
CO2-Enhanced Oil Recovery Mechanism in Canadian Bakken Shale
by
 , , ,
, , ,
Majid Bizhani
1,* ,
,
Omid Haeri Ardakani
1,2,
Steven B. Hawthorne
3,
Jaime Cesar
1,
Bethany Kurz
3 and
Jeanne B. Percival
4 1
Natural Resources Canada, Geological Survey of Canada, Calgary, AB T2L 2A7, Canada
2
Department of Geoscience, University of Calgary, Calgary, AB T2N 1N4, Canada
3
Energy & Environment Research Center, University of North Dakota, Grand Forks, ND 58202, USA
4
Natural Resources Canada, Geological Survey of Canada, Ottawa, ON K1A 0E8, Canada
*
Author to whom correspondence should be addressed.
Minerals 2022, 12(6), 779; https://0-doi-org.brum.beds.ac.uk/10.3390/min12060779
Submission received: 12 May 2022
/
Revised: 3 June 2022
/
Accepted: 17 June 2022
/
Published: 19 June 2022
(This article belongs to the Special Issue Shale and Tight Reservoir Characterization and Resource Assessment)
Abstract
:The recovery factor in unconventional reservoirs is typically 5–10%, with extensive hydraulic fracturing and infill drilling to maintain the production rate. Concurrently, the rush towards decarbonization is opening up new possibilities for CO2 utilization, enhanced oil recovery (EOR) being one example. CO2-EOR in unconventional reservoirs presents an opportunity for both financial gain through improved recovery factors, as well as reducing the carbon footprint of the produced oil. In this work, we examine the CO2-EOR potential in 4 organic-rich shale samples from the Canadian Bakken Formation. A number of characterization tests alongside CO2 extraction experiments were performed to gain insight into the controlling factors of CO2-EOR in these ultra-tight formations. The results show CO2 can penetrate the tight rock matrix and recover a substantial amount of hydrocarbon. Concentration gradient driven diffusion is the dominant form of recovery.
1. Introduction
The need for new hydrocarbon resources led to the unconventional reservoir boom in the early 2000s. Horizontal drilling and multi-stage hydraulic fracturing have enabled production from ultra-tight formations; however, the recovery factor remains low in these deposits, typically around 5–10% [1,2]. The low recovery rates have prompted researchers and the industry to explore the possibility of enhanced oil recovery (EOR) methods, which are similar to conventional reservoirs.
Simultaneously, the need to manage greenhouse gas emissions and the decarbonization of the energy industry are fueling the development of carbon capture, utilization, and storage (CCUS) projects. CCUS refers to several technologies that aim to capture carbon dioxide (CO2) from processes (e.g., fossil fuel power plants), pressurize it, and eventually either neutralize it through added-value products or store it underground [3,4]. CO2-EOR has been identified as one example of CO2 utilization [5,6]. The combination of CO2-EOR and CCUS is referred to as CO2-EOR+ [5].
CO2-EOR+ (this term is used interchangeably with CO2-EOR in this work) is an attractive option for the energy industry as it results in improved recovery (i.e., financial gain) and a lower carbon footprint for the produced oil. It is estimated that oil production through CO2-EOR+ results in a 63% lower carbon footprint per barrel of oil [4]. For CO2-EOR+ to contribute to emission reduction, the CO2 must come from anthropogenic sources.
EOR studies on shales have typically been limited to lab tests and numerical simulations, with few field trials. Most studies have considered the huff-n-puff scheme for their investigation. In huff-n-puff, CO2 or other gasses are injected into the well for a certain duration, then the well is shut down for a given time interval, and finally, the same well is opened for production. In this approach, the fractured reservoir is soaked in the injected fluid. Diffusion (which is driven by the concentration gradient) is expected to be the dominant mode of transport under a waning pressure gradient [7]. EOR through huff-n-puff is affected by several parameters, such as injection plan, gas injection rate and volume, pressure, cycle time, reservoir heterogeneity, pore space, and shale characteristics, some of which are design parameters whereas others are simply reservoir properties.
Among the lab studies, Hawthorne et al. [7] studied the use of CO2-EOR on 51 shale samples from the Bakken Petroleum System in the US. The shale samples were exposed to supercritical CO2 for 24 h under reservoir conditions. Significant oil was recovered from the Lower and Upper Bakken (hereafter LB and UB) samples, despite a median pore throat radius of 3.5 nm. The authors’ analysis of the mineralogical composition of the samples indicated that these parameters were not relevant for predicting the recovery factor. In a later study, Hawthorne and Miller [8] investigated the impacts of the injection of various gases under different pressures on the produced hydrocarbon. CO2, produced gas (natural gas), and several pure hydrocarbons were tested as potential EOR injections. Their results indicated that CO2 could dissolve heavier hydrocarbon components better than CH4 and produced gas but fell short compared to propane and ethane.
Jin et al. [9,10] used core plugs from the Bakken Formation to study oil recovery under the diffusive regime in a fractured reservoir. The apparatus that they used, along with the low injection rate, allowed for the neglecting of convective and pressure-driven flows. The Middle Bakken (MB) samples showed very high recovery factors (>90%), while the shale samples had recovery factors of around 60%. An analysis of the importance of the parameters indicated that the total organic carbon (TOC) content was an important parameter in the oil recovery from shales, while the porosity and permeability had little impact. The authors argued that kerogen-hosted pores were smaller than matrix pores, in addition to their oil-wet surface, which made oil extraction from these pores much harder for CO2. Therefore, high TOC content may be detrimental to CO2-EOR efforts in shales.
In terms of recovery mechanisms, different mechanisms have been proposed for gas injection in shales, e.g., molecular diffusion [11,12,13], repressurization [14], swelling, capillary pressure reduction, multi-contact miscible displacement [10], and any combination of these methods. In conventional systems, CO2 penetrates the matrix and causes swelling, viscosity reduction or sweeping of the in-place oil [15]. In shales, the concentration gradient-driven diffusion of hydrocarbons from the interstitial pore spaces in the rock to the surface and into the bulk-injected fluid in the fractures is considered to be the main recovery mechanism [7,8,16,17]. The minimum miscibility pressure (MMP) may not be as important in CO2-EOR in shales as it is in conventional systems.
According to Mahzari et al. [18], in conventional reservoirs, the injected CO2 is in direct contact with the oil in large pores. A two-way diffusion takes place in this case, in which a mass transfer occurs in both phases [18]. In fractured shales, the CO2 is injected into the fractures and a one-way mass transfer is expected at the interface of the fracture and rock matrix. The unidirectional mass transfer causes CO2 to diffuse into the oil phase, causing swelling and viscosity reduction [18,19]. While the pressure-driven transfer of CO2 into the matrix is also expected (along with some inward hydrocarbon movement), the swelling and viscosity reduction are the primary causes of oil recovery.
Additionally, the diffusion of CO2 into the resident oil also results in the liberation of light components [18]. The liberated components form a new gaseous phase that remains immobile up to a critical concentration (15% according to Mahzari et al. [18]). The liberation of the light components can result in significant swelling, which ultimately improves recovery. The numerical modeling of CO2-EOR in Bakken shale by Mahzari et al. [18], as well as the five-step recovery process proposed by Hawthorne et al. [19], supports the use of EOR through diffusion (driven by concentration gradient). The experiments by Li et al. [20] on shales from the Jianghan oilfield, Jianghan Basin, also indicated the preferential tendency of CO2 to recover lighter hydrocarbon, which can be caused by the above mechanism.
When we assume a diffusion-dominant model for the EOR mechanism in shales, a one-way mass transfer (CO2 diffusing into the oil due to the concentration gradient) is mostly plausible because the injected CO2 is not in direct contact with the resident hydrocarbon. On the other hand, Jia et al. [1], based on the work of Habibi et al. [15], depicted the recovery mechanism as follows: at low gas pressure (and at the interface of the fracture and matrix), the unidirectional diffusion of gas into the oil phase takes place, causing swelling and the expulsion of oil into the fracture; however, at a pressure above minimum miscibility pressure, two-way diffusion occurs and oil also diffuses into the gas in the fracture.
Some researchers have found that increasing the injection pressure results in higher recovery factors, leading to the conclusion that repressurization is the main recovery mechanism [14]. Song and Yang [21] showed that increasing the pressure only enhanced the recovery factor in the immiscible regime, while Adel et al. [22] indicated that the recovery factor still increased with increasing pressure above the MMP.
Alfarge et al. [23] reviewed and investigated the parameters affecting CO2-EOR in shales using statistical methods. They found that the intensity of the fractures and the conductivity of the oil pathways were the two main factors affecting EOR efforts in shales. They argued that molecular diffusion is the main mechanism of recovery.
Field trials for EOR in shales are rare. Schmidt and Sekar [24] reported the results of a pilot test in the Canadian Bakken in Saskatchewan. They used nine producer wells, which were 200 ft (61 m) away from the injection wells. Lean natural gas was injected at a rate of 350–1000 MScf/day (9.9–28.3 × 10³ m3/day) without any injectivity issues. The oil production increased in all nine producers; however, early breakthrough was observed in some of the wells. Todd and Evans [25] reported the results of a pilot EOR test on US Bakken shale using CO2 in different scenarios. Of the three CO2 injections that were examined, two were performed in horizontal fractured wells using the huff-n-puff method. The other method injected CO2 into a vertical well. The huff-n-puff tests showed no injectivity problems (1000 MScf/day (28.3 × 10³ m3/day) and 1500–2000 MScf/day (42.47–56.63 × 10³ m3/day) at 2000–3000 psi (138–207 bar)). However, no recovery improvements were observed. The third CO2-EOR pilot injected CO2 into the Middle Bakken Formation for 20–30 days, followed by 20 days of shut-in time while CO2 breakthrough was observed in the offset wells that were 900 ft (275 m) away, after which the test was terminated. Another case tested the continuous injection of enriched natural gas into a well pattern of one injector and four producer wells. After injecting for 55 days at a surface pressure of 3500 psi (241 bar) and a rate of 1600 MScf/day (45.3 × 10³ m3/day), the production rate increased in the production wells. However, this could not be attributed to the injected gas as fracking hits from nearby wells could have interfered with the process. However, EOR activities in Eagle Ford shale have been successful at increasing production rates [26].
Despite significant strides toward making CO2-EOR+ a reality in unconventional resources, there is still significant uncertainty surrounding the key design parameters that are necessary for successful EOR operation. Data from lab-scale tests and numerical simulations are promising, yet field-scale applications show missing links that need to be understood for the design of these recovery schemes. This, coupled with the movement toward net-zero and the large-scale deployment of CCUS projects, further necessitates investigation into the potential of CO2-EOR+ in unconventional reservoirs. The results from past studies have often been different and sometimes even contradictory. The recovery mechanisms are not well understood and the interactions between the CO2 and in situ hydrocarbons under nano-confinement is another area of active research. In this work, we performed a suite of characterization and CO2 extraction tests on four Canadian Bakken samples to understand the interplay of different properties within the recovery process. The pore and throat size, organic content, and in situ hydrocarbons were analyzed to better interpret the potential of CO2-EOR.
The methodology of the study is based on a comparative framework where CO2-EOR performance on four shale samples are compared. The characterization results were used for the interpretation of the CO2 extraction tests. This work is focused on the impact of shales’ properties on the EOR performance, rather than the operational parameters. It is important to note that this study focuses on the Bakken Formation, and consequently, it does not attempt to derive a correlation between shale properties and CO2-EOR performance.
2. The Bakken Formation
The Upper Devonian and Lower Mississippian Bakken Formation of the Williston Basin is distributed over a wide region in southern central Canada, covering southern Saskatchewan and southwestern Manitoba, and the northern central US, covering western North Dakota and northeastern Montana [27]. The Bakken petroleum system is a world-class unconventional hydrocarbon resource with over 600 billion barrels of oil in place [28]. The Bakken Formation is divided into (1) an organic-rich black shale lower member, (2) a fine-grained siltstone and sandstone middle member, and (3) an organic-rich black shale upper member. The lower and upper organic-rich intervals, which are the hydrocarbon source rocks in the Bakken petroleum system, sandwich the Middle Bakken reservoir [27,29].
The TOC content of the lower and upper Bakken members varies regionally, between 7 to 25 wt.% [30]. The overall thermal maturity of the Bakken Formation increases from the north (southern Saskatchewan and Manitoba) to the south (North Dakota and Montana). The unusually high oil saturation in the immature Bakken shales has been reported by Johnson [31]. Although traditional thermal maturity proxies, such as programmed pyrolysis Tmax, have indicated that the studied Bakken shales are immature (Tmax ≈ 431 °C), those samples were fully saturated with oil and were in fact bleeding oil [29].
3. Methods
3.1. Samples
We tested four shale samples from the Lower and Upper Bakken (LB and UB, respectively) Formation. The samples are from two wells located in the Canadian part of the Bakken Formation in Saskatchewan. Both wells were drilled with water-based mud. In terms of lithology, both sets of samples are black shale, with high clay content.
Several characterization tests, including programmed pyrolysis, mercury intrusion capillary pressure (MICP), N2 adsorption–desorption, X-ray powder diffraction (XRD), and gas chromatography mass spectrometry (GC–MC) of hydrocarbon content were conducted for in-depth analysis of the controls on CO2-EOR. The samples were tested in the as-received condition except for N2 adsorption–desorption measurements. More detail on sample treatment for N2 adsorption–desorption tests is provided in the respective section.
It is worth noting that the Bakken shales are source rocks for the Bakken petroleum system. Middle Bakken and Three Forks formations are increasingly being targeted in the Bakken petroleum system. Although the shales are not targets of oil and gas production, given their high oil content, there is a huge potential for future EOR activities in the shale portions of the system. Therefore, our study focused on the two source rocks.
3.2. Programmed Pyrolysis, Total Organic Carbon, and Sulfur Content
About 50 mg of bulk powdered samples were analyzed using a Rock-Eval 7S analyzer (Vinci Technologies, Nanterre, France). The sulfur speciation analysis was performed using the basic/total sulfur method [32]. The temperature program is similar to the basic programmed pyrolysis method [33]. It starts at 300 °C iso-temperature for 3 min, followed by a 25 °C/min ramp to 652 °C, but also includes an extra oven step during the pyrolysis stage using a sulfur oven to oxidize the evolved gases into SO2 at 840 °C. The samples are then transferred to the oxidation oven with an extended analysis time during the oxidation stage with a 20 °C/min ramp from 300 to 1200 °C for decomposition of sulfate moieties [32,34]. The SO2 gas released during both pyrolysis and oxidation is measured in real-time by an ultraviolet (UV) detector. In addition to the detection of total sulfur (TS) and total organic sulfur (TOS), the instrument is capable of separating and quantifying pyritic sulfur (Fe–S), bitumen/oil organic sulfur (S1–S), organic sulfur associated with hydrocarbon prone kerogen (S2–S), and residual organic sulfur associated with oxidized OM (ROS or S4–S) and sulfate minerals. The basic programmed pyrolysis parameters such as S1, S2, S3, Tmax, and TOC were measured during the same process following the Behar et al. [33] methodology.
3.3. Organic Petrography and Reflectance Measurement
Organic petrography was carried out on selected samples using polished blocks made with a cold-setting epoxy resin mixture. The resulting sample pellets were ground and polished, in final preparation for microscopy, using an incident light Zeiss Axioimager II microscope system equipped with an ultraviolet (UV) light source and the Diskus-Fossil system. Fluorescence microscopy of organic matter was carried out using UV G 365 nm excitation with a 420 nm barrier filter. Random reflectance measurements were conducted under oil immersion (objective ×50) following ASTM [35] methods. The standard reference for reflectance measurement was yttrium-aluminum-garnet with a standard reflectance of 0.906% under oil immersion.
3.4. Gas Chromatography–Mass Spectrometry of Solvent Rock Extracts
The four Bakken samples were extracted for a molecular analysis of the extracted bitumen using dichloromethane (DCM) in a soxhlet apparatus for 24 h. The bitumen extracts were separated into saturate, aromatic, resins, and asphaltenes using column chromatography, according to the standard operational procedures of the organic geochemistry laboratory of the Geological Survey of Canada, Calgary.
The gas chromatography (GC) with a flame ionization detection analysis of the saturated hydrocarbon fractions was completed using an Agilent 7890B GC-FID and a 30 m × 0.25 mm × 0.25 μm DB-1 fused silica capillary column, with helium as the carrier gas. The samples were injected using a split injector that was heated to 300 °C. The temperature program was set at a 6 °C/min ramp up from 60 °C to 300 °C and held at 300 °C for 30 min. The FID temperature was maintained at 300 °C. The gas chromatography–mass spectrometry (GC–MS) analysis of the saturated hydrocarbon fractions was carried out using an Agilent 7890B GC coupled with an Agilent 7000C Triple QuadMS, which was operated in full scan mode. A split injection (2:1) was employed into a DB5msUI 30 m × 0.25 mm × 0.25 μm capillary column, with helium as the carrier gas at a flow rate of 1.2 mL/min. The initial temperature of the GC oven was 50 °C but was then ramped to 185 °C at 40 °C/min, followed by a 3.5 °C/min ramp up to 320 °C (final temperature held for 7 min). The mass spectrometer ion source was operated at a 70 eV ionization voltage. The aromatic hydrocarbons were analyzed using an Agilent 6890 series GC coupled with a 5973 series mass selective detector (MSD), which was operated in full scan mode. Splitless injection was employed into an HP-5ms phenyl methyl siloxane 30 m × 0.32 mm × 0.25 μm capillary column, which was heated to 300 °C in temperature. Helium was used as the carrier gas at a flow rate of 1.3 mL/min. The GC oven temperature was programmed for a 4 °C/min ramp up from 40 °C to 325 °C and the temperature was then held at 325°C for 15 min.
3.5. CO2 Extraction Apparatus
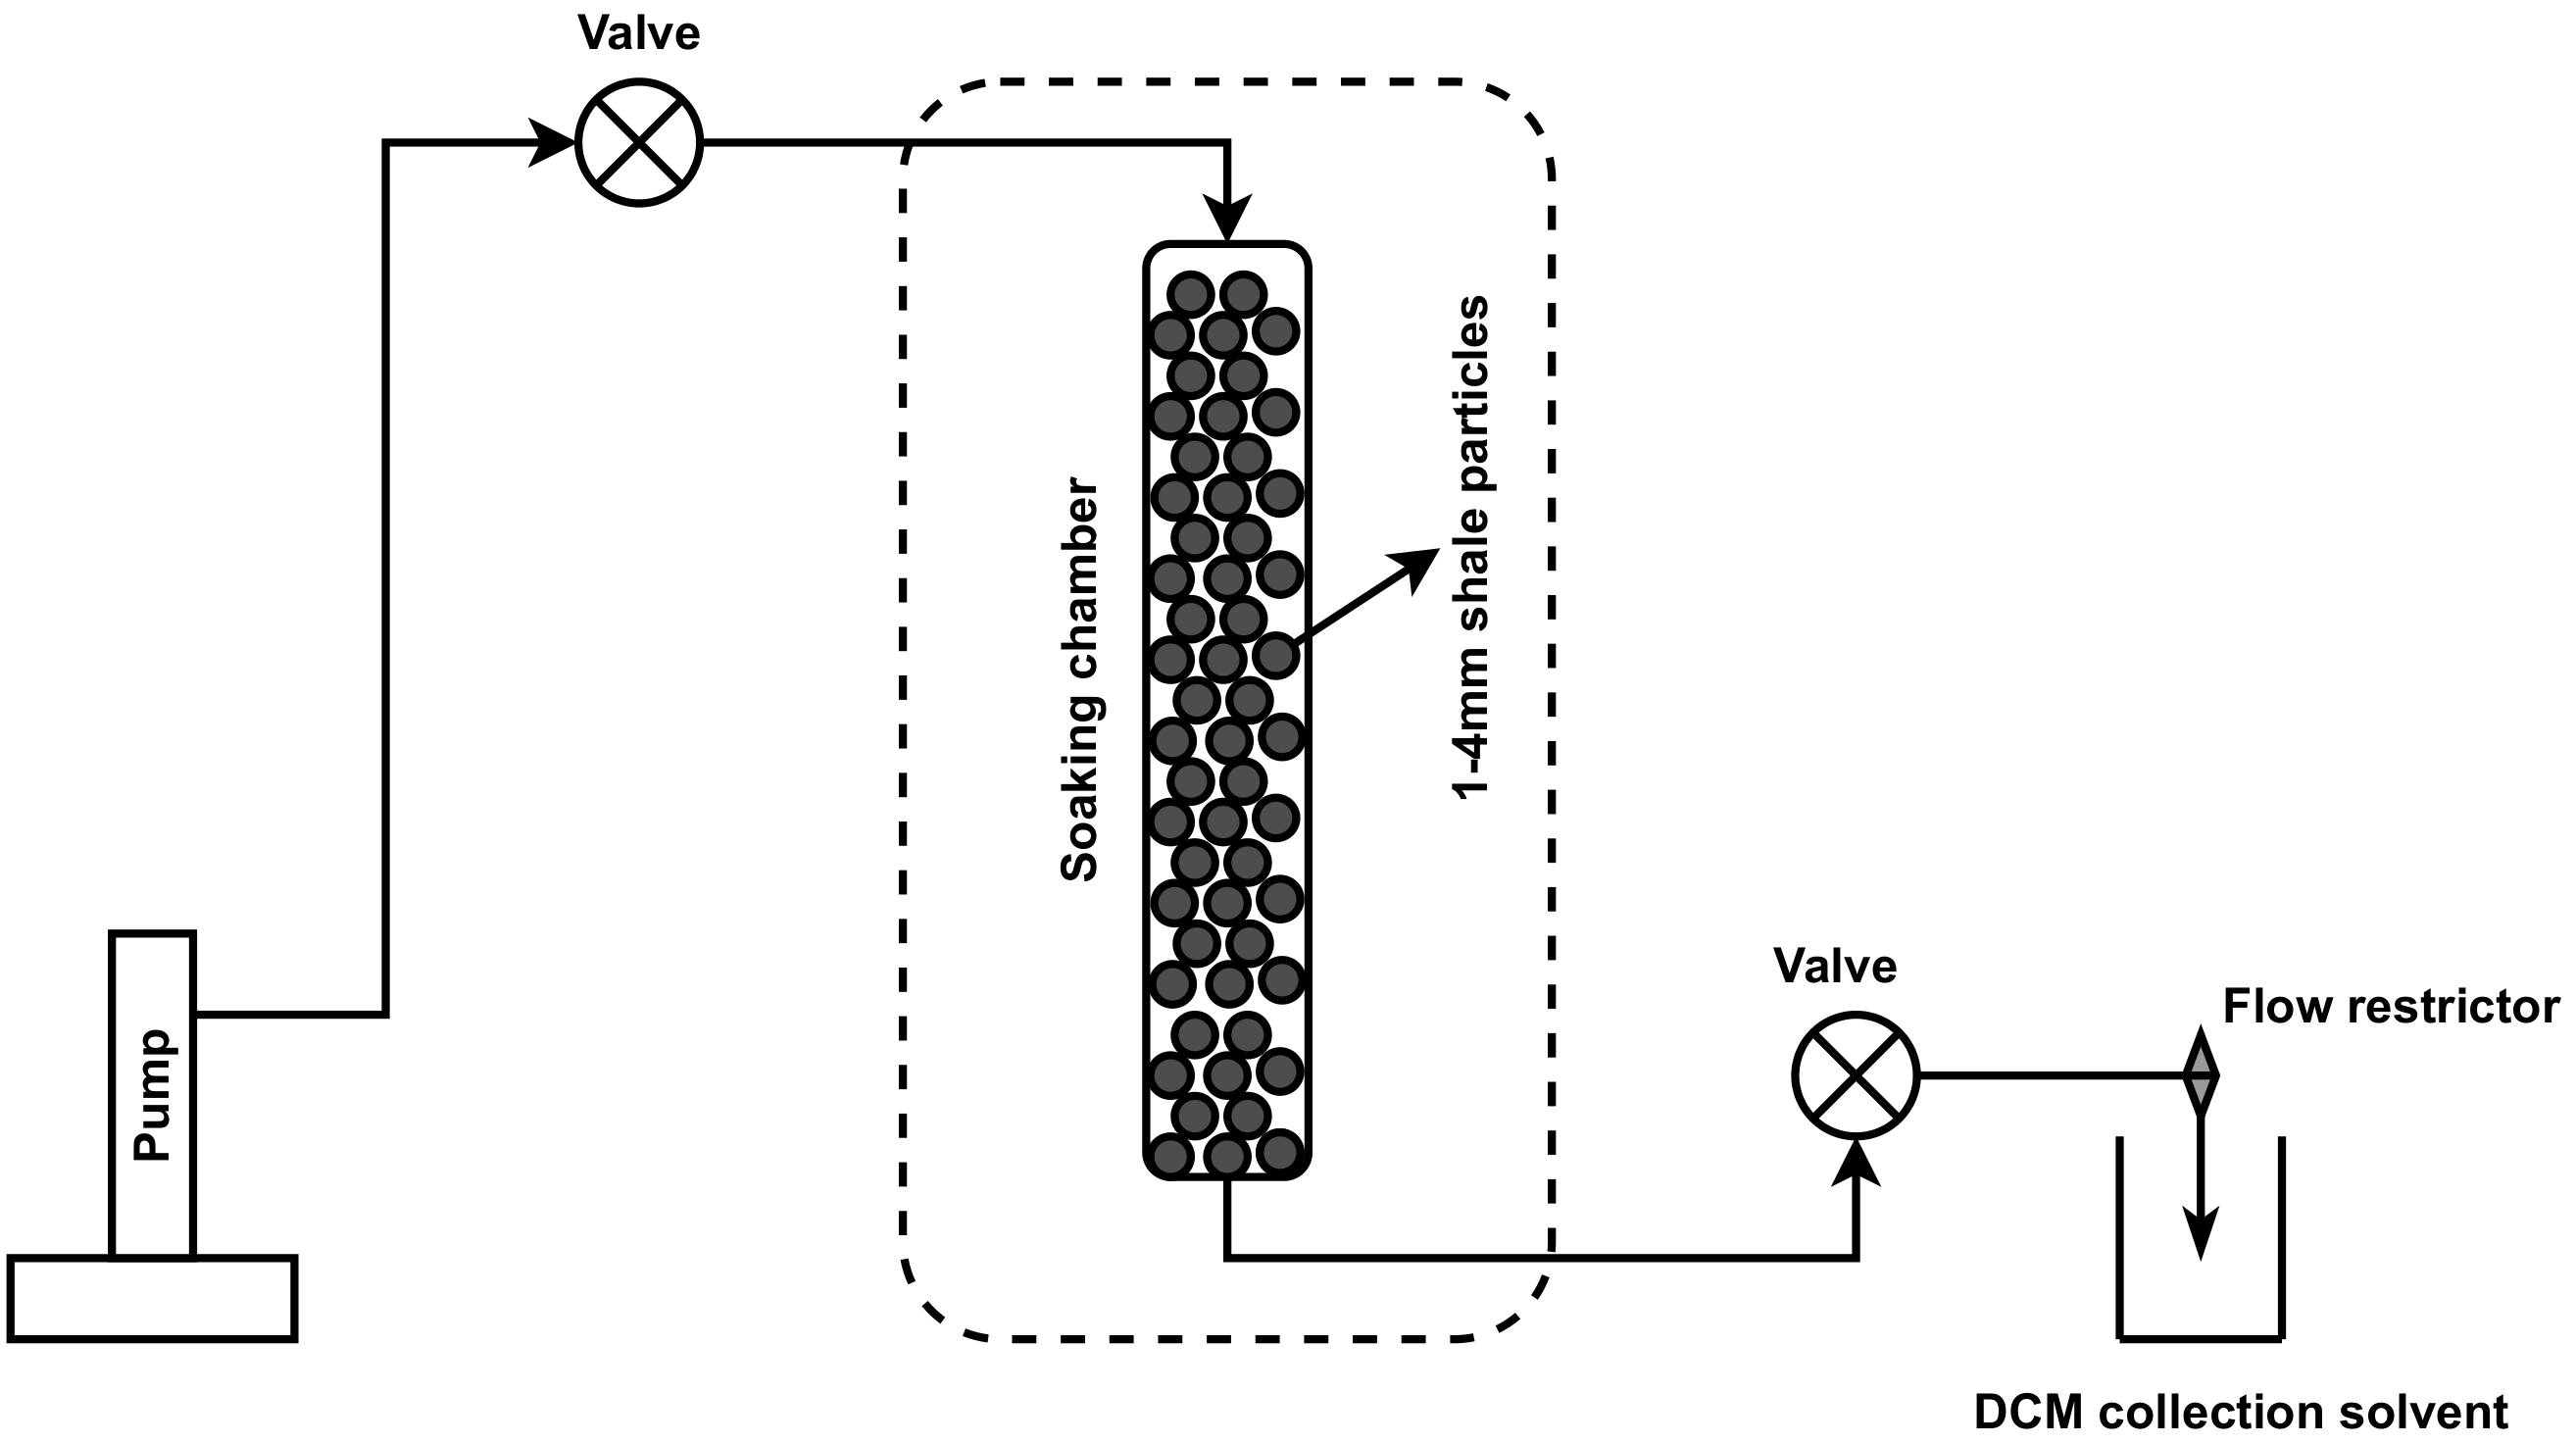
The experimental apparatus (Figure 1) used in this study is identical to the set-up used by Hawthorne et al. [7], therefore, details of the test setup are not discussed here. The test cell comprised a 10mL soaking cell, in which rock chips were immersed in supercritical CO2. The CO2 was supplied via a syringe pump under a constant pressure of 34.5 MPa (5000 psi) and was heated in the extraction unit to 110 °C before hitting the rock sample. The temperature of the cell was maintained at 110 °C. After soaking the samples for a certain period of time, the cell was drained via a valve and a heated flow extractor at 1.5 mL/min, then it was depressurized into a collection cell of DCM. The apparatus was designed so that during the draining (or puff period), the pressure in the soaking cell remained constant. The extracts were analyzed using GC/FID for the recovered hydrocarbons.
After 24 h of soaking with eight cycles of gas collection under a constant pressure (one cycle every hour up to the 7th hour and one cycle at the end of the 24th hour), the rock samples were crushed and mixed with sodium sulphate (Na2SO4) (as the drying agent) and extracted using 1:1 DCM–acetone with the aid of sonication. The extracts were then analyzed using gas chromatography. Interested readers are encouraged to consult Hawthorne et al. [7] for a detailed description of the test device and procedure.
As explained in detail by Hawthorne et al. [7], the CO2 extraction device mimicked the interaction between CO2 and the matrix rock within a fracture. The recovery method was similar to a huff-n-puff design, in which the shale samples are immersed in a CO2 bath for certain time intervals before production. From the CO2 extraction experiments, the recovery factor, as well as the component-specific recovery factors, was computed. No further analysis was performed on the hydrocarbon extracts to determine other properties of the resident oil, such as density.
4. Results and Discussion
The results section first presents the characterization tests followed by the CO2 extraction and recovery mechanism analysis. As mentioned earlier, the analysis is done in a comparative framework. Since the size of the sample set is small (four), the discussion is focused on interpreting the CO2 extraction results using the measured properties. However, since all four shale samples are from the same shale deposit, general correlations cannot be developed for predicting CO2-EOR performance (due to the limited variations in the properties).
4.1. Organic Matter Characterization and Thermal Maturity
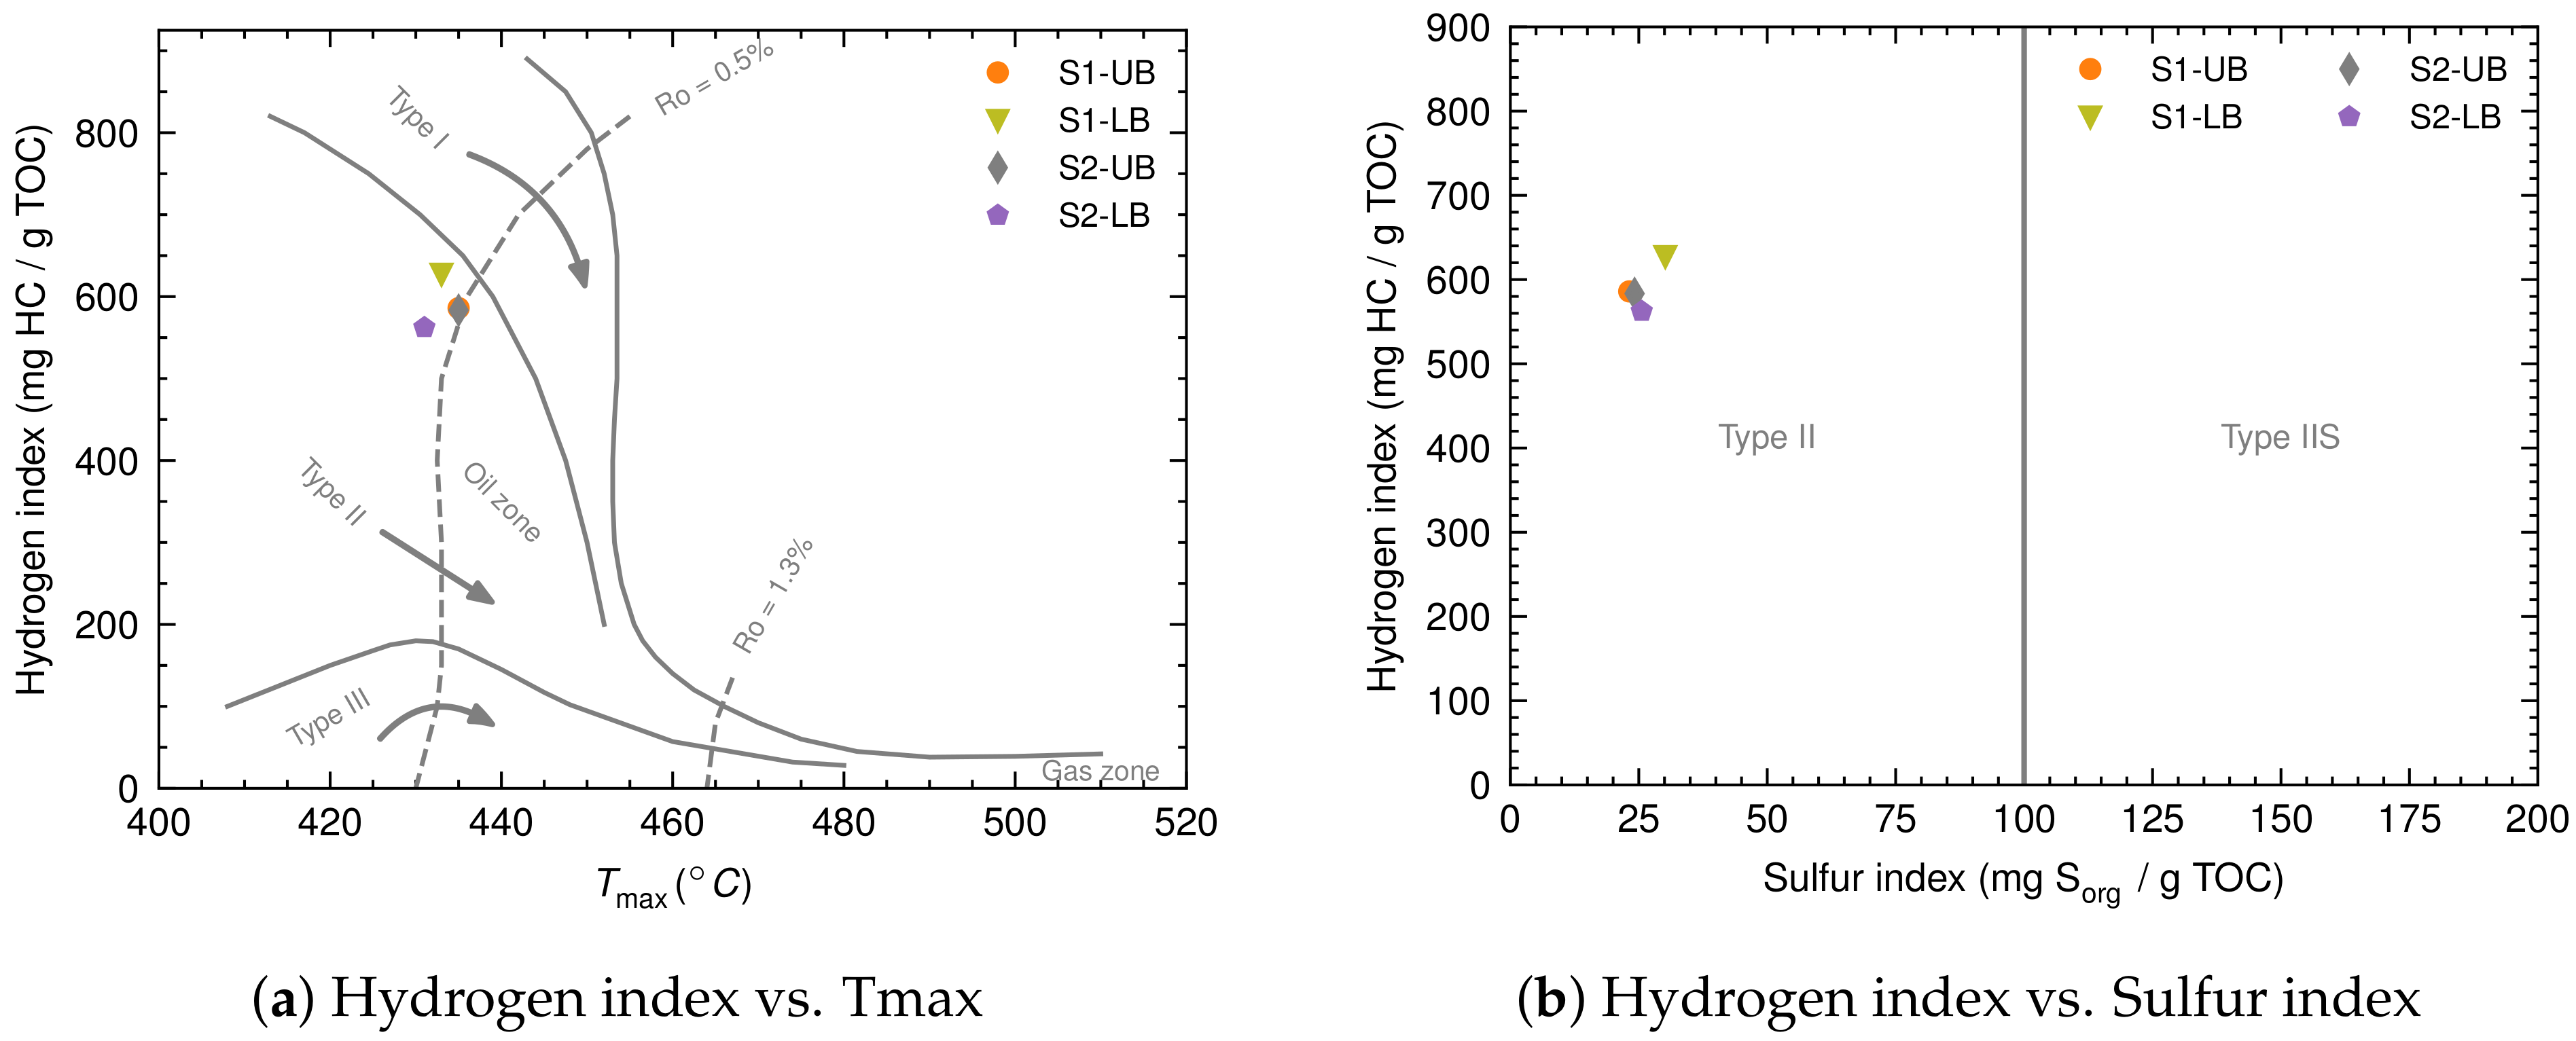
The results of programmed pyrolysis of Lower and Upper Bakken samples with direct quantification of both TOC and TOS contents are presented in Table 1. The amount of organic sulfur in sedimentary OM is a critical parameter that directly influences source-rock kinetics and, thus, thermal conversion of OM into hydrocarbons [36,37]. The samples are organic-rich with high TOC content ranging from 11.7 to 26.5 wt.% (Table 1). The S1 and S2 values for all samples range from 4.6 to 10.6 and 68.4 to 154.4 (mg HC/g of rock), respectively. The hydrogen and oxygen indices (HI and OI) of all samples range from 562.3 to 627.8 (mg HC/g TOC) and 1 to 3 (mg CO2/g TOC), respectively. The Tmax for all samples ranges from 431 to 435 °C along with a high HI value indicating the immature to marginally mature nature of samples (Figure 2a).
The total sulfur (TS) content of the samples ranges from 1.5 to 6.3 wt.%, while TOS content ranges from 0.9 to 2.3 wt.% (Table 1). Sulfide (i.e., pyrite) and sulfate are other major sulfur species in the samples and range from 0.5 to 3.4 wt.% and 0.1 to 0.7 wt.%, respectively (Table 1). The sulfur index (SI) for all samples ranges from 23 to 30, which indicates a Type II marine kerogen (Figure 2b) similar to Bakken Formation in the US (e.g., Carvajal-Ortiz et al. [34]). Although the organic matter in the studied samples is marginally mature, the S1 peak is relatively high in all four samples, which means there is free oil in the samples to be recovered (Table 1).
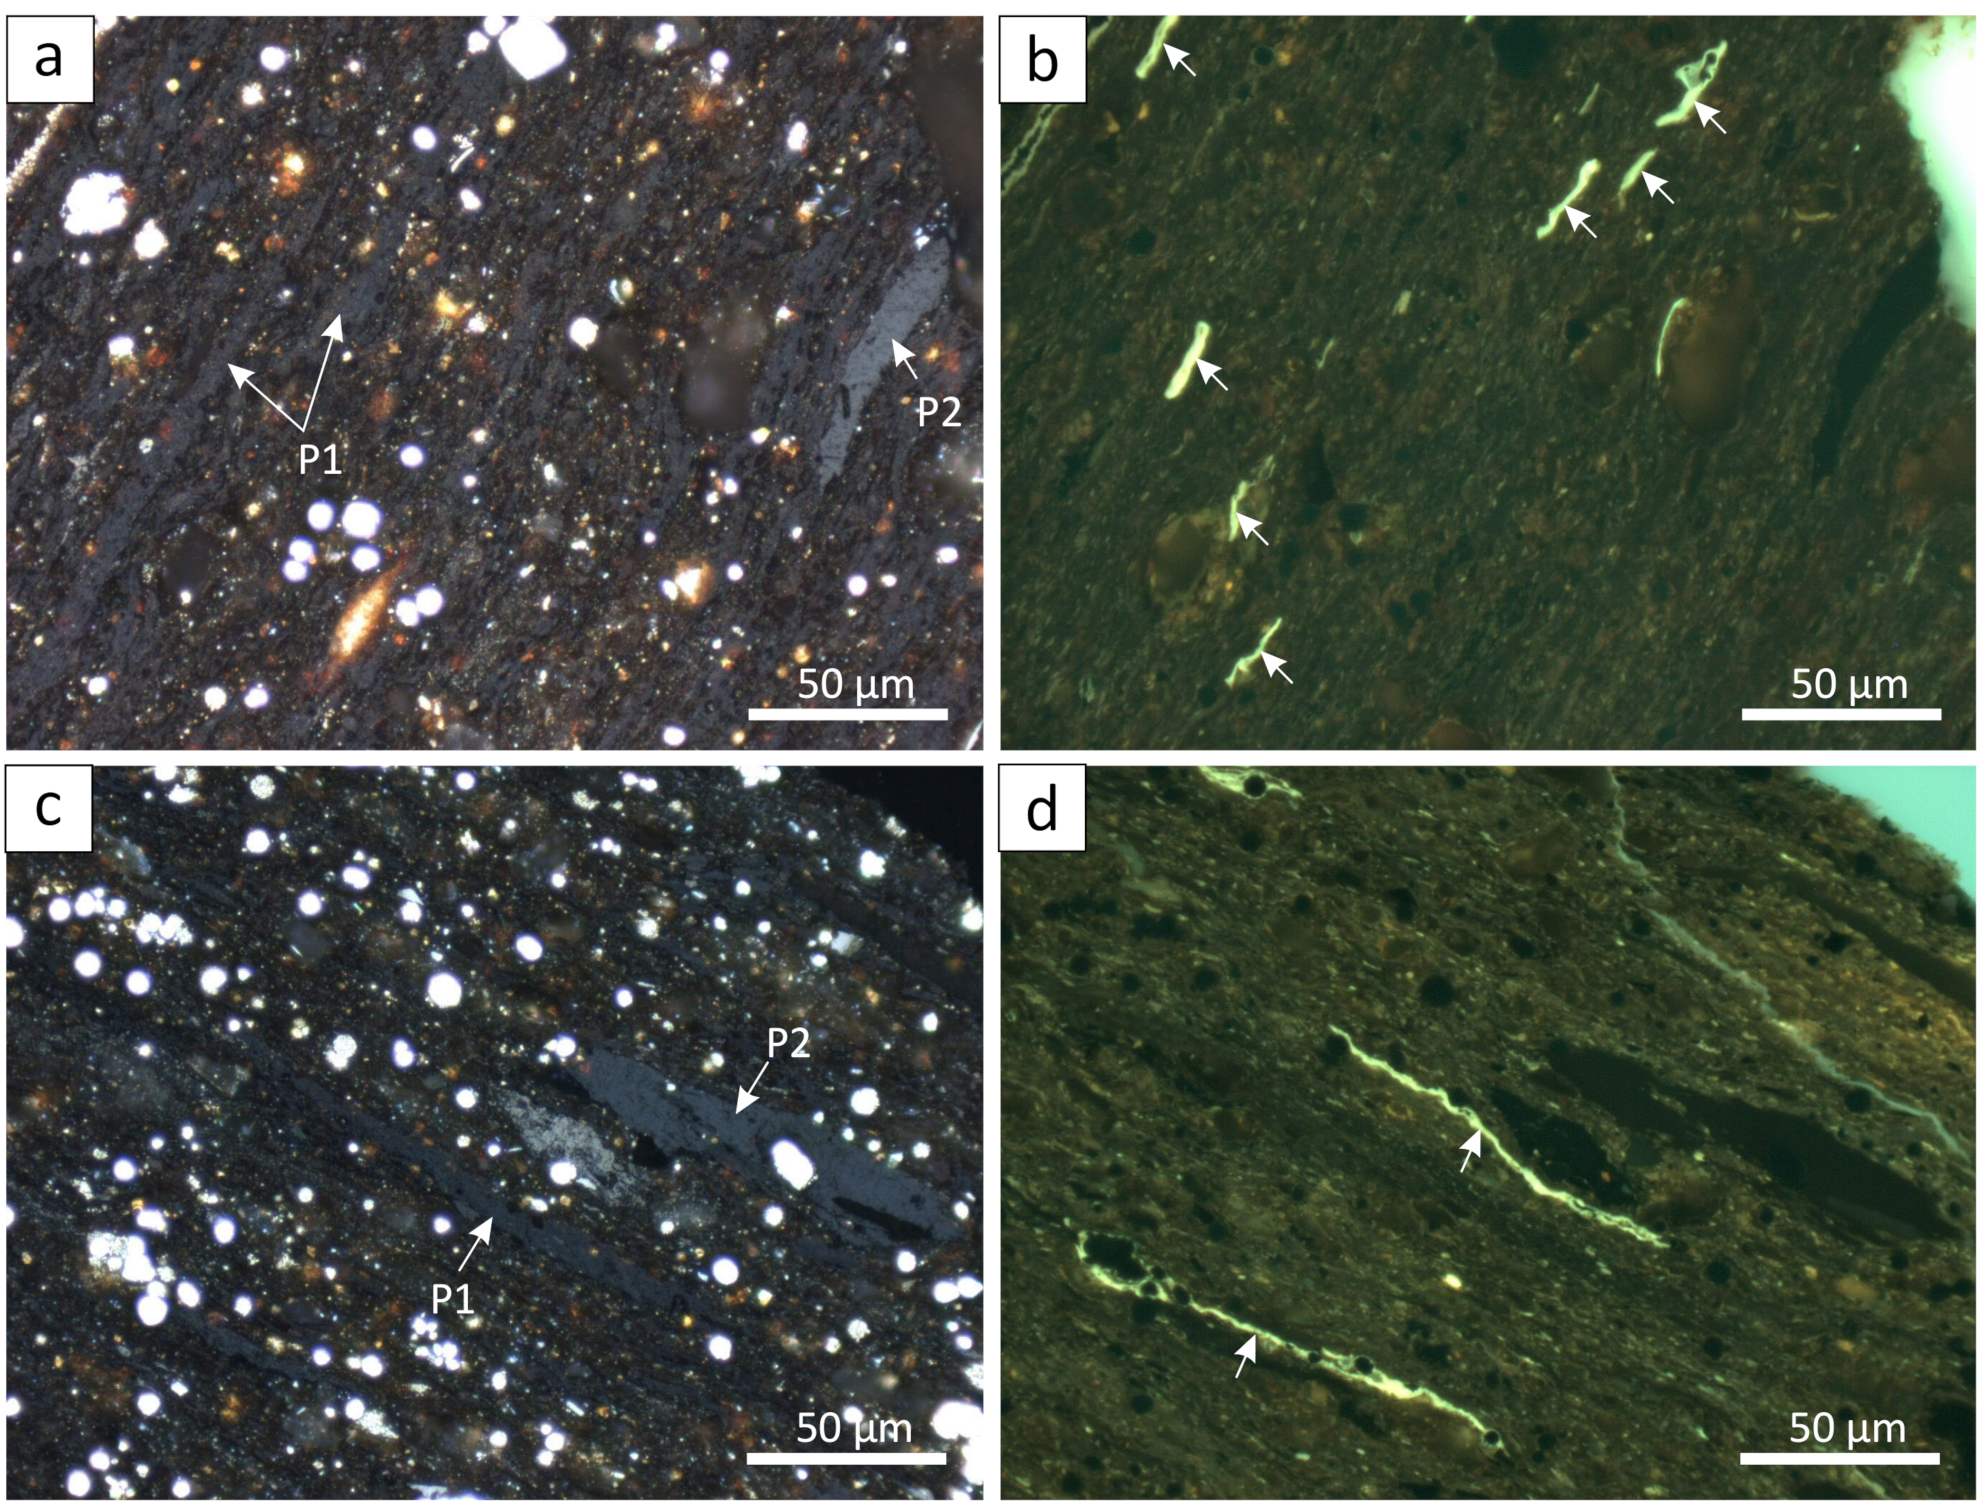
Organic petrographic observation and random bitumen reflectance (BRo) measurements of the samples further confirm the organic matter type (Type II) and low thermal maturity of the samples (Figure 3; Table 1). Both Upper and Lower Bakken samples from the studied wells are pyritic organic-rich shales with abundant solid bitumen and liptinitic alginite macerals (Figure 3). The unicellular alginite (Prasinophyte) generally occurs in an amorphous bituminite kerogen network (Figure 3) (e.g., Stasiuk [38]). The alginite macerals in all samples exhibit green fluorescence, which indicates the low thermal maturity of the studied samples (Figure 3b,d). There are two distinct populations of solid bitumen, one dominant with lower mean BRo ranging from 0.27 to 0.30% and a less abundant population with relatively higher BRo ranging from 0.46 to 0.51% (Figure 3; Table 1).
4.2. Pore Throat Size Distribution
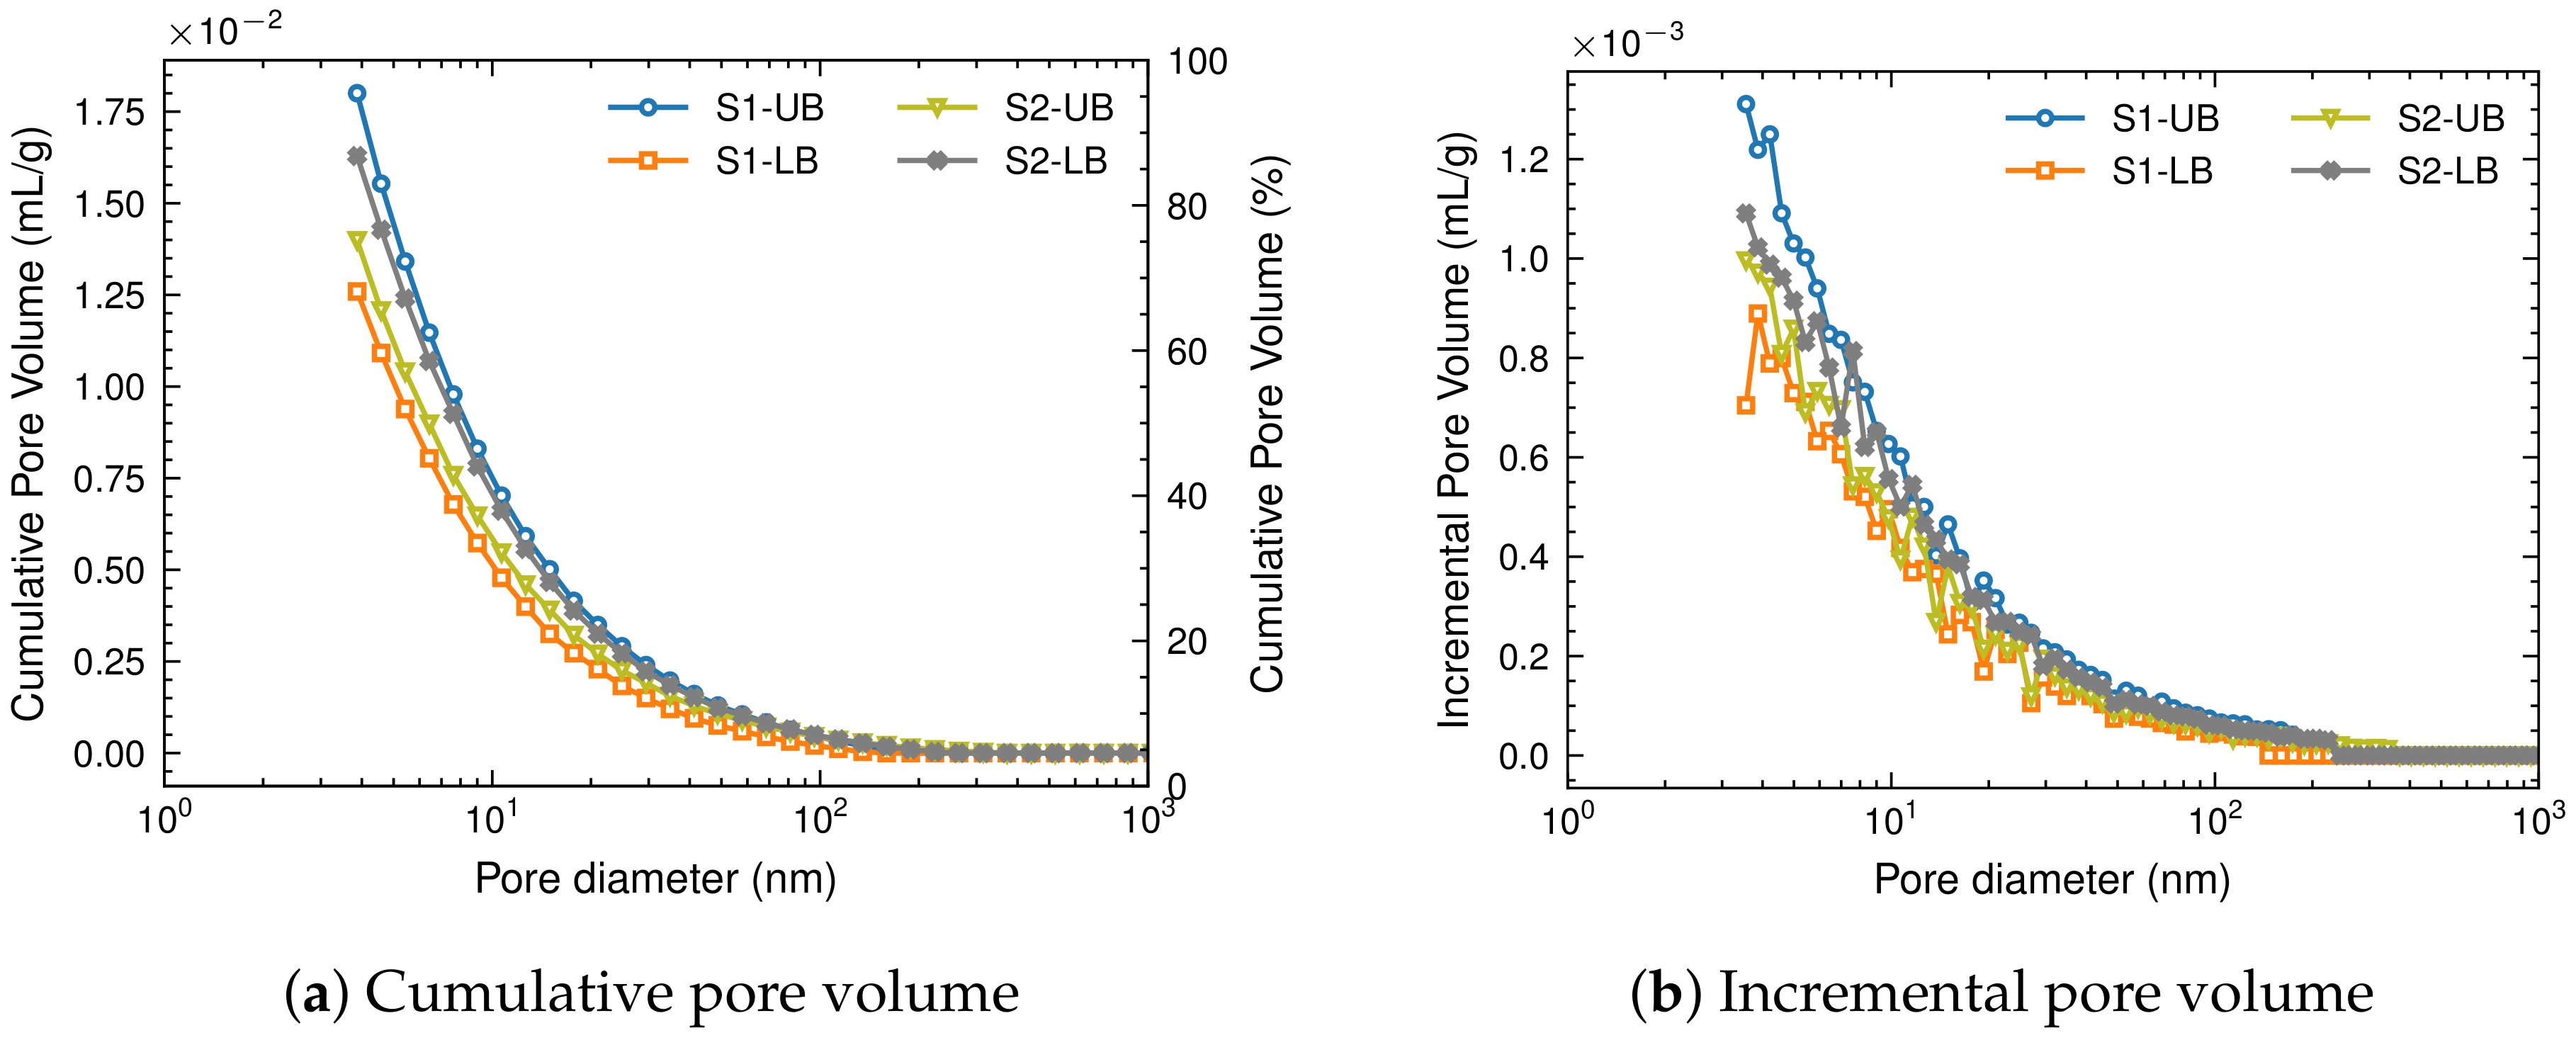
MICP is a routine method for the determination of pore throat size distribution and porosity of porous sedimentary rocks. The technique is based on the Washburn equation and is limited to pore throats larger than 3.2 nm. Figure 4 shows the cumulative and incremental pore volume obtained using the MICP technique. The cumulative pore volume plots reveal all four shale samples are broadly similar, with S1-UB having a slightly larger pore volume. Additionally, almost all pore volumes come from pores smaller than ≈100 nm.
The incremental pore throat volume plot (Figure 4b) shows an exponential decay type profile, peaking at around 3–4 nm (the limit for the MICP method). All shale samples have similar pore throat sizes, with no indications of a noticeable peak.
The median pore (throat) diameter for all the samples is about 5.3–5.4 nm, while the average pore throat diameter is around 7.5 nm. This is typical of Canadian Bakken shale, which has a larger pore throat size compared to the US Bakken [23]. The measured porosity (using the MICP method) is 3.7, 3.0, 3.2, and 3.7% in the order of presentation in Figure 4.
The data from MICP analysis indicate largely similar samples in terms of pore throats size. There is no significant disparity either in the form of size or type of distribution in these samples. All four shale samples are ultra-tight.
4.3. Pore Throat Size Distribution
Pore size distribution in shales is often calculated via the adsorption–desorption phenomena of CO2 and N2. N2 is used for pores larger than 2 nm and up to ≈300 nm. N2 adsorption–desorption was used in this work to determine the pore size distribution of the samples. The free oil blocking the pores in the samples prevented measurement of N2 adsorption–desorption isotherms without treatment, thus the samples were cleaned using an organic solvent. Note that sample treatment was done only for pore size distribution measurement, and other tests used the samples in the as-received condition.
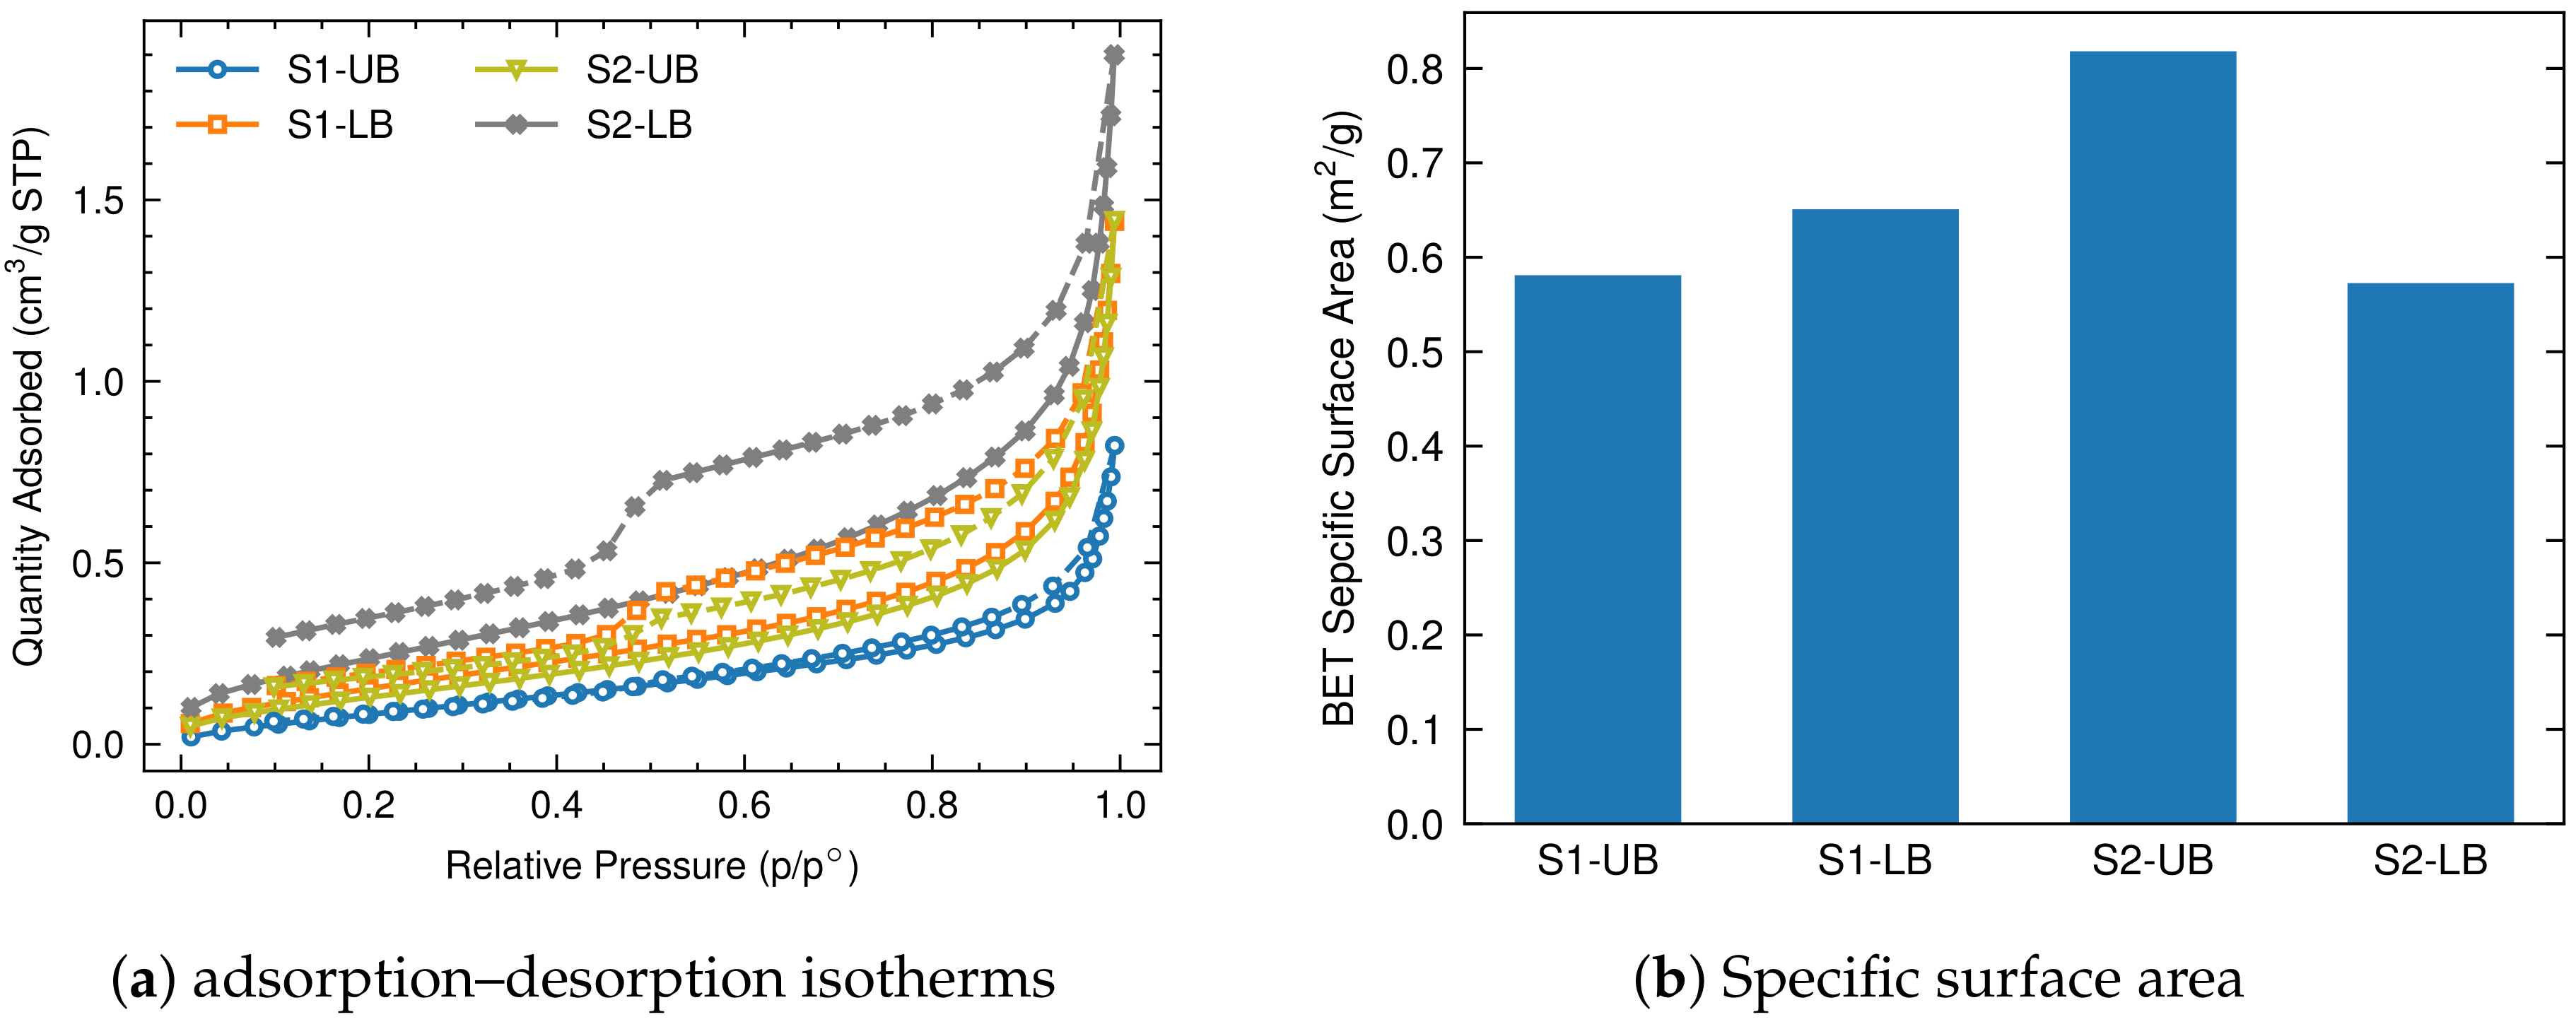
Figure 5a reports the N2 adsorption–desorption isotherms for the studied samples. N2 adsorption isotherms can be used to investigate meso and smaller macropores [39]. The adsorbed amount for low pressures (≤0.05) is relatively small for all the samples, indicating a lack of small mesopores in these samples. Low Tmax and consequently the low maturity of the organic matter in these samples suggests a lack of development of organic matter-hosted pores which is reflected by the isotherm measurements. Sample S2-LB has the highest adsorption capacity, which is almost twice as high when compared to S1-UB.
The isotherms and hysteresis loops (difference between N2 adsorption/desorption isotherms) cannot be simply attributed to a certain classification [40]. A combination of type III and type IV appears to best describe the isotherms. The hysteresis loop is of H3 type, which is consistent with the type IV curve that suggests the occurrence of mesopores and the capillary condensation phenomena. Type IV isotherms are common for mesoporous materials (pore diameters between 2 and 50 nm) [39]. The shape and type of isotherms suggest slit-shaped pores in these samples.
The specific surface area (SSA) of samples is shown in Figure 5b. SSA is computed from the N2 adsorption data using the BET method [41]. As per the data, the samples have broadly similar SSA. Lower SSA than a typical mature shale agrees with the programmed pyrolysis data.
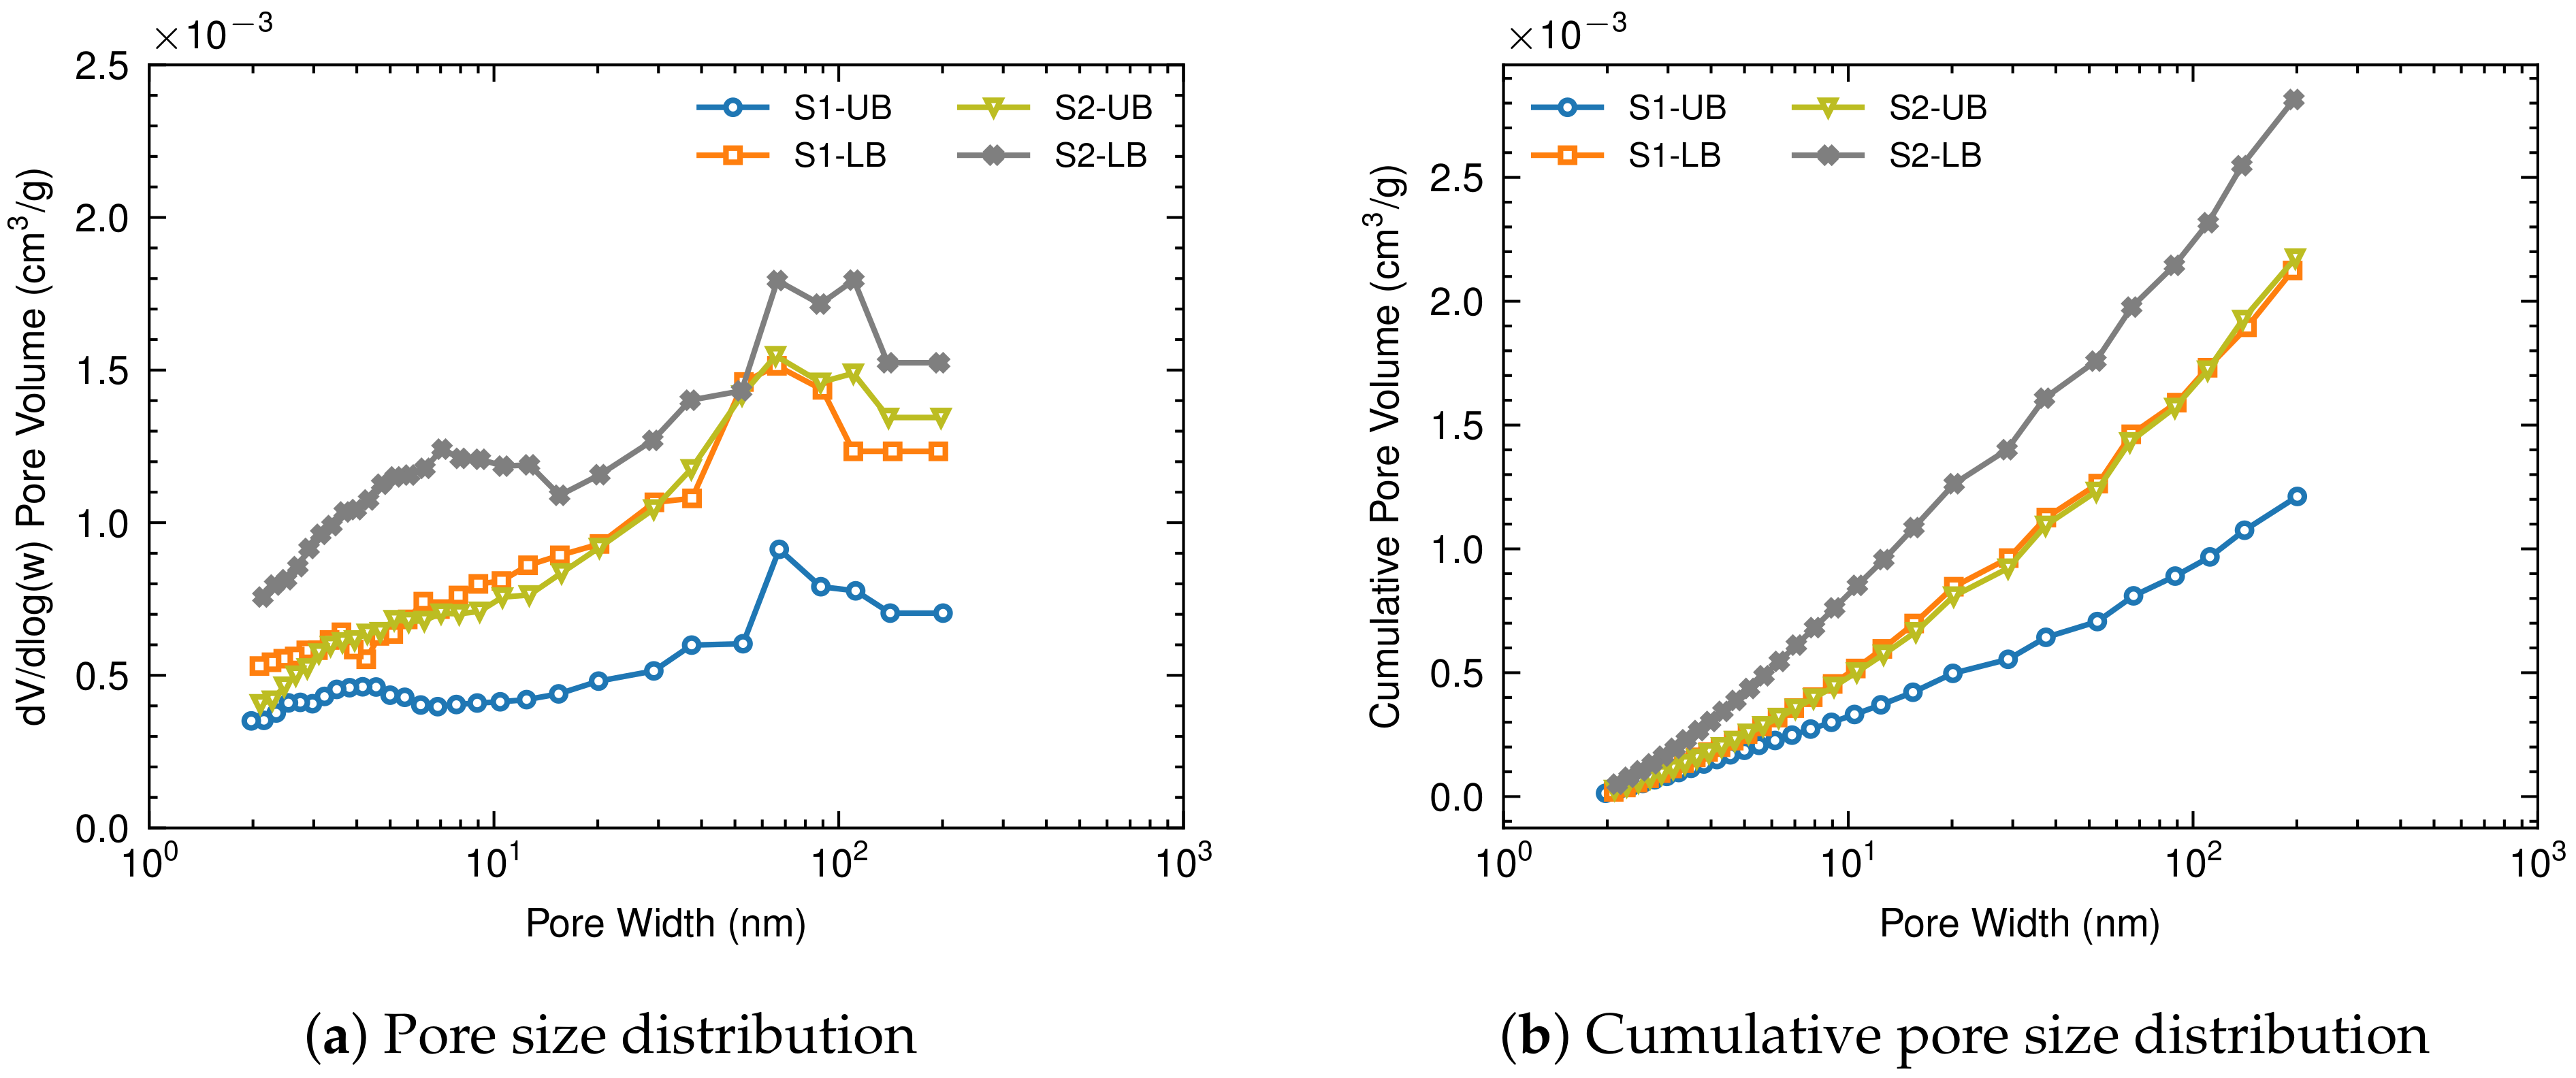
The Barrett, Joyner, and Halenda (BJH) method [42] was used to compute the pore size distribution (PSD; Figure 6a,b) of the samples from the adsorption branch of the N2 isotherms. The PSD (Figure 6a) plots show that three of the samples have a unimodal distribution, while S2-LB has two peaks. All samples have a peak around 60–70 nm. The peaks occur in the macro-sized pore range. Sample S1-UB also has a hint of a second peak near the 3 nm pore size. Figure 6b depicts the cumulative pore volume, where S2-LB has the highest pore volume and S1-UB the lowest.
Overall, the pore size distribution analysis indicates that both LB samples have a larger pore volume and adsorption capacity compared to their UB counterpart. Sample S2-LB has a secondary peak for pore width <10 nm.
4.4. XRD Data
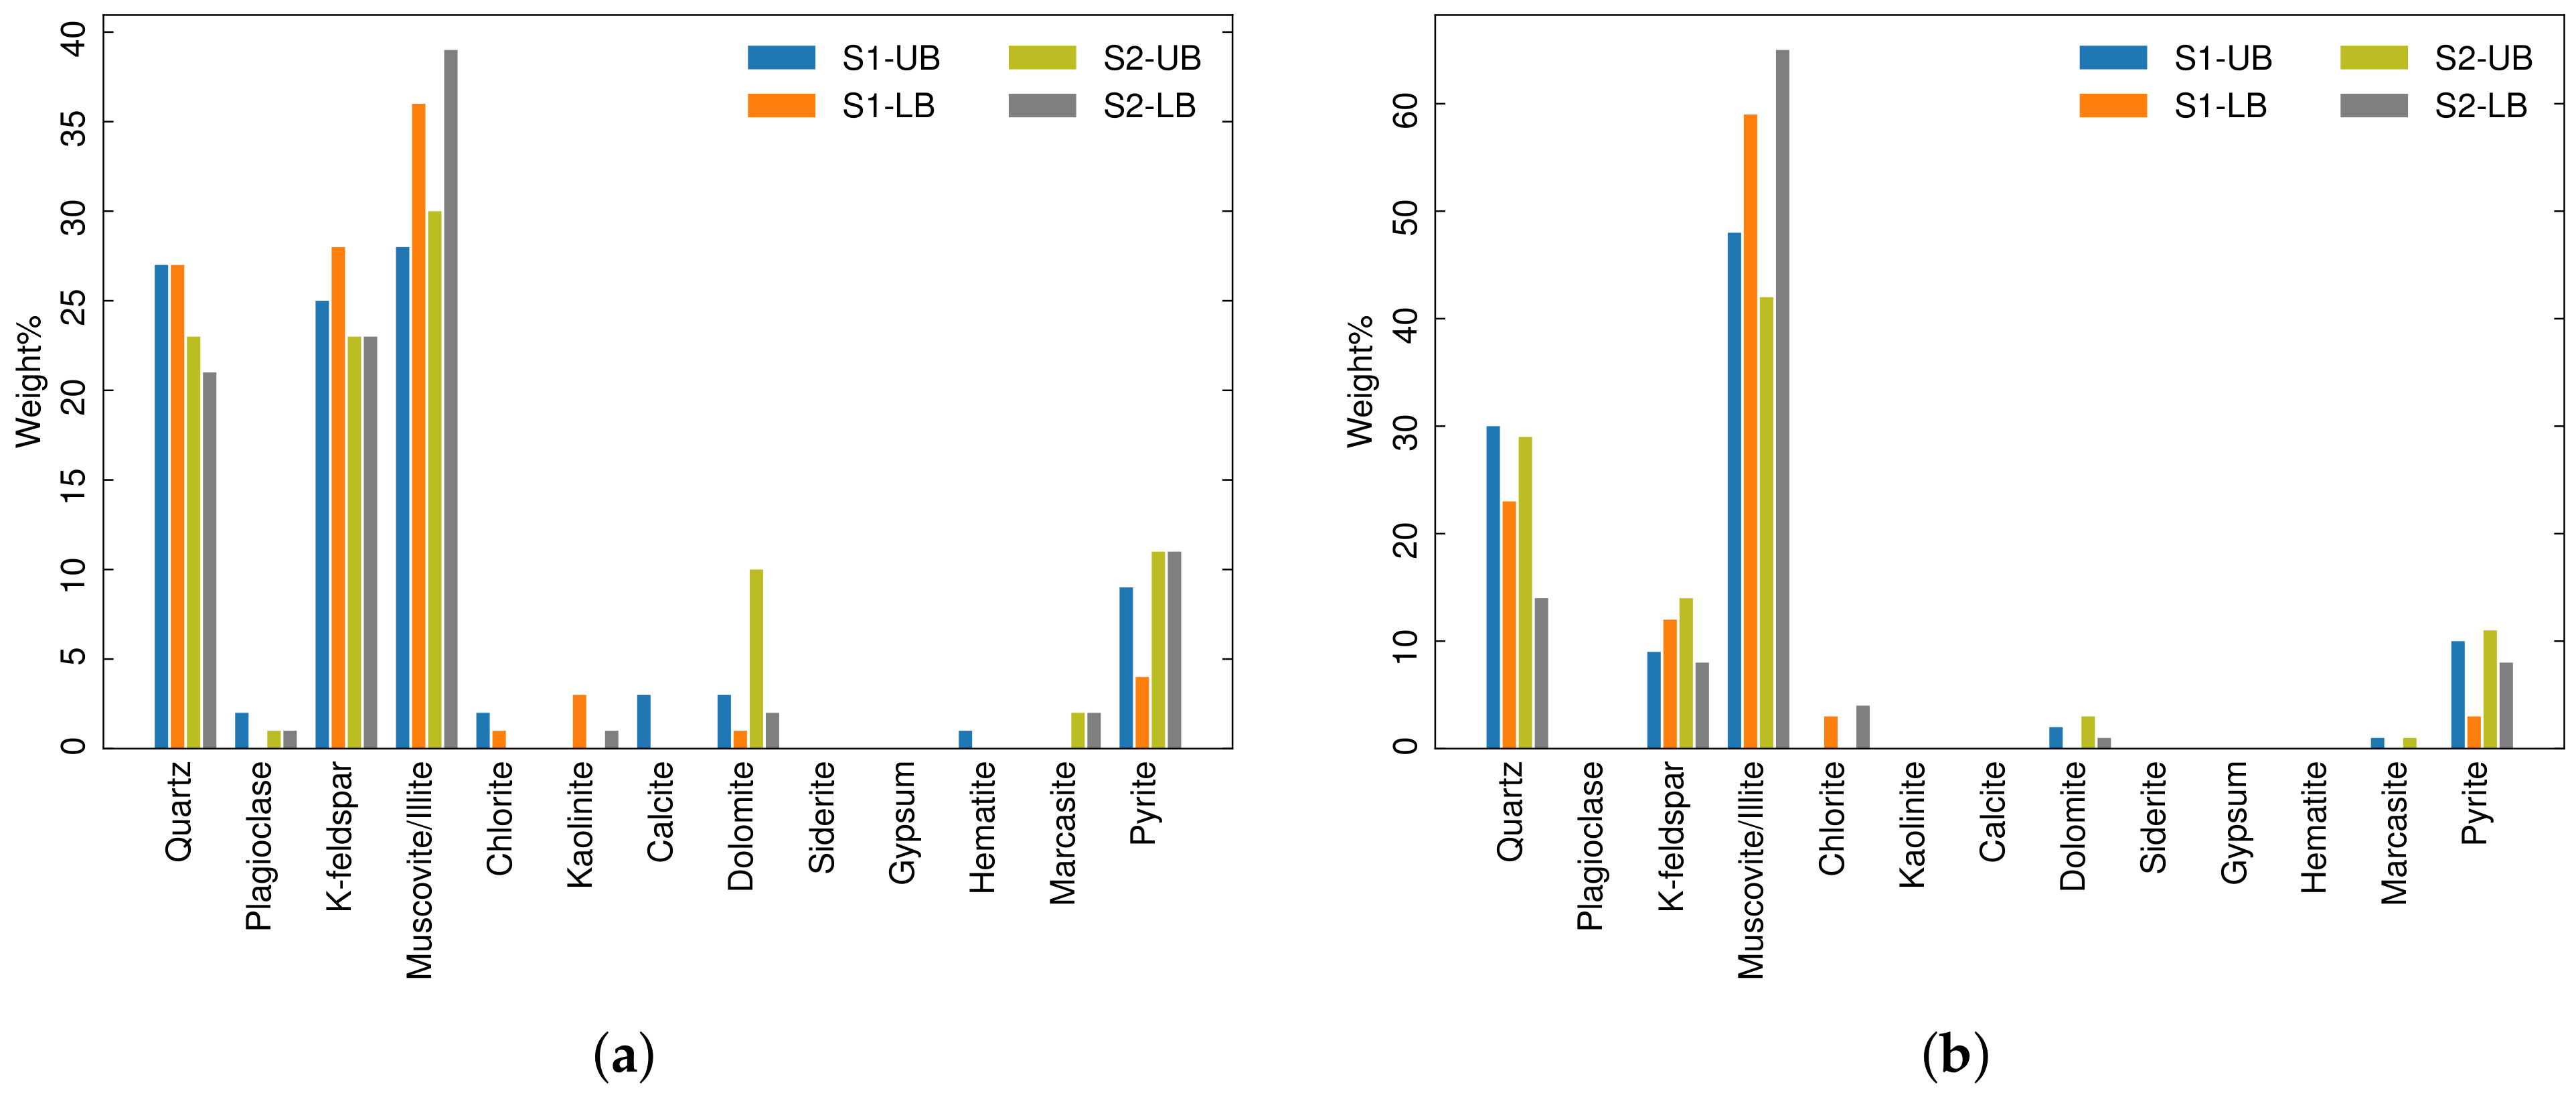
X-ray diffraction data are reported in Figure 7a,b. Figure 7a illustrates the bulk mineralogy of the samples and Figure 7b shows the mineralogy of the clay-sized fractions. All four samples are carbonate lean with abundant quartz and mica (muscovite/illite). Minor amounts of K-feldspar and pyrite occur in all samples and minor to trace plagioclase feldspar, chlorite, kaolinite, siderite, hematite, and marcasite occur in the samples. In general, the LB samples have slightly higher clay contents with lower quartz.
The semi-quantitative mineralogy of the <2 μm fractions is given in Figure 7b. The samples have abundant illite, subordinate quartz, minor K-feldspar and pyrite, and minor to trace calcite and dolomite. The samples do contain an amorphous component, estimated on average about 25%.
4.5. Molecular Analysis of Organic Extracts from the As-Received Rocks
The following section summarizes the distribution of organic compounds that were solvent-extracted from the samples. It should be emphasized that the molecular analyses of solvent extracts and the CO2 extracts (that will be presented later in this manuscript) are not comparable for two main reasons: (i) the solvent extracts have been fractionated into saturate and aromatic compounds whereas the CO2 extracts have been analyzed as whole oil, and (ii) the solvent extracts have been analyzed using GC-FID and GC-MS whereas the CO2 extracts were analyzed using GC-FID only, the latter limits the number of compounds that can be used for organic geochemical interpretations. However, the analysis of solvent extracts from as-received rocks was necessary to complement the general characteristics of the samples as well as examine possible relationships between their molecular nature and the petrophysical properties of the rock. In this section, only the findings on the organic compounds from rocks extracted with a solvent is discussed.
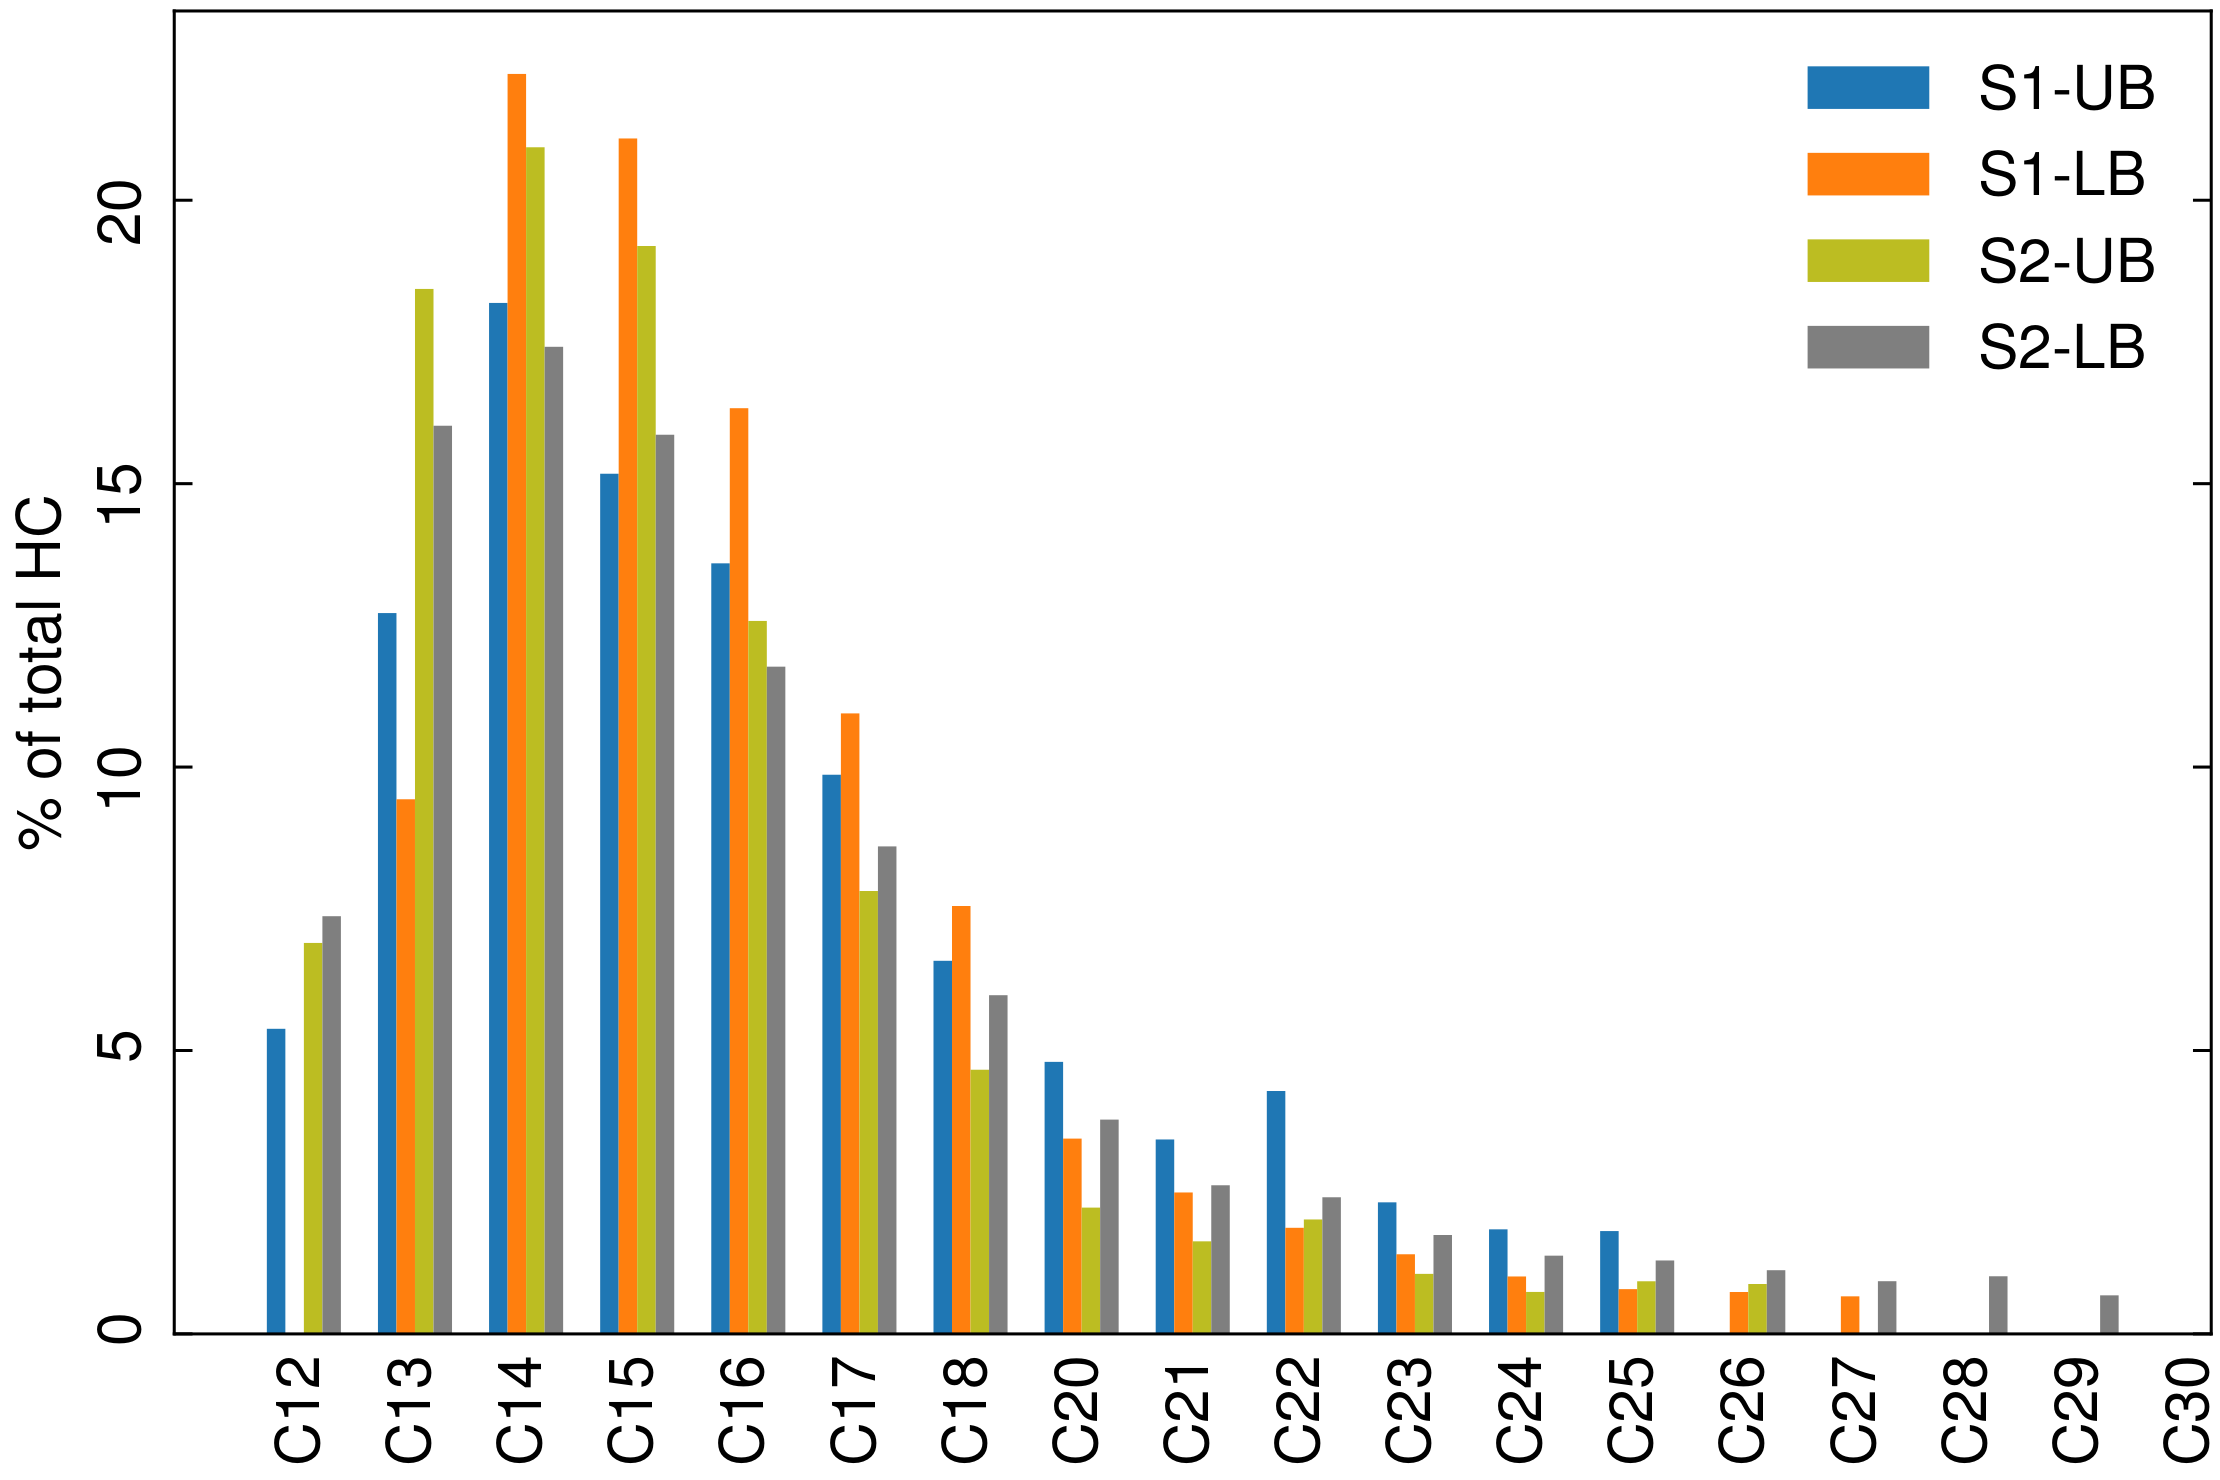
The relative distribution of n-alkane hydrocarbons contained in each sample is shown in Figure 8. The samples exhibit a high abundance of light hydrocarbons in the C13–C16 range despite volatility loss during sample preparation. Hawthorne et al. [7] showed, due to the tight nature of the shales, hydrocarbons tend to remain in the UB and LB rock samples much better than in the MB samples after collection and storage, though there are still losses of the more volatile hydrocarbons. A C13–C16 dominant composition for the in-place hydrocarbon is observed for all four shale samples. There is no significant disparity in the n-alkanes distribution (Figure 8). Traces of heavier than C20 components are detected, particularly in sample S2-LB.
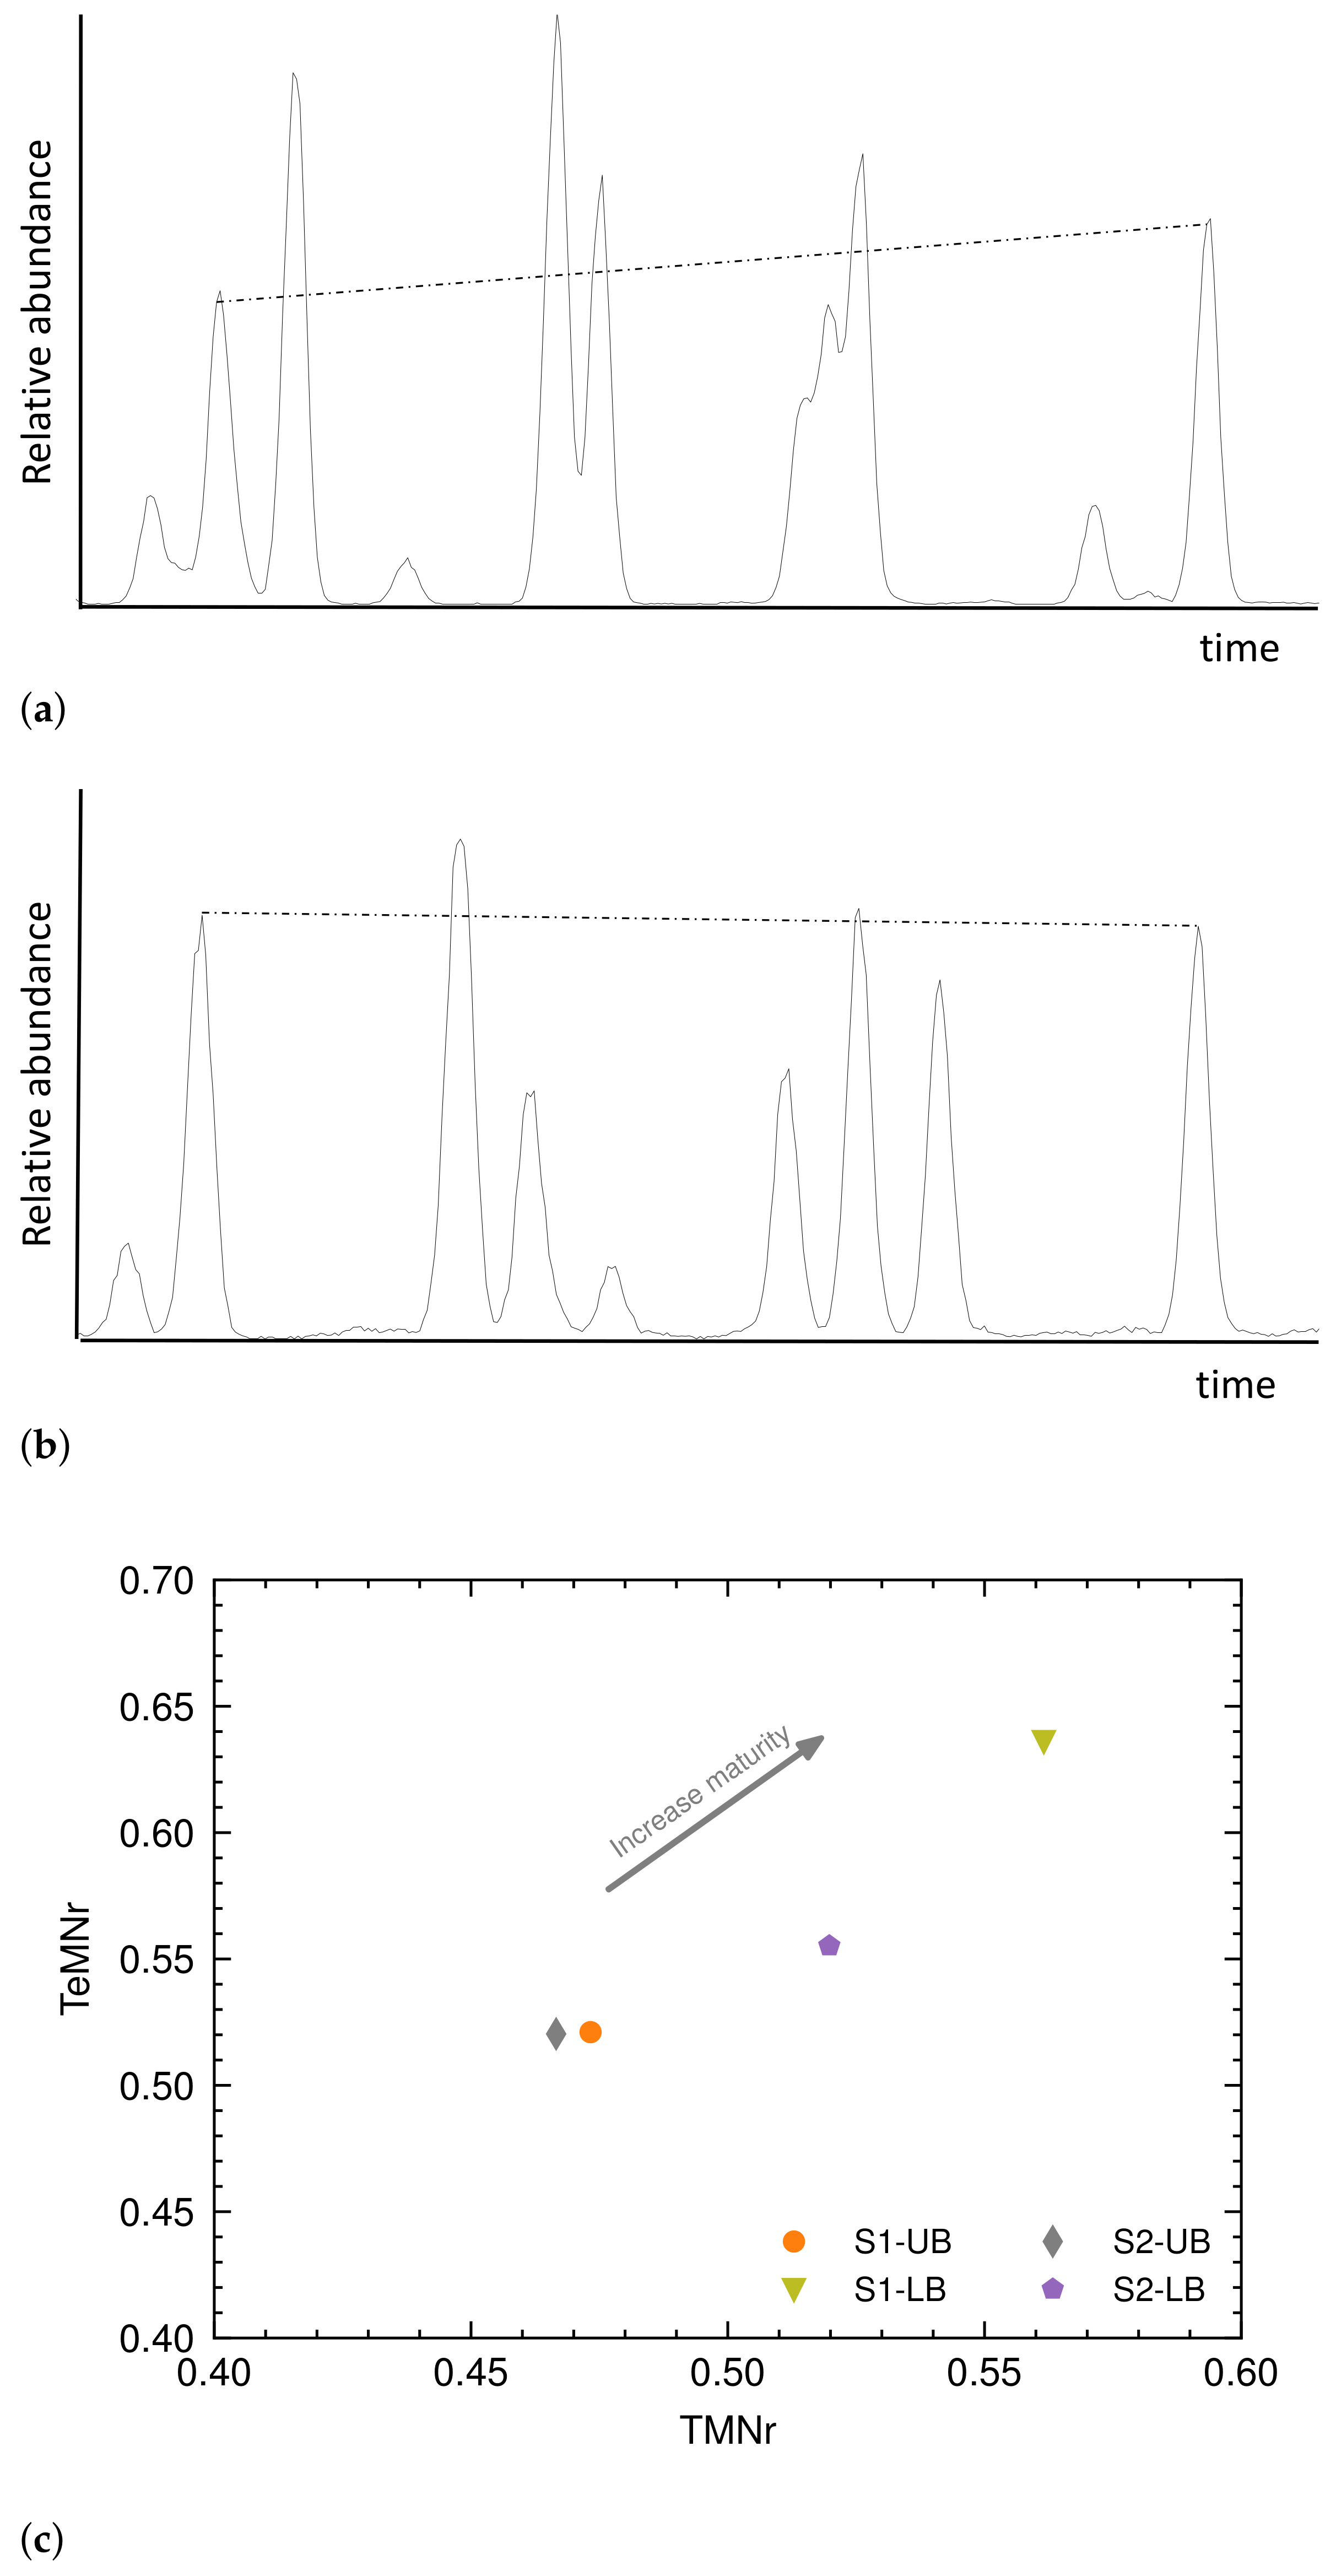
An important aspect to highlight is that the molecular data do not fully support the immaturity of the samples. For instance, the distribution of trimethylnaphthalenes (Figure 9a) and tetramethylnaphthalenes (Figure 9b) rather describes an early-mature to medium maturity as defined by van Aarssen et al. [43]. Likewise, when correlating the trimethylnapthalene ratio (TMNr) with the tetramethylnapjthalene ratio (TeMNr) in Figure 9c, these parameters do suggest a higher maturity level in the Lower Bakken (as expected for a normal maturity trend increasing with depth). In immature samples, the TMNr and TeMNr usually do not show any correlation due to stronger source effects that have not been overprinted by temperature [43].
The alkylnaphtalene ratios are probably a better representation of the actual thermal maturity of the samples given the oil saturation found, which would not be expected for an immature rock. Previous studies have reported that highly organic-rich Bakken intervals tend to show underestimated maturity because of hydrocarbon carryover into the S2-pyrolysis peak, which leads to Tmax values lower than expected [29,44].
4.6. CO2 Extraction Data
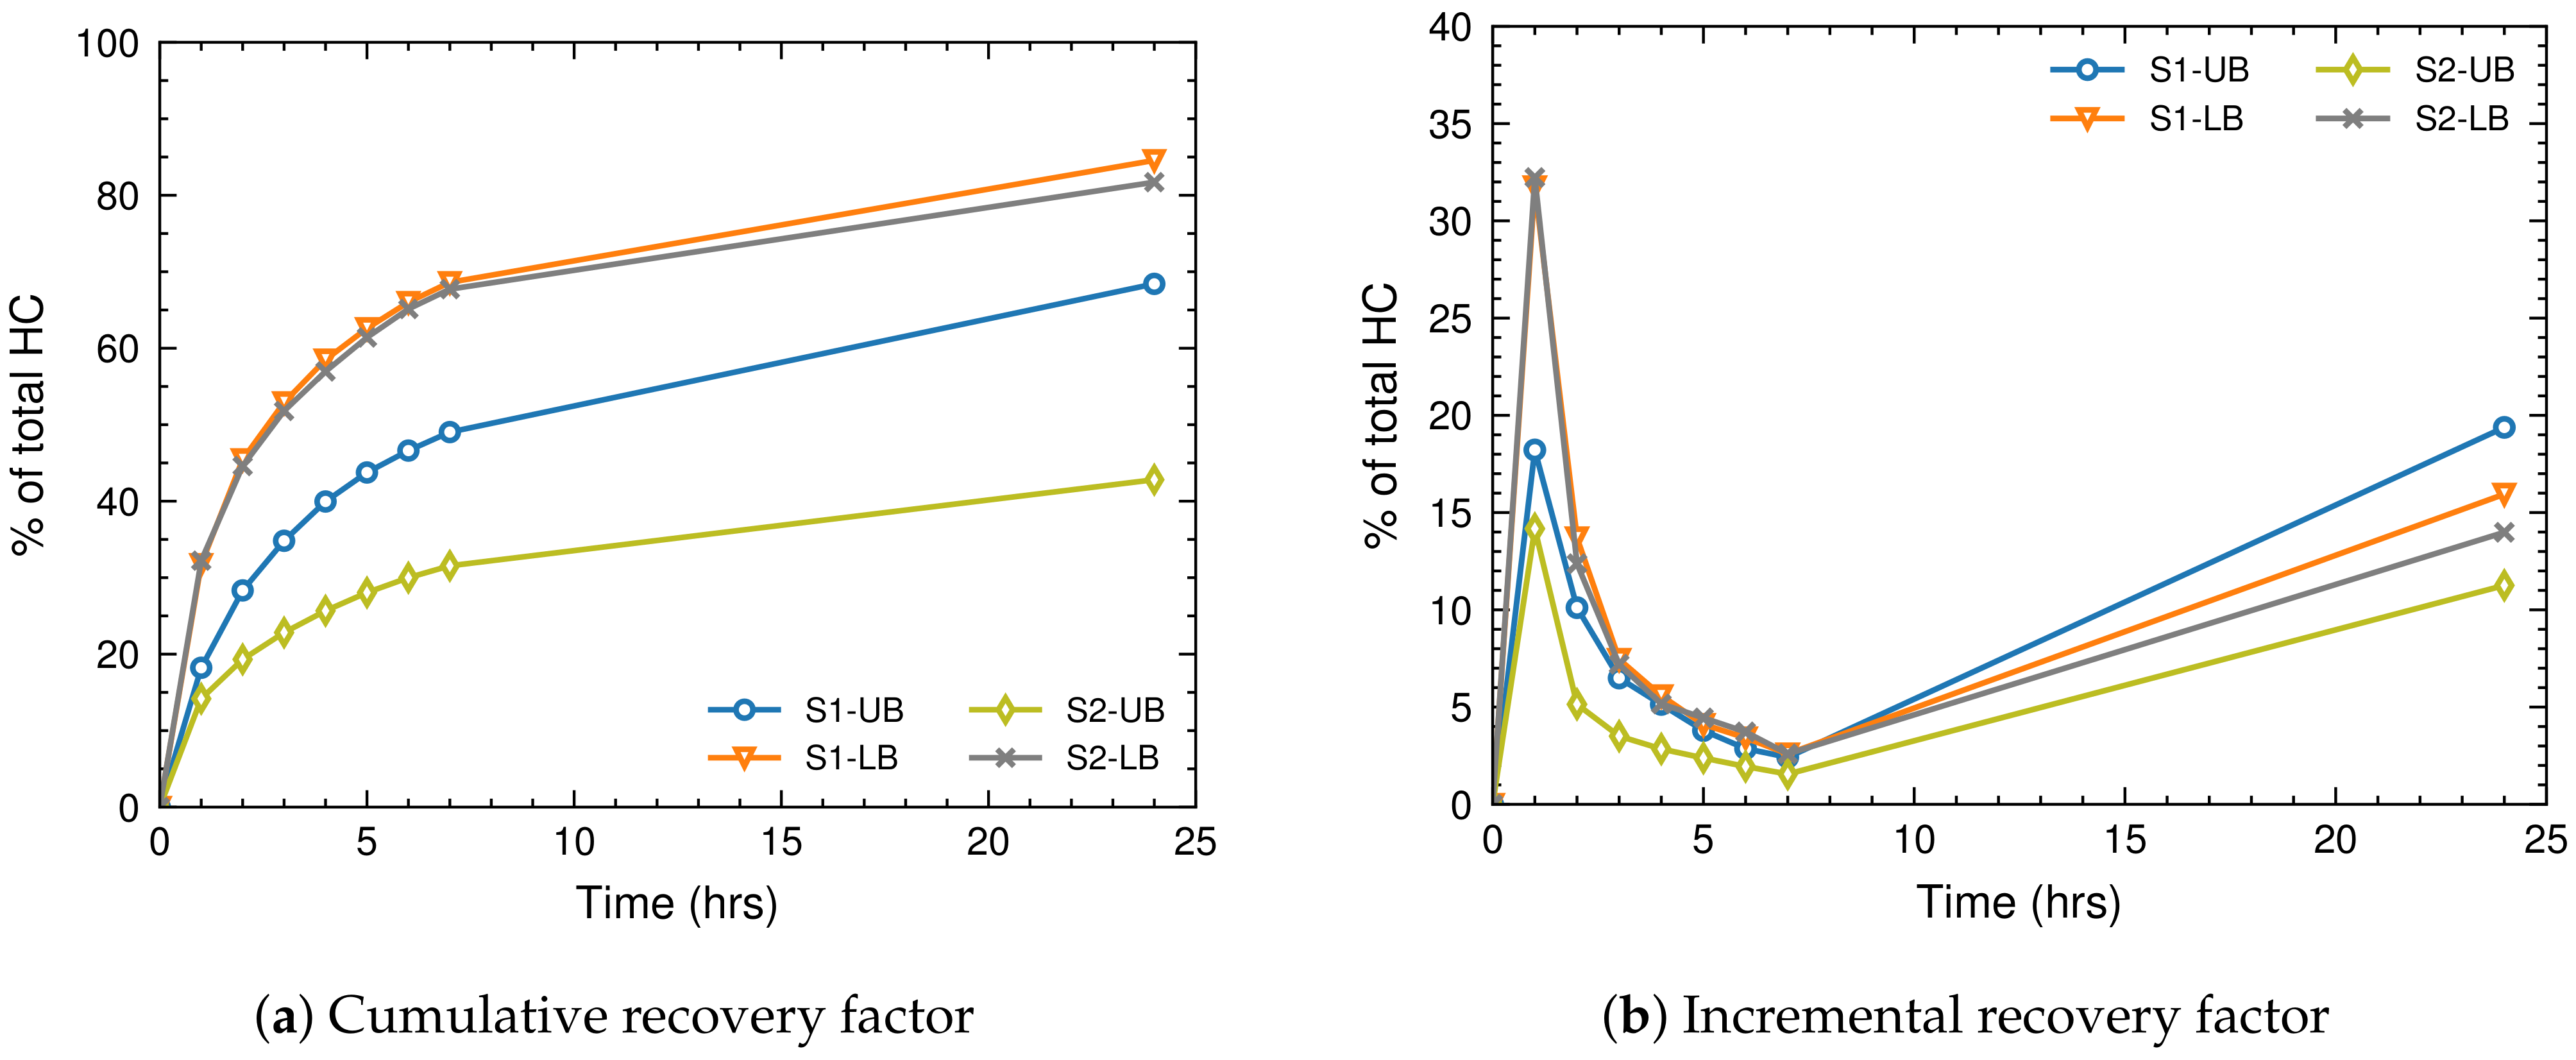
As described earlier, CO2 extraction experiments measured both the cumulative and component-specific recovery factors throughout the tests. Cumulative recovery is simply the fraction of recovered hydrocarbon after each cycle of injection. Total recoverable hydrocarbon was computed by pulverizing the samples at the end of each test and extracting all hydrocarbons to compute the total hydrocarbon contents.
The cumulative recovery factors are reported in Figure 10a. The recovery percentage at the end of the 24 h ranges from 42 to over 80%. Note that the recovery factors are high because the experiments were conducted on rock chips (due to increased surface area and pore accessibility). A notable feature of the recovery data is that the LB samples yielded higher recovery factors as compared to the UB samples. For sample S2, the recovery factor for the LB sample is almost twice that of the UB. The cause of such observation is not clear at first. Both sets of samples were analyzed for different characteristics, and LB samples tend to have higher pore volumes and are more mature than UB samples (see Figure 5a and Figure 9c).
Hawthorne et al. [7] studied recovery from 51 US Bakken shale samples and observed that LB and UB samples are generally similar in their recovery factors. However, our dataset suggests the same might not be true for the Canadian Bakken Formation. To better understand the data, the recovery data should be combined with the other characterization tests. S1-UB has a higher TOC content than S1-LB, while S2-UB and S2-LB have relatively similar TOC contents. Therefore, TOC content is not the reason for recovery factor differences. On the other hand, LB samples tend to be more mature (see Figure 9c) compared to UB samples. Higher maturity can potentially mean a better developed organic-pore system, that eventually affects the ultimate recovery factor.
It is also plausible that different depositional environments for the LB and UB layers could have an impact as well. For example, typical biomarkers such as hopanes and steranes were barely detected in sample S2-LB compared to the others, which might be attributed to depositional environment conditions. However, it is unclear how this would affect physical phenomena like CO2 transport. Longer chain n-alkanes were also detected in sample S2-LB (Figure 8).
In terms of pore structure, MICP data does not show significant differences in pore throat size between the LB and UB samples. However, the LPA data suggest that LB samples are more heterogeneous and have more mesopore volume, reflected through the hysteresis loop of the adsorption and desorption isotherms. The LB samples, in particular for sample S2, showed higher adsorption capacity (see Figure 5a), and this may play a role in the differences in the recovery factors.
The mineralogy of both set of samples was also shown to be broadly similar, with the LB samples having slightly higher clay contents. In particular, higher illite contents may cause a reaction with CO2 resulting in swelling of the clay contents [45]. Clay swelling in an unconfined test can result in the development of micro-fractures in the samples, consequently improving contact area and permeability.
Combining the characterization results with that of CO2 extraction data, none of the properties can explain the differences between the recovery factor difference of LB and UB samples. If there is a correlation between these characteristics and the CO2-EOR performance, it is a highly complex and multi-dimensional relationship. Although there are differences in the adsorption capacity of samples, the CO2 extraction results do not correlate with the adsorption capacity (S1-UB has the lowest adsorption capacity, while S2-UB has the lowest recovery percentage). The difference in recovery factors of LB and UB samples can be explained partly by the maturity of the organic contents, where LB samples tend to be more mature. By extension, the difference might be attributed to better connectivity of the pores. Since the size of the dataset is limited in this work, no conclusion can be drawn on the role of mineralogy and wettability on EOR performance.
Figure 10b shows the incremental recovery factor recorded after each cycle of CO2 injection and draw-down (at constant pressure). As expected, the first cycle has the highest recovery factor, and monotonic decrease thereafter until the 6th cycle. The last cycle is the longest in duration and the recovery factor increases compared to the previous cycle.
Comparing the LB and UB samples, the first cycle reveals a significant disparity. Both LB samples have almost identical recovery factors after the 1th cycle. The UB samples have almost half the recovery factor compared to the LB samples after the 1st cycle. Figure 10b suggests CO2 penetrates the LB samples much faster, possibly reflecting the difference in pore system structure of the LB and UB samples.
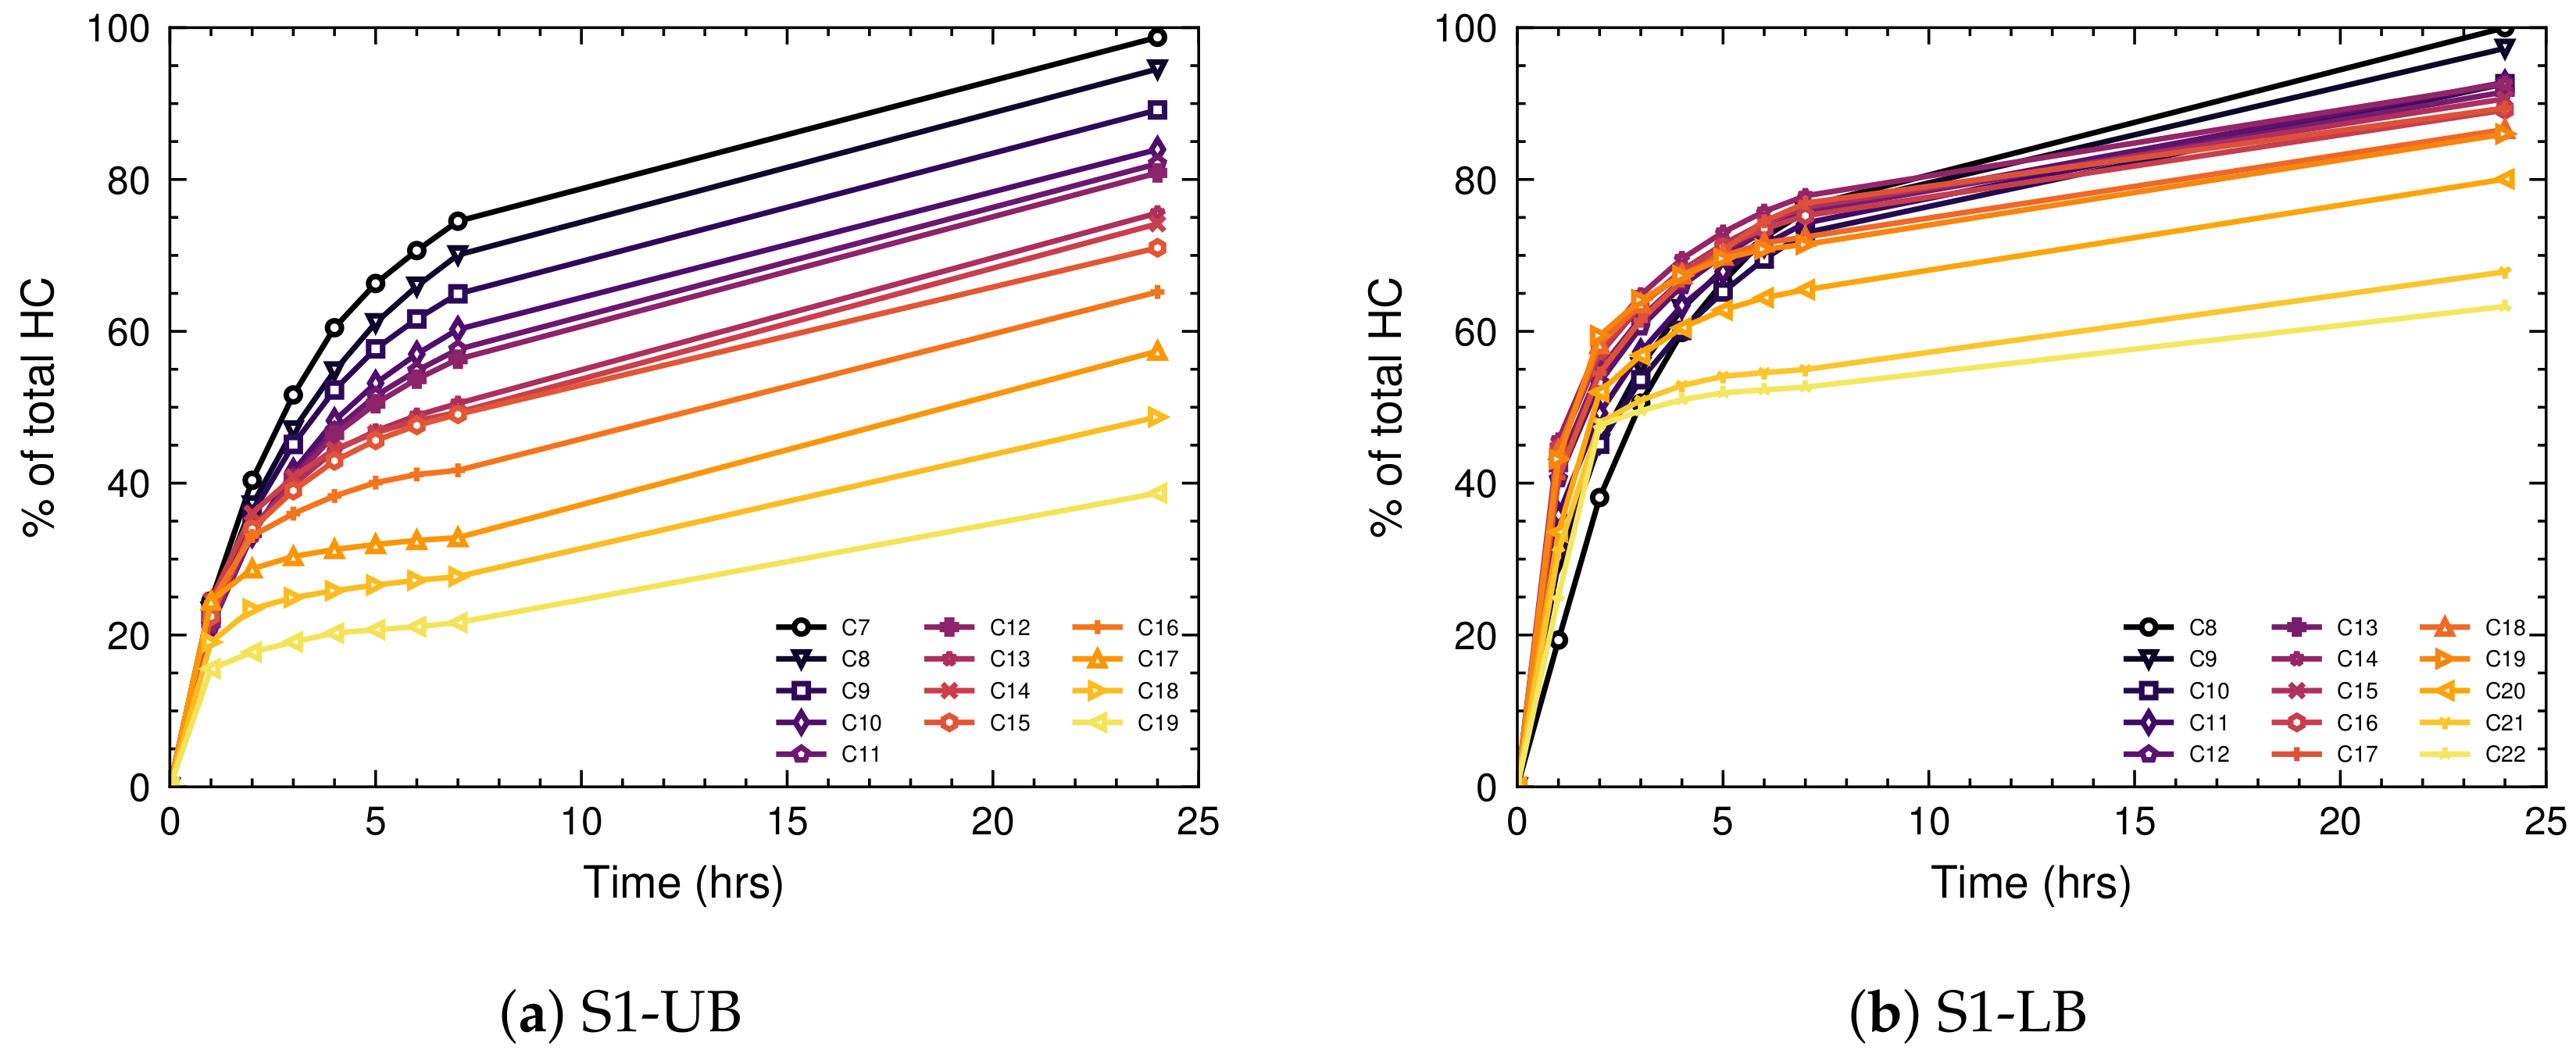
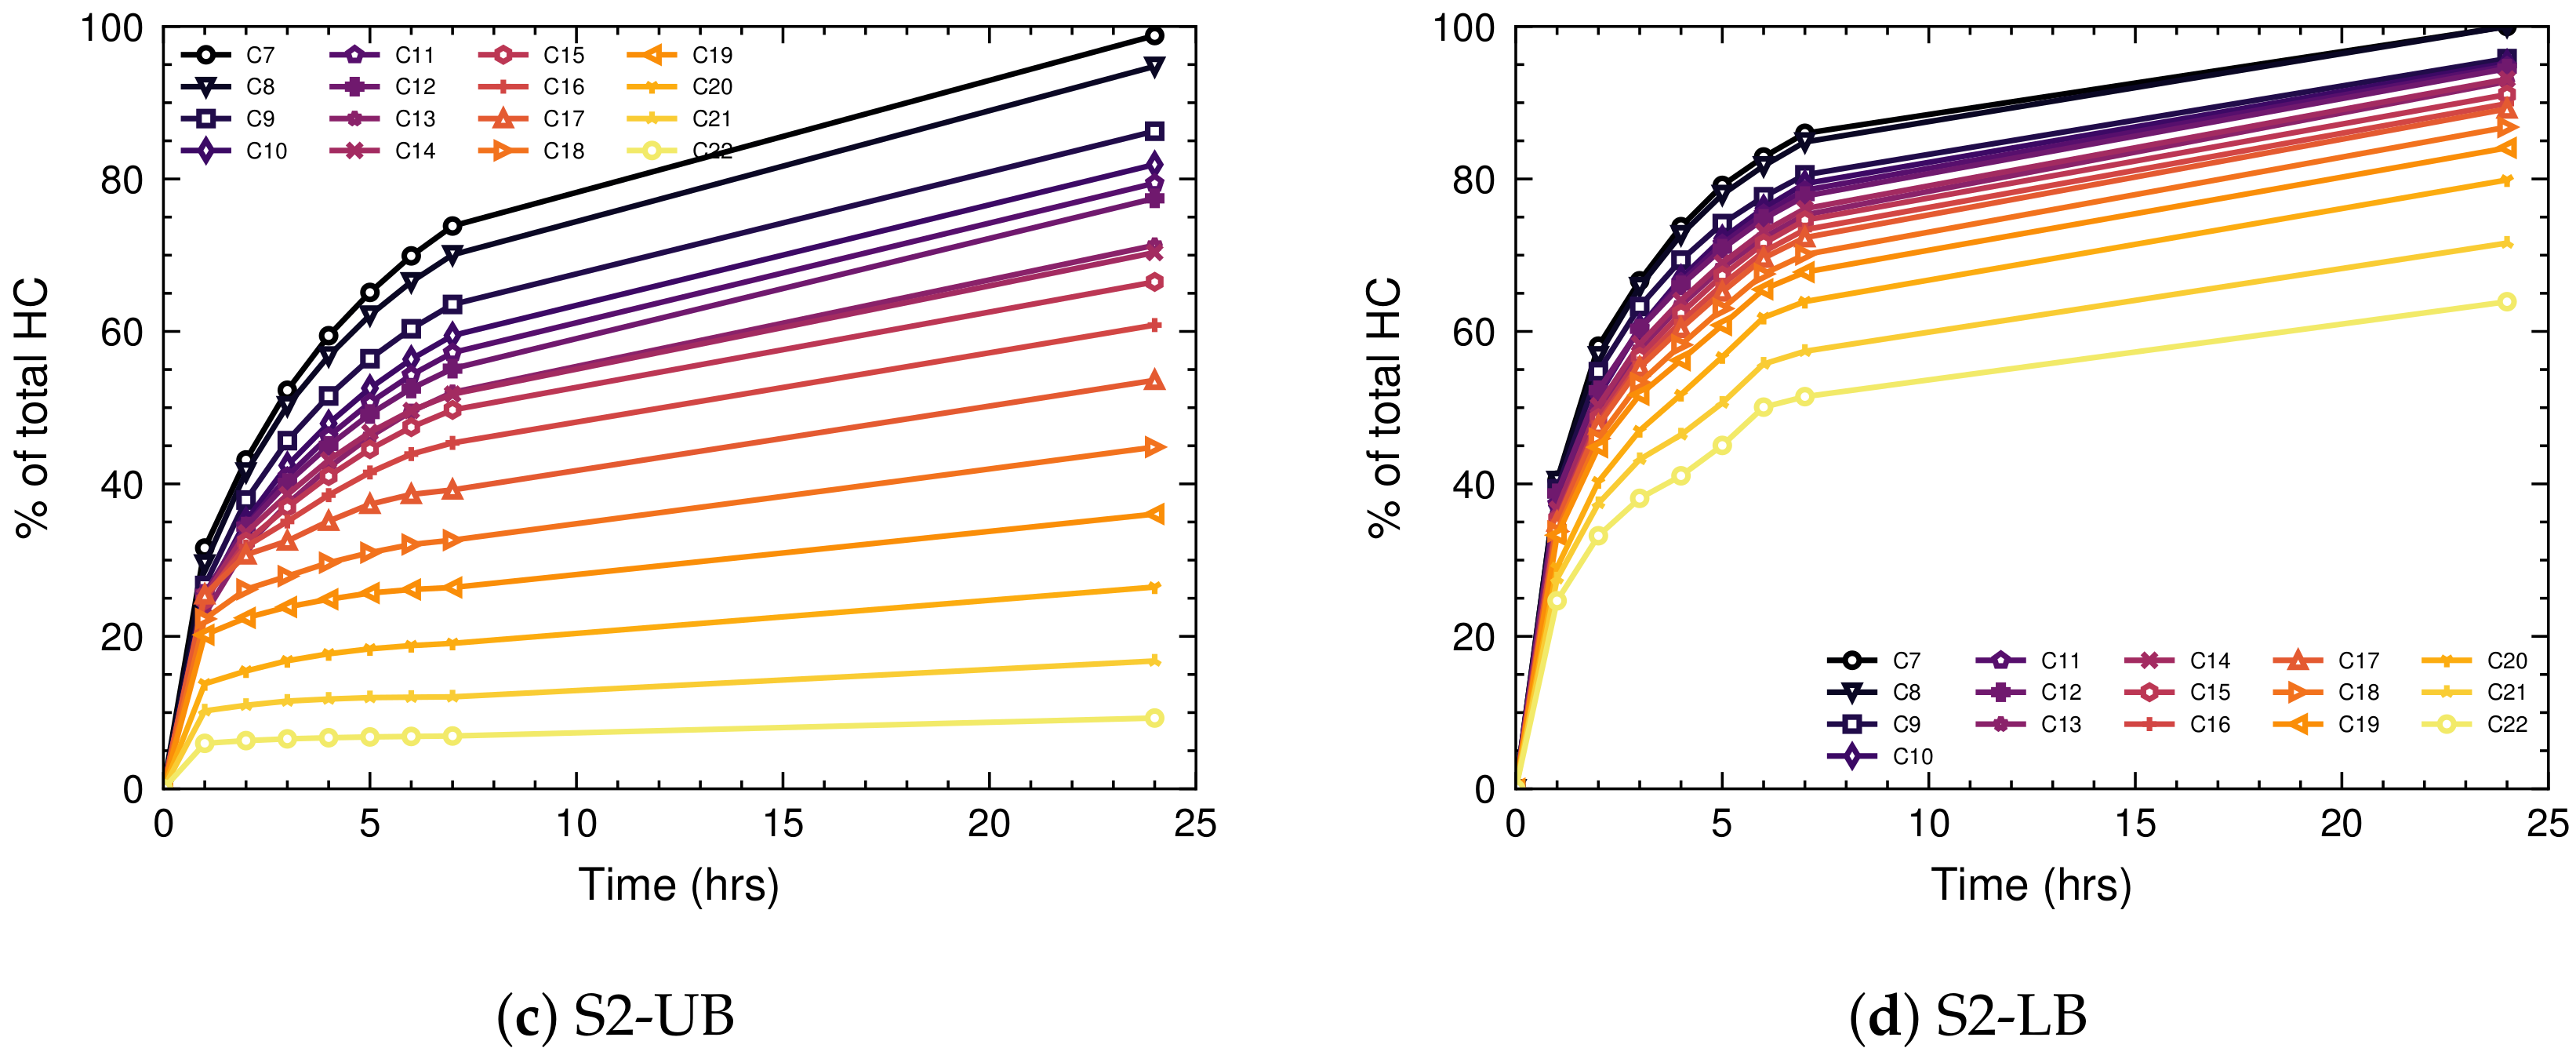
Hydrocarbon extracts during the CO2 huff-n-puff experiments were also analyzed using GC–FID. Figure 11 reports the component-specific recovery factors. The y-axis is the recovery factor for each component. The data suggest lighter hydrocarbons are easier to produce, and the ultimate recovery factor is higher for the lighter components. Higher solubility in CO2, higher diffusion coefficient, and smaller molecular size are the main contributor to this behaviour [17]. All samples show similar profiles. Note that the hydrocarbon composition for the samples indicates a light oil. The recovery data agrees with the diffusive recovery mechanism of Mahzari et al. [18]. In essence, the concentration gradient drives the CO2 into the oil, causing liberation of lighter components and consequently recovering hydrocarbons.
4.7. Recovery Mechanism
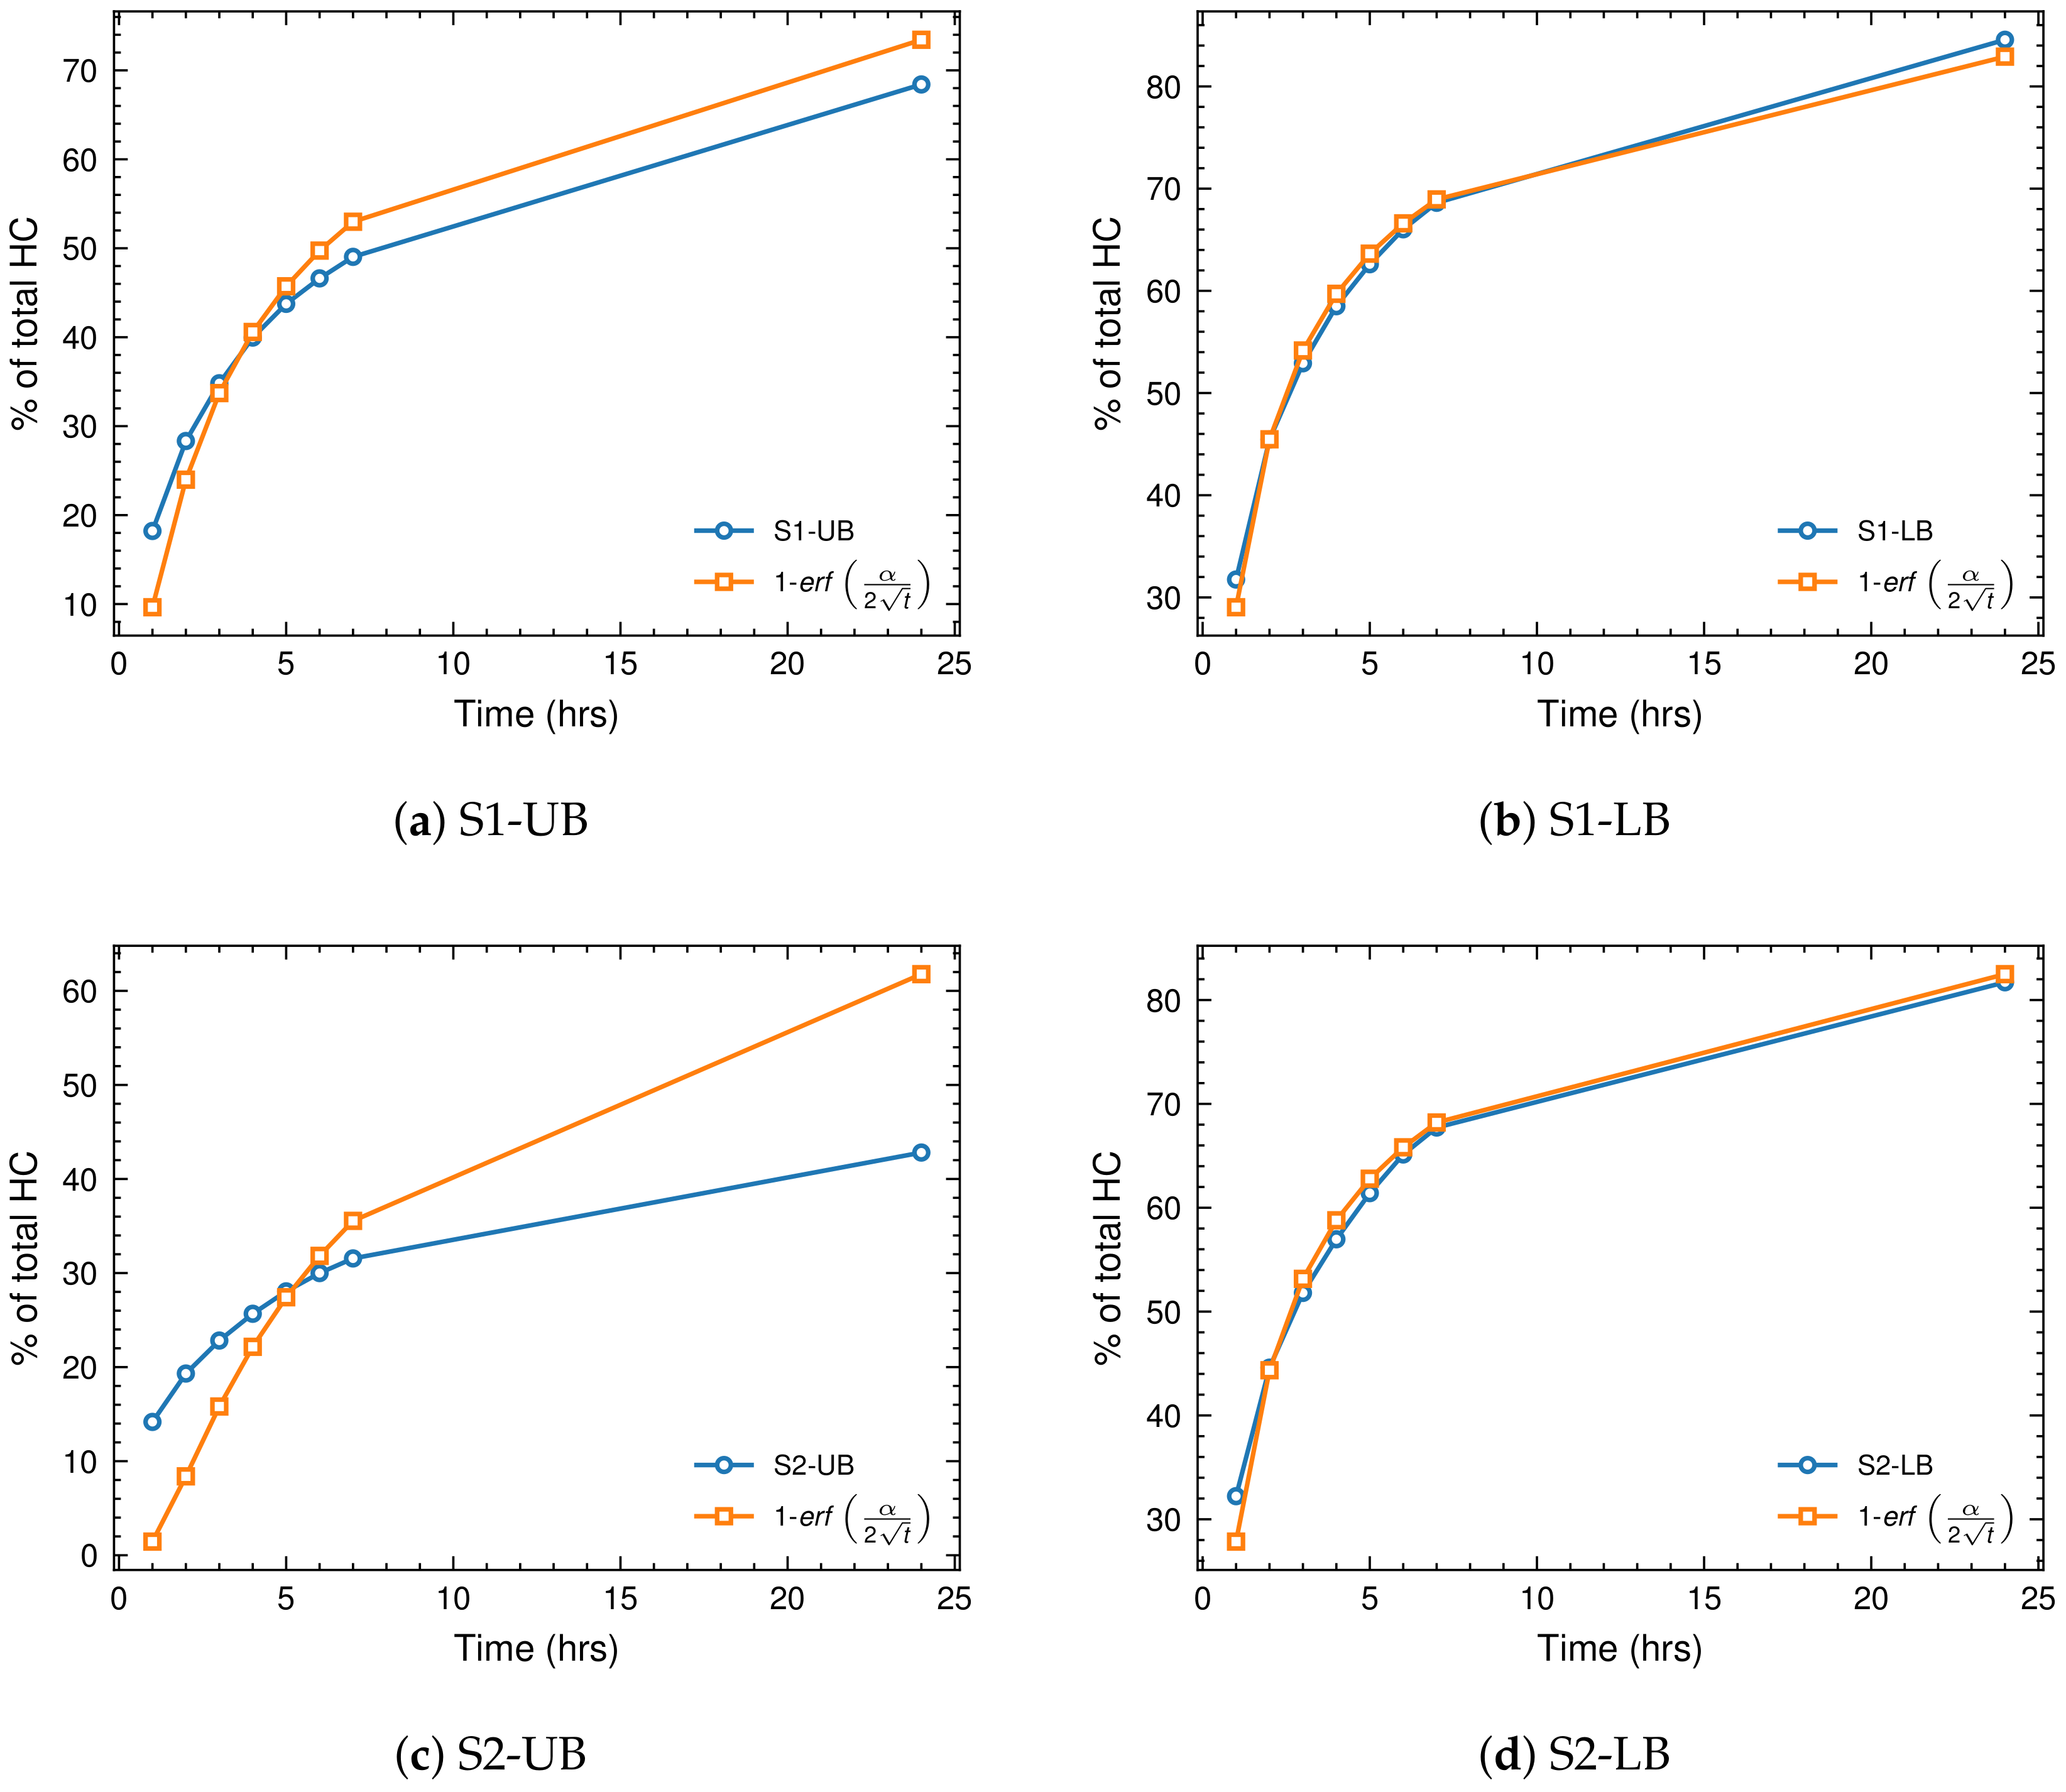
The recovery mechanism of oil through CO2 huff-n-puff has been the subject of various studies. Most studies attributed EOR through CO2 injection in shales to molecular diffusion of CO2 into nano-pores (e.g., Alfarge et al. [23]). The recovery factors profiles (Figure 10a) are log-linear, which suggests a diffusion-dominated recovery mechanism. To test this hypothesis, the recovery profiles were fitted using a 1D concentration-gradient-driven diffusion type of recovery. Equation (1) describes a recovery profile purely driven by diffusive flow [16,46]. Such assumption is based on the fact that the soaking chamber is static; it is further assumed that the pressure gradient tends to be negligible in the crushed samples. Once again, because of the small size of the particles (1–4 mm), such an assumption is justified. The recovery profiles are fitted to Equation (1):
In Equation (1), X represents the length scale associated with the samples and D is the diffusion coefficient. The length scale implicitly includes the tortuosity of the pore space, which is an important factor in fluid flow and the accessibility of pores by CO2. Since the length scale and the diffusion coefficient were unknown, they were combined into another parameter: , which is the fitting parameter for the recovery data. The hypothesis is that when a fit to the recovery factor could be found using Equation (1), the recovery was dominated by molecular diffusion, otherwise a more complex mechanism of recovery was at play.
Figure 12 shows the results of fitting Equation (1) to the recovery profiles for the four shale samples. The recovery profiles for the LB samples (Figure 12b,d) fit perfectly with a diffusion-driven type of recovery. UB samples (Figure 12a,c), on the other hand, deviate from this behaviour. Sample S2-UB has the lowest recovery factor, and the recovery profile deviates from the concentration-gradient diffusion recovery profile.
A combination of various parameters appears to be causing a complex chain of reactions that ultimately results in the hindered ability of CO2 to diffuse into the tight shale matrix of the UB samples. However, based on the characterization results, this is not attributed to routine properties such as pore size distribution. Complex pore structures, low maturity, blocked pathways, and underdeveloped pore system in the UB samples are believed to be the main cause of deviation from a diffusive recovery. Parameters such as connectivity of the pore space, tortuosity, and diffusion coefficient play a crucial role in diffusion-driven flows. However, these parameters are not routine and are not measured in most studies.
It can be concluded that the main recovery mechanism of CO2-EOR in the experiments is molecular diffusion, driven by the concentration gradient. The design of EOR projects should take into account the importance of CO2 diffusion into the rock matrix to maximize oil recovery.
5. Summary
CO2-EOR+ in unconventional resources and, in particular, organic-rich shales has great potential, both financially and technically. However, field applications have seen limited success, with the exception of those at the Eagle Ford. Unlike conventional CO2-EOR, in which multiple drive mechanisms can contribute to oil recovery, concentration gradient-driven molecular diffusion is the primary mechanism of recovery in unconventional reservoirs. Field applications should be designed to maximize this diffusion. The fracturing, controlling flow conformance, soak times, and detailed characterization of the target formations would be key for these designs.
In this work, CO2-EOR performance in four Bakken shale samples was studied. The samples were characterized for pore and throat size, mineralogy, and geochemical property (organic petrography). These properties were used to analyze the CO2 extraction data. Since only four shale samples from the same shale deposit were used, the analysis was done in a comparative framework rather than isolating shale properties to study their impact on the CO2-EOR. We used the differences between the shale samples to explain the CO2 extraction data. However, it should be noted that no claim can be made about a single shale property on the CO2-EOR performance based on the results of this study. In the context of CO2-EOR and the impact of shale properties, most of these properties are confounder variables (i.e., they affect both the EOR performance and other properties). In presence of confounding variables establishing a clear correlation is not trivial and requires massive datasets to do.
In terms of factors affecting CO2-EOR in unconventional reservoirs, there is no clear indication of whether organic contents and mineralogy play a role. In the experiments conducted in this work with two sets of Lower and Upper Bakken shales, Lower Bakken samples have higher recovery factors compared to the Upper Bakken shales. The characterization tests indicated both formations are broadly similar in terms of pore structures, although the Upper Bakken samples tend to have higher TOC content. Nonetheless, both formations have very high TOC values, hence, it is hard to link the degradation in recovery factors to a single characteristic.
The analysis of the recovery mechanism shows that the maximum recovery factor is achieved under a concentration gradient driven diffusion drive mechanism. Of course, this is naturally the main mechanism of recovery since the test procedure constrained the convective transport (i.e., small to zero pressure gradient). However, the upper Bakken samples indicated a deviation from this regime, possibly owing to the pore structures and underdeveloped pore system that limits the fluid exchange. The deviation of recovery profiles from a concentration gradient driven diffusion dominant flow can potentially be caused by a combination of complex pore structures (e.g., large tortuosity) and immature organic contents of the samples.
Author Contributions
M.B. and O.H.A. conceptualized, analyzed, and wrote the draft manuscript; J.C. contributed to the molecular analysis of the hydrocarbon extracts; S.B.H. and B.K. performed the CO2 extraction experiments; J.B.P. performed the X-ray diffraction analysis; all authors contributed to the revision of the paper. All authors have read and agreed to the published version of the manuscript.
Funding
The funding for this study was provided by the Natural Resources Canada (NRCan) Geoscience for New Energy Supply (GNES) program (331403).
Institutional Review Board Statement
Not applicable.
Data Availability Statement
All of the data for this study are included within the manuscript.
Acknowledgments
The authors would like to acknowledge the help of the Geological Survey of Canada labs, as well as the staff and scientists from the Energy & Environment Research Center, for helping with the experiments and preparations in this study. We would also like to acknowledge and thank Adnan Younis and Amin Ghanizadeh from the University of Calgary for their help with the N2 adsorption–desorption measurements and analysis, as well as their valuable feedback and discussions about the paper.
Conflicts of Interest
The authors declare no conflict of interest.
References
- Jia, B.; Tsau, J.S.; Barati, R. A review of the current progress of CO2 injection EOR and carbon storage in shale oil reservoirs. Fuel 2019, 236, 404–427. [Google Scholar] [CrossRef]
- Du, F.; Nojabaei, B. A Review of Gas Injection in Shale Reservoirs: Enhanced Oil/Gas Recovery Approaches and Greenhouse Gas Control. Energies 2019, 12, 2355. [Google Scholar] [CrossRef] [Green Version]
- Boot-Handford, M.E.; Abanades, J.C.; Anthony, E.J.; Blunt, M.J.; Brandani, S.; Dowell, N.M.; Fernández, J.R.; Ferrari, M.C.; Gross, R.; Hallett, J.P.; et al. Carbon capture and storage update. Energy Environ. Sci. 2013, 7, 130–189. [Google Scholar] [CrossRef]
- Orr, F.M. Carbon Capture, Utilization, and Storage: An Update. SPE J. 2018, 23, 2444–2455. [Google Scholar] [CrossRef]
- IEA. Storing CO2 through Enhanced Oil Recovery; Technical Report; International Energy Agency: Paris, France, 2015. [Google Scholar]
- Quantification Protocol for Enhanced Oil Recovery. Version 2; Standard; Government of Alberta: Edmonton, CA, USA, 2022.
- Hawthorne, S.B.; Miller, D.J.; Grabanski, C.B.; Azzolina, N.; Kurz, B.A.; Ardakani, O.H.; Smith, S.A.; Sanei, H.; Sorensen, J.A. Hydrocarbon Recovery from Williston Basin Shale and Mudrock Cores with Supercritical CO2: Part 1. Method Validation and Recoveries from Cores Collected across the Basin. Energy Fuels 2019, 33, 6857–6866. [Google Scholar] [CrossRef]
- Hawthorne, S.B.; Miller, D.J. Comparison of CO2 and Produced Gas Hydrocarbons to Dissolve and Mobilize Bakken Crude Oil at 10.3, 20.7, and 34.5 MPa and 110C. Energy Fuels 2020, 34, 10882–10893. [Google Scholar] [CrossRef]
- Jin, L.; Sorensen, J.A.; Hawthorne, S.B.; Smith, S.A.; Pekot, L.J.; Bosshart, N.W.; Burton-Kelly, M.E.; Miller, D.J.; Grabanski, C.B.; Gorecki, C.D.; et al. Improving Oil Recovery by Use of Carbon Dioxide in the Bakken Unconventional System: A Laboratory Investigation. SPE Reserv. Eval. Eng. 2016, 20, 602–612. [Google Scholar] [CrossRef]
- Jin, L.; Hawthorne, S.; Sorensen, J.; Pekot, L.; Kurz, B.; Smith, S.; Heebink, L.; Bosshart, N.; Torres, J.; Dalkhaa, C.; et al. Extraction of Oil From the Bakken Shales With Supercritical CO2. In Proceedings of the SPE/AAPG/SEG Unconventional Resources Technology Conference, Austin, TX, USA, 17–21 July 2017. [Google Scholar] [CrossRef]
- Fathi, E.; Akkutlu, Y.Y. Mass Transport of Adsorbed-Phase in Stochastic Porous Medium with Fluctuating Porosity Field and Nonlinear Gas Adsorption Kinetics. Transp. Porous Media 2011, 91, 5–33. [Google Scholar] [CrossRef]
- Fathi, E.; Akkutlu, I.Y. Multi-component gas transport and adsorption effects during CO2 injection and enhanced shale gas recovery. Int. J. Coal Geol. 2014, 123, 52–61. [Google Scholar] [CrossRef]
- Yu, W.; Lashgari, H.R.; Wu, K.; Sepehrnoori, K. CO2 injection for enhanced oil recovery in Bakken tight oil reservoirs. Fuel 2015, 159, 354–363. [Google Scholar] [CrossRef]
- Gamadi, T.D.; Sheng, J.J.; Soliman, M.Y. An Experimental Study of Cyclic Gas Injection to Improve Shale Oil Recovery. Proc. SPE Annu. Tech. Conf. Exhib. 2013, 4, 3019–3027. [Google Scholar] [CrossRef]
- Habibi, A.; Yassin, M.R.; Dehghanpour, H.; Bryan, D. Experimental investigation of CO2-oil interactions in tight rocks: A Montney case study. Fuel 2017, 203, 853–867. [Google Scholar] [CrossRef]
- Eide, Ø.; Fernø, M.A.; Alcorn, Z.; Graue, A. Visualization of Carbon Dioxide Enhanced Oil Recovery by Diffusion in Fractured Chalk. SPE J. 2016, 21, 112–120. [Google Scholar] [CrossRef]
- Hawthorne, S.B.; Grabanski, C.B.; Miller, D.J.; Kurz, B.A.; Sorensen, J.A. Hydrocarbon Recovery from Williston Basin Shale and Mudrock Cores with Supercritical CO2: 2. Mechanisms That Control Oil Recovery Rates and CO2 Permeation. Energy Fuels 2019, 33, 6867–6877. [Google Scholar] [CrossRef]
- Mahzari, P.; Oelkers, E.; Mitchell, T.; Jones, A. An Improved Understanding About CO2 EOR and CO2 Storage in Liquid-Rich Shale Reservoirs. In Proceedings of the SPE Europec featured at EAGE Conference and Exhibition, London, UK, 3–6 June 2019. [Google Scholar] [CrossRef]
- Hawthorne, S.B.; Gorecki, C.D.; Sorensen, J.A.; Steadman, E.N.; Harju, J.A.; Melzer, S. Hydrocarbon Mobilization Mechanisms from Upper, Middle, and Lower Bakken Reservoir Rocks Exposed to CO2. In Proceedings of the SPE Unconventional Resources Conference Canada, Calgary, AB, Canada, 5–7 November 2013. [Google Scholar] [CrossRef]
- Li, H.B.; Yang, Z.M.; Li, R.S.; Zhou, T.Y.; Guo, H.K.; Liu, X.W.; Dai, Y.X.; Hu, Z.G.; Meng, H. Mechanism of CO2 enhanced oil recovery in shale reservoirs. Pet. Sci. 2021, 18, 1788–1796. [Google Scholar] [CrossRef]
- Song, C.; Yang, D. Experimental and numerical evaluation of CO2 huff-n-puff processes in Bakken formation. Fuel 2017, 190, 145–162. [Google Scholar] [CrossRef]
- Adel, I.A.; Tovar, F.D.; Zhang, F.; Schechter, D.S. The Impact of MMP on Recovery Factor During CO2—EOR in Unconventional Liquid Reservoirs. In Proceedings of the SPE Annual Technical Conference and Exhibition, Dallas, Texas, USA, 23 September 2018. [Google Scholar] [CrossRef]
- Alfarge, D.; Wei, M.; Bai, B. Factors Affecting CO2-EOR in Shale-Oil Reservoirs: Numerical Simulation Study and Pilot Tests. Energy Fuels 2017, 31, 8462–8480. [Google Scholar] [CrossRef]
- Schmidt, M.; Sekar, B.K. Innovative Unconventional EOR-A Light EOR an Unconventional Tertiary Recovery Approach to an Unconventional Bakken Reservoir in Southeast Saskatchewan. In Proceedings of the 21st World Petroleum Congress, Moscow, Russia, 15–19 June 2014. [Google Scholar]
- Todd, H.B.; Evans, J.G. Improved Oil Recovery IOR Pilot Projects in the Bakken Formation. In Proceedings of the SPE Low Perm Symposium, Denver, CO, USA, 5–6 May 2016. [Google Scholar] [CrossRef]
- Hoffman, B.T. Huff-N-Puff Gas Injection Pilot Projects in the Eagle Ford. In Proceedings of the SPE Canada Unconventional Resources Conference, URC 2018, Calgary, AB, Canada, 13–14 March 2018. [Google Scholar] [CrossRef]
- Smith, M.G.; Bustin, R.M. Lithofacies and paleoenvironments of the Upper Devonian and Lower Mississippian Bakken Formation, Williston Basin. Bull. Can. Pet. Geol. 1996, 44, 495–507. [Google Scholar] [CrossRef]
- North Dakota Department of Mineral Resources. North Dakota Cumulative Oil Production by Formation through December 2016; Technical Report, North Dakota General Statistics; North Dakota Department of Mineral Resources: Bismarck, ND, USA, 2017.
- Donohue, C.M.; Barrie, C.D. A review of the Bakken petroleum systems in the United States and Canada: Recognizing the importance of the Middle Member play. AAPG Bull. 2021, 105, 1847–1866. [Google Scholar] [CrossRef]
- LeFever, J.A. Rock-Eval Data of the Bakken Formation; North Dakota Geological Survey: Bismarck, ND, USA, 2008.
- Johnson, M.S. Obscurity to Success in the Oil Business: Discovery of Parshall Oil Field in North Dakota; Karras Publishing: Denver, CO, USA, 2017. [Google Scholar]
- Aboussou, A.; Lamoureux-Var, V.; Wagner, T.; Pillot, D.; Kowalewski, I.; März, C.; Garcia, B. Pyritic sulphur and organic sulphur quantification in organic rich sediments using rock-eval. In Proceedings of the 1st EAGE/IFPEN Conference on Sulfur Risk Management in Exploration and Production, SRM 2018. European Association of Geoscientists and Engineers, Rueil-Malmaison, France, 18–20 September 2018. [Google Scholar] [CrossRef]
- Behar, F.; Beaumont, V.; De, H.L. Rock-Eval 6 Technology: Performances and Developments. Oil Gas Sci. Technol. 2001, 56, 111–134. [Google Scholar] [CrossRef]
- Carvajal-Ortiz, H.; Gentzis, T.; Ostadhassan, M. Sulfur Differentiation in Organic-Rich Shales and Carbonates via Open-System Programmed Pyrolysis and Oxidation: Insights into Fluid Souring and H2S Production in the Bakken Shale, United States. Energy Fuels 2021, 35, 12030–12044. [Google Scholar] [CrossRef]
- Standard Test Method for Microscopical Determination of the Reflectance of Vitrinite Dispersed in Sedimentary Rocks; Standard; ASTM International: Conshohocken, PA, USA, 2016. [CrossRef]
- Orr, W.L. Kerogen/asphaltene/sulfur relationships in sulfur-rich Monterey oils. Org. Geochem. 1986, 10, 499–516. [Google Scholar] [CrossRef]
- Raven, M.R.; Fike, D.A.; Gomes, M.L.; Webb, S.M.; Bradley, A.S.; McClelland, H.L.O. Organic carbon burial during OAE2 driven by changes in the locus of organic matter sulfurization. Nat. Commun. 2018, 9, 1–9. [Google Scholar] [CrossRef] [PubMed]
- Stasiuk, L.D. Petrographic thermal maturity assessment of Winnipegosis (Middle Devonian) and Bakken (Devonian-Mississippian) formations, Southeastern Saskatchewan. Bull. Can. Pet. Geol. 1994, 42, 178–186. [Google Scholar] [CrossRef]
- Clarkson, C.R.; Wood, J.M.; Burgis, S.E.; Aquino, S.D.; Freeman, M. Nanopore-Structure Analysis and Permeability Predictions for a Tight Gas Siltstone Reservoir by Use of Low-Pressure Adsorption and Mercury-Intrusion Techniques. SPE Reserv. Eval. Eng. 2012, 15, 648–661. [Google Scholar] [CrossRef]
- Fu, S.; Fang, Q.; Li, A.; Li, Z.; Han, J.; Dang, X.; Han, W. Accurate characterization of full pore size distribution of tight sandstones by low-temperature nitrogen gas adsorption and high-pressure mercury intrusion combination method. Energy Sci. Eng. 2021, 9, 80–100. [Google Scholar] [CrossRef]
- Brunauer, S.; Emmett, P.H.; Teller, E. Adsorption of Gases in Multimolecular Layers. J. Am. Chem. Soc. 1938, 60, 309–319. [Google Scholar] [CrossRef]
- Barrett, E.P.; Joyner, L.G.; Halenda, P.P. The Determination of Pore Volume and Area Distributions in Porous Substances. I. Computations from Nitrogen Isotherms. J. Am. Chem. Soc. 1951, 73, 373–380. [Google Scholar] [CrossRef]
- Van Aarssen, B.G.; Bastow, T.P.; Alexander, R.; Kagi, R.I. Distributions of methylated naphthalenes in crude oils: Indicators of maturity, biodegradation and mixing. Org. Geochem. 1999, 30, 1213–1227. [Google Scholar] [CrossRef]
- Clementz, D.M.; Demaison, G.J.; Daly, A.R. Well site geochemistry by programmed pyrolysis. Proc. Annu. Offshore Technol. Conf. 1979, 1979, 465–470. [Google Scholar] [CrossRef]
- Lindner, E.N. Review of the Effects of CO2 on Very-Fine-Grained Sedimentary Rock/Shale—Part III: Shale Response to CO2; U.S. Department of Energy: Oak Ridge, TN, USA, 2017. [CrossRef]
- Fernø, M.A.; Hauge, L.P.; Uno Rognmo, A.; Gauteplass, J.; Graue, A. Flow visualization of CO2 in tight shale formations at reservoir conditions. Geophys. Res. Lett. 2015, 42, 7414–7419. [Google Scholar] [CrossRef]
Figure 1.
A schematic of the CO2 extraction system.

Figure 2.
The kerogen type and maturity from the programmed pyrolysis data. The data suggested a type II kerogen in the immature to early oil window.
Figure 2.
The kerogen type and maturity from the programmed pyrolysis data. The data suggested a type II kerogen in the immature to early oil window.

Figure 3.
The organic petrography photomicrographs of the studied samples from the Lower and Upper Bakken Formation: the two left images were taken during oil immersion under a white incident light, while the two right images show same view but taken under ultraviolet (UV) light with a ×50 objective. All samples were organic-rich pyritic shale with abundant matrix bituminite and solid bitumen (a,c) and green fluorescing unicellular alginate macerals (shown with white arrows) within the matrix (b,d). P1 and P2 represent the two populations of bitumen with their distinct reflectance values.

Figure 4.
Pore throat size distribution data from MICP.

Figure 5.
(a) The N2 Adsorption–desorption data (note that the dashed line is the desorption branch); (b) the computed specific surface area.
Figure 5.
(a) The N2 Adsorption–desorption data (note that the dashed line is the desorption branch); (b) the computed specific surface area.

Figure 6.
Pore size distribution, as computed from the N2 desorption data using BJH method: (a) the pore throat size distribution; (b) the cumulative pore throat size distribution. It should be noted that in the plot of dV/dlog(W), the derivative (y-axis value) was markedly expanded for larger pore sizes.

Figure 7.
(a) The quantitative mineralogy data from the XRD; (b) the semi-quantitative mineralogy data of the clay sized minerals.
Figure 7.
(a) The quantitative mineralogy data from the XRD; (b) the semi-quantitative mineralogy data of the clay sized minerals.

Figure 8.
The GC analysis of the hydrocarbon extracts from untreated samples.

Figure 9.
The relative distribution of (a) trimethylnaphthalenes, (b) tetramethylnaphthalenes, and (c) their correlation: TMNr, (1,3,7-trimethylnaphthalene)/(1,3,7 + 1,2,5 -trimethylnaphthalene); TeMNr, 1,3,6,7-tetramethylnaphthalene/(1,3,6,7 + 1,2,5,6 + 1,2,3,5 –tetramethylnaphthalene).
Figure 9.
The relative distribution of (a) trimethylnaphthalenes, (b) tetramethylnaphthalenes, and (c) their correlation: TMNr, (1,3,7-trimethylnaphthalene)/(1,3,7 + 1,2,5 -trimethylnaphthalene); TeMNr, 1,3,6,7-tetramethylnaphthalene/(1,3,6,7 + 1,2,5,6 + 1,2,3,5 –tetramethylnaphthalene).

Figure 10.
(a) The cumulative recovery factors of the shale samples over the 24-h period; (b) the incremental recovery factors of the shale samples over the 24-h period.
Figure 10.
(a) The cumulative recovery factors of the shale samples over the 24-h period; (b) the incremental recovery factors of the shale samples over the 24-h period.

Figure 11.
The recovery factors of the individual hydrocarbon components, which were analyzed using GC over the 24-h period.
Figure 11.
The recovery factors of the individual hydrocarbon components, which were analyzed using GC over the 24-h period.


Figure 12.
A comparison of the cumulative recovery factor profiles vs. the predicted profiles using Equation (1).
Figure 12.
A comparison of the cumulative recovery factor profiles vs. the predicted profiles using Equation (1).


Table 1.
The programmed pyrolysis data.
| Measurement | Unit | S1-UB | S1-LB | S2-UB | S2-LB |
|---|---|---|---|---|---|
| Depth | m | 2321.9 | 2349.0 | 2091.4 | 2114.1 |
| S1 | mg HC/g rock | 10.6 | 4.6 | 8.4 | 9.0 |
| S2 | mg HC/g rock | 154.4 | 68.4 | 116.6 | 105.6 |
| TOC | wt.% | 25.6 | 11.7 | 18.6 | 18.8 |
| Tmax | °C | 435 | 435 | 433 | 431 |
| HI | mg HC/g TOC | 583 | 586 | 628 | 562 |
| OI | mg CO2/g of TOC | 1 | 2 | 2 | 3 |
| TS | wt.% | 3.6 | 1.5 | 6.3 | 5.0 |
| TOS | wt.% | 2.3 | 0.9 | 2.2 | 2.2 |
| Fe–S | wt.% | 1.1 | 0.5 | 3.4 | 2.4 |
| Sulfate–S | wt.% | 0.3 | 0.1 | 0.7 | 0.4 |
| S1 | PySorg×1000/TOC | 24 | 23 | 30 | 26 |
| mean BRo (%) | P1 | 0.3 ± 0.3; 92 | 0.29 ± 0.05; 40 | 0.27 ± 0.05; 64 | 0.28 ± 0.03; 64 |
| P2 | 0.5 ± 0.05; 41 | 0.28 ± 0.06; 23 | 0.46 ± 0.05; 40 | 0.51 ± 0.06; 36 |
Publisher’s Note: MDPI stays neutral with regard to jurisdictional claims in published maps and institutional affiliations. |
© 2022 by the authors. Licensee MDPI, Basel, Switzerland. This article is an open access article distributed under the terms and conditions of the Creative Commons Attribution (CC BY) license (https://creativecommons.org/licenses/by/4.0/).
Share and Cite
MDPI and ACS Style
Bizhani, M.; Ardakani, O.H.; Hawthorne, S.B.; Cesar, J.; Kurz, B.; Percival, J.B. CO2-Enhanced Oil Recovery Mechanism in Canadian Bakken Shale. Minerals 2022, 12, 779. https://0-doi-org.brum.beds.ac.uk/10.3390/min12060779
AMA Style
Bizhani M, Ardakani OH, Hawthorne SB, Cesar J, Kurz B, Percival JB. CO2-Enhanced Oil Recovery Mechanism in Canadian Bakken Shale. Minerals. 2022; 12(6):779. https://0-doi-org.brum.beds.ac.uk/10.3390/min12060779
Chicago/Turabian StyleBizhani, Majid, Omid Haeri Ardakani, Steven B. Hawthorne, Jaime Cesar, Bethany Kurz, and Jeanne B. Percival. 2022. "CO2-Enhanced Oil Recovery Mechanism in Canadian Bakken Shale" Minerals 12, no. 6: 779. https://0-doi-org.brum.beds.ac.uk/10.3390/min12060779
Note that from the first issue of 2016, this journal uses article numbers instead of page numbers. See further details here.