
Lithostratigraphy, Origin, and Geodynamic Setting of Iron Formations and Host Rocks of the Anyouzok Region, Congo Craton, Southwestern Cameroon
 , , , ,
Abstract
:1. Introduction
2. Geological Setting
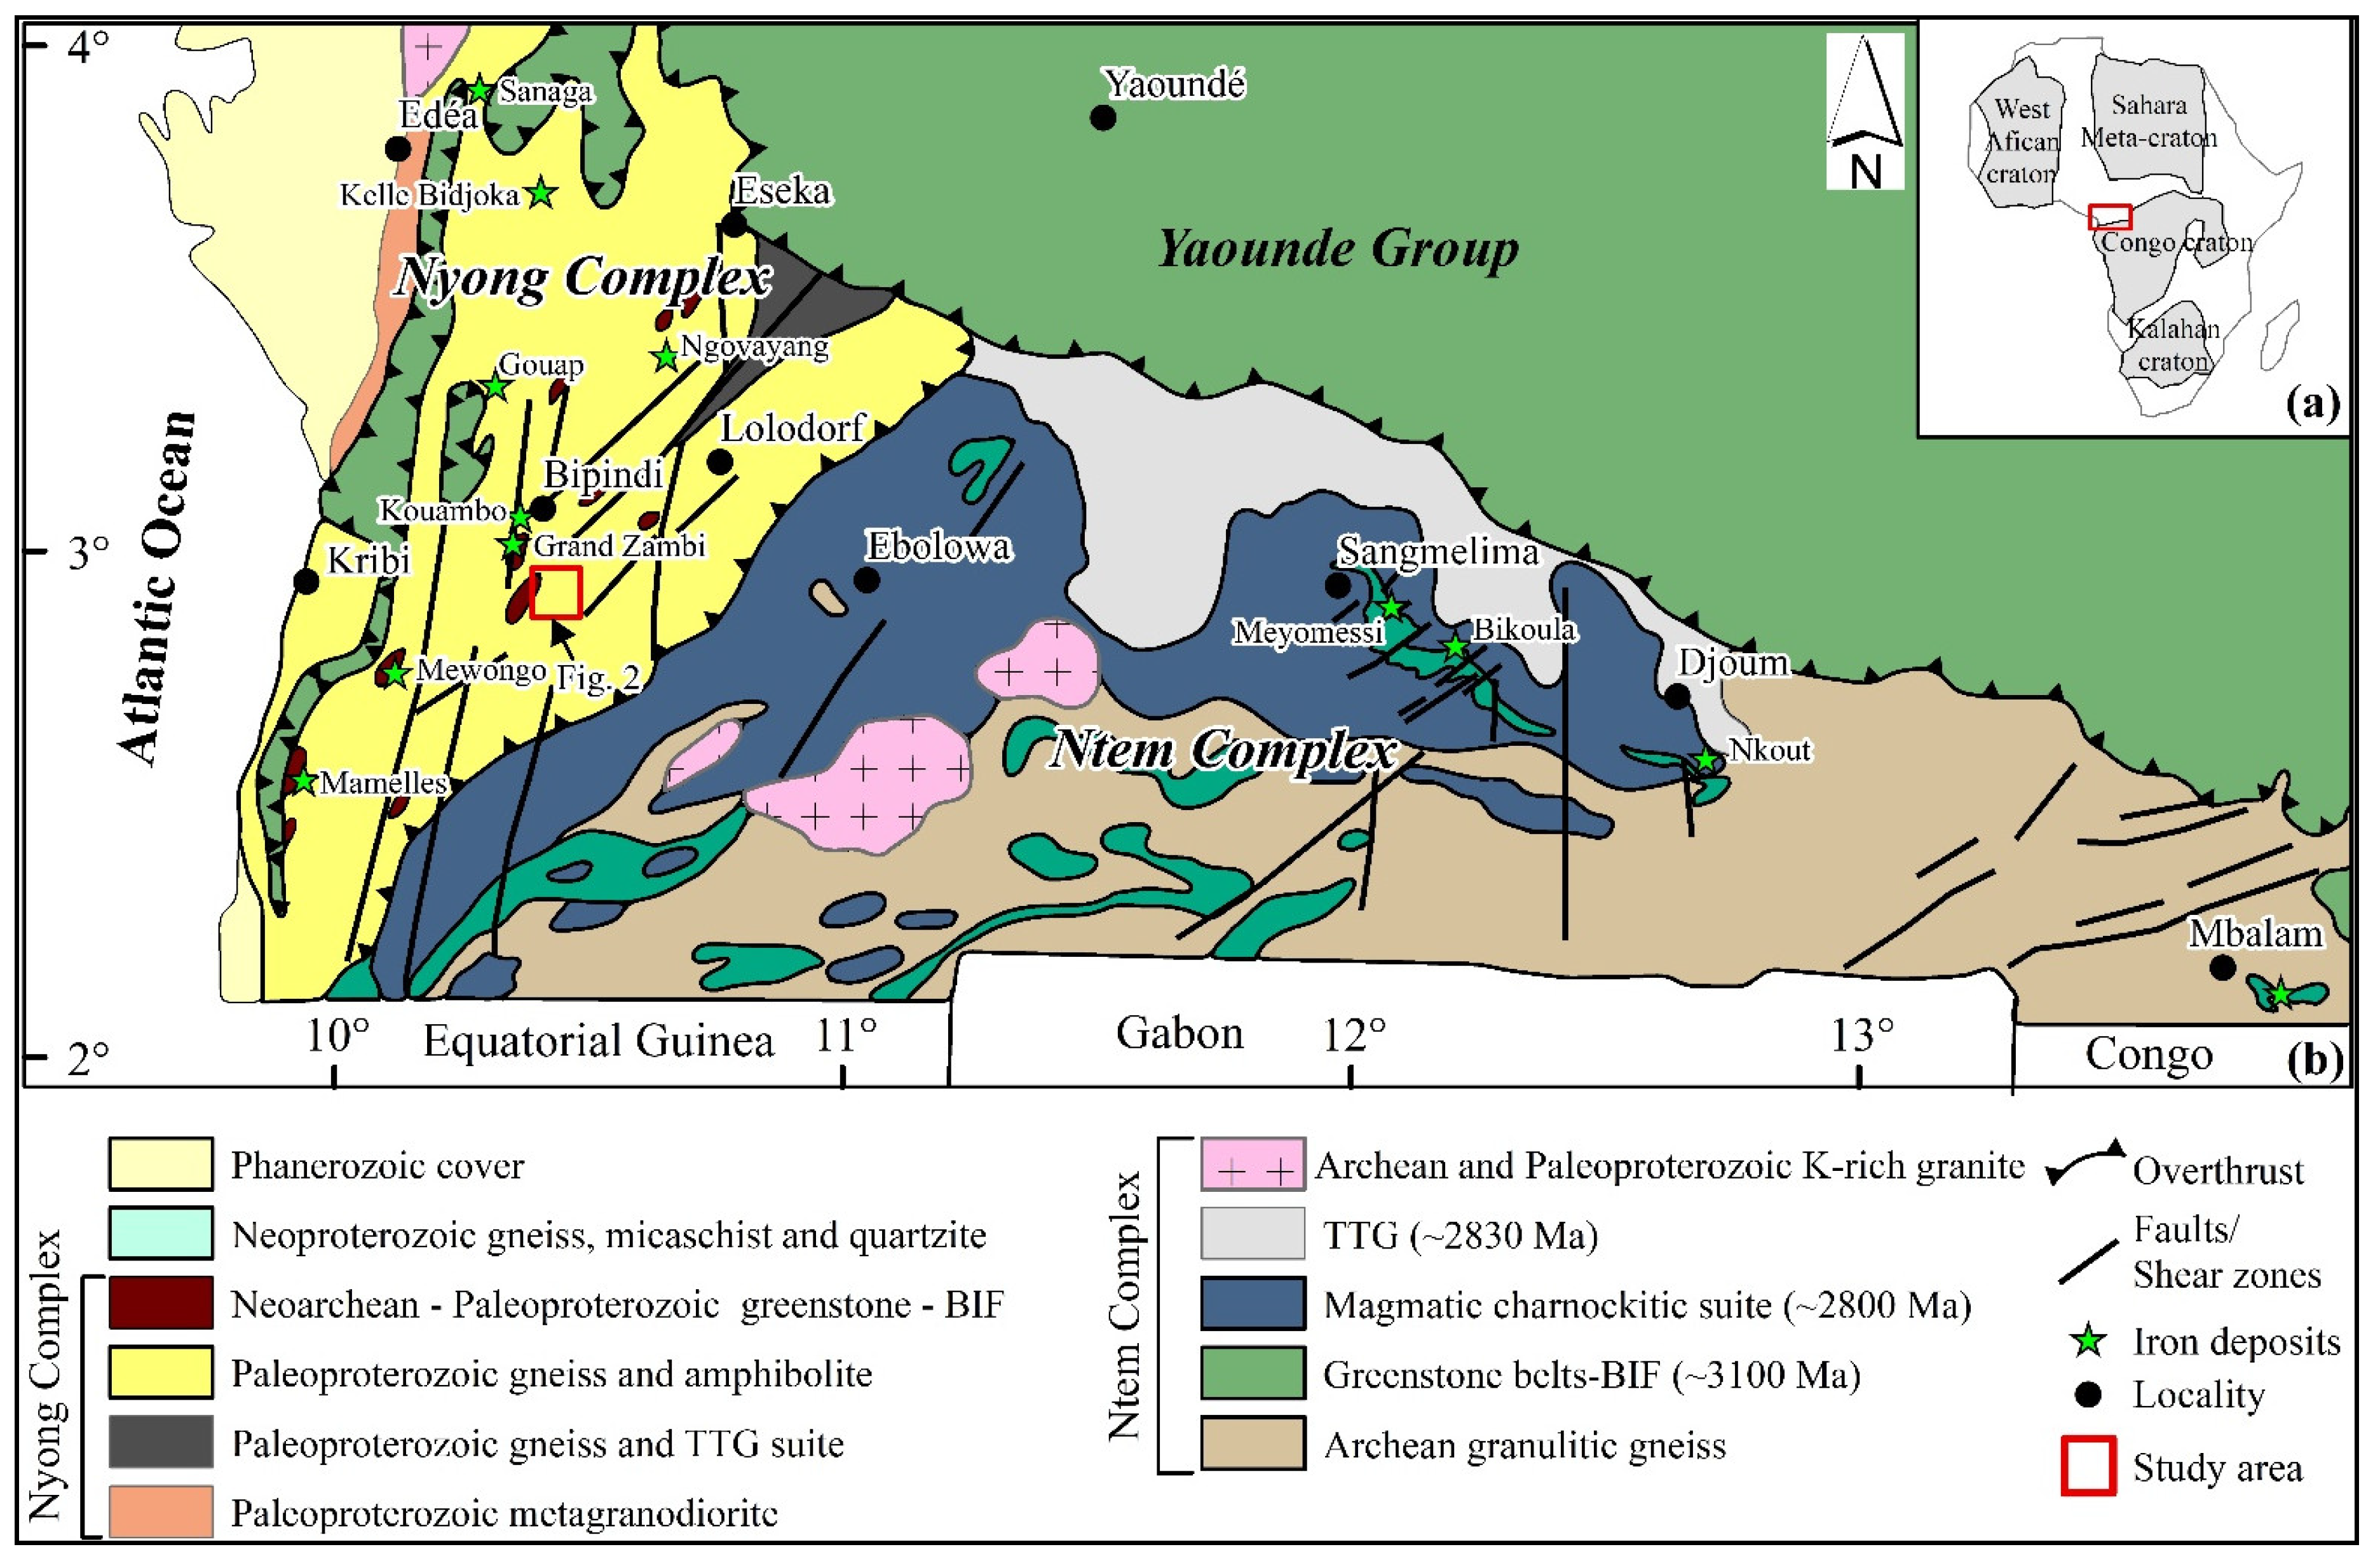
2.1. Regional Geology
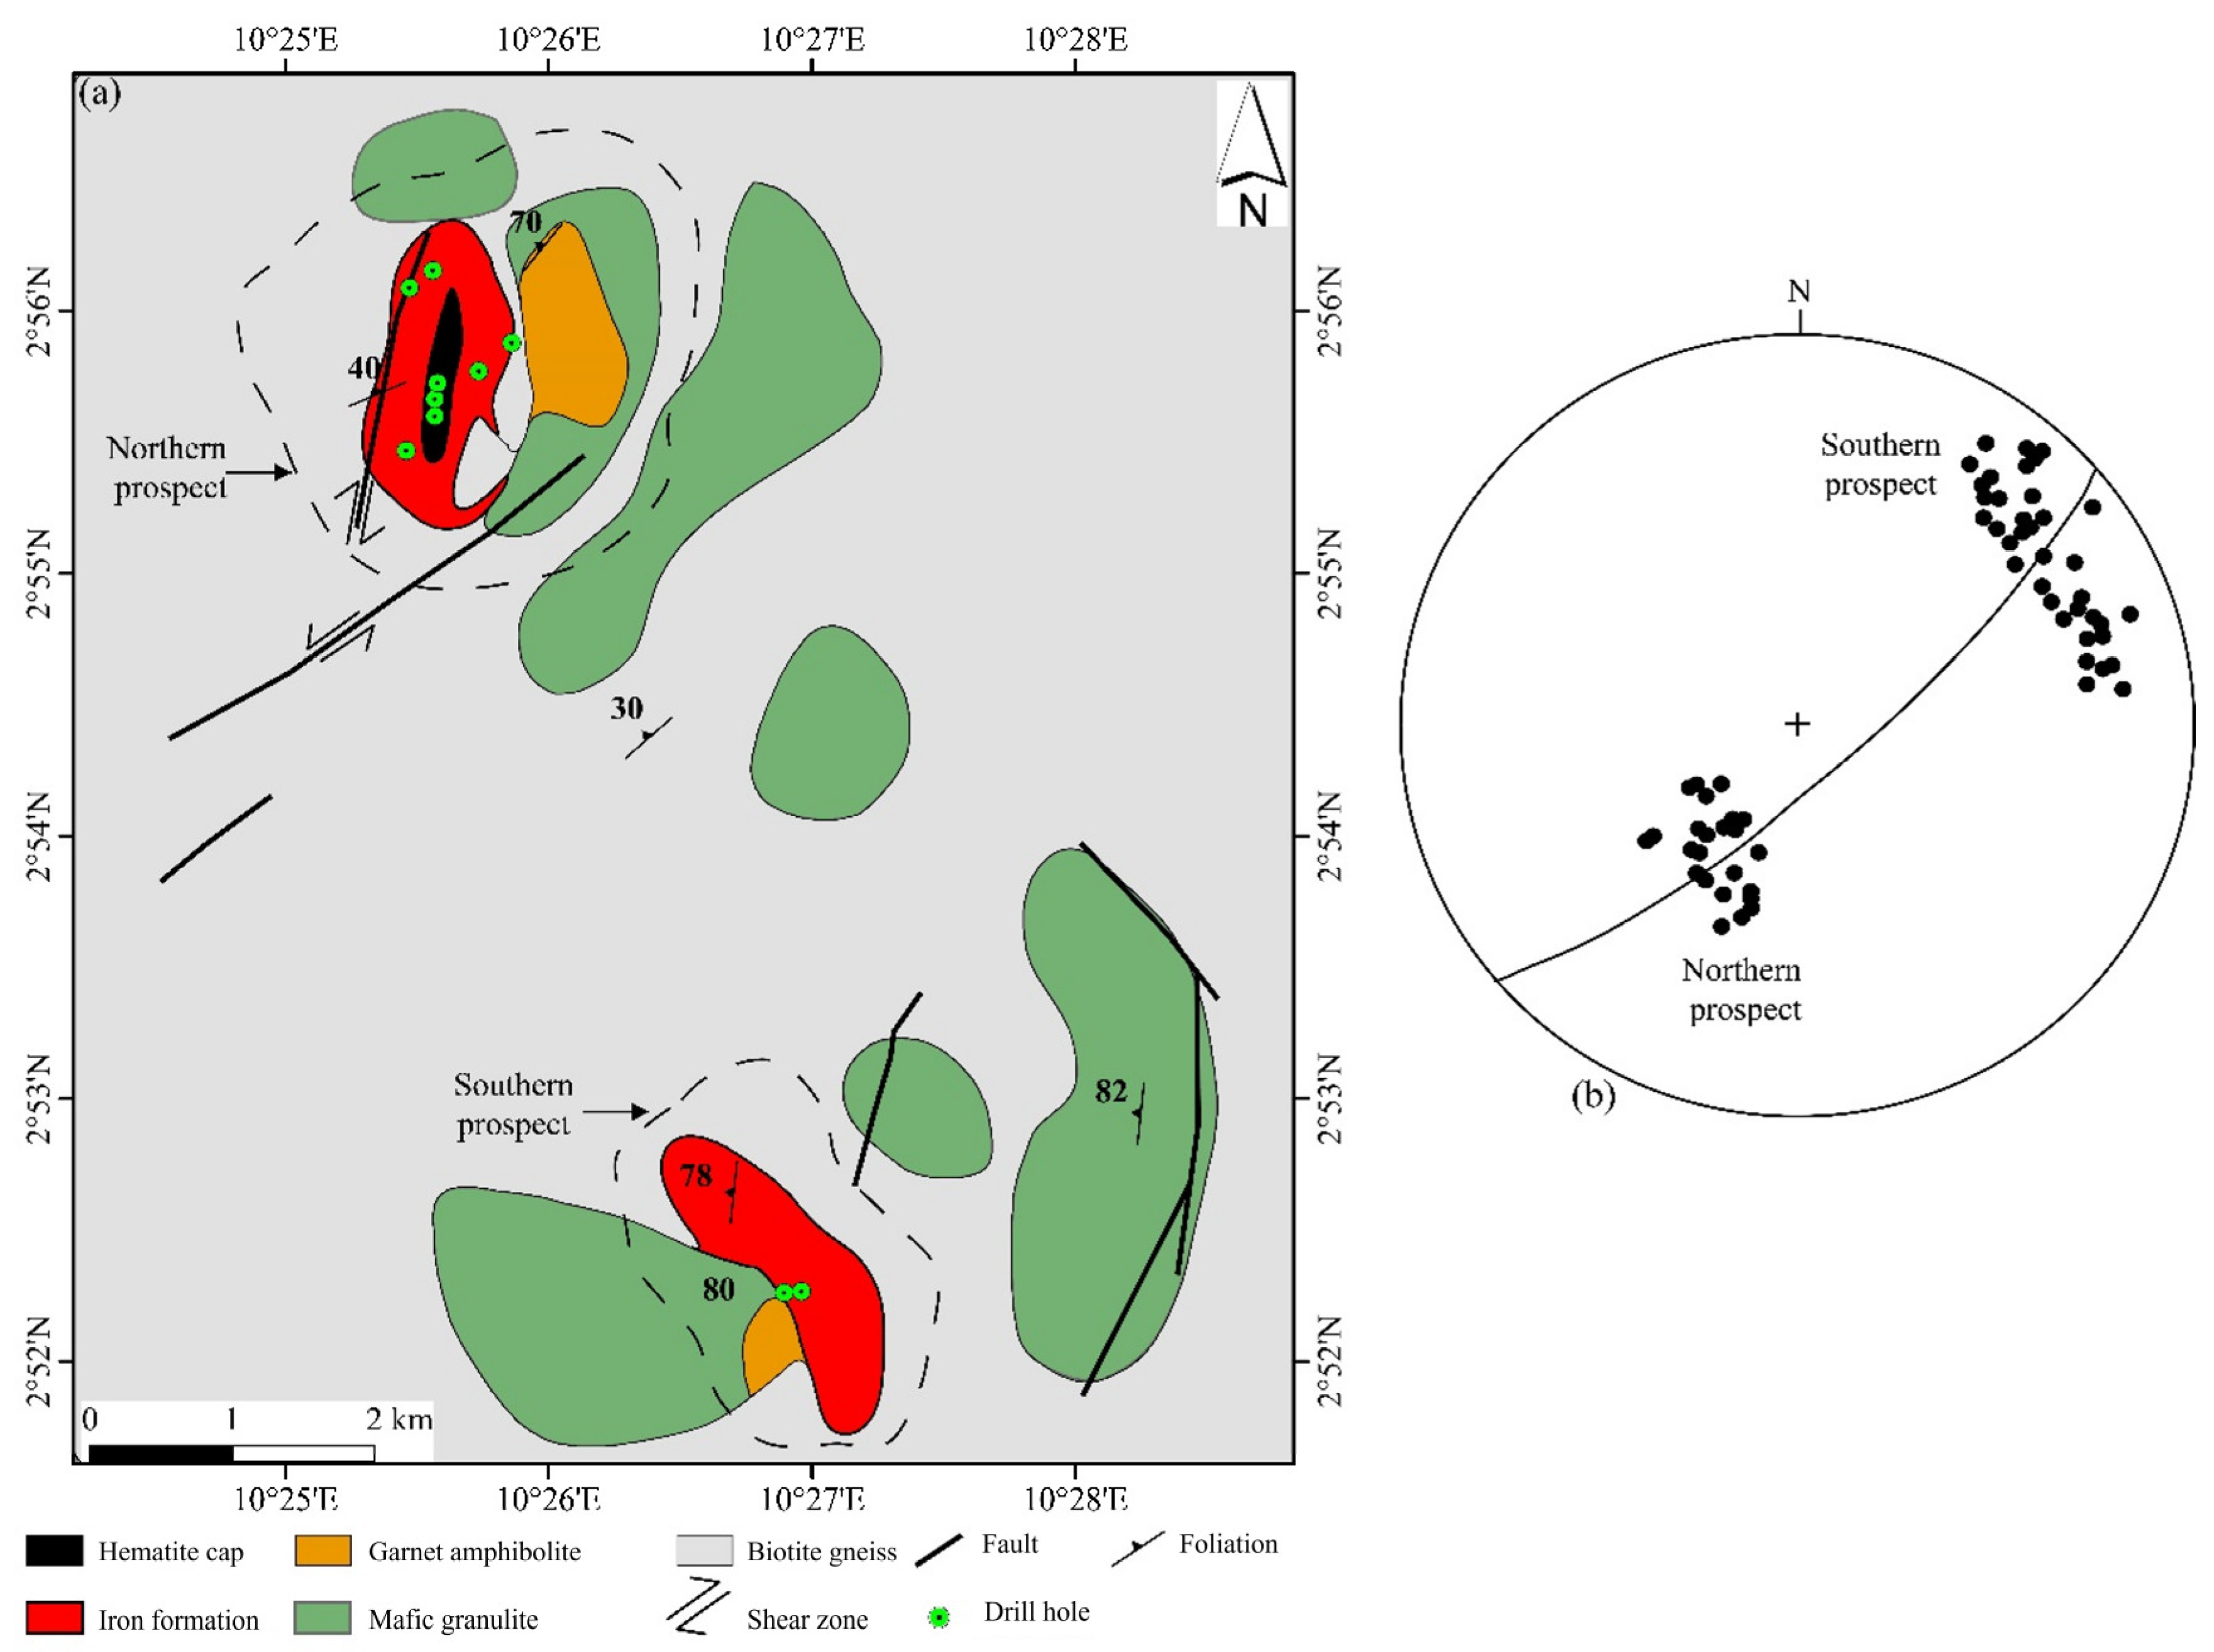
2.2. Anyouzok Deposit Geology
3. Lithostratigraphy of the Anyouzok Iron Ore Deposit
3.1. The Northern Prospect
- Iron formations unit
- Country rocks unit
3.2. The Southern Prospect
- Iron formation unit
- Country rocks unit
4. Sampling and Analytical Methods
5. Results
5.1. Petrography and Mineralogy
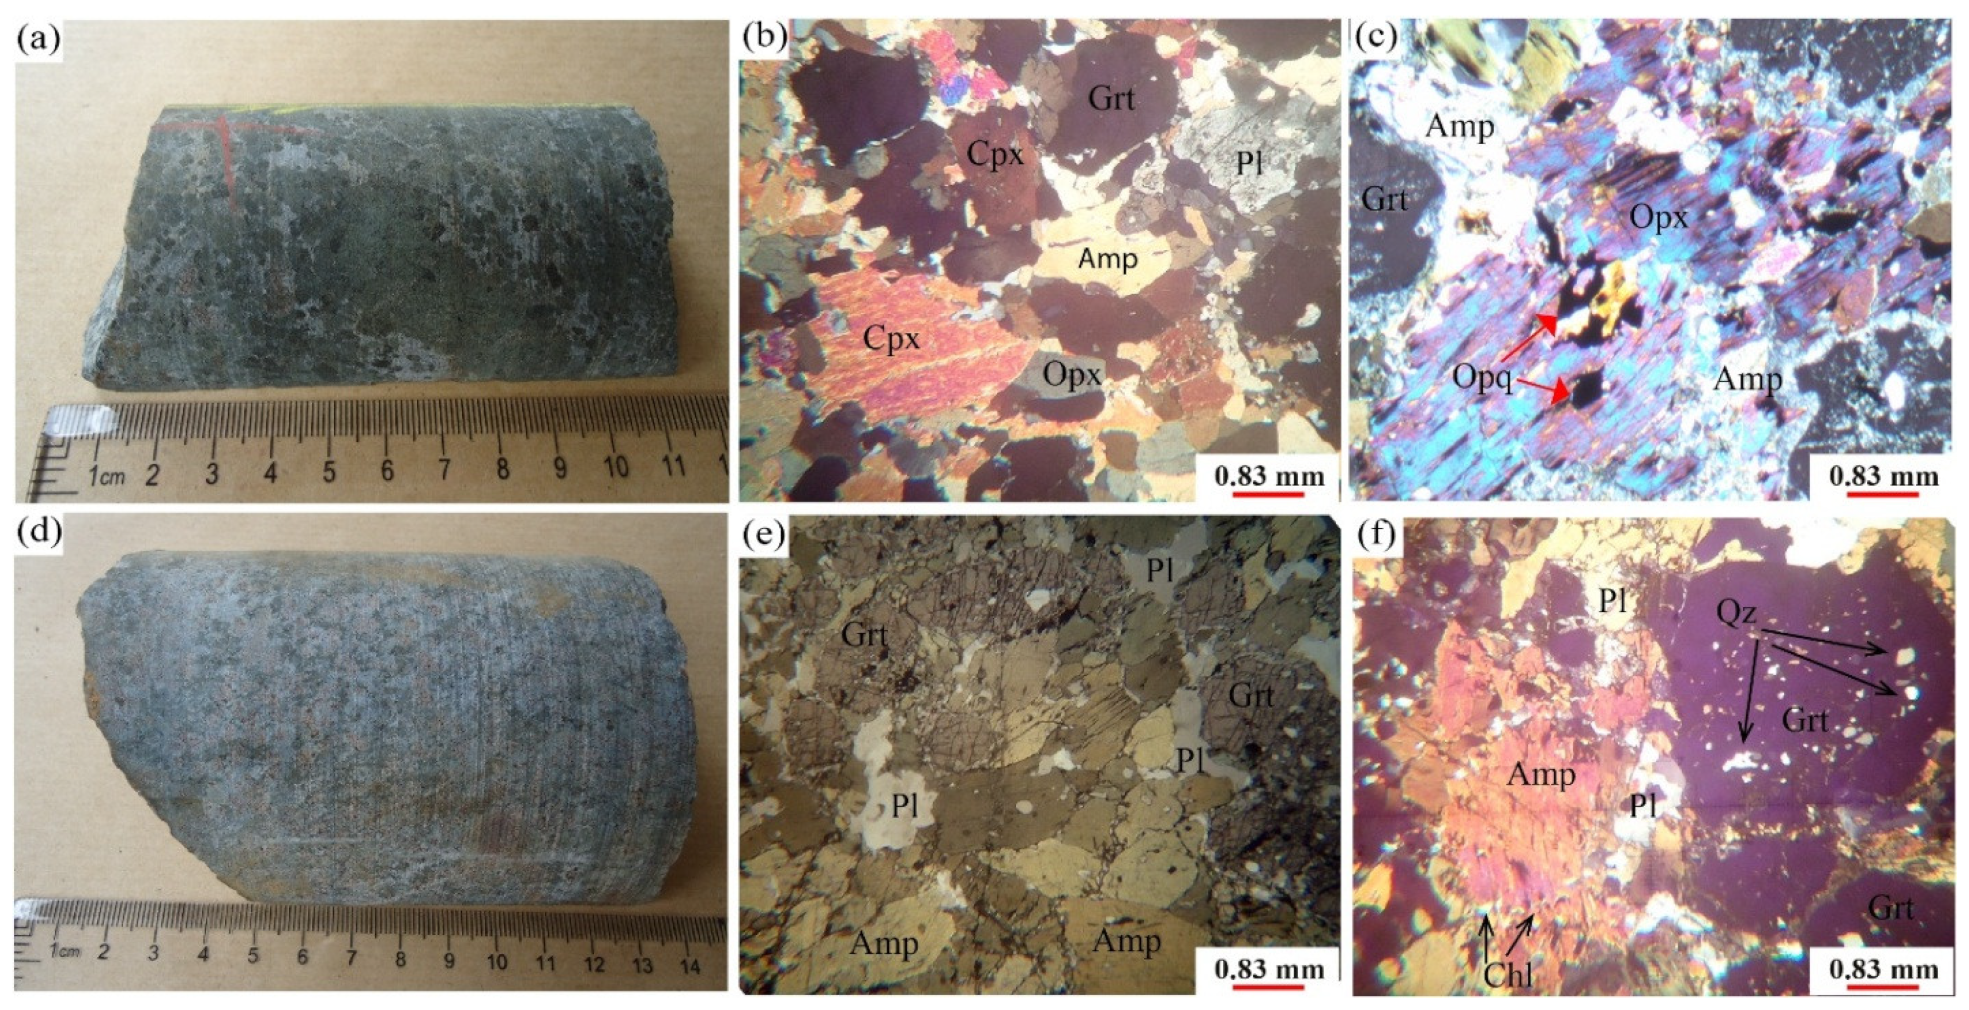
5.1.1. Metavolcanic Rocks
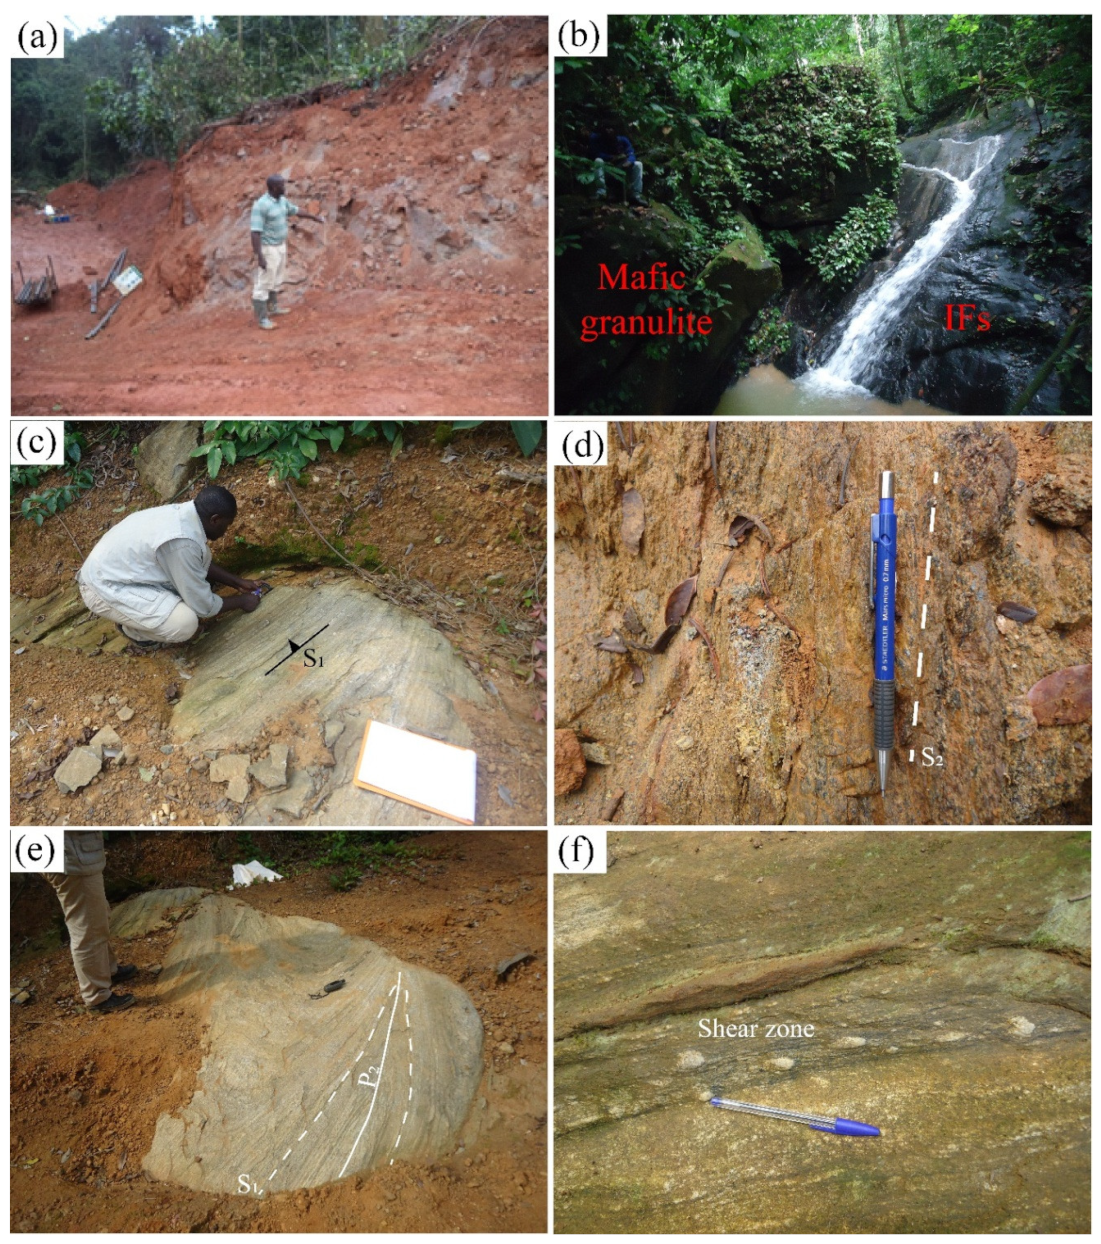
- Metavolcanic rocks appear as mafic granulite and garnet amphibolite.
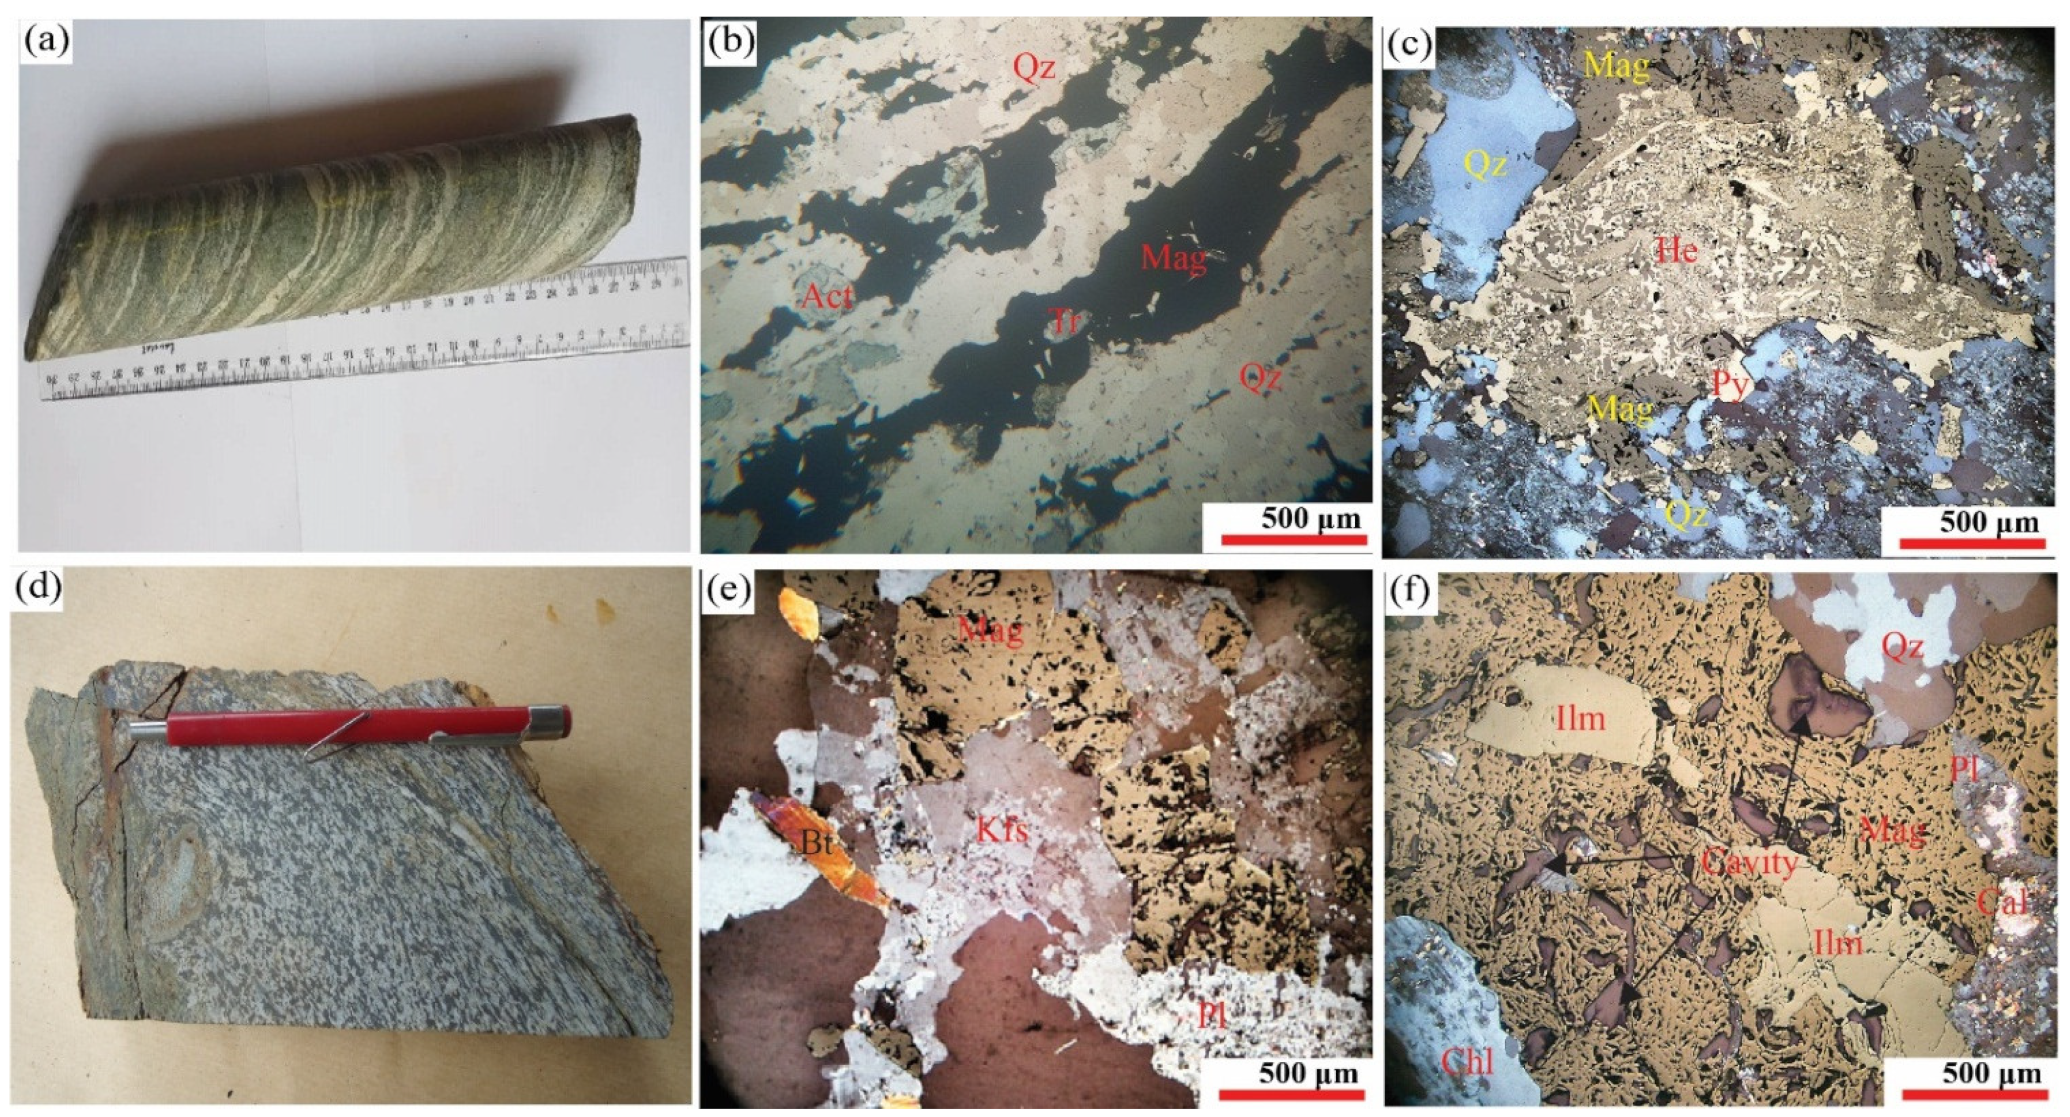
5.1.2. Iron Formations
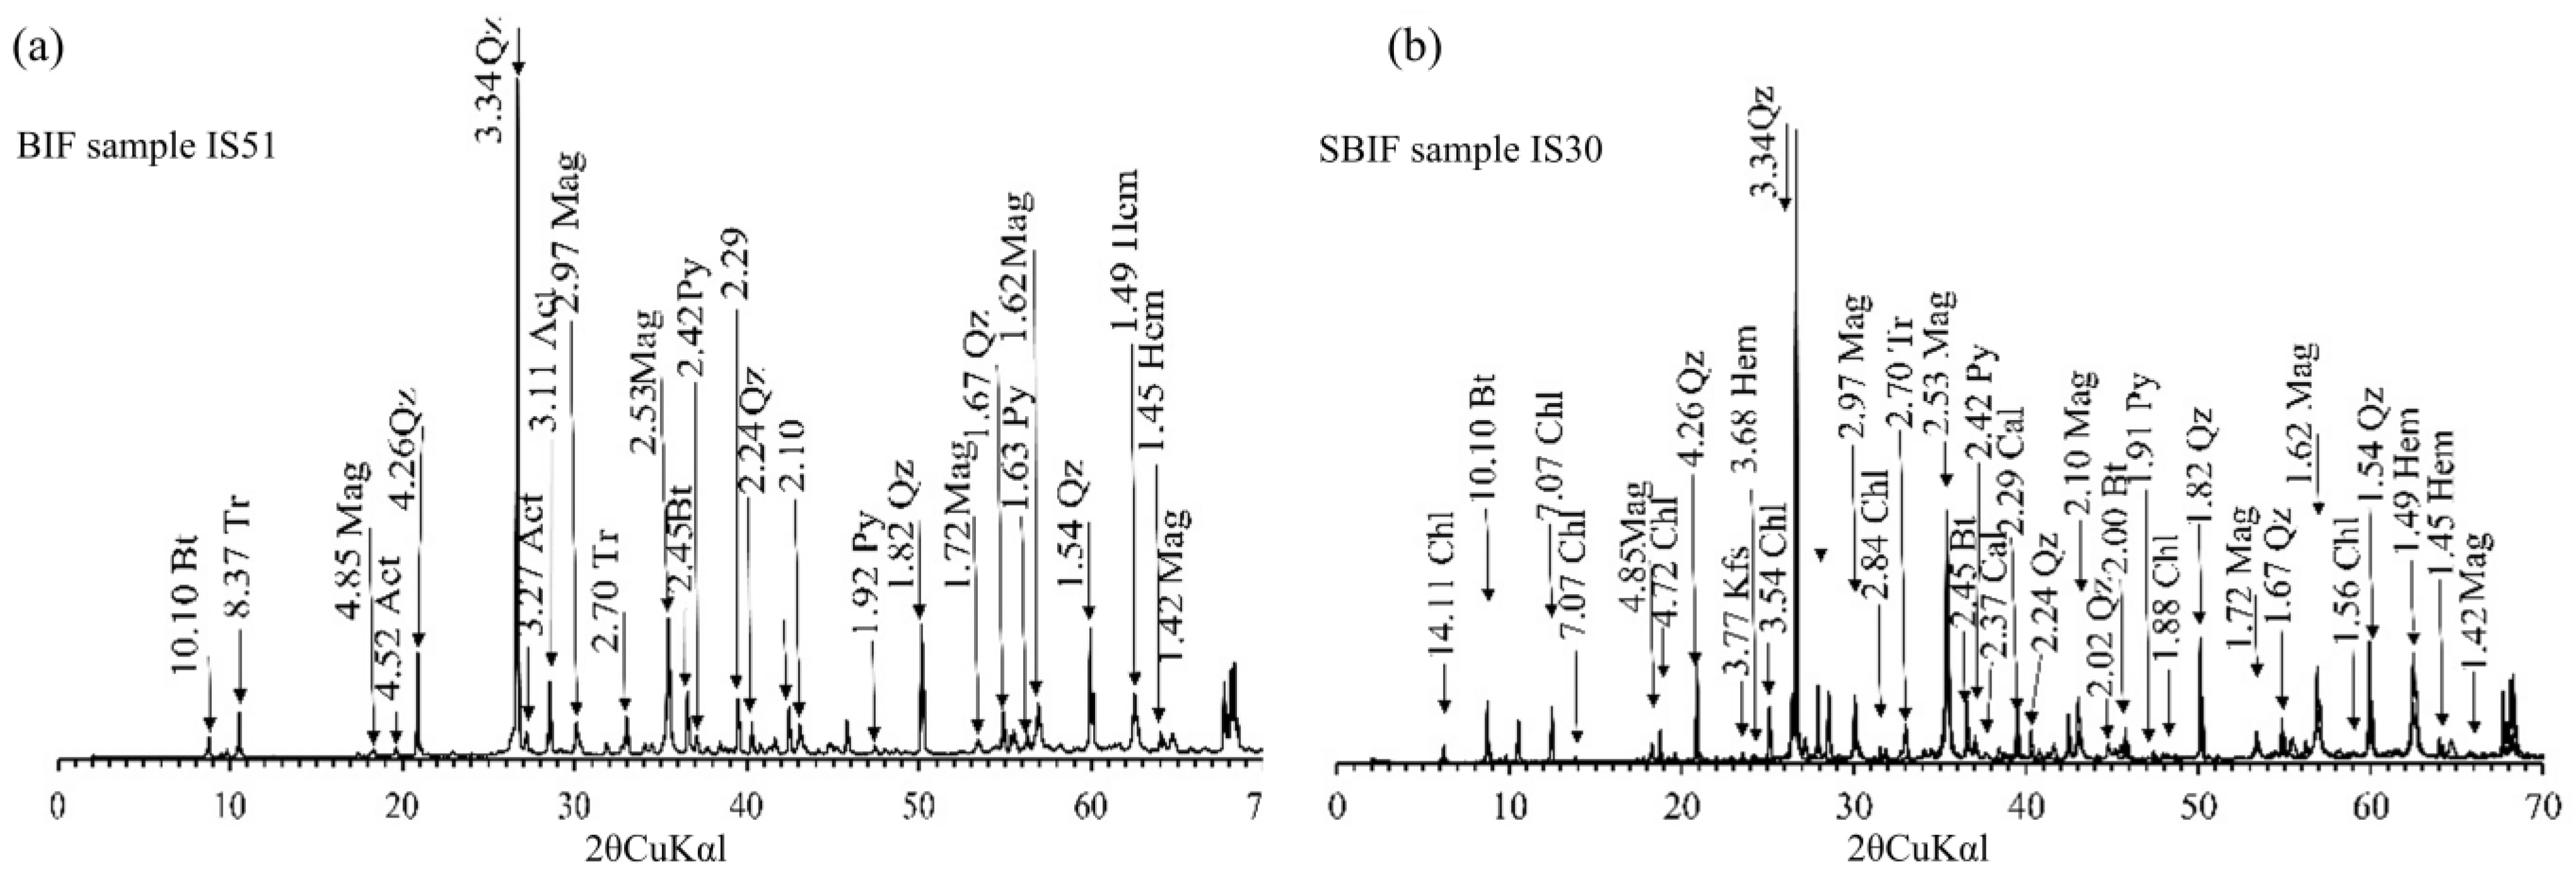
5.1.3. Mineralogy of IFs
5.2. Geochemistry
5.2.1. Metavolcanic Rocks
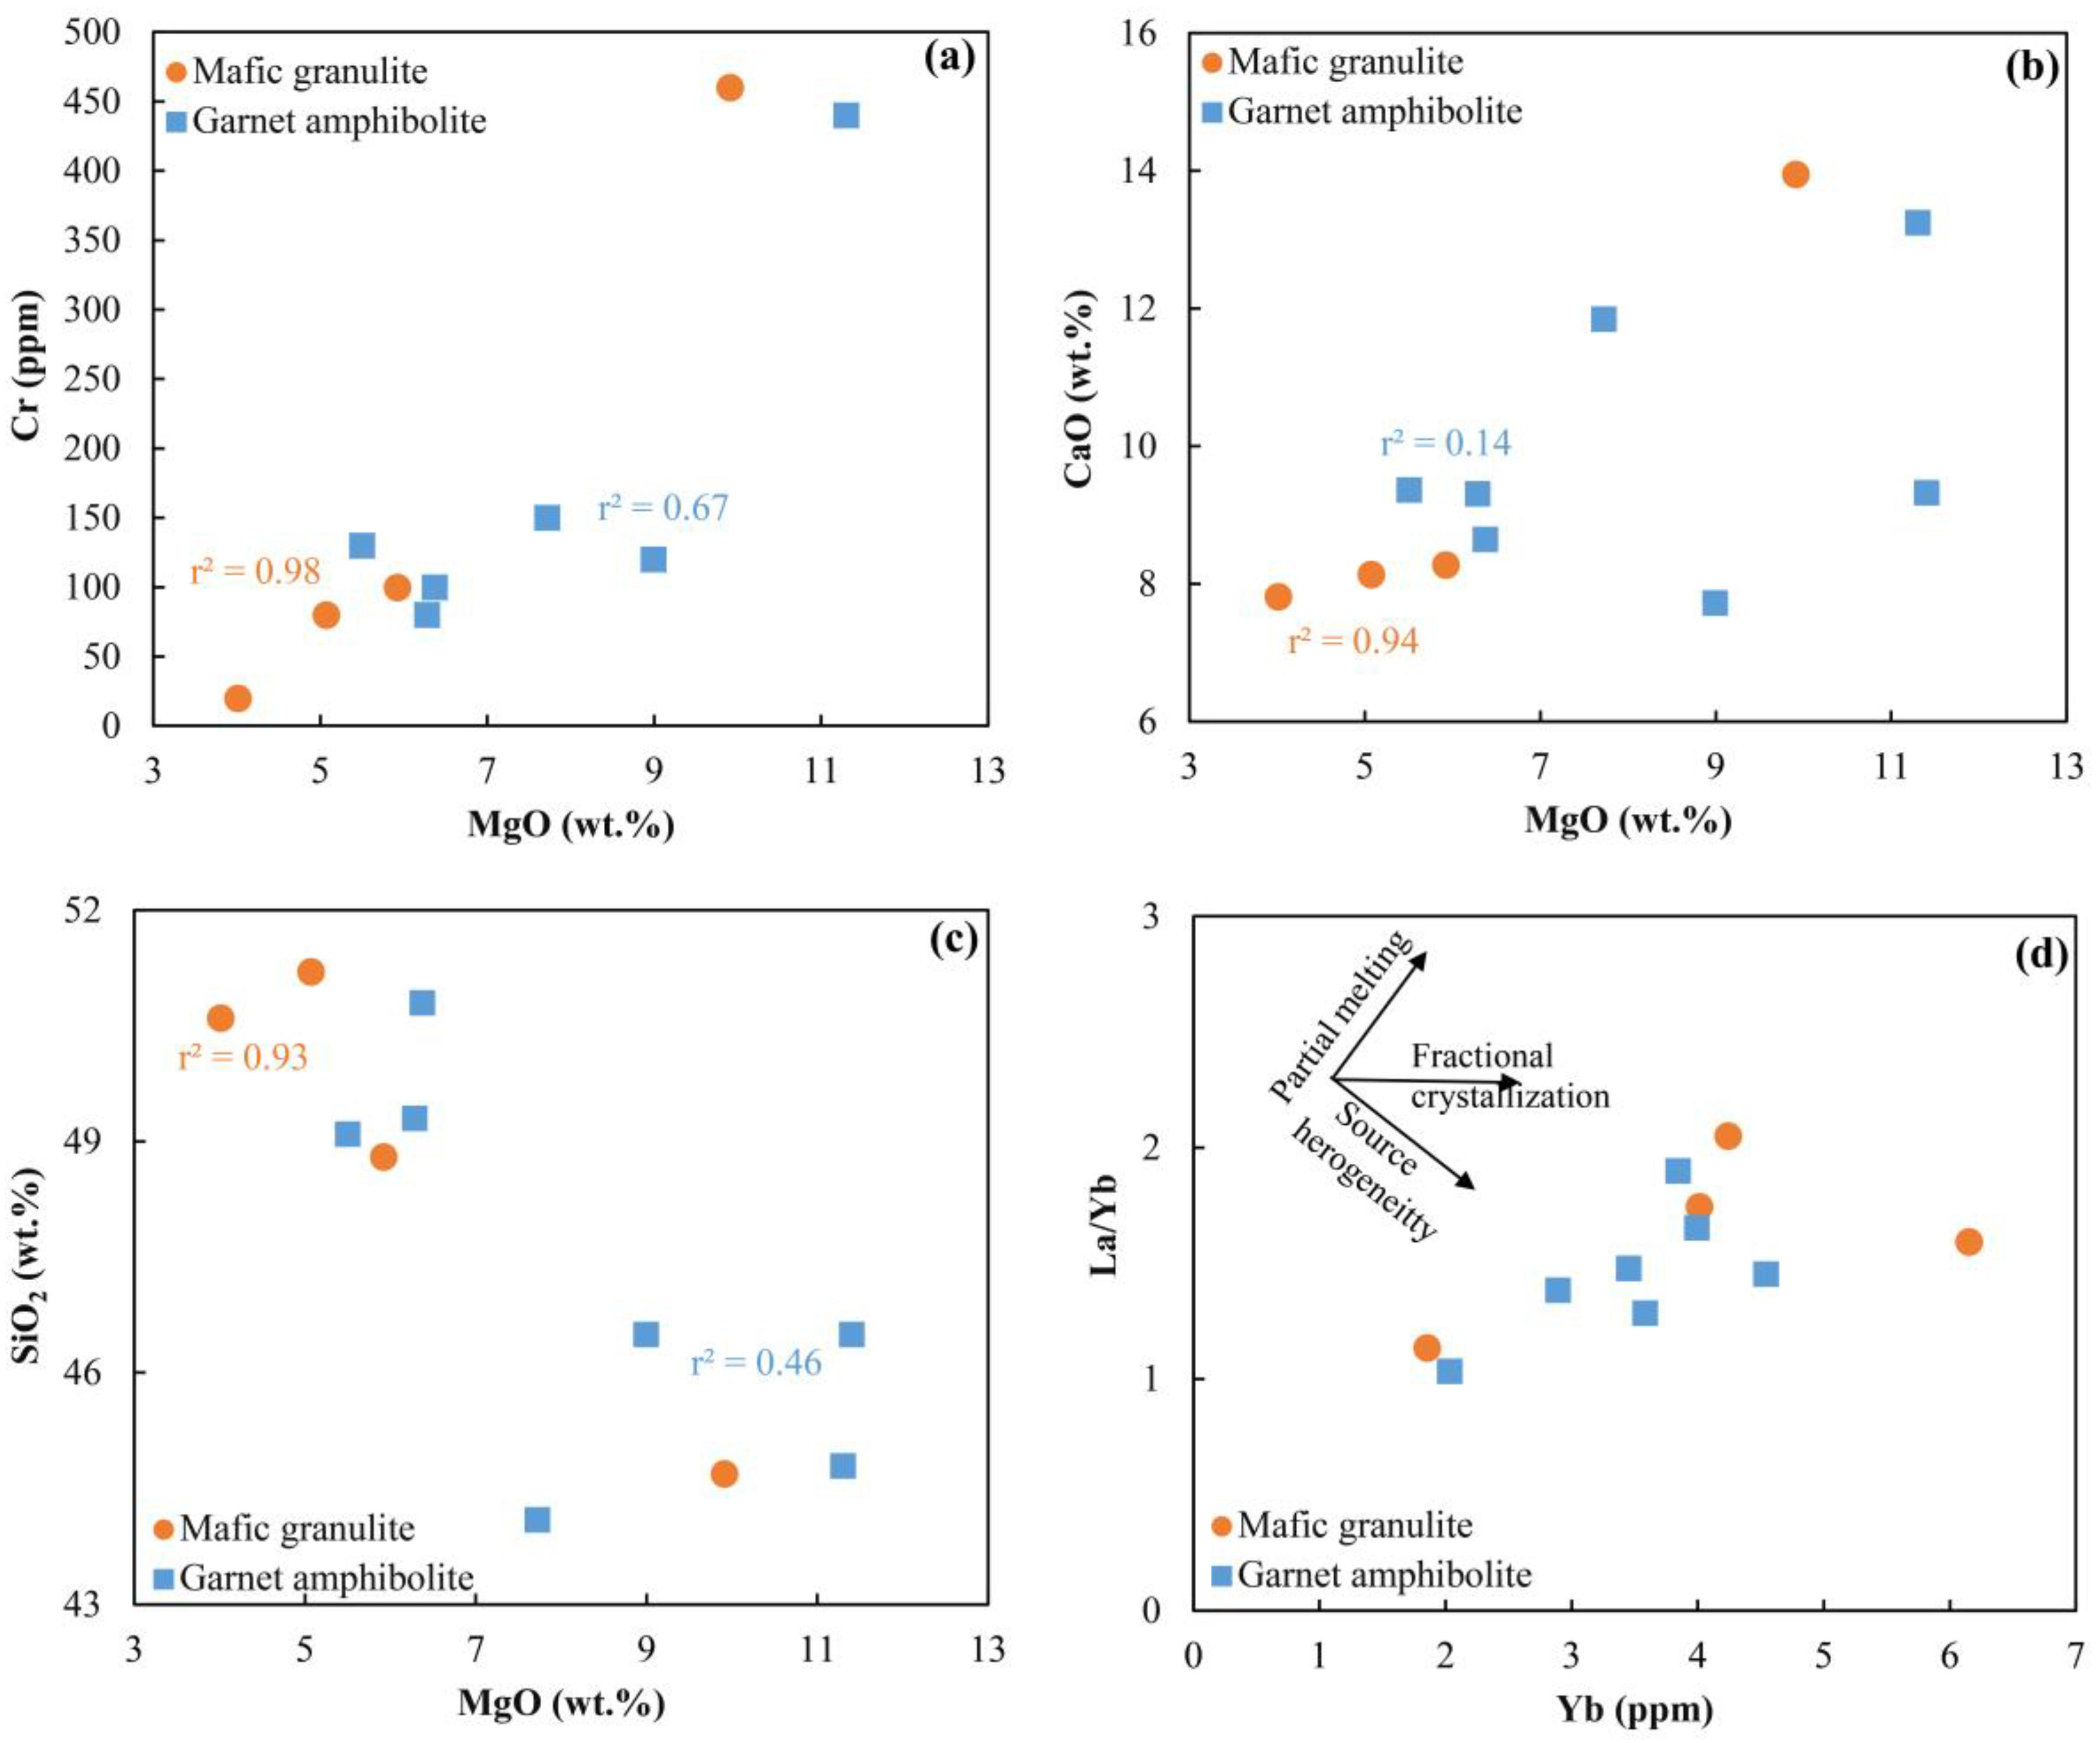
- Major elements
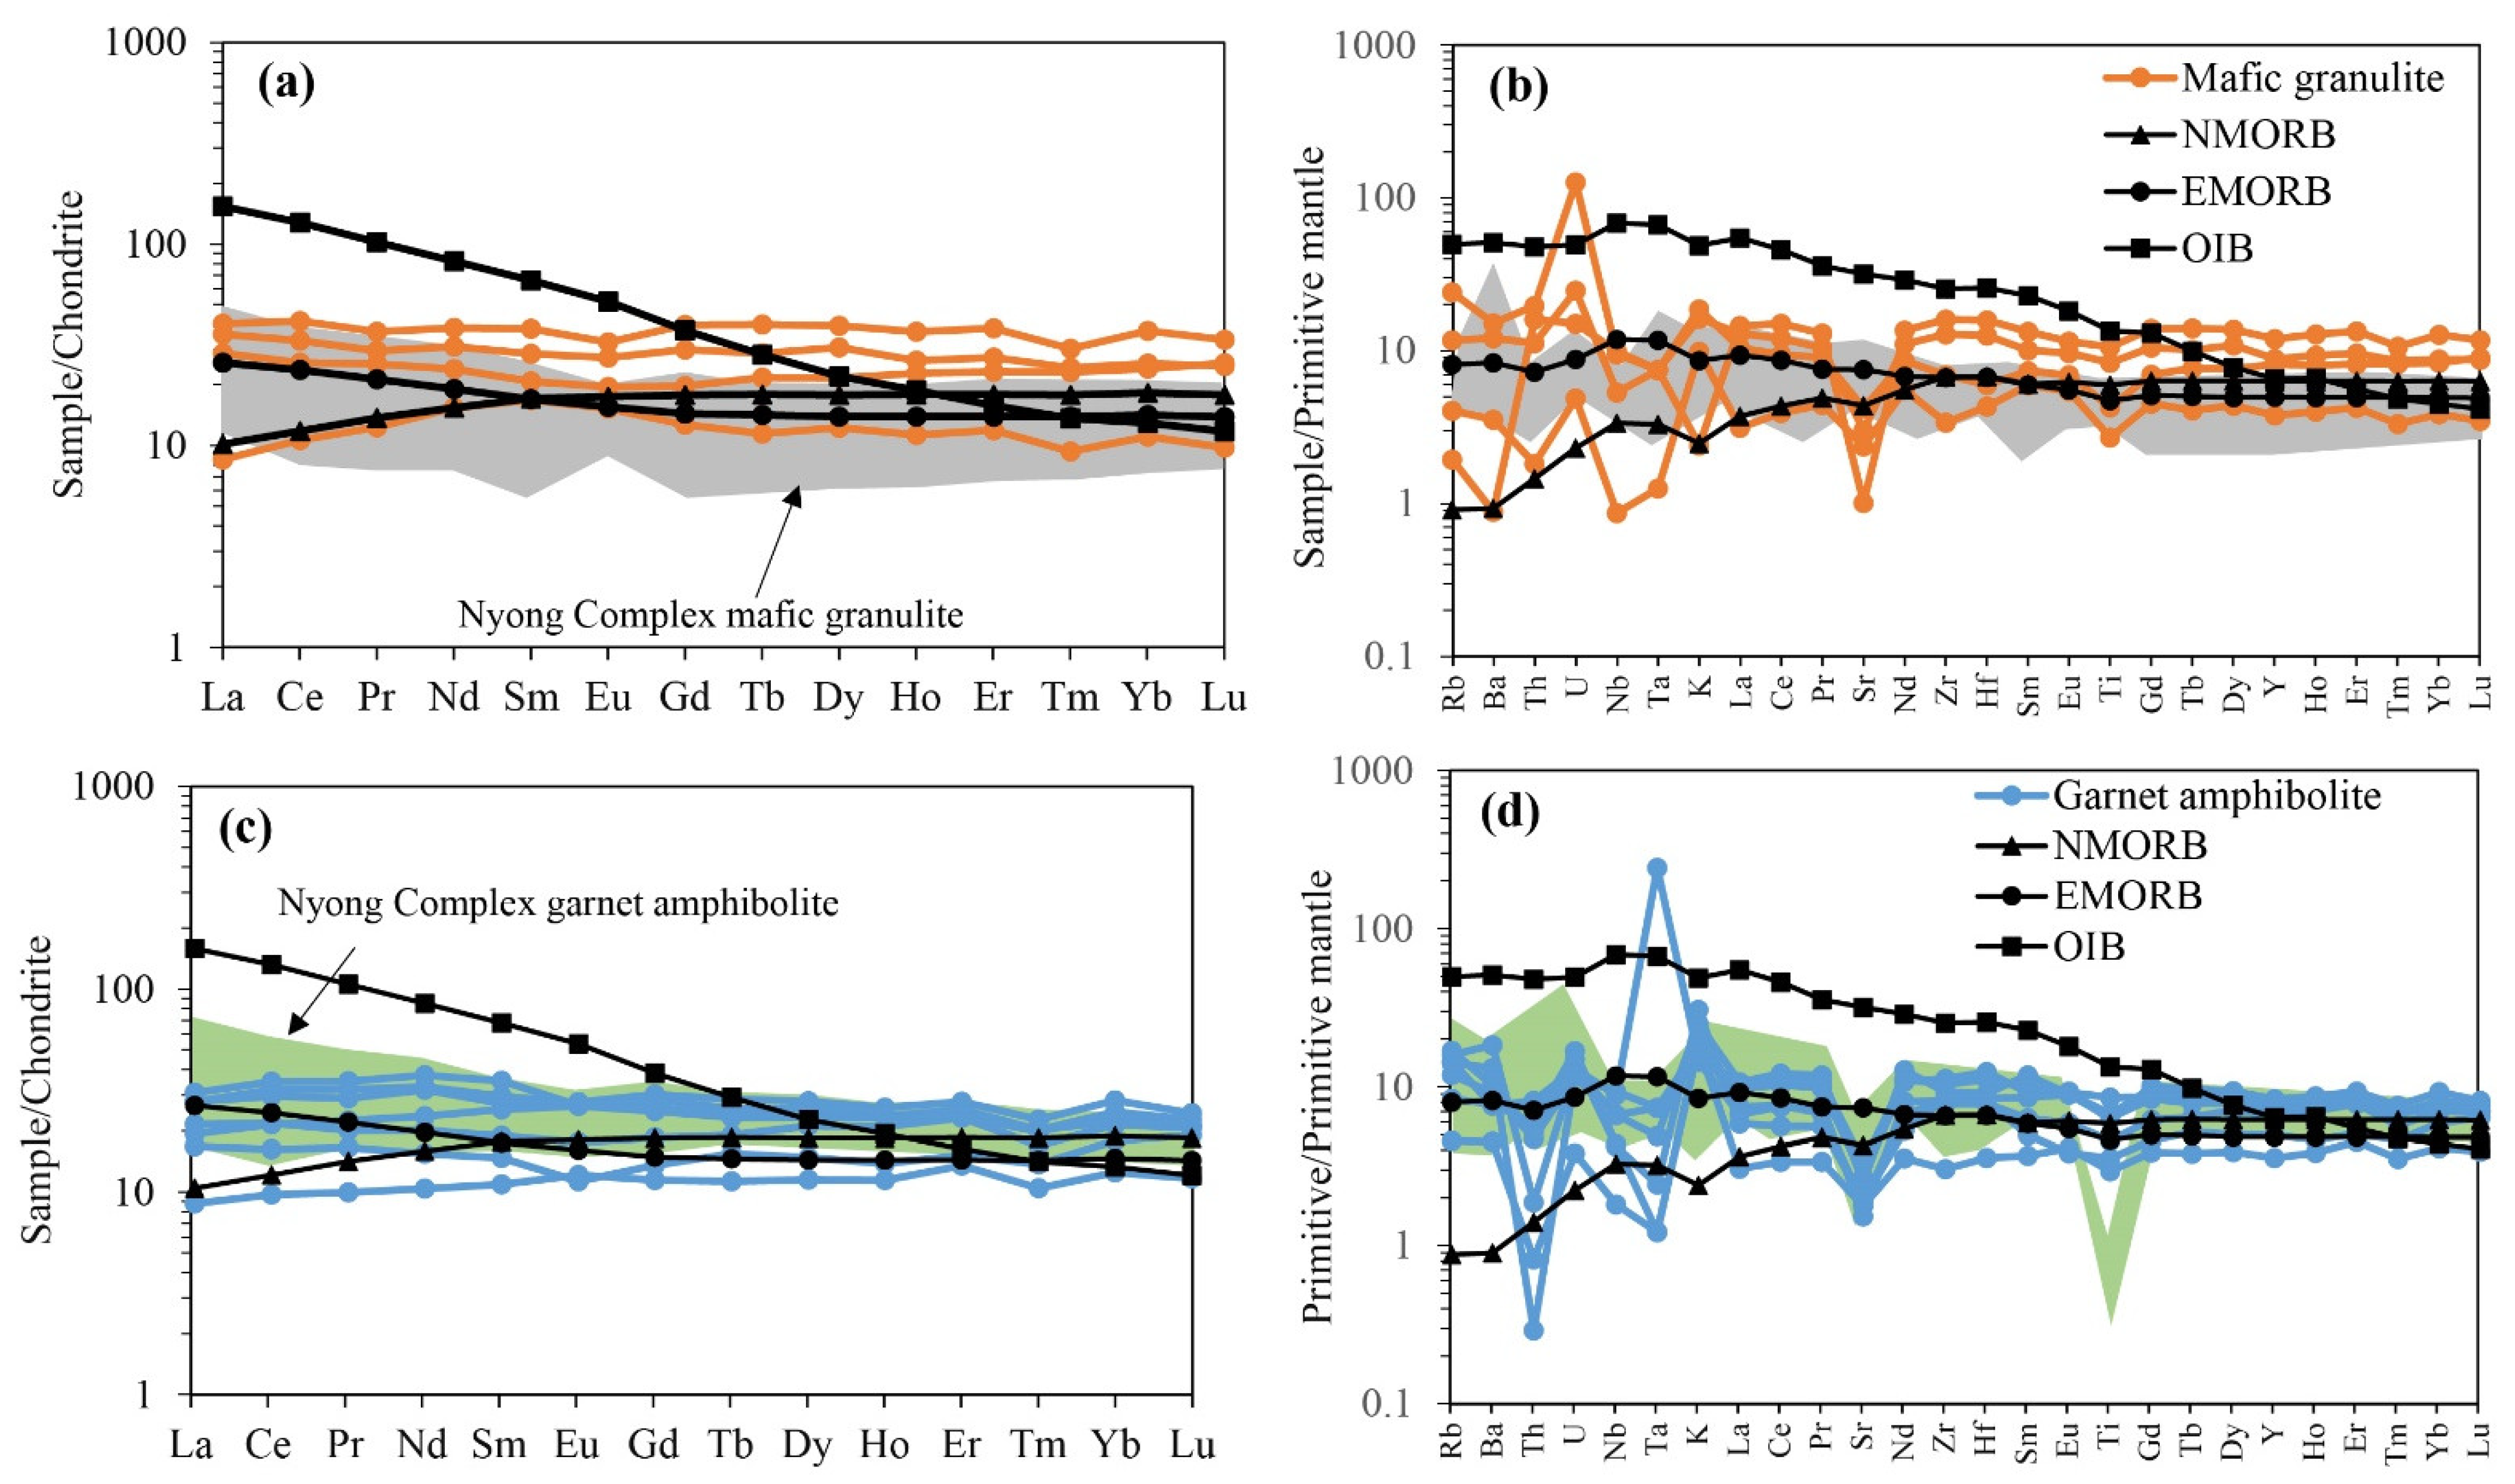
- Trace and rare earth elements (REE)
5.2.2. Iron Formations
- Major elements
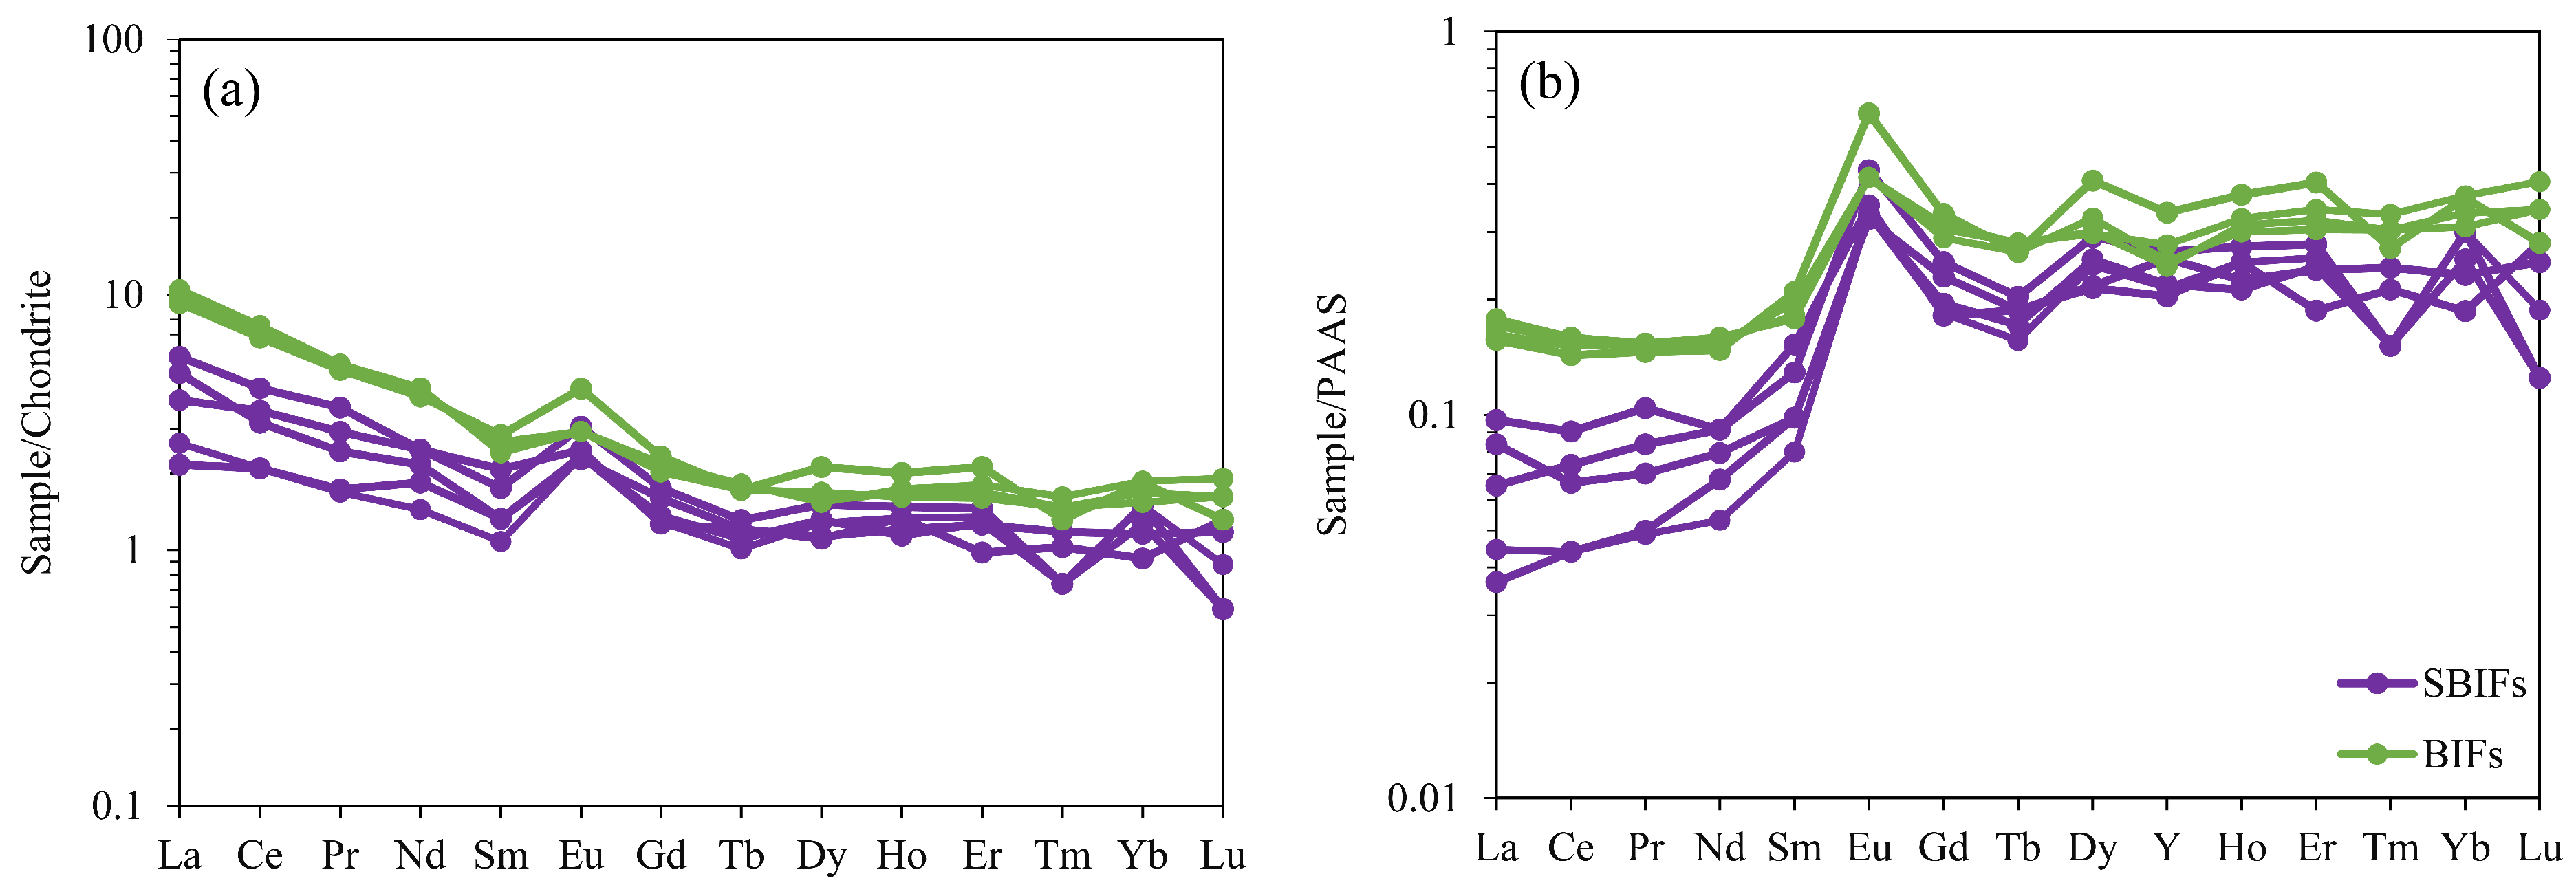
- Trace and rare earth elements
6. Discussion
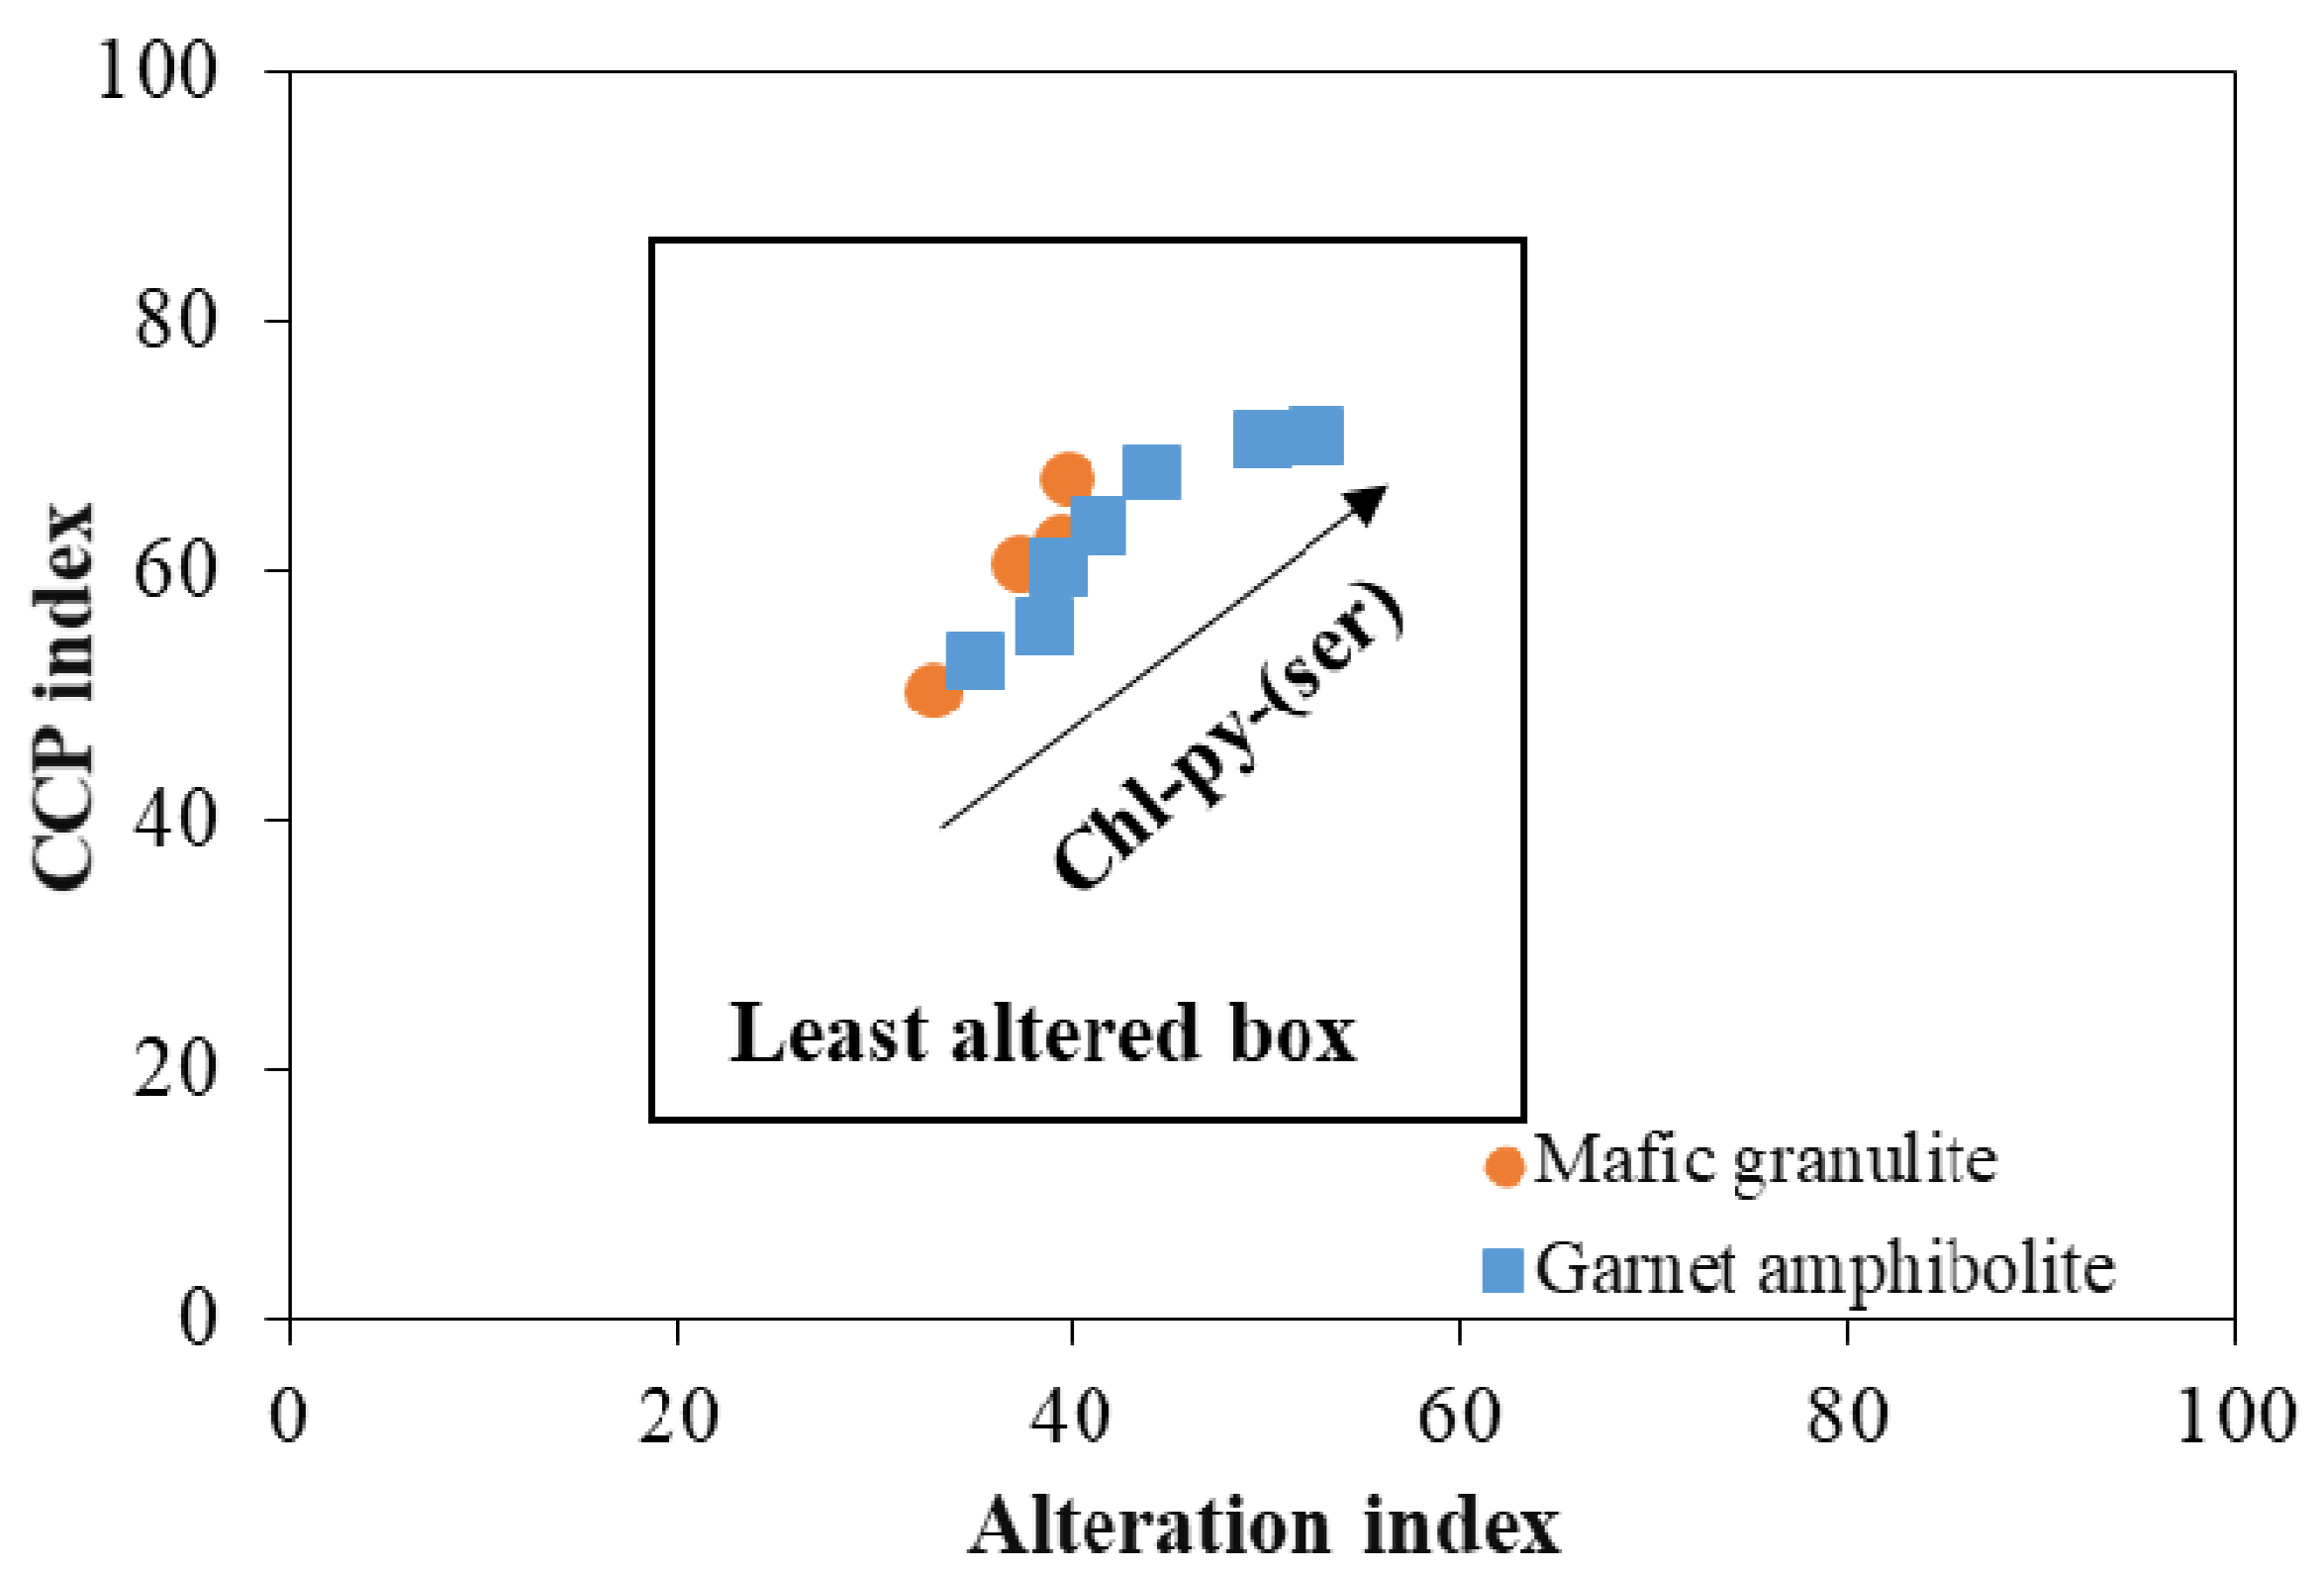
6.1. Alteration, Metamorphism, and Element Mobility Assessment
6.1.1. Effects on Metavolcanic Rocks
6.1.2. Effects on IFs
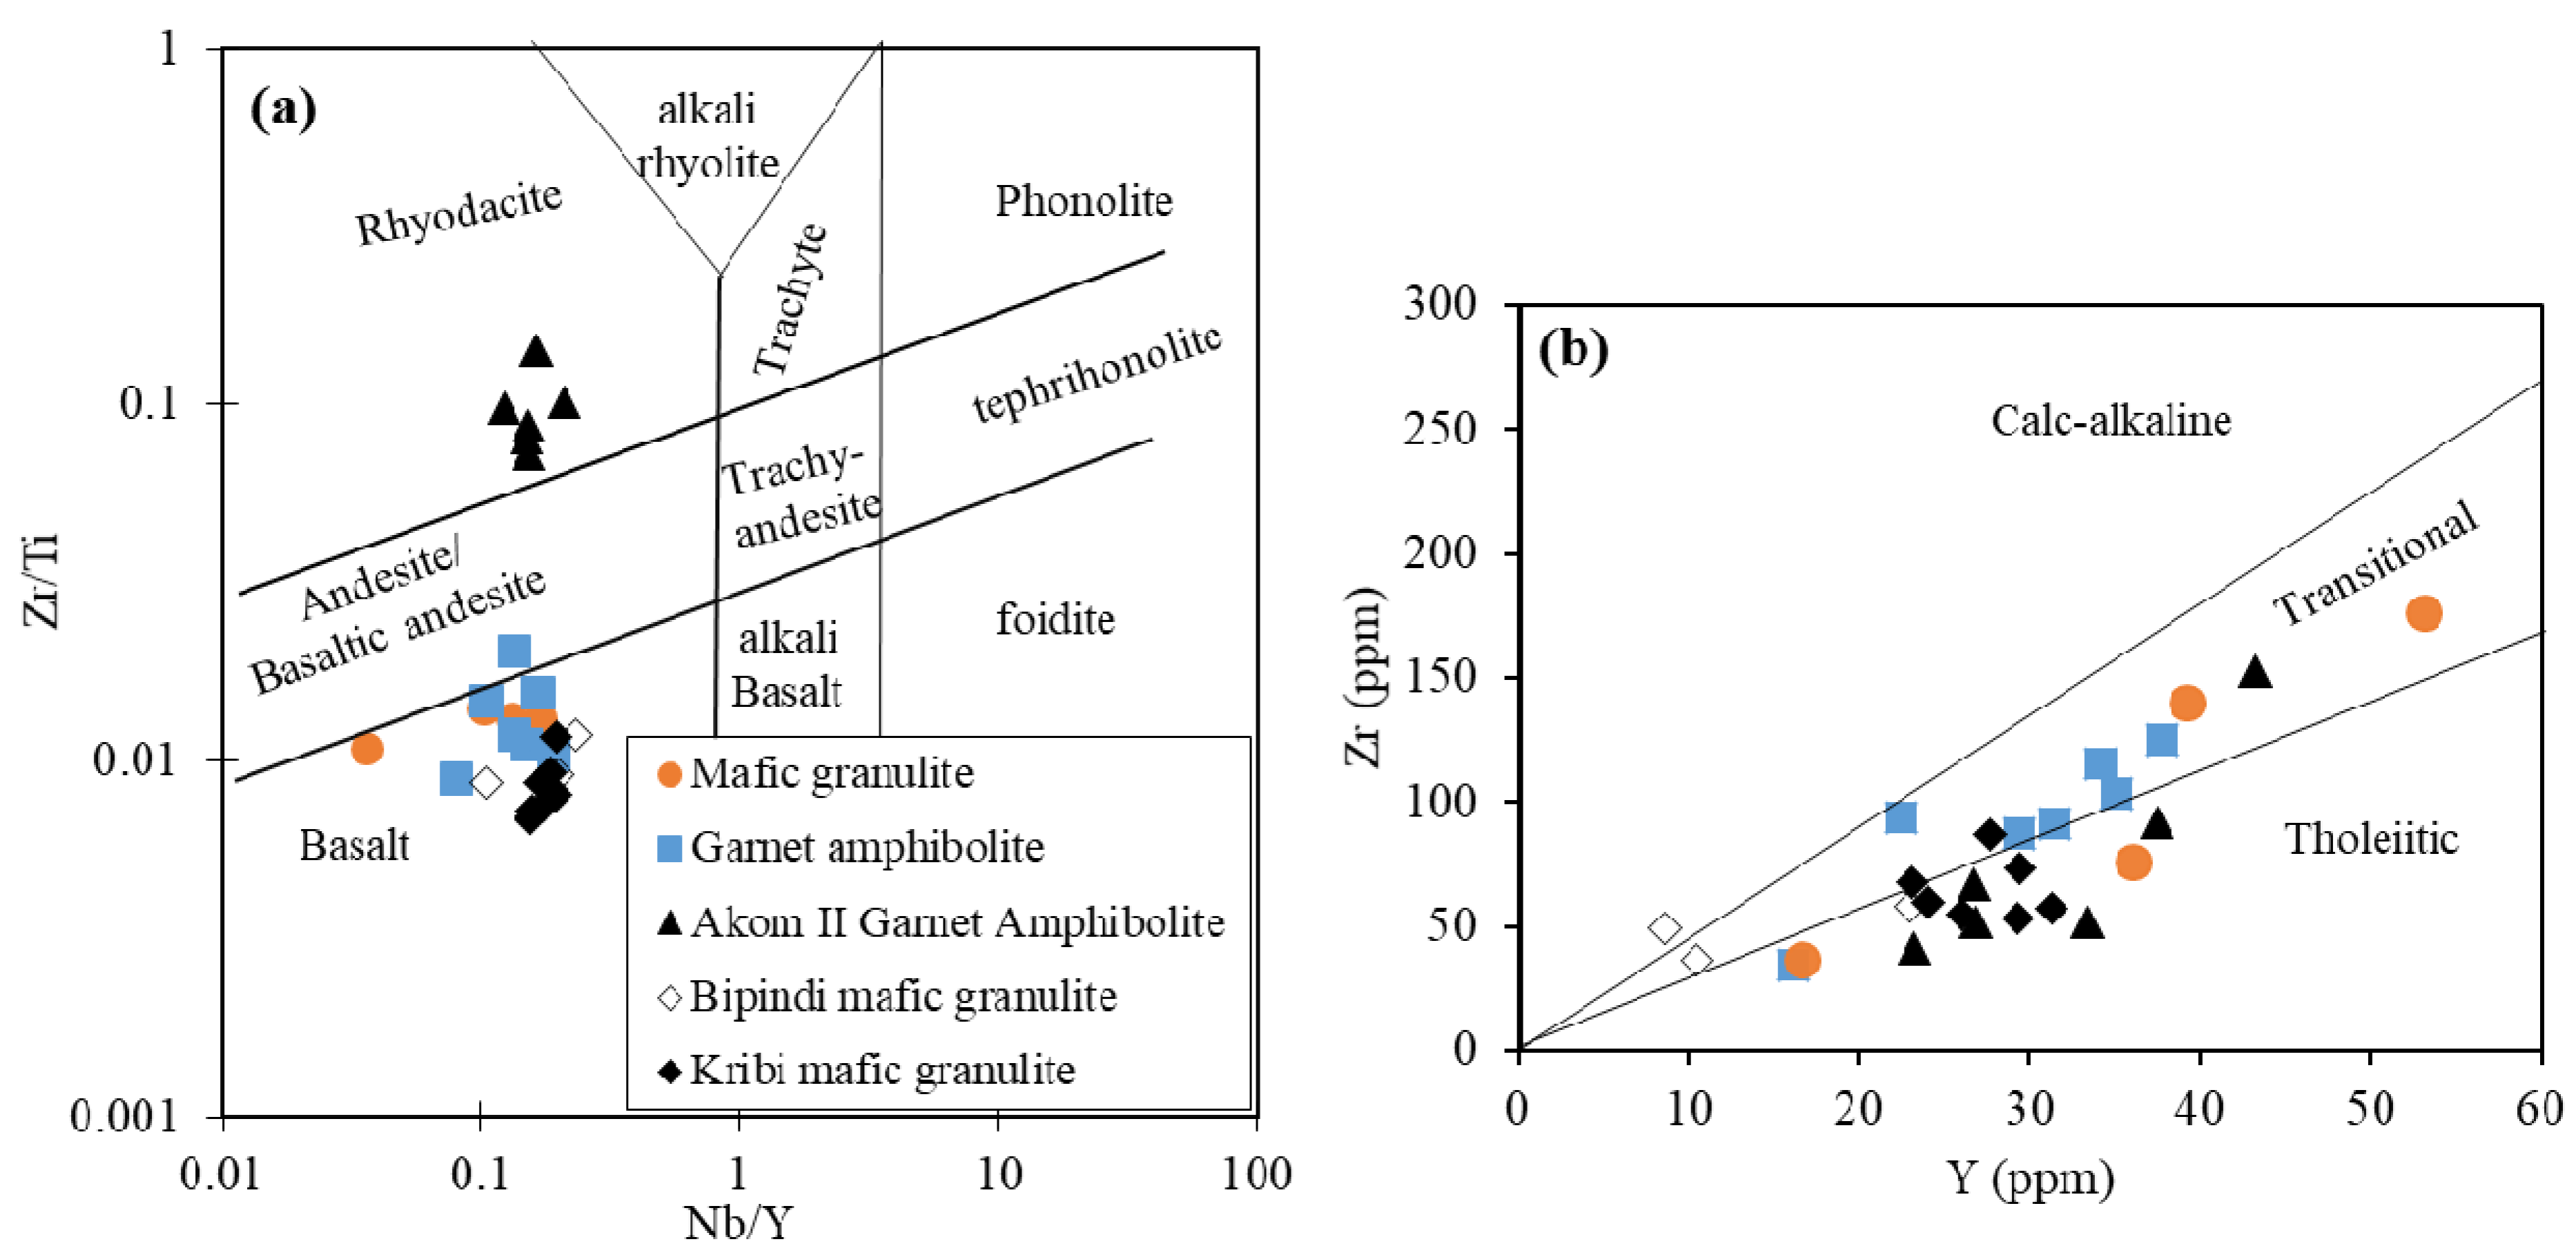
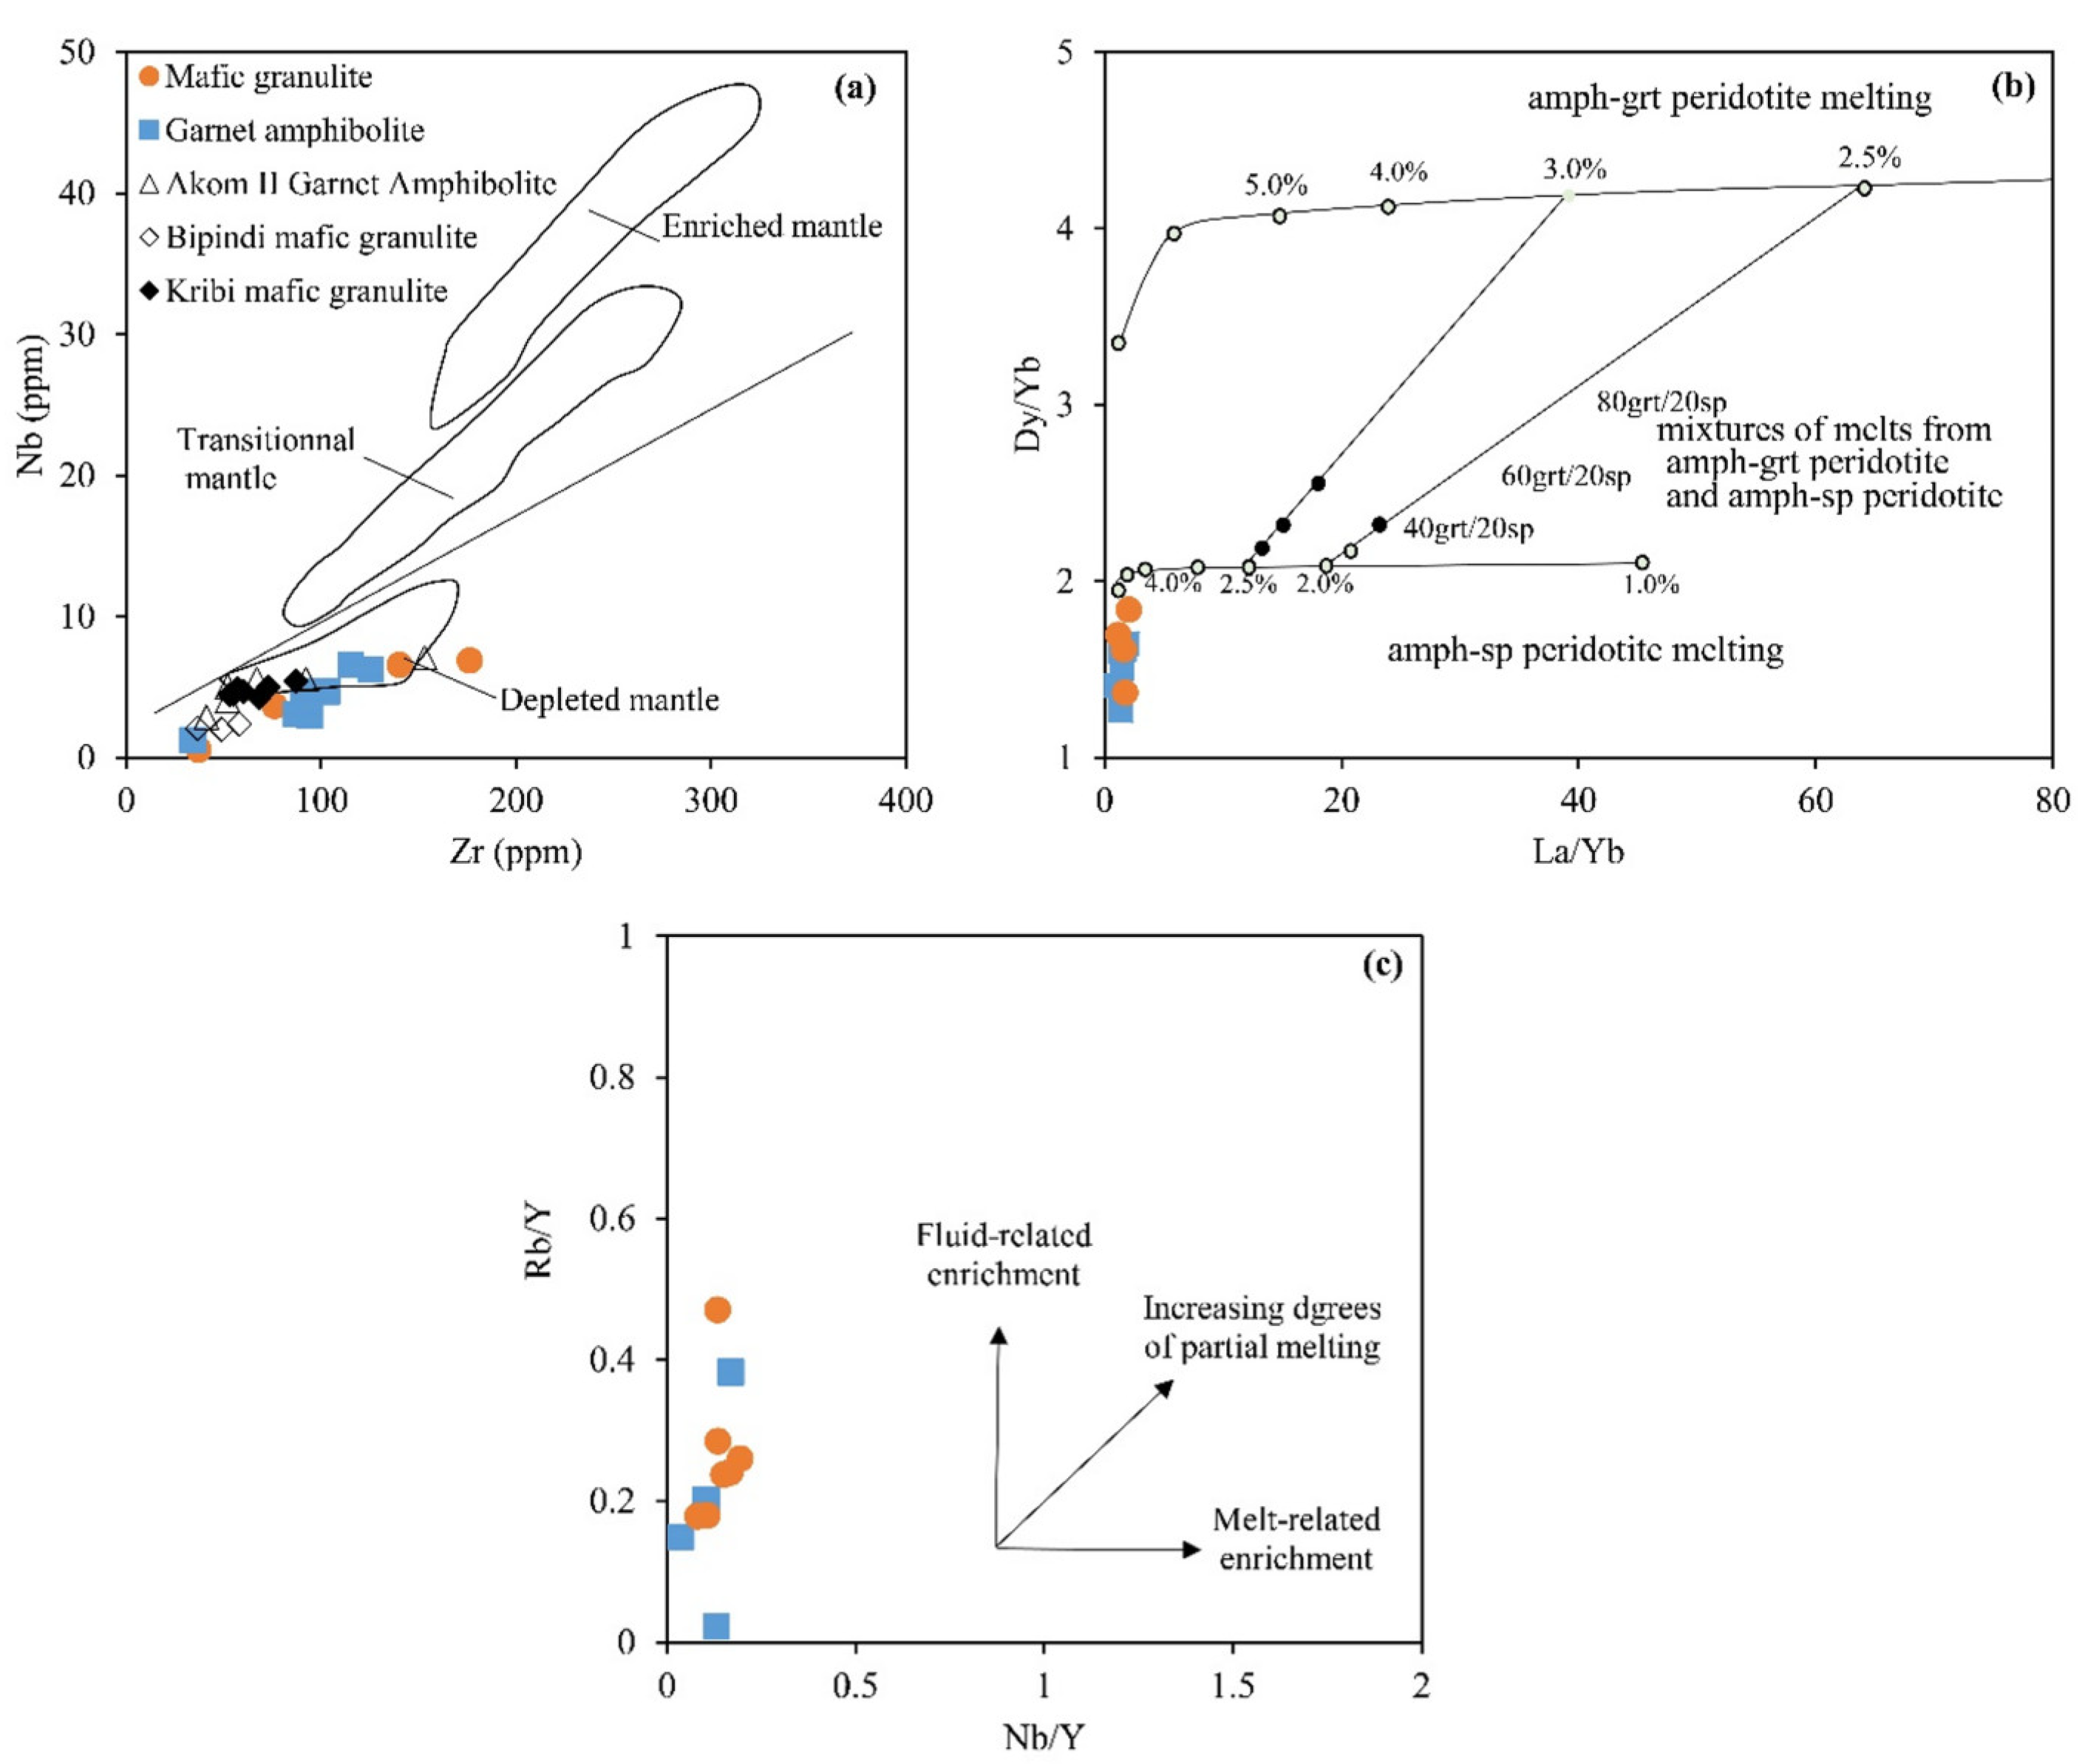
6.2. Petrogenesis of the Metavolcanic Rocks
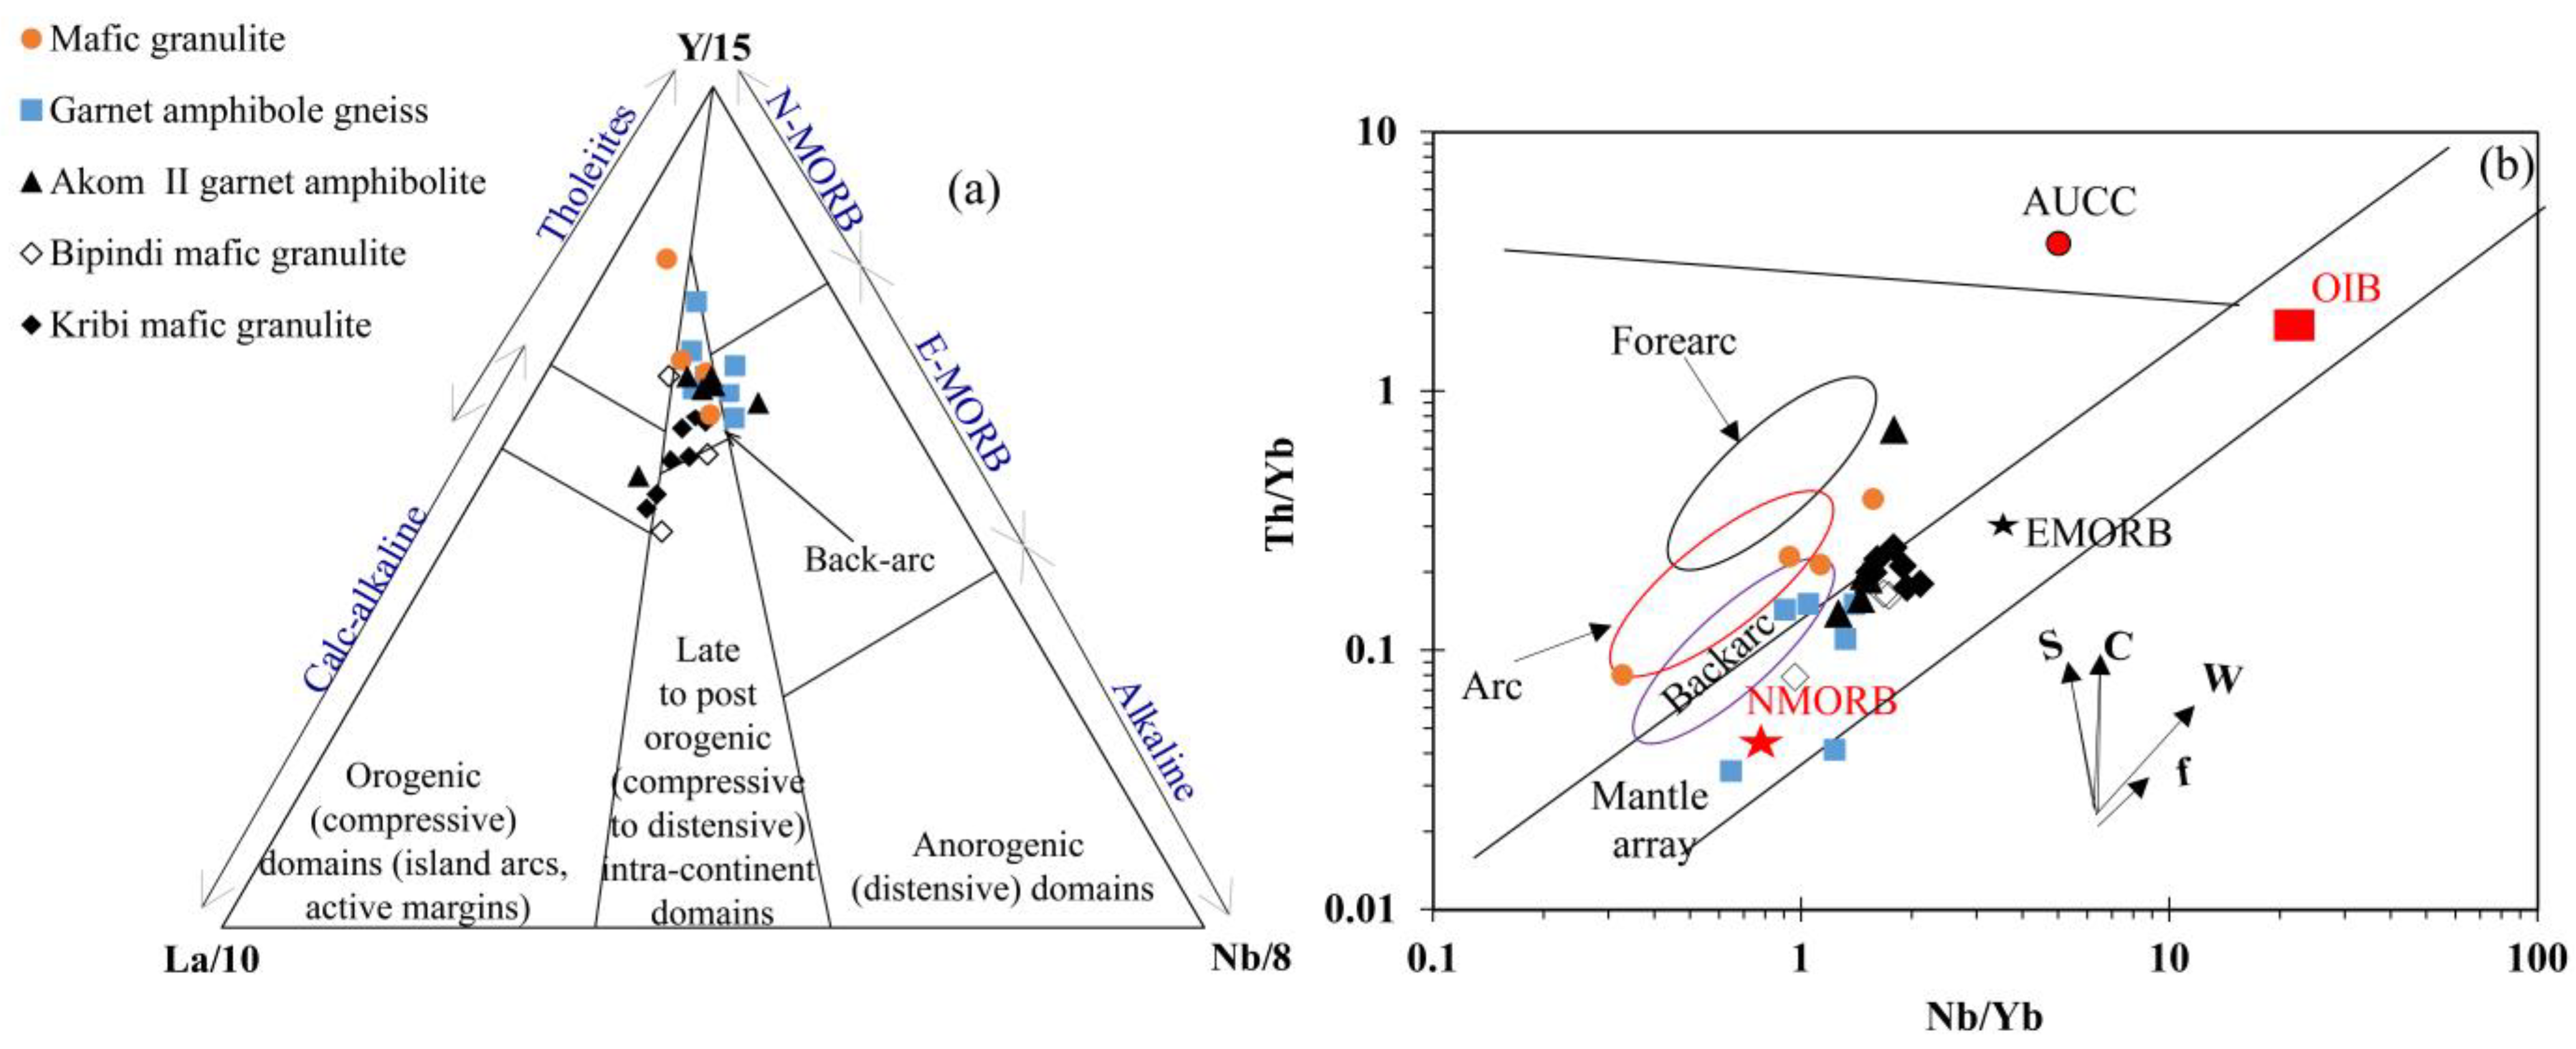
6.3. Tectonic Setting of the Metavolcanic Rocks
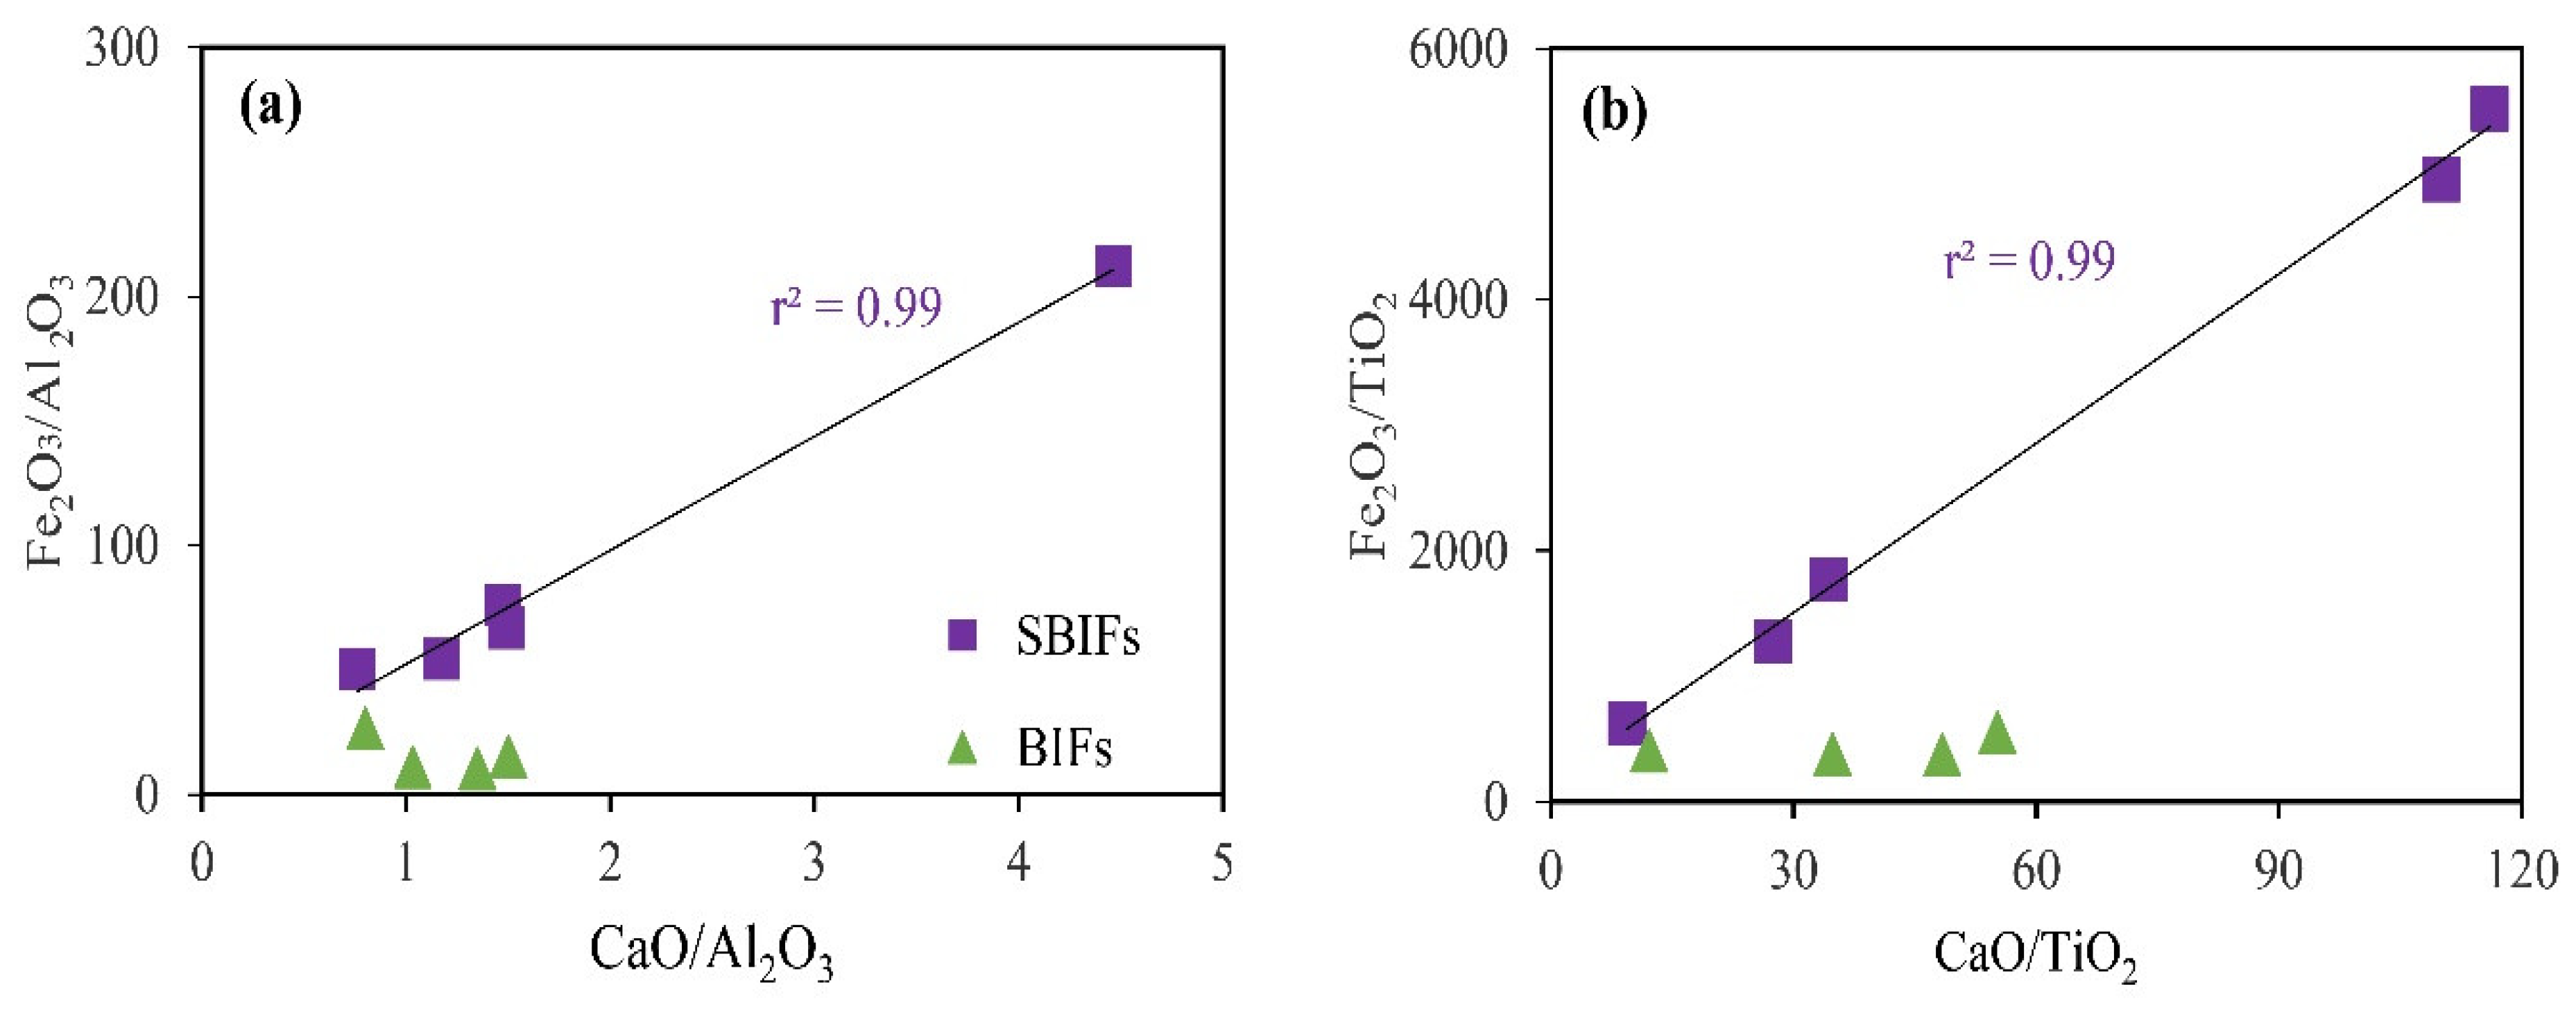
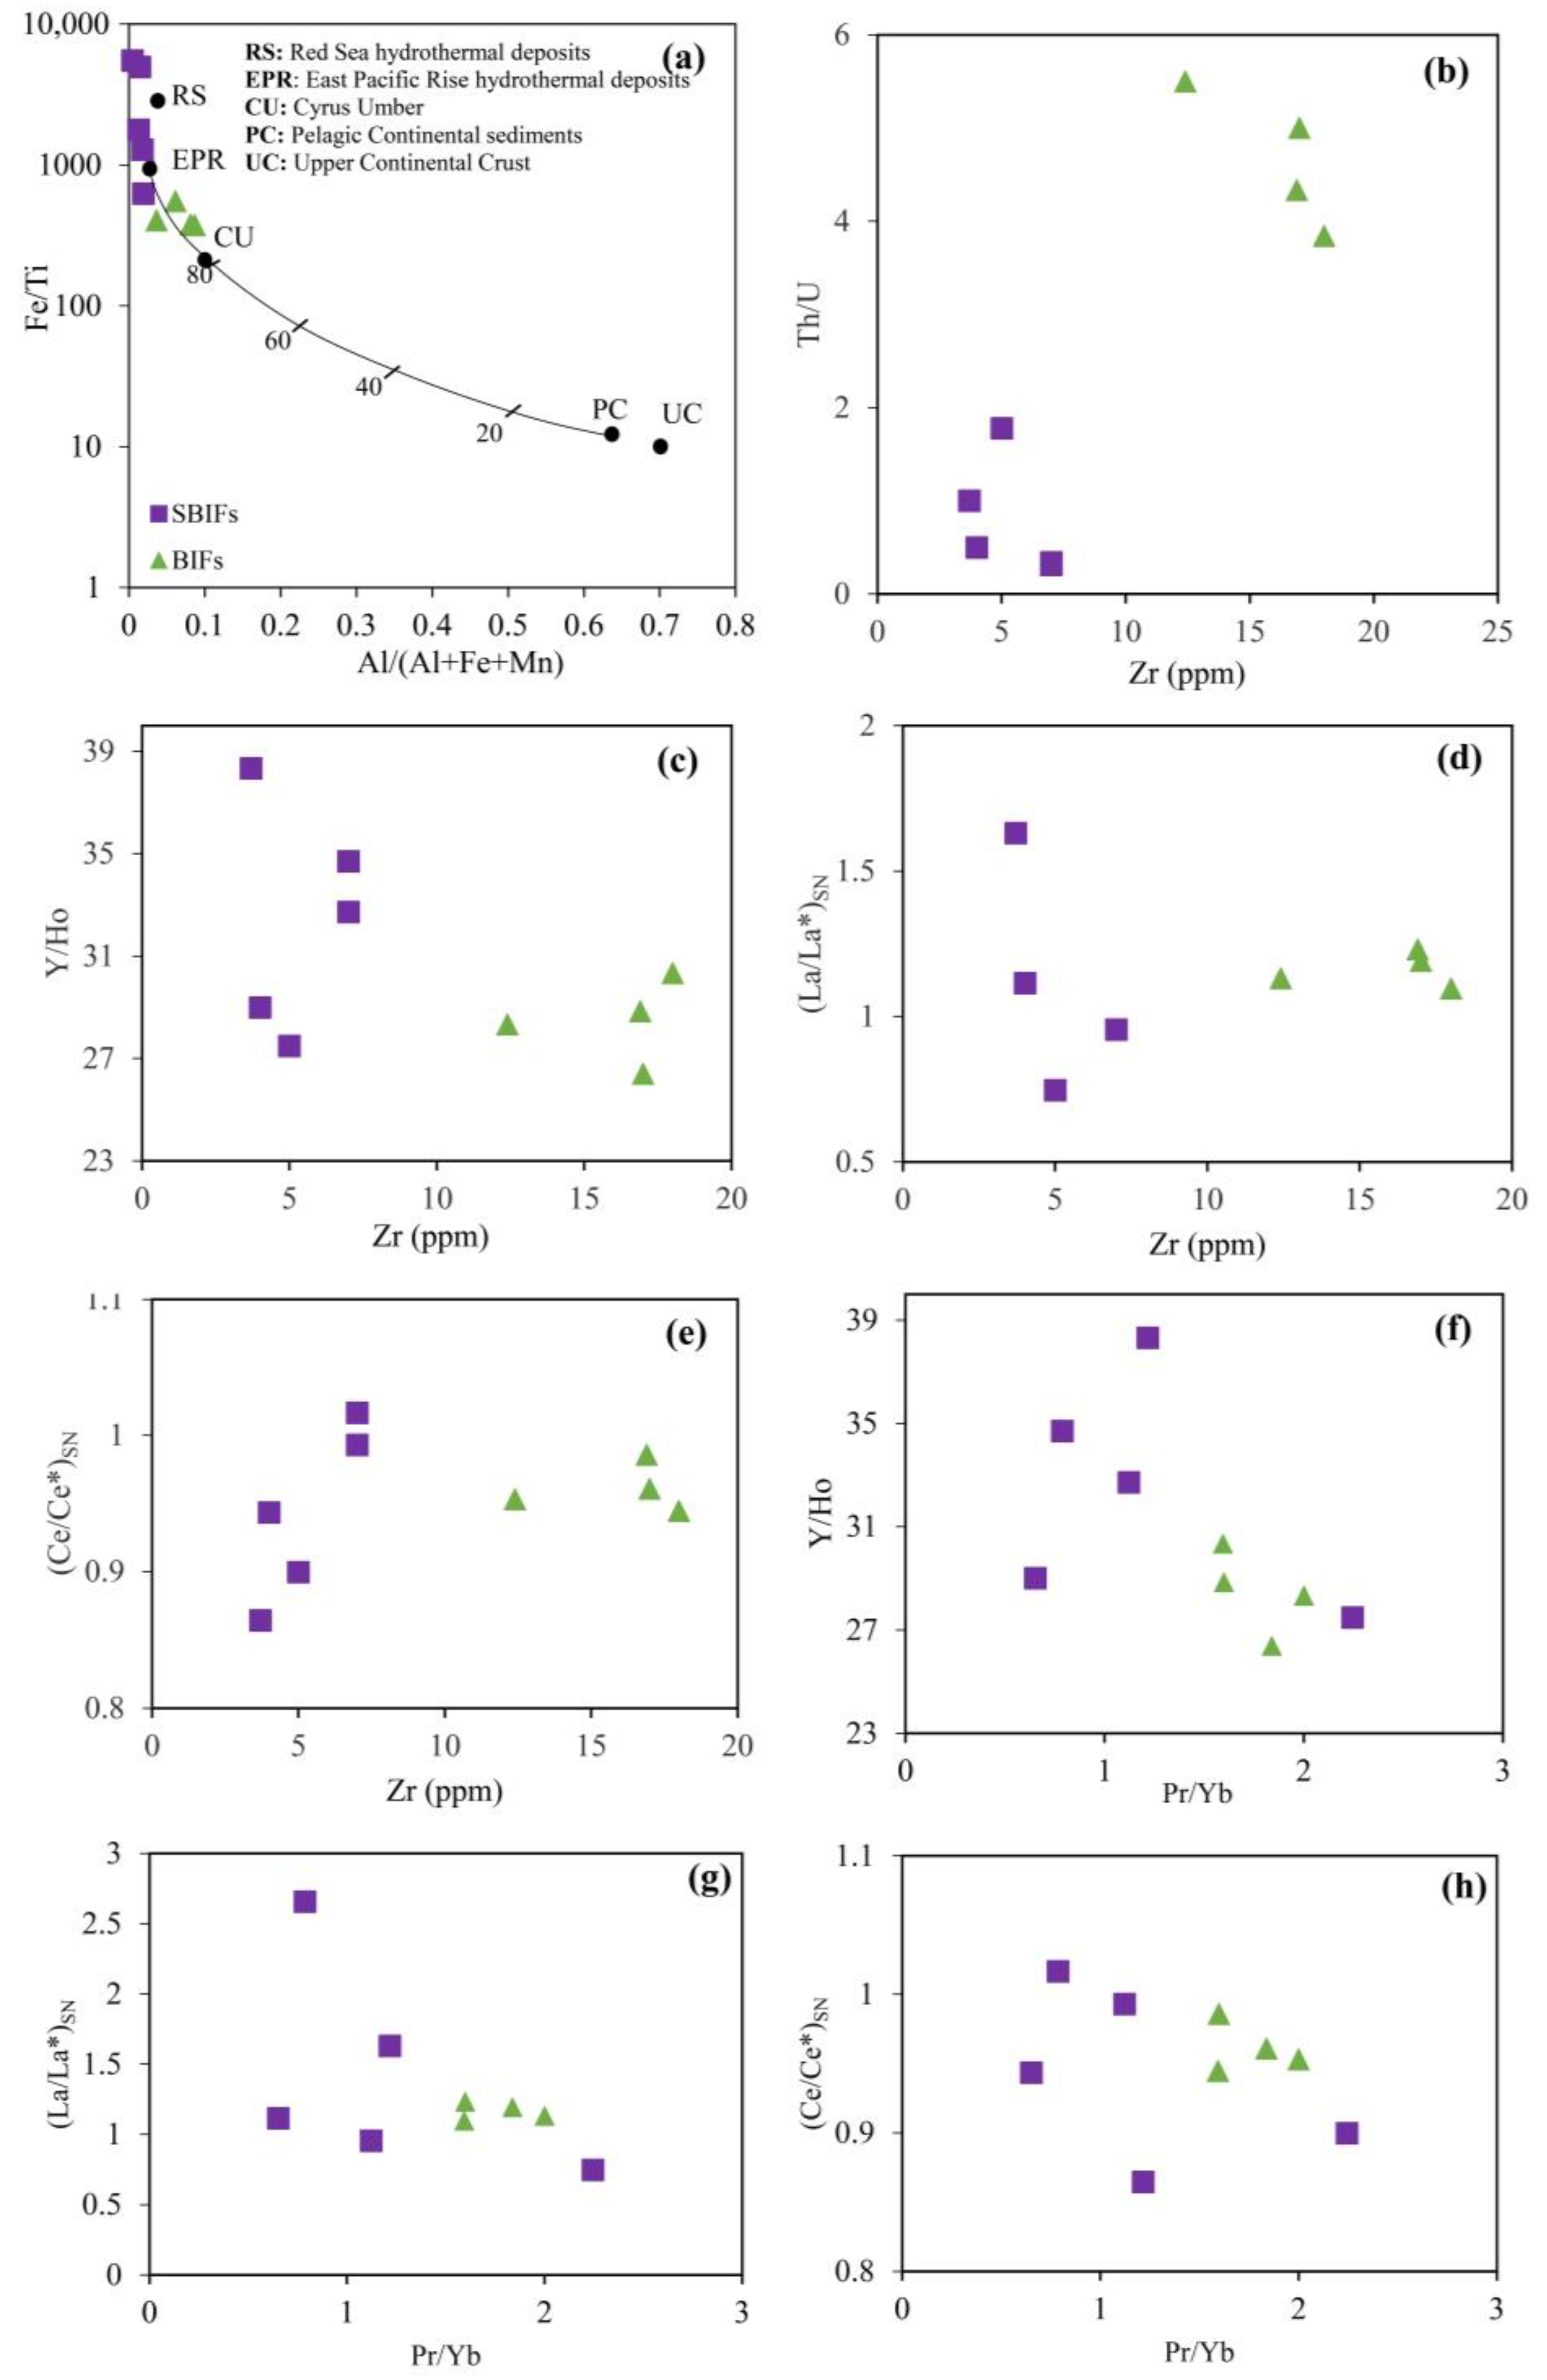
6.4. Nature, Source, and Assessment of Detrital Input during the Anyouzok IF Deposition
6.5. Origin of the Anyouzok Iron Formations
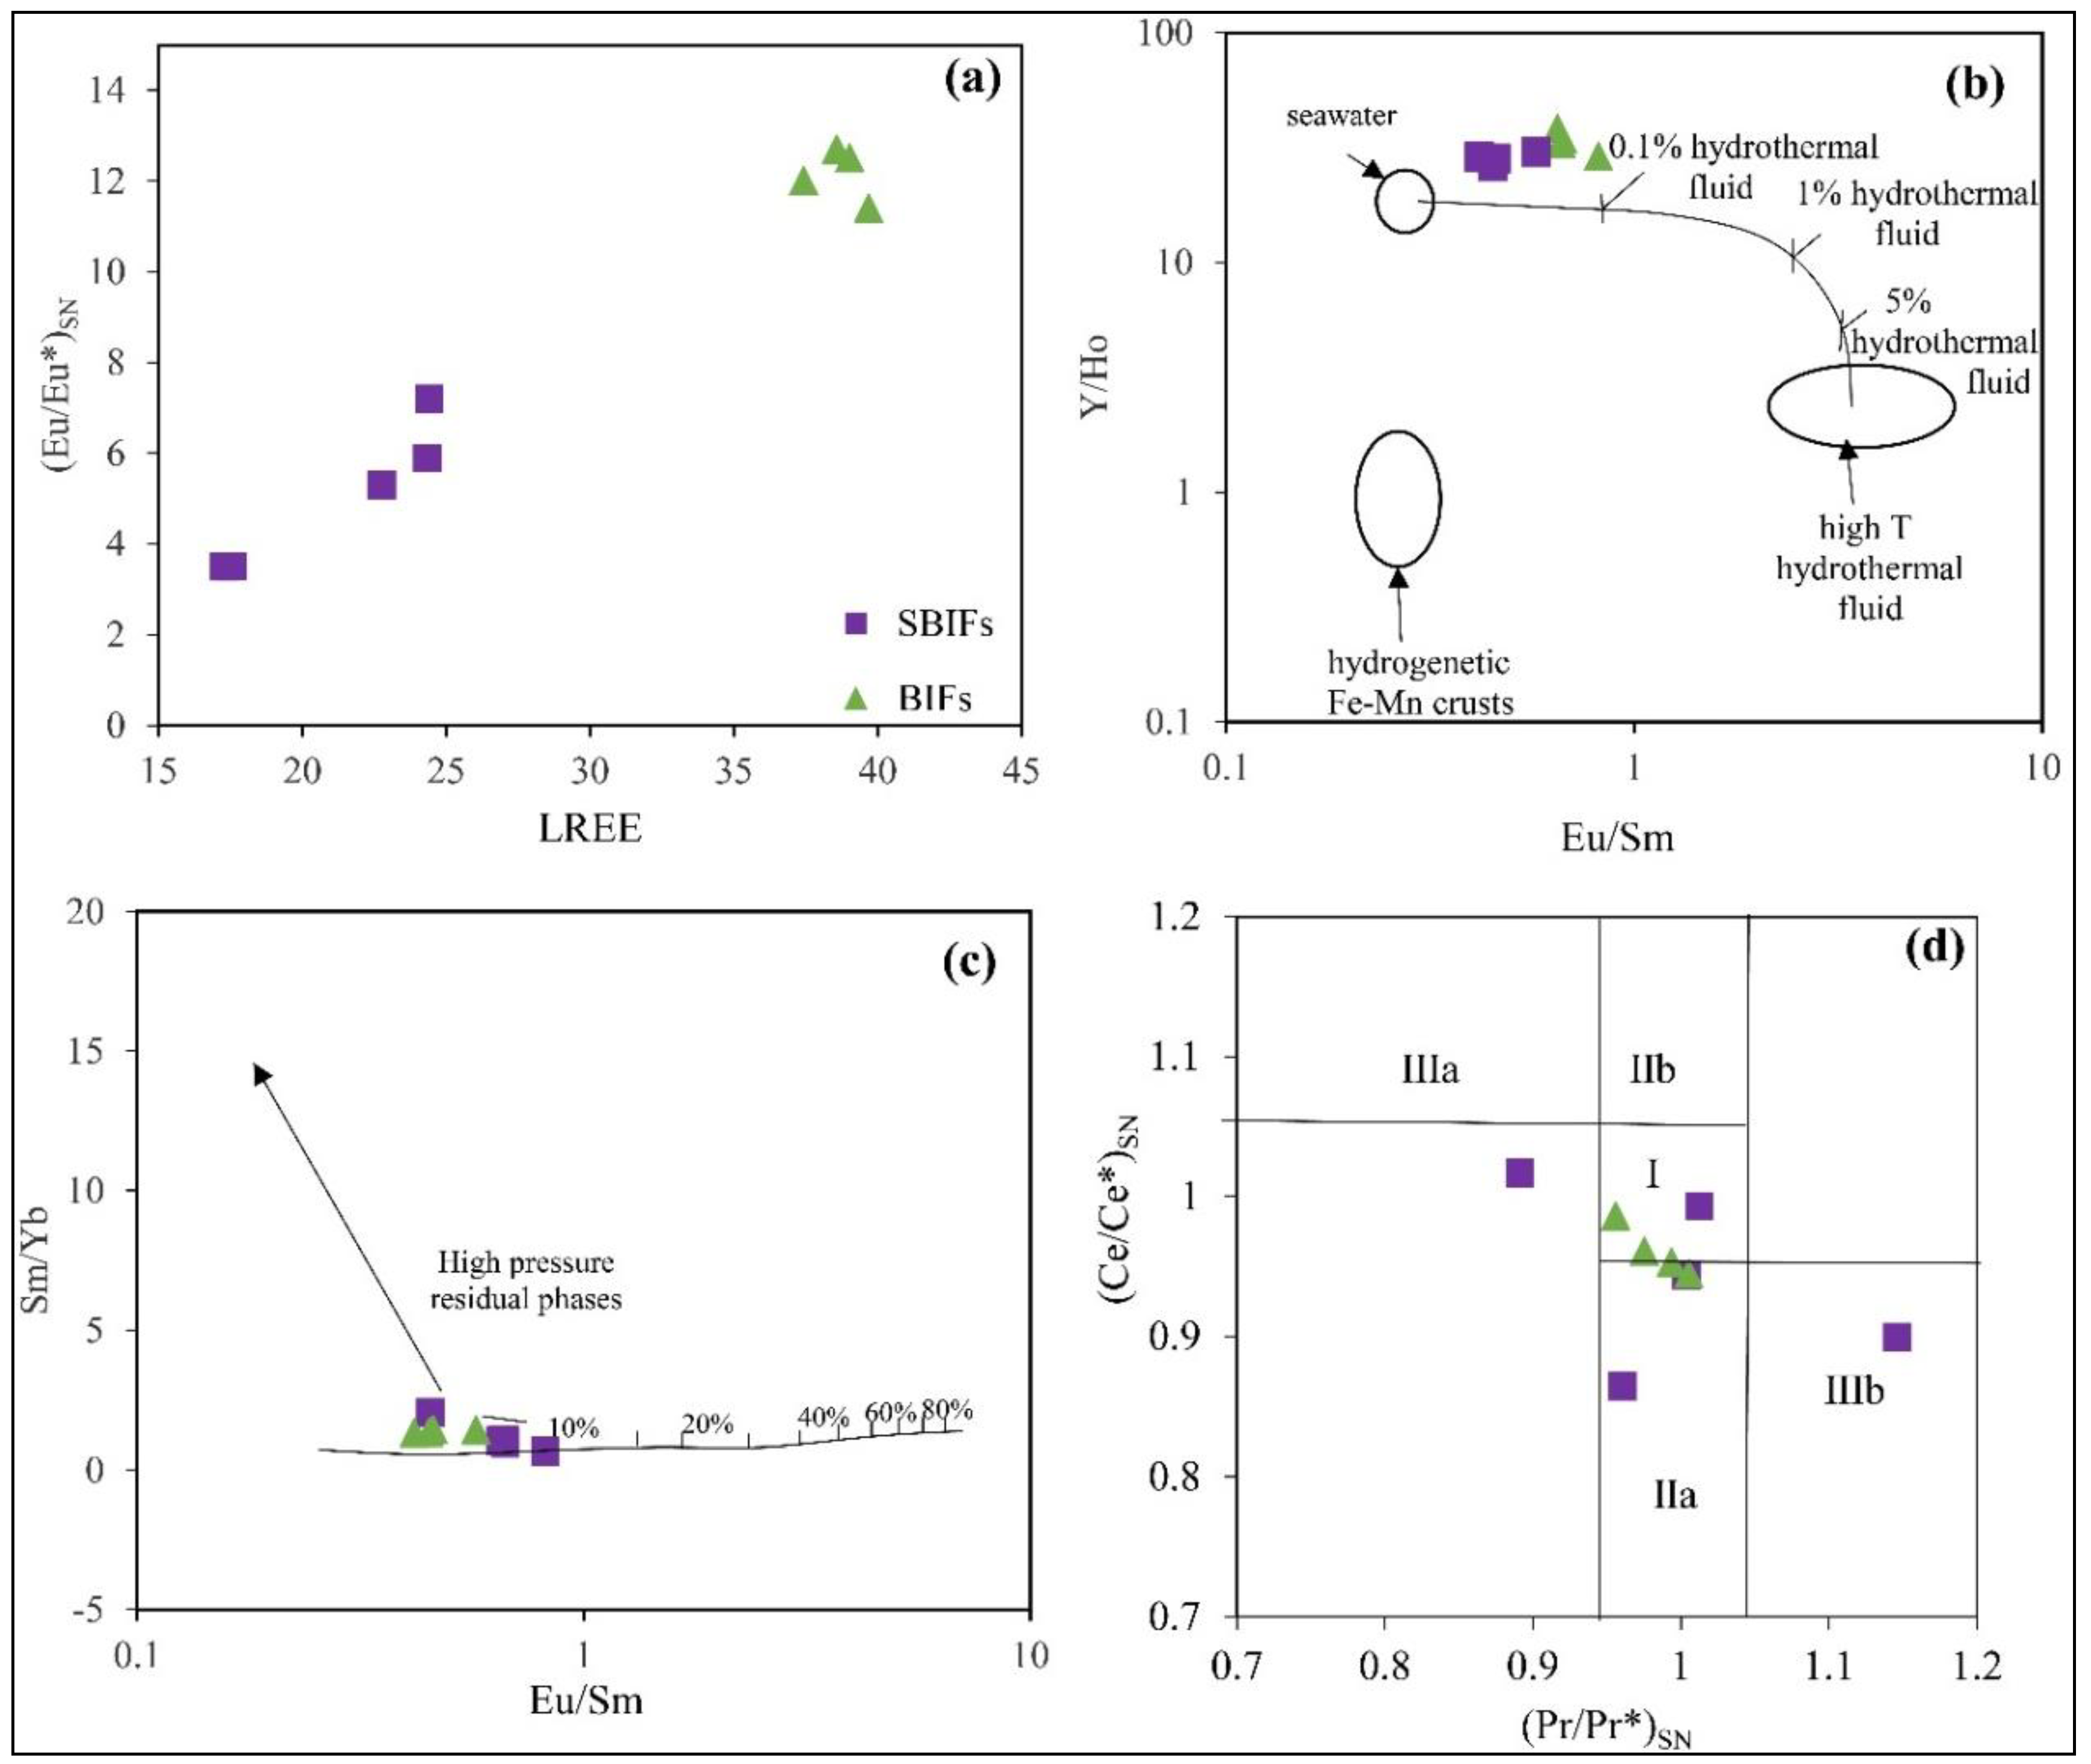
6.5.1. Seawater and Hydrothermal Fluid Contribution
6.5.2. Palaeoredox State of IF

6.6. Depositional Setting
7. Conclusions
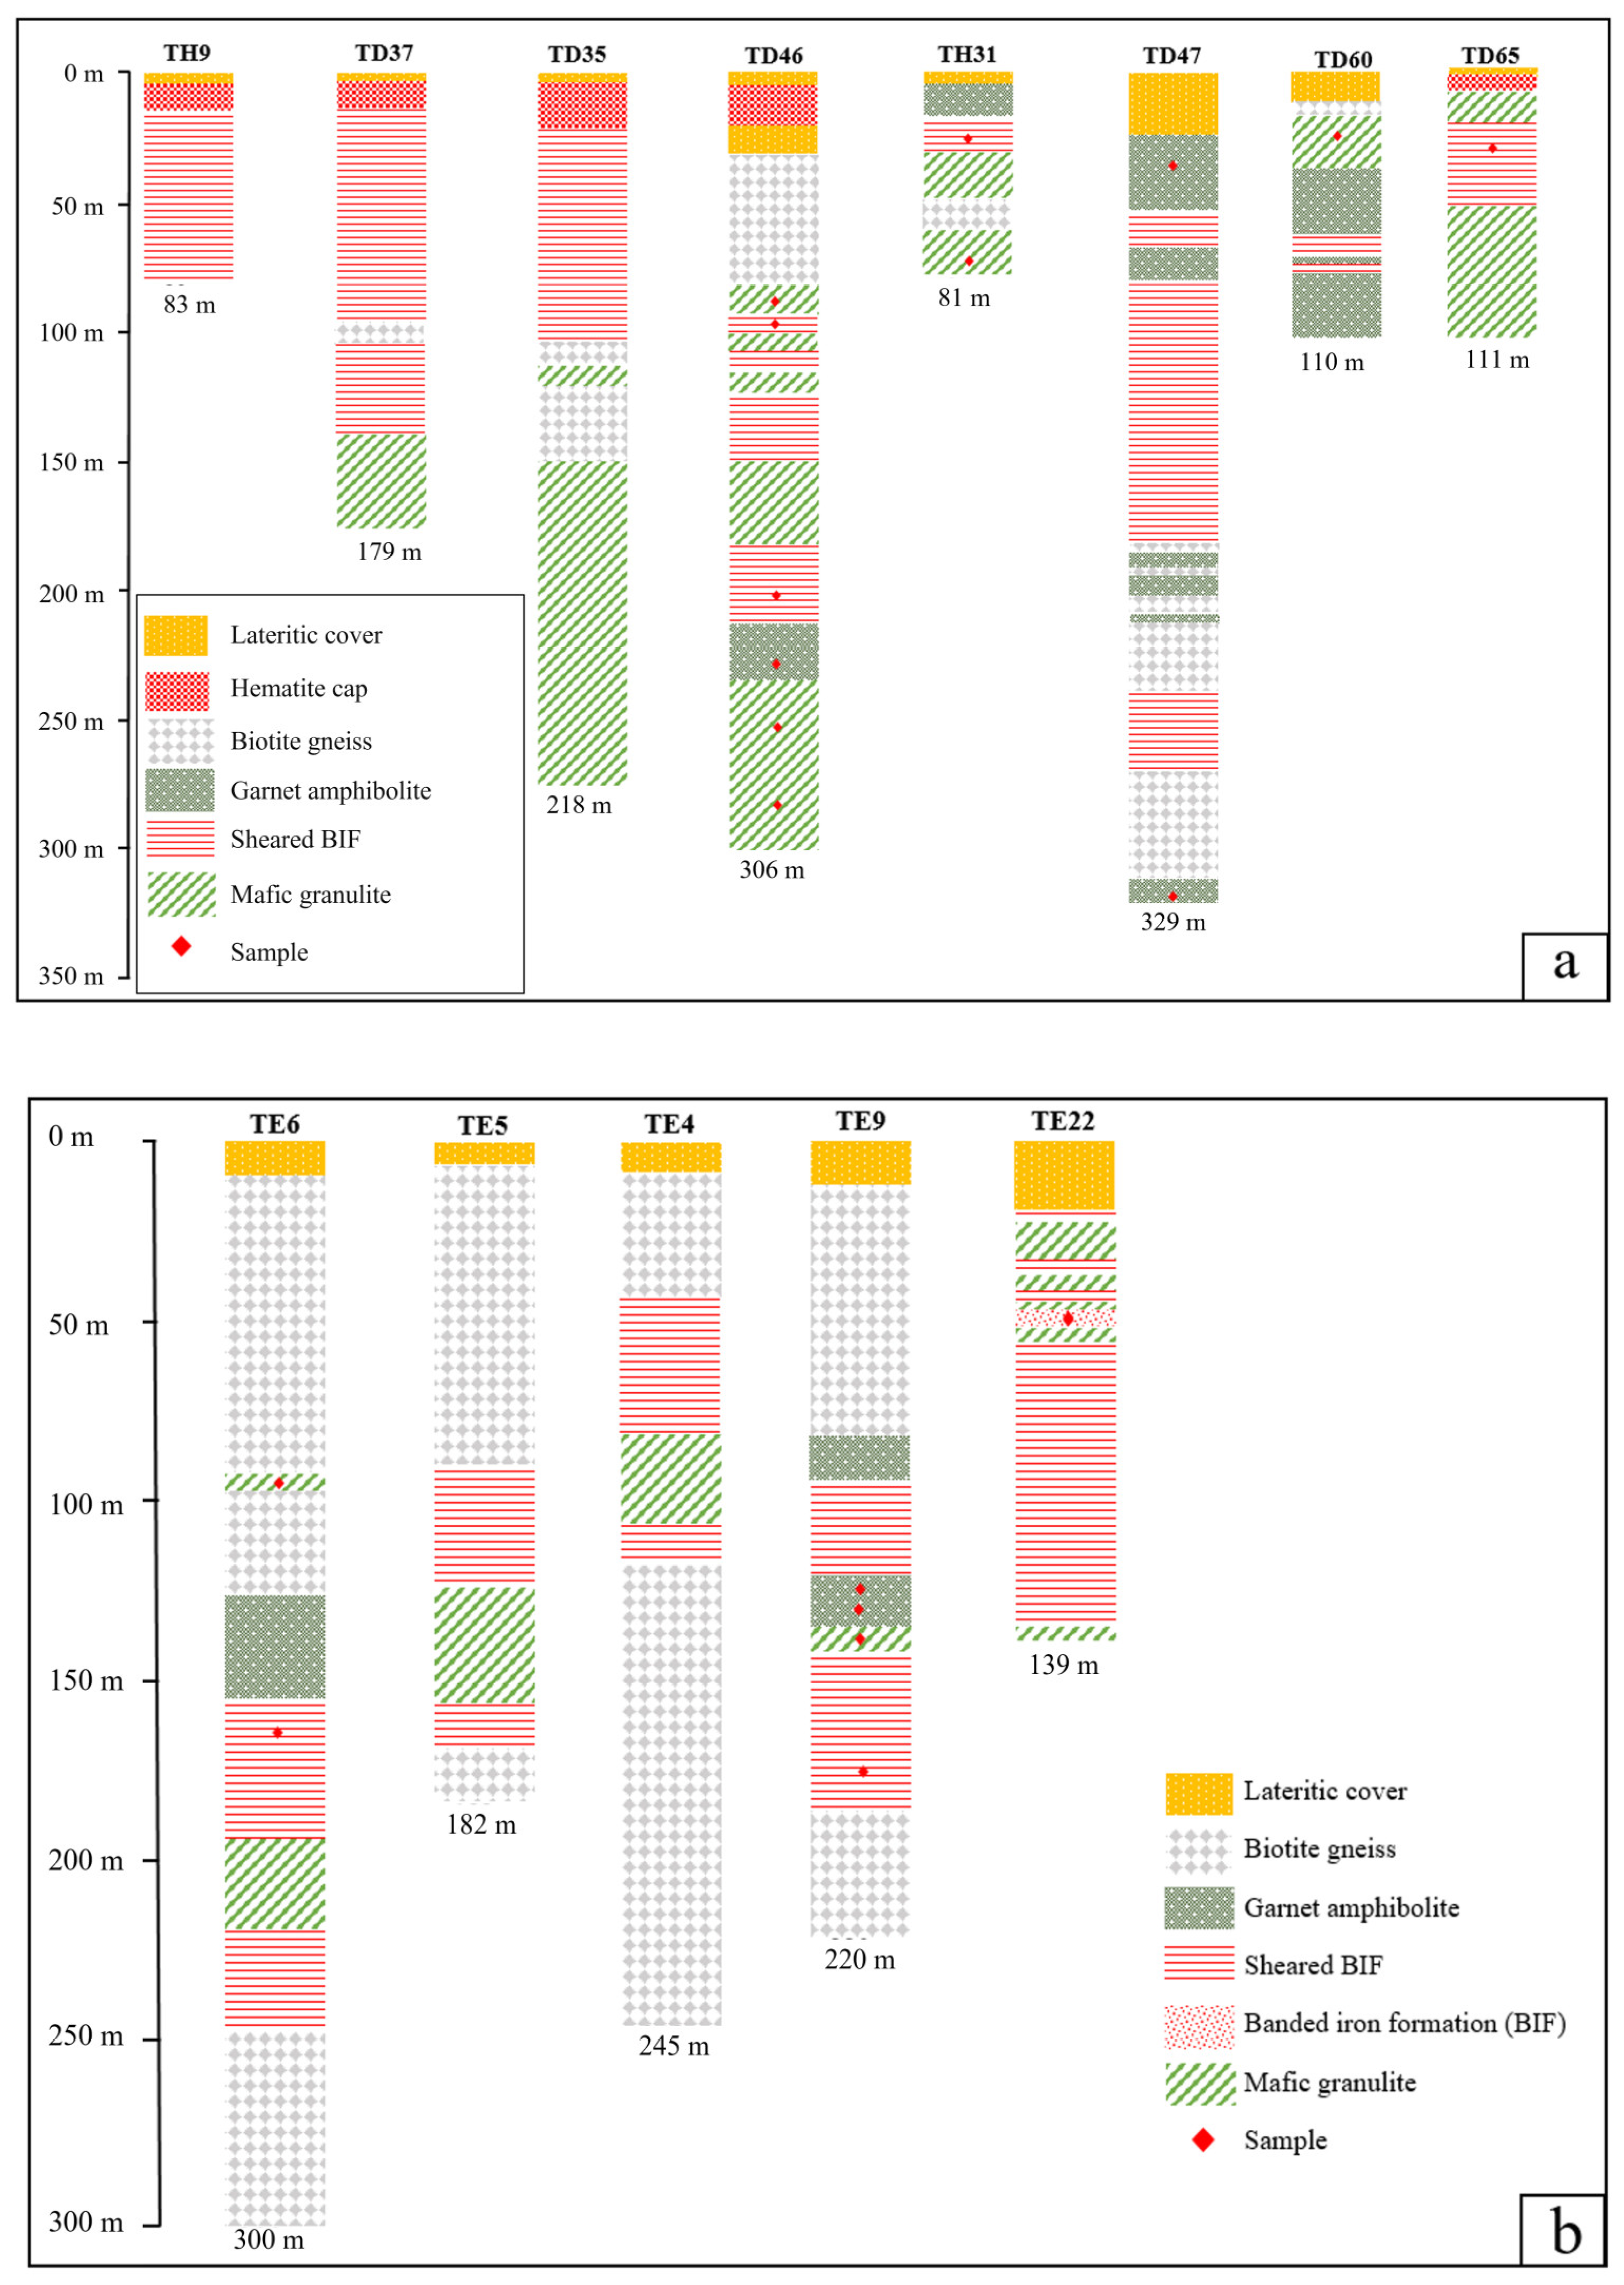
- The lithostratigraphy of this area comprises an IF unit, consisting of BIFs and SBIFs, and a country rock unit made up of mafic granulite and garnet amphibolite. These rocks were intensely deformed and metamorphosed up to granulite facies. BIFs are absent in surface outcrops and were uniquely intercepted in one drillhole, sandwiched between mafic granulites.
- The Anyouzok metavolcanic rocks have tholeiitic to transitional basalt precursors. The latter originated from the partial melting of a metasomatized spinel lherzolite source, which experienced various degrees of fractional crystallization and was emplaced in an arc/back-arc setting.
- The Anyouzok IFs are mainly composed of magnetite, quartz, and metamorphic amphibole (actinolite and tremolite), with subordinate biotite, plagioclase, K-feldspar, hematite, pyrite, calcite, and ilmenite. These rocks were primarily deposited as BIFs and enriched to SBIFs through hydrothermal alteration activities and the leaching of silica.
- The Anyouzok BIFs recorded the contribution of detrital components during their deposition. In addition, the REE-Y systematics of both BIFs and SBIFs suggest the influence of seawater and high-temperature hydrothermal fluids distal to the vent source during their precipitation in an anoxic to suboxic environment. The ubiquitous negative Y anomalies and chondritic Y/Ho ratios observed in almost all BIF samples suggest slow rates of Fe oxyhydroxide precipitation.
- Based on the geochemical features of the Anyouzok IFs and interbedded metavolcanic rocks, we propose that these IFs are Algoma-type and were formed distal to the hydrothermal vents in a back-arc setting.
Supplementary Materials
Author Contributions
Funding
Data Availability Statement
Acknowledgments
Conflicts of Interest
References
- James, H.L. Sedimentary facies of iron-formation. Econ. Geol. 1954, 49, 235–293. [Google Scholar] [CrossRef]
- Hagemann, S.; Angerer, T.; Duuring, P.; Rosière, C.; E Silva, R.F.; Lobato, L.; Hensler, A.; Walde, D. BIF-hosted iron mineral system: A review. Ore Geol. Rev. 2016, 76, 317–359. [Google Scholar] [CrossRef]
- Duuring, P.; Hagemann, S. Leaching of silica bands and concentration of magnetite in Archean BIF by hypogene fluids: Beebyn Fe ore deposit, Yilgarn Craton, Western Australia. Miner. Depos. 2012, 48, 341–370. [Google Scholar] [CrossRef]
- Peters, W.S. Aeromagnetic-Radiometric Survey: Structural Interpretation for Iron Ore, Gold and Other Commodities for Aureus Mining Inc; Aeromagnetic (Southern Geoscience Consulting Pty Ltd.): Yaoundé, Cameroon, 2011. [Google Scholar]
- Baker, H.; Haythornthwaite, J. Mineral Resource Estimate for the FeO8 and Fe11 Deposits of the Ntem Iron Project; SRK Consulting Ltd.: Gauteng, China, 2015. [Google Scholar]
- Bolhar, R.; Kamber, B.S.; Moorbath, S.; Fedo, C.M.; Whitehouse, M.J. Characterisation of early Archaean chemical sediments by trace element signatures. Earth Planet. Sci. Lett. 2004, 222, 43–60. [Google Scholar] [CrossRef]
- Bekker, A.; Slack, J.F.; Planavsky, N.; Krapez, B.; Hofmann, A.; Konhauser, K.; Rouxel, O.J. Iron Formation: The Sedimentary Product of a Complex Interplay among Mantle, Tectonic, Oceanic, and Biospheric Processes. Econ. Geol. 2010, 105, 467–508. [Google Scholar] [CrossRef]
- Thurston, P.; Kamber, B.; Whitehouse, M. Archean cherts in banded iron formation: Insight into Neoarchean ocean chemistry and depositional processes. Precambrian Res. 2012, 214–215, 227–257. [Google Scholar] [CrossRef]
- Wang, C.; Zhang, L.; Lan, C.; Dai, Y. Petrology and geochemistry of the Wangjiazhuang banded iron formation and associated supracrustal rocks from the Wutai greenstone belt in the North China Craton: Implications for their origin and tectonic setting. Precambrian Res. 2014, 255, 603–626. [Google Scholar] [CrossRef]
- El-Shazly, A.; Khalil, K.; Helba, H. Geochemistry of banded iron formations and their host rocks from the Central Eastern Desert of Egypt: Aworking genetic model and tectonic implications. Precambrian Res. 2019, 325, 192–216. [Google Scholar] [CrossRef]
- Moudioh, C.; Tamehe, L.S.; Ganno, S.; Tankwa, M.N.; Soares, M.B.; Ghosh, R.; Kankeu, B.; Nzenti, J.P. Tectonic setting of the Bipindi greenstone belt, northwest Congo craton, Cameroon: Implications on BIF deposition. J. Afr. Earth Sci. 2020, 171, 103971. [Google Scholar] [CrossRef]
- Tankwa, M.N.; Ganno, S.; Okunlola, O.A.; Njiosseu, E.L.T.; Tamehe, L.S.; Woguia, B.K.; Mbita, A.S.M.; Nzenti, J.P. Petrogenesis and tectonic setting of the Paleoproterozoic Kelle Bidjoka iron formations, Nyong group greenstone belts, southwestern Cameroon. Constraints from petrology, geochemistry, and LA-ICP-MS zircon U-Pb geochronology. Int. Geol. Rev. 2020, 63, 1737–1757. [Google Scholar] [CrossRef]
- Ebotehouna, C.G.; Xie, Y.; Adomako-Ansah, K.; Gourcerol, B.; Qu, Y. Depositional Environment and Genesis of the Nabeba Banded Iron Formation (BIF) in the Ivindo Basement Complex, Republic of the Congo: Perspective from Whole-Rock and Magnetite Geochemistry. Minerals 2021, 11, 579. [Google Scholar] [CrossRef]
- Soh Tamehe, L.; Li, H.; Ganno, S.; Chen, Z.; Lemdjou, Y.B.; Elatikpo, S.Y. Insight into the Origin of Iron Ore Based on Elemental Contents of Magnetite and Whole-Rock Geochemistry: A Case of the Bipindi Banded Iron Formations. J. Earth Sci. 2022. submitted for publication. [Google Scholar]
- Gourcerol, B.; Blein, O.; Chevillard, M.; Callec, Y.; Boudzoumou, F.; Djama, L.-M.J. Depositional Setting of Archean BIFs from Congo: New Insight into Under-Investigated Occurrences. Minerals 2022, 12, 114. [Google Scholar] [CrossRef]
- Taylor, D.; Dalstra, H.J.; Harding, A.E.; Broadbent, G.C.; Barley, M.E. Genesis of High-Grade Hematite Orebodies of the HamersleyProvince, Western Australia. Econ. Geol. 2001, 96, 837–873. [Google Scholar] [CrossRef]
- Klein, C. Some Precambrian banded iron-formations (BIFs) from around the world: Their age, geologic setting, mineralogy, metamorphism, geochemistry, and origins. Am. Miner. 2005, 90, 1473–1499. [Google Scholar] [CrossRef]
- Gross, G.A. A classification of iron formations based on depositional environments. Can. Mineral. 1980, 18, 215–222. [Google Scholar]
- Maurizot, P.; Abessolo, A.; Feybesse, J.L.; Johan Lecomte, P. Etude de prospection minière du Sud-Ouest Cameroun, Synthèse des travaux de 1978 à 1985. J. Sci. Res. 1986, 247. [Google Scholar]
- Lerouge, C.; Cocherie, A.; Toteu, S.F.; Penaye, J.; Milési, J.-P.; Tchameni, R.; Nsifa, E.N.; Fanning, C.M.; Deloule, E. Shrimp U–Pb zircon age evidence for Paleoproterozoic sedimentation and 2.05Ga syntectonic plutonism in the Nyong Group, South-Western Cameroon: Consequences for the Eburnean–Transamazonian belt of NE Brazil and Central Africa. J. Afr. Earth Sci. 2006, 44, 413–427. [Google Scholar] [CrossRef]
- Ganno, S.; Moudioh, C.; Nchare, A.N.; Nono, G.D.K.; Nzenti, J.P. Geochemical Fingerprint and Iron Ore Potential of the Siliceous Itabirite from Palaeoproterozoic Nyong Series, Zambi Area, Southwestern Cameroon. Resour. Geol. 2015, 66, 71–80. [Google Scholar] [CrossRef]
- Aye, B.A.; Sababa, E.; Ndjigui, P.-D. Geochemistry of S, Cu, Ni, Cr and Au-PGE in the garnet amphibolites from the Akom II area in the Archaean Congo Craton, Southern Cameroon. Geochemistry 2017, 77, 81–93. [Google Scholar] [CrossRef]
- Bouyo, M.H.; Penaye, J.; Mouri, H.; Toteu, S. Eclogite facies metabasites from the Paleoproterozoic Nyong Group, SW Cameroon: Mineralogical evidence and implications for a high-pressure metamorphism related to a subduction zone at the NW margin of the Archean Congo craton. J. Afr. Earth Sci. 2018, 149, 215–234. [Google Scholar] [CrossRef]
- Tsoungui, P.N.E.; Ganno, S.; Njiosseu, E.L.T.; Mbongue, J.L.N.; Woguia, B.K.; Tamehe, L.S.; Wambo, J.D.T.; Nzenti, J.P. Geochemical constraints on the origin and tectonic setting of the serpentinized peridotites from the Paleoproterozoic Nyong series, Eseka area, SW Cameroon. Acta Geochim. 2019, 39, 404–422. [Google Scholar] [CrossRef]
- Tamehe, L.S.; Tankwa, M.N.; Chongtao, W.; Ganno, S.; Ngnotue, T.; Nono, G.D.K.; Simon, S.J.; Zhang, J.; Nzenti, J.P. Geology and geochemical constrains on the origin and depositional setting of the Kpwa–Atog Boga banded iron formations (BIFs), northwestern Congo craton, southern Cameroon. Ore Geol. Rev. 2018, 95, 620–638. [Google Scholar] [CrossRef]
- Tamehe, L.S.; Chongtao, W.; Ganno, S.; Simon, S.J.; Nono, G.D.K.; Nzenti, J.P.; Lemdjou, Y.B.; Lin, N.H. Geology of the Gouap iron deposit, Congo craton, southern Cameroon: Implications for iron ore exploration. Ore Geol. Rev. 2019, 107, 1097–1128. [Google Scholar] [CrossRef]
- Tamehe, L.S.; Wei, C.; Ganno, S.; Rosière, C.A.; Nzenti, J.P.; Ebotehouna, C.G.; Lu, G. Depositional age and tectonic environment of the Gouap banded iron formations from the Nyong group, SW Cameroon: Insights from isotopic, geochemical and geochronological studies of drillcore samples. Geosci. Front. 2020, 12, 549–572. [Google Scholar] [CrossRef]
- Marion, K.W.M.; Djibril, K.N.G.; Guimollaire, N.D.; Patrick, A.K. Petrogenesis and U–Pb zircon dating of amphibolite in the Mewengo iron deposit, Nyong series, Cameroon: Fingerprints of iron depositional geotectonic setting. Arab. J. Geosci. 2021, 14, 1–15. [Google Scholar] [CrossRef]
- Soh, A.P.D.; Ganno, S.; Zhang, L.; Tamehe, L.S.; Wang, C.; Peng, Z.; Tong, X.; Nzenti, J.P. Origin, tectonic environment and age of the Bibole banded iron formations, northwestern Congo Craton, Cameroon: Geochemical and geochronological constraints. Geol. Mag. 2021, 158, 2245–2263. [Google Scholar] [CrossRef]
- Owona, S.; Schulz, B.; Minyem, D.; Ratschbacher, L.; Tchamabe, B.C.; Olinga, J.B.; Ondoa, J.M.; Ekodeck, G.E. Eburne-an/Trans-Amazonian Orogeny in the Nyong Complex of Southwestern Cameroon: Meta-Basite Geochemistry and Meta-morphic Petrology. J. Afr. Earth Sci. 2022, 190, 104515. [Google Scholar] [CrossRef]
- Mvodo, H.; Ganno, S.; Nono, G.D.K.; Fossi, D.H.; Essomba, P.E.N.; Tankwa, M.N.; Nzenti, J.P. Petrogenesis, LA-ICP-MS zircon U-Pb geochronology and geodynamic implications of the Kribi metavolcanic rocks, Nyong Group, Congo craton. Acta Geochim. 2022, 41, 470–495. [Google Scholar] [CrossRef]
- Djomani, Y.P.; Diament, M.; Wilson, M. Lithospheric structure across the Adamawa plateau (Cameroon) fromgravity studies. Tectonophysics 1997, 273, 317–327. [Google Scholar] [CrossRef]
- Toteu, S.F.; Penaye, J.; Djomani, Y.P. Geodynamic evolution of the Pan-African belt in central Africa with special reference to Cameroon. Can. J. Earth Sci. 2004, 41, 73–85. [Google Scholar] [CrossRef]
- Ngalamo, J.F.G.; Bisso, D.; Abdelsalam, M.G.; Atekwana, E.A.; Katumwehe, A.B.; Ekodeck, G. Geophysical imaging of metacratonizaton in the northern edge of the Congo craton in Cameroon. J. Afr. Earth Sci. 2017, 129, 94–107. [Google Scholar] [CrossRef]
- Tchakounté, J.; Eglinger, A.; Toteu, S.F.; Zeh, A.; Nkoumbou, C.; Mvondo-Ondoa, J.; Penaye, J.; De Wit, M.; Barbey, P. The Adamawa-Yadé domain, a piece of Archaean crust in the Neoproterozoic Central African Orogenic belt (Bafia area, Cameroon). Precambrian Res. 2017, 299, 210–229. [Google Scholar] [CrossRef]
- Toteu, S.F.; De Wit, M.; Penaye, J.; Drost, K.; Tait, J.A.; Bouyo, M.H.; Van Schmus, W.R.; Jelsma, H.; Moloto-A-Kenguemba, G.R.; Filho, A.F.D.S.; et al. Geochronology and correlations in the Central African Fold Belt along the northern edge of the Congo Craton: New insights from U-Pb dating of zircons from Cameroon, Central African Republic, and south-western Chad. Gondwana Res. 2022, 107, 296–324. [Google Scholar] [CrossRef]
- Ndema Mbongue, J.L.; Ngnotue, T.; Ngo Nlend, C.D.; Nzenti, J.P.; Cheo Suh, E. Origin and Evolution of the Formation of the Cameroon Nyong Series in the Western Border of the Congo Craton. J. Geosci. Geomat. 2014, 2, 62–75. [Google Scholar] [CrossRef]
- Owona, S.; Ondoa, J.M.; Tichomirowa, M.; Ekodeck, G.E. The petrostructural characteristics and 207Pb/206Pb zircon data from the Ngomedzap-Akongo area (Nyong complex, SW-Cameroon). J. Geosci. 2020, 65, 201–219. [Google Scholar] [CrossRef]
- Owona, S.; Ratschbacher, L.; Ngapna, M.N.; Gulzar, A.M.; Ondoa, J.M.; Ekodeck, G.E. How diverse is the source? Age, provenance, reworking, and overprint of Precambrian meta-sedimentary rocks of West Gondwana, Cameroon, from zircon U-Pb geochronology. Precambrian Res. 2021, 359, 106220. [Google Scholar] [CrossRef]
- Kankeu, B.; Greiling, R.O.; Nzenti, J.P.; Ganno, S.; Danguene, P.Y.; Bassahak, J.; Hell, J.V. Contrasting Pan-African structural styles at the NW margin of the Congo Shield in Cameroon. J. Afr. Earth Sci. 2018, 146, 28–47. [Google Scholar] [CrossRef]
- Penaye, J.; Toteu, S.; Tchameni, R.; Van Schmus, W.; Tchakounté, J.; Ganwa, A.; Minyem, D.; Nsifa, E. The 2.1Ga West Central African Belt in Cameroon: Extension and evolution. J. Afr. Earth Sci. 2004, 39, 159–164. [Google Scholar] [CrossRef]
- Abeng, S.A.E.; Ndjigui, P.-D.; Beyanu, A.A.; Teutsong, T.; Bilong, P. Geochemistry of pyroxenites, amphibolites and their weathered products in the Nyong unit, SW Cameroon (NW border of Congo craton): Implications for Au–PGE exploration. J. Geochem. Explor. 2012, 114, 1–19. [Google Scholar] [CrossRef]
- Toteu, S.; Van Schmus, W.; Penaye, J.; Nyobé, J. UPb and SmN edvidence for Eburnian and Pan-African high-grade metamorphism in cratonic rocks of southern Cameroon. Precambrian Res. 1994, 67, 321–347. [Google Scholar] [CrossRef]
- Loose, D.; Schenk, V. 2.09 Ga old eclogites in the Eburnian-Transamazonian orogen of southern Cameroon: Significance for Palaeoproterozoic plate tectonics. Precambrian Res. 2018, 304, 1–11. [Google Scholar] [CrossRef]
- Nkoumbou, C.; Barbey, P.; Yonta-Ngouné, C.; Paquette, J.; Villiéras, F. Pre-collisional geodynamic context of the southern margin of the Pan-African fold belt in Cameroon. J. Afr. Earth Sci. 2014, 99, 245–260. [Google Scholar] [CrossRef]
- Owona, S.; Ratschbacher, L.; Afzal, M.G.; Nsangou Ngapna, M.; Mvondo Ondoa, J.; Ekodeck, G.E. New U–Pb Zircon Ages of Nyong Complex Meta-Plutonites: Implications for the Eburnean/Trans-Amazonian Orogeny in Southwestern Cameroon (Central Africa). Geol. J. 2021, 56, 1741–1755. [Google Scholar] [CrossRef]
- Chombong, N.N.; Suh, E.; Lehmann, B.; Vishiti, A.; Ilouga, D.C.; Shemang, E.; Tantoh, B.S.; Kedia, A.C. Host rock geochemistry, texture and chemical composition of magnetite in iron ore in the Neoarchaean Nyong unit in southern Cameroon. Appl. Earth Sci. 2017, 126, 129–145. [Google Scholar] [CrossRef]
- Toteu, S.F.; Penaye, J.; Deloule, E.; VanSchmus, W.; Tchameni, R. Diachronous evolution of volcano-sedimentary basins north of the Congo craton: Insights from U–Pb ion microprobe dating of zircons from the Poli, Lom and Yaoundé Groups (Cameroon). J. Afr. Earth Sci. 2006, 44, 428–442. [Google Scholar] [CrossRef]
- Penaye, J.; Toteu, S.F.; Van Schmus, W.R.; Nzenti, J.-P. U-Pb and Sm-Nd Preliminary Geochronologic Data on the Yaoundé Series, Cameroon: Re-Interpretation of the Granulitic Rocks as the Suture of a Collision in the Centrafrican Belt. C. R. Acad. Sci. Sér. 2 Méc. Phys. Chim. Sci. Univers Sci. Terre 1993, 317, 789–794. [Google Scholar]
- Feybesse, J.L.; Johan, V.; Maurizot, P.; Abessolo, A. Mise En Évidence d’une Nappe Synmétamorphe d’âge Eburnéen Dans La Partie NW Du Craton Zairois (SW Cameroun). Publ. Occas.-Cent. Int. Form. Échanges Géol. 1986, 10, 105–111. [Google Scholar]
- Mandeng, E.P.B.; Bidjeck, L.M.B.; Wambo, J.D.T.; Taku, A.; Betsi, T.B.; Ipan, A.S.; Nfada, L.T.; Dieudonné, L.B. Lithologic and structural mapping of the Abiete–Toko gold district in southern Cameroon, using Landsat 7 ETM+/SRTM. C. R. Geosci. 2018, 350, 130–140. [Google Scholar] [CrossRef]
- Sun, S.S.; McDonough, W.F. Chemical and isotopic systematics of oceanic basalts: Implications for mantle composition and processes. In Magmatism in the Ocean Basin; Geological Society Special Publication: London, UK, 1989; Volume 42, pp. 313–345. [Google Scholar]
- Taylor, S.R.; McLennan, S.M. The Continental Crust: Its Composition and Evolution; U.S. Department of Energy: Washington, DC, USA, 1985.
- Bau, M.; Dulski, P. Anthropogenic origin of positive gadolinium anomalies in river waters. Earth Planet. Sci. Lett. 1996, 143, 245–255. [Google Scholar] [CrossRef]
- McDonough, W.F.; Sun, S.-S. The composition of the Earth. Chem. Geol. 1995, 120, 223–253. [Google Scholar] [CrossRef]
- Polat, A.; Hofmann, A.; Rosing, M. Boninite-like volcanic rocks in the 3.7–3.8 Ga Isua greenstone belt, West Greenland: Geochemical evidence for intra-oceanic subduction zone processes in the early Earth. Chem. Geol. 2002, 184, 231–254. [Google Scholar] [CrossRef]
- Wang, C.; Peng, Z.; Tong, X.; Huang, H.; Zheng, M.; Zhang, L.; Zhai, M. Late Neoarchean supracrustal rocks from the Anshan-Benxi terrane, North China Craton: New geodynamic implications from the geochemical record. Am. J. Sci. 2017, 317, 1095–1148. [Google Scholar] [CrossRef]
- Sun, X.-H.; Zhu, X.-Q.; Tang, H.-S.; Zhang, Q.; Luo, T.-Y. The Gongchangling BIFs from the Anshan–Benxi Area, NE China: Petrological–Geochemical Characteristics and Genesis of High-Grade Iron Ores. Ore Geol. Rev. 2014, 60, 112–125. [Google Scholar] [CrossRef]
- Sun, X.-H.; Zhu, X.-Q.; Tang, H.-S.; Zhang, Q.; Luo, T.-Y.; Han, T. Protolith reconstruction and geochemical study on the wall rocks of Anshan BIFs, Northeast China: Implications for the provenance and tectonic setting. J. Geochem. Explor. 2014, 136, 65–75. [Google Scholar] [CrossRef]
- Sylvestre, G.; Laure, N.T.E.; Djibril, K.N.G.; Arlette, D.S.; Cyriel, M.; Timoléon, N.; Paul, N.J. A mixed seawater and hydrothermal origin of superior-type banded iron formation (BIF)-hosted Kouambo iron deposit, Palaeoproterozoic Nyong series, Southwestern Cameroon: Constraints from petrography and geochemistry. Ore Geol. Rev. 2017, 80, 860–875. [Google Scholar] [CrossRef]
- Large, R.R.; Gemmell, J.B.; Paulick, H.; Huston, D.L. The Alteration Box Plot: A Simple Approach to Understanding the Rela-tionship between Alteration Mineralogy and Lithogeochemistry Associated with Volcanic-Hosted Massive Sulfide Deposits. Econ. Geol. 2001, 96, 957–971. [Google Scholar] [CrossRef]
- Ishikawa, Y.; Sawaguchi, T.; Iwaya, S.; Horiuchi, M. Delineation of Prospecting Targets for Kuroko Deposits Based on Modes of Volcanism of Underlying Dacite and Alteration Haloes. Min. Geol. 1976, 26, 105–117. [Google Scholar] [CrossRef]
- Ndime, E.N.; Ganno, S.; Nzenti, J.P. Geochemistry and Pb–Pb Geochronology of the Neoarchean Nkout West Metamorphosed Banded Iron Formation, Southern Cameroon. Int. J. Earth Sci. 2019, 108, 1551–1570. [Google Scholar] [CrossRef]
- Fuanya, C.; Bolarinwa, A.T.; Kankeu, B.; Yongue, R.F.; Tangko, E.T.; Nkepguep, F.Y. Geochemical characteristics and petrogenesis of basic rocks in the Ako’ozam–Njabilobe area, Southwestern Cameroon: Implications for Au genesis. SN Appl. Sci. 2019, 1, 904. [Google Scholar] [CrossRef]
- Winchester, J.; Floyd, P. Geochemical discrimination of different magma series and their differentiation products using immobile elements. Chem. Geol. 1977, 20, 325–343. [Google Scholar] [CrossRef]
- Ross, P.-S.; Bédard, J.H. Magmatic affinity of modern and ancient subalkaline volcanic rocks determined from trace-element discriminant diagrams. Can. J. Earth Sci. 2009, 46, 823–839. [Google Scholar] [CrossRef]
- DePaolo, D.J. A neodymium and strontium isotopic study of the Mesozoic calc-alkaline granitic batholiths of the Sierra Nevada and Peninsular Ranges, California. J. Geophys. Res. Earth Surf. 1981, 86, 10470–10488. [Google Scholar] [CrossRef]
- Pearce, J.A. Geochemical fingerprinting of oceanic basalts with applications to ophiolite classification and the search for Archean oceanic crust. Lithos 2008, 100, 14–48. [Google Scholar] [CrossRef]
- Barth, M.G.; McDonough, W.F.; Rudnick, R.L. Tracking the budget of Nb and Ta in the continental crust. Chem. Geol. 2000, 165, 197–213. [Google Scholar] [CrossRef]
- Rudnick, R.L.; Gao, S. The role of lower crustal recycling in continent formation. Geochim. Cosmochim. Acta Suppl. 2003, 67, 403. [Google Scholar]
- Wilson, M. Igneous Petrogenesis; Springer: Dordrecht, The Netherlands, 1989; 466p. [Google Scholar] [CrossRef]
- Fan, W.-M.; Guo, F.; Wang, Y.-J.; Zhang, M. Late Mesozoic Volcanism in the Northern Huaiyang Tectono-Magmatic Belt, Central China: Partial Melts from a Lithospheric Mantle with Subducted Continental Crust Relicts beneath the Dabie Orogen? Chem. Geol. 2004, 209, 27–48. [Google Scholar] [CrossRef]
- Jung, C.; Jung, S.; Hoffer, E.; Berndt, J. Petrogenesis of Tertiary Mafic Alkaline Magmas in the Hocheifel, Germany. J. Pet. 2006, 47, 1637–1671. [Google Scholar] [CrossRef]
- Rooney, T.O. Geochemical evidence of lithospheric thinning in the southern Main Ethiopian Rift. Lithos 2010, 117, 33–48. [Google Scholar] [CrossRef]
- Geng, H.; Sun, M.; Yuan, C.; Zhao, G.; Xiao, W. Geochemical and geochronological study of early Carboniferous volcanic rocks from the West Junggar: Petrogenesis and tectonic implications. J. Southeast Asian Earth Sci. 2011, 42, 854–866. [Google Scholar] [CrossRef]
- Singh, S.P.; Subramanyam, K.S.V.; Manikyamba, C.; Santosh, M.; Singh, M.R.; Kumar, B.C. Geochemical Systematics of the Mauranipur-Babina Greenstone Belt, Bundelkhand Craton, Central India: Insights on Neoarchean Mantle Plume-Arc Accre-tion and Crustal Evolution. Geosci. Front. 2018, 9, 769–788. [Google Scholar] [CrossRef]
- Workman, R.K.; Hart, S.R. Major and trace element composition of the depleted MORB mantle (DMM). Earth Planet. Sci. Lett. 2005, 231, 53–72. [Google Scholar] [CrossRef]
- Bhat, I.M.; Ahmad, T.; Rao, D.S. The tectonic evolution of the Dras arc complex along the Indus Suture Zone, western Himalaya: Implications for the Neo-Tethys Ocean geodynamics. J. Geodyn. 2019, 124, 52–66. [Google Scholar] [CrossRef]
- Kelemen, P.B.; Hanghøj, K.; Greene, A.R. One View of the Geochemistry of Subduction-Related Magmatic Arcs, with an Emphasis on Primitive Andesite and Lower Crust; Elsevier: Amsterdam, The Netherlands, 2014. [Google Scholar] [CrossRef]
- Meng, E.; Liu, F.-L.; Liu, P.-H.; Liu, C.-H.; Yang, H.; Wang, F.; Shi, J.-R.; Cai, J. Petrogenesis and tectonic significance of Paleoproterozoic meta-mafic rocks from central Liaodong Peninsula, northeast China: Evidence from zircon U–Pb dating and in situ Lu–Hf isotopes, and whole-rock geochemistry. Precambrian Res. 2014, 247, 92–109. [Google Scholar] [CrossRef]
- Wang, X.; Peng, P.; Wang, C.; Yang, S. Petrogenesis of the 2115 Ma Haicheng mafic sills from the Eastern North China Craton: Implications for an intra-continental rifting. Gondwana Res. 2016, 39, 347–364. [Google Scholar] [CrossRef]
- Cabanis, B.; Lecolle, M. Le Diagramme La/10-Y/15-Nb/8: Un Outil Pour La Discrimination Des Séries Volcaniques et La Mise En Évidence Des Processus de Mélange et/Ou de Contamination Crustale. C. R. Acad. Sci. Sér. 2 Méc. Phys. Chim. Sci. Univers Sci. Terre 1989, 309, 2023–2029. [Google Scholar]
- Basta, F.F.; Maurice, A.E.; Fontboté, L.; Favarger, P.-Y. Petrology and Geochemistry of the Banded Iron Formation (BIF) of Wadi Karim and Um Anab, Eastern Desert, Egypt: Implications for the Origin of Neoproterozoic BIF. Precambrian Res. 2011, 187, 277–292. [Google Scholar] [CrossRef]
- Alexander, B.W.; Bau, M.; Andersson, P.; Dulski, P. Continentally-derived solutes in shallow Archean seawater: Rare earth element and Nd isotope evidence in iron formation from the 2.9Ga Pongola Supergroup, South Africa. Geochim. Cosmochim. Acta 2008, 72, 378–394. [Google Scholar] [CrossRef]
- Gourcerol, B.; Thurston, P.; Kontak, D.; Côté-Mantha, O.; Biczok, J. Depositional setting of Algoma-type banded iron formation. Precambrian Res. 2016, 281, 47–79. [Google Scholar] [CrossRef]
- Boström, K. Submarine volcanism as a source for iron. Earth Planet. Sci. Lett. 1970, 9, 348–354. [Google Scholar] [CrossRef]
- Condie, K.C. Chemical composition and evolution of the upper continental crust: Contrasting results from surface samples and shales. Chem. Geol. 1993, 104, 1–37. [Google Scholar] [CrossRef]
- Barrett, T. Chemistry and mineralogy of Jurassic bedded chert overlying ophiolites in the North Apennines, Italy. Chem. Geol. 1981, 34, 289–317. [Google Scholar] [CrossRef]
- Marchig, V.; Gundlach, H.; Möller, P.; Schley, F. Some geochemical indicators for discrimination between diagenetic and hydrothermal metalliferous sediments. Mar. Geol. 1982, 50, 241–256. [Google Scholar] [CrossRef]
- Planavsky, N.; Bekker, A.; Rouxel, O.J.; Kamber, B.; Hofmann, A.; Knudsen, A.; Lyons, T.W. Rare Earth Element and Yttrium Compositions of Archean and Paleoproterozoic Fe Formations Revisited: New Perspectives on the Significance and Mecha-nisms of Deposition. Geochim. Cosmochim. Acta 2010, 74, 6387–6405. [Google Scholar] [CrossRef]
- Bau, M. Scavenging of dissolved yttrium and rare earths by precipitating iron oxyhydroxide: Experimental evidence for Ce oxidation, Y-Ho fractionation, and lanthanide tetrad effect. Geochim. Cosmochim. Acta 1999, 63, 67–77. [Google Scholar] [CrossRef]
- Bau, M.; Dulski, P. Comparing yttrium and rare earths in hydrothermal fluids from the Mid-Atlantic Ridge: Implications for Y and REE behaviour during near-vent mixing and for the Y/Ho ratio of Proterozoic seawater. Chem. Geol. 1999, 155, 77–90. [Google Scholar] [CrossRef]
- Danielson, A.; Möller, P.; Dulski, P. The europium anomalies in banded iron formations and the thermal history of the oceanic crust. Chem. Geol. 1992, 97, 89–100. [Google Scholar] [CrossRef]
- Chen, Y.; Fu, S. Variation of Ree Patterns in Early Precambrian Sediments—Theoretical Study And Evidence from the Southern Margin of the North China Craton. Chin. Sci. Bull. 1991, 36, 1100–1104. [Google Scholar]
- Deng, X.-H.; Chen, Y.-J.; Yao, J.-M.; Bagas, L.; Tang, H.-S. Fluorite REE-Y (REY) geochemistry of the ca. 850 Ma Tumen molybdenite–fluorite deposit, eastern Qinling, China: Constraints on ore genesis. Ore Geol. Rev. 2014, 63, 532–543. [Google Scholar] [CrossRef]
- Frei, R.; Dahl, P.S.; Duke, E.F.; Frei, K.M.; Hansen, T.R.; Frandsson, M.M.; Jensen, L.A. Trace Element and Isotopic Charac-terization of Neoarchean and Paleoproterozoic Iron Formations in the Black Hills (South Dakota, USA): Assessment of Chemical Change during 2.9–1.9 Ga Deposition Bracketing the 2.4–2.2 Ga First Rise of Atmospheric Oxygen. Precambrian Res. 2008, 162, 441–474. [Google Scholar] [CrossRef]
- Tang, H.-S.; Chen, Y.-J.; Santosh, M.; Zhong, H.; Yang, T. REE geochemistry of carbonates from the Guanmenshan Formation, Liaohe Group, NE Sino-Korean Craton: Implications for seawater compositional change during the Great Oxidation Event. Precambrian Res. 2012, 227, 316–336. [Google Scholar] [CrossRef]
- Teutsong, T.; Bontognali, T.R.; Ndjigui, P.-D.; Vrijmoed, J.C.; Teagle, D.; Cooper, M.; Vance, D. Petrography and geochemistry of the Mesoarchean Bikoula banded iron formation in the Ntem complex (Congo craton), Southern Cameroon: Implications for its origin. Ore Geol. Rev. 2017, 80, 267–288. [Google Scholar] [CrossRef]
- Braga, F.C.S.; Rosière, C.A.; Queiroga, G.N.; Rolim, V.K.; Santos, J.O.S.; McNaughton, N.J. The Statherian itabirite-bearing sequence from the Morro Escuro Ridge, Santa Maria de Itabira, Minas Gerais, Brazil. J. South Am. Earth Sci. 2015, 58, 33–53. [Google Scholar] [CrossRef]
- Sylvestre, G.; Timoleon, N.; Djibril, K.N.G.; Paul, N.J.; Marianne, N.F. Petrology and geochemistry of the banded iron-formations from Ntem complex greenstones belt, Elom area, Southern Cameroon: Implications for the origin and depositional environment. Geochemistry 2015, 75, 375–387. [Google Scholar] [CrossRef]
- Alibo, D.S.; Nozaki, Y. Rare earth elements in seawater: Particle association, shale-normalization, and Ce oxidation. Geochim. Cosmochim. Acta 1999, 63, 363–372. [Google Scholar] [CrossRef]
- Beukes, N.J.; Gutzmer, J. Origin and Paleoenvironmental Significance of Major Iron Formations at the Arche-an-Paleoproterozoic Boundary. In Reviews in Economic Geoly; Society of Economic Geologists: Littleton, CO, USA, 2008; pp. 5–47. [Google Scholar]
- Huston, D.L.; Logan, G.A. Barite, BIFs and bugs: Evidence for the evolution of the Earth’s early hydrosphere. Earth Planet. Sci. Lett. 2004, 220, 41–55. [Google Scholar] [CrossRef] [Green Version]


| Rock Type | Mafic Granulite | Garnet Amphibolite | |||||||||
|---|---|---|---|---|---|---|---|---|---|---|---|
| Major Elements | IS20 | IS40 | IS26 | IS17 | IS15b | IS24 | IS27b | IS28 | IS33 | IS37 | IS39 |
| SiO2 | 44.70 | 48.80 | 50.60 | 51.20 | 44.10 | 44.80 | 49.30 | 46.50 | 49.10 | 50.80 | 46.50 |
| TiO2 | 0.57 | 0.90 | 2.24 | 1.77 | 1.84 | 0.64 | 1.37 | 1.46 | 1.34 | 0.99 | 0.77 |
| Al2O3 | 14.25 | 14.75 | 11.95 | 13.50 | 12.90 | 14.05 | 13.20 | 14.35 | 12.05 | 13.30 | 13.65 |
| Fe2O3 | 14.65 | 16.60 | 21.50 | 18.15 | 18.10 | 12.25 | 17.45 | 15.80 | 18.60 | 16.45 | 14.25 |
| MgO | 9.91 | 5.92 | 4.01 | 5.07 | 7.72 | 11.30 | 6.28 | 8.99 | 5.50 | 6.37 | 11.40 |
| MnO | 0.21 | 0.27 | 0.25 | 0.22 | 0.26 | 0.17 | 0.21 | 0.20 | 0.22 | 0.21 | 0.20 |
| CaO | 13.95 | 8.28 | 7.82 | 8.14 | 11.85 | 13.25 | 9.31 | 7.73 | 9.37 | 8.65 | 9.33 |
| Na2O | 1.70 | 1.48 | 0.41 | 1.16 | 1.25 | 1.70 | 1.06 | 2.04 | 1.58 | 1.15 | 1.73 |
| K2O | 0.29 | 0.55 | 0.07 | 0.48 | 0.53 | 0.54 | 0.43 | 0.75 | 0.45 | 0.57 | 0.91 |
| Cr2O3 | 0.07 | 0.01 | <0.01 | 0.01 | 0.02 | 0.06 | 0.01 | 0.02 | 0.02 | 0.02 | 0.12 |
| P2O5 | 0.05 | 0.32 | 0.25 | 0.22 | 0.30 | 0.05 | 0.13 | 0.18 | 0.19 | 0.17 | 0.06 |
| LOI | 0.04 | 1.02 | −0.97 | 0.05 | 0.38 | 0.49 | −0.15 | 2.21 | 0.17 | 0.41 | 1.71 |
| Total | 100.39 | 98.92 | 98.13 | 99.98 | 99.26 | 99.30 | 98.61 | 100.24 | 98.60 | 99.10 | 100.65 |
| mg# | 57.27 | 41.40 | 26.98 | 35.62 | 45.80 | 64.63 | 41.62 | 52.99 | 36.94 | 43.41 | 61.31 |
| K2O/Na2O | 0.17 | 0.37 | 0.17 | 0.41 | 0.42 | 0.32 | 0.41 | 0.37 | 0.28 | 0.50 | 0.53 |
| Trace and rare earth elements | |||||||||||
| Cr | 460.00 | 100.00 | 20.00 | 80.00 | 150.00 | 440.00 | 80.00 | 120.00 | 130.00 | 100.00 | 820.00 |
| Sn | 1.00 | 1.00 | 2.00 | 1.00 | 1.00 | 1.00 | 1.00 | 1.00 | 1.00 | 1.00 | 1.00 |
| V | 361.00 | 287.00 | 392.00 | 391.00 | 475.00 | 258.00 | 429.00 | 392.00 | 242.00 | 338.00 | 231.00 |
| Ba | 24.10 | 82.60 | 6.00 | 103.50 | 90.80 | 31.60 | 63.60 | 126.50 | 52.80 | 53.80 | 70.80 |
| Rb | 2.50 | 7.30 | 1.20 | 15.00 | 8.90 | 2.90 | 7.50 | 10.00 | 9.10 | 5.30 | 10.60 |
| Ga | 16.80 | 13.70 | 18.70 | 15.00 | 18.80 | 13.30 | 16.90 | 18.40 | 18.70 | 14.10 | 16.30 |
| Cs | 0.02 | 0.17 | 0.05 | 0.65 | 0.44 | 0.01 | 0.30 | 0.18 | 0.12 | 0.07 | 0.31 |
| Th | 0.15 | 0.93 | 1.33 | 1.64 | <0.5 | 0.07 | 0.40 | 0.16 | 0.69 | 0.50 | 0.44 |
| U | 0.10 | 0.51 | 0.31 | 2.63 | 0.24 | 0.08 | 0.24 | 0.27 | 0.27 | 0.35 | 0.31 |
| Sr | 48.40 | 86.40 | 20.70 | 62.10 | 69.50 | 37.50 | 32.30 | 53.10 | 57.00 | 38.60 | 40.70 |
| Nb | 0.60 | 3.70 | 6.90 | 6.60 | 6.60 | 1.30 | 4.70 | 4.70 | 6.30 | 3.10 | 3.00 |
| Ta | <0.1 | 0.30 | 0.30 | 0.30 | 0.30 | <0.1 | 0.30 | 0.20 | 9.70 | <0.1 | 0.10 |
| Hf | 1.30 | 1.80 | 4.80 | 3.80 | 3.40 | 1.10 | 2.60 | 2.80 | 3.80 | 2.40 | 2.50 |
| Zr | 37.00 | 76.00 | 176.00 | 140.00 | 115.00 | 34.00 | 91.00 | 103.00 | 125.00 | 87.00 | 94.00 |
| Y | 16.70 | 36.10 | 53.10 | 39.20 | 34.20 | 16.20 | 31.50 | 35.10 | 37.80 | 29.40 | 22.50 |
| La | 2.10 | 7.00 | 9.80 | 8.70 | 6.60 | 2.10 | 4.60 | 7.30 | 6.60 | 5.10 | 4.00 |
| Ce | 6.80 | 16.30 | 26.10 | 20.90 | 19.50 | 6.00 | 13.20 | 21.30 | 18.10 | 13.40 | 10.00 |
| Pr | 1.19 | 2.43 | 3.51 | 2.82 | 2.97 | 0.93 | 2.09 | 3.24 | 2.68 | 1.87 | 1.54 |
| Nd | 7.30 | 11.30 | 18.00 | 14.60 | 15.00 | 4.80 | 10.80 | 17.10 | 14.50 | 9.20 | 7.10 |
| Sm | 2.58 | 3.19 | 5.78 | 4.35 | 4.37 | 1.63 | 3.77 | 5.19 | 4.04 | 2.80 | 2.19 |
| Eu | 0.89 | 1.14 | 1.89 | 1.59 | 1.54 | 0.69 | 1.49 | 1.50 | 1.56 | 0.99 | 0.64 |
| Gd | 2.62 | 4.07 | 8.14 | 6.14 | 5.11 | 2.30 | 4.97 | 5.63 | 5.99 | 3.69 | 2.72 |
| Tb | 0.43 | 0.81 | 1.48 | 1.07 | 0.88 | 0.41 | 0.84 | 0.93 | 1.03 | 0.69 | 0.56 |
| Dy | 3.14 | 5.49 | 9.93 | 7.80 | 6.44 | 2.86 | 5.74 | 6.33 | 6.88 | 5.20 | 3.66 |
| Ho | 0.64 | 1.29 | 2.06 | 1.49 | 1.29 | 0.63 | 1.27 | 1.30 | 1.42 | 1.15 | 0.76 |
| Er | 1.98 | 3.84 | 6.28 | 4.50 | 4.08 | 2.17 | 3.77 | 3.77 | 4.45 | 3.71 | 2.44 |
| Tm | 0.24 | 0.59 | 0.77 | 0.62 | 0.50 | 0.26 | 0.50 | 0.49 | 0.56 | 0.42 | 0.34 |
| Yb | 1.85 | 4.01 | 6.15 | 4.24 | 3.99 | 2.03 | 3.58 | 3.84 | 4.54 | 3.45 | 2.89 |
| Lu | 0.25 | 0.65 | 0.85 | 0.63 | 0.56 | 0.29 | 0.52 | 0.52 | 0.60 | 0.51 | 0.47 |
| ΣREE | 32.01 | 62.11 | 100.74 | 79.45 | 72.83 | 27.10 | 57.14 | 78.44 | 72.95 | 52.18 | 39.31 |
| (La/Yb)CN | 0.77 | 1.19 | 1.08 | 1.39 | 1.12 | 0.70 | 0.87 | 1.29 | 0.99 | 1.00 | 0.94 |
| (La/Sm)CN | 0.51 | 1.37 | 1.06 | 1.25 | 0.94 | 0.80 | 0.76 | 0.88 | 1.02 | 1.14 | 1.14 |
| (Gd/Yb)CN | 1.15 | 0.82 | 1.07 | 1.17 | 1.04 | 0.92 | 1.12 | 1.19 | 1.07 | 0.87 | 0.76 |
| (Eu/Eu*)CN | 1.04 | 0.96 | 0.84 | 0.94 | 0.99 | 1.09 | 1.05 | 0.85 | 0.97 | 0.94 | 0.80 |
| (Ce/Ce*)CN | 1.04 | 0.96 | 1.08 | 1.02 | 1.07 | 1.04 | 1.03 | 1.06 | 1.04 | 1.05 | 0.97 |
| Th/Nb | 0.25 | 0.25 | 0.19 | 0.25 | 0.00 | 0.05 | 0.09 | 0.03 | 0.11 | 0.16 | 0.15 |
| Nb/Y | 0.04 | 0.10 | 0.13 | 0.17 | 0.19 | 0.08 | 0.15 | 0.13 | 0.17 | 0.11 | 0.13 |
| La/Nb | 3.50 | 1.89 | 1.42 | 1.32 | 1.00 | 1.62 | 0.98 | 1.55 | 1.05 | 1.65 | 1.33 |
| Dy/Yb | 1.70 | 1.37 | 1.61 | 1.84 | 1.61 | 1.41 | 1.60 | 1.65 | 1.52 | 1.51 | 1.27 |
| Zr/Nb | 61.67 | 20.54 | 25.51 | 21.21 | 17.42 | 26.15 | 19.36 | 21.91 | 19.84 | 28.06 | 31.33 |
| Zr/Hf | 28.46 | 42.22 | 36.67 | 36.84 | 33.82 | 30.91 | 35.00 | 36.79 | 32.89 | 36.25 | 37.60 |
| Th/Yb | 0.08 | 0.23 | 0.22 | 0.39 | 0.01 | 0.03 | 0.11 | 0.04 | 0.15 | 0.14 | 0.15 |
| Rock Type | BIF | SBIF | |||||||
|---|---|---|---|---|---|---|---|---|---|
| Major Elements | IS13 | IS50 | IS51 | IS52 | IS18 | IS19 | IS35 | IS41 | IS54 |
| SiO2 | 44.40 | 60.78 | 59.02 | 59.45 | 43.70 | 43.50 | 43.30 | 45.70 | 47.26 |
| TiO2 | 0.12 | 0.07 | 0.07 | 0.05 | 0.01 | 0.04 | 0.03 | 0.08 | <0.01 |
| Al2O3 | 1.83 | 2.37 | 2.52 | 1.84 | 0.26 | 0.94 | 0.70 | 0.99 | 0.74 |
| Fe2O3 | 48.40 | 26.37 | 26.05 | 27.68 | 55.20 | 51.30 | 53.20 | 50.20 | 49.60 |
| MgO | 2.55 | 5.27 | 5.98 | 5.73 | 1.94 | 1.94 | 2.08 | 2.21 | 1.82 |
| MnO | 0.04 | 0.40 | 0.46 | 0.46 | 0.03 | 0.04 | 0.03 | 0.04 | 0.05 |
| CaO | 1.46 | 2.44 | 3.39 | 2.76 | 1.16 | 1.10 | 1.03 | 0.75 | 1.10 |
| Na2O | 0.52 | 0.14 | 0.18 | 0.10 | 0.04 | 0.27 | 0.10 | 0.01 | 0.20 |
| K2O | 0.47 | 1.16 | 1.20 | 0.84 | 0.06 | 0.40 | 0.08 | 0.03 | 0.32 |
| Cr2O3 | 0.01 | 0.00 | 0.00 | 0.00 | <0.01 | 0.01 | 0.01 | 0.01 | 0.00 |
| P2O5 | 0.12 | 0.09 | 0.07 | 0.09 | 0.09 | 0.16 | 0.14 | 0.11 | 0.10 |
| LOI | −0.69 | 0.80 | 0.90 | 0.90 | −1.32 | −1.20 | −0.88 | −0.58 | −1.30 |
| Total | 99.24 | 99.88 | 99.87 | 99.87 | 101.17 | 98.51 | 99.82 | 99.56 | 99.96 |
| Fe | 33.88 | 18.46 | 18.24 | 19.38 | 38.64 | 35.91 | 37.24 | 35.14 | 34.72 |
| Fe/Si | 1.63 | 0.65 | 0.66 | 0.70 | 1.89 | 1.77 | 1.84 | 1.65 | 1.57 |
| Trace and rare earth elements | |||||||||
| Sn | <1 | <1 | <1 | <1 | <1 | <1 | <1 | <1 | <1 |
| V | 28.00 | <8 | <8 | <8 | 6.00 | 13.00 | 9.00 | 32.00 | <8 |
| Ba | 66.10 | 71.00 | 74.00 | 39.00 | 9.70 | 134.00 | 5.10 | 3.80 | 74.00 |
| Rb | 23.60 | 85.40 | 88.00 | 54.50 | 2.80 | 33.70 | 3.40 | 1.90 | 15.90 |
| Ga | 3.50 | 1.50 | 2.40 | 1.40 | 0.50 | 1.90 | 1.00 | 3.40 | 3.60 |
| Cs | 0.77 | 8.70 | 8.70 | 4.40 | 0.07 | 0.88 | 0.10 | 0.14 | 0.40 |
| Th | 1.23 | 1.50 | 1.30 | 1.10 | 0.05 | <0.05 | 0.13 | 0.16 | <0.2 |
| U | 0.32 | 0.30 | 0.30 | 0.20 | 0.10 | 0.08 | 0.38 | 0.09 | 0.10 |
| Sr | 10.50 | 8.90 | 11.50 | 6.60 | 7.10 | 20.70 | 5.00 | 5.30 | 15.00 |
| Nb | 1.00 | 0.50 | 0.60 | 0.40 | 0.20 | 0.40 | 1.00 | 0.70 | <0.1 |
| Ta | <0.1 | <0.1 | <0.1 | <0.1 | <0.1 | <0.1 | 0.10 | <0.1 | <0.1 |
| Hf | 0.50 | 0.40 | 0.50 | 0.30 | 0.20 | 0.20 | 0.20 | 0.20 | 0.10 |
| Zr | 18.00 | 17.00 | 16.90 | 12.40 | 4.00 | 7.00 | 7.00 | 5.00 | 3.70 |
| Y | 9.10 | 6.60 | 7.50 | 6.80 | 5.80 | 7.20 | 5.90 | 5.50 | 6.90 |
| La | 6.00 | 6.80 | 6.50 | 6.20 | 1.70 | 2.50 | 1.40 | 3.70 | 3.20 |
| Ce | 11.40 | 12.70 | 12.50 | 12.00 | 3.50 | 5.90 | 3.50 | 7.20 | 5.30 |
| Pr | 1.29 | 1.36 | 1.31 | 1.36 | 0.43 | 0.74 | 0.44 | 0.92 | 0.62 |
| Nd | 5.00 | 5.30 | 5.20 | 5.40 | 1.80 | 3.10 | 2.30 | 3.10 | 2.70 |
| Sm | 1.15 | 1.00 | 1.08 | 0.98 | 0.44 | 0.71 | 0.54 | 0.84 | 0.54 |
| Eu | 0.66 | 0.45 | 0.45 | 0.45 | 0.36 | 0.47 | 0.36 | 0.38 | 0.35 |
| Gd | 1.27 | 1.19 | 1.16 | 1.10 | 0.70 | 0.95 | 0.74 | 0.69 | 0.87 |
| Tb | 0.17 | 0.18 | 0.18 | 0.17 | 0.10 | 0.13 | 0.11 | 0.12 | 0.12 |
| Dy | 1.43 | 1.05 | 1.04 | 1.14 | 0.86 | 1.02 | 0.89 | 0.75 | 0.76 |
| Ho | 0.30 | 0.25 | 0.26 | 0.24 | 0.20 | 0.22 | 0.17 | 0.20 | 0.18 |
| Er | 0.93 | 0.74 | 0.79 | 0.70 | 0.59 | 0.64 | 0.56 | 0.43 | 0.55 |
| Tm | 0.09 | 0.10 | 0.11 | 0.10 | 0.05 | 0.05 | 0.05 | 0.07 | 0.08 |
| Yb | 0.81 | 0.74 | 0.82 | 0.68 | 0.66 | 0.66 | 0.56 | 0.41 | 0.51 |
| Lu | 0.09 | 0.11 | 0.13 | 0.11 | 0.06 | 0.04 | 0.04 | 0.09 | 0.08 |
| ∑REE-Y | 39.69 | 38.57 | 39.03 | 37.43 | 17.25 | 24.33 | 17.56 | 24.40 | 22.76 |
| (Eu/Eu*)SN | 2.68 | 1.94 | 1.86 | 2.01 | 3.17 | 2.83 | 2.72 | 2.14 | 2.54 |
| (Ce/Ce*)SN | 0.94 | 0.96 | 0.99 | 0.95 | 0.94 | 0.99 | 1.02 | 0.90 | 0.86 |
| (La/La*)SN | 1.10 | 1.19 | 1.23 | 1.13 | 1.12 | 0.96 | 2.66 | 0.75 | 1.63 |
| (Gd/Gd*)SN | 1.35 | 1.26 | 1.21 | 1.22 | 1.41 | 1.40 | 1.32 | 1.03 | 1.45 |
| (Y/Y*)SN | 0.86 | 0.80 | 0.89 | 0.81 | 0.87 | 0.94 | 0.94 | 0.88 | 1.16 |
| (Pr/Pr*)SN | 1.01 | 0.98 | 0.96 | 0.99 | 1.00 | 1.01 | 0.89 | 1.15 | 0.96 |
| (Eu/Eu*)CN | 1.66 | 1.26 | 1.23 | 1.32 | 1.98 | 1.74 | 1.74 | 1.52 | 1.56 |
| (Eu/Eu*)NASC | 2.70 | 1.97 | 1.88 | 2.04 | 3.26 | 2.88 | 2.78 | 2.16 | 2.61 |
| Y/Ho | 30.33 | 26.40 | 28.85 | 28.33 | 29.00 | 32.73 | 34.71 | 27.50 | 38.33 |
| Pr/Yb | 1.59 | 1.84 | 1.60 | 2.00 | 0.65 | 1.12 | 0.79 | 2.24 | 1.22 |
| Th/U | 3.84 | 5.00 | 4.33 | 5.50 | 0.50 | 0.31 | 0.34 | 1.78 | 1.00 |
Publisher’s Note: MDPI stays neutral with regard to jurisdictional claims in published maps and institutional affiliations. |
© 2022 by the authors. Licensee MDPI, Basel, Switzerland. This article is an open access article distributed under the terms and conditions of the Creative Commons Attribution (CC BY) license (https://creativecommons.org/licenses/by/4.0/).
Share and Cite
Swiffa Fajong, I.; Nzepang Tankwa, M.; Fossi, D.H.; Ganno, S.; Moudioh, C.; Soh Tamehe, L.; Suh, C.E.; Nzenti, J.P. Lithostratigraphy, Origin, and Geodynamic Setting of Iron Formations and Host Rocks of the Anyouzok Region, Congo Craton, Southwestern Cameroon. Minerals 2022, 12, 1198. https://0-doi-org.brum.beds.ac.uk/10.3390/min12101198
Swiffa Fajong I, Nzepang Tankwa M, Fossi DH, Ganno S, Moudioh C, Soh Tamehe L, Suh CE, Nzenti JP. Lithostratigraphy, Origin, and Geodynamic Setting of Iron Formations and Host Rocks of the Anyouzok Region, Congo Craton, Southwestern Cameroon. Minerals. 2022; 12(10):1198. https://0-doi-org.brum.beds.ac.uk/10.3390/min12101198
Chicago/Turabian StyleSwiffa Fajong, Isaac, Marvine Nzepang Tankwa, Donald Hermann Fossi, Sylvestre Ganno, Cyriel Moudioh, Landry Soh Tamehe, Cheo Emmanuel Suh, and Jean Paul Nzenti. 2022. "Lithostratigraphy, Origin, and Geodynamic Setting of Iron Formations and Host Rocks of the Anyouzok Region, Congo Craton, Southwestern Cameroon" Minerals 12, no. 10: 1198. https://0-doi-org.brum.beds.ac.uk/10.3390/min12101198