
Can Weathering of Banded Iron Formations Generate Natural Hydrogen? Evidence from Australia, Brazil and South Africa


Abstract
:1. Introduction
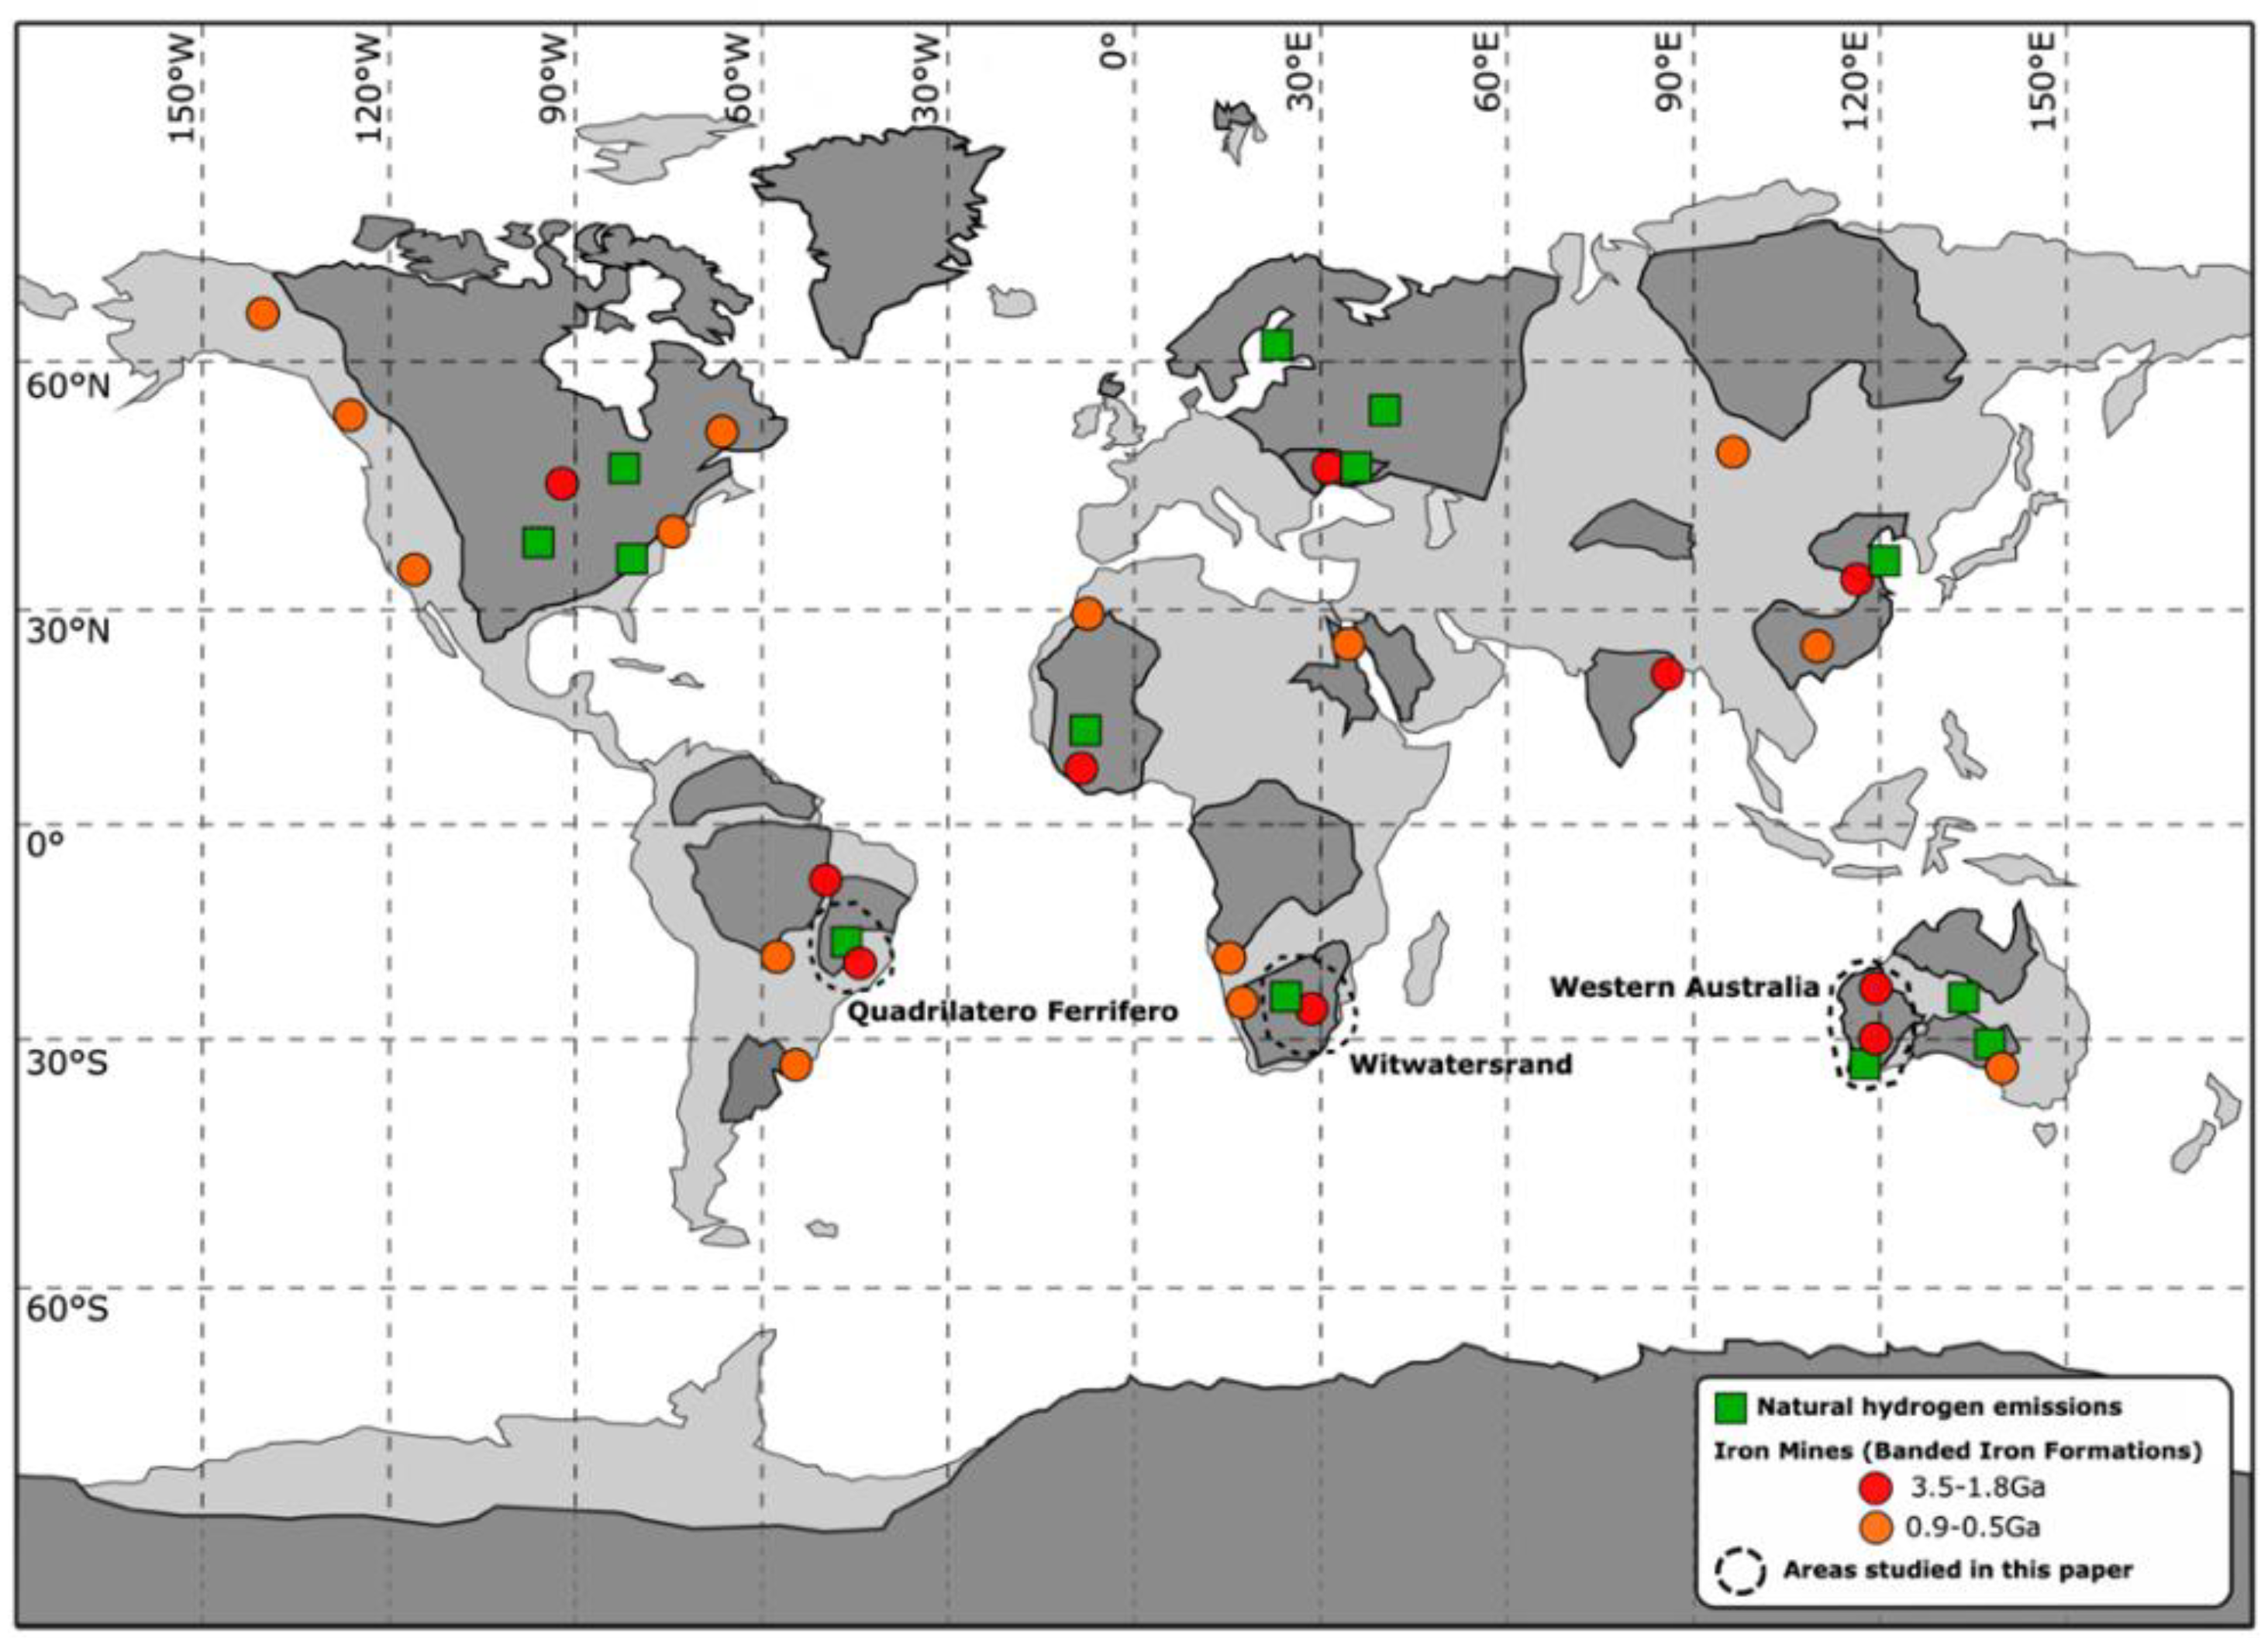
1.1. Global Context
1.2. An Iron Rich Facies: The Banded Iron Formations
1.3. Proxy of H2 Emanations: Sub-Circular Depressions
1.4. Aim of the Study
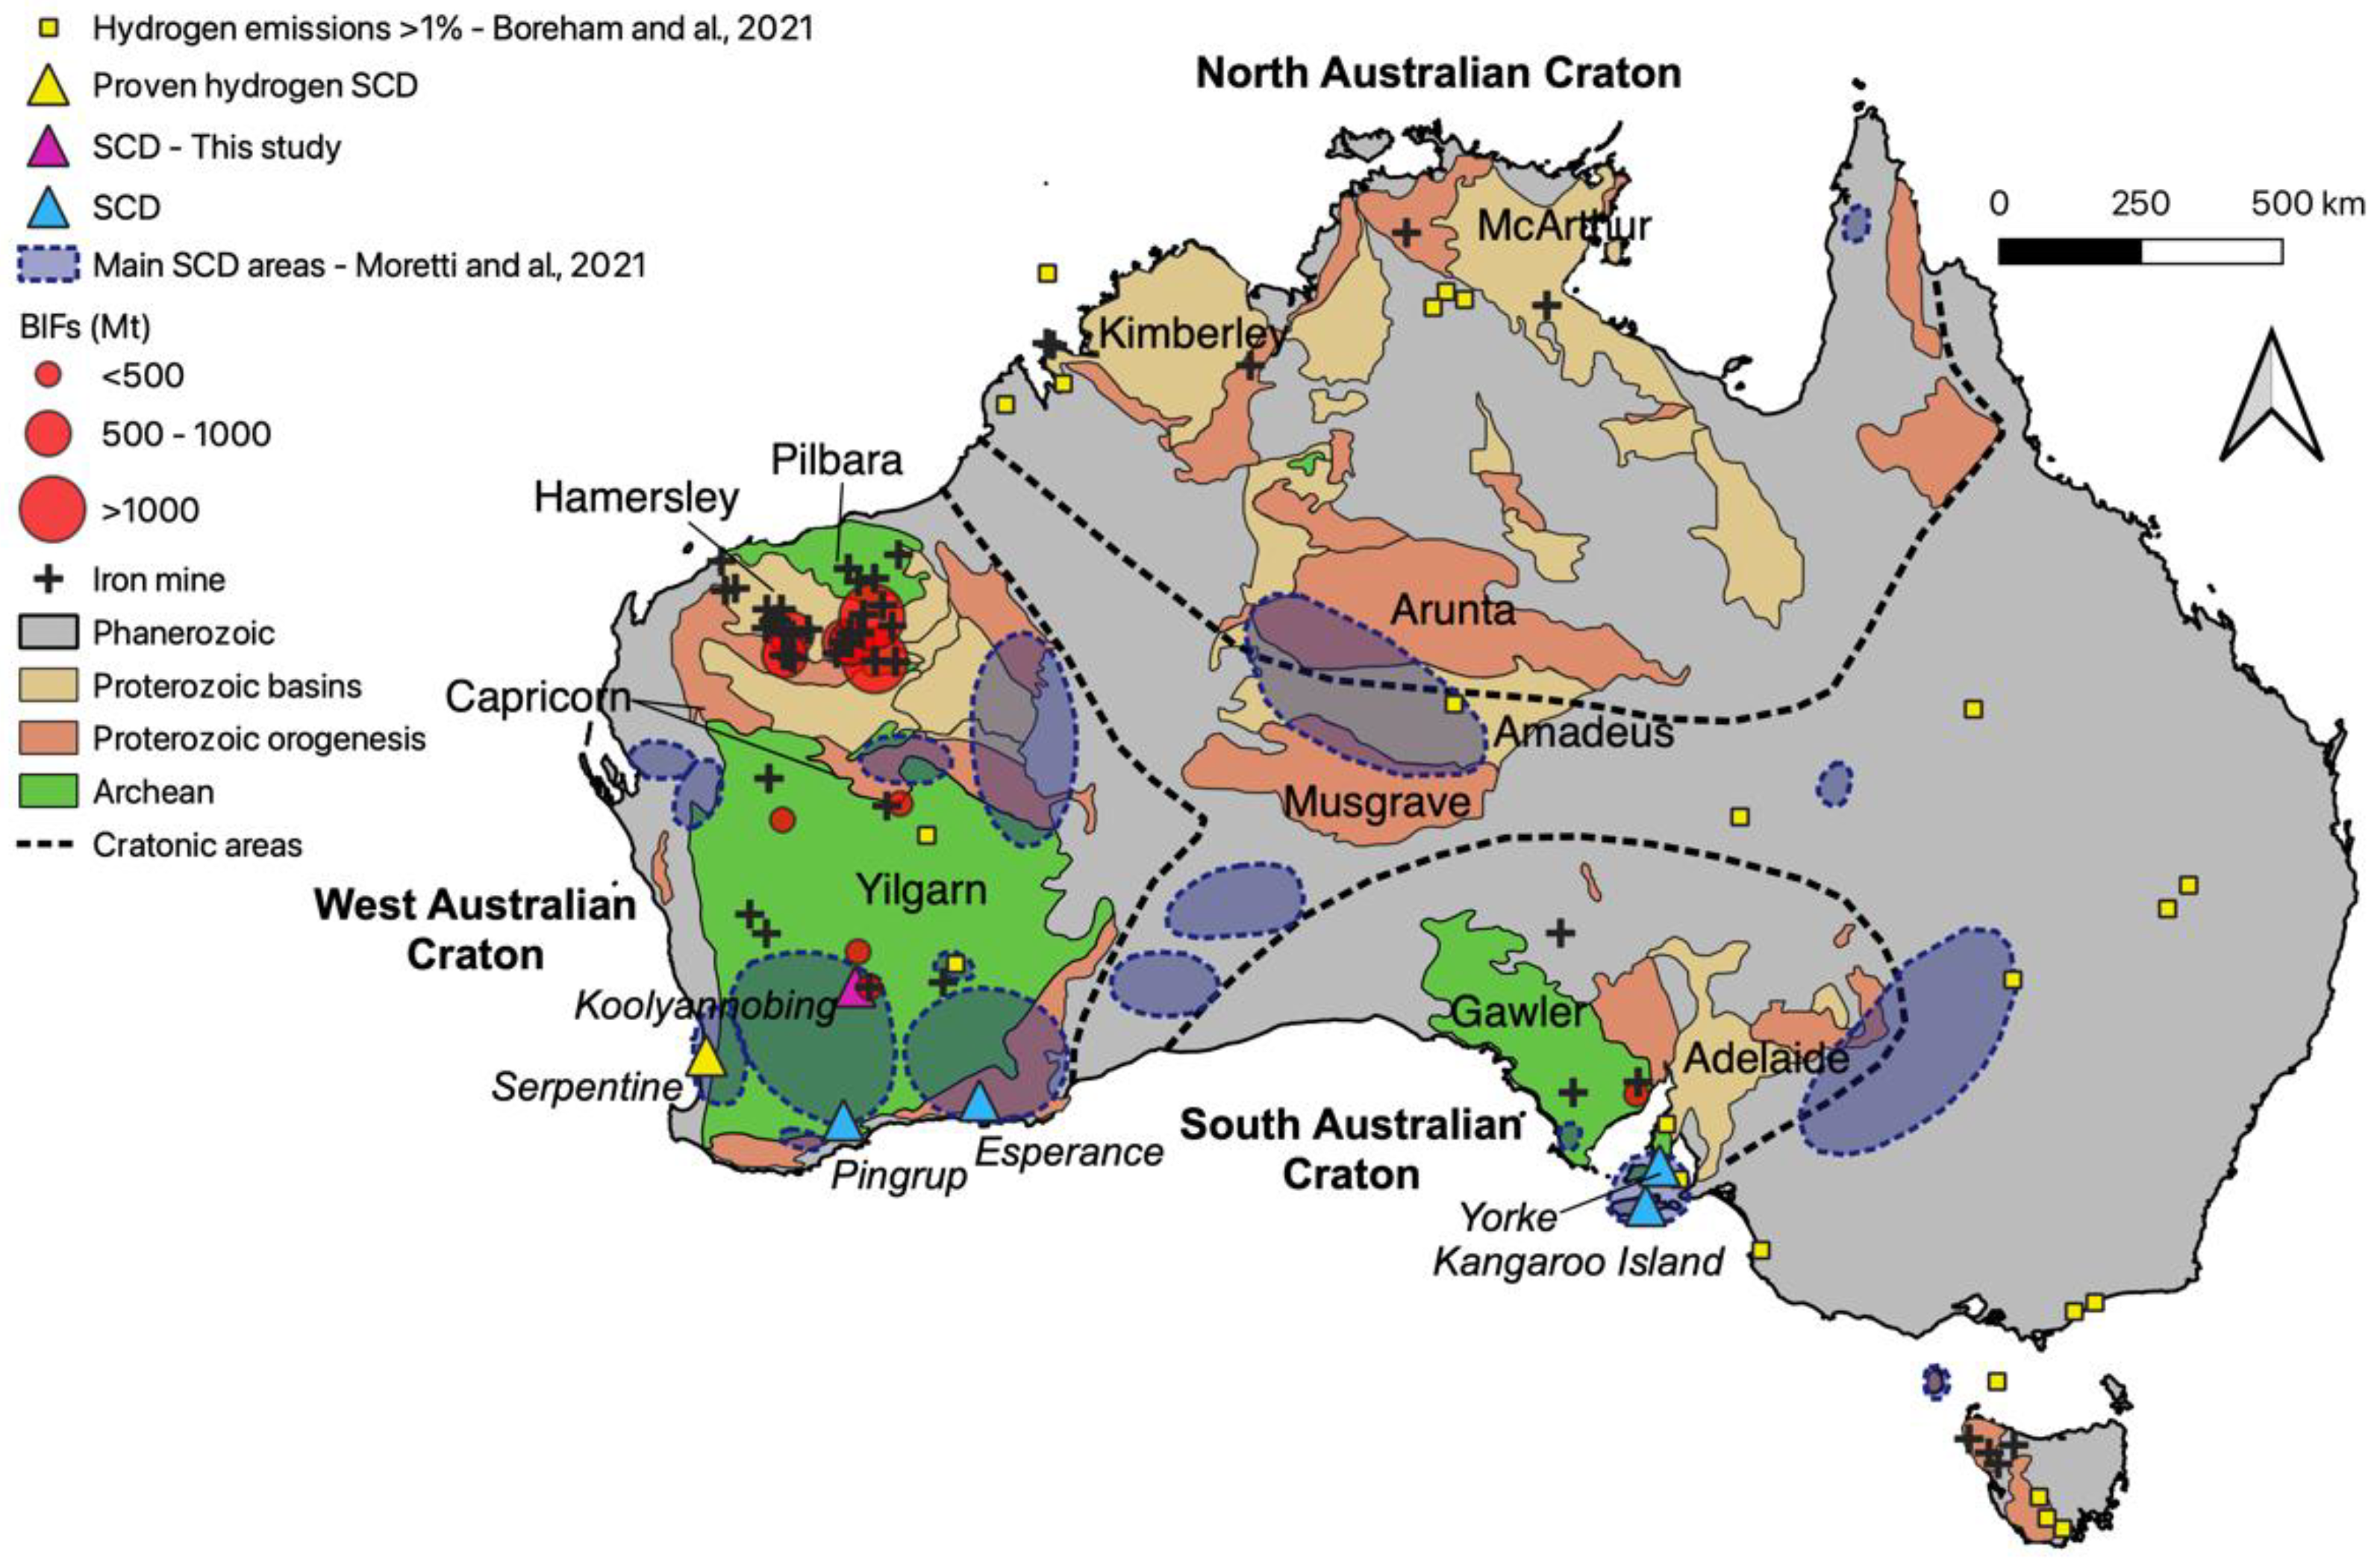
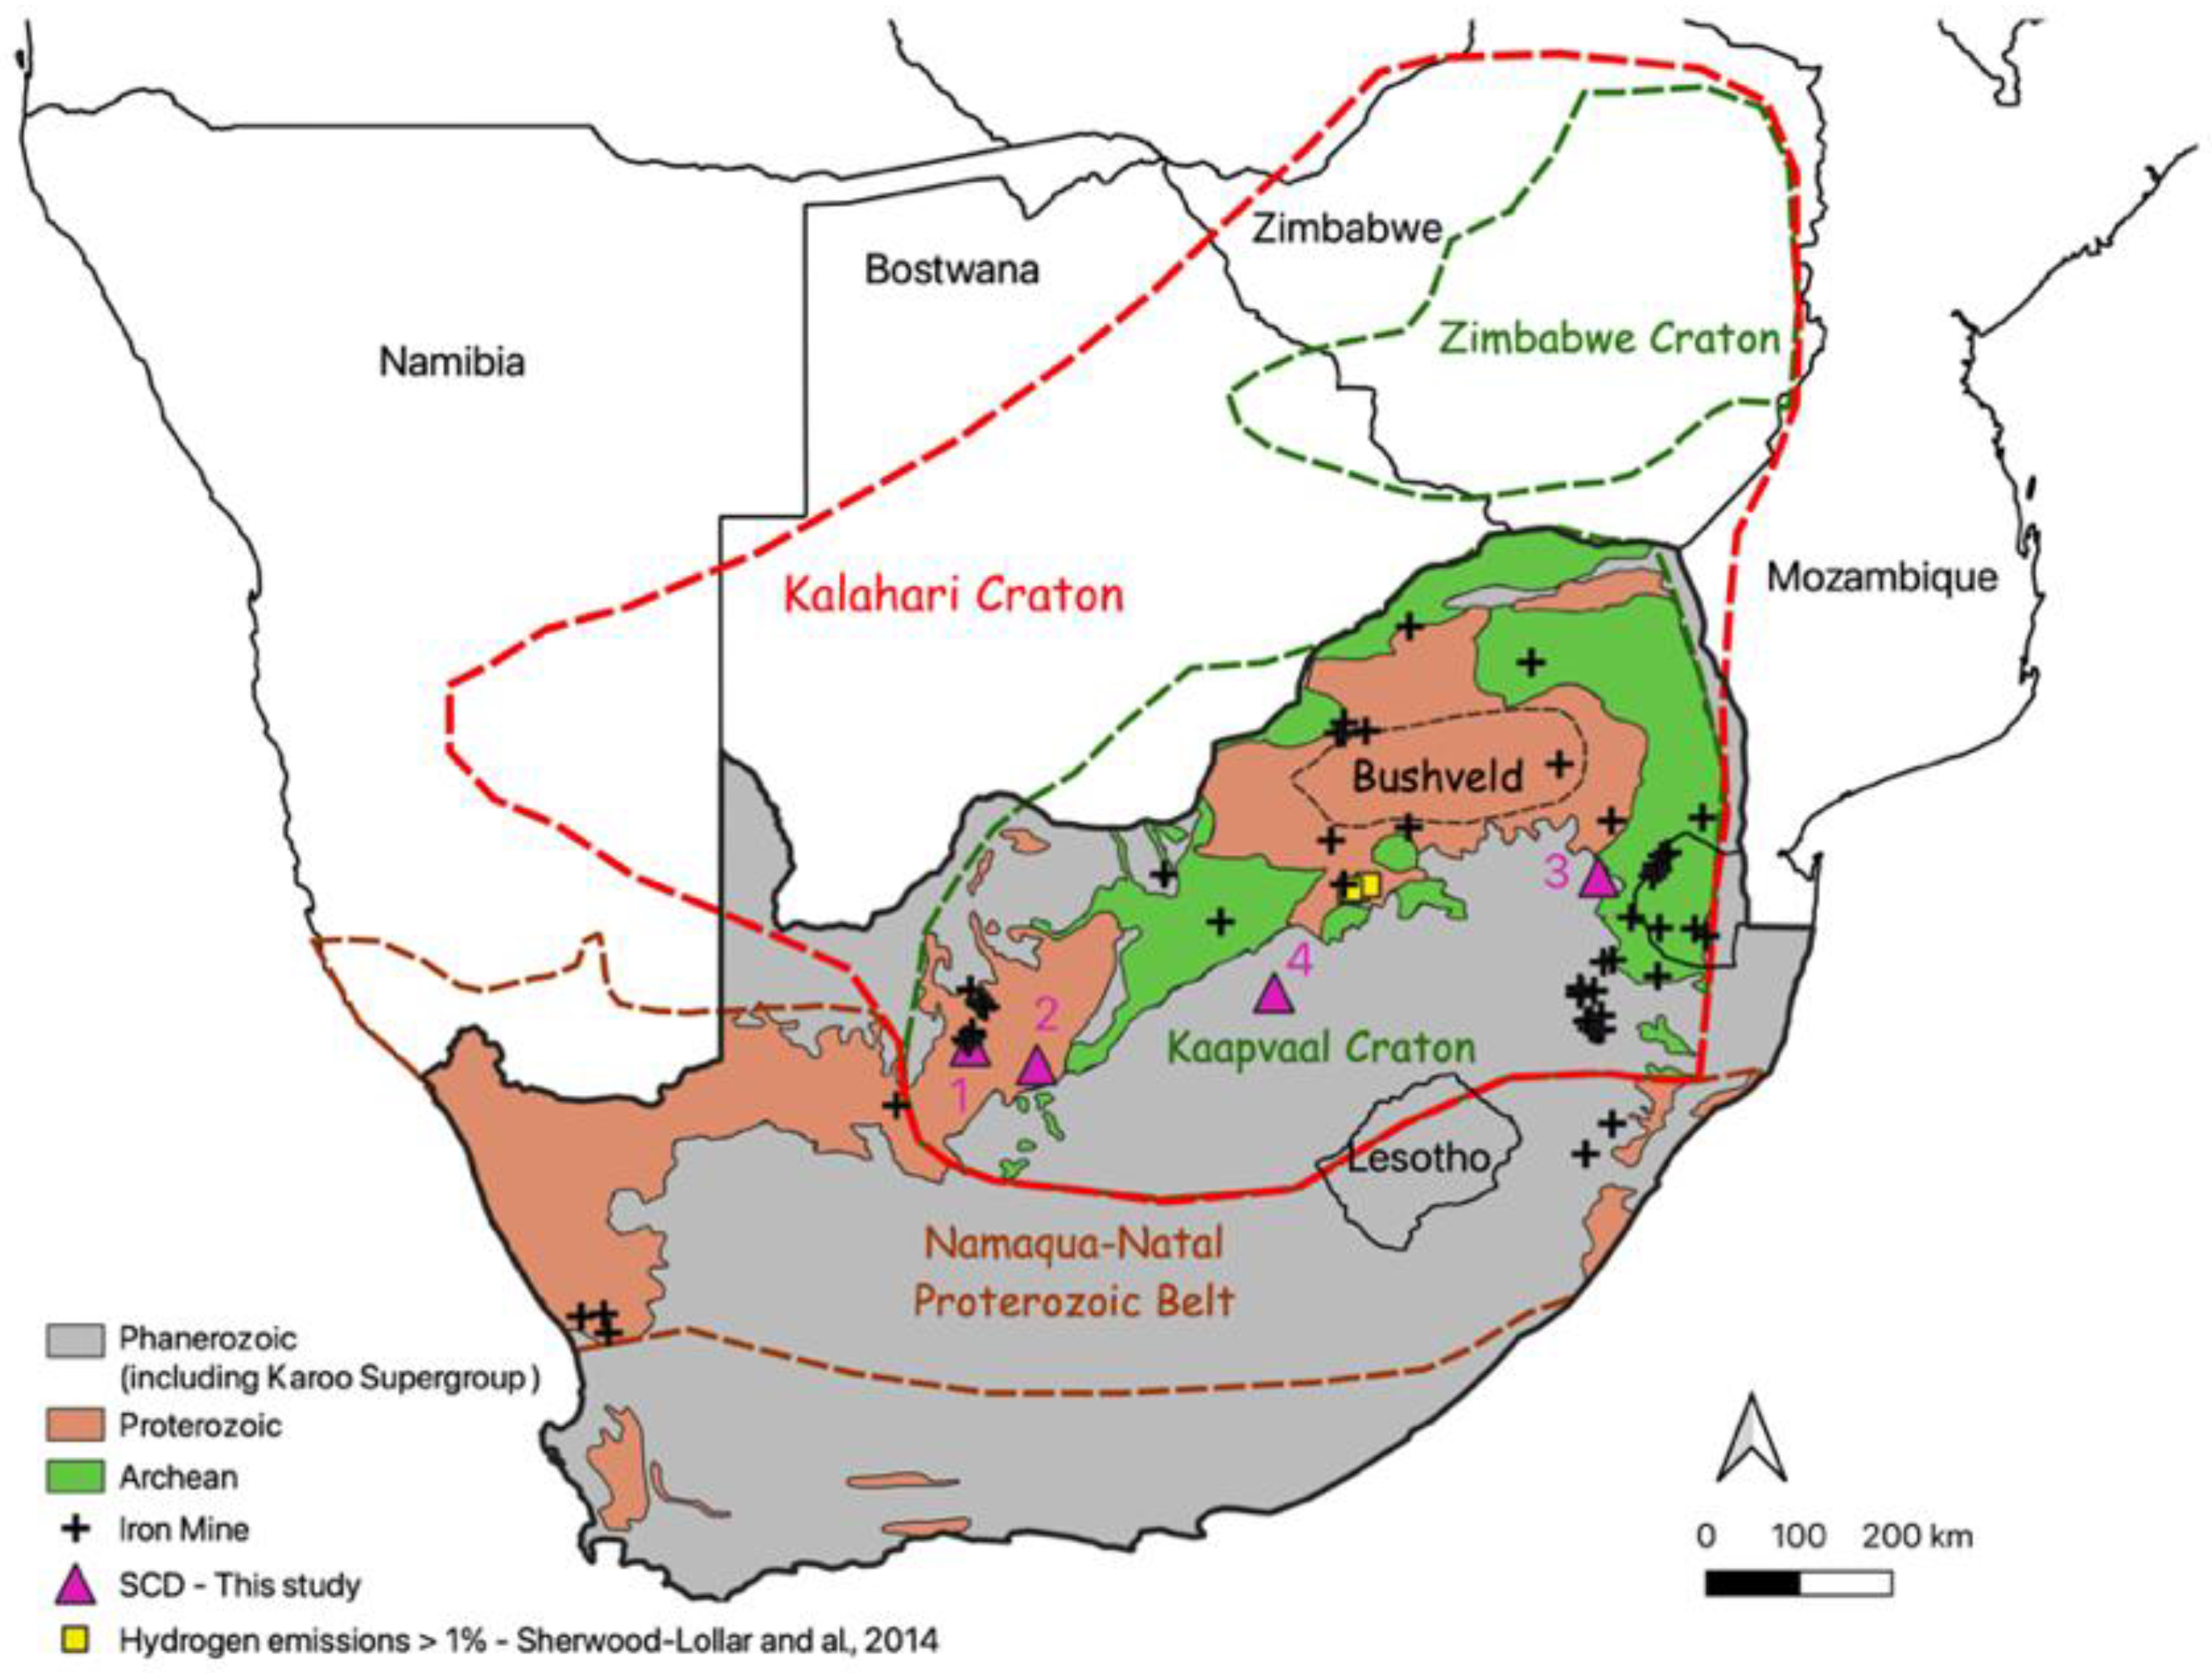
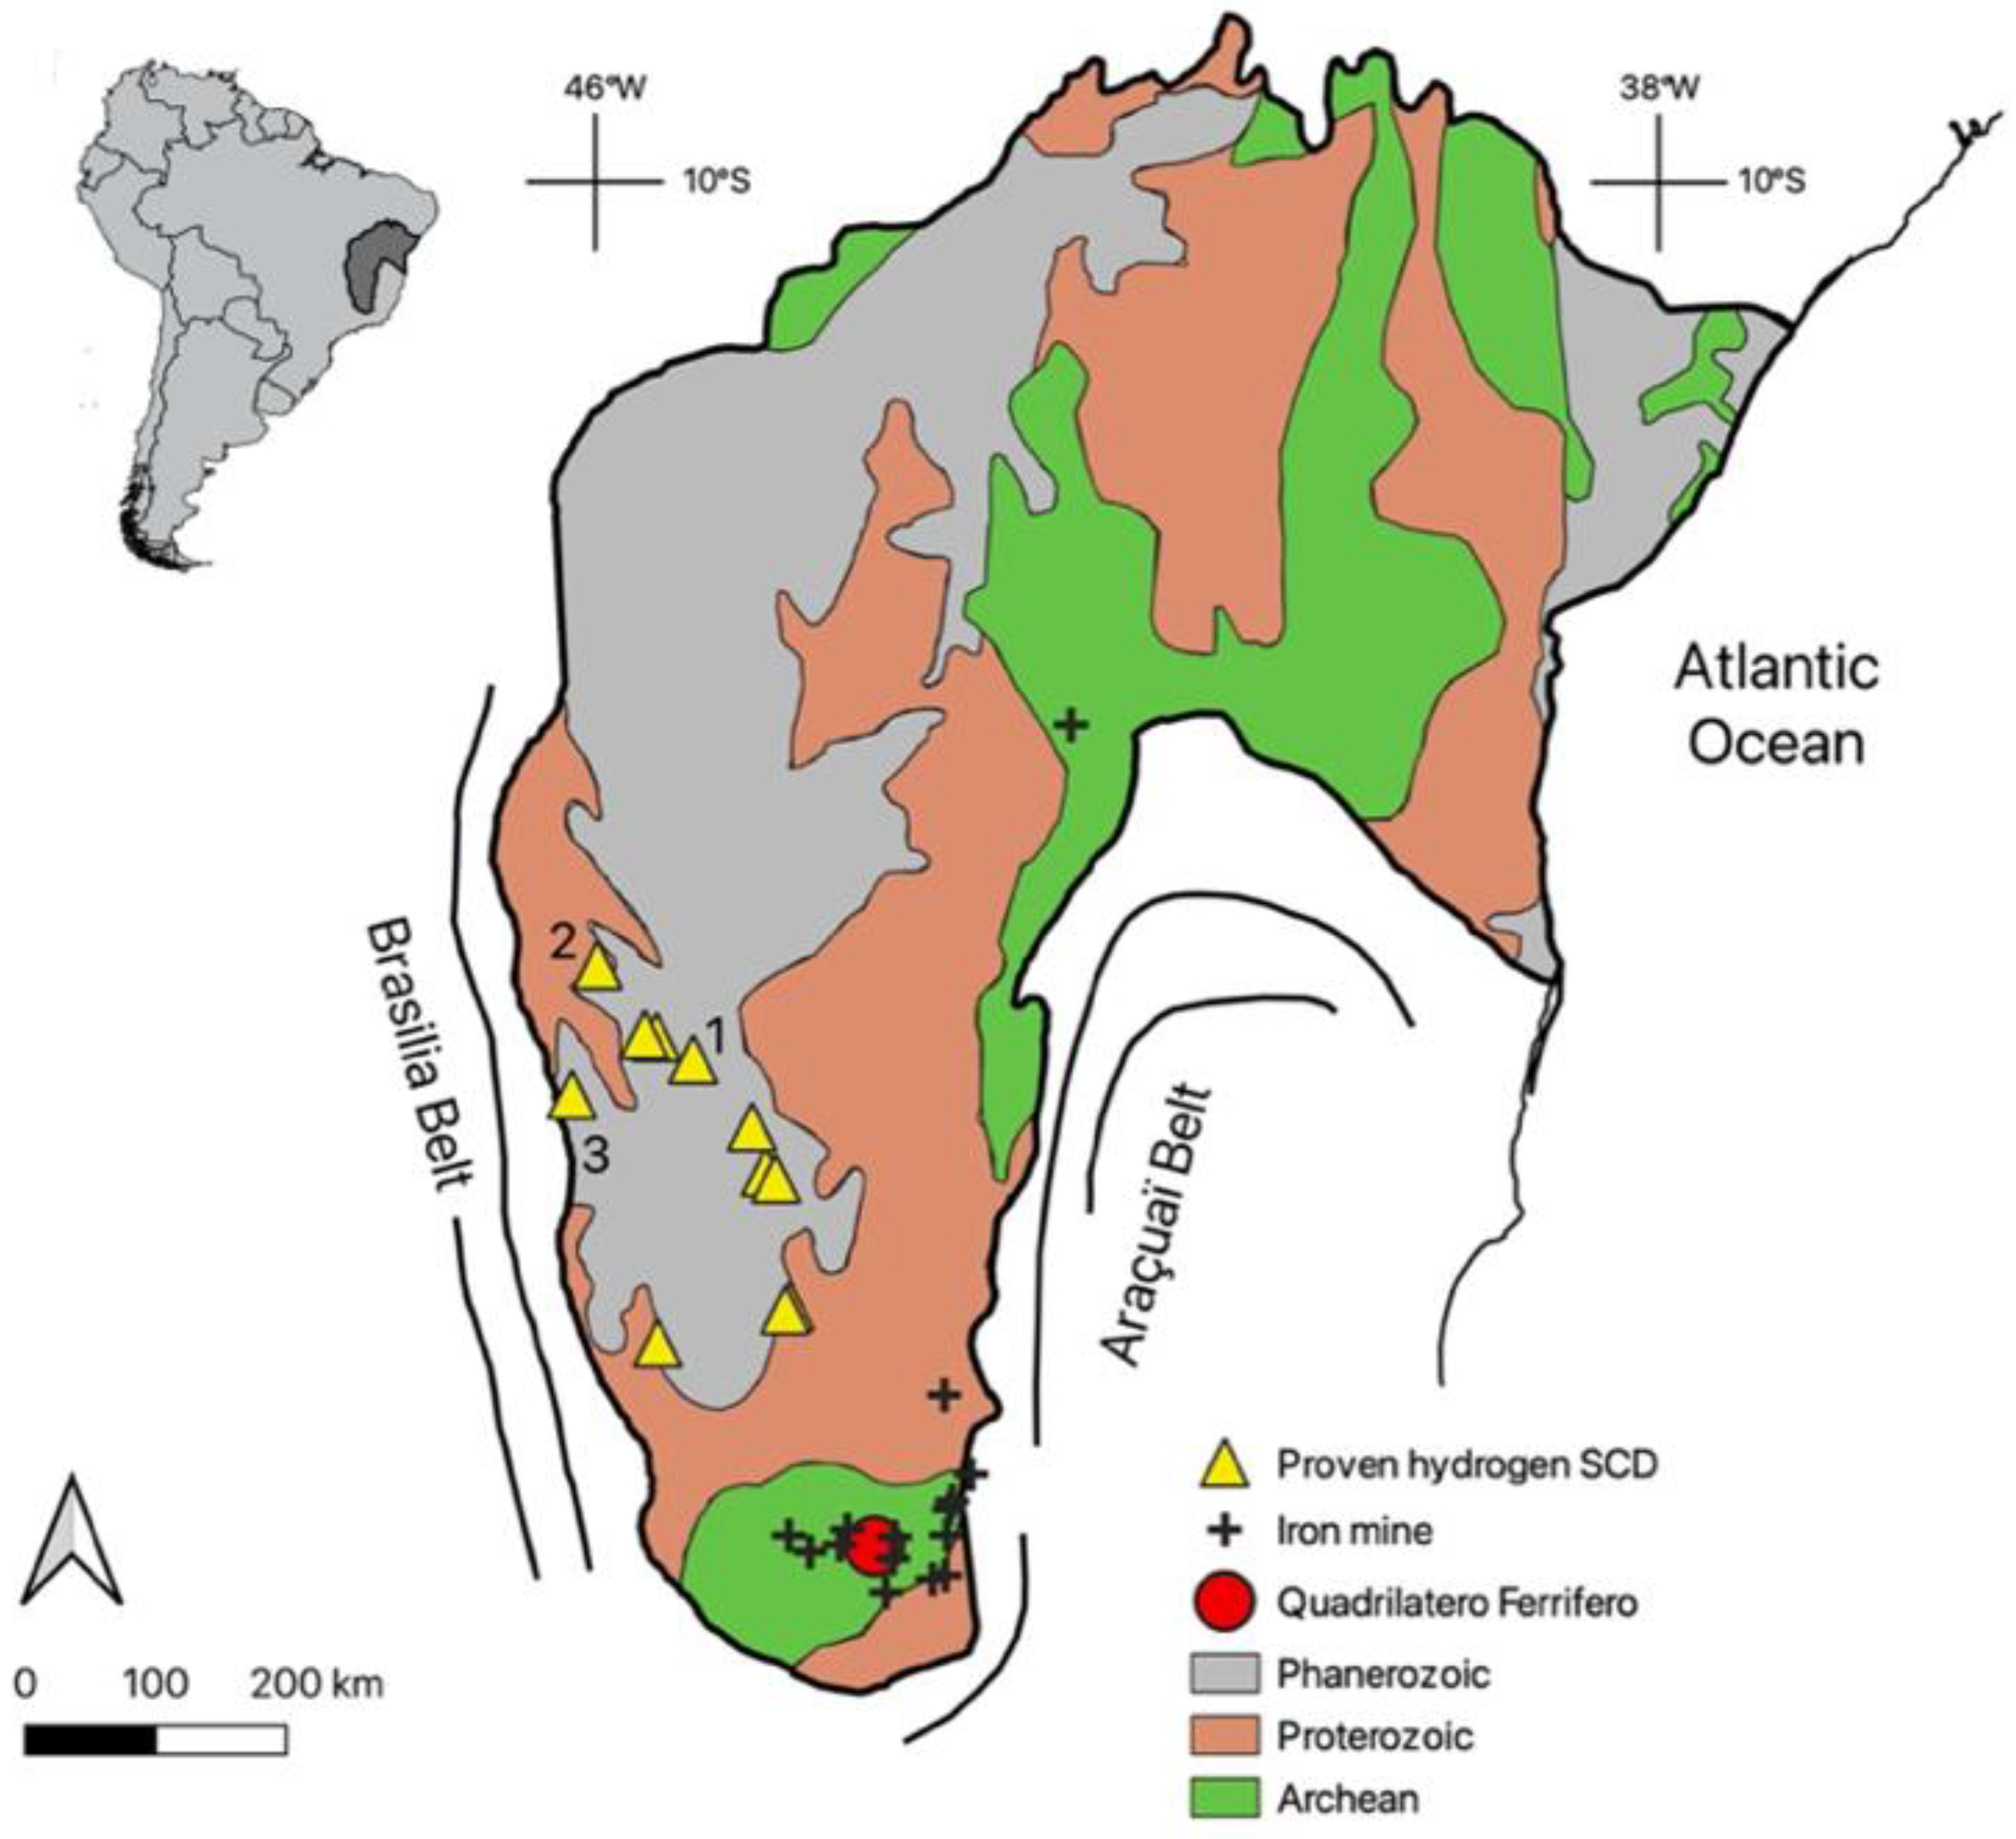
2. Study Locations and Geological Settings
2.1. Australia
2.2. South Africa
2.3. Brazil
2.4. BIF and Relationship between These 3 Cratonic Areas
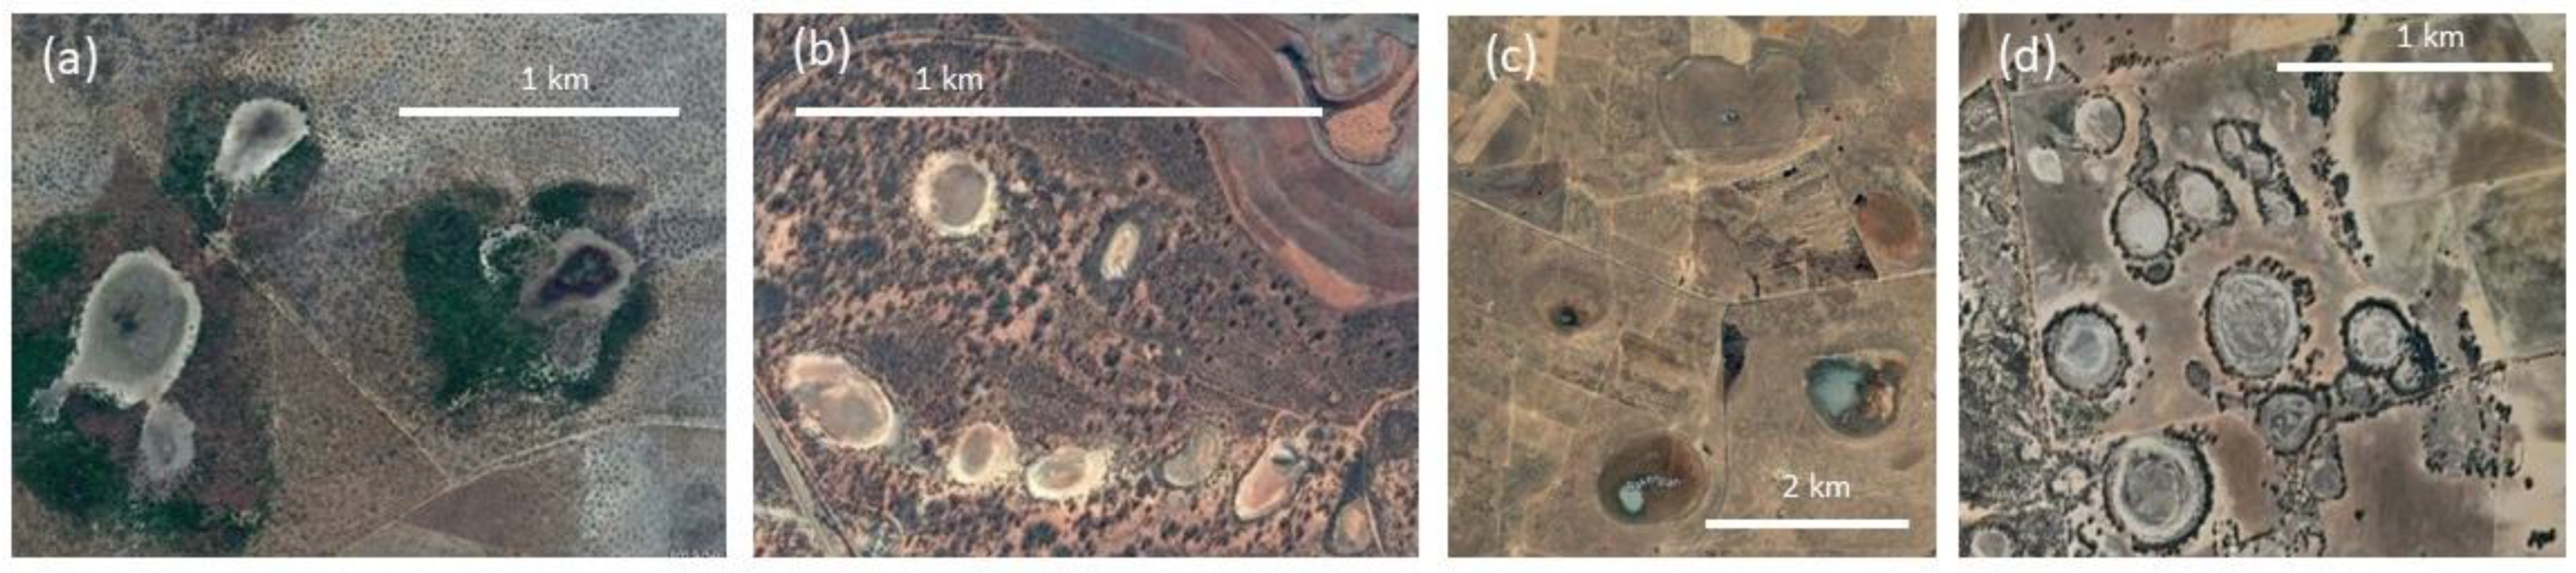
3. Rounded Depressions in BIF Rich Areas
3.1. Rounded Depressions Related to Gas Escape
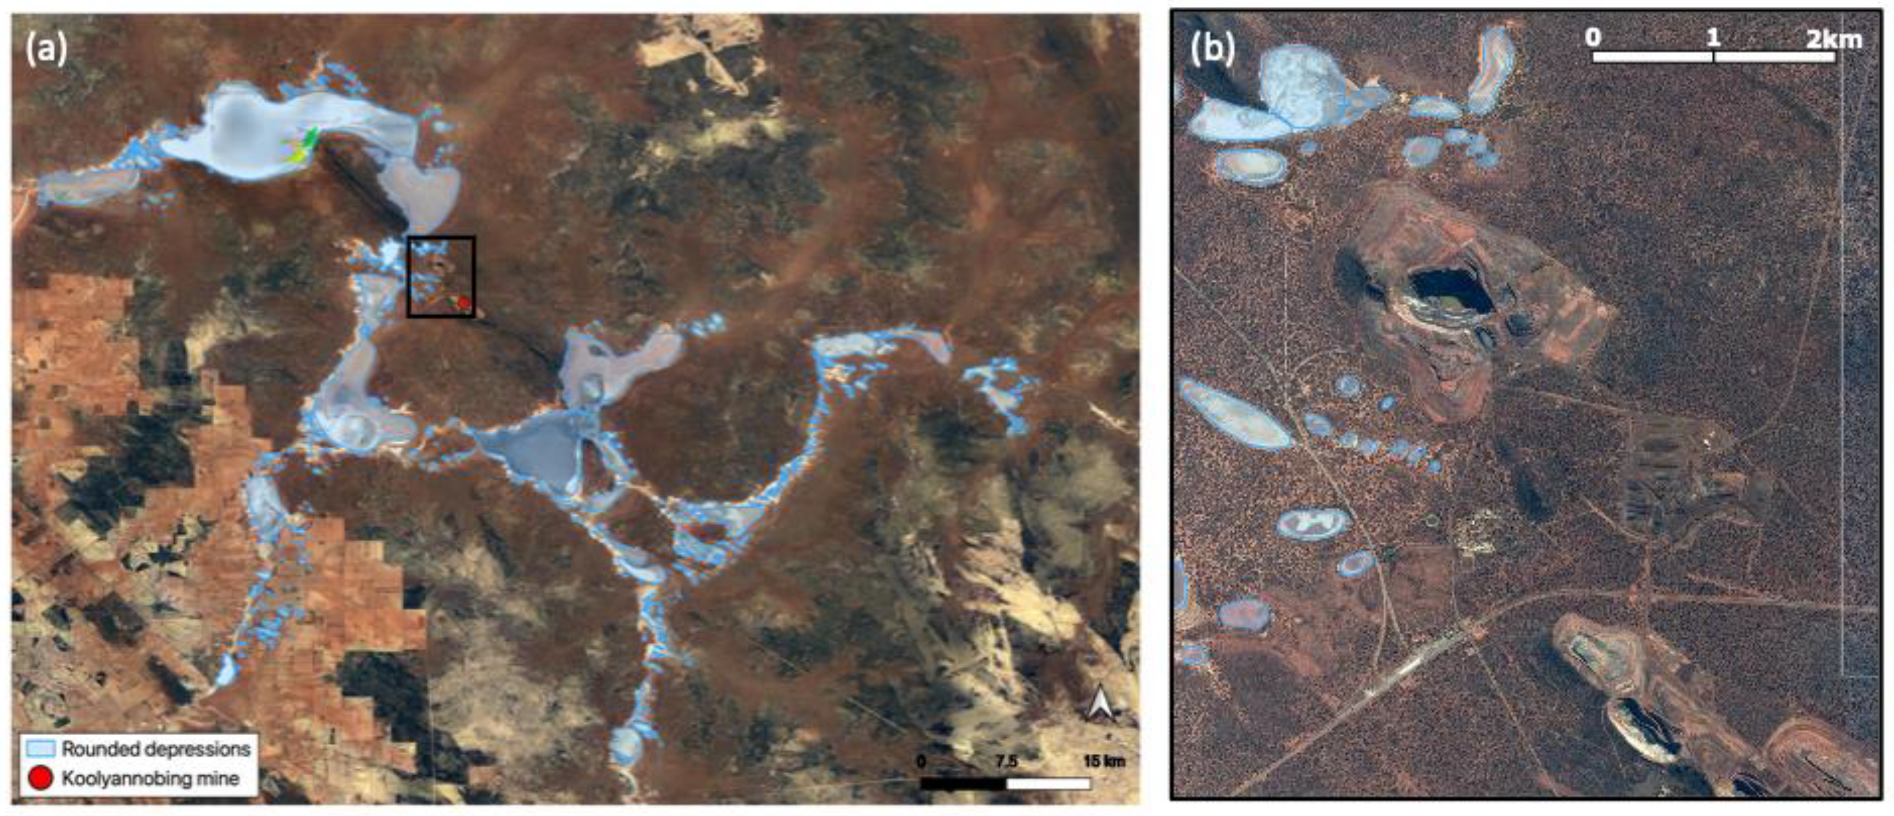
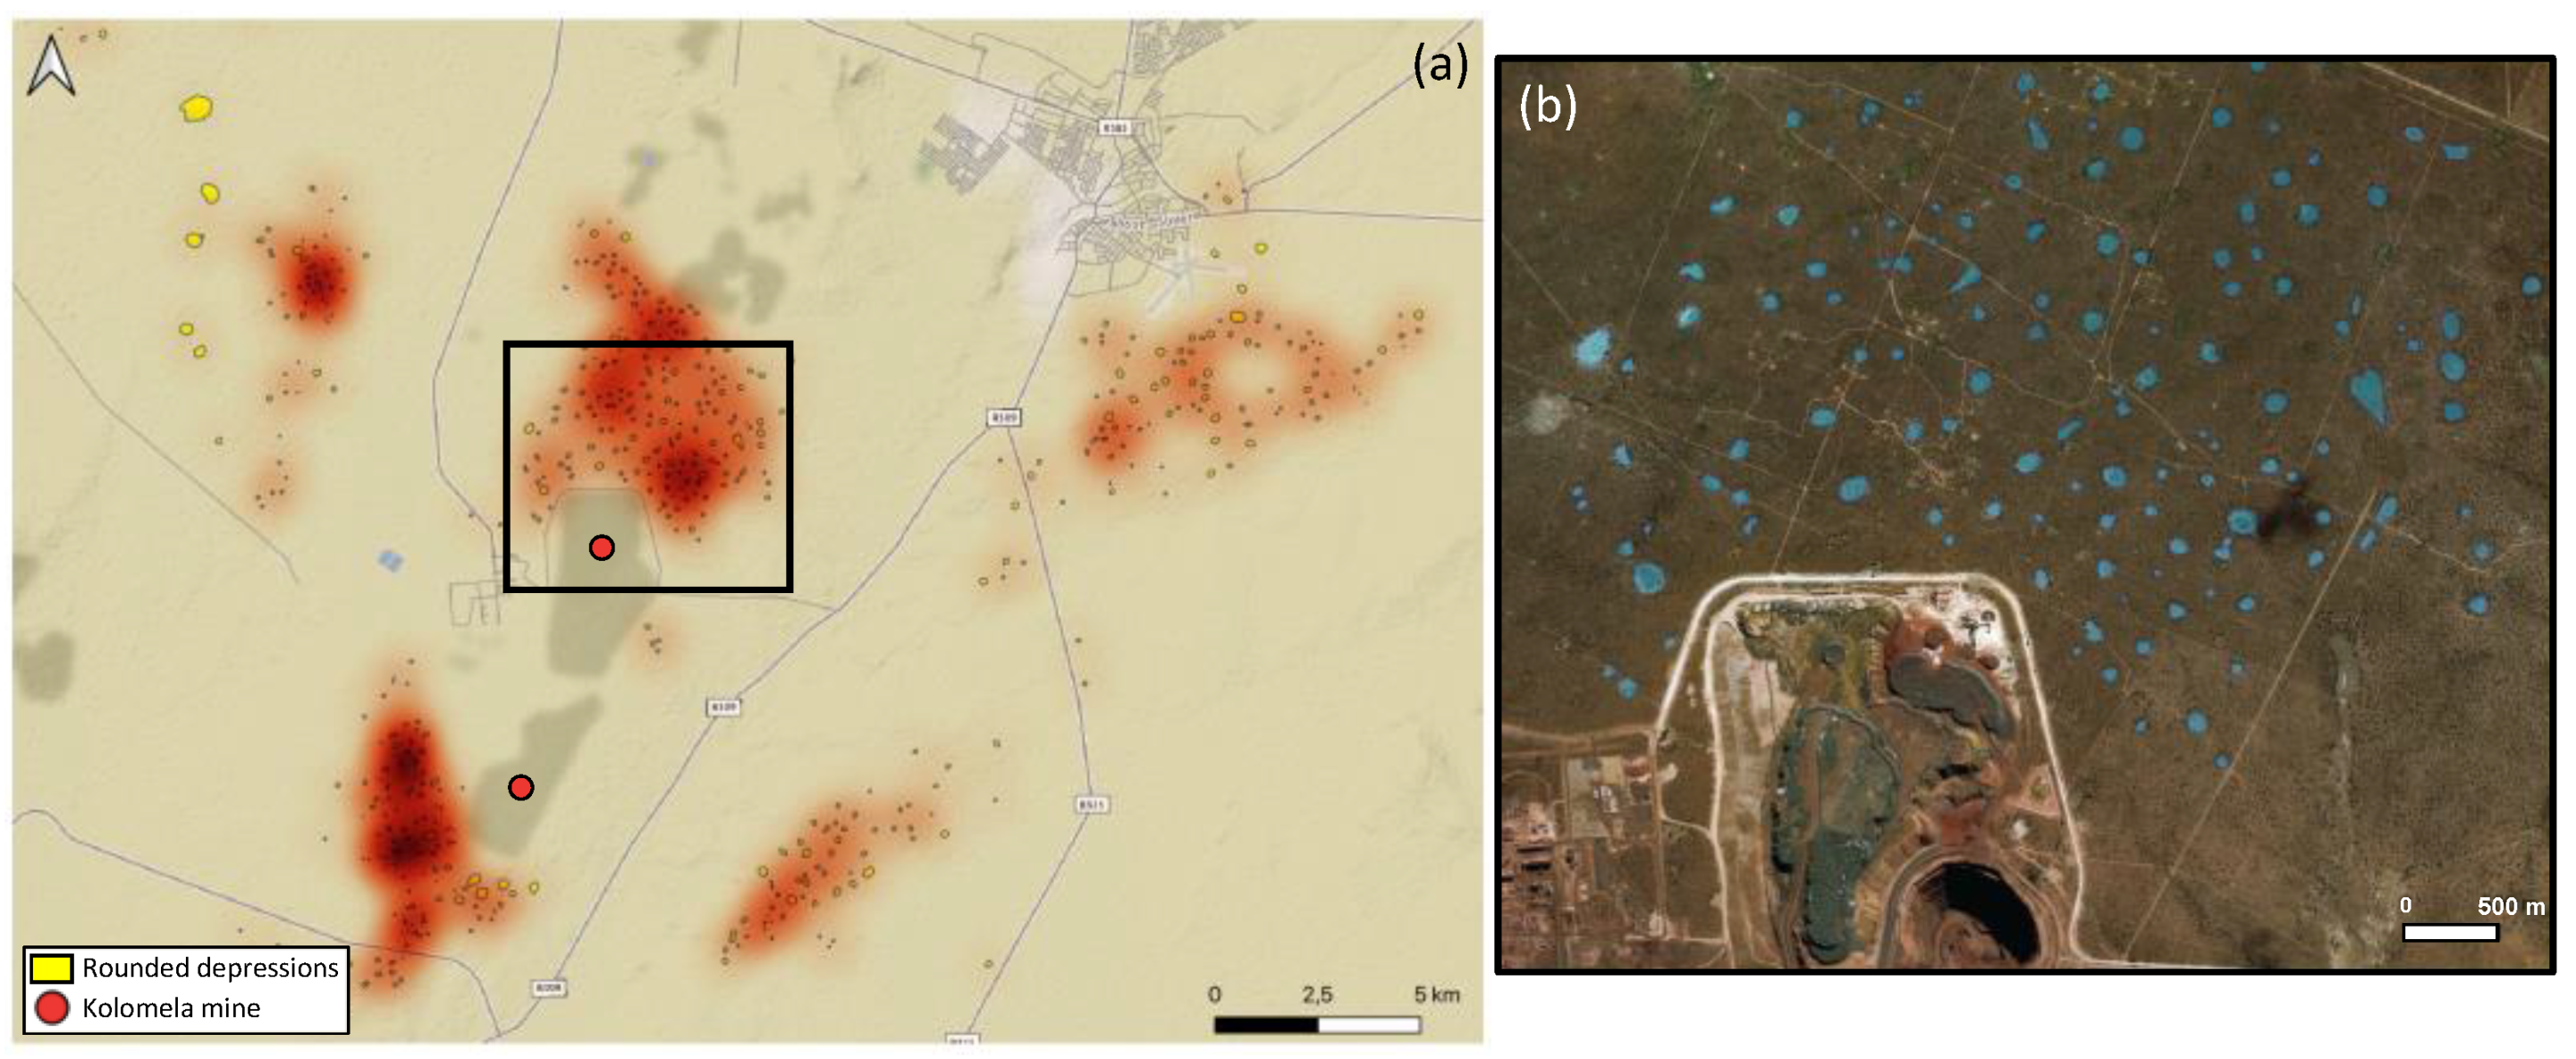
3.2. Presence of SCD around the BIF Mines
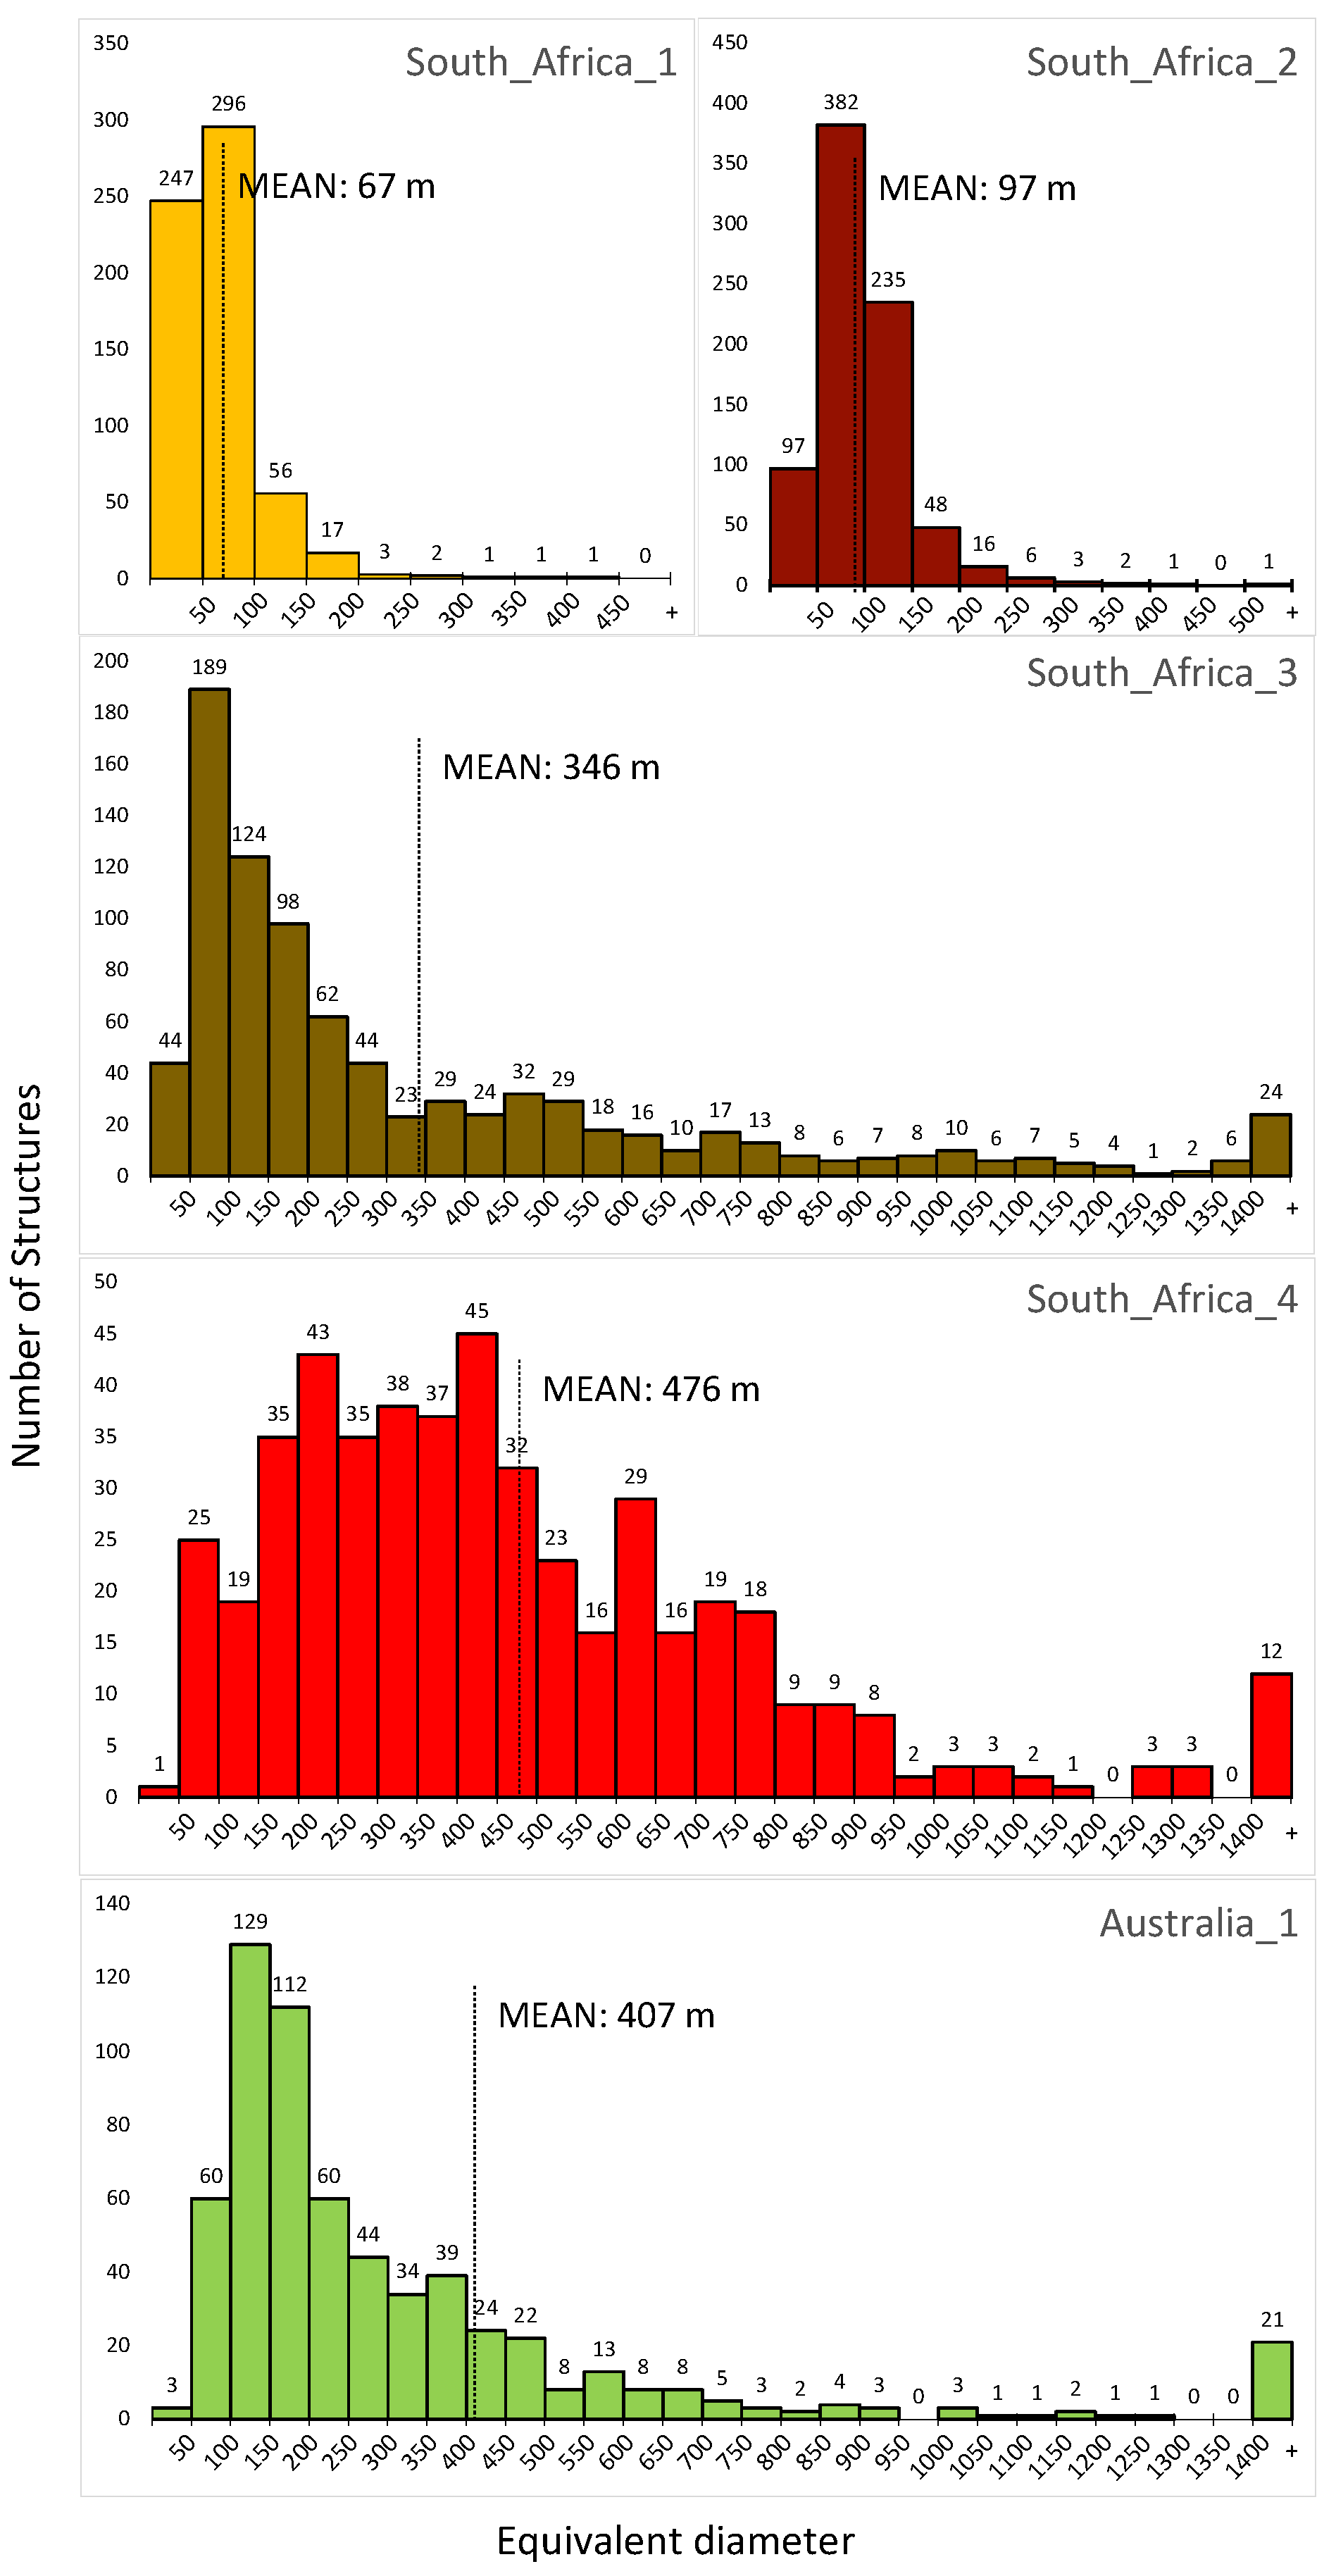
3.3. Statistics on SCD around BIF Mines in Australia and South Africa
3.4. Comparison with the SCD Distributions of the São Francisco Basin
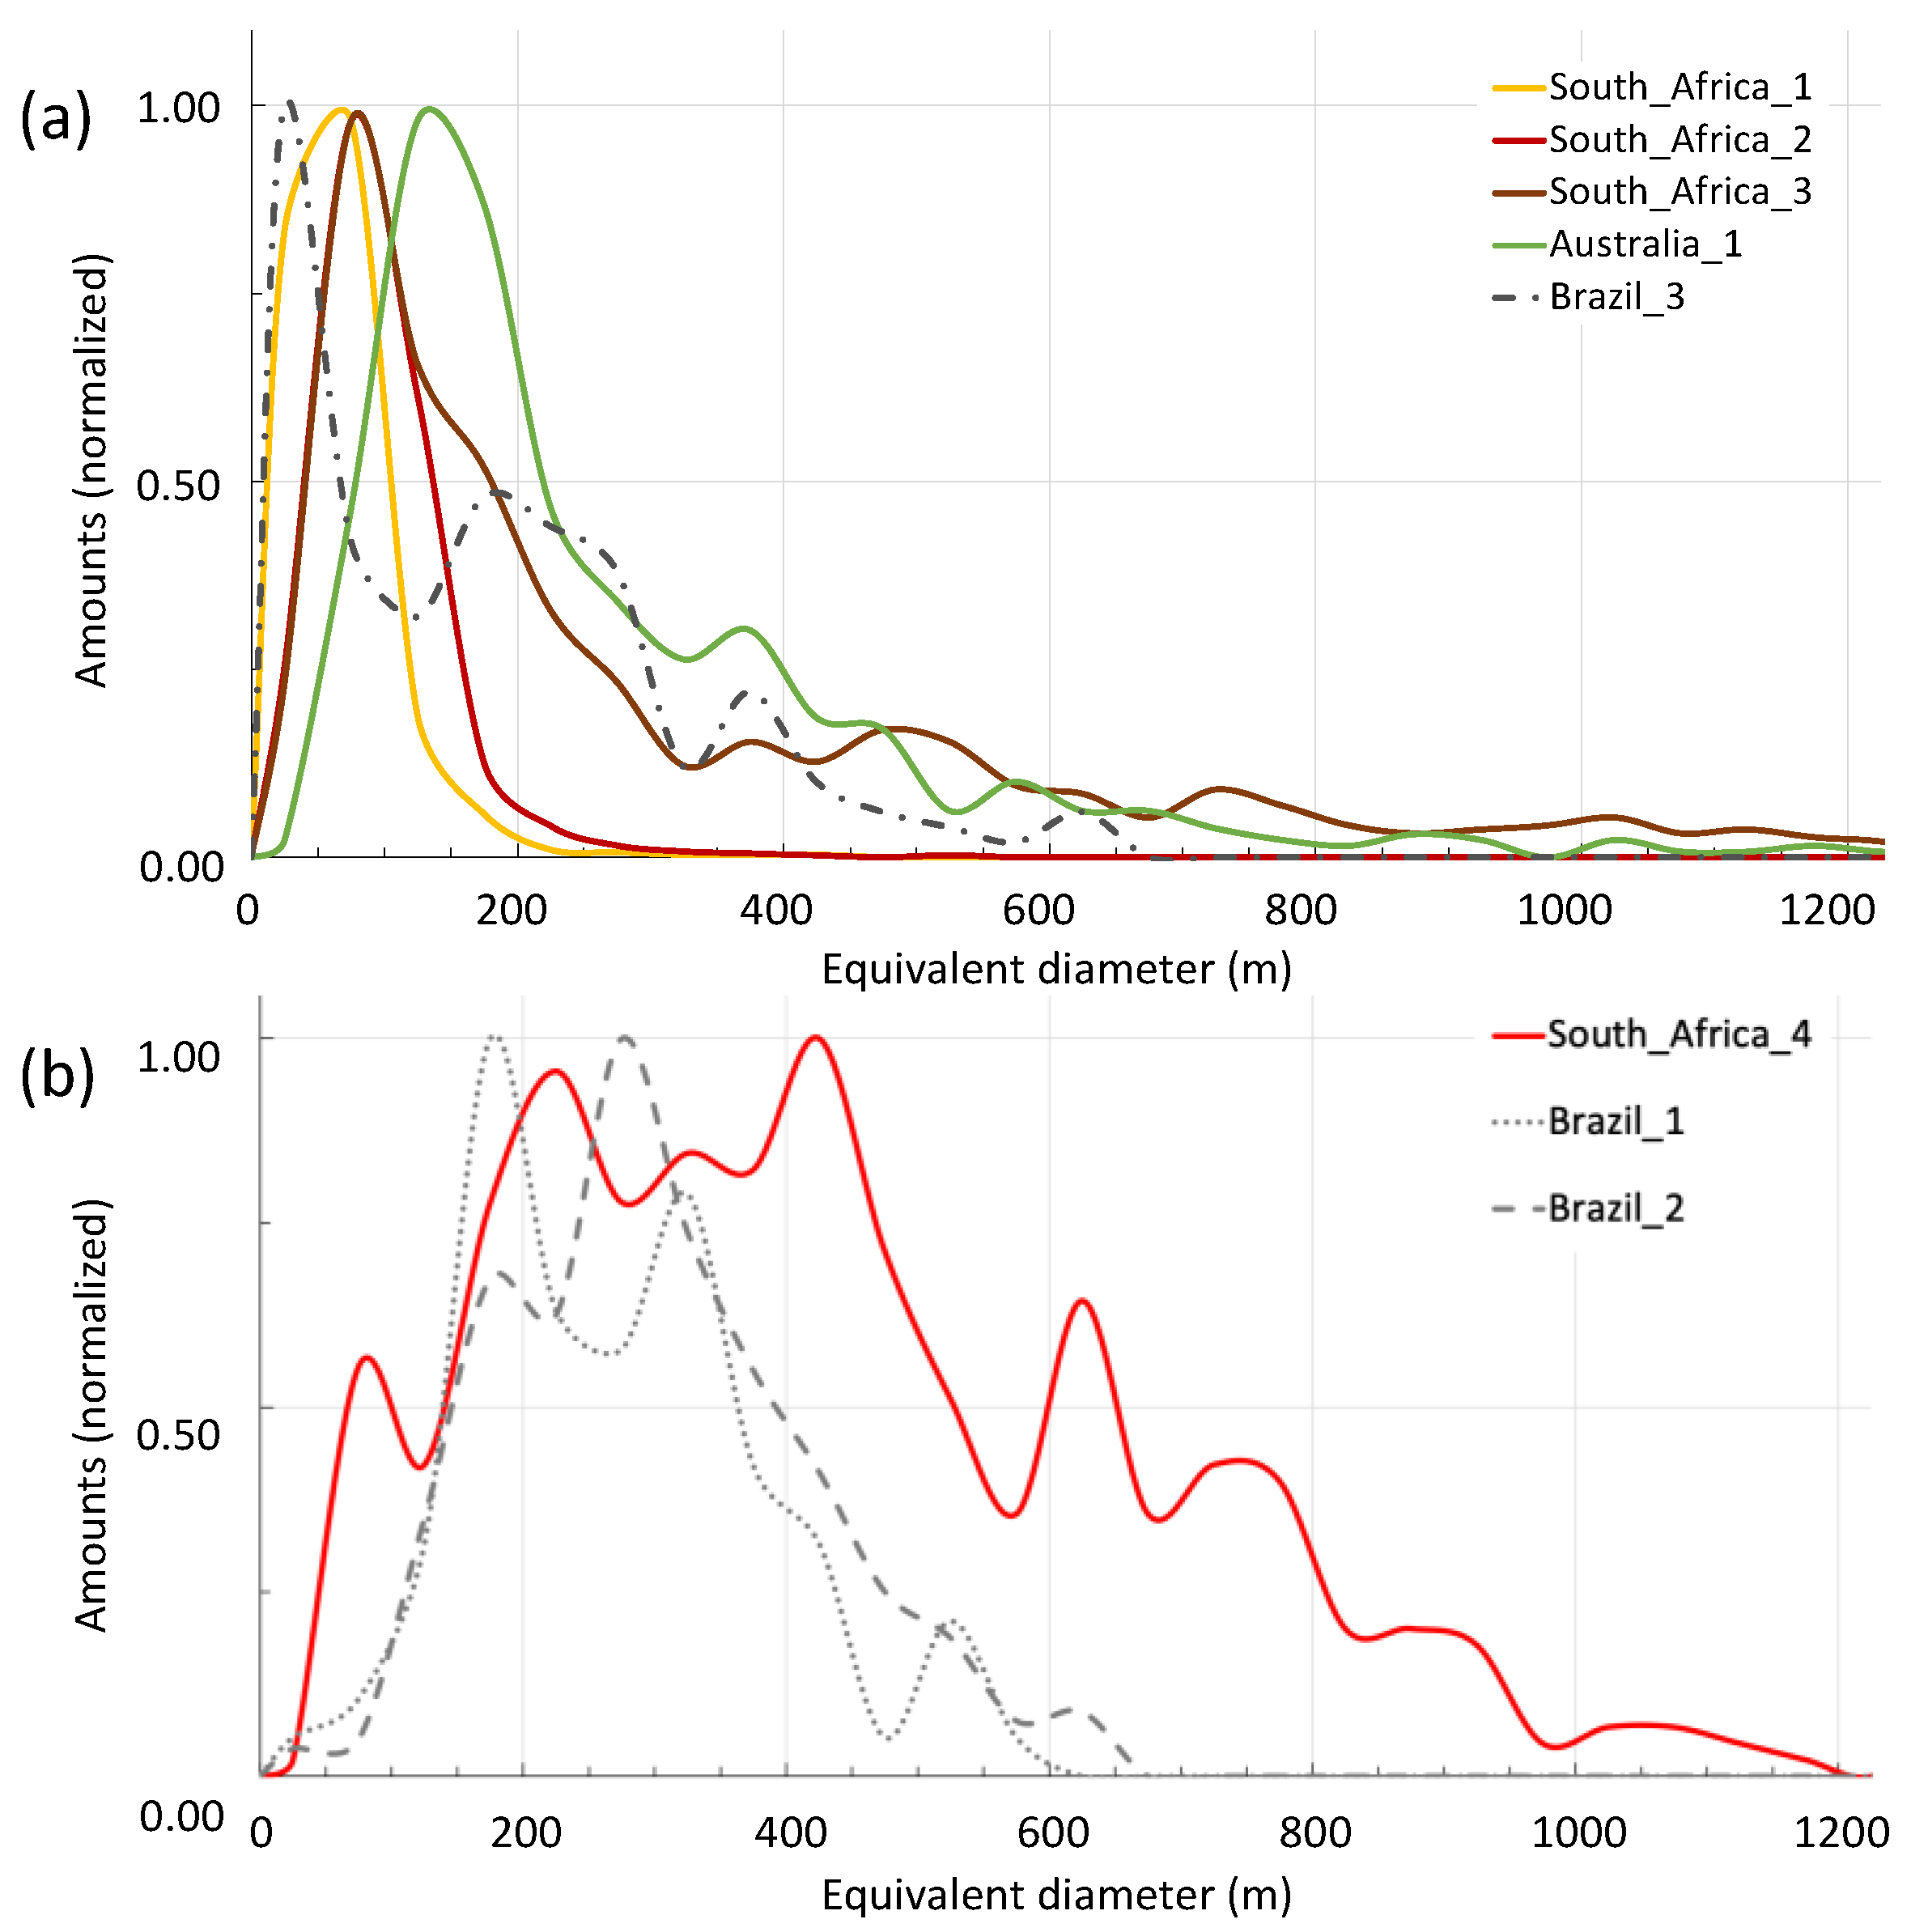
3.4.1. SCD Sizes
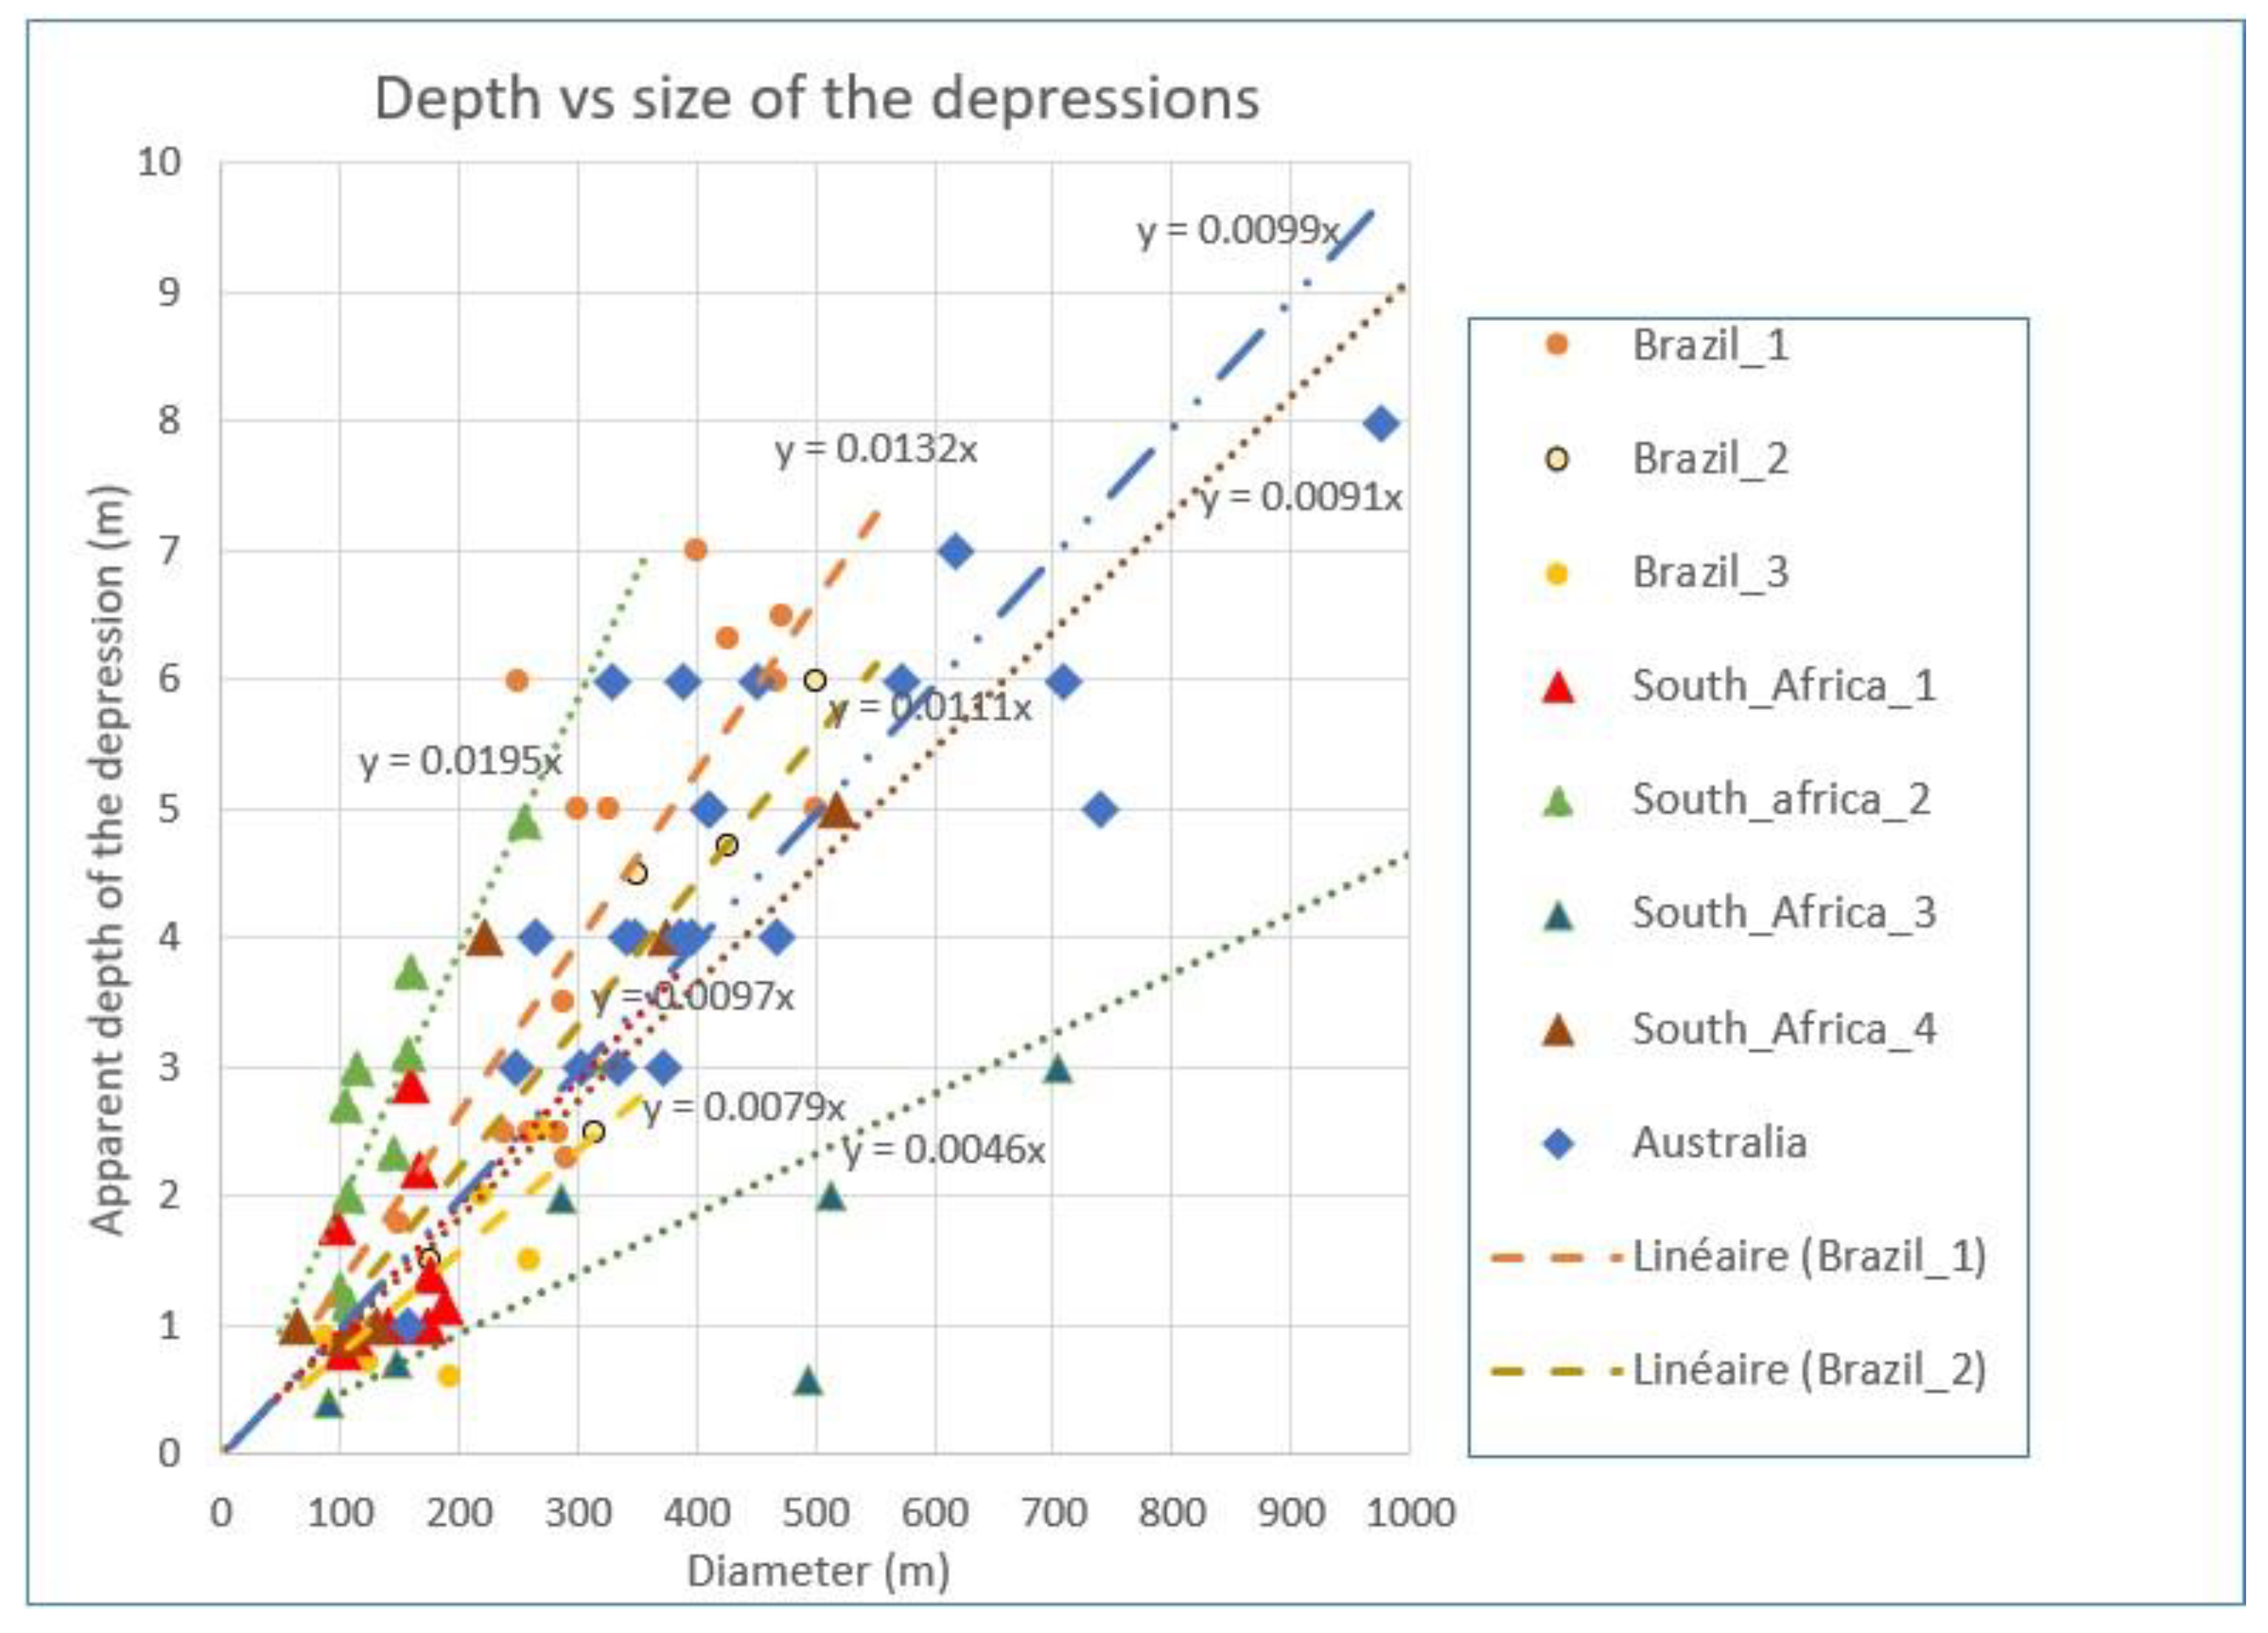
3.4.2. SCD Depths
4. BIF Potential for H2 Production: Case Study of Australian Samples
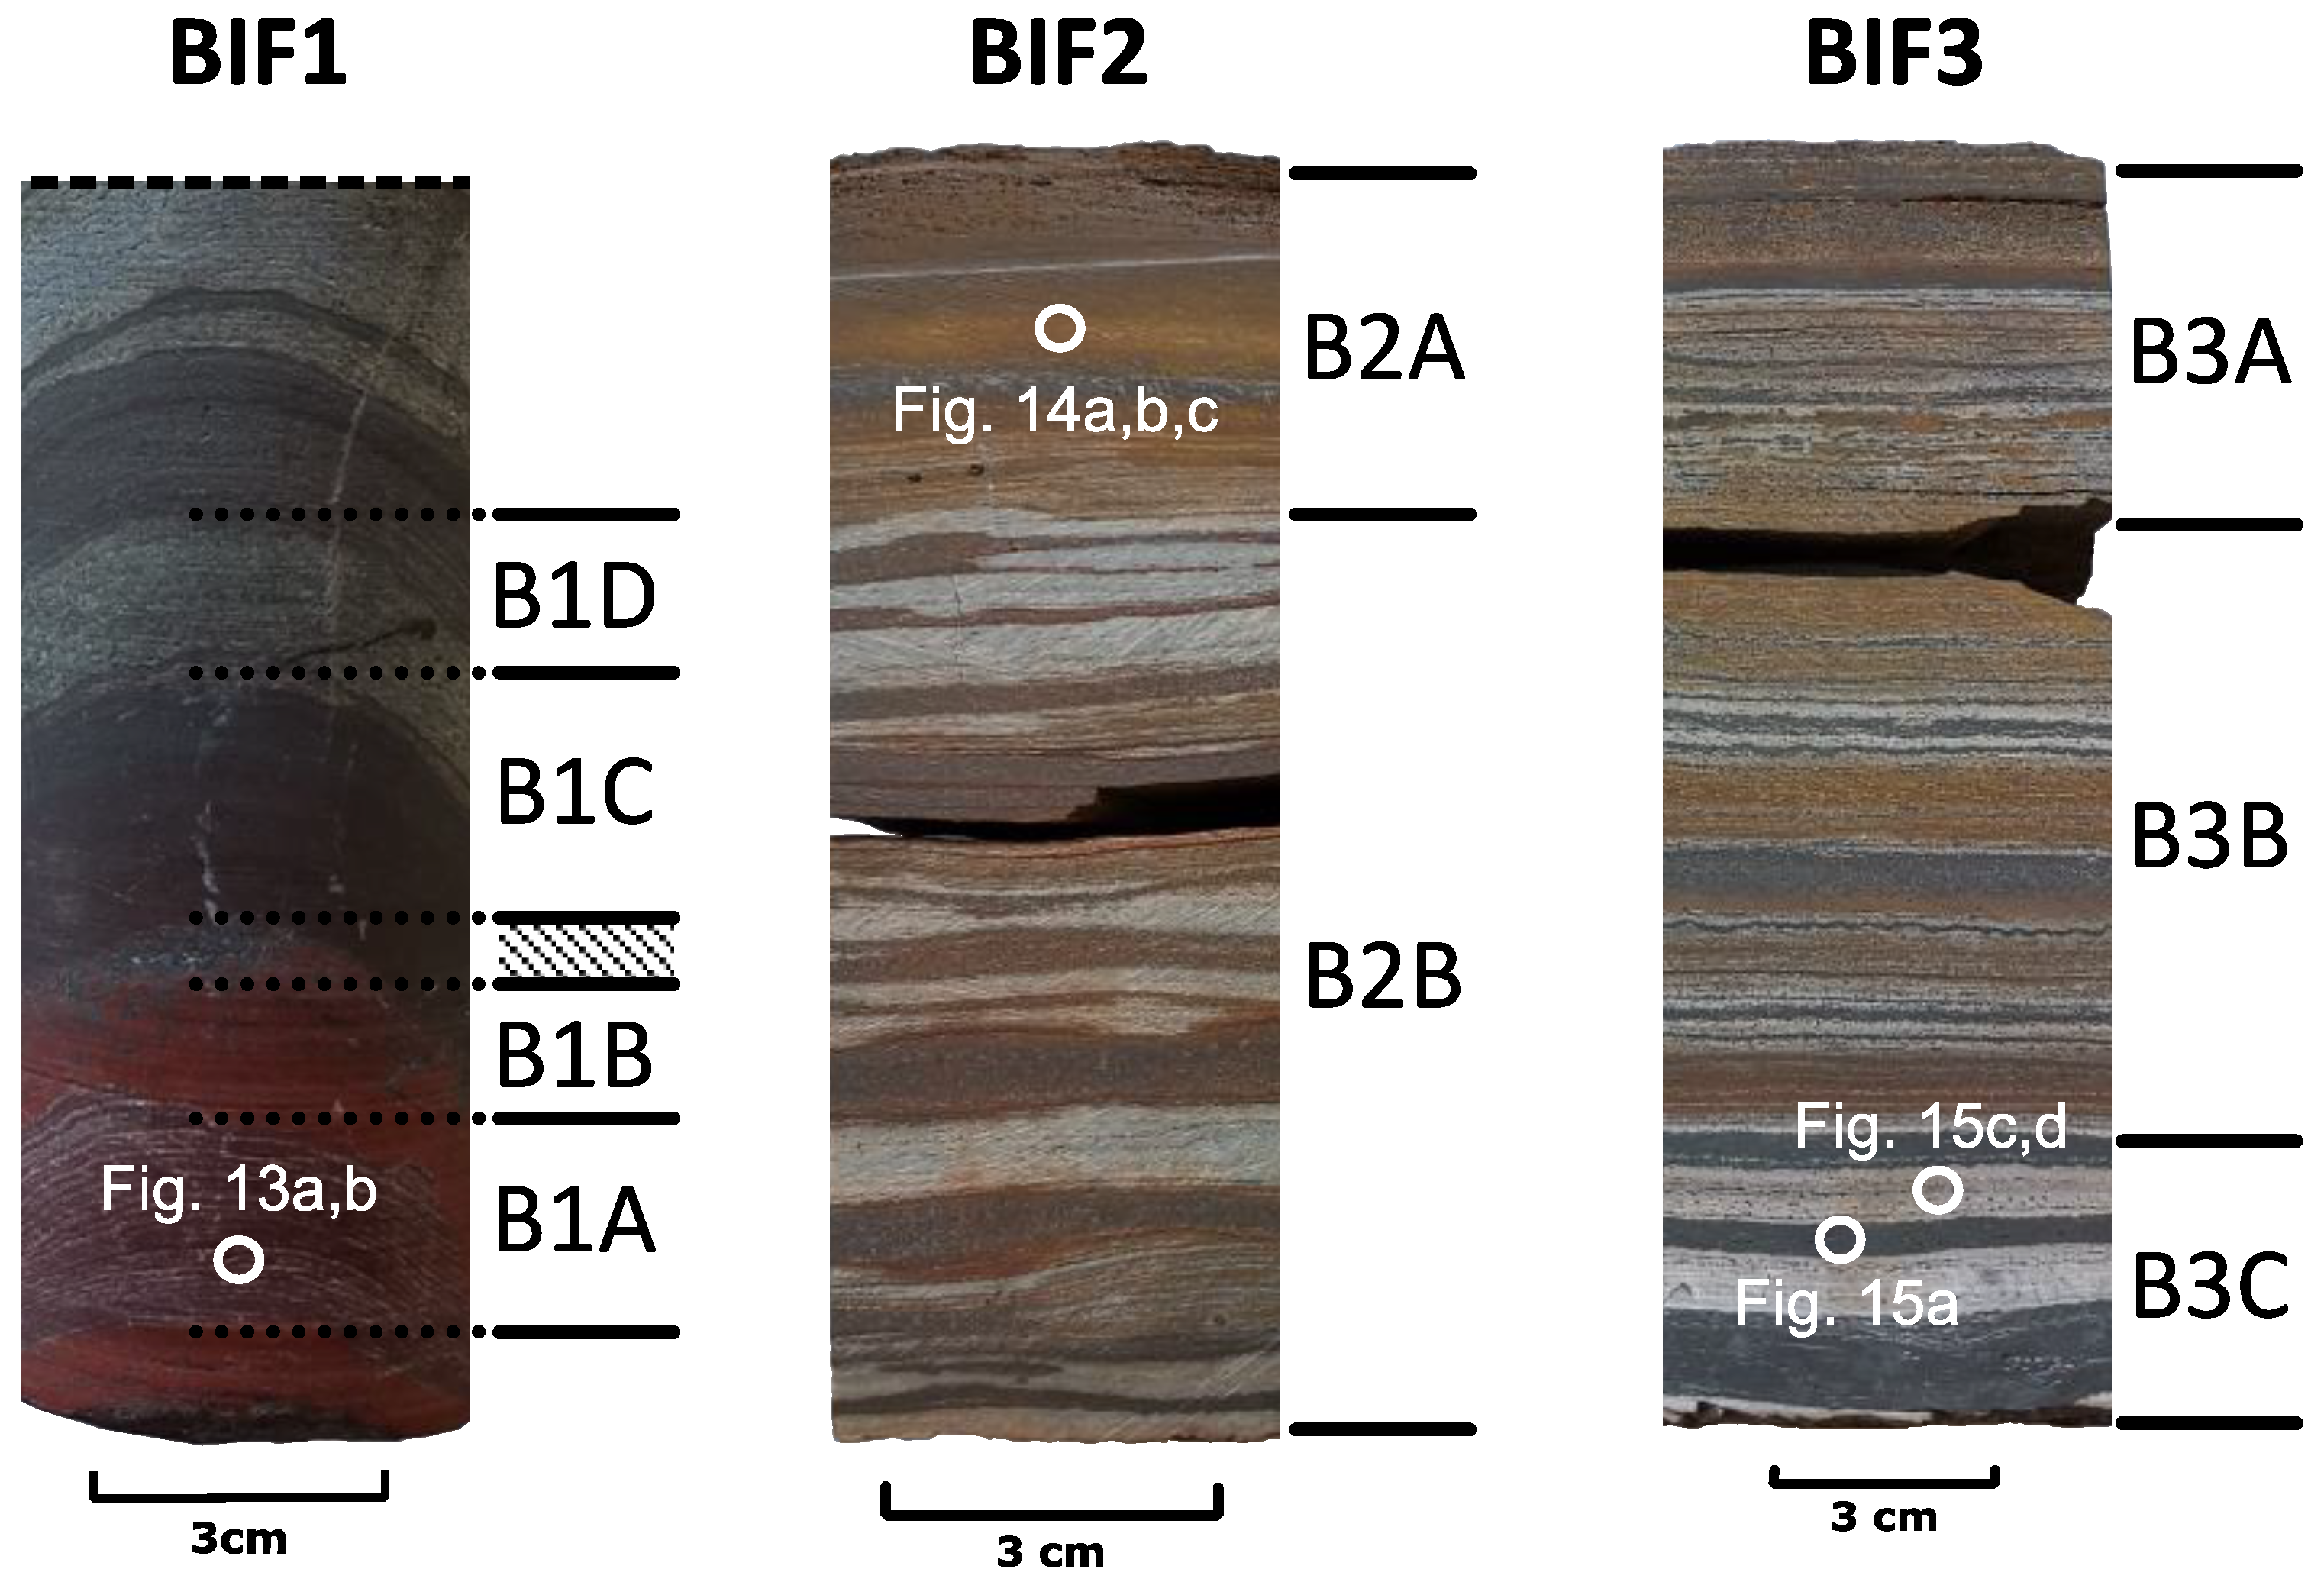
4.1. Geological Context and Sampling
4.2. Methods
4.3. Results
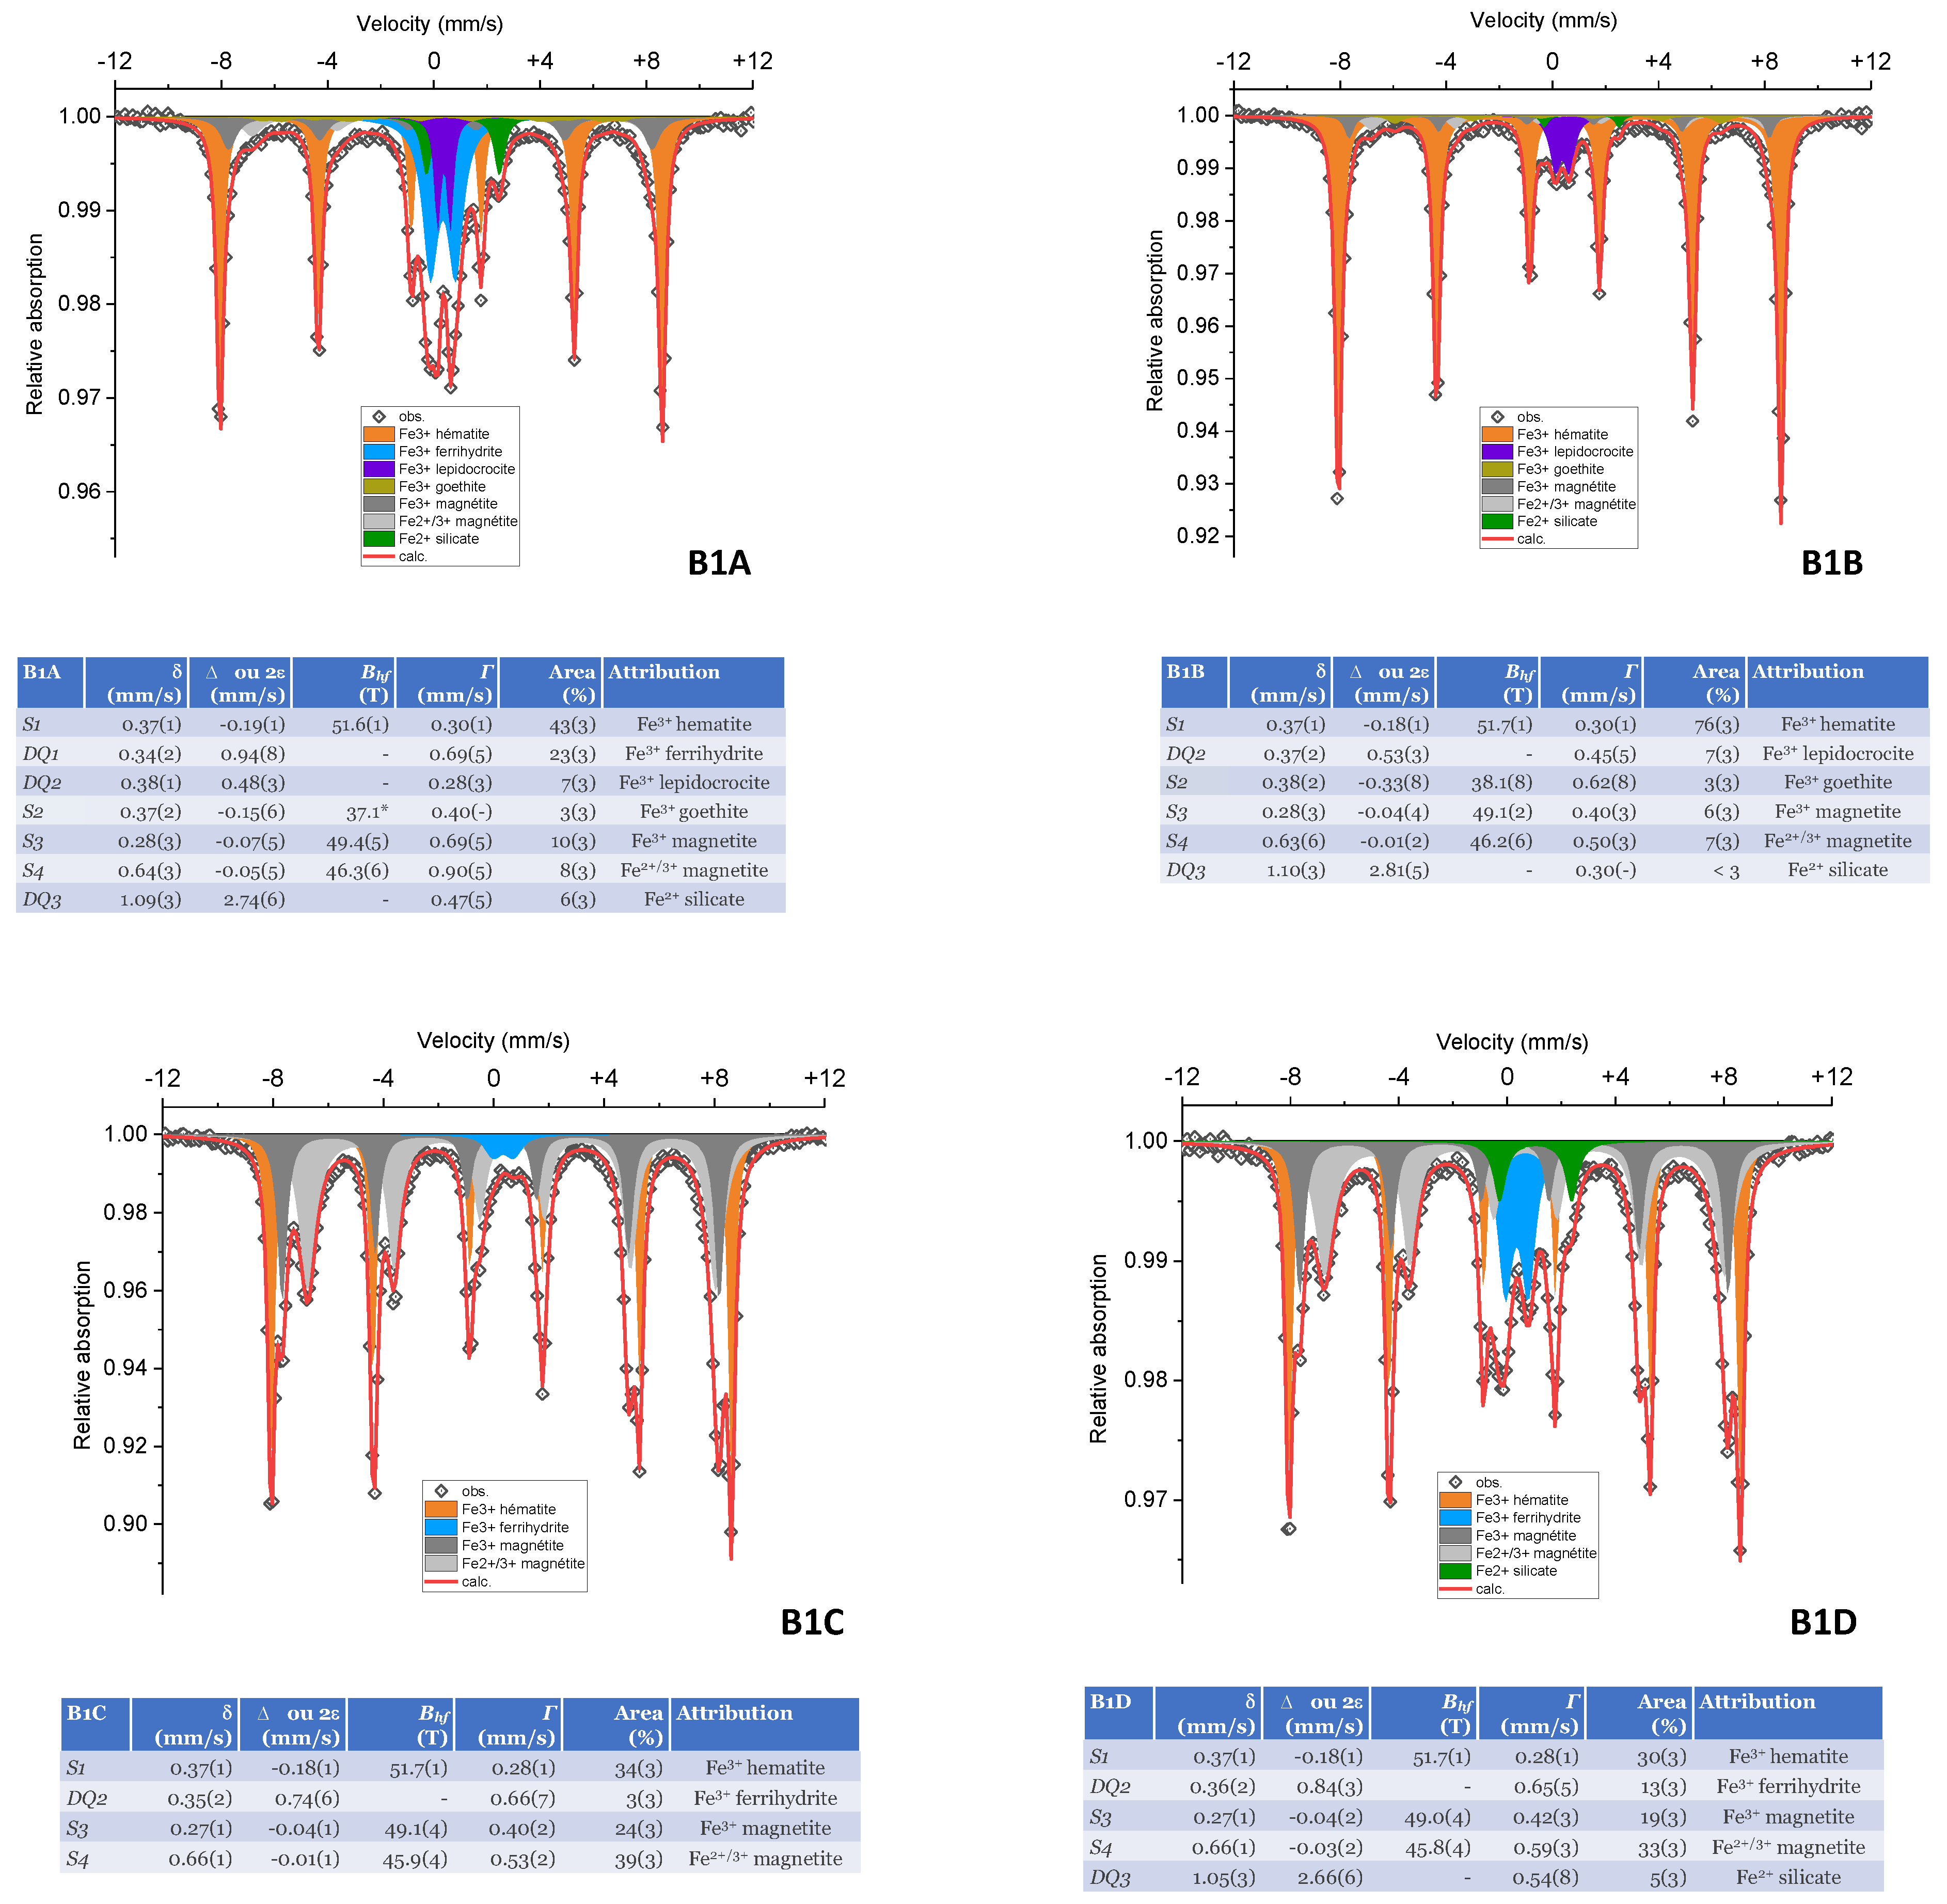
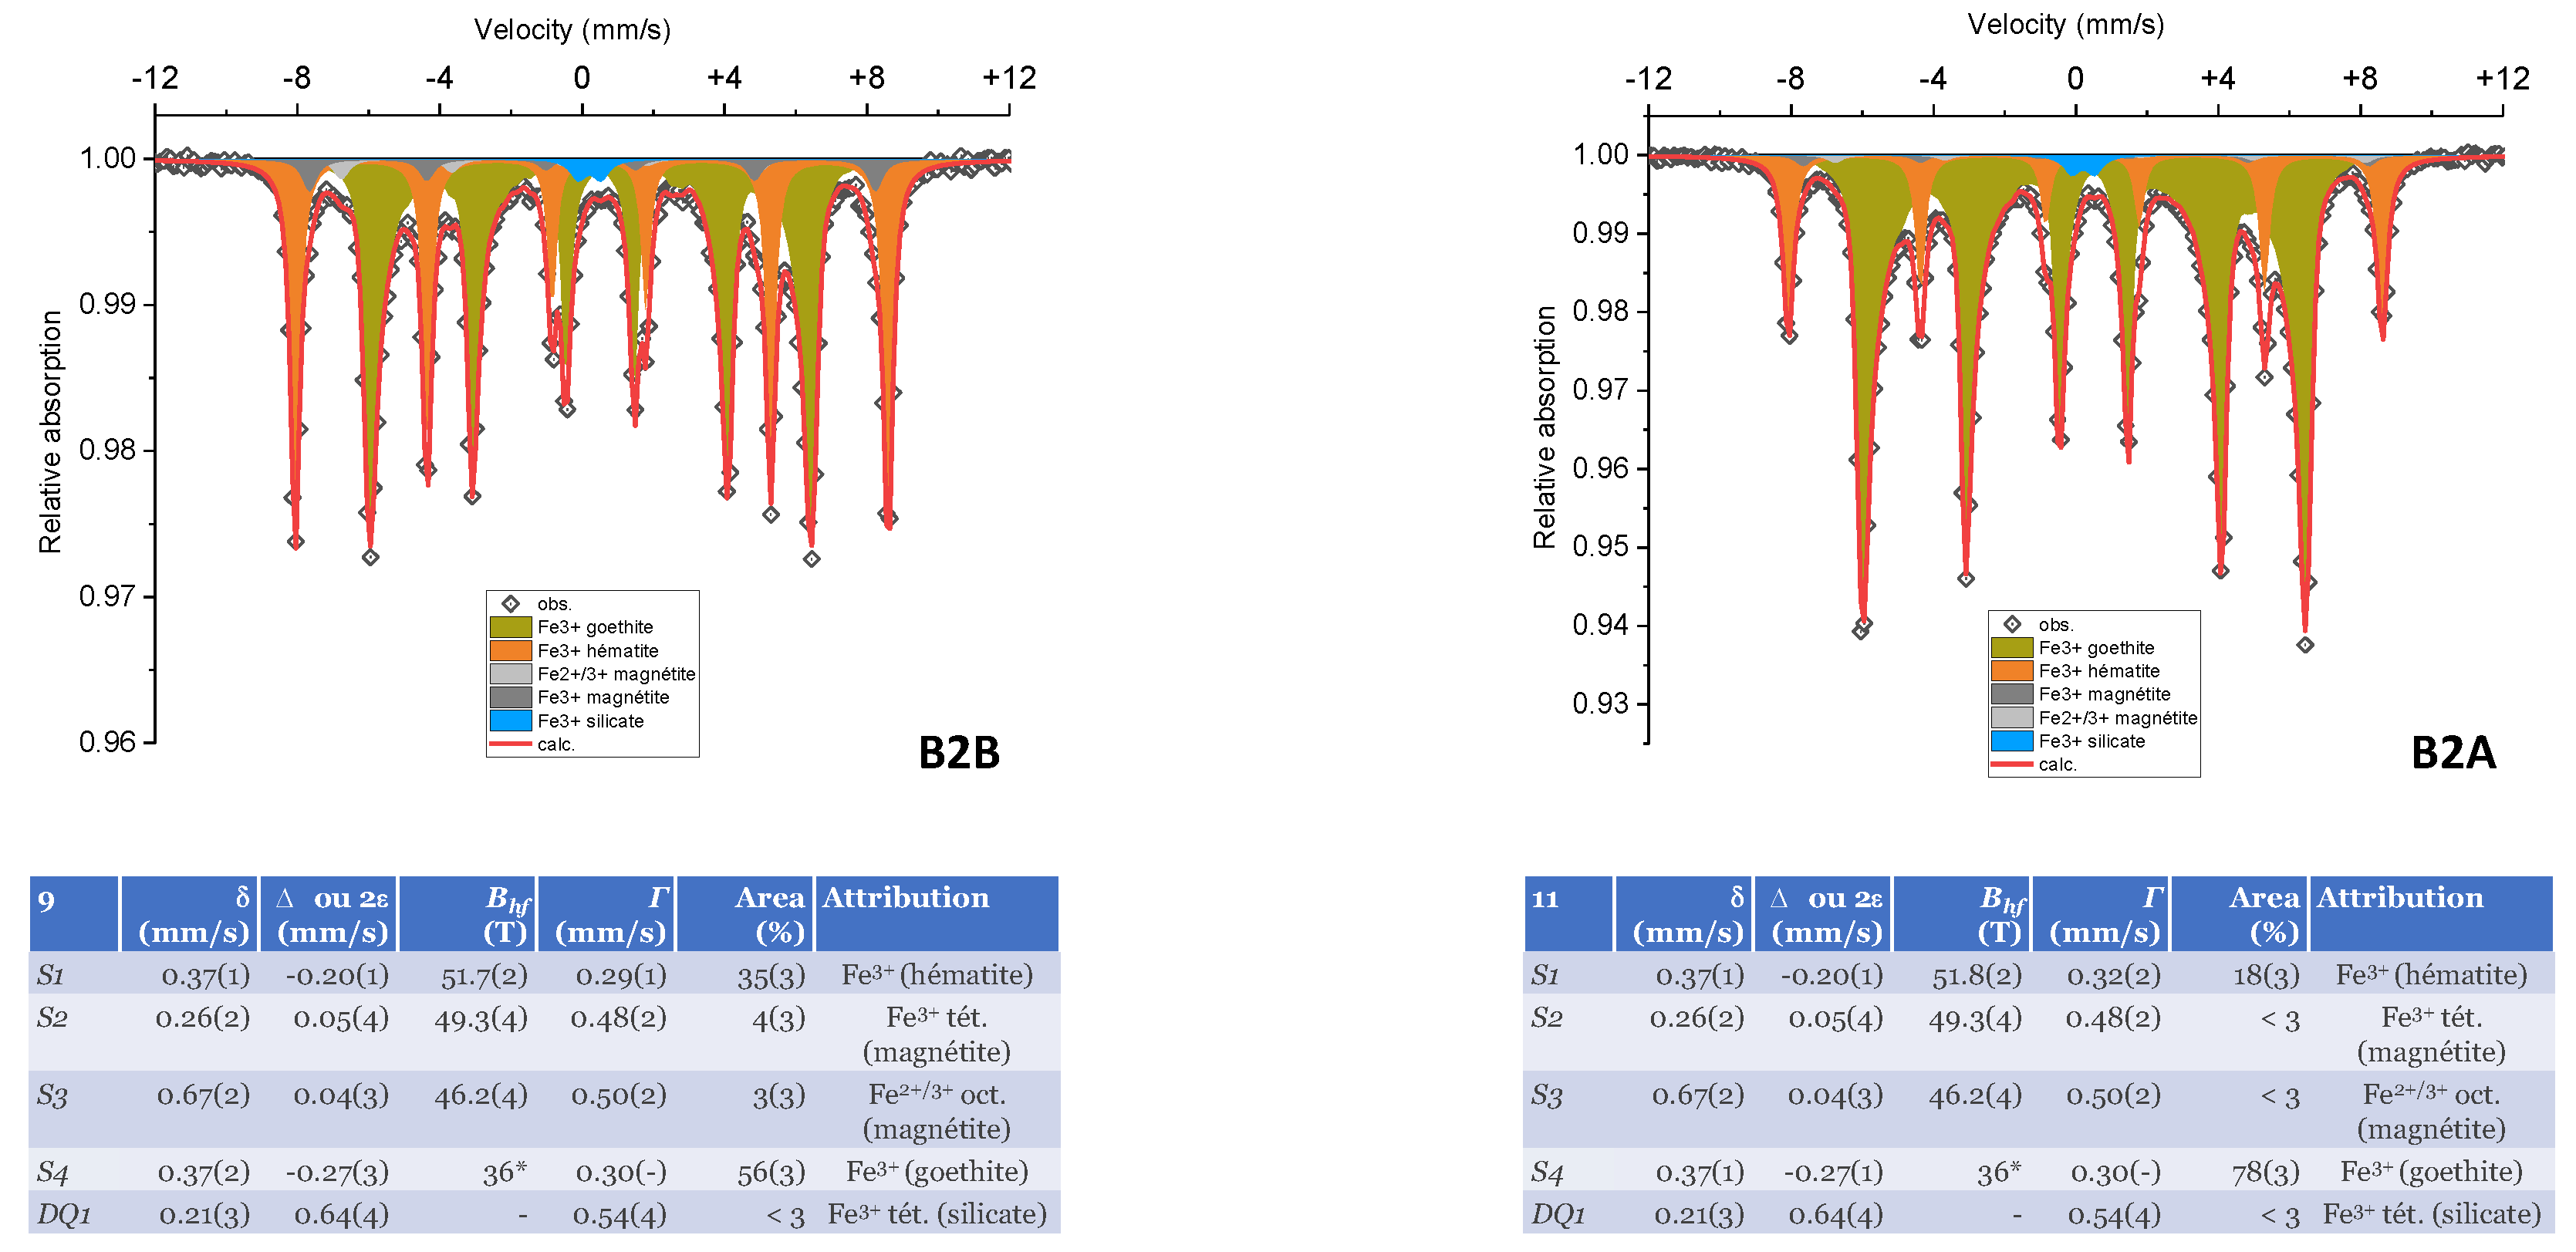
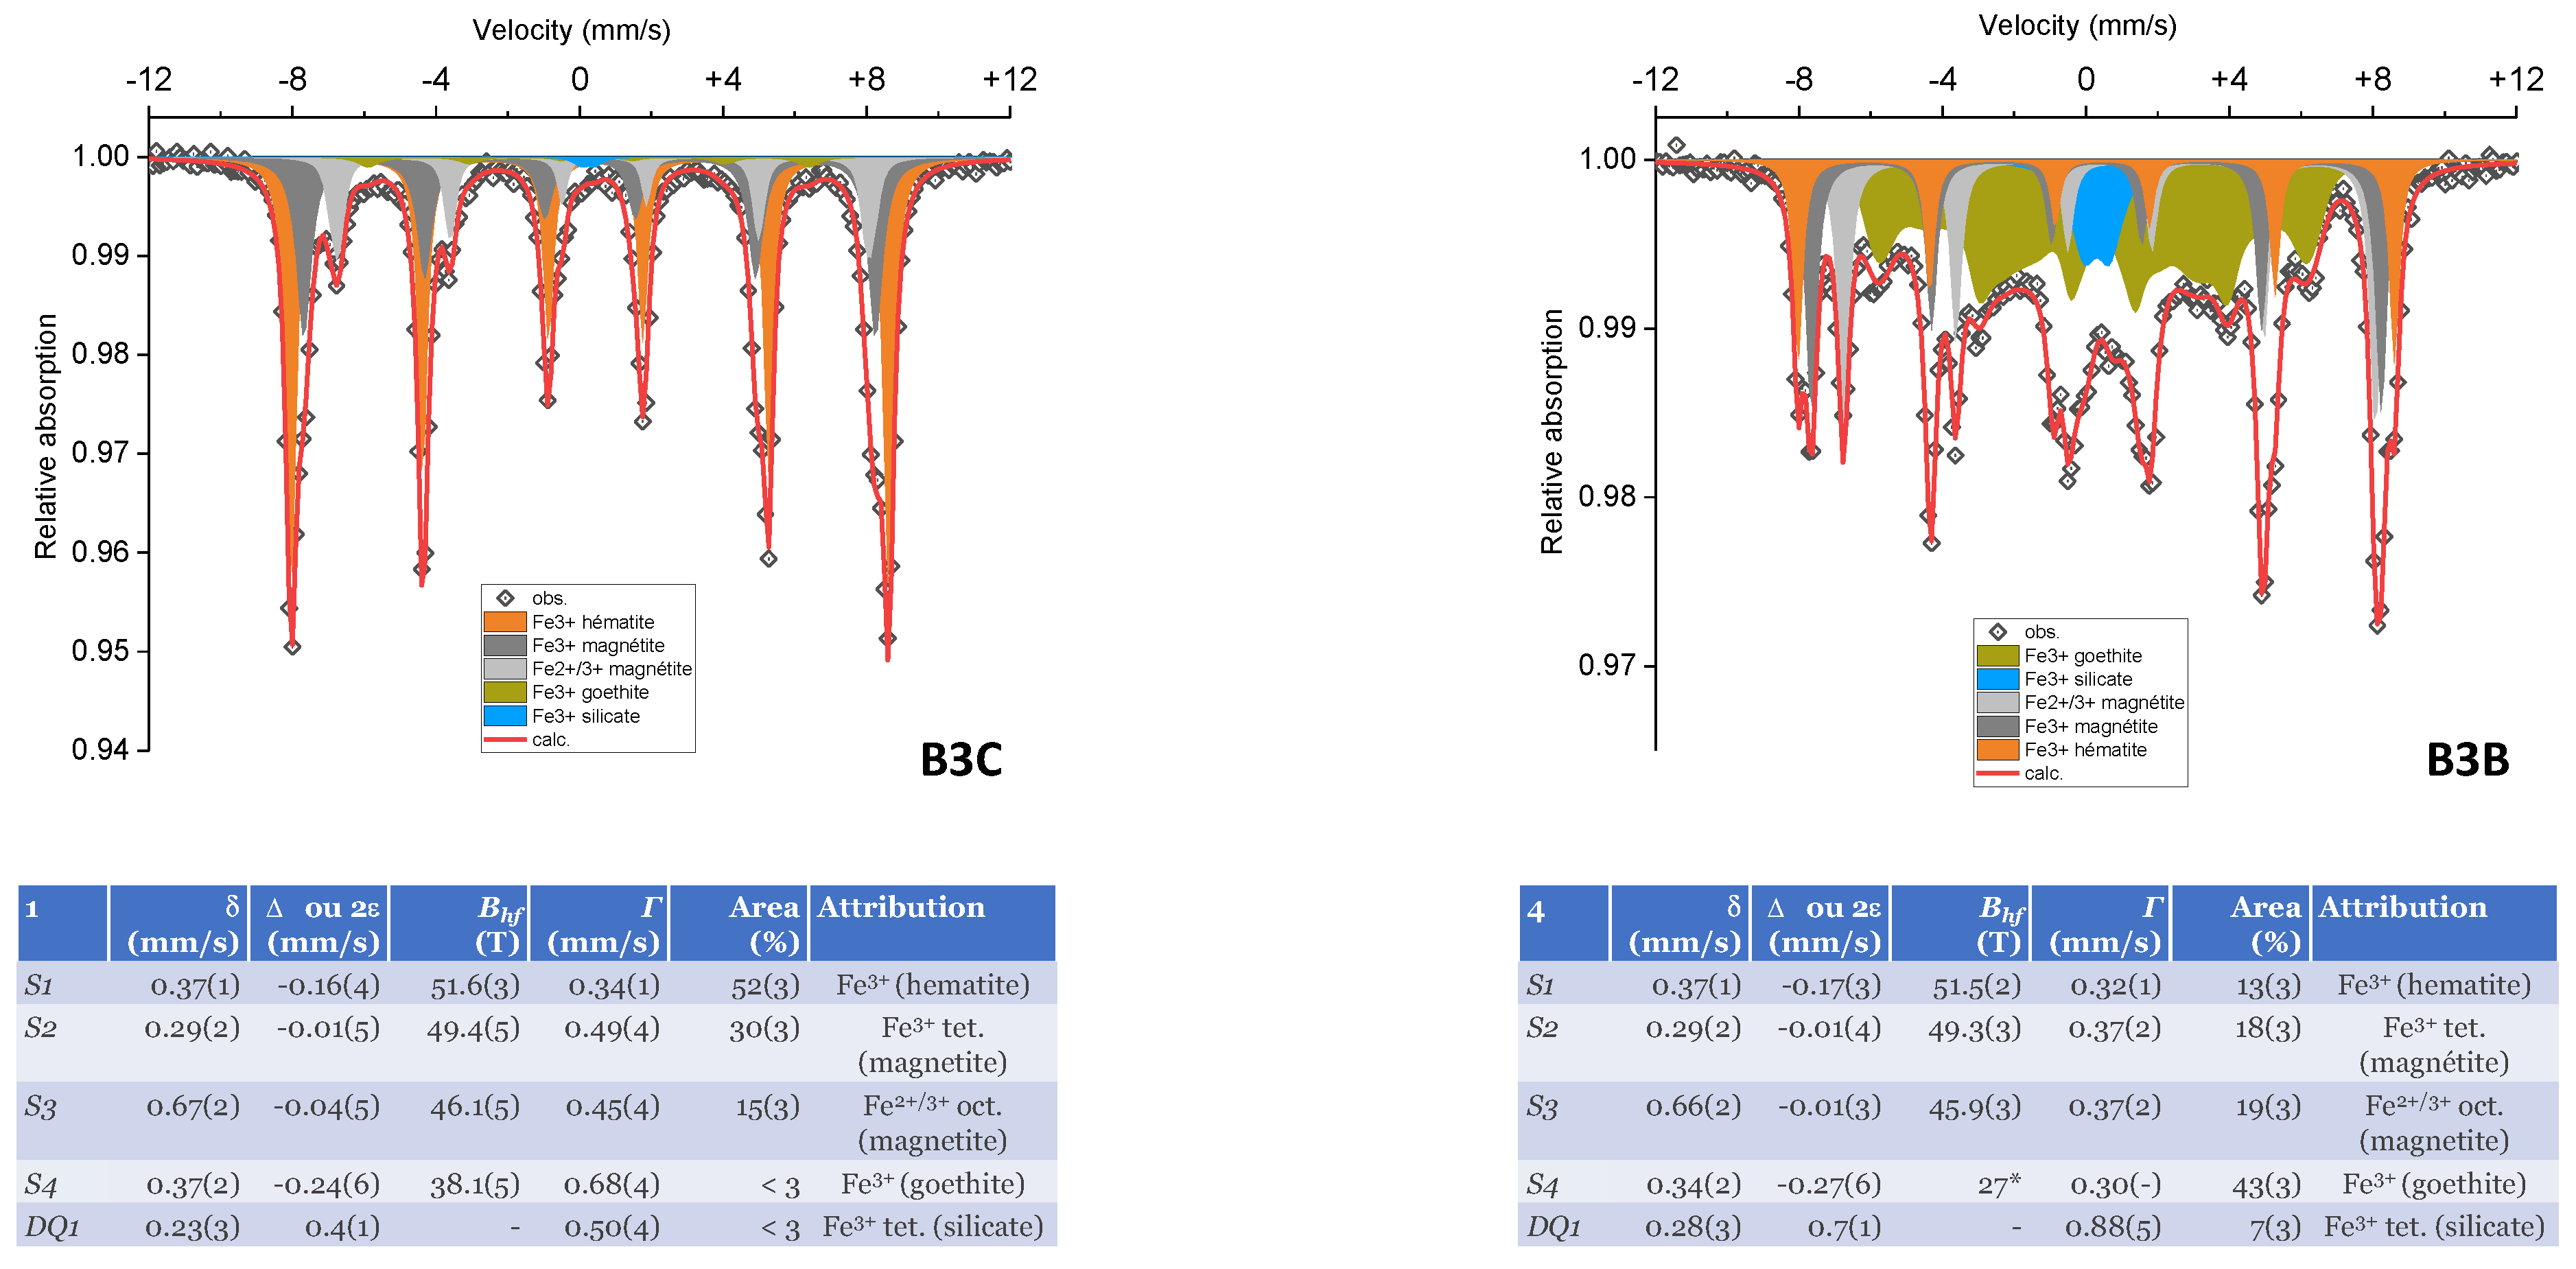
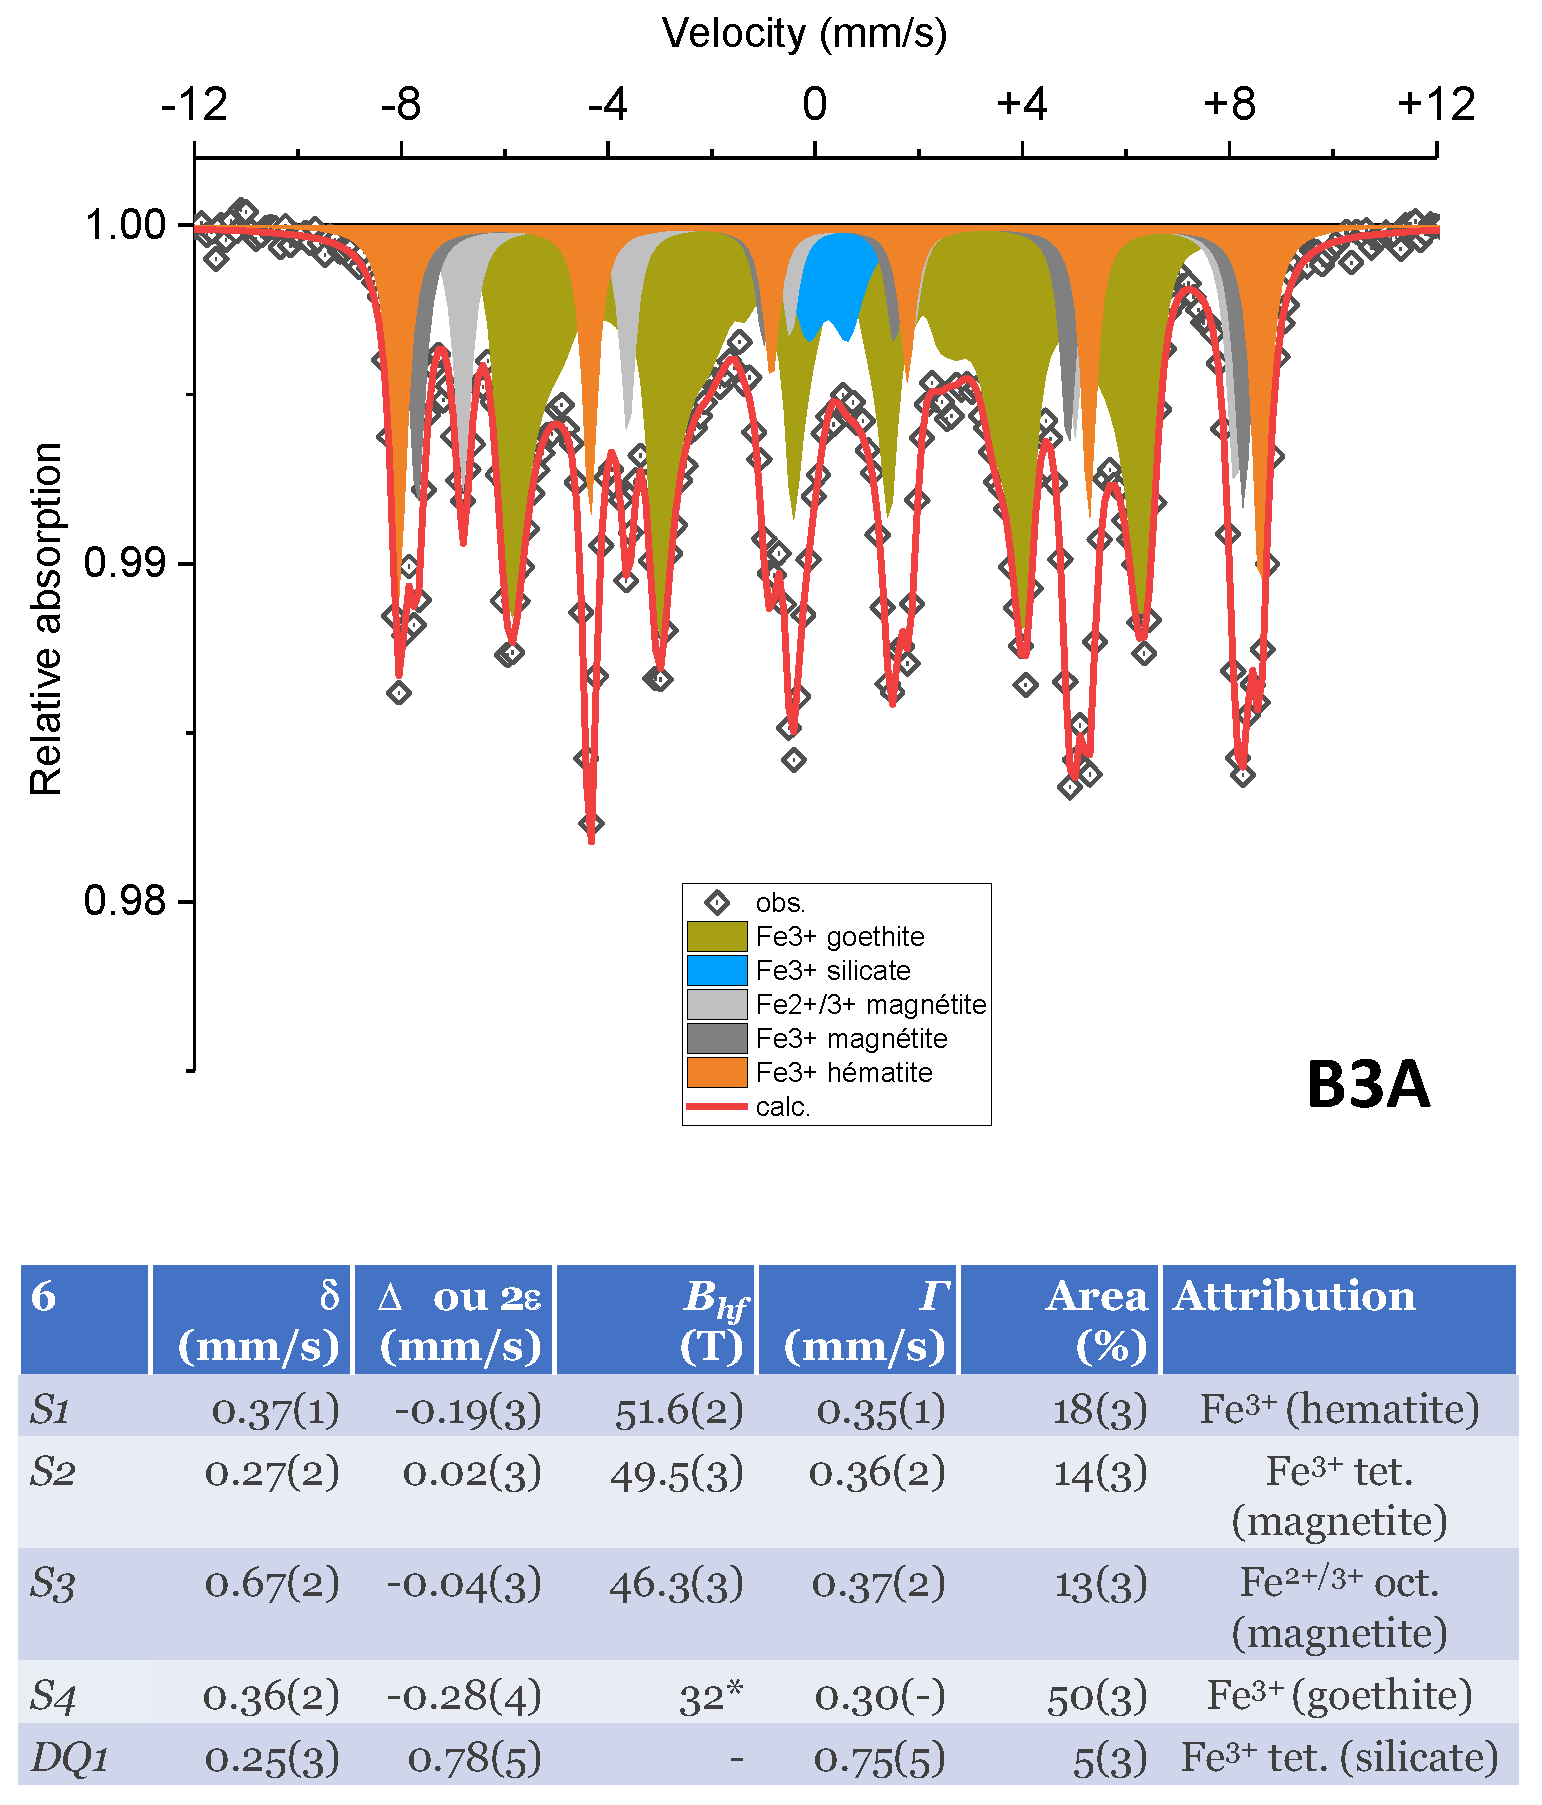
4.3.1. Samples Composition
- Iron content and speciation
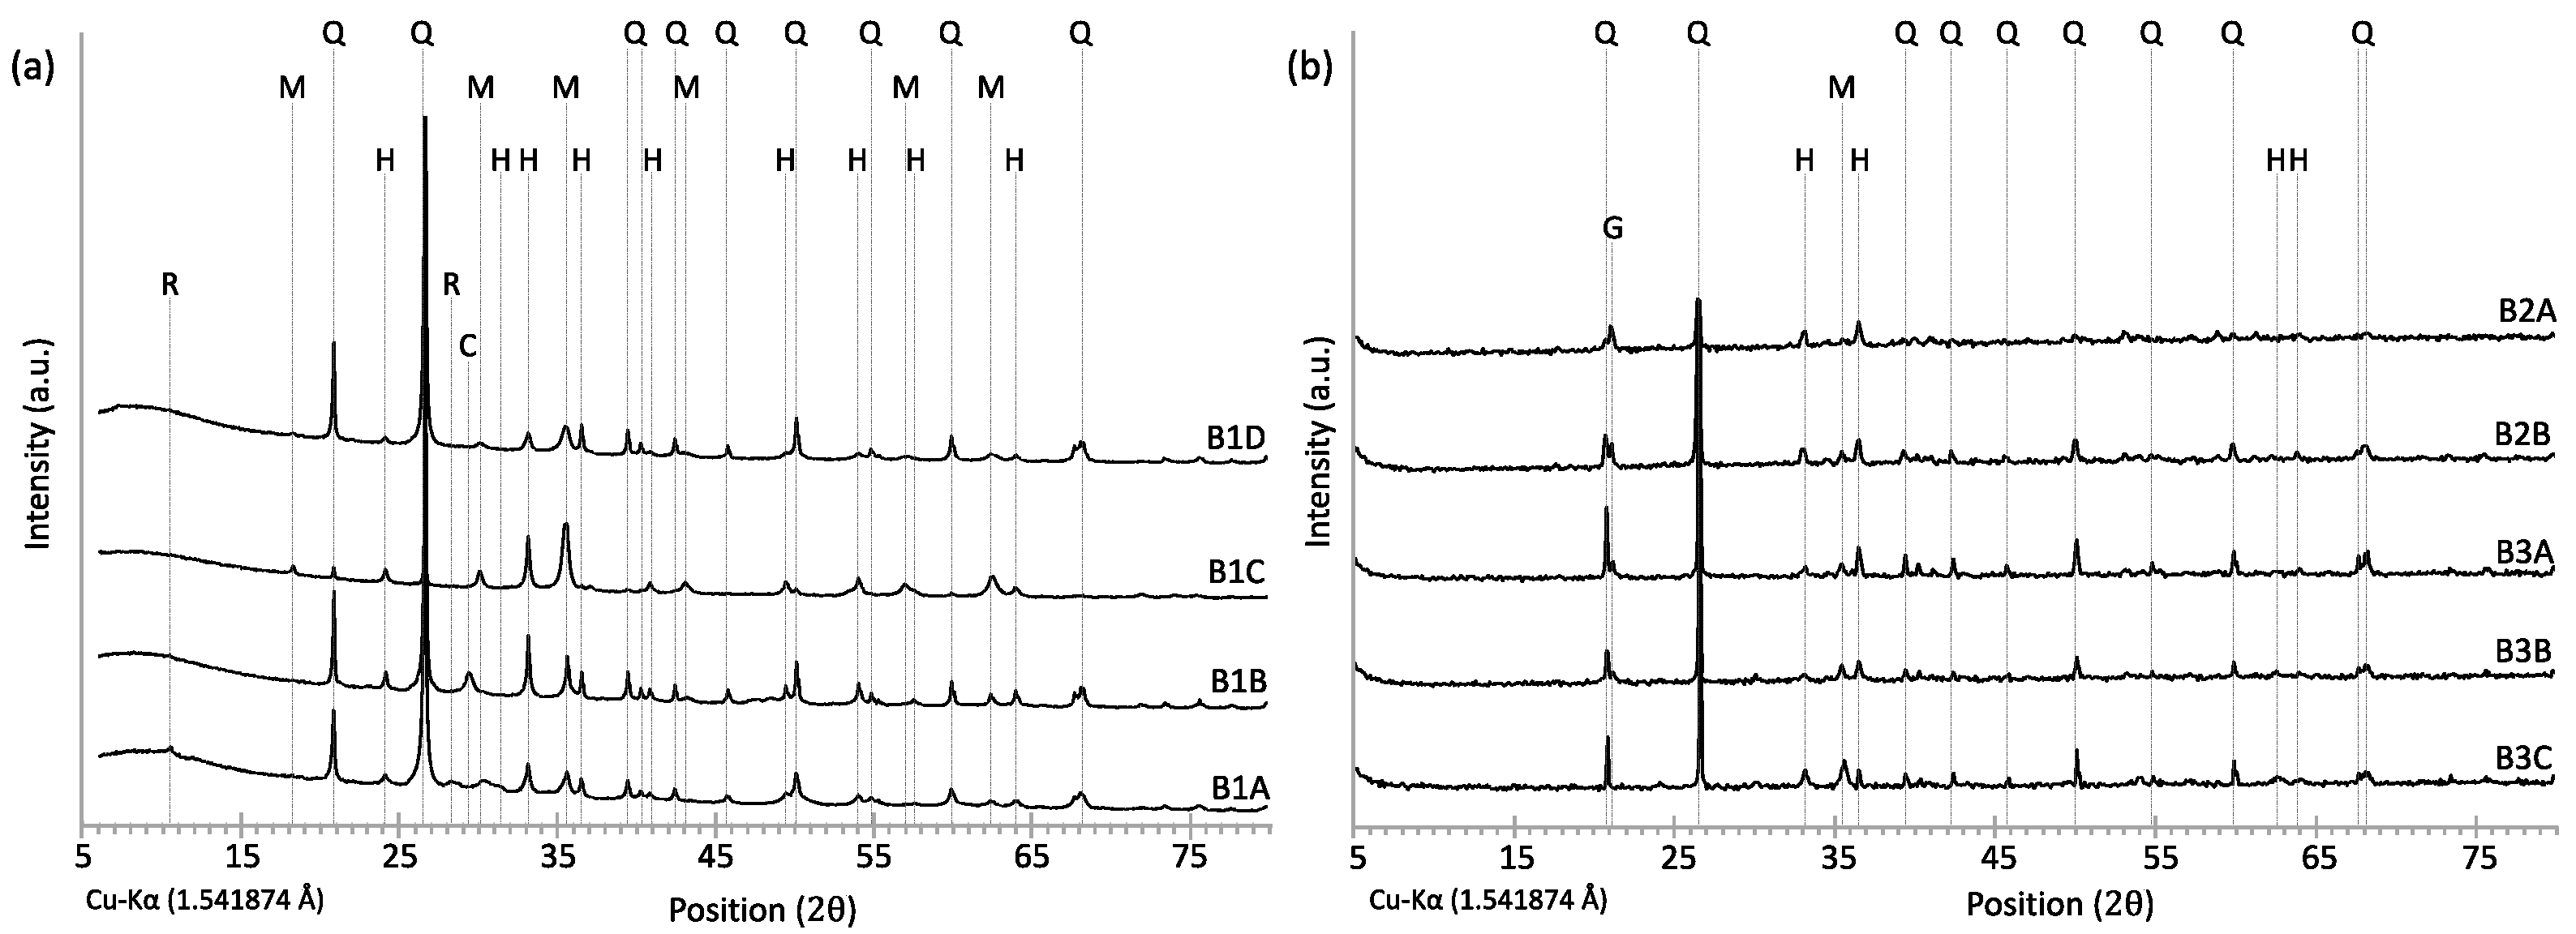
- Mineralogy
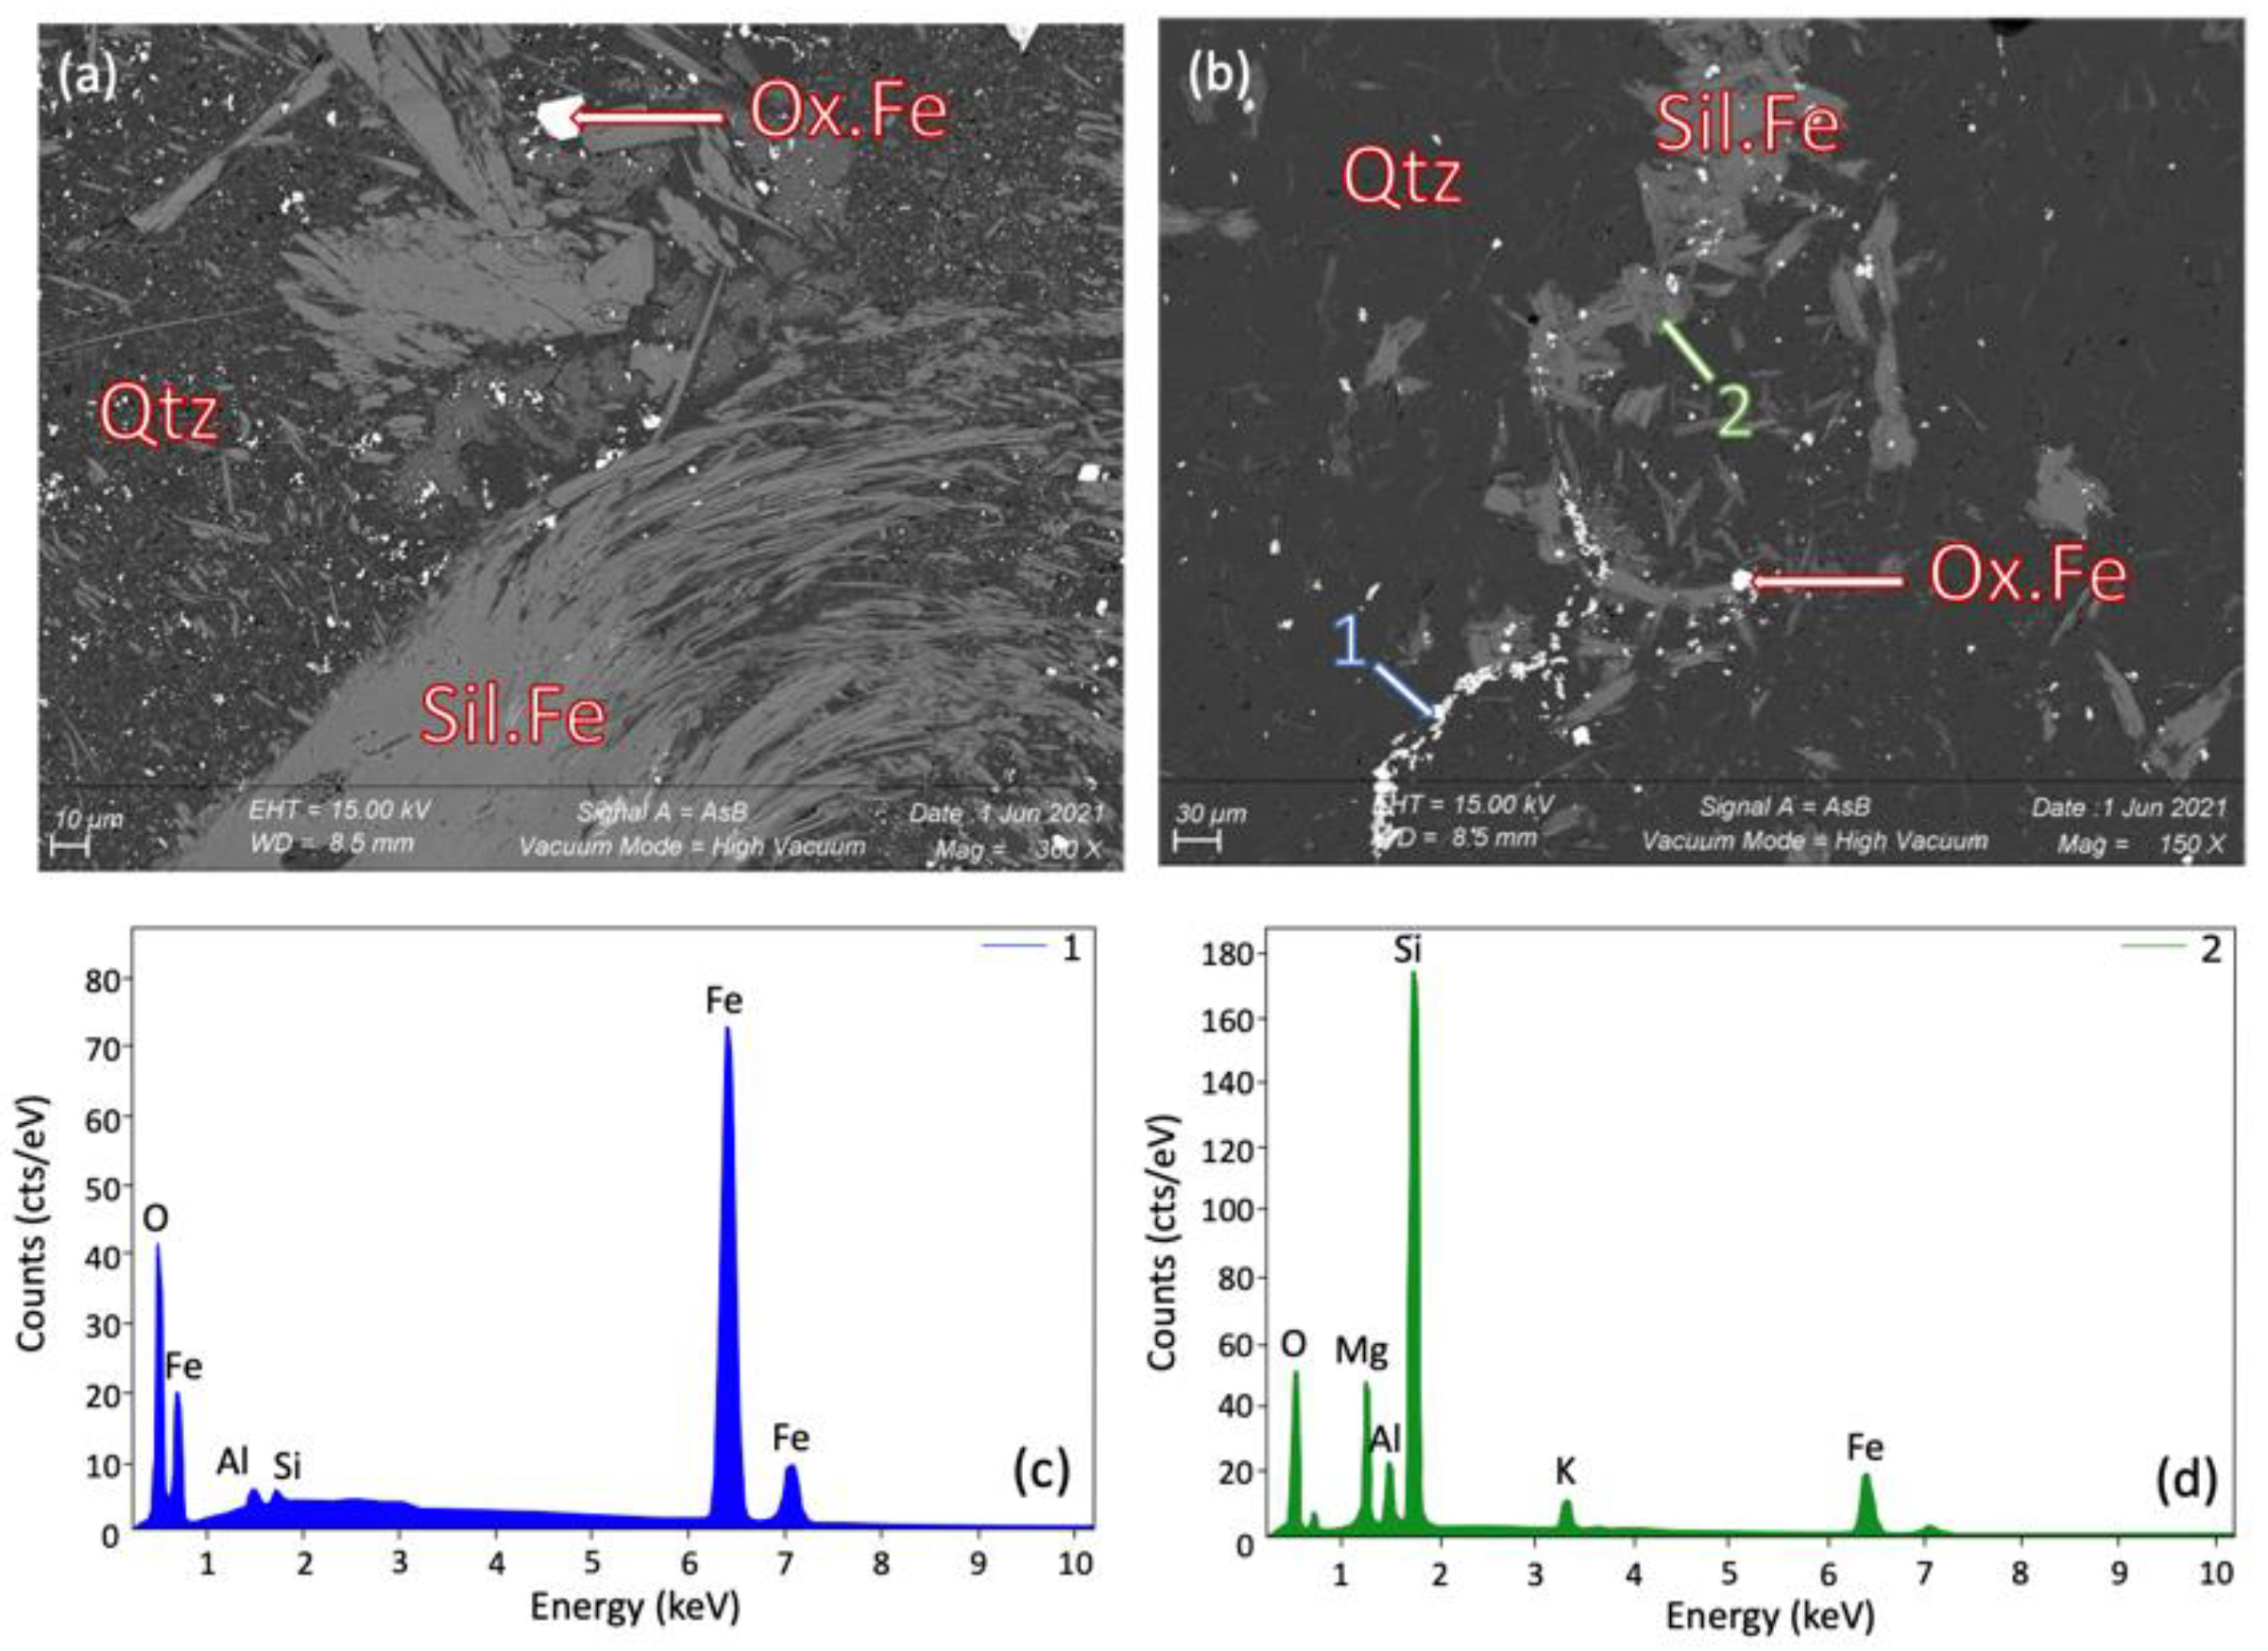
4.3.2. Microscopic Observations
- Fresh BIF
4.4. Discussion
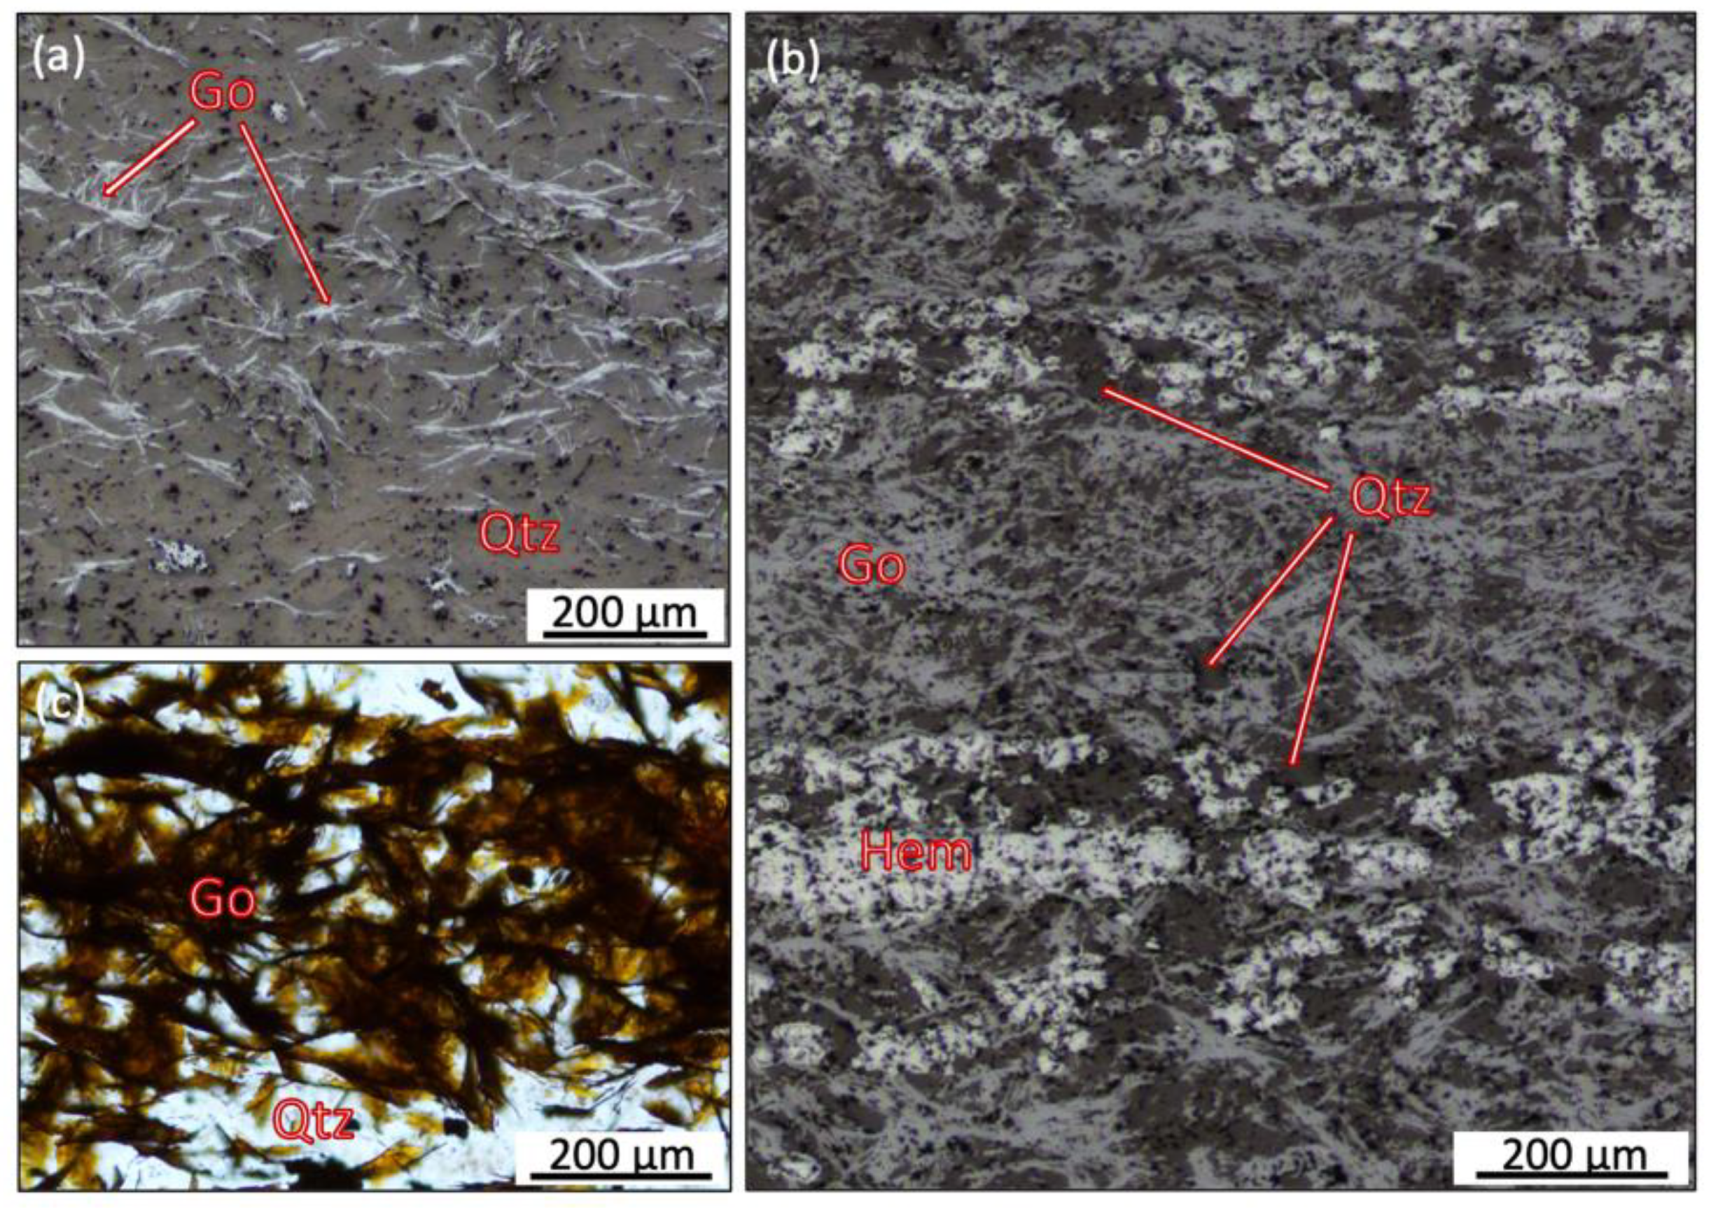
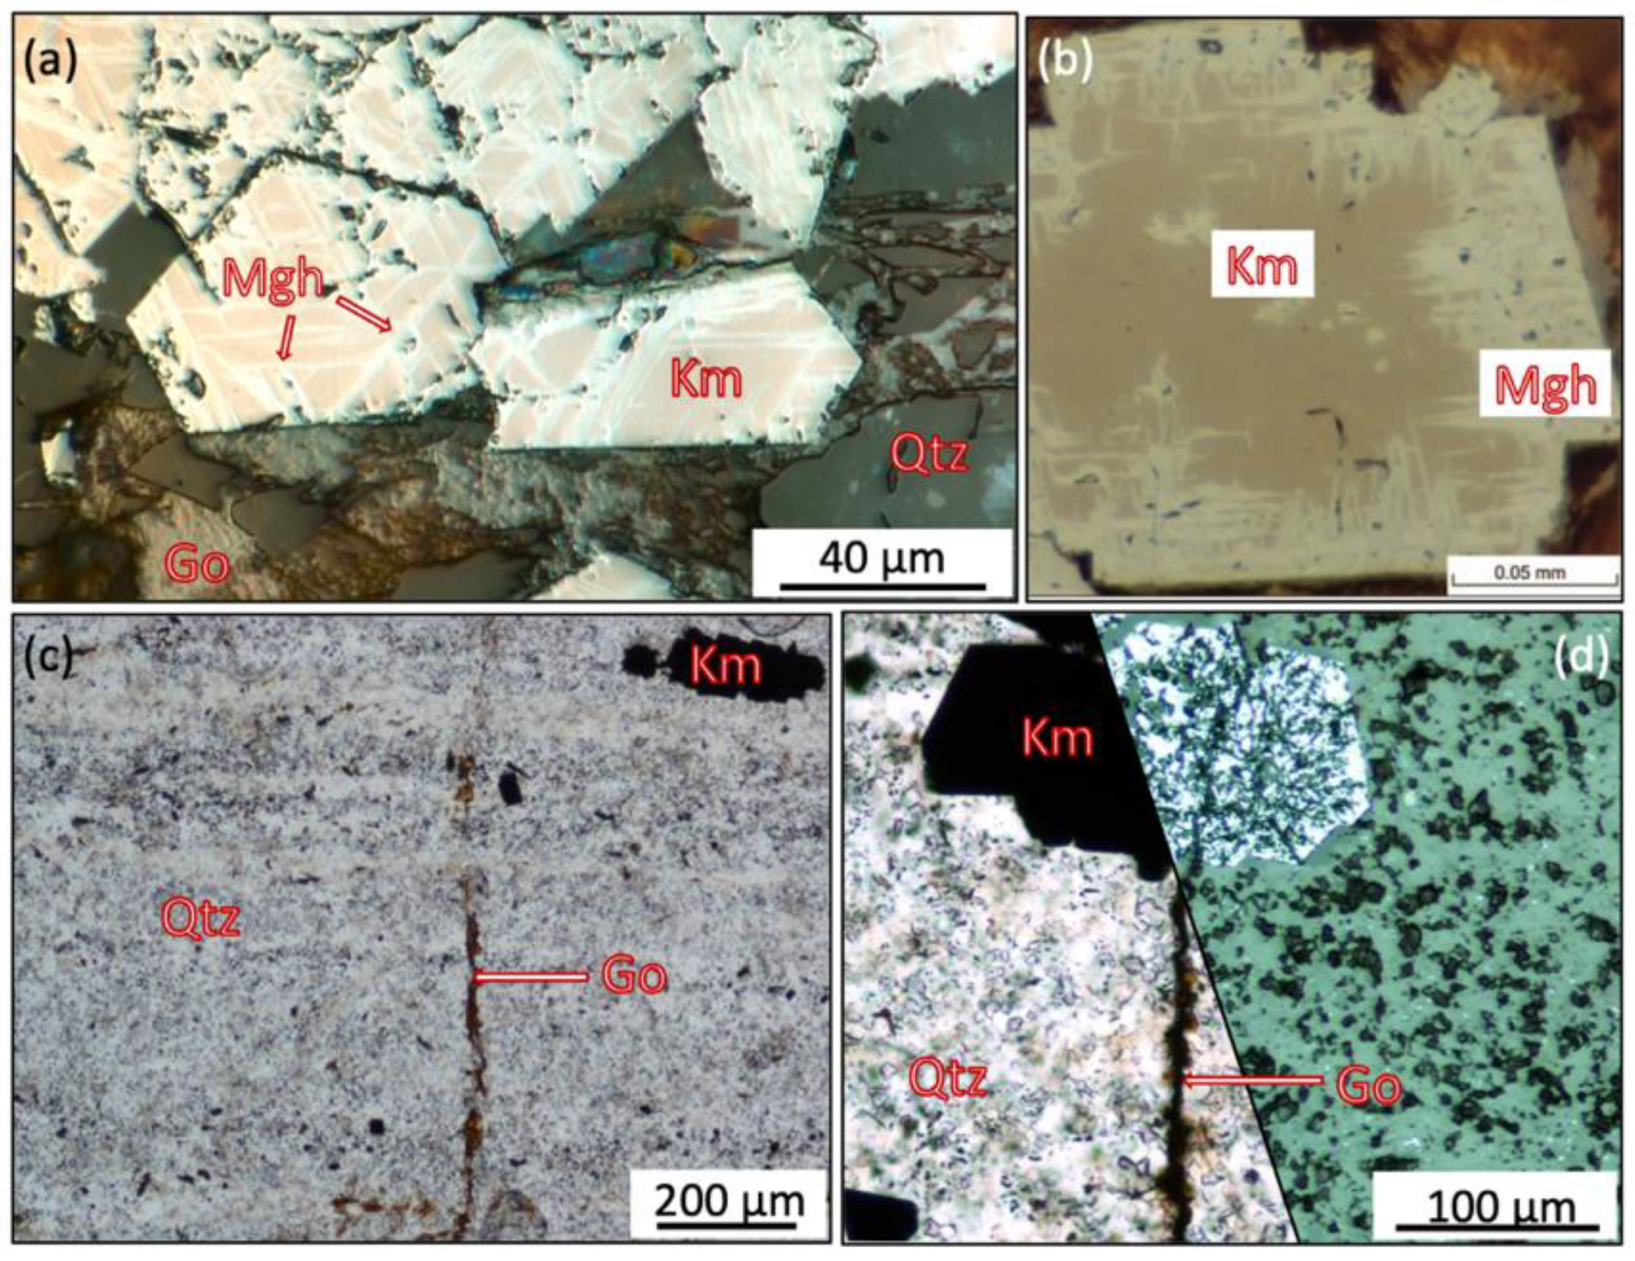
4.4.1. Mineralogical Evidence for H2 Production
- Fe2+-bearing silicates alteration
- Fe2+-bearing oxide alteration
4.4.2. Is Water the Main Oxidant during BIF Alteration?
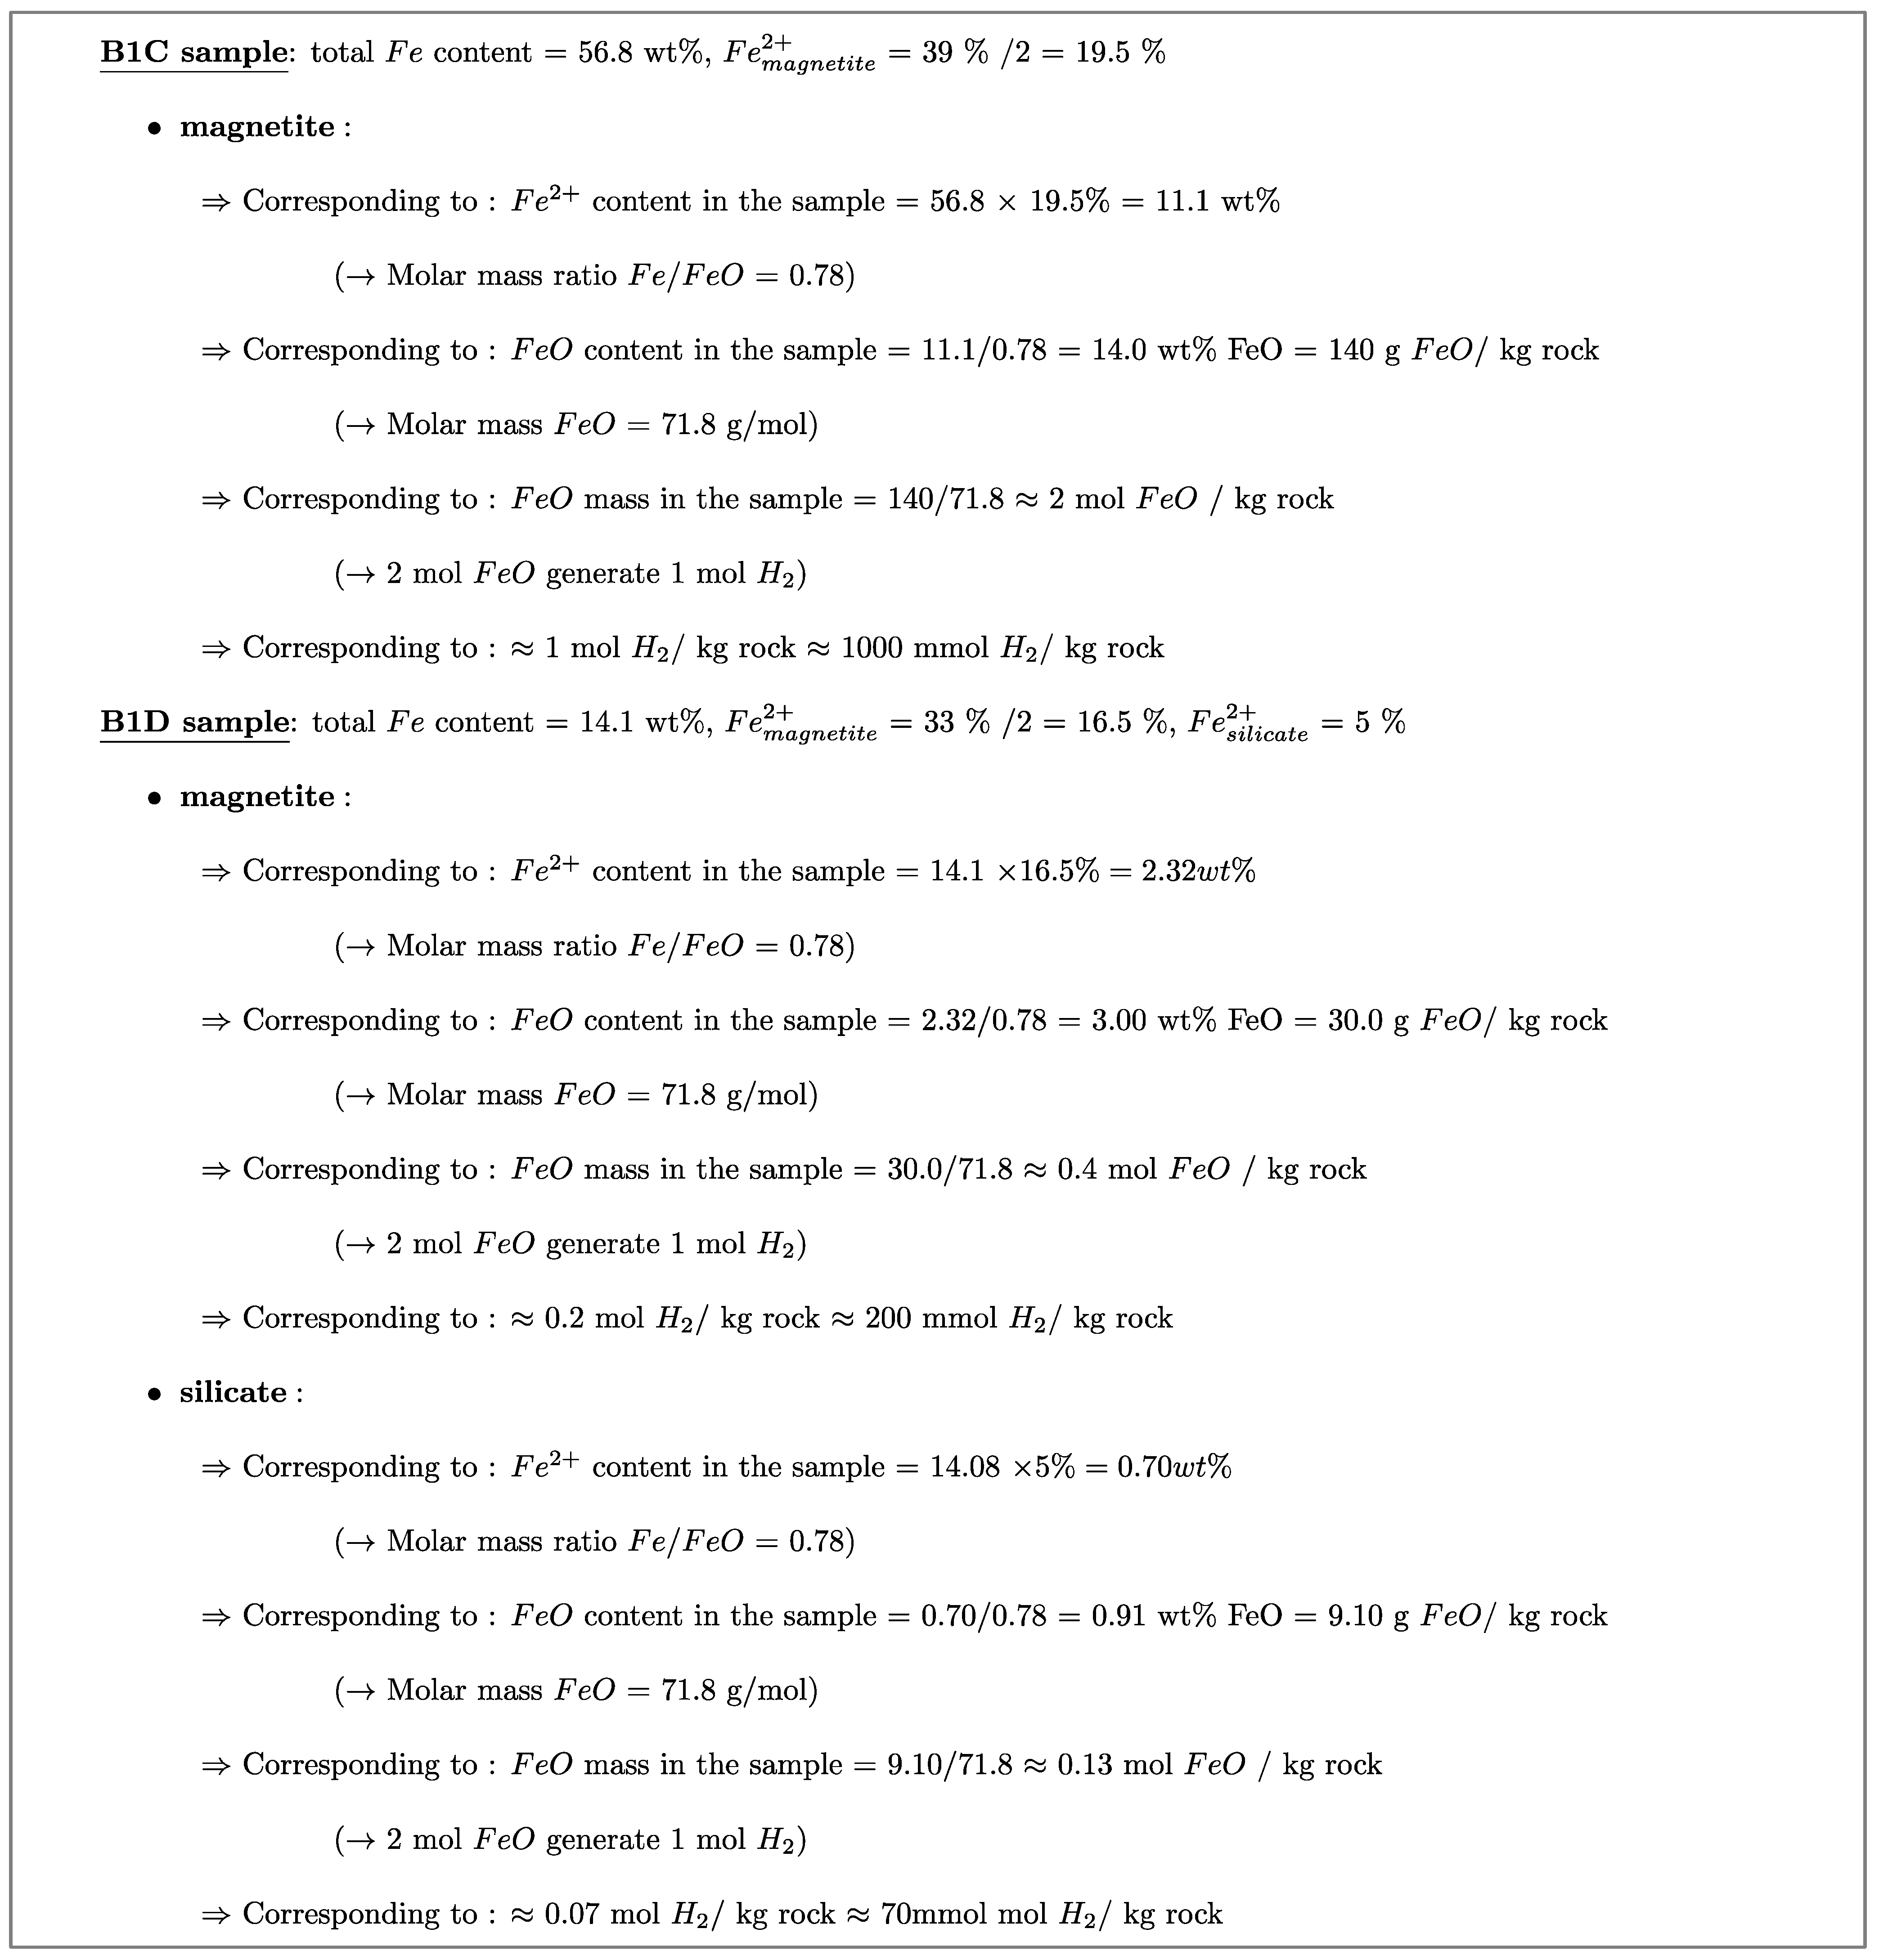
4.4.3. Fe2+-Budget for H2 Generation in Fresh BIF1 Sample
4.4.4. Is There a Temporal Concordance between BIF Alteration and H2 Emissions?
4.4.5. Kinetic Factors Concern for H2 Generation by BIF Oxidation
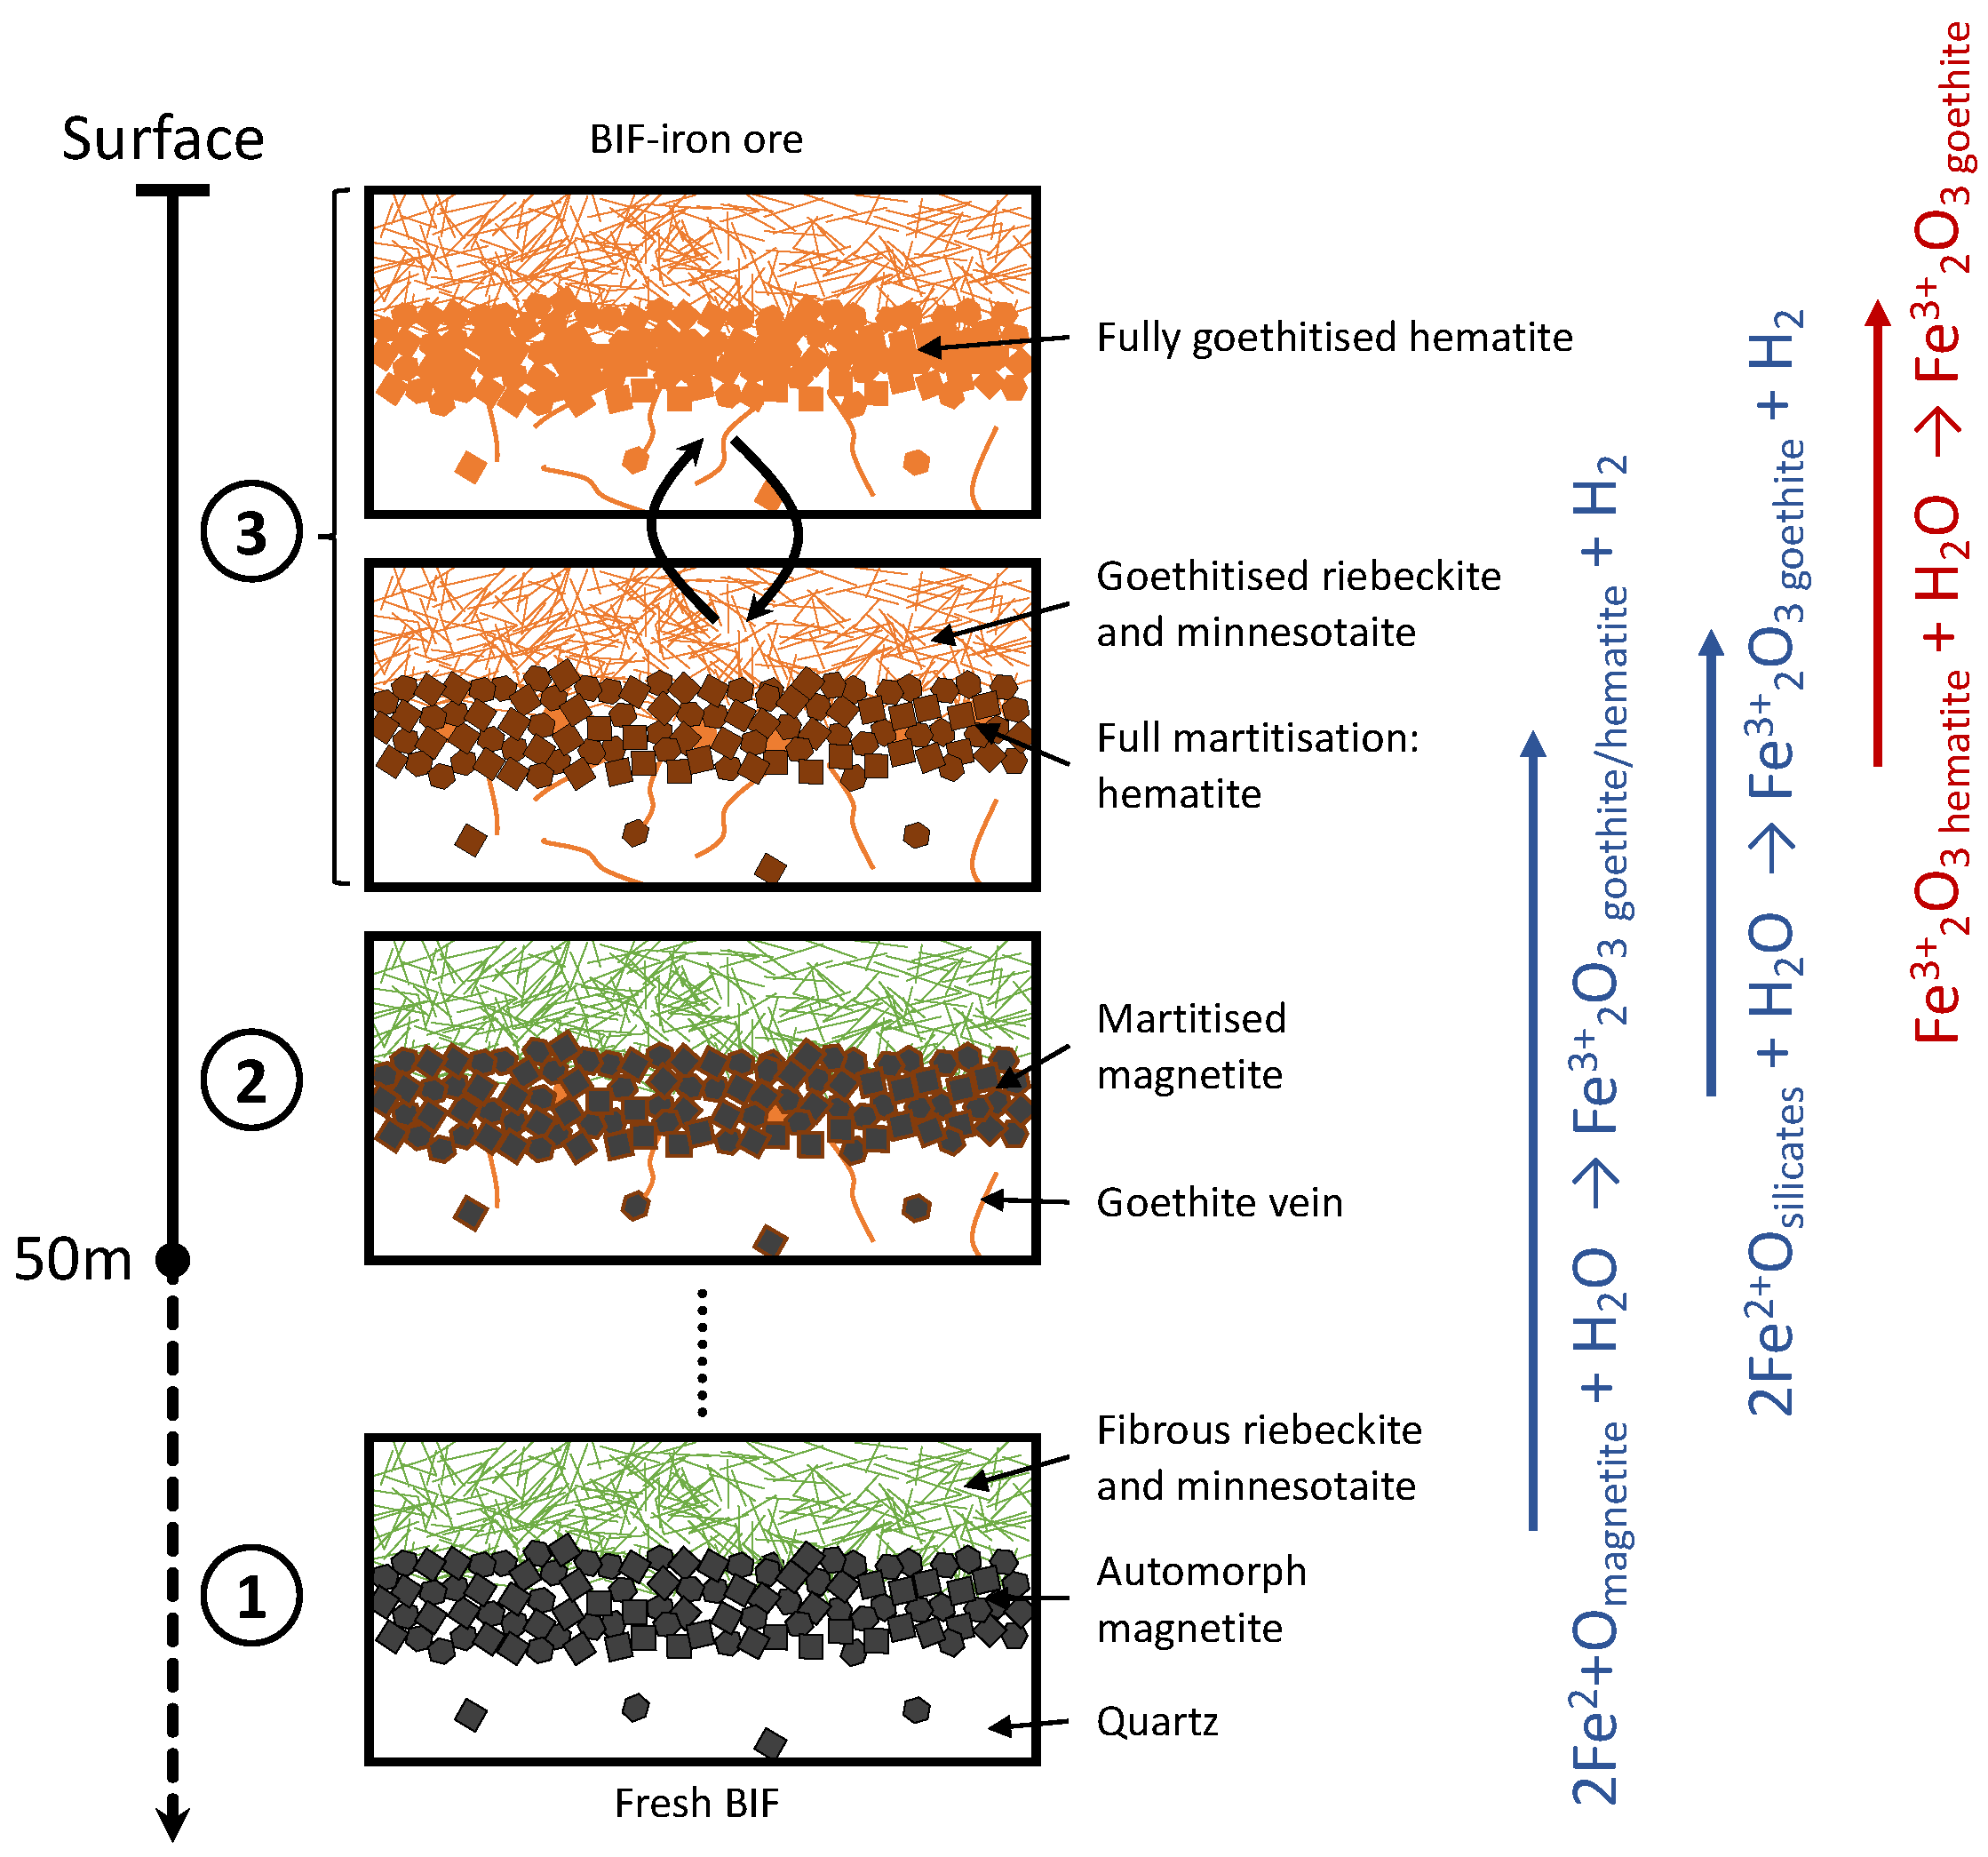
4.5. Synthesis of the Petrographic Study: A Model of BIF Samples Alteration and Related H2 Generation
- The BIF samples are made up of alternating layers of quartz and primary automorphy magnetite. In the quartz layers, various proportions of minor phases such as primary iron silicates and primary iron oxides occur;
- When weathering starts, the BIF undertakes an oxidation episode, underlined by the presence of kenomagnetite and maghemite, which mark the on-going martitization process of the primary magnetite. The martitization can be accompanied by a mobilization of Fe2+ in circulation fluids before reprecipitation as Fe3+ in goethite veins closer to the surface when the medium become more oxidizing. Quartz starts being dissolved, increasing progressively the permeability and hence fluid circulation;
- A second oxidative alteration episode occurs closer to the surface, when fluid circulation intensifies. The minor phases such as iron silicates or carbonates are destabilized and ferric iron precipitates in situ as goethite pseudomorph, or ex situ in voids created by the rock leaching.
5. Conclusions
- Topography and sky images analyses
- Petrological study
- Implications for the future of H2 exploration
Author Contributions
Funding
Data Availability Statement
Acknowledgments
Conflicts of Interest
Appendix A

| Sample | Chemical Composition—ICP-OES (wt%) | |||||||||||
|---|---|---|---|---|---|---|---|---|---|---|---|---|
| SiO2 | Al2O3 | Fe2O3 | MnO | MgO | CaO | Na2O | K2O | TiO2 | P2O5 | L.O.I. * | Total | |
| B1A | 71.06 | 0.11 | 16.83 | <D.L. | 1.37 | 1.07 | 1.04 | <D.L. | <D.L. | <D.L. | 2.72 | 94.19 |
| B1B | 57.55 | 0.05 | 21.60 | 0.027 | 0.13 | 10.54 | 0.12 | <D.L. | <D.L. | <D.L. | 9.61 | 99.61 |
| B1C | 15.78 | 0.29 | 81.18 | <D.L. | 0.88 | 0.50 | 0.10 | 0.12 | <D.L. | 0.35 | 0.38 | 99.58 |
| B1D | 73.95 | 0.51 | 20.11 | <D.L. | 2.62 | 0.04 | 0.08 | 0.23 | <D.L. | <D.L. | 2.29 | 99.83 |
| B2A | 32.32 | 0.25 | 60.81 | <D.L. | <D.L. | 0.03 | <D.L. | <D.L. | <D.L. | 0.10 | 6.50 | 100.01 |
| B2B | 55.00 | 0.05 | 41.35 | <D.L. | <D.L. | <D.L. | <D.L. | <D.L. | <D.L. | <D.L. | 3.24 | 99.63 |
| B3A | 58.18 | <D.L. | 38.59 | 0.23 | 0.09 | 0.04 | <D.L. | <D.L. | <D.L. | 0.10 | 2.66 | 99.88 |
| B3B | 43.30 | <D.L. | 52.67 | 0.19 | 0.19 | 0.04 | <D.L. | <D.L. | <D.L. | <D.L. | 2.84 | 99.23 |
| B3C | 39.78 | <D.L. | 59.57 | <D.L. | <D.L. | 0.04 | <D.L. | <D.L. | <D.L. | <D.L. | −0.27 | 99.12 |
Appendix B


Appendix C

References
- Prinzhofer, A.; Deville, É. Hydrogène Naturel: La Prochaine Révolution Energétique? Belin: Paris, France, 2015; ISBN 978-2-7011-8384-8. [Google Scholar]
- Truche, L.; McCollom, T.M.; Martinez, I. Hydrogen and Abiotic Hydrocarbons: Molecules That Change the World. Elements 2020, 16, 13–18. [Google Scholar] [CrossRef]
- Krasnov, S.G.; Cherkashev, G.A.; Stepanova, T.V.; Batuyev, B.N.; Krotov, A.G.; Malin, B.V.; Maslov, M.N.; Markov, V.F.; Poroshina, I.M.; Samovarov, M.S.; et al. Detailed Geological Studies of Hydrothermal Fields in the North Atlantic. Geol. Soc. Lond. Spec. Publ. 1995, 87, 43–64. [Google Scholar] [CrossRef]
- Charlou, J.L.; Donval, J.P.; Fouquet, Y.; Jean-Baptiste, P.; Holm, N. Geochemistry of High H2 and CH4 Vent Fluids Issuing from Ultramafic Rocks at the Rainbow Hydrothermal Field (36j14VN, MAR). Chem. Geol. 2002, 191, 345–359. [Google Scholar] [CrossRef]
- Welhan, J.A.; Craig, H. Methane and Hydrogen in East Pacific Rise Hydrothermal Fluids. Geophys. Res. Lett. 1979, 6, 829–831. [Google Scholar] [CrossRef]
- Guélard, J.; Beaumont, V.; Rouchon, V.; Guyot, F.; Pillot, D.; Jézéquel, D.; Ader, M.; Newell, K.D.; Deville, E. Natural H2 in Kansas: Deep or Shallow Origin? Geochem. Geophys. Geosyst. 2017, 18, 1841–1865. [Google Scholar] [CrossRef]
- Prinzhofer, A.; Cissé, C.S.T.; Diallo, A.B. Discovery of a Large Accumulation of Natural Hydrogen in Bourakebougou (Mali). Int. J. Hydrog. Energy 2018, 43, 19315–19326. [Google Scholar] [CrossRef]
- Etiope, G.; Schoell, M.; Hosgörmez, H. Abiotic Methane Flux from the Chimaera Seep and Tekirova Ophiolites (Turkey): Understanding Gas Exhalation from Low Temperature Serpentinization and Implications for Mars. Earth Planet. Sci. Lett. 2011, 310, 96–104. [Google Scholar] [CrossRef]
- Prinzhofer, A.; Moretti, I.; Françolin, J.; Pacheco, C.; D’Agostino, A.; Werly, J.; Rupin, F. Natural Hydrogen Continuous Emission from Sedimentary Basins: The Example of a Brazilian H2-Emitting Structure. Int. J. Hydrog. Energy 2019, 44, 5676–5685. [Google Scholar] [CrossRef]
- Zgonnik, V.; Beaumont, V.; Deville, E.; Larin, N.; Pillot, D.; Farrell, K.M. Evidence for Natural Molecular Hydrogen Seepage Associated with Carolina Bays (Surficial, Ovoid Depressions on the Atlantic Coastal Plain, Province of the USA). Prog. Earth Planet. Sci. 2015, 2, 31. [Google Scholar] [CrossRef] [Green Version]
- Lollar, B.S.; Onstott, T.C.; Lacrampe-Couloume, G.; Ballentine, C.J. The Contribution of the Precambrian Continental Lithosphere to Global H2 Production. Nature 2014, 516, 379–382. [Google Scholar] [CrossRef]
- Moretti, I.; Brouilly, E.; Loiseau, K.; Prinzhofer, A.; Deville, E. Hydrogen Emanations in Intracratonic Areas: New Guide Lines for Early Exploration Basin Screening. Geosciences 2021, 11, 145. [Google Scholar] [CrossRef]
- Moretti, I.; Prinzhofer, A.; Françolin, J.; Pacheco, C.; Rosanne, M.; Rupin, F.; Mertens, J. Long-Term Monitoring of Natural Hydrogen Superficial Emissions in a Brazilian Cratonic Environment. Sporadic Large Pulses versus Daily Periodic Emissions. Int. J. Hydrog. Energy 2021, 46, 3615–3628. [Google Scholar] [CrossRef]
- Zgonnik, V. The Occurrence and Geoscience of Natural Hydrogen: A Comprehensive Review. Earth Sci. Rev. 2020, 203, 103140. [Google Scholar] [CrossRef]
- Klein, C.; Beukes, N.J. Sedimentology and Geochemistry of the Glaciogenic Late Proterozoic Rapitan Iron-Formation in Canada. Econ. Geol. 1993, 88, 542–565. [Google Scholar] [CrossRef]
- Ramanaidou, E.R.; Wells, M.A. Sedimentary Hosted Iron Ores. In Treatise on Geochemistry; Elsevier: Amsterdam, The Netherlands, 2014; pp. 313–355. ISBN 978-0-08-098300-4. [Google Scholar]
- Ilyin, A.V. Neoproterozoic Banded Iron Formations. Lithol. Miner. Resour. 2009, 44, 78–86. [Google Scholar] [CrossRef]
- Bekker, A.; Slack, J.F.; Planavsky, N.; Krapez, B.; Hofmann, A.; Konhauser, K.O.; Rouxel, O.J. Iron Formation: The Sedimentary Product of a Complex Interplay among Mantle, Tectonic, Oceanic, and Biospheric Processes. Econ. Geol. 2010, 105, 467–508. [Google Scholar] [CrossRef]
- Cox, G.M.; Halverson, G.P.; Minarik, W.G.; Le Heron, D.P.; Macdonald, F.A.; Bellefroid, E.J.; Strauss, J.V. Neoproterozoic Iron Formation: An Evaluation of Its Temporal, Environmental and Tectonic Significance. Chem. Geol. 2013, 362, 232–249. [Google Scholar] [CrossRef] [Green Version]
- Zhu, X.-Q.; Tang, H.-S.; Sun, X.-H. Genesis of Banded Iron Formations: A Series of Experimental Simulations. Ore Geol. Rev. 2014, 63, 465–469. [Google Scholar] [CrossRef]
- Angerer, T.; Duuring, P.; Hagemann, S.G.; Thorne, W.; McCuaig, T.C. A Mineral System Approach to Iron Ore in Archaean and Palaeoproterozoic BIF of Western Australia. Geol. Soc. Lond. Spec. Publ. 2015, 393, 81–115. [Google Scholar] [CrossRef]
- Klein, C. Some Precambrian Banded Iron-Formations (BIFs) from around the World: Their Age, Geologic Setting, Mineralogy, Metamorphism, Geochemistry, and Origins. Am. Mineral. 2005, 90, 1473–1499. [Google Scholar] [CrossRef]
- Myagkiy, A.; Brunet, F.; Popov, C.; Krüger, R.; Guimarães, H.; Sousa, R.S.; Charlet, L.; Moretti, I. H2 Dynamics in the Soil of a H2-Emitting Zone (São Francisco Basin, Brazil): Microbial Uptake Quantification and Reactive Transport Modelling. Appl. Geochem. 2020, 112, 104474. [Google Scholar] [CrossRef]
- Myagkiy, A.; Moretti, I.; Brunet, F. Space and Time Distribution of Subsurface H2 Concentration in so-Called “Fairy Circles”: Insight from a Conceptual 2-D Transport Model. BSGF Earth Sci. Bull. 2020, 191, 13. [Google Scholar] [CrossRef]
- Larin, N.; Zgonnik, V.; Rodina, S.; Deville, E.; Prinzhofer, A.; Larin, V.N. Natural Molecular Hydrogen Seepage Associated with Surficial, Rounded Depressions on the European Craton in Russia. Nat. Resour. Res. 2015, 24, 369–383. [Google Scholar] [CrossRef]
- Rezaee, R. Natural Hydrogen System in Western Australia? Earth Sci. 2020, 2020100589. [Google Scholar] [CrossRef]
- Frery, E.; Langhi, L.; Maison, M.; Moretti, I. Natural Hydrogen Seeps Identified in the North Perth Basin, Western Australia. Int. J. Hydrog. Energy 2021, 46, 31158–31173. [Google Scholar] [CrossRef]
- Tschinkel, W.R. Experiments Testing the Causes of Namibian Fairy Circles. PLoS ONE 2015, 10, e0140099. [Google Scholar] [CrossRef]
- Preiss, W.V. The Adelaide Geosyncline of South Australia and Its Significance in Neoproterozoic Continental Reconstruction. Precambrian Res. 2000, 100, 21–63. [Google Scholar] [CrossRef]
- Betts, P.; Giles, D. The 1800–1100Ma Tectonic Evolution of Australia. Precambrian Res. 2006, 144, 92–125. [Google Scholar] [CrossRef]
- Ward, L. Inflammable Gases Occluded in the Pre-Palaeozoic Rocks of South Australia. Trans. Proc. R. Soc. S. Aust. 1933, 57, 42–47. [Google Scholar]
- Boreham, C.J.; Edwards, D.S.; Czado, K.; Rollet, N.; Wang, L.; van der Wielen, S.; Champion, D.; Blewett, R.; Feitz, A.; Henson, P.A. Hydrogen in Australian Natural Gas: Occurrences, Sources and Resources. APPEA J. 2021, 61, 163. [Google Scholar] [CrossRef]
- Boreham, C.J.; Sohn, J.H.; Cox, N.; Williams, J.; Hong, Z.; Kendrick, M.A. Hydrogen and Hydrocarbons Associated with the Neoarchean Frog’s Leg Gold Camp, Yilgarn Craton, Western Australia. Chem. Geol. 2021, 575, 120098. [Google Scholar] [CrossRef]
- Compston, W.; Kröner, A. Multiple Zircon Growth within Early Archaean Tonalitic Gneiss from the Ancient Gneiss Complex, Swaziland. Earth Planet. Sci. Lett. 1988, 87, 13–28. [Google Scholar] [CrossRef]
- Scoates, J.S.; Friedman, R.M. Precise Age of the Platiniferous Merensky Reef, Bushveld Complex, South Africa, by the U-Pb Zircon Chemical Abrasion ID-TIMS Technique. Econ. Geol. 2008, 103, 465–471. [Google Scholar] [CrossRef]
- Sodoudi, F.; Yuan, X.; Kind, R.; Lebedev, S.; Adam, J.M.-C.; Kästle, E.; Tilmann, F. Seismic Evidence for Stratification in Composition and Anisotropic Fabric within the Thick Lithosphere of Kalahari Craton: Thick and Layered Mantle Lithosphere. Geochem. Geophys. Geosyst. 2013, 14, 5393–5412. [Google Scholar] [CrossRef] [Green Version]
- Reis, H.L.S.; Alkmim, F.F.; Fonseca, R.C.S.; Nascimento, T.C.; Suss, J.F.; Prevatti, L.D. The São Francisco Basin. In São Francisco Craton, Eastern Brazil; Heilbron, M., Cordani, U.G., Alkmim, F.F., Eds.; Regional Geology Reviews; Springer International Publishing: Cham, Switzerland, 2017; pp. 117–143. ISBN 978-3-319-01714-3. [Google Scholar]
- Duuring, P.; Hagemann, S.G.; Laukamp, C.; Chiarelli, L. Supergene Modification of Magnetite and Hematite Shear Zones in Banded Iron-Formation at Mt Richardson, Yilgarn Craton, Western Australia. Ore Geol. Rev. 2019, 111, 102995. [Google Scholar] [CrossRef]
- Auler, A.S.; Barton, H.A.; Zambelli, B.; Senko, J.; Parker, C.W.; Sasowsky, I.D.; Souza, T.A.R.; Pujoni, D.; Peñaranda, J.; Davis, R. Silica and Iron Mobilization, Cave Development and Landscape Evolution in Iron Formations in Brazil. Geomorphology 2022, 398, 108068. [Google Scholar] [CrossRef]
- Donzé, F.-V.; Truche, L.; Shekari Namin, P.; Lefeuvre, N.; Bazarkina, E.F. Migration of Natural Hydrogen from Deep-Seated Sources in the São Francisco Basin, Brazil. Geosciences 2020, 10, 346. [Google Scholar] [CrossRef]
- Webb, A.D.; Dickens, G.R.; Oliver, N.H.S. From Banded Iron-Formation to Iron Ore: Geochemical and Mineralogical Constraints from across the Hamersley Province, Western Australia. Chem. Geol. 2003, 197, 215–251. [Google Scholar] [CrossRef] [Green Version]
- Ewers, W.E.; Morris, R.C. Studies of the Dales Gorge Member of the Brockman Iron Formation, Western Australia. Econ. Geol. 1981, 76, 1929–1953. [Google Scholar] [CrossRef]
- Sun, S.; Li, Y.-L. Geneses and Evolutions of Iron-Bearing Minerals in Banded Iron Formations of >3760 to ca. 2200 Million-Year-Old: Constraints from Electron Microscopic, X-Ray Diffraction and Mössbauer Spectroscopic Investigations. Precambrian Res. 2017, 289, 1–17. [Google Scholar] [CrossRef]
- Van Alboom, A.; De Grave, E. Temperature Dependence of the 57Fe Mössbauer Parameters in Riebeckite. Phys. Chem. Miner. 1996, 23, 377–386. [Google Scholar] [CrossRef]
- Morris, R.C.; Ramanaidou, E.R. Genesis of the Channel Iron Deposits (CID) of the Pilbara Region, Western Australia. Aust. J. Earth Sci. 2007, 54, 733–756. [Google Scholar] [CrossRef]
- Morris, R.C.; Kneeshaw, M. Genesis Modelling for the Hamersley BIF-Hosted Iron Ores of Western Australia: A Critical Review. Aust. J. Earth Sci. 2011, 58, 417–451. [Google Scholar] [CrossRef]
- McLellan, J.G.; Oliver, N.H.S.; Schaubs, P.M. Fluid Flow in Extensional Environments; Numerical Modelling with an Application to Hamersley Iron Ores. J. Struct. Geol. 2004, 26, 1157–1171. [Google Scholar] [CrossRef]
- Taylor, D.; Dalstra, H.J.; Harding, A.E.; Broadbent, G.C.; Barley, M.E. Genesis of High-Grade Hematite Orebodies of the HamersleyProvince, Western Australia. Econ. Geol. 2001, 96, 837–873. [Google Scholar] [CrossRef]
- Robbins, L.J.; Funk, S.P.; Flynn, S.L.; Warchola, T.J.; Li, Z.; Lalonde, S.V.; Rostron, B.J.; Smith, A.J.B.; Beukes, N.J.; de Kock, M.O.; et al. Hydrogeological Constraints on the Formation of Palaeoproterozoic Banded Iron Formations. Nat. Geosci. 2019, 12, 558–563. [Google Scholar] [CrossRef]
- Tardy, Y.; Kobilsek, B.; Paquet, H. Mineralogical Composition and Geographical Distribution of African and Brazilian Periatlantic Laterites. The Influence of Continental Drift and Tropical Paleoclimates during the Past 150 Million Years and Implications for India and Australia. J. Afr. Earth Sci. 1991, 12, 283–295. [Google Scholar] [CrossRef]
- Canfield, D.E.; Jørgensen, B.B.; Fossing, H.; Glud, R.; Gundersen, J.; Ramsing, N.B.; Thamdrup, B.; Hansen, J.W.; Nielsen, L.P.; Hall, P.O.J. Pathways of Organic Carbon Oxidation in Three Continental Margin Sediments. Mar. Geol. 1993, 113, 27–40. [Google Scholar] [CrossRef]
- Jørgensen, B.B.; Kasten, S. Sulfur Cycling and Methane Oxidation. In Marine Geochemistry; Schulz, H.D., Zabel, M., Eds.; Springer: Berlin/Heidelberg, Germany, 2006; pp. 271–309. ISBN 978-3-540-32143-9. [Google Scholar]
- Lahiri, C.; Davidson, G.R. Heterogeneous Oxygenation of Wetland Soils with Increasing Inundation: Redox Potential, Water Depth, and Preferential Flow Paths. Hydrol. Processes 2020, 34, 1350–1358. [Google Scholar] [CrossRef]
- Albers, E.; Bach, W.; Pérez-Gussinyé, M.; McCammon, C.; Frederichs, T. Serpentinization-Driven H2 Production from Continental Break-Up to Mid-Ocean Ridge Spreading: Unexpected High Rates at the West Iberia Margin. Front. Earth Sci. 2021, 9, 673063. [Google Scholar] [CrossRef]
- Angerer, T.; Hagemann, S.G.; Danyushevsky, L. High-Grade Iron Ore at Windarling, Yilgarn Craton: A Product of Syn-Orogenic Deformation, Hypogene Hydrothermal Alteration and Supergene Modification in an Archean BIF-Basalt Lithostratigraphy. Min. Depos. 2013, 48, 697–728. [Google Scholar] [CrossRef]
- Morris, R.C. Genesis of Iron Ore in Banded Iron Formations by Supergene and Supergene Metamorphic Processes—A Conceptual Model. In Regional Studies and Specific Deposits; Elsevier: Amsterdam, The Netherlands, 1985; pp. 73–235. ISBN 978-0-444-42497-6. [Google Scholar]
- Brunet, F. Hydrothermal Production of H2 and Magnetite from Steel Slags: A Geo-Inspired Approach Based on Olivine Serpentinization. Front. Earth Sci. 2019, 7, 17. [Google Scholar] [CrossRef] [Green Version]
- Neubeck, A.; Duc, N.T.; Bastviken, D.; Crill, P.; Holm, N.G. Formation of H2 and CH4 by Weathering of Olivine at Temperatures between 30 and 70 °C. Geochem. Trans. 2011, 12, 6. [Google Scholar] [CrossRef] [PubMed] [Green Version]
- Milesi, V.; Guyot, F.; Brunet, F.; Richard, L.; Recham, N.; Benedetti, M.; Dairou, J.; Prinzhofer, A. Formation of CO2, H2 and Condensed Carbon from Siderite Dissolution in the 200–300 °C Range and at 50MPa. Geochim. Cosmochim. Acta 2015, 154, 201–211. [Google Scholar] [CrossRef]
- Crouzet, C.; Brunet, F.; Recham, N.; Findling, N.; Lanson, M.; Guyot, F.; Ferrasse, J.-H.; Goffé, B. Hydrogen Production by Hydrothermal Oxidation of FeO under Acidic Conditions. Int. J. Hydrog. Energy 2017, 42, 795–806. [Google Scholar] [CrossRef] [Green Version]
- Klein, F.; Bach, W.; McCollom, T.M. Compositional Controls on Hydrogen Generation during Serpentinization of Ultramafic Rocks. Lithos 2013, 178, 55–69. [Google Scholar] [CrossRef]
- Ramanaidou, E.R.; Danišik, M.; Wells, M.A. Preliminary Dating of Martite Goethite Iron Ore in the Hamersley Province (Western Australia). ASEG Ext. Abstr. 2019, 2019, 1–2. [Google Scholar] [CrossRef] [Green Version]
- Mayhew, L.E.; Ellison, E.T.; Miller, H.M.; Kelemen, P.B.; Templeton, A.S. Iron Transformations during Low Temperature Alteration of Variably Serpentinized Rocks from the Samail Ophiolite, Oman. Geochim. Cosmochim. Acta 2018, 222, 704–728. [Google Scholar] [CrossRef]


| SCD | South_Africa_1 | South_Africa_2 | South_Africa_3 | South_Africa_4 | Australia_1 |
|---|---|---|---|---|---|
| Nb of mapped structures | 624 | 792 | 866 | 486 | 612 |
| Min. equiv. diameter (m) | 8 | 19 | 22 | 35 | 45 |
| Max. equiv. diameter (m) | 437 | 856 | 2961 | 2633 | 12,784 |
| Mean equiv. diameter (m) | 67 | 98 | 346 | 476 | 407 |
| Median equiv. diameter (m) | 59 | 88 | 187 | 412 | 200 |
| Depth/diameter | 0.017 | 0.019 | 0.005 | 0.014 | 0.013 |
| Sample | Iron Speciation—Mössbauer Spectroscopy (%) | Iron Content ICP-OES (wt%) | |||||||
|---|---|---|---|---|---|---|---|---|---|
| Hematite | Goethite * | Ferrihydrite | Magnetite | Silicate | Fe3+/Fetot | Fetot | |||
| Fe3+ | Fe3+ | Fe3+ | Fe3+tetra | Fe2+/3+octa | Fe3+ | Fe2+ | |||
| B1A | 43 | 10 | 23 | 10 | 8 | N.D. | 6 | 0.90 | 11.78 |
| B1B | 76 | 10 | N.D. | 6 | 7 | N.D. | <3 | 0.96 | 15.12 |
| B1C | 34 | N.D. | 3 | 24 | 39 | N.D. | N.D. | 0.81 | 56.83 |
| B1D | 30 | N.D. | 13 | 19 | 33 | N.D. | 5 | 0.79 | 14.08 |
| B2A | 18 | 78 | N.D. | <3 | <3 | <3 | N.D. | 1.00 | 42.57 |
| B2B | 35 | 56 | N.D. | 4 | 3 | <3 | N.D. | 0.99 | 28.95 |
| B3A | 18 | 50 | N.D. | 14 | 13 | 5 | N.D. | 0.94 | 27.01 |
| B3B | 13 | 43 | N.D. | 18 | 19 | 7 | N.D. | 0.91 | 36.87 |
| B3C | 56 | N.D. | N.D. | 25 | 19 | N.D. | N.D. | 0.91 | 41.70 |
Publisher’s Note: MDPI stays neutral with regard to jurisdictional claims in published maps and institutional affiliations. |
© 2022 by the authors. Licensee MDPI, Basel, Switzerland. This article is an open access article distributed under the terms and conditions of the Creative Commons Attribution (CC BY) license (https://creativecommons.org/licenses/by/4.0/).
Share and Cite
Geymond, U.; Ramanaidou, E.; Lévy, D.; Ouaya, A.; Moretti, I. Can Weathering of Banded Iron Formations Generate Natural Hydrogen? Evidence from Australia, Brazil and South Africa. Minerals 2022, 12, 163. https://0-doi-org.brum.beds.ac.uk/10.3390/min12020163
Geymond U, Ramanaidou E, Lévy D, Ouaya A, Moretti I. Can Weathering of Banded Iron Formations Generate Natural Hydrogen? Evidence from Australia, Brazil and South Africa. Minerals. 2022; 12(2):163. https://0-doi-org.brum.beds.ac.uk/10.3390/min12020163
Chicago/Turabian StyleGeymond, Ugo, Erick Ramanaidou, Dan Lévy, Abderrahim Ouaya, and Isabelle Moretti. 2022. "Can Weathering of Banded Iron Formations Generate Natural Hydrogen? Evidence from Australia, Brazil and South Africa" Minerals 12, no. 2: 163. https://0-doi-org.brum.beds.ac.uk/10.3390/min12020163