Article

A Joint Experiment and Discussion for Strength Characteristics of Cemented Paste Backfill Considering Curing Conditions

1
State Key Laboratory of Mechanical Behavior and System Safety of Traffic Engineering Structures, Shijiazhuang Tiedao University, Shijiazhuang 050043, China
2
School of Safety Engineering and Emergency Management, Shijiazhuang Tiedao University, Shijiazhuang 050043, China
3
School of Civil and Resources Engineering, University of Science and Technology Beijing, Beijing 100083, China
4
Department of Civil Engineering, Geotechnical Division, Recep Tayyip Erdogan University, Fener, Rize TR53100, Turkey
*
Authors to whom correspondence should be addressed.
Submission received: 4 January 2022 / Revised: 1 February 2022 / Accepted: 2 February 2022 / Published: 7 February 2022
(This article belongs to the Topic Mining Safety and Sustainability)

Abstract

:
As lots of underground mines have been exploited in the past decades, many stope instability and surface subsidence problems are appeared in the underground mines, while the cemented paste backfill (CPB) technology has been applied for more than 40 years, and it can solve these problems. As it is shown that the effect of backfilling is mainly affected by the mechanical properties of the CPB, and there are lots of factors which can influence the strength of the CPB, but the coupled effects of curing conditions has not been reported. In this research, the coupled effects of curing conditions are importantly considered, and the uniaxial compressive strength (UCS) is adopted as the important evaluation index of CPB, then the evolution law of the UCS for CPB are analyzed, also the mathematical strength model of CPB is established. The findings suggest that the relationship between the UCS of CPB and curing stress develops the function of quadratic polynomial with one variable, while the UCS of the CPB shows the power function as the curing temperature increases. Moreover, the established mathematical strength model is verified on the basis of laboratory experiments, the error between the measured UCS and the prediction UCS is less than 15%. It shows that the established strength model of the CPB by considering the curing conditions can predict the UCS very well, it has great significance for the safety design of CPB.

1. Introduction

As more and more mines have been excavated, many voids are produced in the underground mines, also a lot of tailings are disposed in the tailing dam, therefore, there are huge challenges we are facing, such as the surface subsidence, stope instability and safety of the tailing dams [1,2]. For the voids, they may cause the surface subsidence, stope collapse and other geological risks [3]. According to the statistics by the researchers, there are about 14.6 billion tons of tailings in China, most of them are disposed in the tailings or on the surface, it may cause the environment pollution or dam-failure accidents [4,5]. As the society has been rapidly developed, the environment protection is getting more and more attention, while the filling mining methods can dispose the surface tailings, which has been widely applied in many mines at home and abroad [6]. On the one hand, the CPB technology has the advantages of safety, economy and high efficiency; on the other hand, it also has the advantages of environmental protection [7]. Moreover, the total tailings are used in the CPB technology, so it can reduce the surface tailings deposit for 50~60% [8].
For the CPB technology, the safety of the backfilling stope is the main areas of concern, while the mechanical property is one of the main indexes to reflect the backfilling effect, also the study shows that the UCS is the main index to show the mechanical properties of CPB [9,10]. In terms of the UCS for CPB, many studies had been done by the scholars, Andrew and Fall’s [11,12] study indicated that the UCS was significantly influenced by the curing temperature, because the hydration reaction rate of the cement was firstly affected. The correlation of the electrical properties, microstructure properties and mechanical properties of the CPB was investigated. Secondly, the laboratory tests aere done considering the curing time, sulphur contents and mineral admixtures by Jiang and Liu [13,14,15]. Some studies had revealed that the UCS was significantly influenced by the water type, water content and mixing time, also the microstructure of the CPB was affected by the mixing time [16,17]. Libos, Wang and Yilmaz [18,19,20] had studied the relationship between the cement types, cement content and mechanical properties of CPB, indicating that the hydration reaction rate and UCS of the CPB were mostly affect by them. Moreover, it was found that the specimen size, curing stress and tailings fineness can also influence the mechanical properties of the CPB [21,22,23,24]. In a short word, the majority of the above studies are concentrated on one influencing factor, while there are few studies about the coupled effects of curing conditions on the mechanical properties of CPB.
However, most of the studies were based on the laboratory tests, the costs of the laboratory experiments are high, many researchers had established the UCS prediction model to forecast the UCS of CPB when designing the mix proportion of CPB [25,26]. Ehsan et al. used the particle swarm optimization algorithm to optimize the multi-objective mixture design of CPB. Li and Zhao et al. [27,28,29]. optimized the admixture of CPB on the basis of the response -surface method, and it can provide technical references for the engineering design in the mines, while the fitting formula was complex and the cross term had no specific physical meaning. Moreover. the BP neural network and intelligent modelling framework were adopted to show the UCS with different conditions, but the model was based on the laboratory experiment, and the data should be large, it was difficult to applied in the engineering design [30,31,32]. Based on the laboratory experiments, Mitchell and Fu et al. [33,34,35] established the mathematical model to forecast the UCS, also the model was applied to the engineering design. According to the above studies, there were many prediction models which can predict the strength of CPB, but the prediction model can be established better [36,37,38], the influencing factors were incomplete, the studies showed that the UCS is affected by curing conditions, therefore, it is needed to establish the prediction model considering the curing conditions.
In this paper, the strength characteristics of CPB considering curing conditions is studied, and the UCS of the CPB is tested in the laboratory, then evolution role of the UCS for CPB considering curing conditions is analyzed, based on the results, the mathematical strength model of CPB considering different curing conditions is established, also the established mathematical strength model is verified based on the experiment results.

2. Experimental Materials and Methods

2.1. Materials

2.1.1. Tailings

As the tailings is one of the main components of CPB, therefore, the total tailings can be disposed, and it is selected from one copper mine. Firstly, the laser particle scanning analyzeris used to analyze the particle size distribution (PSD) of the total tailings, then the X-ray diffractometry (XRD)is adopted to obtain the chemical component of the tailings [39,40], therefore, the physical and chemical properties of the tailings are obtained, and the chemical characteristics of the tailings is shown in Table 1, it indicates that the chemical components of the total tailings mainly include MgO, Al2O3, SiO2 and CaO.
As it is known that the compactness of the CPB is affected by the gradation of the total tailings [41]. Based on the experimental results, the PSD of the CPB is shown in Figure 1. The statistics shows that the diameter of cumulative volume with 20 μm, 37 μm and 74 μm are 29.60%, 47.33% and 77.52%, respectively. Based on the theoretical calculation formula, then the non-uniformity coefficient and curvature coefficient can be obtained, which are 8.05 and 1.31, respectively. In contrast to the standard values, the distribution of the total tailing is good. According to the tailings which have been studied before, the tailings studied in the copper mine have similar properties to the tailings which have been reported in the literature by other scholars.

2.1.2. Binders

As the binder is also one of the important components of CPB, the Portland cement, fly ash, fiber and waste glass are included [42,43]. The type of Ordinary Portland cement (OPC) is adopted in this study, based on the tests by the laser particle scanning analyzer, the PSD of the cement is also obtained, which is shown in Figure 1, in contrast to the PSD of the tailings, the cement is finer. Moreover, the chemical properties of the cement is obtained based on the X-ray diffraction (XRD) tests, which is shown in Table 1, it also indicates that the SiO2, CaO and other elements are included.

2.1.3. Water

As the CPB consists of cement, tailing and water, therefore, the water is the essential part of the CPB, for it can provide the hydration reaction medium for the CPB. The water is selected from the laboratory tap water, because it can reduce the experimental error. The acid and alkali stability experiment results show that the tap water in the laboratory is weakly alkaline, and the PH value of it is 7.5. Moreover, the Fe, Na, Ca, Si and SO42− are included for the chemical properties of the water.

2.2. Preparation and Mix Proportion of CPB

In this study, the mixer is adopted to make the cement, tailing and water at the same time, and the curing conditions is mainly considered, therefore, the cement-tailing ratio is controlled to be 1:6, also the mass concentration of it is controlled to be 76%. As for the curing conditions, all of the specimens are controlled to be 20 °C for the initial temperature, and the relative humidity is 90 ± 2% RH, therefore, the curing temperature and curing stress are mainly considered for the curing conditions.
According to the studies before, the temperature of 20 °C, 35 °C and 50 °C are selected as the curing temperature schemes. The stress condition of the CPB under different stope heights is shown in Figure 2, as there are seven points ranging from the top to the bottom, the height of them is 0 m, 5 m, 10 m, 15 m, 20 m, 25 m and 30 m between each point to the bottom of the stope for point A, B, C, D, E, F and G. Moreover, the density of the CPB is selected as 2700 kg/m3. Based on the CPB density and backfilling technology, the curing stress of 0 kPa, 90 kPa, 180 kPa, 270 kPa, 360 kPa, 450 kPa and 540 kPa are selected as the curing stress conditions. Firstly, the curing stress is applied to be a quarter of the total required curing stress as the curing time is 12 h; Secondly, the curing stress is applied to be a half of the total required curing stress as the curing time is 1 day; Finally, the curing stress is applied to be the total required curing stress as the curing time is 2 days. Previous studies showed that the curing stress had the appreciable impact on the consolidation of CPB in the first 48 h [44,45], therefore, the stress is applied within 2 days for each schemes. Moreover, as the specimens have been cured for 3 days, the demoulding is required for all the specimens, then all the specimens are in the standard curing conditions, the schemes of the curing stress application is shown in Figure 2.

2.3. UCS Tests

As it is known that the UCS is one of the main influencing indexes to reflect the mechanical properties of CPB, therefore, after all the specimens are cured for the required curing times, then all the specimens are tested to obtain the UCS of the CPB. Before the tests, it is needed to dispose all the specimens. the top and bottom of the specimen should be the plain surface to be parallel, also the standard size of the specimen is 50 mm and 100 mm for its diameter and height. In this study, the WDW-50 servo control uniaxial pressure testing machine is adopted to obtain the UCS of CPB, the control accuracy of it is ±0.2%.

3. Results and Discussion

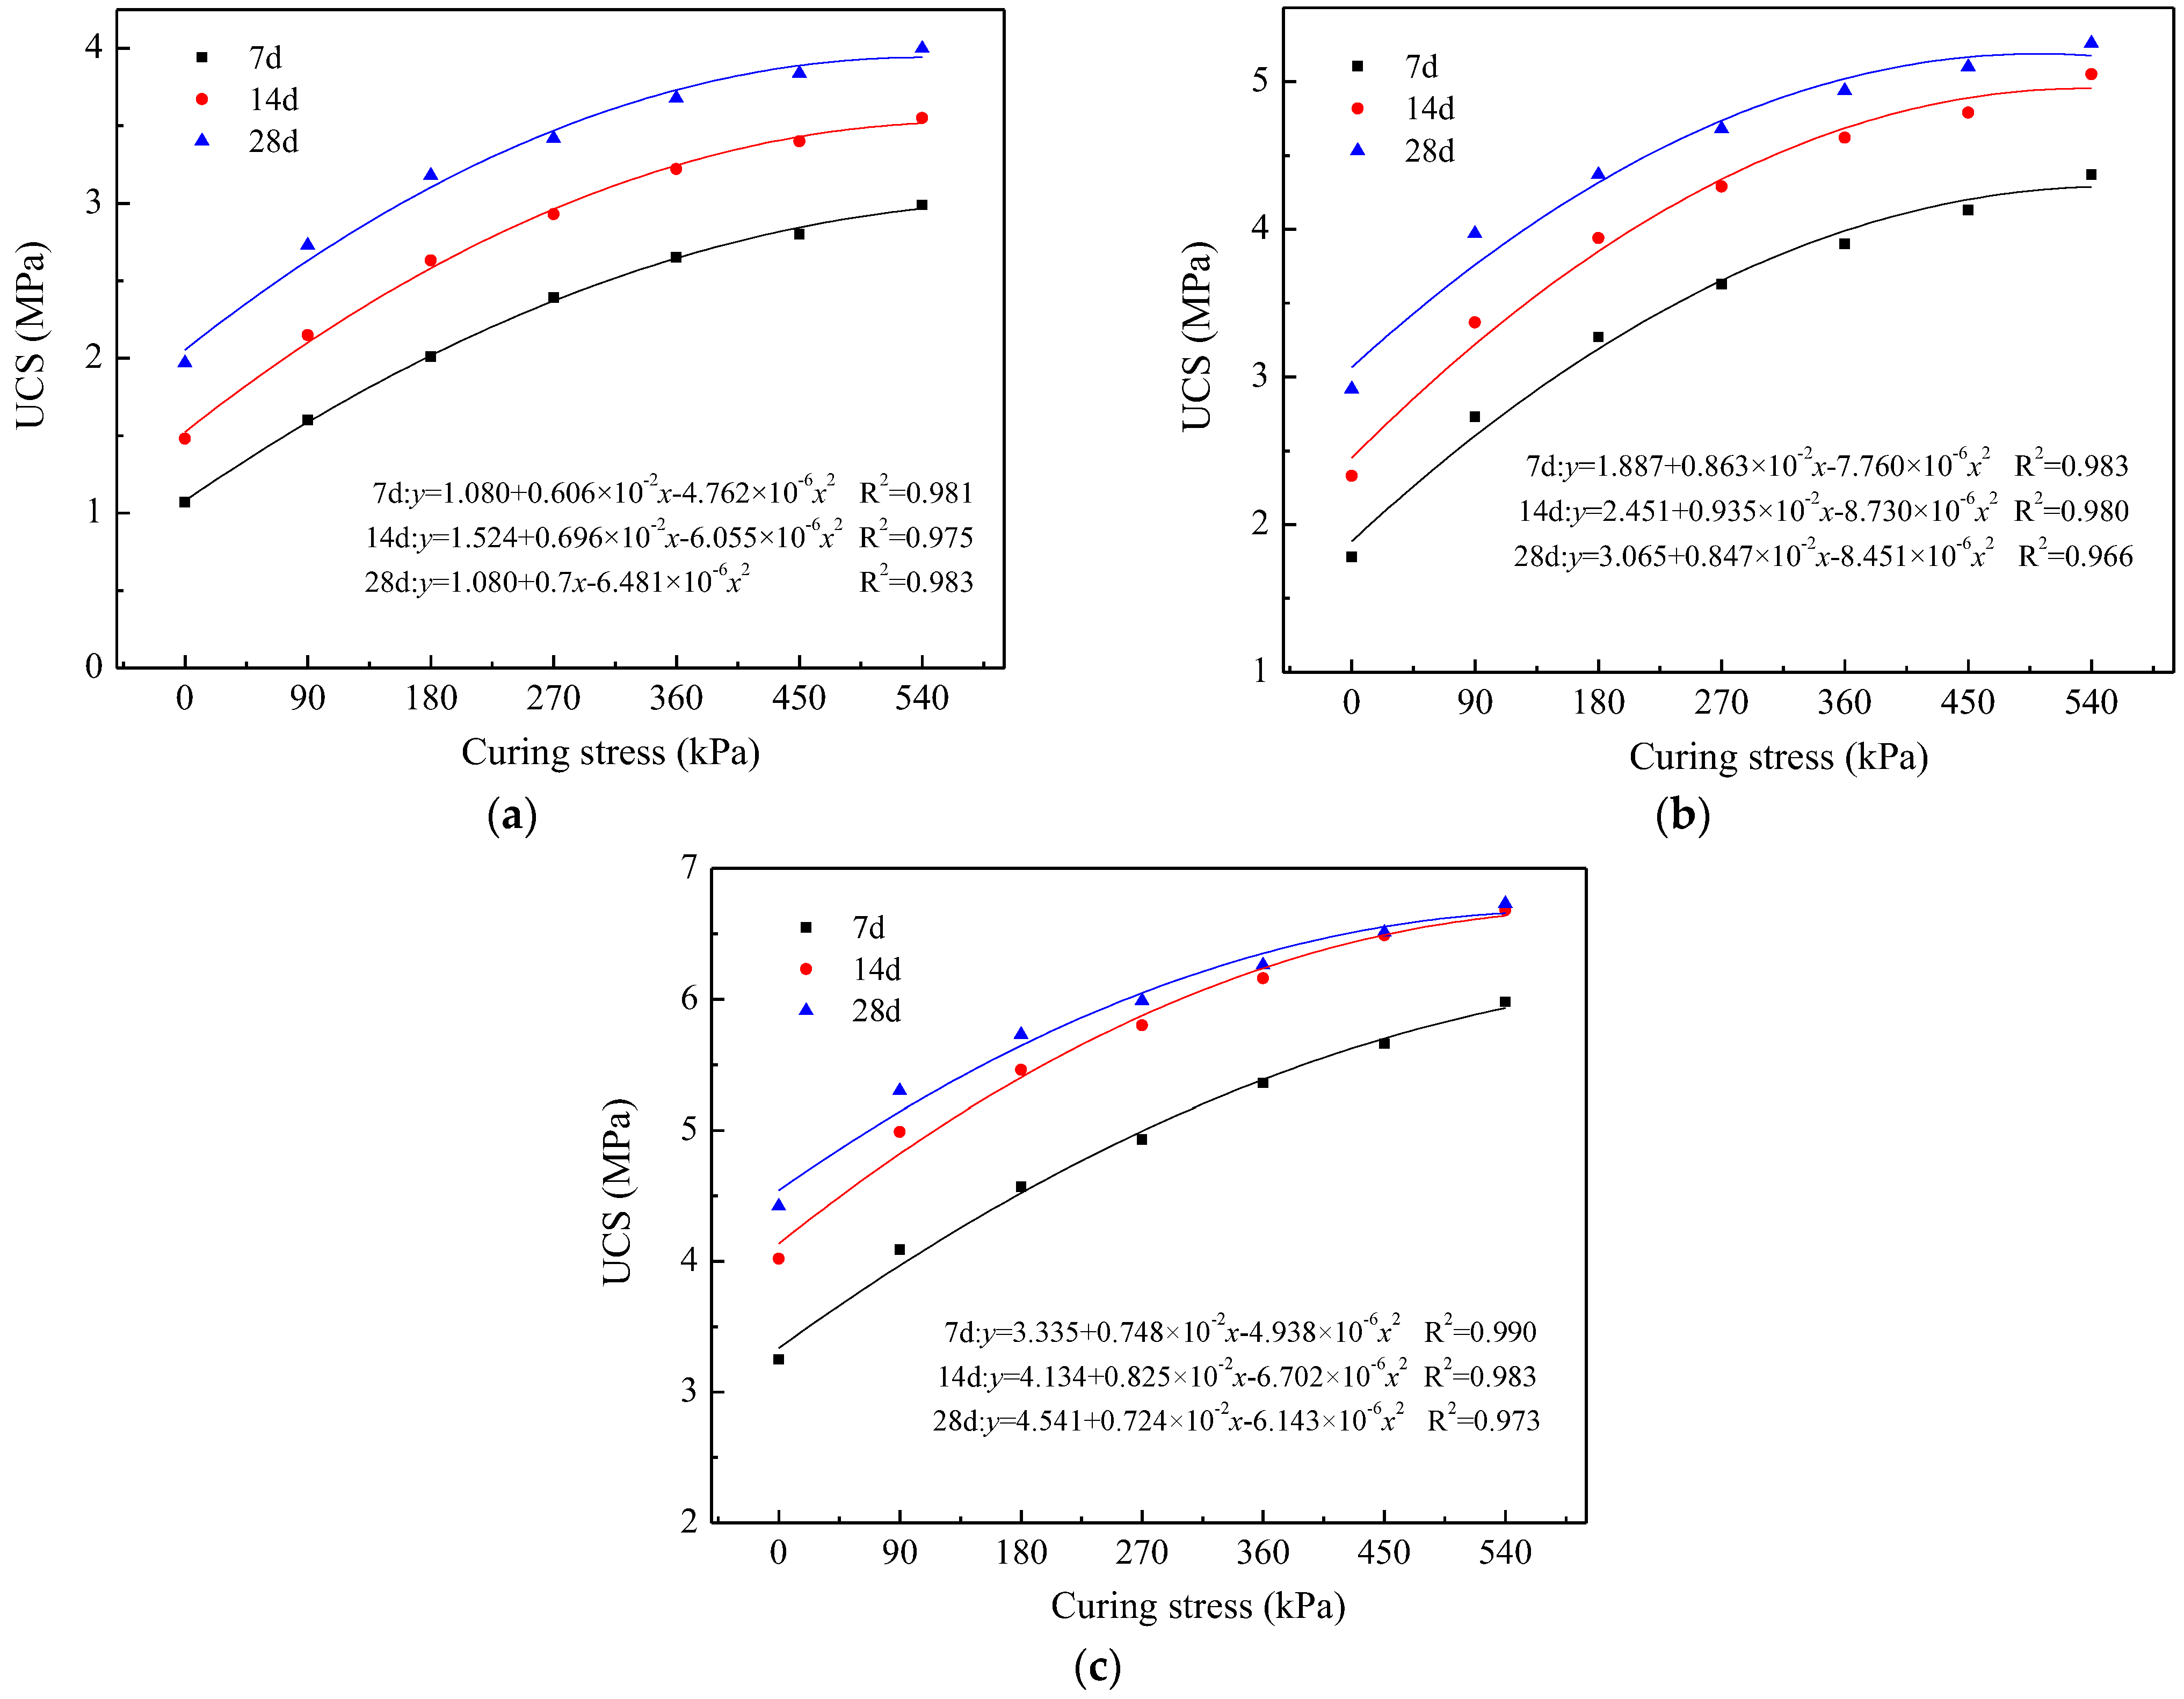
3.1. Influence of Curing Stress on UCS

The experiment results are shown in the Figure 3, it can reflect the correlation between the curing stress and UCS of CPB, it has made clear that the UCS is significantly increased with the increase of the curing stress while other curing conditions are unchanged. The reason for the above phenomenon can be explained as follow: as the curing stress increases, resulting the faster hydration reaction rate, then more hydration products are produced, also pores between the tailing and cement are compressed by the CPB particles, then the space between the particles are decreased, and the pores are filling into the hydration products, therefore, the UCS of CPB is improved.
In another aspect, the Table 2 shows the correlation between the curing stress and growth rate of UCS, it can reflect the evolution of the UCS growth rate under different curing conditions, the UCS growth rate is significantly decreased when the curing stress is increased. From Figure 3 and Table 2, it also shows that the UCS is increased when the curing time is increased regardless of other curing conditions, but the growth rate of UCS is trending downward. The reason for the above phenomenon is that the cementitious behavior of CPB is improved as the curing time is longer. In a word, the curing time can improve the UCS of CPB, but the growth property of it is certain.
By studying the correlation between the curing stress and UCS quantitatively, the linear, power, exponential, logarithm, and quadratic function of one variable are selected to fit them, the most appropriate function and its correlation coefficient (R2) are shown in Figure 3, the p value of all the fitting equations is less than 0.05 [46], therefore, the function of quadratic polynomial with one variable can reflect the correlation between UCS and curing stress, which can be expressed by the Formula (1):
σ c = a + b p + c p 2
where σ c is the UCS, p is the curing stress, a, b, and c are the fitting of constant.
For the Formula (1), as the correlation coefficient, all of the correlation coefficient are more than 0.95, which shows that the correlationship among the curing stress and UCS are high. Therefore, the function of quadratic polynomial with one variable is suitable to express the relationship between them.

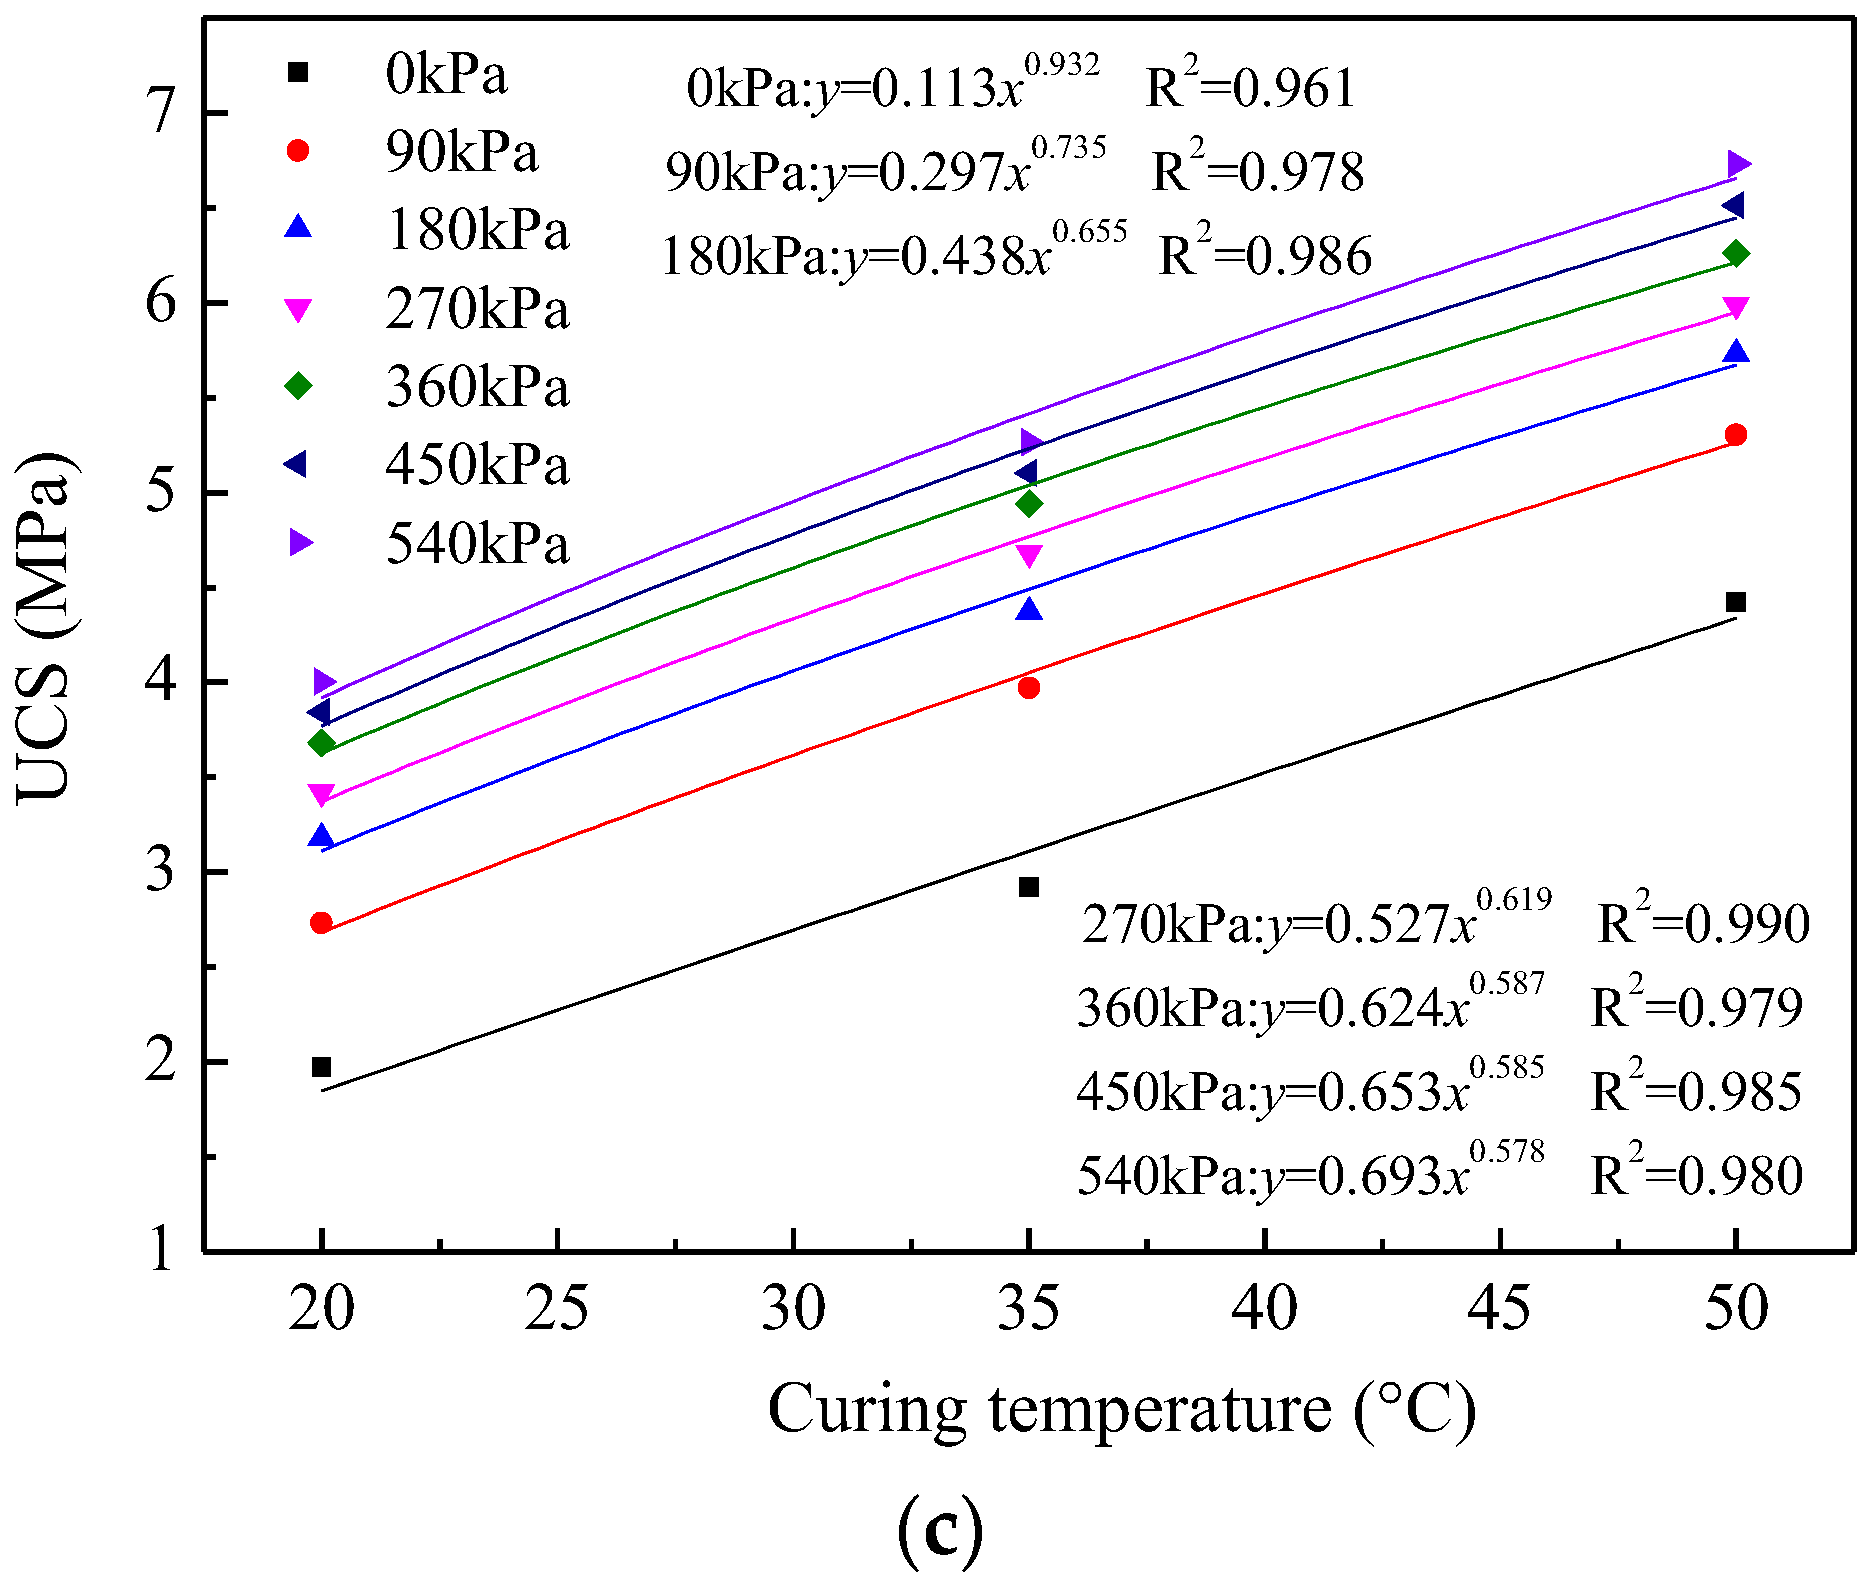
3.2. Influence of Curing Temperature on UCS

The correlation between the curing temperature and UCS is clearly shown in Figure 4, the UCS of CPB is increased with the increase of curing temperature regardless of other curing conditions. Moreover, it indicates that curing temperature has greater effect on the UCS for the smaller curing stress than the larger curing stress. This phenomenon is caused by the following reasons: when the curing temperature becomes higher, more hydration products are produced, then most of them are filled into the pores between the tailing particles. Therefore, the pore spacing is decreased, and the compactness of the CPB is more dense, which resulting in the increase of UCS.
The Table 3 shows the evolution rule of the UCS growth rate for the CPB, as the curing stress is 0 kPa, the growth rate of UCS are 66.36% and 82.58% for the curing temperature of 35 °C and 50 °C under the curing time of 7 days; while the growth rate of UCS are 46.15% and 36.84% for the same curing temperature under the curing time of 28 days. Therefore, it shows the decline trend for the growth rate of UCS as the curing temperature is increased, and it also shows similar rule for other conditions. Moreover, the results indicate that the growth rate of UCS decreases with the longer curing time regardless of other curing conditions, and the curing temperature shows greater influence on the early UCS than the later UCS.
By studying the evolution law of the correlation between the UCS and curing temperature quantitatively, the linear, power, exponential, logarithm, and quadratic function are adopted to fitting the relation between them. It can be seen that the power function showed the highest accuracy, that is to say the power function is fitted to show the correlation between the UCS and curing temperature, all of the correlation coefficient (R2) are larger than 0.95, the p value of all the fitting equations is less than 0.05, therefore, the formula for the relationship between them can be shown bellow:
σ c = d T e
where σ c is the UCS, T is the curing temperature, d and e are the fitting coefficient.

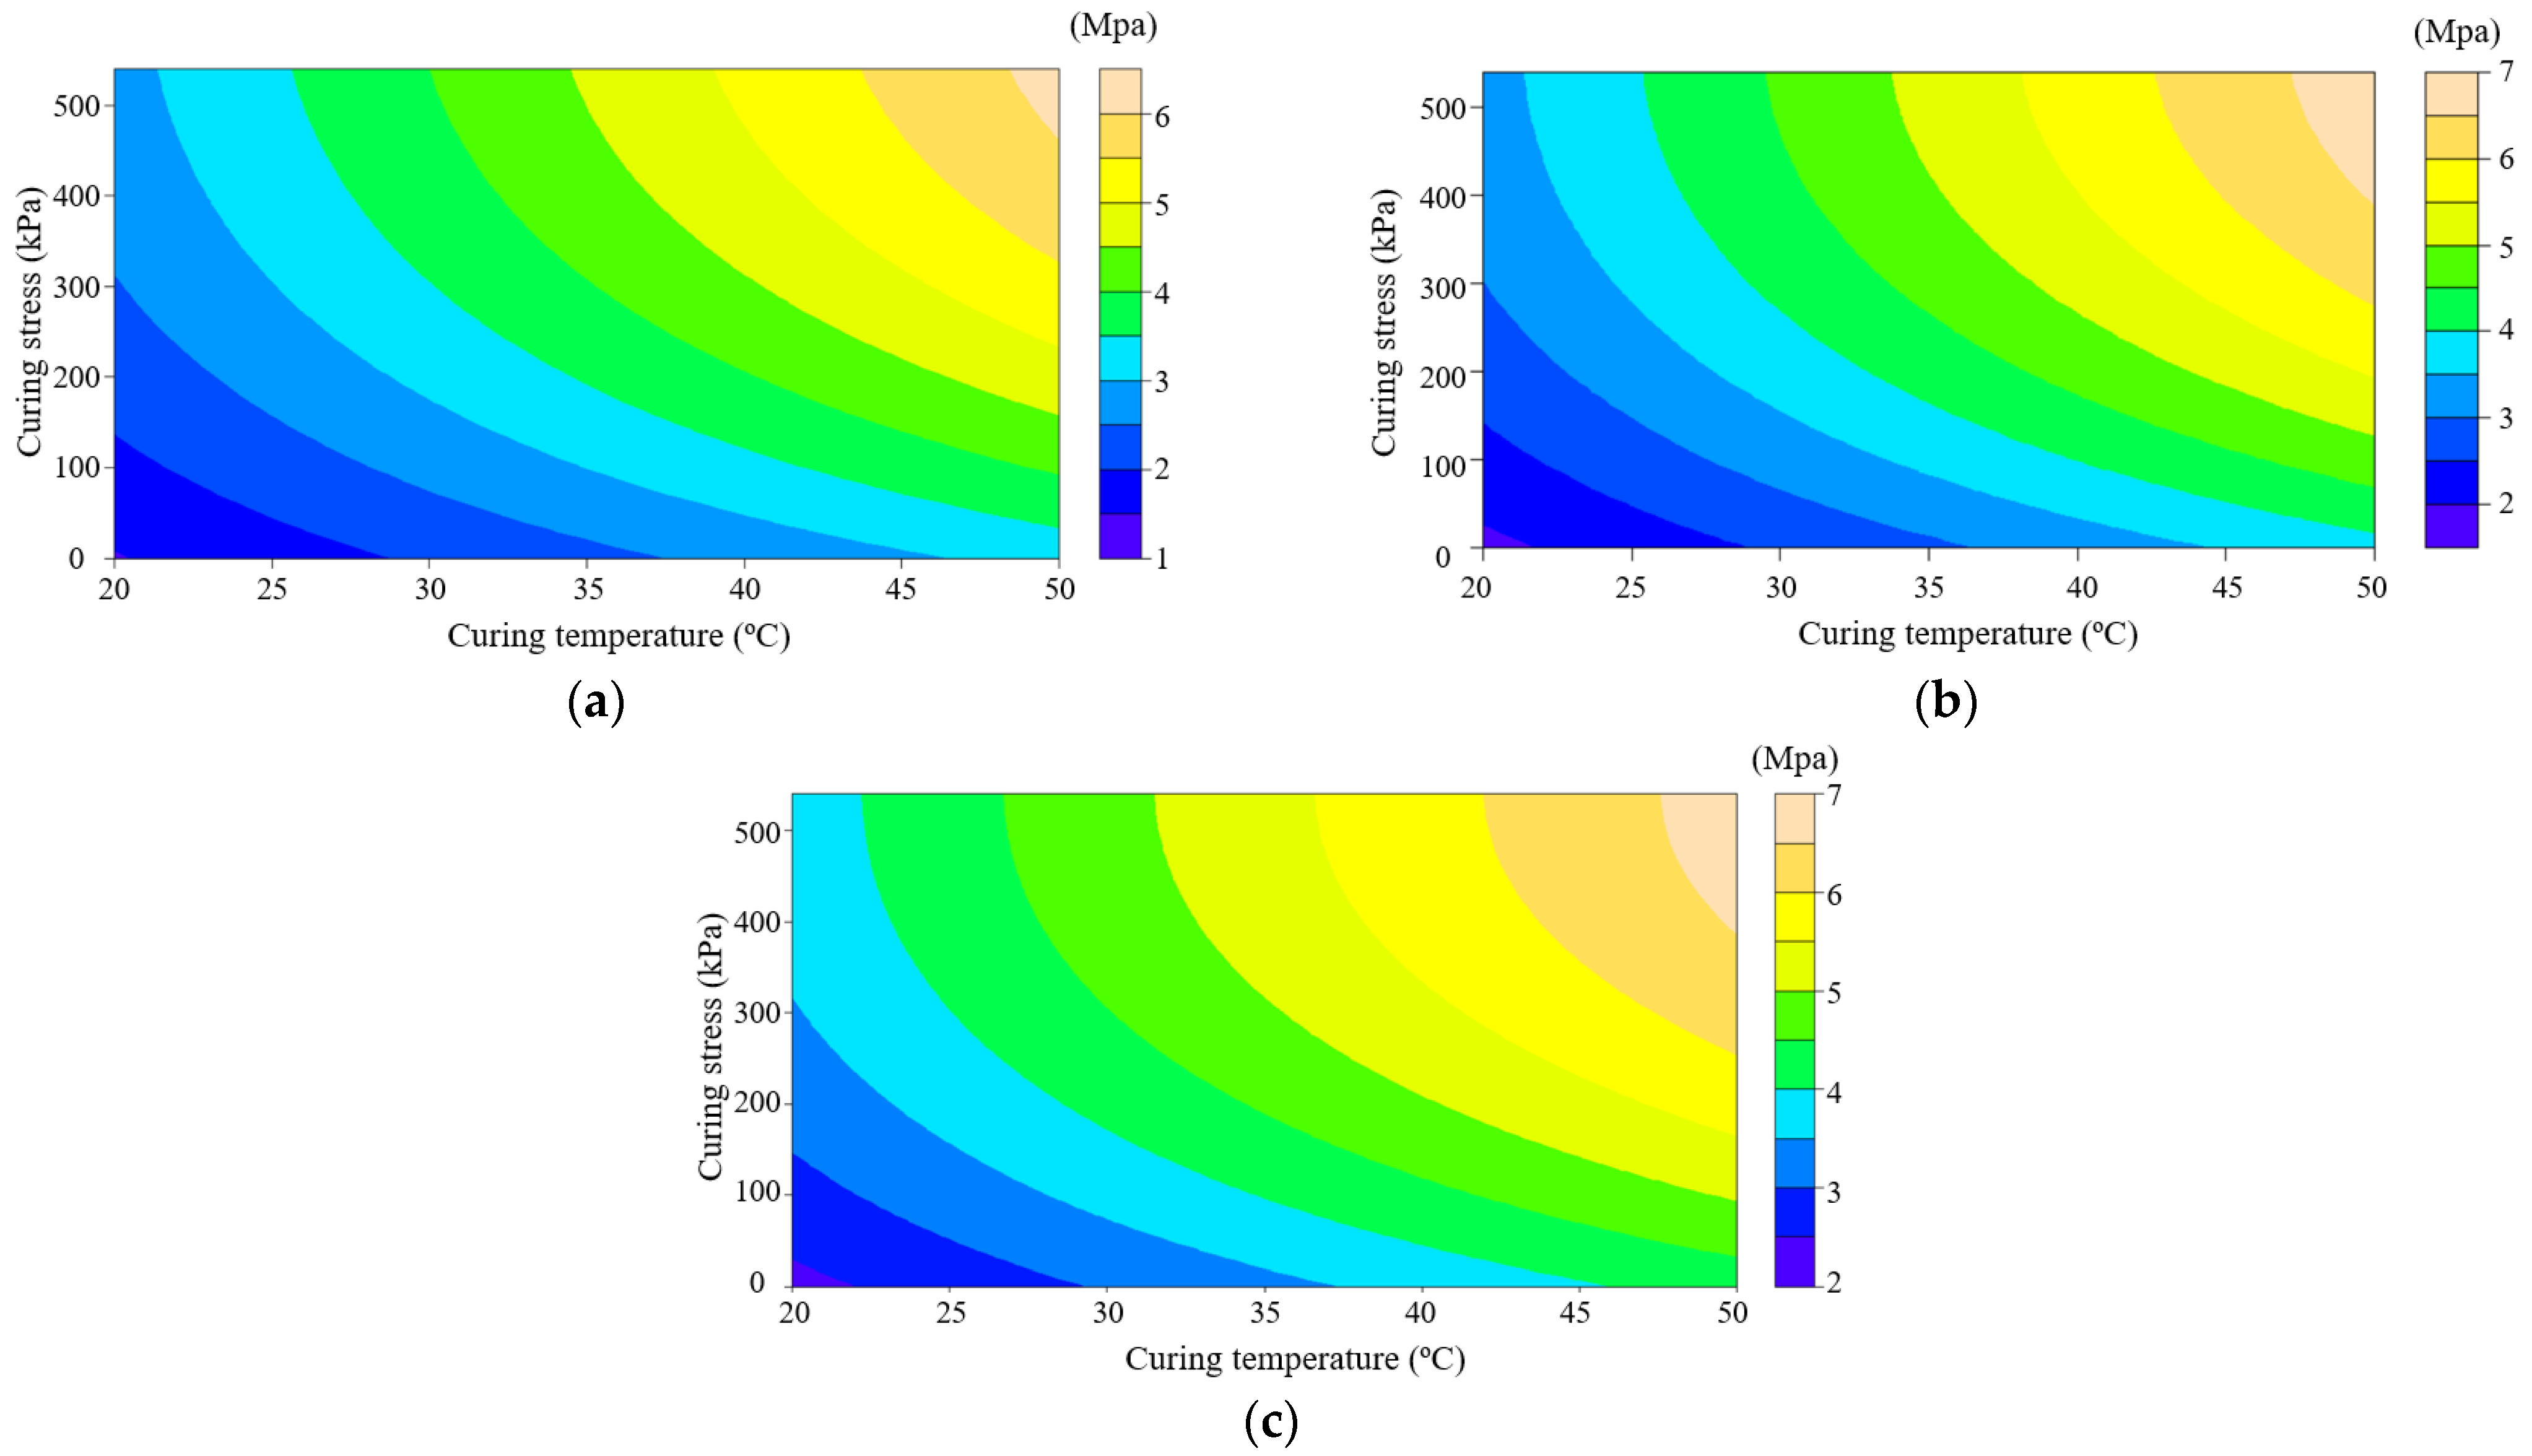
3.3. Coupled Effects of Curing Conditions on UCS

In order to find out the correlation between the coupled effects of curing conditions and UCS of CPB, based on the laboratory results, the correlation between them is given in Figure 5, it indicates that the UCS is significantly influenced by the coupled effects of curing conditions. As the curing stress decreases from 540 kPa to 360 kPa, also the curing temperature is increased from 20 °C to 50 °C, the UCS is increased sharply. While the curing temperature decreases from 50 °C to 20 °C, and the curing stress decreases from 360 kPa to 180 kPa, the UCS is decreased sharply. Therefore, it indicates that there may exist a complicated relation between them. Not only that, the trend of the three curves under different curing ages for the UCS are similar, indicating that there should be a regular rule for the UCS. According to the results, the formula considering the curing condition can be obtained.

4. Mathematical Strength Model

4.1. Establish of the Mathematical Strength Model

According to the results of the previous analysis, the curves for the coupled effects of curing conditions on the UCS develops a similar trend. Based on the above results, the mathematical strength model of CPB is established when considering different curing conditions, therefore the formula of it is as follows:
σ c = f c f 1 ( p ) f 2 ( T )
σ c = f c ( a + b p + c p 2 )   d T e
where σ c is the UCS, f c represents the UCS of CPB relation to the cement, f 1 ( p ) and f 2 ( T ) represent the UCS relation to the curing stress and curing temperature.
Assume that η = a d f c , ξ = b d f c , λ = c d f c , then the Formula (4) can be transformed to the Formula (5):
σ c = ( η + ξ p + λ p 2 ) T e
where the η , ξ and λ are the fitting coefficients for the strength model.
Assume that the curing temperature of T is constant, and a = η T e , b = ξ T e , c = λ T e , then the Formula (5) can be simplified as the Formula (6):
σ c = a + b p + c p 2
According to the relationship between the curing stress and UCS, the Formula (6) is exactly the same to the Formula (1).
Assume that the curing stress of p is constant, and the d = η + ξ p + λ p 2 , then the correlation between the UCS and curing temperature is shown below:
σ c = d T e
According to the Formula (2), it indicates that the Formula (7) is exactly the same to it.
Based on the above analysis, it is evident that the mathematical strength model of CPB can be obtained by the Formula (5), and it contains the influencing factors of curing conditions, the parameters relation to the formula are clear. In the fact, in order to apply the established mathematical strength model, the parameters of η , ξ and λ can be determined by the laboratory results.
In order to verify the mathematical strength model considering the curing conditions, the experimental results of Figure 3 are adopted to analyze it. The parameters of the strength model relation to the UCS are obtained by the R programming language [47], also the fitting coefficients are obtained as shown in Table 4. It is evident that all of the fitting coefficient R2 of the mathematical strength model under different curing ages are more than 0.95, also the p value of all the fitting equations is less than 0.05, indicating that the significance of the established mathematical strength model is good, it can verify the mathematical strength model.
Based on the established mathematical strength model for CPB, the contours of CPB under different curing ages are shown in Figure 6, and they can reflect the correlation between the influencing factors and UCS. In the engineering design, if the curing conditions are given, then the UCS of CPB can be predicted based on the data in Figure 6. Moreover, if the design requirement is certain, in the actual engineering design, when the UCS is at a certain range with the curing time of 28 days, the contour plots of UCS considering the curing conditions can be applied to optimize the mix proportion.

4.2. Comparison of Experimental Results and Theoretical Model for UCS

As the mathematical strength model of CPB has been established above, the relationship between the model theoretical UCS and the measured UCS in the laboratory is shown in Figure 7, also the ideal fitting line and the prediction error within the 15% are listed in the Figure 7, and it indicates that the established mathematical strength model can predict the UCS of CPB very well. As shown in Figure 7a, most of the prediction error are less than 15%, only two specimen points are beyond the prediction error of 15%, moreover, all specimen points are in the range of prediction bands for 95%, indicating that the established mathematical strength model shows an important impact for predicting the UCS at early ages. The correlation between the model theoretical UCS and measured UCS under the curing time of 14 and 28 days are shown in Figure 7b,c, there are two specimen points which beyond the prediction error of 15% under the curing time of 14 and 28 days, but these two specimen points are near the ±15% prediction error line, respectively. Moreover, all of the specimen points are in the range of prediction bands for 95% under the curing time of 14 and 28 days, indicating that the prediction results are in consistent with the experiment results, and the established mathematical strength model is rational.
According to the above analysis, also the histogram of UCSmeasured/UCSpredicted based on the mathematical strength model are shown in Figure 8, it shows that the means and the median are all close to 1, which indicates that the predicted UCS of CPB is consistent with the experiment UCS. On the other hand, the skewness of the dataset under different curing ages are 0.0545, 0.0513 and 0.0958, respectively, it means that the frequency distribution of the UCSmeasured/UCSpredicted is positive partial, so the established mathematical strength model shows a slightly lower UCS than the experimental UCS under different curing ages, but this is good for the safety of the CPB when designing the mixture ratio of CPB.

4.3. Verification of the Mathematical Strength Model

The predicted UCS and experimental UCS have been analyzed above, in order to verify the rationality of the established mathematical strength model, the curing temperature is 35 °C, the curing temperature is 0 kPa, 90 kPa, 180 kPa, 270 kPa, 360 kPa, 450 kPa and 540 kPa, respectively, while other conditions and parameters are the same as the schemes before. Based on the studies above, the predicted UCS of CPB is computed by the established mathematical strength model which is shown in the Formula (5), then the relationship between the predicted UCS and the measured UCS is obtained, and it is shown in Figure 9. It can be observed that all the specimen points are in the range of the 15% prediction error, also all of the prediction UCS is slightly smaller than the measured UCS, indicating that the application of the established mathematical strength model to predict the UCS of CPB is good.

5. Conclusions

As the mechanical properties of the CPB considering curing conditions has been discussed, the strength testes are done in the laboratory, also the mathematical strength model is also established, and then the model is verified by the engineering example. According to the studies, some opinions can be concluded as follow:
(1)
The results show that the function of quadratic polynomial with one variable can represent the correlation between the UCS and the curing stress well. Moreover, the correlation between the UCS and curing temperature shows the power function.
(2)
It is found that the trend of the three curves under different curing ages for the UCS are extremely similar, indicating that there exists a regular rule for the UCS with different curing conditions. The established mathematical strength model for CPB considering the curing conditions is developed.
(3)
The established mathematical strength model is verified by the engineering data, the prediction error between the measured UCS and the prediction UCS is less than 15%, all of the specimen points are in the range of prediction bands for 95%, indicating that the prediction results are in agreement with the experiment results under different curing ages, therefore, the established mathematical strength model is rational, which can provide some technical support for the mix proportion design of CPB.

Author Contributions

Conceptualization, S.C. and A.W.; methodology, S.C.; validation, R.Y.; formal analysis, S.C.; investigation, S.C.; resources, S.C.; data curation, E.Y.; writing—original draft preparation, S.C.; writing—review and editing, W.W.; visualization, Y.W.; supervision, Y.W. and S.C.; project administration, W.W.; funding acquisition, W.W. All authors have read and agreed to the published version of the manuscript.

Funding

This work is financially supported by the Hebei Natural Science Foundation (E2021210128) and the Joint Funds of the National Natural Science Foundation of China (U1967208).

Acknowledgments

We thank for the Chambishi copper mine for the help with the tailing sample and data collection.

Conflicts of Interest

The authors declare no conflict of interest. The authors declare that they have no known competing financial interests or personal relationships that could appear to have influenced the work reported in this paper.

References

  1. Qi, C.; Fourie, A. Cemented paste backfill for mineral tailings management: Review and future perspectives. Miner. Eng. 2019, 144, 106025. [Google Scholar] [CrossRef]
  2. Sun, Q.; Li, X.L.; Wei, X.; Mu, Q.W. Experimental study on the influence of mine water corrosion over filling paste strength. Bull. Chin. Ceram. Soc. 2015, 34, 1246–1251. [Google Scholar]
  3. Wang, Q.; Shi, M.; Wang, D. Influence of elevated curing temperature on the properties of cement paste and concrete at the same hydration degree. J. Wuhan Uni. Technol. Mater. Sci. Ed. 2017, 32, 1344–1351. [Google Scholar] [CrossRef]
  4. Wu, D.; Zhang, Y.; Liu, Y. Mechanical performance and ultrasonic properties of cemented gangue backfill with admixture of fly ash. Ultrason 2016, 64, 89–96. [Google Scholar] [CrossRef]
  5. Hasan, E.; Atac, B. Influence of silica fume on mechanical property of cemented paste backfill. Constr. Build. Mater. 2022, 317, 1–9. [Google Scholar]
  6. Lu, G.D.; Fall, M.; Cui, L. A multiphysics-viscoplastic cap model for simulating blast response of cemented tailings backfill. J. Rock Mech. Geotech. Eng. 2017, 9, 551–564. [Google Scholar] [CrossRef]
  7. Kashani, A.; Nicolas, S.R.; Qiao, G.G.; Deventer, J.S.J.; Provis, J.L. Modelling the yield stress of ternary cement-slag-fly ash pastes based on particle size distribution. Powder Technol. 2014, 266, 203–209. [Google Scholar] [CrossRef]
  8. Dong, Q.; Liang, B.; Jia, L.F.; Jiang, L.G. Effect of sulfide on the long-term strength of lead-zinc tailings cemented paste backfill. Constr. Build. Mater. 2019, 200, 436–446. [Google Scholar] [CrossRef]
  9. Xiu, Z.G.; Wang, S.H.; Ji, Y.C.; Wang, F.L.; Ren, F.Y.; Wang, P.Y. An analytical model for the triaxial compressive Stress-strain relationships of Cemented Pasted Backfill (CPB) with different curing time. Constr. Build. Mater. 2021, 313, 1087–1102. [Google Scholar] [CrossRef]
  10. Yilmaz, E.; Belem, T.; Benzaazoua, M.; Kesimal, A.; Ercikdi, B. Evaluation of the strength properties of deslimed tailings paste backfill. Miner. Resour. Eng. 2013, 12, 129–144. [Google Scholar]
  11. Bull, A.J.; Fall, M. Curing temperature dependency of the release of arsenic from cemented paste backfill made with Portland cement. J. Environ. Manag. 2020, 269, 110772. [Google Scholar] [CrossRef] [PubMed]
  12. Fall, M.; Samb, S.S. Influence of curing temperature on strength, deformation behaviour and pore structure of cemented paste backfill at early ages. Constr. Build. Mater. 2006, 305, 125–135. [Google Scholar] [CrossRef]
  13. Jiang, H.Q.; Fall, M.; Yilmaz, E.; Li, Y.H.; Yang, L. Effect of mineral admixtures on flow properties of fresh cemented paste backfill: Assessment of time dependency and thixotropy. Powder Technol. 2020, 372, 258–266. [Google Scholar] [CrossRef]
  14. Liu, L.; Xin, J.; Huan, C.; Qi, C.; Song, K.L. Pore and strength characteristics of cemented paste backfill using sulphide tailings: Effect of sulphur content. Constr. Build. Mater. 2020, 237, 117452. [Google Scholar] [CrossRef]
  15. Tian, X.C.; Fall, M. Non-isothermal evolution of mechanical properties, pore structure and self-desiccation of cemented paste backfill. Constr. Build. Mater. 2021, 297, 123657. [Google Scholar] [CrossRef]
  16. Yang, L.H.; Wang, H.J.; Wu, A.X.; Li, H.; Bruno, T.A.; Zhou, X.; Wang, X.T. Effect of mixing time on hydration kinetics and mechanical property of cemented paste backfill. Constr. Build. Mater. 2020, 247, 118516. [Google Scholar] [CrossRef]
  17. Zhao, Y.; Taheri, A.; Karakus, M.; Chen, Z.W.; Deng, A. Effects of water content, water type and temperature on the rheological behaviour of slag-cement and fly ash-cement paste backfill. Int. J. Min. Sci. Technol. 2020, 30, 271–278. [Google Scholar] [CrossRef]
  18. Libos, I.L.S.; Cui, L. Effects of curing time, cement content, and saturation state on mode-I fracture toughness of cemented paste backfill. Eng. Fract. Mech. 2020, 235, 107174. [Google Scholar] [CrossRef]
  19. Wang, J.; Zhang, C.; Fu, J.X.; Song, W.D.; Zhang, Y.F. Effect of water saturation on mechanical characteristics and damage behavior of cemented paste backfill. J. Mater. Res. Technol. 2021, 15, 6624–6639. [Google Scholar] [CrossRef]
  20. Yilmaz, E.; Belem, T.; Bussière, B.; Mbonimpa, M.; Benzaazoua, M. Curing time effect on consolidation behaviour of cemented paste backfill containing different cement types and contents. Constr. Build. Mater. 2015, 75, 99–111. [Google Scholar] [CrossRef]
  21. Zhou, Y.B.; Fall, M.; Haruna, S. Flow ability of cemented paste backfill with chloride-free antifreeze additives in sub-zero environments. Cem. Concr. Compos. 2022, 126, 104359. [Google Scholar] [CrossRef]
  22. Ghirian, A. Coupled Thermo-Hydro-Mechanical-Chemical (THMC) Processes in Cemented Tailings Backfill Structures and Implications for Their Engineering Design. Ph.D. Thesis, University of Ottawa, Ottawa, ON, Canada, 2016. [Google Scholar]
  23. Ouyang, S.Y.; Huang, Y.L.; Zhou, N. Experiment on hydration exothermic characteristics and hydration mechanism of sand-based cemented paste backfill materials. Constr. Build. Mater. 2022, 318, 125870. [Google Scholar] [CrossRef]
  24. Fall, M.; Benzaazoua, M.; Ouellet, S. Experimental characterization of the influence of tailings fineness and density on the quality of cemented paste backfill. Miner. Eng. 2005, 18, 41–44. [Google Scholar] [CrossRef]
  25. Zhang, Q.L.; Li, X.P.; Yang, W. Optimization of filling slurry ratio in a mine based on back-propagation neural network. J. Cent. South Univ. (Sci. Tech.) 2013, 44, 2867–2874. [Google Scholar]
  26. Huang, S.; Xia, K.W.; Qiao, L. Dynamic tests of cemented paste backfill: Effects of strain rate, curing time, and cement content on compressive strength. J. Mater. Sci. 2011, 46, 5165–5170. [Google Scholar] [CrossRef]
  27. Ehsan, S.; Hakan, B.; Luo, G.H.; Ali, K.; Richard, D.; Andy, F.; Mohamed, E. Multi-objective mixture design of cemented paste backfill using particle swarm optimisation algorithm. Miner. Eng. 2020, 153, 106385. [Google Scholar]
  28. Li, D.; Feng, G.R.; Guo, Y.X.; Qi, T.Y.; Jia, X.Q.; Feng, J.R.; Li, Z. Analysis on the strength increase law of filling material based on response surface method. J. China Coal Soc. 2016, 41, 392–398. [Google Scholar]
  29. Zhao, G.Y.; Ma, J.; Peng, K.; Yang, Q.; Zhou, L. Mix ratio optimization of alpine mine backfill based on the response surface method. Chin. J. Eng. 2013, 35, 559–565. [Google Scholar]
  30. Xu, M.F.; Gao, Y.T.; Jin, A.B.; Zhou, Y.; Guo, L.J.; Liu, G.S. Prediction of cemented backfill strength by ultrasonic pulse velocity and BP neural network. Chin. J. Eng. 2016, 38, 1059–1068. [Google Scholar]
  31. Wei, W.; Gao, Q. Strength prediction of backfilling body based on modified BP neural network. J. Harbin Inst. Technol. 2013, 45, 90–95. [Google Scholar]
  32. Qi, C.; Chen, Q.; Fourie, A.; Zhang, Q. An intelligent modelling framework for mechanical properties of cemented paste backfill. Miner. Eng. 2018, 123, 16–27. [Google Scholar] [CrossRef]
  33. Mitchell, R.J.; Olsen, R.S.; Smith, J.D. Model studies on cemented tailings used in mine backfill. Can. Geotech. J. 2011, 19, 14–28. [Google Scholar] [CrossRef]
  34. Fu, Z.G.; Qiao, D.P.; Guo, Z.L.; Li, K.G.; Xie, J.C.; Wang, J.X. A model for calculating strength of ultra-fine tailings cemented hydraulic fill and its application. Rock Soil Mech. 2018, 39, 3147–3156. [Google Scholar]
  35. Qi, C.C.; Chen, Q.S.; Kim, S.S. Integrated and intelligent design framework for cemented paste backfill: A combination of robust machine learning modelling and multi-objective optimization. Miner. Eng. 2020, 155, 106422. [Google Scholar] [CrossRef]
  36. Wei, X.; Li, C.; Zhang, L.; Zhou, X.; Hu, B. Strength prediction model of cemented backfill and inversion calculation of cement consumption. Geotech. Geol. Eng. 2018, 36, 649–656. [Google Scholar] [CrossRef]
  37. Orejarena, L.; Fall, M. Artificial neural network based modeling of the coupled effect of sulphate and temperature on the strength of cemented paste backfill. Can. J. Civ. Eng. 2011, 38, 100–109. [Google Scholar] [CrossRef]
  38. Cui, L.; Fall, M. Mathematical modelling of cemented tailings backfill: A review. Int. J. Mining, Reclam. Environ. 2018, 33, 389–408. [Google Scholar] [CrossRef]
  39. Zhao, Y.L.; Wu, P.Q.; Qiu, J.P.; Guo, Z.B.; Tian, Y.S.; Sun, X.G.; Gu, X.W. Recycling hazardous steel slag after thermal treatment to produce a binder for cemented paste backfill. Powder Technol. 2022, 395, 652–662. [Google Scholar] [CrossRef]
  40. Klein, K.; Simon, D. Effect of specimen composition on the strength development in cemented paste backfill. Can. Geotech. J. 2006, 43, 310–324. [Google Scholar] [CrossRef]
  41. Cao, S.; Yilmaz, E.; Song, W.D. Fiber type effect on strength, toughness and microstructure of early age cemented tailings backfill. Constr. Build. Mater. 2019, 223, 44–54. [Google Scholar] [CrossRef]
  42. Chen, S.J.; Du, Z.W.; Zhang, Z.; Zhang, H.W.; Xia, Z.G.; Feng, F. Effects of chloride on the early mechanical properties and microstructure of gangue-cemented paste backfill. Constr. Build. Mater. 2020, 235, 117504. [Google Scholar] [CrossRef]
  43. Li, W.C.; Fall, M. Strength and self-desiccation of slag-cemented paste backfill at early ages: Link to initial sulphate concentration. Cem. Concr. Compos. 2018, 89, 160–168. [Google Scholar] [CrossRef]
  44. Fahey, M.; Helinski, M.; Fourie, A. Development of specimen curing procedures that account for the influence of effective stress during curing on the strength of cemented mine backfill. Geotech. Geol. Eng. 2011, 29, 709–723. [Google Scholar] [CrossRef]
  45. Ghirian, A.; Fall, M. Strength evolution and deformation behaviour of cemented paste backfill at early ages: Effect of curing stress, filling strategy and drainage. Int. J. Min. Sci. Technol. 2016, 26, 809–817. [Google Scholar] [CrossRef]
  46. Qiu, J.P.; Guo, Z.B.; Yang, L.; Jiang, H.Q.; Zhao, Y.L. Effect of tailings fineness on flow, strength, ultrasonic and microstructure characteristics of cemented paste backfill. Constr. Build. Mater. 2020, 263, 120645. [Google Scholar] [CrossRef]
  47. Zisi, C.; Pappa-Louisi, A.; Nikitas, P. Separation optimization in HPLC analysis implemented in R programming language. J. Chromatogr. A. 2020, 1617, 460823. [Google Scholar] [CrossRef] [PubMed]
Figure 1. The curves of the cement and tailings between cumulative volume and particle size.
Minerals 12 00211 g001
Figure 2. Schemes of the curing stress application.
Minerals 12 00211 g002
Figure 3. Relationship between the UCS and curing stress with different curing temperatures: (a) 20 °C; (b) 35 °C; (c) 50 °C.
Minerals 12 00211 g003
Figure 4. Relationship between UCS and curing temperature with different curing stress: (a) 7 d; (b) 14 d; (c) 28 d.
Minerals 12 00211 g004aMinerals 12 00211 g004b
Figure 5. Correlation between the UCS and coupled effects of curing conditions.
Minerals 12 00211 g005
Figure 6. The theoretical model of the UCS contours for CPB: (a) 7 d; (b) 14 d; (c) 28 d.
Minerals 12 00211 g006
Figure 7. Relationship between the model theoretical UCS and measured UCS: (a) 7 d; (b) 14 d; (c) 28 d.
Minerals 12 00211 g007
Figure 8. Histogram of UCSmeasured/UCSpredicted based on the mathematical strength model at: (a) 7 d; (b) 14 d; (c) 28 d.
Minerals 12 00211 g008
Figure 9. Correlation between the predicted UCS and measured UCS.
Minerals 12 00211 g009
Table 1. Chemical characteristics of the tailings.
Parameter Al2O3
(%)
CaO
(%)
FeO3
(%)
MgO
(%)
P2O5
(%)
SiO2
(%)
TiO2
(%)
Na2O
(%)
K2O
(%)
Tailings1.0444.052.895.020.1843.550.350.102.82
OPC5.3766.183.363.010.1121.120.200.20.45
Table 2. The distribution of the UCS growth rate for CPB.
Curing Time
(d)
Curing Temperature
(°C)
UCS Growth Rate (%)
0 kPa90 kPa180 kPa270 kPa360 kPa450 kPa540 kPa
720049.5325.6318.9110.885.666.79
35053.3719.7811.017.445.905.81
50025.8511.747.888.725.605.65
1420045.2722.3311.419.905.594.41
35044.6416.918.887.693.685.43
50024.139.426.236.215.362.93
2820038.5816.487.557.604.354.17
35035.9610.087.095.563.243.14
50019.918.114.544.513.993.38
Table 3. The evolution rule of the UCS growth rate for the CPB.
Curing Time
(d)
Curing Temperature
(°C)
UCS Growth Rate (%)
0 kPa90 kPa180 kPa270 kPa360 kPa450 kPa540 kPa
7200.000.000.000.000.000.000.00
3566.3670.6362.6951.8847.1747.5046.15
5082.5849.8239.7635.8137.4437.0536.84
14200.000.000.000.000.000.000.00
3557.4356.7449.8146.4243.4840.8842.25
5072.5348.0738.5835.2033.3335.4932.28
28200.000.000.000.000.000.000.00
3548.2245.4237.4236.8434.2432.8131.50
5051.3733.5031.1227.9926.7227.6527.95
Table 4. Parameters of the mathematical strength model.
Curing Time (d)ParametersR2
η ξ λ e
70.1083.446 × 10−4−2.663 × 10−70.8470.977
140.1754.854 × 10−4−7.603 × 10−70.7820.972
280.3457.009 × 10−4−7.009 × 10−70.6370.970
Notice: The best fit parameters above can only be applied in the conditions of this experiment: (1) Curing stress of 0~540 kPa, (2) Curing temperature of 20~50 °C.
Publisher’s Note: MDPI stays neutral with regard to jurisdictional claims in published maps and institutional affiliations.

