
Diffusion and Sorption Studies of Cs, Sr and Co in Intact Crystalline Rock
by
 , ,
, ,
Xiaodong Li
1,*,† ,
,
Juuso Sammaljärvi
1,†,
Shuo Meng
2,
Longcheng Liu
2,
Marja Siitari-Kauppi
1 and
Andrew Martin
3 1
Department of Chemistry–Radiochemistry, University of Helsinki, 00014 Helsinki, Finland
2
Department of Chemical Engineering, Royal Institute of Technology KTH, 10691 Stockholm, Sweden
3
Nagra (National Cooperative for the Disposal of Radioactive Waste), 5430 Wettingen, Switzerland
*
Author to whom correspondence should be addressed.
†
These authors contributed equally to this work.
Minerals 2022, 12(2), 231; https://0-doi-org.brum.beds.ac.uk/10.3390/min12020231
Submission received: 20 December 2021
/
Revised: 4 February 2022
/
Accepted: 8 February 2022
/
Published: 11 February 2022
(This article belongs to the Special Issue Mineral Aggregates in Crystalline Rocks—Bridge between Rock-Forming Components and Physical, Chemical, and Mechanical Properties)
Abstract
:Three cationic tracers, Sr2+, Co2+ and Cs+ were tested with a modified electromigration device by applying 2V, 3V and 4V voltage gradients over an intact Grimsel granodiorite rock sample. An ideal plug-flow model and an advection-dispersion model were applied to analyze the breakthrough curves. Matrix characterization by C-14-PMMA autoradiography and scanning electron microscopy showed that in the centimeter scale of Grimsel granodiorite rock, the interconnected matrix porosity forms a well-connected network for diffusion. Micrometer-scale fissures are transecting biotite and chlorite minerals, indicating sorption of the studied cations. The ideal plug-flow model indicated that the effective diffusion coefficients (De values) for Sr2+, Co2+ and Cs+ tracer ions within the Grimsel granodiorite rock were 3.20 × 10⁻¹³ m2/s, 1.23 × 10⁻¹³ m2/s and 2.25 × 10⁻¹² m2/s, respectively. De values were also derived from the advection-dispersion model, from which 2.86 × 10⁻¹³ m2/s, 1.35 × 10⁻¹³ m2/s and 2.26 × 10⁻¹² m2/s were calculated. The diffusion speed for the tracers was in the sequence of Cs+ > Sr2+ > Co2+ that is in the same sequence as their diffusion in diluted water. The distribution coefficients (Kd values) calculated from the models covered the range of two magnitudes (from 10−7 m3/kg to 10−5 m3/kg). The result indicated that the sorption process of the studied elements did not reach equilibrium during the electromigration process, mainly due to the too much acceleration of the migration speed by the voltage gradients applied over the rock sample.
1. Introduction
Geological disposal has been widely accepted as a realistic option for nuclear waste management in many countries, such as Finland, Sweden, France and Switzerland. Experiments, both in-situ and laboratory scale, have been performed to provide solid parameters for concept development and safety assessment of a nuclear waste repository [1,2]. For example, the Swiss National Cooperative for the Disposal of Radioactive Waste (Nagra) has been conducting in-situ field experiments in its underground rock laboratory (URL), named the Grimsel Test Site (GTS), to assess the relevance of laboratory data to repository scales and to evaluate the diffusion and sorption properties of radionuclides in in-situ conditions [3,4,5].
In tandem, supporting laboratory experiments were conducted to gain information on the validity of the methods and data to provide an opportunity to improve the modeling results and hence the safety analysis [4,6,7]. The migration and retention of radionuclides such as 133Ba, 79Se, 226Ra, 134Cs, 22Na, 3H, 131I, in the matrix of the GTS bedrock, Grimsel granodiorite, has been provided both for the in-situ condition and laboratory-scale experimental conditions. The results show that matrix diffusion into the rock and sorption onto the mineral/rock surfaces are the most significant processes that can retard the transport of radionuclides from the spent nuclear fuel or low- and intermediate level radioactive waste repositories to the surrounding biosphere. Thus, in the safety assessment of a nuclear waste repository, the effective diffusivity (De), sorption distribution coefficient (Kd) and pore space characterization (e.g., porosity ε) are the key parameters to evaluate the retardation processes of radionuclides under expected underground conditions [8].
The characterization of pore spaces and surfaces of an intact rock sample have been studied with various techniques. A resin technique for impregnating and imaging rock samples with a 14C-labelled polymethylmethacrylate (C-14-PMMA autoradiography) method was developed to allow investigation of the spatial distributions of accessible porosity of centimetric scaled rock samples [9,10,11]. Quantitative measurements of total or mineral-specific local porosities have also been obtained using image analysis tools [12]. This method was used to characterize crystalline rock samples from GTS and Onkalo, Olkiluoto, Finland [13,14]. By combining the C-14-PMMA autoradiography with other techniques, such as X-ray tomography, scanning electron microscope (SEM) and energy-dispersive X-ray spectroscopic analyses, this technique can provide a detailed relationship between microstructure, mineralogy and porosity in centimeter-scale rock cores. For the acquisition of De and Kd parameters, the use of the electromigration technique has received more attention in the last two decades [15,16,17,18,19,20]. Compared with traditional diffusion experiments, the electromigration technique can decrease the experimental time from months to days due to the acceleration of the migration of studied ions by an electric field. The technique also has the advantage of providing Kd values for intact rock samples to avoid the crushing effects of them as used in batch sorption studies. Therefore, the electromigration technique has received increasing attention for directly providing sorption and diffusion data under intact rock conditions. With the electromigration device that has four chambers, Löfgren et al. [21] obtained the De values for both I− and Cs+ through a 15 mm thick crystalline rock sample and concluded that the De values were in agreement with the ones provided by in-diffusion experiments. To improve the stability of the device and reduce experimental errors, Li et al. [19] modified the electromigration device by introducing a potentiostat that has four electrode experimental functions. The potentiostat keeps the voltage over the rock sample constant and enables the automation of the system. However, studies focusing on the impact of properties of rock samples (e.g., pore structure, mineralogical heterogeneities and porosity) on tracer diffusion and sorption under applied external electric fields are still rare.
Two anions, I- and SeO32-, which have non-sorbing or slightly sorbing properties, were successfully tested with the modified electromigration device by Li et al. [19]. However, the sorption data (Kd) produced with the electromigration method is still quite rare, which limits the use of this powerful technique in providing reliable parameters for sorption of elements in intact rock samples. In addition, the heterogeneity of the pore space of crystalline rock should be taken into account in interpreting the diffusion and sorption results of electromigration experiments.
This work aims to discuss the electromigration results of three strongly sorbing cations (Cs+, Sr2+ and Co2+) in light of pore space characterization data (heterogeneous mineralogy and pore structures) obtained from C-14-PMMA autoradiography and scanning electron microscopy and energy-dispersive X-ray spectroscopy analysis (SEM/EDS). The combination of the electromigration technique and C-14-PMMA autoradiography will provide insight into the diffusion and sorption processes in heterogeneous Grimsel granodiorite rock core) concerning the main migration pathways and minerals around them.
2. Materials and Methods
2.1. Rock Sample Processing
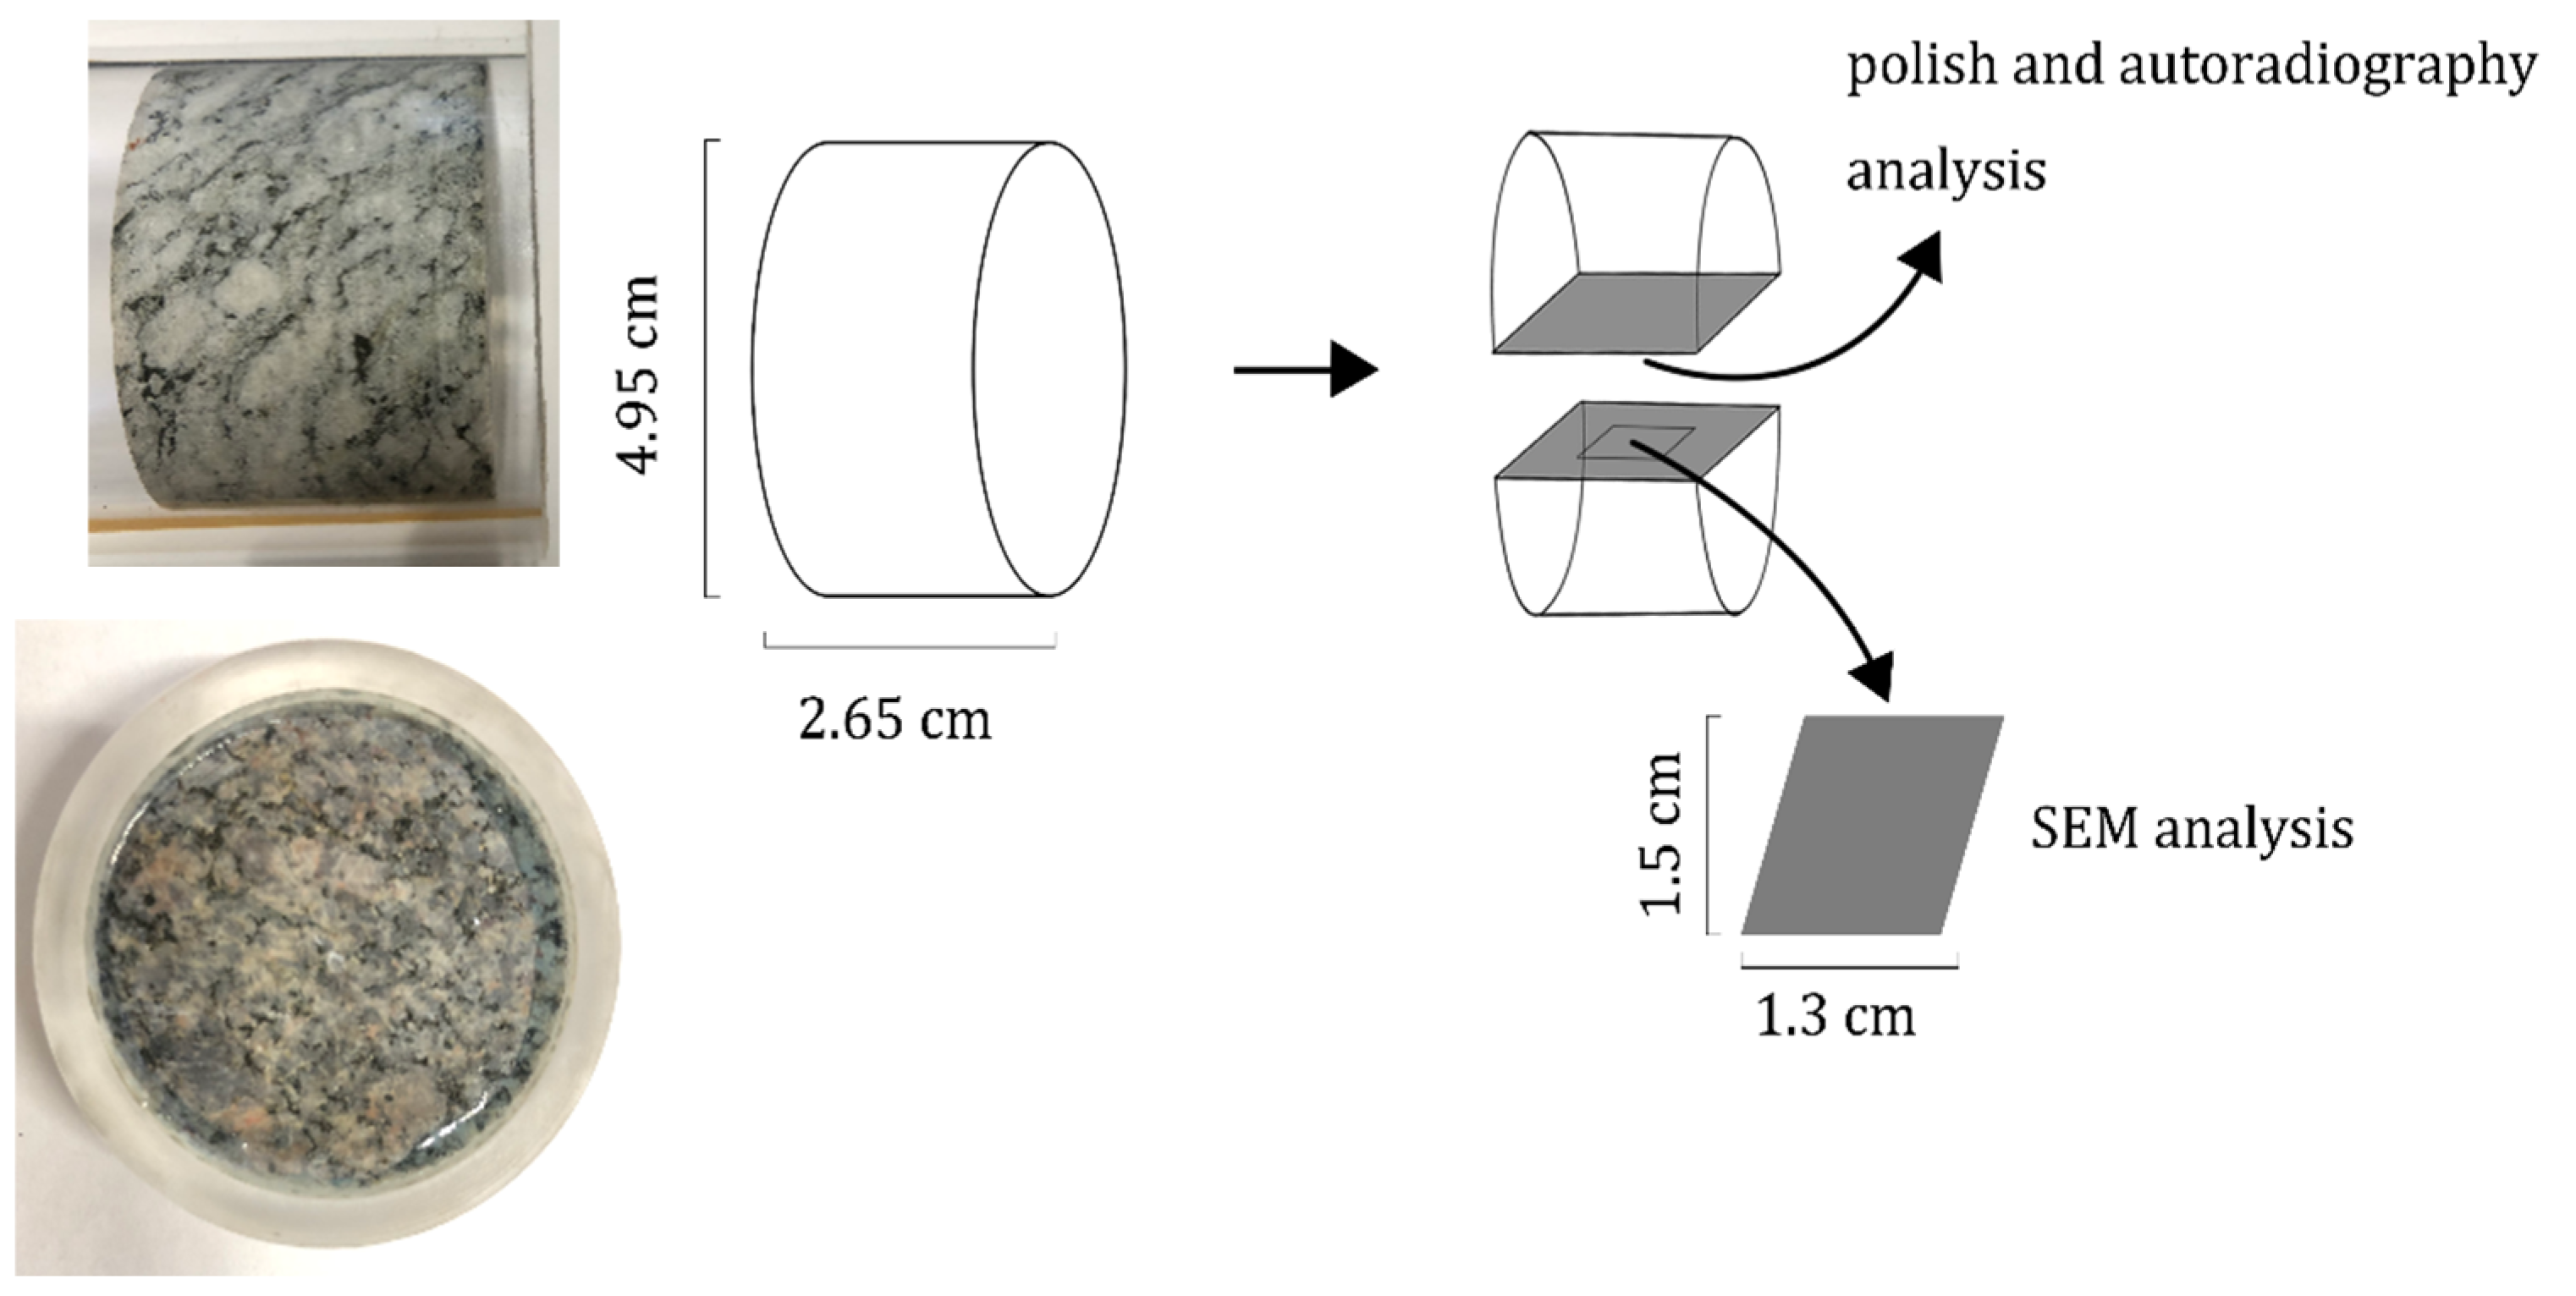
Grimsel granodiorite (Figure 1) was chosen as the studied intact rock sample because of the extensive characterization of the parameters (e.g., porosity, permeability, mineralogy and pore structure distributions) and wide studies with batch sorption experiments and through diffusion experiments [4,6,22,23,24].
The mineral composition of Grimsel granodiorite was measured by X-ray Diffraction (XRD, D8 Discover (A25) powder diffractometer equipped with LYNXEYE detector) and thin section analysis with polarizing microscopy in the Geological Survey of Finland (Table 1). The XRD spectra were recorded for 3 h at an angle interval of 4-100° 2θ (CuKα) with a step size of 0.0092° 2θ. Grimsel granodiorite is a mixture of several minerals with around 40 wt.% of plagioclase, 20–25 wt.% of K-feldspar, 20–30 wt.% of quartz, 6–10 wt.% of biotite and 5 wt.% of chlorite. Biotite and chlorite content is up to 15 wt.% of the material and these minerals have a relatively large specific surface area compared to the other minerals existing in Grimsel granodiorite.
The diameter and length of the rock sample were measured to be 49.5 mm and 26.5 mm, respectively. After cutting and polishing, the rock sample was immersed in background electrolyte (0.2 M NaCl + 0.002 M NaHCO3) for at least two weeks for the purpose of background saturation. The 0.2 M NaCl in the background water simulates the salinity of the common groundwater, while 0.002 M NaHCO3 was added as a pH buffer to resist the pH change caused by hydrolysis reactions occurring on electrodes during the operation of electromigration experiments. After saturation, the rock sample was sealed tightly with epoxy in a plastic cylindrical shell, which has the same inner diameter as the diameter of the rock sample (Figure 1). A detailed method for sealing the sample holder was described in our previous work [19]. The tightness of the holder was also checked, and the results show that the tracer ions can only migrate through the rock sample by its micropores [19].
2.2. C-14-PMMA Autoradiography
C-14-PMMA autoradiography was applied to the Grimsel granodiorite studied for porosity measurement. C-14-PMMA autoradiography is based on measuring the radiation resulting from the C-14-labeled tracer compound within the rock [9,10,11,25]. The sample is first dried and then impregnated with a tracer solution of C-14-labeled methyl methacrylate (C-14-MMA). This tracer intrudes into the sample’s connected porosity. Once the tracer has intruded into all accessible pore spaces, the tracer is fixed in place by polymerizing it. When the tracer has been polymerized, the sample can be sawed, polished and placed on an autoradiographic film for film autoradiography or an imaging plate for digital autoradiography [24,26].
C-14-PMMA autoradiography images the spatial distribution of the C-14-labeled PMMA within the pore network of the sample along two dimensions with the use of storage phosphor screen imaging plates. BAS TR2025 phosphor-europium complex imaging plates were used in this work. The scanner used to read the autoradiography imaging plates in this work was the Fuji FLA-5100.
The 16-bit digital images are produced and the optical densities are calculated according to the equation as follows:
where OD is the optical density, is the optical density for A = 1 Bq/mL, A is the local activity and k’ is the fitting coefficient.
This equation can be converted to the equation of local activity:
Using these two equations, the local activity can be solved and placed into the equation of porosity. The beta correction must be taken into account in the porosity calculation due to the range of C-14 beta emissions in materials of different densities. Thus, the beta correction is proportional to the sample’s grain density and the PMMA density [9,10,27]. Here, a grain density of 2.7 g/cm3 for rock material and a PMMA density of 1.2 g/cm3 are used:
where ϕi is the local porosity (%), represents the material grain density (g/cm3), is the PMMA resin density (g/cm3), Ai is local activity (Bq/mL) and A0 is tracer activity (Bq/mL).
2.3. Scanning Electron Microscopy and Energy Dispersive X-ray Spectroscopic Analyses
The morphology and elemental distribution were studied with field emission scanning electron microscopy (FE-SEM) and with energy-dispersive X-ray spectroscopic analysis (EDS) on the C-14-PMMA impregnated rock sample. The FE-SEM-EDS was used in high-vacuum mode with a backscattered signal, 20 kV accelerating voltage, and 1-5 nA probe current. Backscattered electron (BSE) images were obtained. EDS analysis provides quantitative elemental composition data that was used to identify the mineral phases by comparison to literature values. The elemental analyses were calculated into oxide percentages and normalized to 100%. One autoradiographed Grimsel granodiorite sample surface was carbon coated for the SEM analyses, which were performed using a field emission scanning electron microscope (FE-SEM) Hitachi S-4800 (Hi-tachi, Tokyo, Japan) model with an Oxford instruments X-sight X-ray diffractometer. The energy resolution of the EDS detectors used is about 130 eV for Mn Kα with a processing capabilities multichannel analyzer with 2048 channels at 10 eV ch–1. The FE-SEM-EDS systems were operated by Oxford Instruments INCA software. The analytical data obtained was semi-quantitative and the sum of the components was normalized to 100%. Typical detection limits in point analysis for different elements range between 0.3 and 0.5 wt%.
2.4. Electromigration Device
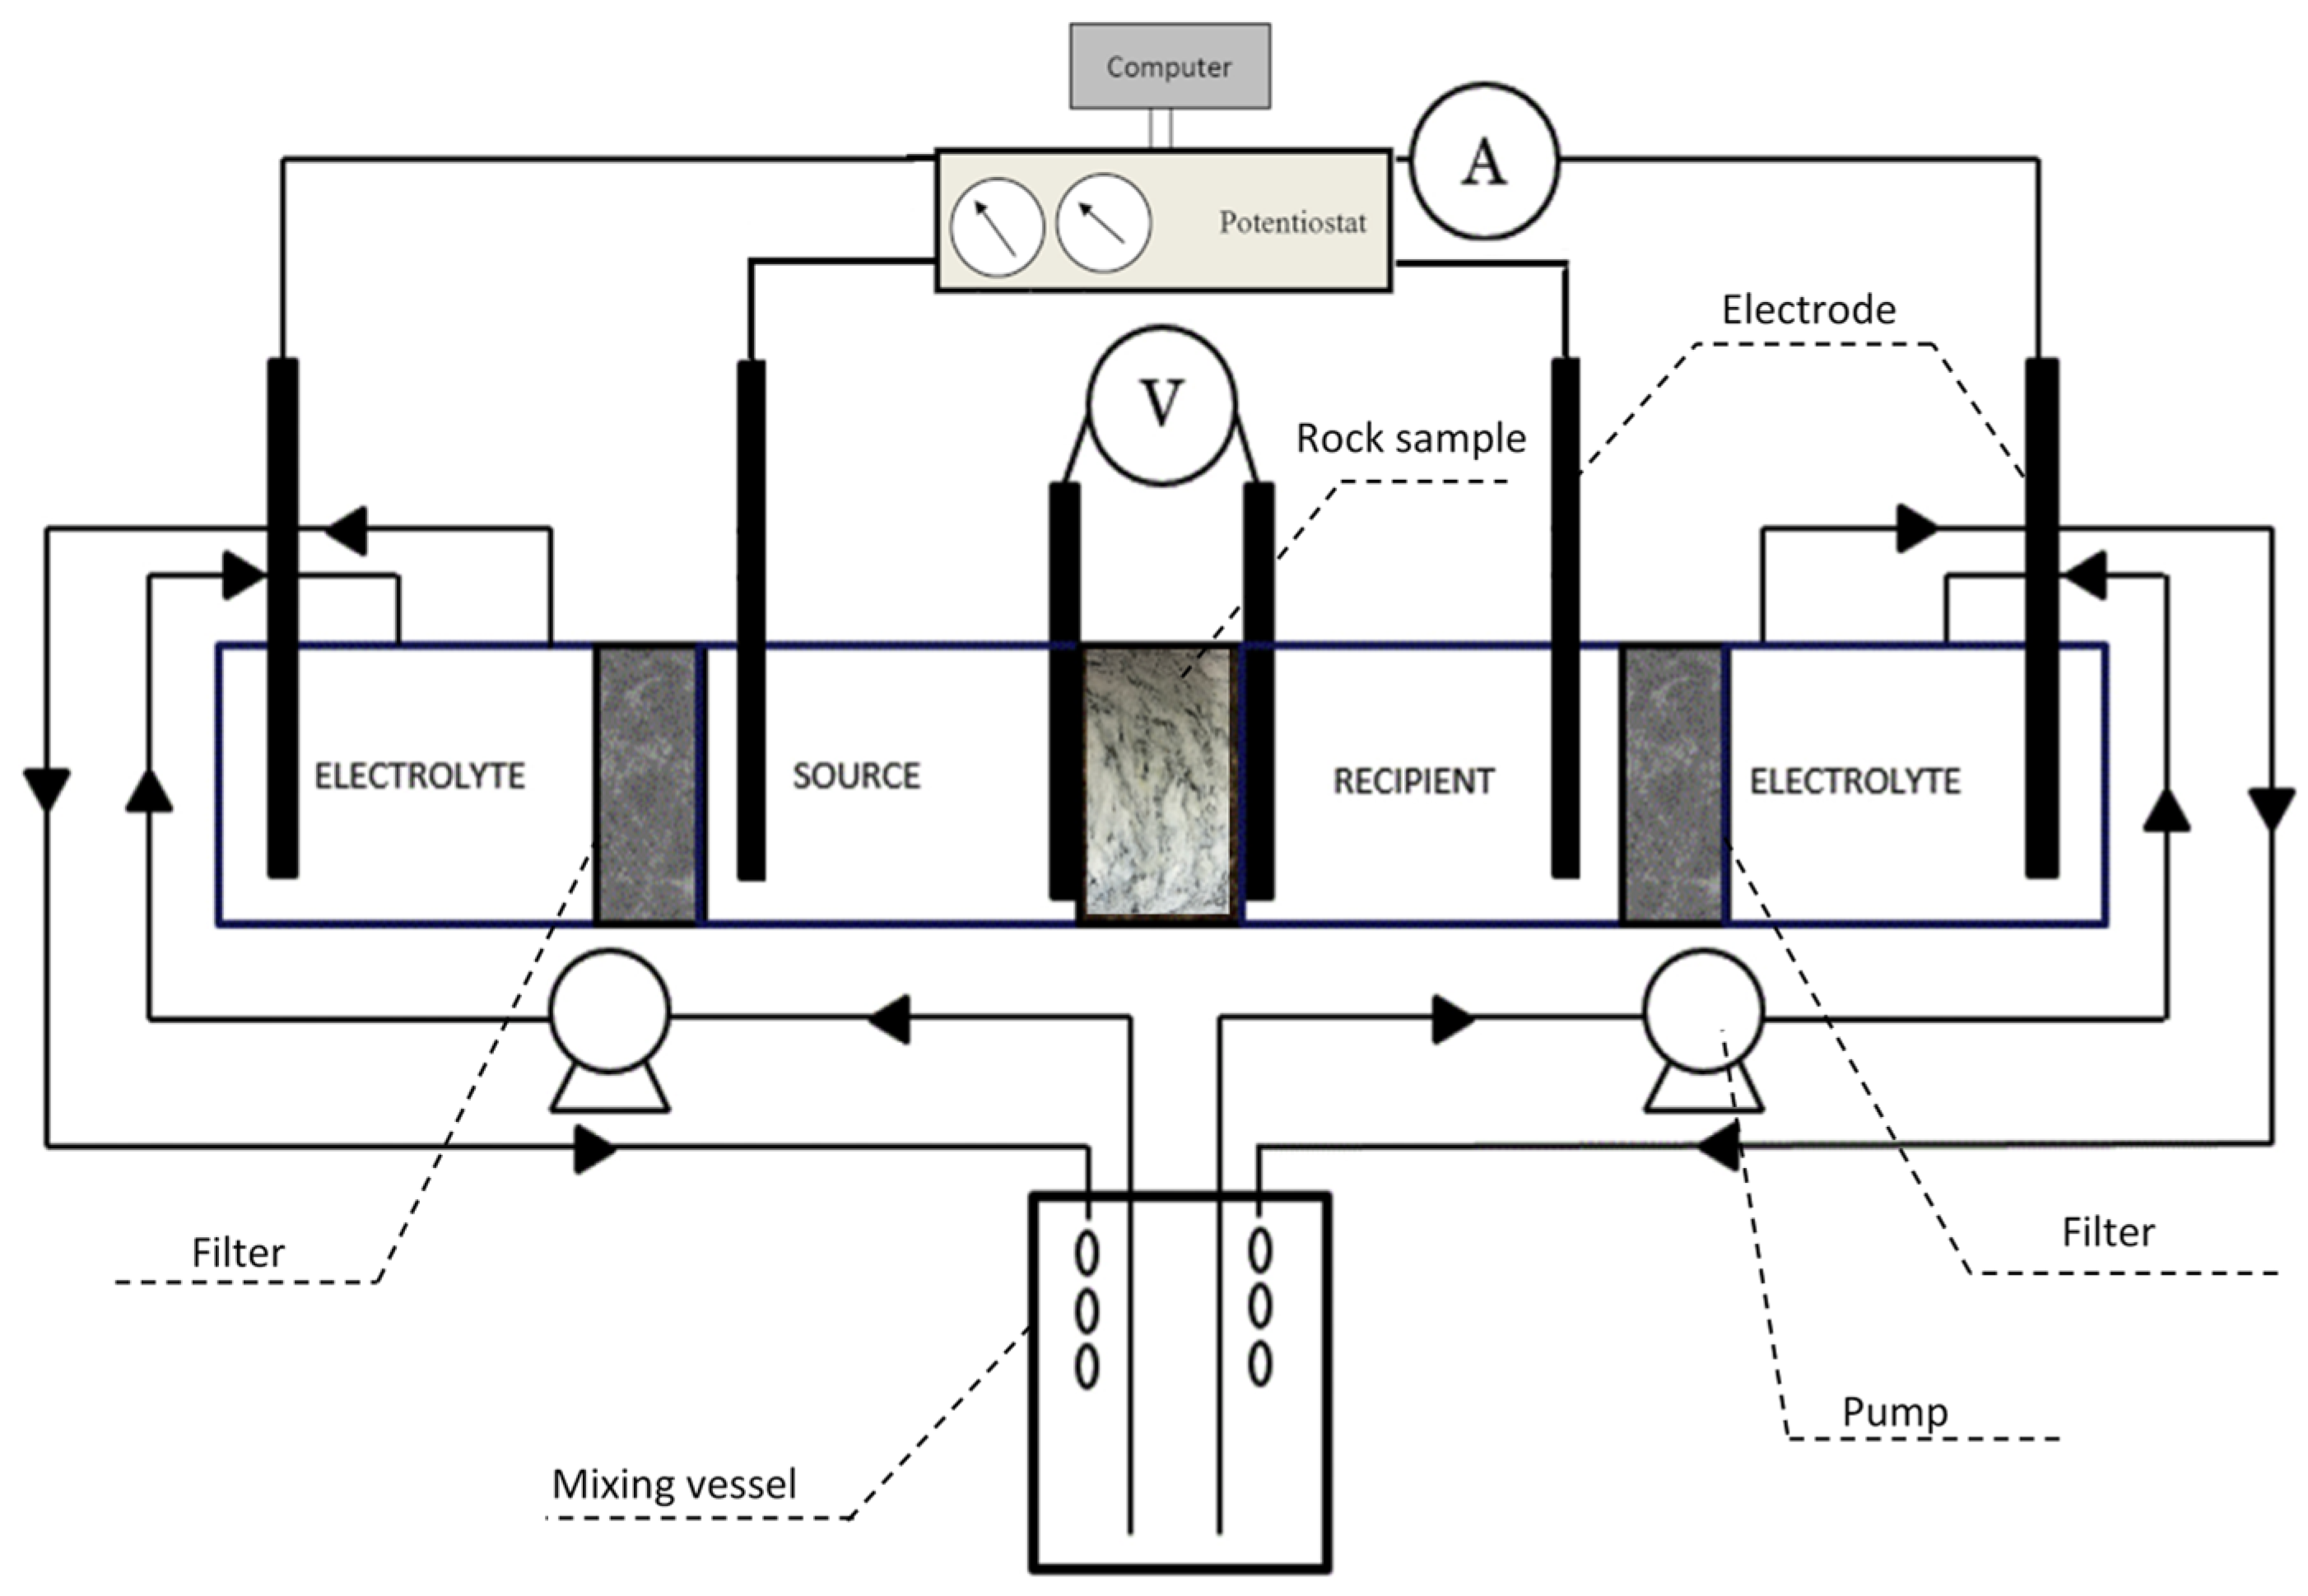
An electromigration device modified in the work of Li et al. [19] was used in the study. The modification of the electromigration device was based on the former design of Löfgren and Neretnieks [20] and André et al. [15] by introducing a potentiostat that can maintain a constant voltage across the rock sample and by adding NaHCO3 buffer to stabilize the pH conditions of the background electrolyte. The modified electromigration device has the functions of voltage-self-controlling, continuous-current-recording and solution-pH-stabilization. Long-term running of the device becomes possible because the voltage over the rock sample will be adjusted automatically by the device itself to keep a constant value when the resistance of the rock sample changes.
A schematic figure of the electromigration device is shown in Figure 2. The volume of the source and recipient chambers is 152 mL, while the volume of the two electrode chambers at both ends is 250 mL. The four-electrode plates with a dimension of 1 cm × 2 cm are made of titanium metal. A platinum wire was used to connect the titanium electrodes. A voltage meter and an ampere meter were utilized to record the instant voltage over the rock sample and the current going through the whole device, respectively. The filters (Äspö underground rock, 0.7% porosity) with a length of 1 cm were used to separate the electrolyte in the two electrode chambers from the electrolyte in the source/recipient chambers. A constant potential of 2 V, 3 V and 4 V was applied over the rock sample, while the whole voltage applied to the electromigration device changes with time according to the resistance change of the rock sample. This process was controlled by the four-electrode system and the Amperometric i-t curve technique [28] of the potentiostat. The current going through the electromigration device was also recorded continuously as a function of experimental time by the potentiostat.
2.5. Electromigration Measurements
The diffusion experiment was performed with three tracers, CsCl, SrCl2 and CoCl2. The concentrations of the tracers in the source chamber as well as other running conditions are shown in Table 2. Before running the electromigration experiments, the speciation of the tracers in the background electrolyte (pH 8) was checked by Phreeqc with the database of Thermoddem V1.10 (15/12/2020) which is a database that gathers the thermodynamic properties of mineral phases from wastes and natural environments. The percentages of the tracers that exist in the sample dissolved ionic form are Cs+ (91%), Sr2+ (96%) and Co2+ (76%). The remaining tracers exist in Cl-complexing formats, such as CsCl, SrCl+ and CoCl+. To simplify the system, we assumed that all the tracers were in the speciation format of Cs+, Sr2+ and Co2+. Three voltages 2V, 3V and 4V, were applied in the experiments to study the effect of different voltages on the retardation processes. The ionic strength of the tracer ions was designed to be the same to avoid the influence of the electric double layer. Thus, the initial concentration of Cs+ (0.1 M) was 3 times higher than the concentration of Sr2+ and Co2+ (0.033 M). The background electrolyte was 0.2 M NaCl and buffered by 0.002 M NaHCO3 to simulate the ionic strength and pH value of normal groundwater.
Before running the electromigration experiments with tracers, the device was stabilized by running it with background electrolyte under the applied voltage overnight to saturate the rock sample with background electrolyte. After stabilization, tracers were added to the source chamber, resulting in the final concentration of the tracers being listed in Table 2. To balance the ionic strength throughout the through-electromigration cell, NaCl with the same ionic strength as the tracer was immediately added into the recipient chamber.
After the addition of the tracers, the source and recipient chambers were both stirred for 5 min by magnetic stirrers for full dissolution. At the same time, 100 µL of sample from the source chamber and 1 mL of sample from the recipient chamber were taken to determine the original concentrations of the tracer ions at the beginning of the experiment. After sampling, the same amount of background electrolyte was added into the chambers to keep the hydraulic pressure and the volume of solutions constant. During the experiments, the electrolytes in the source and recipient chambers were stirred all the time by a magnetic stirrer. The tracer concentrations in the recipient chamber were followed by taking out 2 mL of electrolytes from time to time and then adding the same amount of background electrolytes.
The concentrations of Cs were analyzed by inductively coupled plasma mass spectrometry (ICP-MS), while the concentrations of Sr and Co were analyzed by Microwave Plasma-Atomic Emission Spectrometry (MP-AES). After dilution and centrifugation, all the samples were acidified by adding strong supra pure HNO3 (Romil) until 0.5 M concentration. Then, aliquots of the sample were filtered with 0.2 μm polypropylene membrane filters for analysis.
2.6. Data Analysis Approach
By following the concentration change of the tracer ions in the recipient chamber, a breakthrough curve was obtained from the experiment. The ideal plug-flow model was previously used by researchers for the analysis of electromigration results [15,21]. It considers only the effect of the electromigration process on the behavior of the tracers. For more accurate and realistic data analysis, the advection-dispersion model was developed [29]. The advection-dispersion model takes into account electromigration, electro-osmosis and dispersion and thus can provide better parameter identification with smaller uncertainties. For the comparison of the two models and for comparing our modeling results with other researchers, both models were applied in our data analysis processes. A brief introduction of the two models is described in the following section.
2.6.1. Ideal Plug-Flow Model
To use the ideal plug-flow model, a linear line will be drawn over the data points of a breakthrough curve where the tracer concentration increases seemingly at a constant rate. The intercept of the regression line with the time coordinate gives an estimate of the apparent advection time, whereas the slope of the regression line approximates the rate of change of the tracer concentration in the recipient chamber, from which the effective convection velocity or the effective mass flux can be estimated.
The use of the law of Einstein [30] for the relation between diffusivity and ionic mobility allows the effective diffusion coefficient (De) to be estimated from the slope (dc/dt) of the regression line by
where V (m3) is the volume of the recipient chamber, k (m2·kg·s−2·K−1) is the Boltzmann constant, T is the temperature (K), cR (mol/m3) is the tracer concentration in the recipient chamber, t (s) is the measurement time, A (m2) is the cross-section area of the rock sample, ct (mol/m3) is the test concentration in the supply chamber, e (C) is the electron charge, z is the charge of the species and dΦ/dx (V/m) is the electrical potential gradient applied to the rock sample.
The ideal plug-flow model implicitly assumes that the tracer flux into the rock sample is constant during the experiment and that the rock sample has been fully in equilibrium with the tracer concentration in the source chamber after the breakthrough time. This is not the real case, but it facilitates evaluation of the Kd value of the test tracer by making a mass balance of the tracer ions over the rock sample, giving:
where tbr (s) is the breakthrough time determined by the intercept of the linear regression line with the time axis of the breakthrough curve, Vr (m3) is the volume of the rock sample, is the porosity associated with the transport, ct (mol/m3) is the source concentration of the tracer ions in the supply chamber and m (kg) is the mass of the sample.
It should, however, be noted that the above two expressions are valid only under the assumption that the tracer concentration in the source chamber (ct) remains constant during the running of the experiments. Since, in practice, only 1/105 or 1/106 fraction of the tracer ions may migrate through the rock sample within the limited experimental time, we can reasonably ignore the change of the source concentration to simply apply the above equations for data analysis.
2.6.2. Advection-Dispersion Model
The advection-dispersion model was formulated based on the equation of continuity describing the mass balance of the tracer ions over a rock sample perpendicular to the direction of mass transport, i.e.,
where is the convection velocity, is the dry bulk density of the rock sample, is the distribution coefficient, is the porosity available for both transport and storage, is the porosity associated with the transport, is the constrictivity, considered to depend on the ratio of the diameter of the ions to the pore diameter, and is the tortuosity, defined as the ratio between the real distance of the transport path and the experimentally measured end to end distance.
For the electromigration experiments under consideration, the full solution of Equation (6) can be written in the Laplace domain as:
where is the Laplace transformed solution of tracer concentration in recipient chamber (), Pe is the Péclet number, βL and βR are the relaxation times of the source and recipient chambers, respectively, s is the Laplace variable, S is a s- and εTSR-dependent variable. A more detailed description and derivation of the Equation (7) are shown in Meng et al. [29].
The inverse Laplace transform of Equation (7) to the time domain by use of e.g., De Hoog algorithm [31] to numerically transform gives the tracer concentration at the recipient chamber and it can, for a given experimental setup, be generally written as,
This equation indicates that the numerical solution of depends on and . As a consequence, these parameters can be evaluated by fitting the numerical solution to the measured data of the breakthrough curve using, for example, a nonlinear least-squares algorithm supplemented with suitable lower and upper bounds.
3. Results and Discussions
3.1. C-14-PMMA
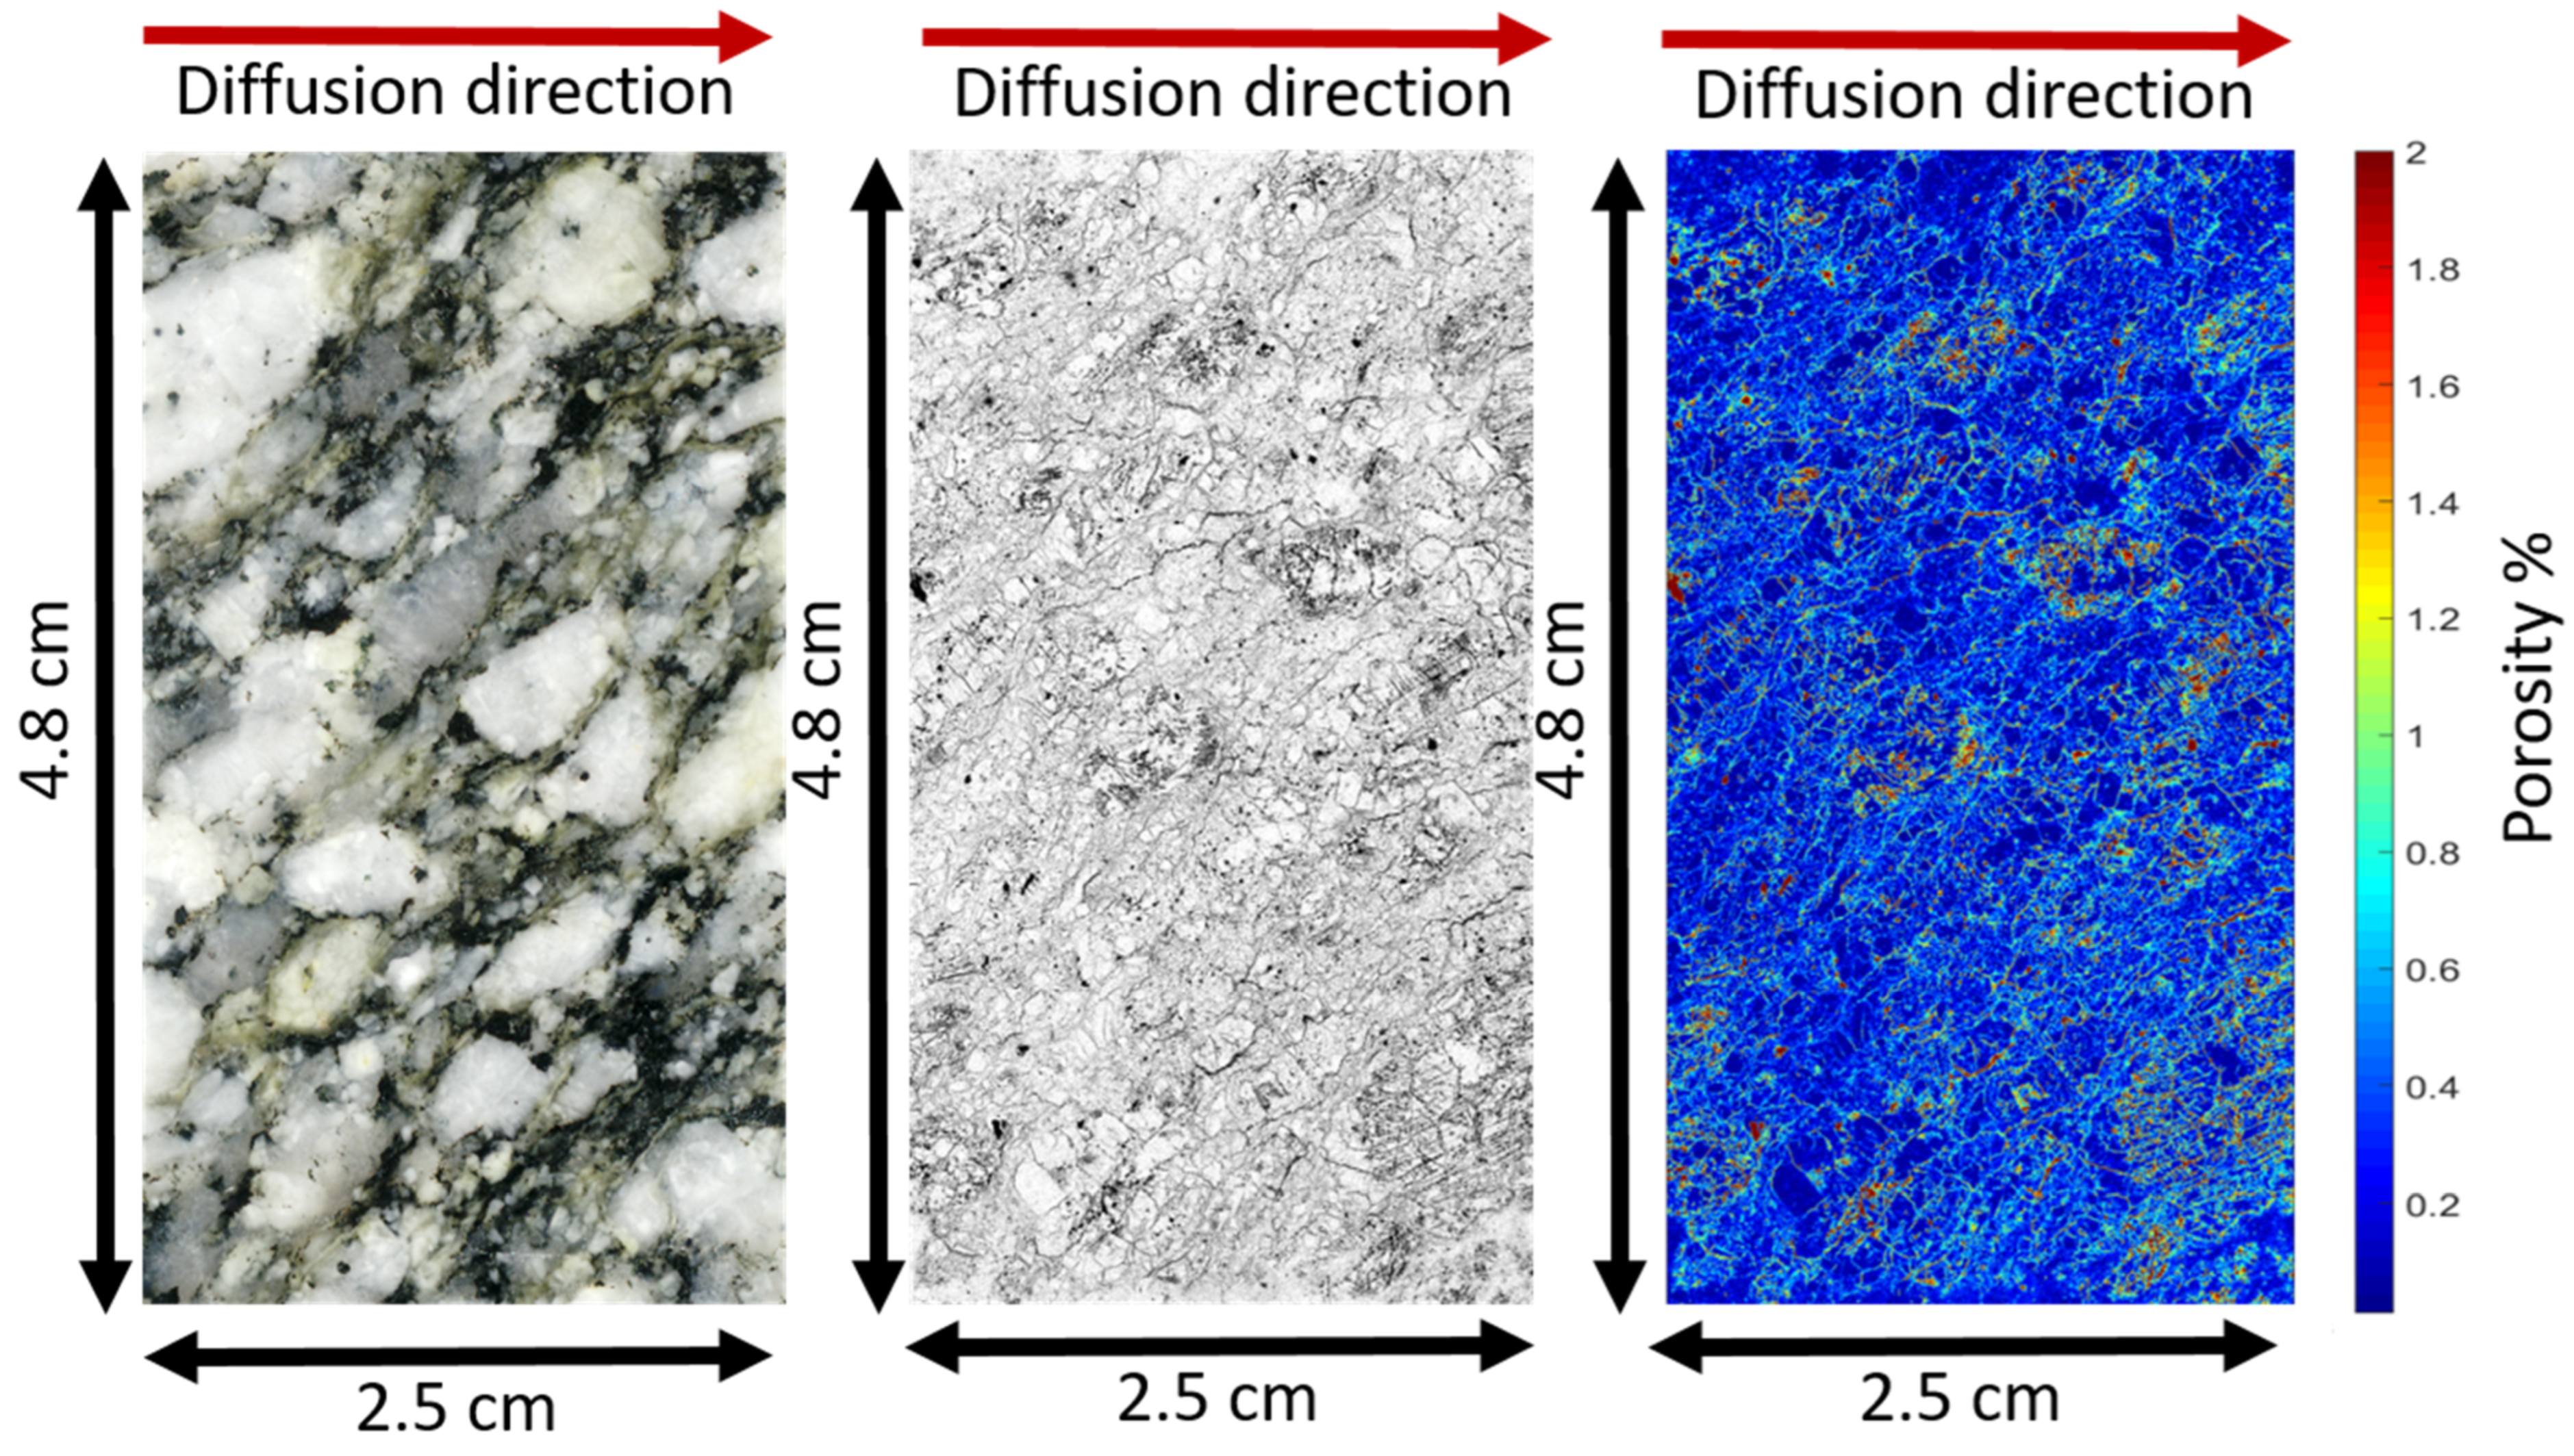
Autoradiography and scanning electron microscopy. Autoradiography results obtained are shown in Figure 3. The mean porosity was determined to be 0.56%. The surface scan shows that there is observable foliation in the sample. The C-14-PMMA autoradiography results also indicate that this foliation is observed in the spatial distribution of porosity. The pore network appears to be well connected, with small clusters of highly porous areas here and there. While there is notable intergranular porosity, all of the grains themselves also appear porous. The porosity map highlights how some highly porous minerals are found among the sample matrix, although considerable porosity is found in all mineral phases. Möri et al. [32] described the porosity of Grimsel granodiorite as consisting of 4 main types of pores. Besides the grain boundary pores, there are also sheet silicate pores in shear bands and mica bands, solution pores in altered plagioclase and perthitic lamellae and microfractures, found throughout the matrix.
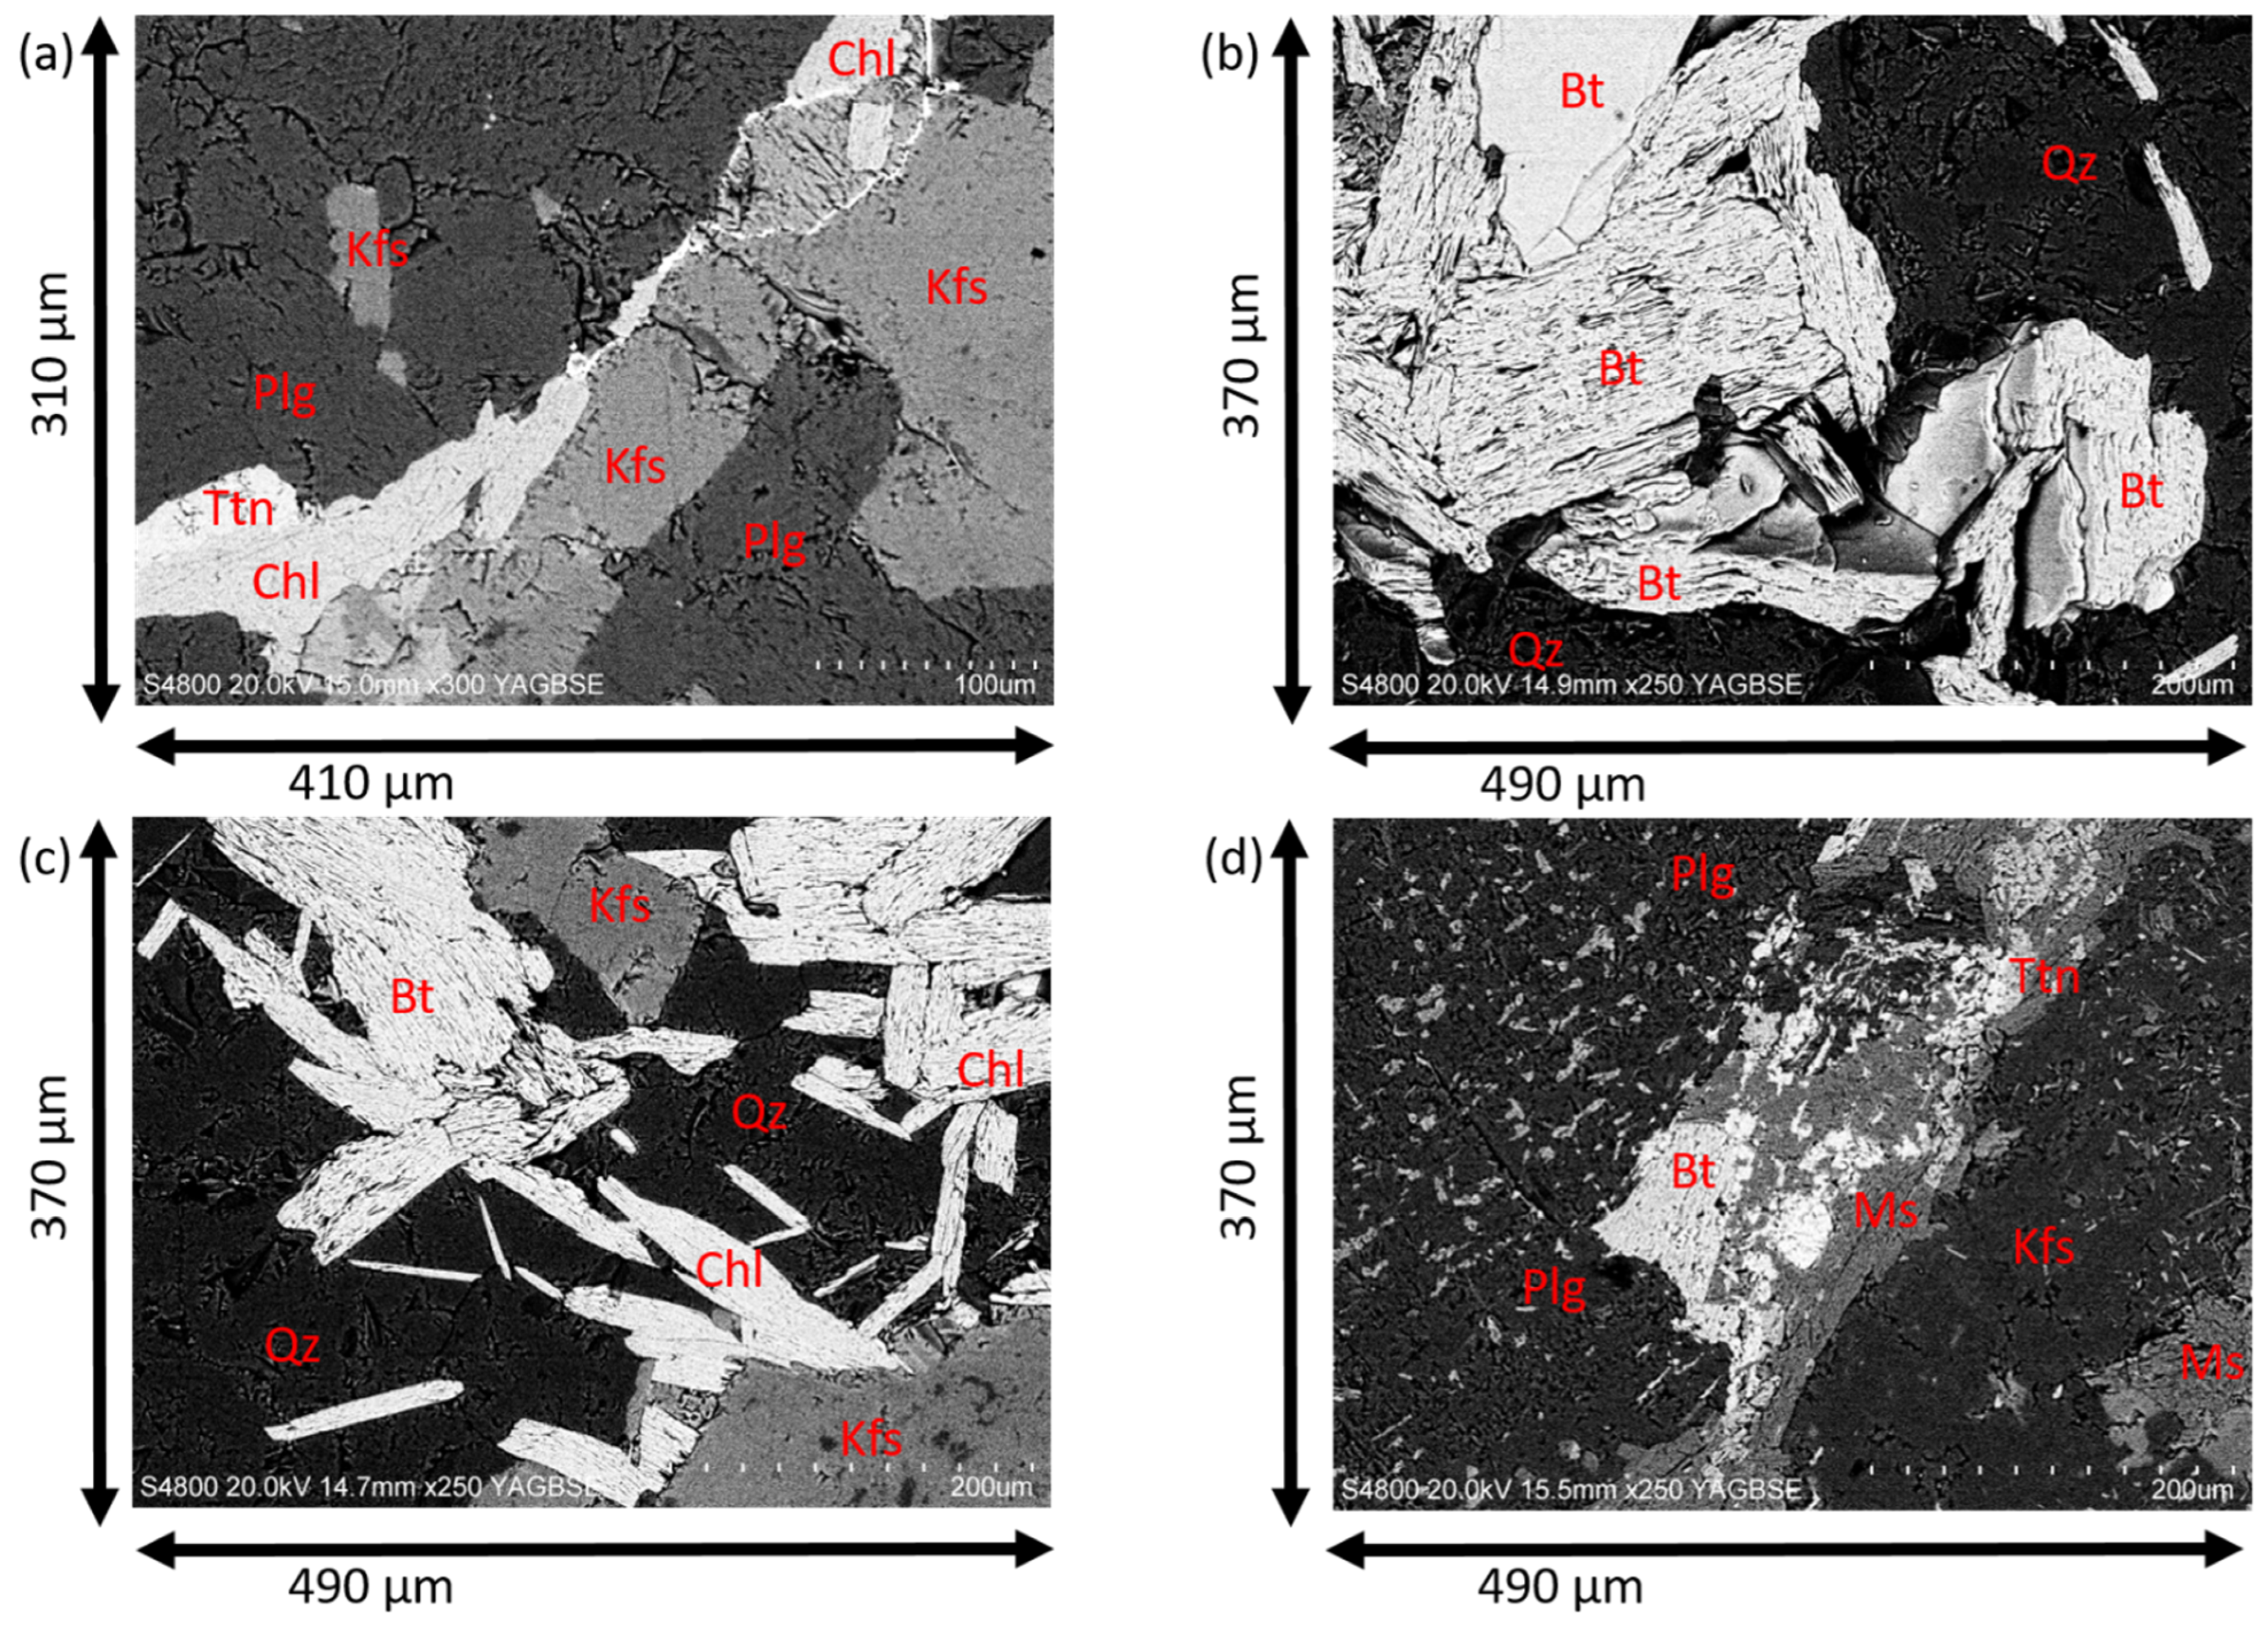
Results obtained via SEM/EDS analyses are shown in Figure 4. Plagioclase, potassium feldspar and quartz were found as large grains. These minerals were often fractured and had fissures running through them. Biotite was found in lamellae of different sizes ranging from hundreds of micrometers to a few tens of micrometers. The biotite lamellae have interlamellar porosity and some of the lamellae were fractured. Biotite was also sometimes found together with muscovite grains. Biotite had altered in several places to chlorite, with the lamellar structure intact. There were also small grains of titanite found sporadically. The fissure population is dominated by open cleavage cracks in mica and grain boundary cracks and an interconnected network of micro fissures exists in the whole granodiorite matrix.
The pore structure of the sample has some amount of foliation to it, which is at an angle compared to the diffusion direction in the electromigration experiment. This likely influences the pathway the tracers take. This could cause the pathway to be longer than in a sample with no foliation. The sample matrix also contained several highly porous areas interspersed throughout the sample. These highly porous areas are biotite and its alteration product, chlorite. The fissures of micrometer-scale transecting biotite and chlorite grains form a part of the network of main migration pathways in Grimsel granodiorite. Biotite is known to be rather porous, and alteration products such as chlorite are known to be highly porous. They also appeared highly porous on the SEM results. These minerals, biotite and chlorite, also have high specific surface areas and could act as sites of enhanced sorption for the cationic tracers used in electromigration experiments. As these mineral clusters appear relatively evenly spread throughout the sample, it is likely that their retarding effect on the diffusion applies more or less uniformly on the electromigration experiment, although possible sorption sites are of course spread out and diffusion profiles are affected. Transport of cesium in Grimsel granodiorite was studied in the Long-term Diffusion (LTD) project and the effect of microscale heterogeneities in mineral and pore structure was studied from cored samples [33]. It was found that heterogeneity of the mineral structure significantly affects the diffusion and sorption of cesium in Grimsel granodiorite at the centimeter scale. However, the strength of the effect will differ based on the affinity of the tracer for minerals. For example, Lehto et al. [34] studied the sorption of Cs and Sr with batch experiments in crushed crystalline rock and biotite. Their findings indicate that Cs sorbed more strongly than Sr in crystalline rock. Cs sorption was noted to be high in biotite and biotite-containing rocks, and less so in rocks poor in biotite. Sr sorption was smaller rather constant across the different rock types studied. Sr has, however, been noted to sorb strongly on calcite and also on clay minerals [35].
3.2. Electromigration Results with SrCl2
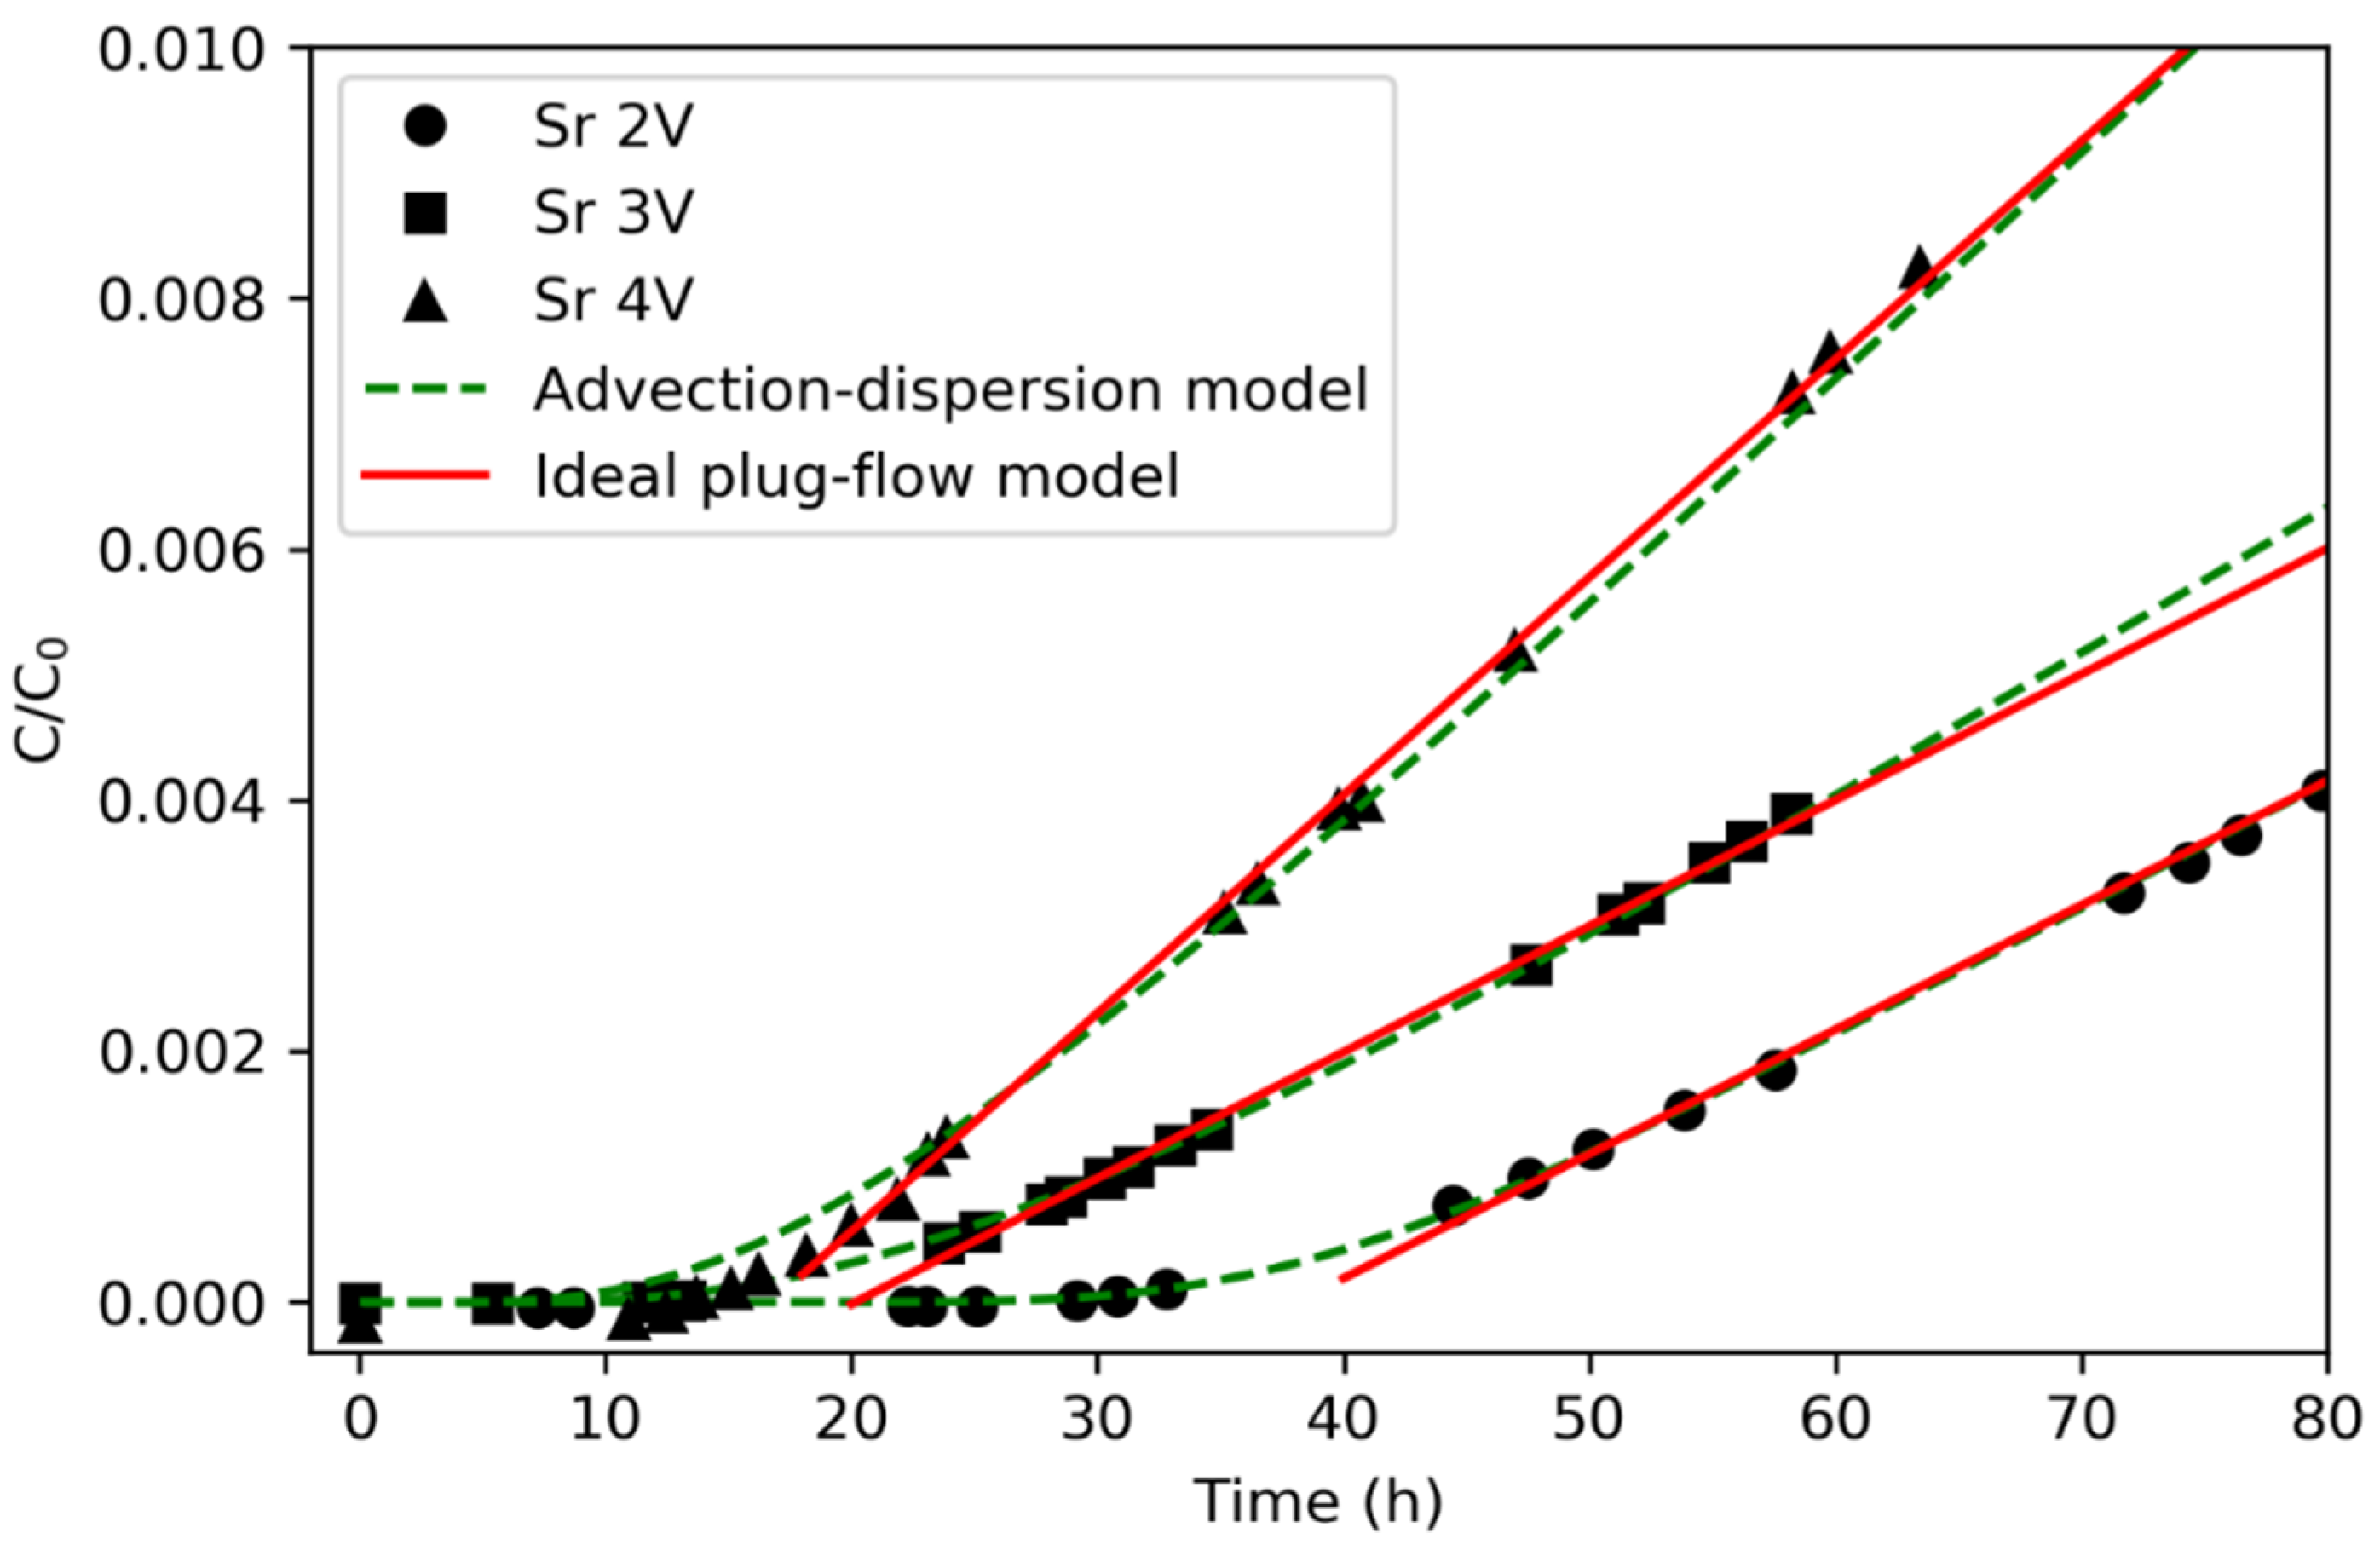
Sorption of cations, such as Cs+, Sr2+ and Co2+, is known to be strong on biotite, which will retard their migration processes through rock samples [36,37,38,39]. Three voltages (2V, 3V and 4V) over the rock sample were applied in the electromigration experiments with SrCl2 using the modified electromigration device. The potential gradients over the rock sample were 75.47 V/m, 113.21 V/m and 150.94 V/m, respectively. The original concentration of SrCl2 in the source chamber was 0.03 M and the concentration of Sr2+ in the recipient chamber was followed for about 3 days. The breakthrough curves as a function of experimental time recorded by potentiostat are shown in Figure 5.
First, the traditional ideal plug-flow model was applied to analyze the experimental results by drawing a linear regression line with the last several data points where a pseudo steady state seemed to be established (Figure 5). The breakthrough time for Sr2+ ions migrating through the rock sample and the concentration change rate of the Sr2+ ions in the recipient chamber can be evaluated from the intercept and the slope of the linear regression line, as given in Table 3. The results show that the effective diffusion coefficients evaluated from the ideal plug-flow model (Equation (4)) for Sr2+ migrating through the rock sample is around 3.2 × 10⁻¹³ m2/s (the average value under three different voltage gradients). Compared with the reported De values of Sr2+ migrating through a crystalline granite rock sample traditionally used through diffusion experiments, the De values obtained by the electromigration method are quite reasonable. For example, Yamaguchi et al. (1993) [40] reported the De values of Sr2+ to be (0.32–1.7) × 10−13 m2/s in an Inada granite sample with a similar porosity (0.68±0.03%) using 0.1 M KCl as the background electrolyte. However, the evaluation of Kd using Equation (5) gave nearly zero or negative values, which may indicate that the migration speed for Sr2+ ions was too quick and that the sorption process was not completed during the experimental process or that the ideal plug-flow may give results with large errors because of some unrealistic assumptions.
The numerical solution of the advection-dispersion model in the Laplace domain (Equation (7)) can be easily achieved by the De Hoog algorithm [31]. The De and Kd values as well as other parameters, the effective dispersion coefficient, and formation factor, , which can be deduced from the advection-dispersion model are listed in Table 4. The De values calculated by the advection-dispersion model are in agreement with the De values calculated by the ideal plug-flow model (average 2.86 × 10⁻¹³ m2/s), especially for the results when 2V voltage was applied. The similarity can also be shown by Figure 5, where the comparison of the two models is depicted. However, the advection-dispersion model is believed to be a more accurate modeling method because it avoids the use of many unrealistic assumptions associated with the ideal plug-flow model. In addition, the advection-dispersion model takes into account the effect of dispersion, which plays a non-negligible role in the ionic transport through the rock sample. For example, the breakthrough curve shows a clear curvature at the moment around the breakthrough time and this signifies the effect of the dispersion. The ideal plug-flow model can only use a small portion of the experimental data when a pseudo-steady state is established. However, sometimes it is difficult to define such a pseudo-steady state. The Kd values calculated from the advection-dispersion model vary from the magnitude of 10−7 m3/kg to 10−5 m3/kg. The large distribution of the modeling results may indicate that the sorption process was not completed due to the great acceleration of the migration speed. Taking into account the experimental time (within 80 h), this conclusion is reasonable since the typical equilibration time in batch sorption experiments is one or two weeks.
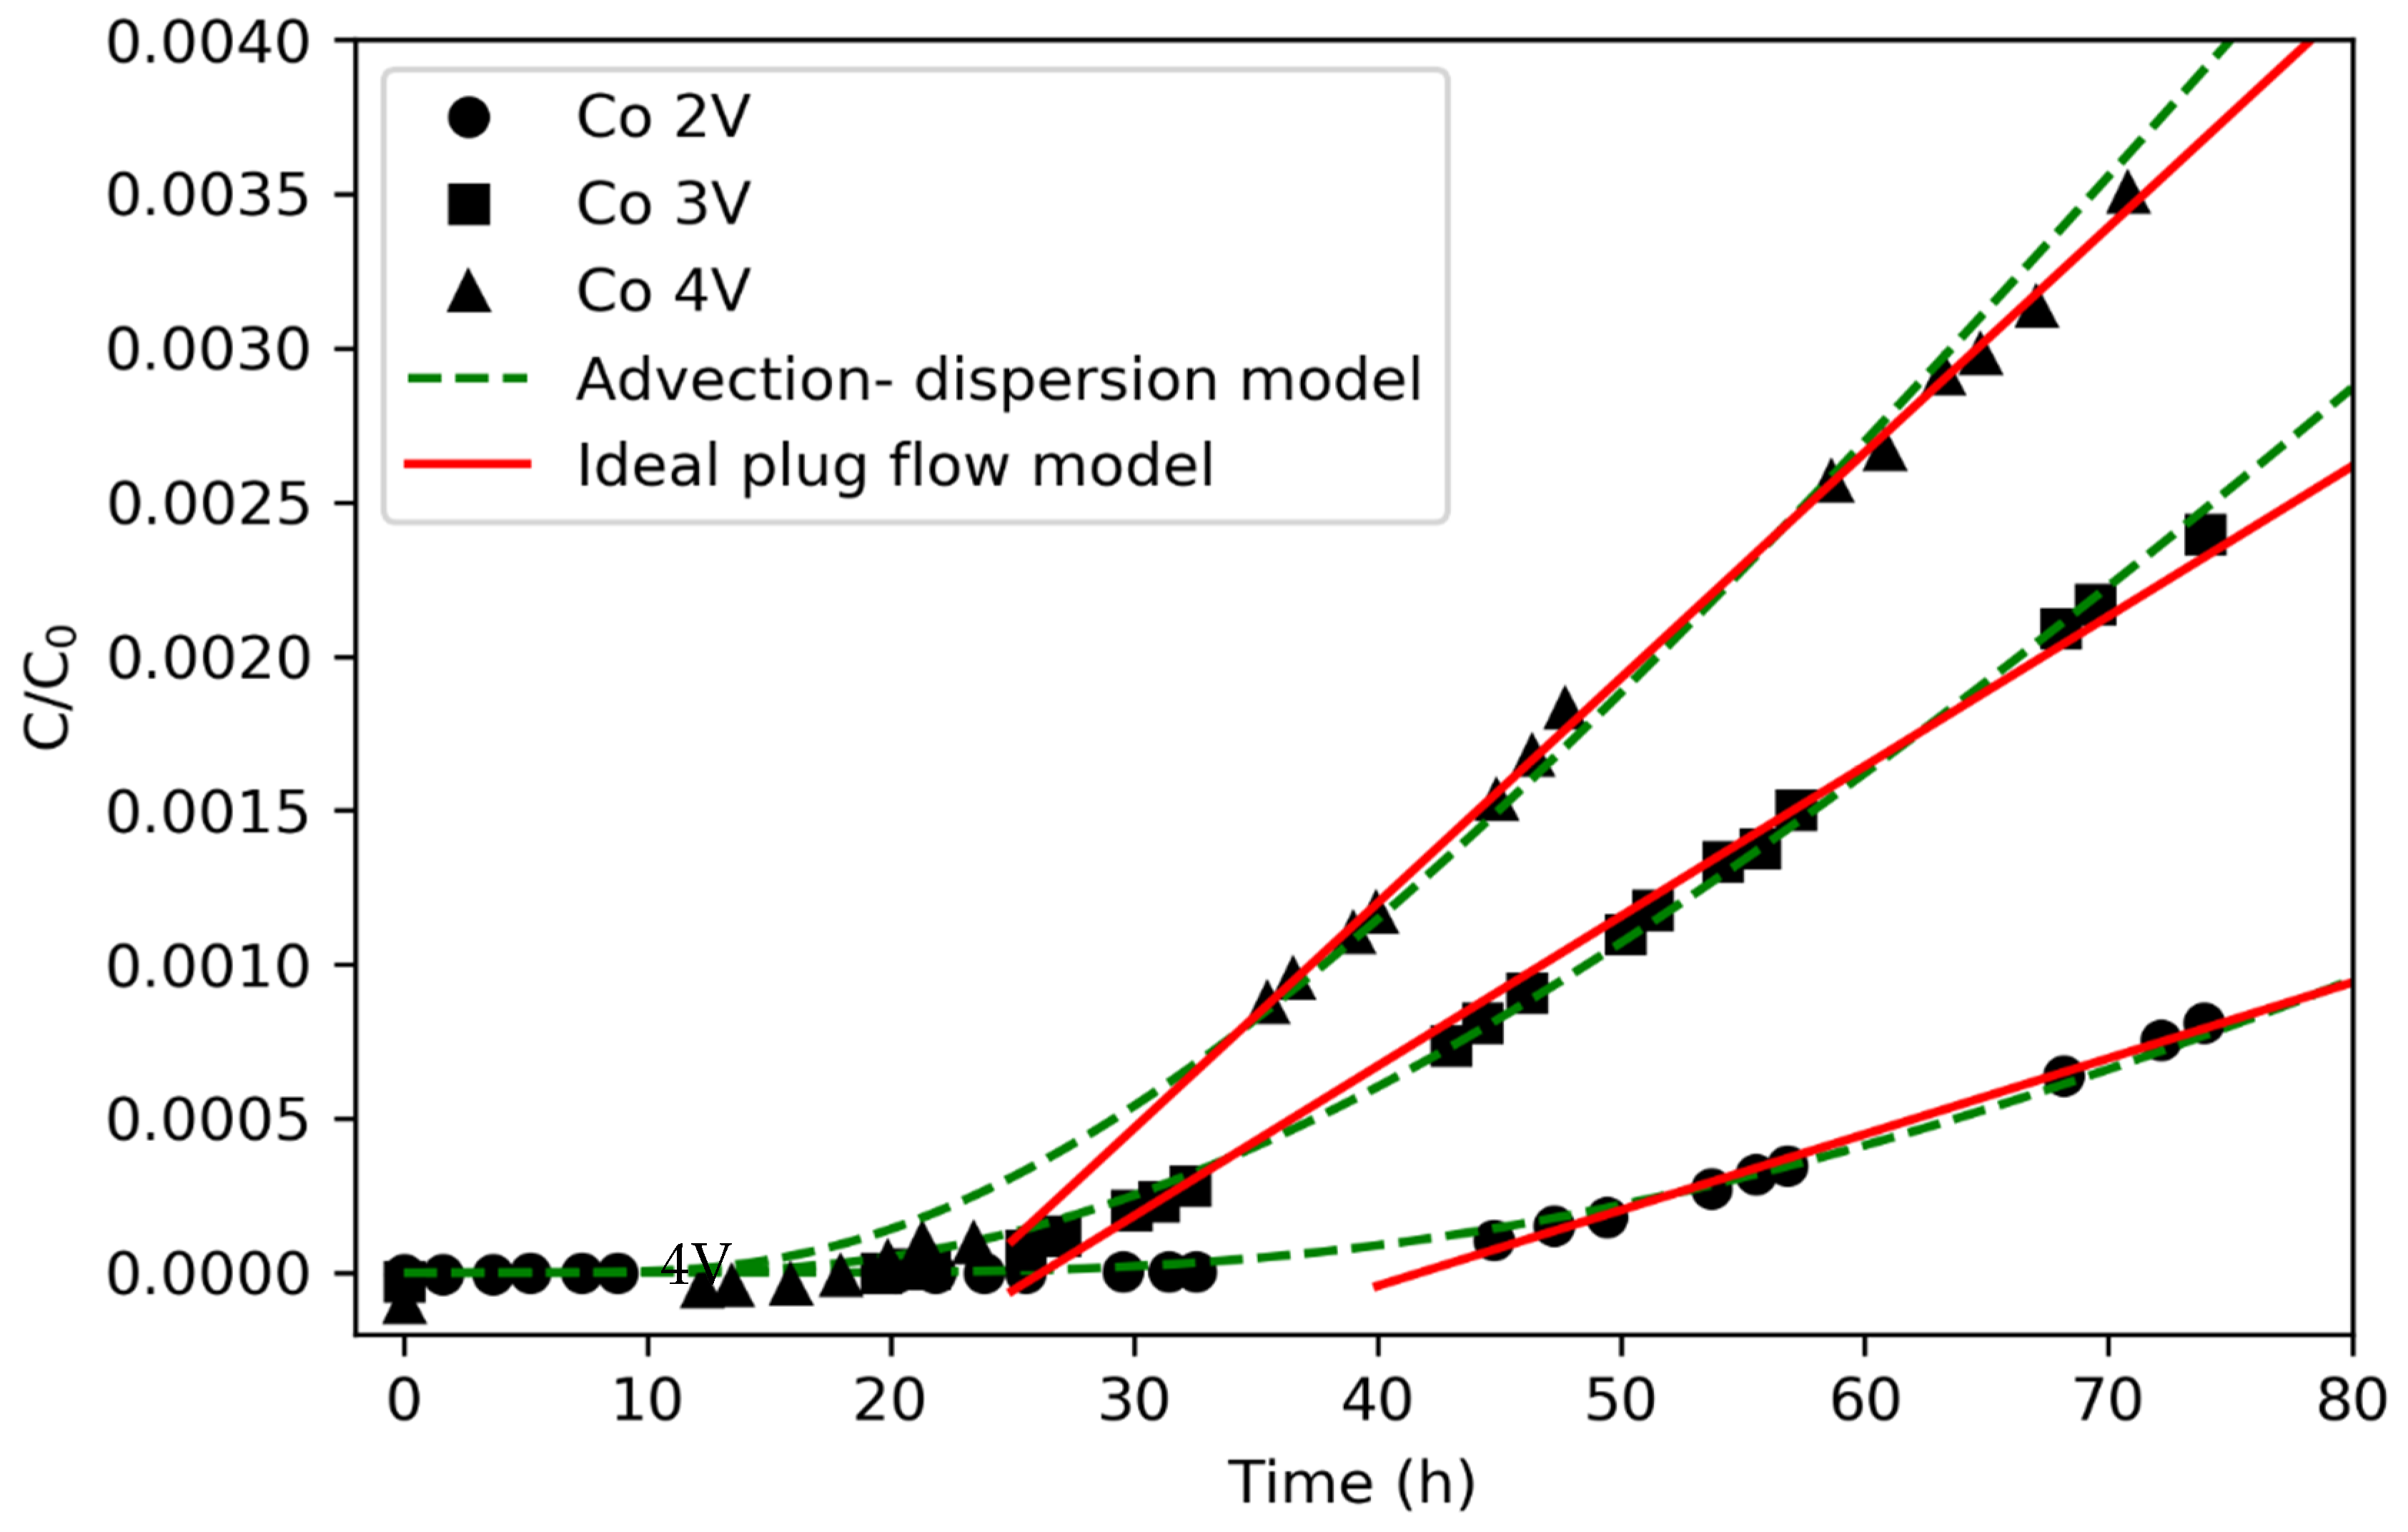
3.3. Electromigration Results with CoCl2
The migration behavior of Co2+ ions was tested with the same rock sample under the same experimental conditions. The original concentration of CoCl2 in the source chamber was 0.033 M. The breakthrough curves as a function of experimental time recorded by the potentiostat are shown in Figure 6. The breakthrough time and the slope data deduced from the linear regression line as well as the De values calculated from Equations (4) and (5) are given in Table 5. The modeling results with the advection-dispersion model are shown in Table 6. The average De value by the advection-dispersion model is 1.35 × 10⁻¹³ m2/s, which is quite similar to the results from the ideal plug-flow model. The results show that the average effective diffusion coefficient of Co2+ ions is 1.23 × 10⁻¹³ m2/s, which is about one-third or half of the diffusion coefficient of Sr2+. In dilute aqueous solutions, the diffusion coefficient for Co2+ is 7.32 × 10⁻¹⁰ m2/s while the diffusion coefficient for Sr2+ is 7.91 × 10⁻¹⁰ m2/s [41]. The much smaller diffusion coefficient for Co2+ was obtained from the electromigration experiments and may indicate that sorption plays an important role when we compare the diffusion coefficients of Co2+ and Sr2+ ions in the rock samples. Our idea is supported by the former observations that Co2+ has a different sorption mechanism than both Sr2+ and Cs+ ions [42,43,44]. Previous studies show that, on the same fracture filling materials of granite, the Kd values of Co2+ is one and a half orders of magnitude higher than that of Sr2+ [42]. The sorption mechanism of Sr2+ on crystalline rock was concluded to be ion exchange [45,46,47]. The much stronger Co2+ sorption indicated that complexation reactions between Co2+ and surface sites have formed. Ebner et al. [48] also compared the sorption behaviors of Cs, Sr and Co ions on magnetite; it shows that the sorption of these three ions on magnetite follows the sequence of Co2+ > Sr2+ > Cs+. Thus, the smaller diffusion coefficient of Co2+ than Sr2+ observed from the electromigration results can be explained by the different sorption mechanisms of these two ions.
3.4. Electromigration Results with CsCl
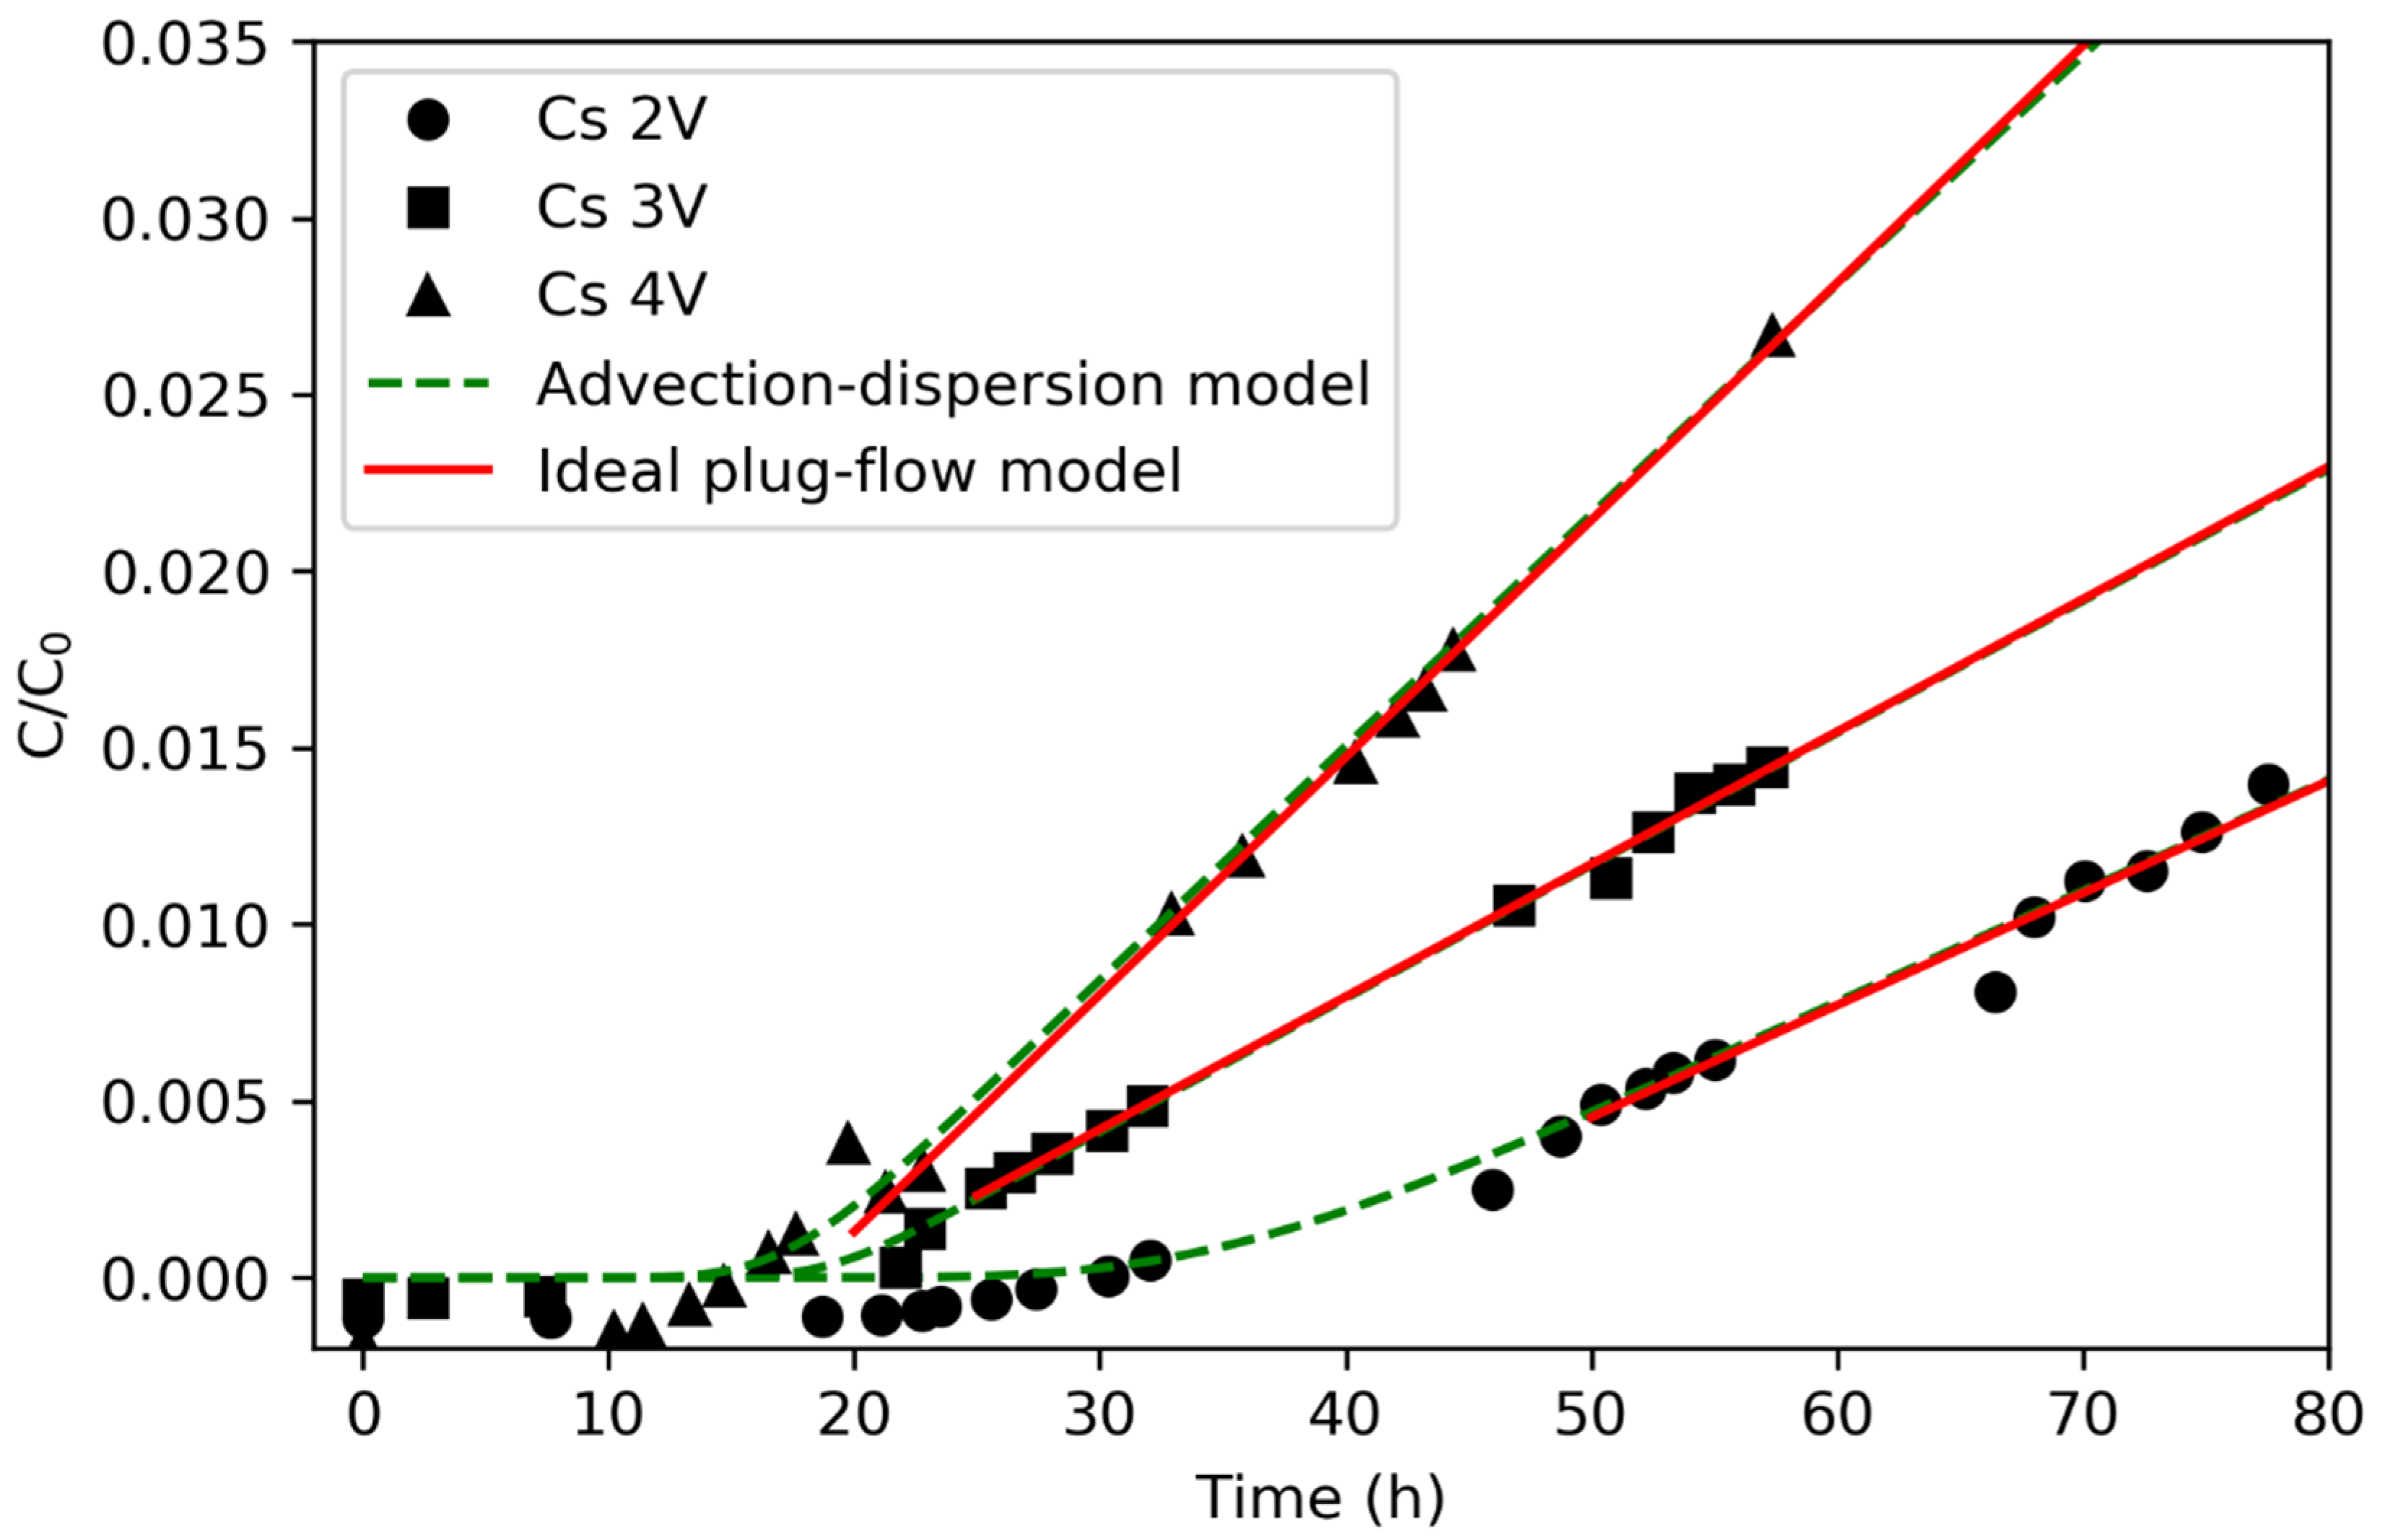
The third kind of cation tested was Cs+ which has +1 charge compared with Sr2+ and Co2+, the charges of which are +2. The original concentration in the recipient chamber was 0.1 M in order to maintain the same ionic strength as the tested Sr2+ and Co2+ experiments. The experimental results as well as the modeling data from the ideal plug-flow model and the advection-dispersion model are shown in Figure 7. The modelled De and Kd values as well as other parameters from these two models are summarized in Table 7 and Table 8. Both the ideal plug-flow model and the advection-dispersion model give almost the same De values. The average De value from the ideal plug-flow model is 2.25 × 10⁻¹² m2/s and the average De value calculated by the advection-dispersion model is 2.26 × 10⁻¹² m2/s. The value is about 8 times larger than the modelled De value for Sr2+ diffusion and 18 times larger than the modelled De value for Co2+ diffusion. It is quite reasonable that the diffusion of Cs+ is much quicker than the diffusion of Sr2+ and Co2+ ions. The diffusion coefficient of Cs+ in diluted water is 2.056 × 10⁻⁹ m2/s which is much larger than the diffusion coefficient of both Sr2+ and Co2+ ions (0.791 m2/s and 0.732 m2/s, respectively).
3.5. Factors Affecting Kd Evaluations
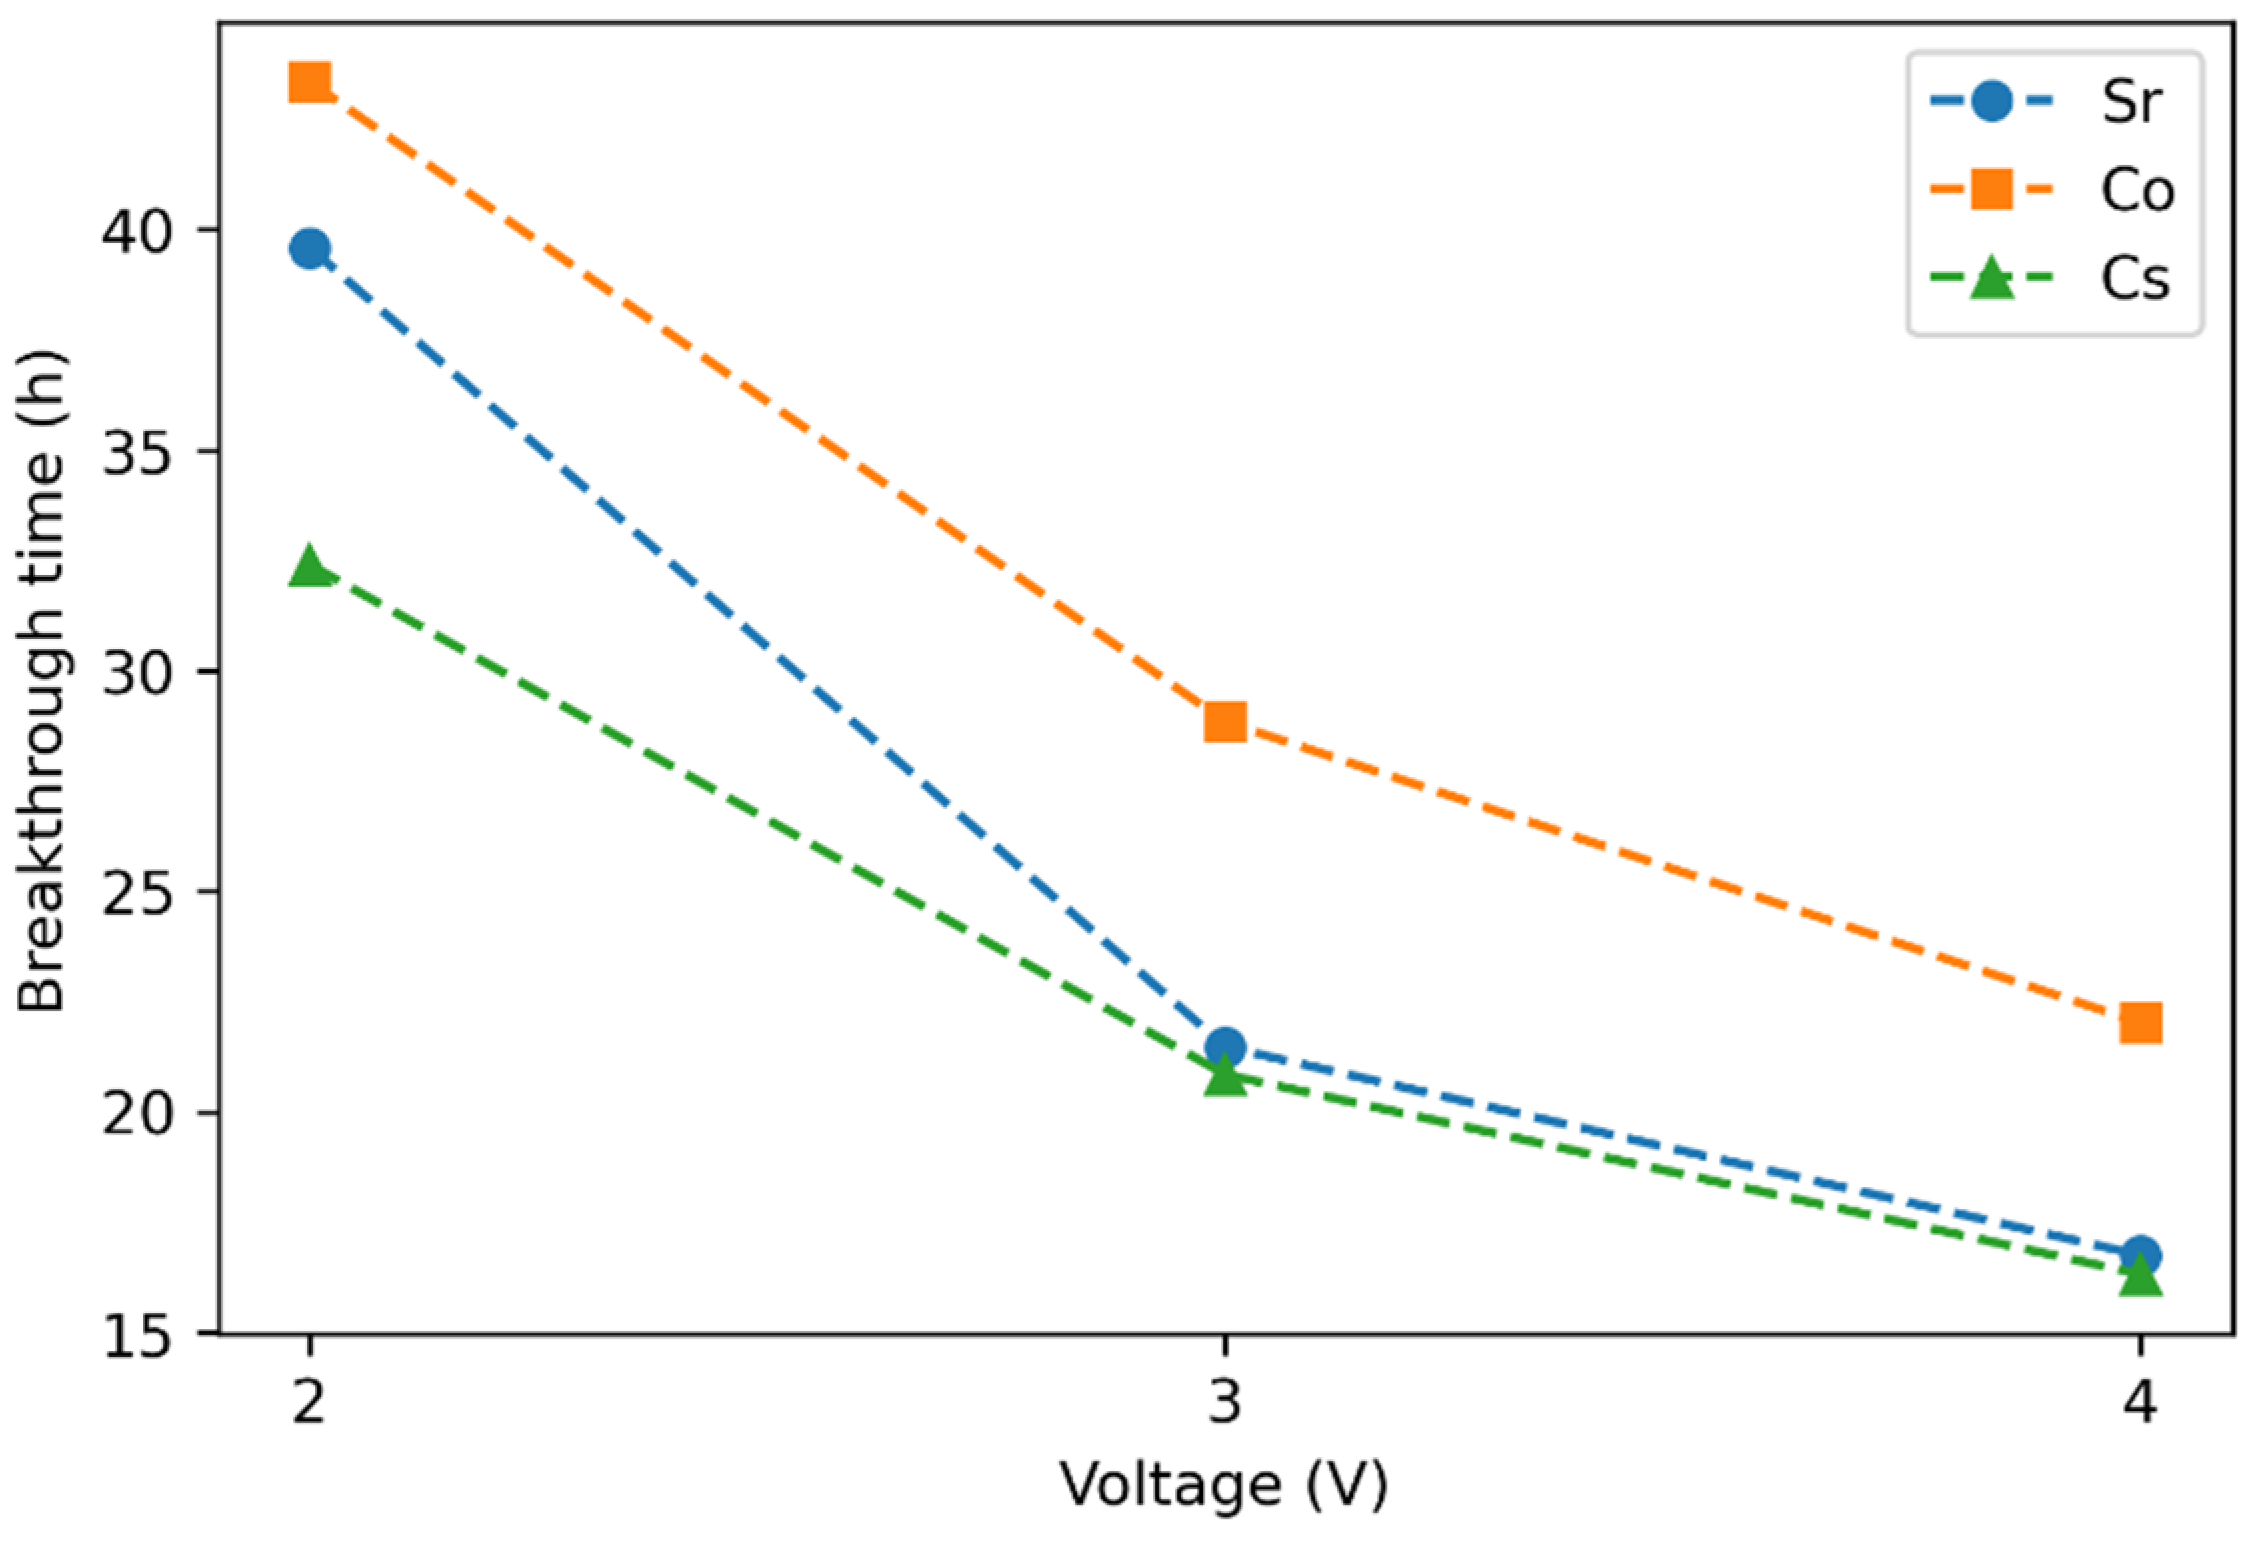
The Kd values calculated from the advection-dispersion model in this work were in the range of 10−7–10−5 m3/kg for Sr2+ and 10−6–10−5 m3/kg for Co2+. For Cs+, the model predicted Kd values to be in the magnitude of 10−6 m3/kg. Puukko et al. [49] determined the sorption of Cs and Sr on intact crystalline rock samples with a two-chamber electromigration device and the sorption time was long enough to assure equilibrium. They determined the Kd values for Cs and Sr to be between (0.12–26.2) × 10−3 m3/kg and (1.4–13.3) × 10−3 m3/kg, respectively. The Kd values of Sr were (3-4) × 10−4 m3/kg from the in-situ experiments performed in Onkalo in the REPRO project in biotite rick veined gneiss rock [41]. In-situ experiments performed with Sr in Olkiluoto bedrock (biotite rick veined gneiss) measured the Kd values to be (3-4) × 10−4 m3/kg [50]. The Kd values of Cs+ were measured to be between 10−3 to 10−2 m3/kg in the in-situ experiments performed at the Grimsel Test Site [7]. Compared with the former work and in-situ experimental results, the Kd values obtained in this work were 2 magnitudes smaller. The main reason was attributed to the high voltage applied in this work. As shown in Figure 8, the breakthrough time measured at 2V was larger than the linear trend of the breakthrough time measured at 3V and 4V. This indicates that the accelerated migration speed causes incompletion of the sorption process, thus adding considerable error to the experimental results. The sorption mechanisms of these three tracers may also differ from each other. Previous studies show that Cs can form a ternary complex with the surface sites, and Sr sorption is dependent on solution pH, while Co sorption is independent of pH in Na2CO3 solutions [51]. Because of the complex sorption mechanisms, sufficient sorption time should be provided to obtain accurate sorption data. The breakthrough time was under 30 h for all the tracers when the voltage applied over the rock sample were above 2V. Electromigration experiments with lower voltages could give more accurate Kd values. In addition, as shown in Figure 3 and discussed in Section 3.1, the heterogeneity of the pore structure of Grimsel granodiorite will further hinder the diffusion of the studied tracers into all of the small aperture pores. Thus, we can conclude that the sorption process was not in equilibrium under the experimental conditions. Therefore, the Kd results do not reflect the different sorption affinities of the tracers for all the minerals found in the samples.
To evaluate the sorption coefficients in a precise way, one needs to assure sufficient diffusion time to allow equilibrium in all pore surfaces. In addition, modeling methods that take into account the heterogeneity of the mineralogy and microstructure of the rock samples are also necessary. The modeling of the electromigration process is still a challenge since the transport mechanisms induced by the application of an external electric field are complex. Accurate modeling of the electromigration processes should consider the coupling effects of physical (fluid flow, solute transport), chemical (reactions in groundwater and surface) and electrostatic (Coulombic interactions between charged ions) processes and the application of the electric field. The advection-dispersion model applied in this work assumed that the rock sample was homogeneous. Recently, an NP-PhreeqcRM-EK simulator was developed based on Nernst-Planck-Poisson equations and on aqueous speciation reactions in pore water [52,53] to handle heterogeneities along diffusion paths. This simulator coupled COMSOL Multiphysics and PhreeqcRM to solve the fluid flow/solute transport behaviors and geochemical reactions, respectively. The mineralogical and structural heterogeneities can be integrated into this simulator, and this could provide us with a direction to solve the current problem of Kd measurements.
4. Conclusions and Outlook
In this work, the diffusion and sorption of three cationic tracers, Sr2+, Co2+ and Cs+ ions, were studied in Grimsel granodiorite with the modified electromigration device. Three voltages, 2V, 3V and 4V, were tested for these tracers. It was found that the modified electromigration device shown in this work can give stable and accurate experimental results for all the studied tracers. The rock structure was characterized with C-14-PMMA autoradiography and SEM/EDS to obtain information on the porosity and mineralogical distributions.
In the centimeter scale of Grimsel granodiorite rock, the interconnected matrix porosity forms a well-connected network for diffusion. This was studied by C-14-PMMA autoradiography and electron microscopy. Micrometer-scale fissures are transecting biotite and chlorite minerals, indicating the possibility of sorption of the studied cations. The De values derived from the ideal plug-flow model for Sr2+, Co2+ and Cs+ ions are 3.20 × 10⁻¹³ m2/s, 1.23 × 10⁻¹³ m2/s and 2.25 × 10⁻¹² m2/s, respectively. Similar De values were derived from the advection-dispersion model, 2.86 × 10⁻¹³ m2/s, 1.35 × 10⁻¹³ m2/s and 2.26 × 10⁻¹² m2/s, respectively. The diffusion speed for the tracers is in the sequence of Cs+ > Sr2+ > Co2+, which is in the same sequence of the diffusion speed in diluted water. The Kd modeling results show that sorption is not completed during the experimental period, and this conclusion was also proved by the comparison of the breakthrough time of all three tracers under different voltage gradients. It is therefore likely that the sorption affinities and therefore the mineral composition of the sample material played only a minor role in these results. Since all of the tracers have rather low and differing distribution coefficients, it is possible that the tracers did not see all of the porosity in the sample, especially the smaller aperture pores. This small aperture porosity also tends to be the intragranular porosity and the porosity found in altered phases, which often account for much of the sorption. Perhaps by increasing the diffusion time, a plateau could be achieved where the sorption is completed but the experimental time is shortened compared to traditional diffusion experiments. In the future, the sorption process during electromigration experiments could be characterized using radioactive tracers. In such cases, after the electromigration experiment is completed, the samples could be sawed and spatial distribution of sorbed tracers studied with autoradiographic techniques. This would allow for the sorption characteristics to be directly correlated with different mineral phases of intact rock.
More questions were exposed during the experimental processes and studies should be performed to give a better understanding of the electromigration technique. The explanation of the current data, which relates to the ionic distribution of ions inside the rock sample, was not clear at this moment. Studies such as slice-sawing and performing autoradiography to obtain a diffusion profile may give a better understanding of the current data. In addition, a reactive transport model that takes into account the interactions between different tracer ions and background electrolytes and sorption on mineral surfaces is also helpful to give a deeper insight into the electromigration process. The experimental results from this work are not quite successful for sorption studies because of the too high acceleration of the migration speed. More voltages, especially at lower voltage conditions, should be studied to illustrate the effect of voltages. Other influencing factors, such as ionic strength, are also crucial to the understanding of the electromigration process. More studies are needed to justify the application of the electromigration technique as an ordinary method in diffusion and sorption studies under nuclear waste disposal conditions.
Author Contributions
Conceptualization, X.L., L.L. and M.S.-K.; methodology, X.L., J.S. and S.M.; software, X.L. and S.M.; validation, X.L. and M.S.-K.; formal analysis, X.L., J.S., S.M.; resources, L.L. and A.M.; writing—original draft preparation, L.L.; writing—review and editing, J.S. and M.S.-K.; visualization, X.L.; supervision, M.S.-K. and L.L.; project administration, M.S.-K. and L.L.; funding acquisition, M.S.-K. and L.L. All authors have read and agreed to the published version of the manuscript.
Funding
The research was funded by European Union’s Horizon 2020 research and innovation program, grant agreement No. 847593. The APC was funded by the University of Helsinki. Open access funding provided by the University of Helsinki.
Acknowledgments
The project leading to this work has received funding from the European Union’s Horizon 2020 research and innovation program under grant agreement No. 847593.
Conflicts of Interest
The authors declare no conflict of interest.
References
- Oy, P. Safety Case Plan for the Operating Licence Application; Posiva Report 2017-02; Posiva: Eurajoki, Finland, 2017; p. 164. [Google Scholar]
- Oy, P. Safety Case for the Disposal of Spent Nuclear Fuel at Olkiluoto—Models and Data for the Repository System 2012. Parts 1 and 2; Posiva Report 2013-1; Posiva: Eurajoki, Finland, 2013; p. 828. [Google Scholar]
- Möri, A.; Mazurek, M.; Ota, K.; Siitari-Kauppi, M.; Eichinger, F.; Leuenberger, M. Quantifying the Porosity of Crystalline Rocks by In Situ and Laboratory Injection Methods. Minerals 2021, 11, 1072. [Google Scholar] [CrossRef]
- Muuri, E.; Matara-aho, M.; Puhakka, E.; Ikonen, J.; Martin, A.; Koskinen, L.; Siitari-Kauppi, M. The sorption and diffusion of 133Ba in crushed and intact granitic rocks from the Olkiluoto and Grimsel in-situ test sites. Appl. Geochem. 2018, 89, 138–149. [Google Scholar] [CrossRef] [Green Version]
- Schild, M.; Siegesmund, S.; Vollbrecht, A.; Mazurek, M. Characterization of granite matrix porosity and pore-space geometry by in situ and laboratory methods. Geophys. J. Int. 2001, 146, 111–125. [Google Scholar] [CrossRef] [Green Version]
- Ikonen, J.; Voutilainen, M.; Söderlund, M.; Jokelainen, L.; Siitari-Kauppi, M.; Martin, A. Sorption and diffusion of selenium oxyanions in granitic rock. J. Contam. Hydrol. 2016, 192, 203–211. [Google Scholar] [CrossRef] [PubMed]
- Soler, J.M.; Landa, J.; Havlova, V.; Tachi, Y.; Ebina, T.; Sardini, P.; Siitari-Kauppi, M.; Eikenberg, J.; Martin, A.J. Comparative modeling of an in situ diffusion experiment in granite at the Grimsel Test Site. J. Contam. Hydrol. 2015, 179, 89–101. [Google Scholar] [CrossRef] [PubMed]
- Jakob, A. Matrix Diffusion for Performance Assessment—Experimental Evidence, Modelling Assumptions and Open Issues; Report NTB—04-07; IAEA: Wettingen, Switzerland, 2004; p. 87. [Google Scholar]
- Hellmuth, K.-H.; Klobes, P.; Meyer, K.; Röhl-Kuhn, B.; Siitari-Kauppi, M.; Hartikainen, J.; Hartikainen, K.; Timonen, J. Matrix retardation studies: Size and structure of the accessable pore space in fresh and altered crystalline rock. Z. Für Geol. Wiss. 1995, 23, 691–706. [Google Scholar]
- Hellmuth, K.-H.; Lukkarinen, S.; Siitari-kauppi, M. Rock Matrix Studies with Carbon-14-Polymethylmethacrylate (PMMA); Method Development and Applications. Isot. Isot. Environ. Health Stud. 1994, 30, 47–60. [Google Scholar] [CrossRef]
- Hellmuth, K.-H.; Shtari-Kauppi, M.; Lindberg, A. Applications of the Carbon-14-Polymethylmethacrylate (PMMA) Impregnation Method in Studies on Porosity and Matrix Diffusion. MRS Online Proc. Libr. (OPL) 1991, 257, 649–656. [Google Scholar] [CrossRef]
- Sardini, P.; Siitari-Kauppi, M.; Beaufort, D.; Hellmuth, K.-H. On the connected porosity of mineral aggregates in crystalline rocks. Am. Mineral. 2006, 91, 1069–1080. [Google Scholar] [CrossRef]
- Sammaljärvi, J.; Lindberg, A.; Voutilainen, M.; Ikonen, J.; Siitari-Kauppi, M.; Pitkänen, P.; Koskinen, L. Multi-scale study of the mineral porosity of veined gneiss and pegmatitic granite from Olkiluoto, Western Finland. J. Radioanal. Nucl. Chem. 2017, 314, 1557–1575. [Google Scholar] [CrossRef]
- Voutilainen, M.; Miettinen, A.; Sardini, P.; Parkkonen, J.; Sammaljärvi, J.; Gylling, B.; Selroos, J.-O.; Yli-Kaila, M.; Koskinen, L.; Siitari-Kauppi, M. Characterization of spatial porosity and mineral distribution of crystalline rock using X-ray micro computed tomography, C-14-PMMA autoradiography and scanning electron microscopy. Appl. Geochem. 2019, 101, 50–61. [Google Scholar] [CrossRef]
- André, M.; Malmström, M.E.; Neretnieks, I. Determination of sorption properties of intact rock samples: New methods based on electromigration. J. Contam. Hydrol. 2009, 103, 71–81. [Google Scholar] [CrossRef] [PubMed]
- Maes, N.; Moors, H.; Dierckx, A.; De Cannière, P.; Put, M. The assessment of electromigration as a new technique to study diffusion of radionuclides in clayey soils. J. Contam. Hydrol. 1999, 36, 231–247. [Google Scholar] [CrossRef]
- Maes, N.; Moors, H.; Wang, L.; Delècaut, G.; De Cannière, P.; Put, M. The use of electromigration as a qualitative technique to study the migration behaviour and speciation of uranium in the Boom Clay. Radiochim. Acta 2002, 90, 741–746. [Google Scholar] [CrossRef]
- Beauwens, T.; De Cannière, P.; Moors, H.; Wang, L.; Maes, N. Studying the migration behaviour of selenate in Boom Clay by electromigration. Eng. Geol. 2005, 77, 285–293. [Google Scholar] [CrossRef]
- Li, X.; Meng, S.; Puhakka, E.; Ikonen, J.; Liu, L.; Siitari-Kauppi, M. A modification of the electromigration device and modelling methods for diffusion and sorption studies of radionuclides in intact crystalline rocks. J. Contam. Hydrol. 2020, 231, 103585. [Google Scholar] [CrossRef]
- Löfgren, M.; Neretnieks, I. Through-electromigration: A new method of investigating pore connectivity and obtaining formation factors. J. Contam. Hydrol. 2006, 87, 237–252. [Google Scholar] [CrossRef]
- Löfgren, M.; Vecernik, P.; Havlova, V. Studying the Influence of Pore Water Electrical Conductivity on the Formation Factor, As Estimated Based on Electrical Methods; SKB Report R-09-57; SKB: Stockholm, Sweden, 2009; p. 84. [Google Scholar]
- Ikonen, J.; Sardini, P.; Jokelainen, L.; Siitari-Kauppi, M.; Martin, A.; Eikenberg, J. The tritiated water and iodine migration in situ in Grimsel granodiorite. Part I: Determination of the diffusion profiles. J. Radioanal. Nucl. Chem. 2016, 310, 1041–1048. [Google Scholar] [CrossRef]
- Kuva, J.; Sammaljärvi, J.; Parkkonen, J.; Siitari-Kauppi, M.; Lehtonen, M.; Turpeinen, T.; Timonen, J.; Voutilainen, M. Imaging connected porosity of crystalline rock by contrast agent-aided X-ray microtomography and scanning electron microscopy. J. Microsc. 2018, 270, 98–109. [Google Scholar] [CrossRef] [Green Version]
- Sammaljärvi, J.; Jokelainen, L.; Ikonen, J.; Siitari-Kauppi, M. Free radical polymerisation of MMA with thermal initiator in brick and Grimsel granodiorite. Eng. Geol. 2012, 135–136, 52–59. [Google Scholar] [CrossRef]
- Hellmuth, K.-H.; Siitari-Kauppi, M.; Klobes, P.; Meyer, K.; Goebbels, J. Imaging and analyzing rock porosity by autoradiography and Hg-porosimetry/X-ray computertomography—Applications. Phys. Chem. Earth Part A: Solid Earth Geod. 1999, 24, 569–573. [Google Scholar] [CrossRef]
- Delayre, C.; Sammaljärvi, J.; Billon, S.; Muuri, E.; Sardini, P.; Siitari-Kauppi, M. Comparison of phosphor screen autoradiography and micro-pattern gas detector based autoradiography for the porosity of altered rocks. Sci. Rep. 2020, 10, 9455. [Google Scholar] [CrossRef]
- Kelokaski, M.; Siitari-Kauppi, M.; Sardini, P.; Möri, A.; Hellmuth, K.H. Characterisation of pore space geometry by 14C-PMMA impregnation—development work for in situ studies. J. Geochem. Explor. 2006, 90, 45–52. [Google Scholar] [CrossRef]
- CH Instruments. Model 600E Series Electrochemical Analyzer/Workstation User Manual. 2014. Available online: http://www.chinstr.com/filedownload/2304 (accessed on 19 December 2021).
- Meng, S.; Li, X.; Siitari-Kauppi, M.; Liu, L. Development and application of an advection-dispersion model for data analysis of electromigration experiments with intact rock cores. J. Contam. Hydrol. 2020, 231, 103618. [Google Scholar] [CrossRef]
- Atkins, P.; Paula, J.D. Atkins’ Physical Chemistry, 9th ed.; OUP: Oxford, UK, 2010. [Google Scholar]
- de Hoog, F.R.; Knight, J.H.; Stokes, A.N. An Improved Method for Numerical Inversion of Laplace Transforms. SIAM J. Sci. Stat. Comput. 1982, 3, 357–366. [Google Scholar] [CrossRef]
- Möri, A.; Mazurek, M.; Adler, M.; Schild, M.; Siegesmund, S.; Vollbrecht, A.; Ota, K.; Ando, T.; Alexander, W.R.; Smith, P.A.; et al. Grimsel Test Site Investigation Phase IV (1994–1996) the Nagra-JNC in situ Study of Safety Relevant Radionuclide Retardation in Fractured Crystalline Rock IV: The in Situ Study of Matrix Porosity in the Vicinity of a Water Conducting Fracture; Nagra Technical Report 00-08; Nagra: Wettingen, Switzerland, 2003; p. 115. [Google Scholar]
- Voutilainen, M.; Kekäläinen, P.; Siitari-Kauppi, M.; Sardini, P.; Muuri, E.; Timonen, J.; Martin, A. Modeling Transport of Cesium in Grimsel Granodiorite with Micrometer Scale Heterogeneities and Dynamic Update of Kd. Water Resour. Res. 2017, 53, 9245–9265. [Google Scholar] [CrossRef] [Green Version]
- Lehto, J.; Puukko, E.; Lindberg, A.; Voutilainen, M. Batch sorption experiments of cesium and strontium on crushed rock and biotite for the estimation of distribution coefficients on intact crystalline rock. Heliyon 2019, 5, e02296. [Google Scholar] [CrossRef] [Green Version]
- Carbol, P.; Engkvist, I. Compilation of Radionuclide Sorption Coefficients for Performance Assessment; SKB Report R-97-13; SKB: Stockholm, Sweden, 1997; p. 77. [Google Scholar]
- Kyllönen, J.; Hakanen, M.; Lindberg, A.; Harjula, R.; Vehkamäki, M.; Lehto, J. Modeling of cesium sorption on biotite using cation exchange selectivity coefficients. Radiochim. Acta 2014, 102, 919–929. [Google Scholar] [CrossRef]
- Söderlund, M.; Ervanne, H.; Muuri, E.; Lehto, J. Sorption of Alkaline Earth Metals on Biotite of Olkiluoto Beckrock; Posiva Report 2017-41; Posiva: Eurajoki, Finland, 2018; p. 66. [Google Scholar]
- Tachi, Y.; Ebina, T.; Takeda, C.; Saito, T.; Takahashi, H.; Ohuchi, Y.; Martin, A.J. Matrix diffusion and sorption of Cs+, Na+, I– and HTO in granodiorite: Laboratory-scale results and their extrapolation to the in situ condition. J. Contam. Hydrol. 2015, 179, 10–24. [Google Scholar] [CrossRef]
- Yang, X.; Ge, X.; He, J.; Wang, C.; Qi, L.; Wang, X.; Liu, C. Effects of Mineral Compositions on Matrix Diffusion and Sorption of 75 Se(IV) in Granite. Environ. Sci. Technol. 2018, 52, 1320–1329. [Google Scholar] [CrossRef]
- Yamaguchi, T.; SAKAMOTO, Y.; SENOO, M. Consideration on Effective Diffusivity of Strontium in Granite. J. Nucl. Sci. Technol. 1993, 30, 796–803. [Google Scholar] [CrossRef]
- CRC Press. CRC Handbook of Chemistry and Physics, 99th ed.; CRC Press: Boca Raton, FL, USA, 2018. [Google Scholar]
- Cui, D.; Eriksen, T.E. On the Sorption of Co and Cs on Stripa Granite Fracture-Filling Material. Radiochim. Acta. 1997, 79, 29–36. [Google Scholar] [CrossRef]
- Park, C.K.; Woo, S.I.; Tanaka, T.; Kamiyama, H. Sorption and Desorption Behavior of60Co,85Sr, and137Cs in a Porous Tuff. J. Nucl. Sci. Technol. 1992, 29, 1184–1193. [Google Scholar] [CrossRef]
- Muurinen, A.; Rantanen, J.; Penttilä-Hiltunen, P. Diffusion Mechanisms of Strontium, Cesium and Cobalt in Compacted Sodium Bentonite. MRS Proc. 1985, 50, 617–624. [Google Scholar] [CrossRef]
- Cui, D.; Eriksen, T.E. Experimental Study of Strontium Sorption on Fissure Filling Material; SKB Report 94-27; SKB: Stockholm, Sweden, 1994; p. 32. [Google Scholar]
- Cho, Y.; Komarneni, S. Cation exchange equilibria of cesium and strontium with K-depleted biotite and muscovite. Appl. Clay Sci. 2009, 44, 15–20. [Google Scholar] [CrossRef]
- Liu, C.; Zachara, J.M.; Smith, S.C. A cation exchange model to describe Cs+ sorption at high ionic strength in subsurface sediments at Hanford site, USA. J. Contam. Hydrol. 2004, 68, 217–238. [Google Scholar] [CrossRef] [Green Version]
- Ebner, A.D.; Ritter, J.A.; Navratil, J.D. Adsorption of Cesium, Strontium, and Cobalt Ions on Magnetite and a Magnetite−Silica Composite. Ind. Eng. Chem. Res. 2001, 40, 1615–1623. [Google Scholar] [CrossRef]
- Puukko, E.; Lehto, J.; Lindberg, A.; Voutilainen, M. Electromigration experiments for studying transport parameters and sorption of cesium and strontium on intact crystalline rock. J. Contam. Hydrol. 2018, 217, 1–7. [Google Scholar] [CrossRef]
- Poteri, A.; Andersson, P.; Nilsson, K.; Byegård, J.; Skålberg, M.; Siitari-Kauppi, M.; Helariutta, K.; Kekäläinen, M.V.P. The Second Matrix Diffusion Experiment in the Water Phase of the Repro Project: WPDE 2; Posiva Report 2017-24; Posiva: Eurajoki, Finland, 2018; p. 152. [Google Scholar]
- Fujikawa, Y.; Fukui, M. Radionuclide Sorption to Rocks and Minerals: Effects of pH and Inorganic Anions. Part 1. Sorption of Cesium, Cobalt, Strontium and Manganese. Radiochim. Acta. 1997, 76, 153–162. [Google Scholar] [CrossRef]
- Rolle, M.; Albrecht, M.; Sprocati, R. Impact of solute charge and diffusion coefficient on electromigration and mixing in porous media. J. Contam. Hydrol. 2022, 244, 103933. [Google Scholar] [CrossRef]
- Sprocati, R.; Masi, M.; Muniruzzaman, M.; Rolle, M. Modeling electrokinetic transport and biogeochemical reactions in porous media: A multidimensional Nernst–Planck–Poisson approach with PHREEQC coupling. Adv. Water Resour. 2019, 127, 134–147. [Google Scholar] [CrossRef]
Figure 1.
Left: Grimsel granodiorite rock core that was sealed in a cylinder for the electromigration device (Left). The same sample was impregnated with C-14-PMMA for autoradiography. Right: The sample sawing procedures and the surfaces for autoradiography and SEM/EDS analysis.
Figure 1.
Left: Grimsel granodiorite rock core that was sealed in a cylinder for the electromigration device (Left). The same sample was impregnated with C-14-PMMA for autoradiography. Right: The sample sawing procedures and the surfaces for autoradiography and SEM/EDS analysis.

Figure 2.
Schematic figure of the electromigration device run with Grimsel granodiorite. A potentiostat was introduced in the modified device to improve the stability of the whole system.
Figure 2.
Schematic figure of the electromigration device run with Grimsel granodiorite. A potentiostat was introduced in the modified device to improve the stability of the whole system.

Figure 3.
(Left): Surface scan of the autoradiography sample. (Center): Corresponding autoradiograph. (Right): Corresponding porosity map. The diffusion direction in the electromigration experiment was from left to right.
Figure 3.
(Left): Surface scan of the autoradiography sample. (Center): Corresponding autoradiograph. (Right): Corresponding porosity map. The diffusion direction in the electromigration experiment was from left to right.

Figure 4.
SEM results. (a): Plagioclase and feldspar grains, and chlorite grains. (b): Biotite lamellae and quartz grains. (c): Quartz grains, Potassium feldspar grains, Biotite and chlorite lamellae. (d) Plagioclase and feldspar grains. Biotite and muscovite lamellae. Legend: Bt: Biotite, Chl: Chlorite, Kfs: Potassium feldspar, Ms: Muscovite, Plg: Plagioclase, Qz: Quartz, Ttn: Titanite.

Figure 5.
The concentrations of Sr followed in the recipient chamber as a function of time with 0.03 M SrCl2 in the source chamber. The voltage over the rock sample were 2V, 3V and 4V, respectively.
Figure 5.
The concentrations of Sr followed in the recipient chamber as a function of time with 0.03 M SrCl2 in the source chamber. The voltage over the rock sample were 2V, 3V and 4V, respectively.

Figure 6.
The concentration of Co2+ ions followed in the recipient chamber as a function of experimental time in the electromigration experiments.
Figure 6.
The concentration of Co2+ ions followed in the recipient chamber as a function of experimental time in the electromigration experiments.

Figure 7.
The concentration of Cs+ ions followed in the recipient chamber as a function of experimental time in the electromigration experiments.
Figure 7.
The concentration of Cs+ ions followed in the recipient chamber as a function of experimental time in the electromigration experiments.

Figure 8.
Comparison of breakthrough time for Sr, Cs and Co under different tested voltages.


Table 1.
Mineralogy analysis of Grimsel granodiorite by using the XRD (wt.%) and polarizing microscopy (point-counting by 500 points, vol.%) performed in the Geological Survey of Finland.
Table 1.
Mineralogy analysis of Grimsel granodiorite by using the XRD (wt.%) and polarizing microscopy (point-counting by 500 points, vol.%) performed in the Geological Survey of Finland.
| Minerals | XRD (wt.%) | Thin Section Analysis (vol.%) |
|---|---|---|
| Plagioclase | 40 | 36.5 |
| K-feldspar | 25 | 17.2 |
| Quartz | 20 | 32.8 |
| biotite | 10 | 6.4 |
| Muscovite + sericite | --- | 2.1 |
| Epidote | --- | 1.1 |
| Amphibole | --- | 3.2 |
| chlorite | 5 | 0.3 |
Table 2.
The initial conditions of the electromigration experiments. “×” means no additions.
| Tracer | Cs+ (M) | Sr2+ (M) | Co2+ (M) | Voltages Tested (V) | Background Electrolyte |
|---|---|---|---|---|---|
| CsCl | 0.1 | × | × | 2, 3, 4 | 0.2 M NaCl +2 mM NaHCO3 |
| SrCl2 | × | 0.033 | × | 2, 3, 4 | 0.2 M NaCl +2 mM NaHCO3 |
| CoCl2 | × | × | 0.033 | 2, 3, 4 | 0.2 M NaCl +2 mM NaHCO3 |
Table 3.
Electromigration modeling results with ideal plug-flow modeling of Sr2+ migrating through the rock sample.
Table 3.
Electromigration modeling results with ideal plug-flow modeling of Sr2+ migrating through the rock sample.
| Voltage (V) | Voltage Gradient (V/m) | Breakthrough Time (h) | Slope (mol/L/h) | De (m2/s) |
|---|---|---|---|---|
| 2 | 75.47 | 39.59 | 3.398 × 10⁻⁶ | 3.84 × 10⁻¹³ |
| 3 | 113.21 | 21.47 | 3.459 × 10⁻⁶ | 2.61 × 10⁻¹³ |
| 4 | 150.94 | 16.74 | 5.862 × 10⁻⁶ | 3.32 × 10⁻¹³ |
Table 4.
Parameter evaluation of the breakthrough curves of Sr2+ migrating through the rock sample using the advection-dispersion model.
Table 4.
Parameter evaluation of the breakthrough curves of Sr2+ migrating through the rock sample using the advection-dispersion model.
| Voltage (V) | De (m2/s) | Ff | Kd (m3/kg) | |
|---|---|---|---|---|
| 2 | 5.57 × 10⁻⁹ | 3.78 × 10⁻¹³ | 4.77 × 10⁻⁴ | 8.90 × 10⁻⁷ |
| 3 | 1.20 × 10⁻⁷ | 2.43 × 10⁻¹³ | 3.07 × 10⁻⁴ | 6.94 × 10⁻⁶ |
| 4 | 2.29 × 10⁻⁷ | 2.38 × 10⁻¹³ | 3.01 × 10⁻⁴ | 1.13 × 10⁻⁵ |
Table 5.
Electromigration experimental results with ideal plug-flow modeling of Co2+ migration through the rock sample.
Table 5.
Electromigration experimental results with ideal plug-flow modeling of Co2+ migration through the rock sample.
| Voltage (V) | Voltage Gradient (V/m) | Breakthrough Time (h) | Slope (mol/L/h) | De (m2/s) |
|---|---|---|---|---|
| 2 | 75.47 | 43.35 | 8.648 × 10⁻⁷ | 9.79 × 10⁻¹⁴ |
| 3 | 113.21 | 28.84 | 1.783 × 10⁻⁶ | 1.35 × 10⁻¹³ |
| 4 | 150.94 | 22.01 | 2.387 × 10⁻⁶ | 1.35 × 10⁻¹³ |
Table 6.
Parameter evaluation of the breakthrough curves of Co2+ migrating through the rock sample using the advection-dispersion model.
Table 6.
Parameter evaluation of the breakthrough curves of Co2+ migrating through the rock sample using the advection-dispersion model.
| Voltage (V) | De (m2/s) | Ff | Kd (m3/kg) | |
|---|---|---|---|---|
| 2 | 1.86 × 10⁻⁸ | 1.59 × 10⁻¹³ | 4.73 × 10⁻⁴ | 1.62 × 10⁻⁶ |
| 3 | 1.09 × 10⁻⁷ | 9.43 × 10⁻¹⁴ | 2.62 × 10⁻⁴ | 1.14 × 10⁻⁵ |
| 4 | 8.41 × 10⁻⁸ | 1.52 × 10⁻¹³ | 4.24 × 10⁻⁴ | 5.71 × 10⁻⁶ |
Table 7.
Electromigration experimental results with ideal plug-flow modeling of Cs+ migration through the rock sample.
Table 7.
Electromigration experimental results with ideal plug-flow modeling of Cs+ migration through the rock sample.
| Voltage (V) | Voltage Gradient (V/m) | Breakthrough Time (h) | Slope (mol/L/h) | De (m2/s) |
|---|---|---|---|---|
| 2 | 75.47 | 43.35 | 3.216 × 10⁻⁵ | 2.37 × 10⁻¹² |
| 3 | 113.21 | 28.84 | 4.178 × 10⁻⁵ | 1.87 × 10⁻¹² |
| 4 | 150.94 | 22.01 | 6.931 × 10⁻⁵ | 2.51 × 10⁻¹² |
Table 8.
Parameter evaluation of the breakthrough curves of Cs+ migrating through the rock sample using advection-dispersion model.
Table 8.
Parameter evaluation of the breakthrough curves of Cs+ migrating through the rock sample using advection-dispersion model.
| Voltage (V) | De (m2/s) | Ff | Kd (m3/kg) | |
|---|---|---|---|---|
| 2 | 1.52 × 10⁻⁸ | 2.38 × 10⁻¹² | 1.16 × 10⁻³ | 9.34 × 10⁻⁶ |
| 3 | 6.82 × 10⁻⁹ | 1.89 × 10⁻¹² | 9.21 × 10⁻³ | 4.51 × 10⁻⁶ |
| 4 | 2.25 × 10⁻⁸ | 2.50 × 10⁻¹² | 1.22 × 10⁻³ | 9.65 × 10⁻⁶ |
Publisher’s Note: MDPI stays neutral with regard to jurisdictional claims in published maps and institutional affiliations. |
© 2022 by the authors. Licensee MDPI, Basel, Switzerland. This article is an open access article distributed under the terms and conditions of the Creative Commons Attribution (CC BY) license (https://creativecommons.org/licenses/by/4.0/).
Share and Cite
MDPI and ACS Style
Li, X.; Sammaljärvi, J.; Meng, S.; Liu, L.; Siitari-Kauppi, M.; Martin, A. Diffusion and Sorption Studies of Cs, Sr and Co in Intact Crystalline Rock. Minerals 2022, 12, 231. https://0-doi-org.brum.beds.ac.uk/10.3390/min12020231
AMA Style
Li X, Sammaljärvi J, Meng S, Liu L, Siitari-Kauppi M, Martin A. Diffusion and Sorption Studies of Cs, Sr and Co in Intact Crystalline Rock. Minerals. 2022; 12(2):231. https://0-doi-org.brum.beds.ac.uk/10.3390/min12020231
Chicago/Turabian StyleLi, Xiaodong, Juuso Sammaljärvi, Shuo Meng, Longcheng Liu, Marja Siitari-Kauppi, and Andrew Martin. 2022. "Diffusion and Sorption Studies of Cs, Sr and Co in Intact Crystalline Rock" Minerals 12, no. 2: 231. https://0-doi-org.brum.beds.ac.uk/10.3390/min12020231
Note that from the first issue of 2016, this journal uses article numbers instead of page numbers. See further details here.