
Ranges of Physical Parameters and Geochemical Features of Mineralizing Fluids at Porphyry Deposits of Various Types of the Cu−Mo−Au System: Evidence from Fluid Inclusions Data


Abstract
:1. Introduction
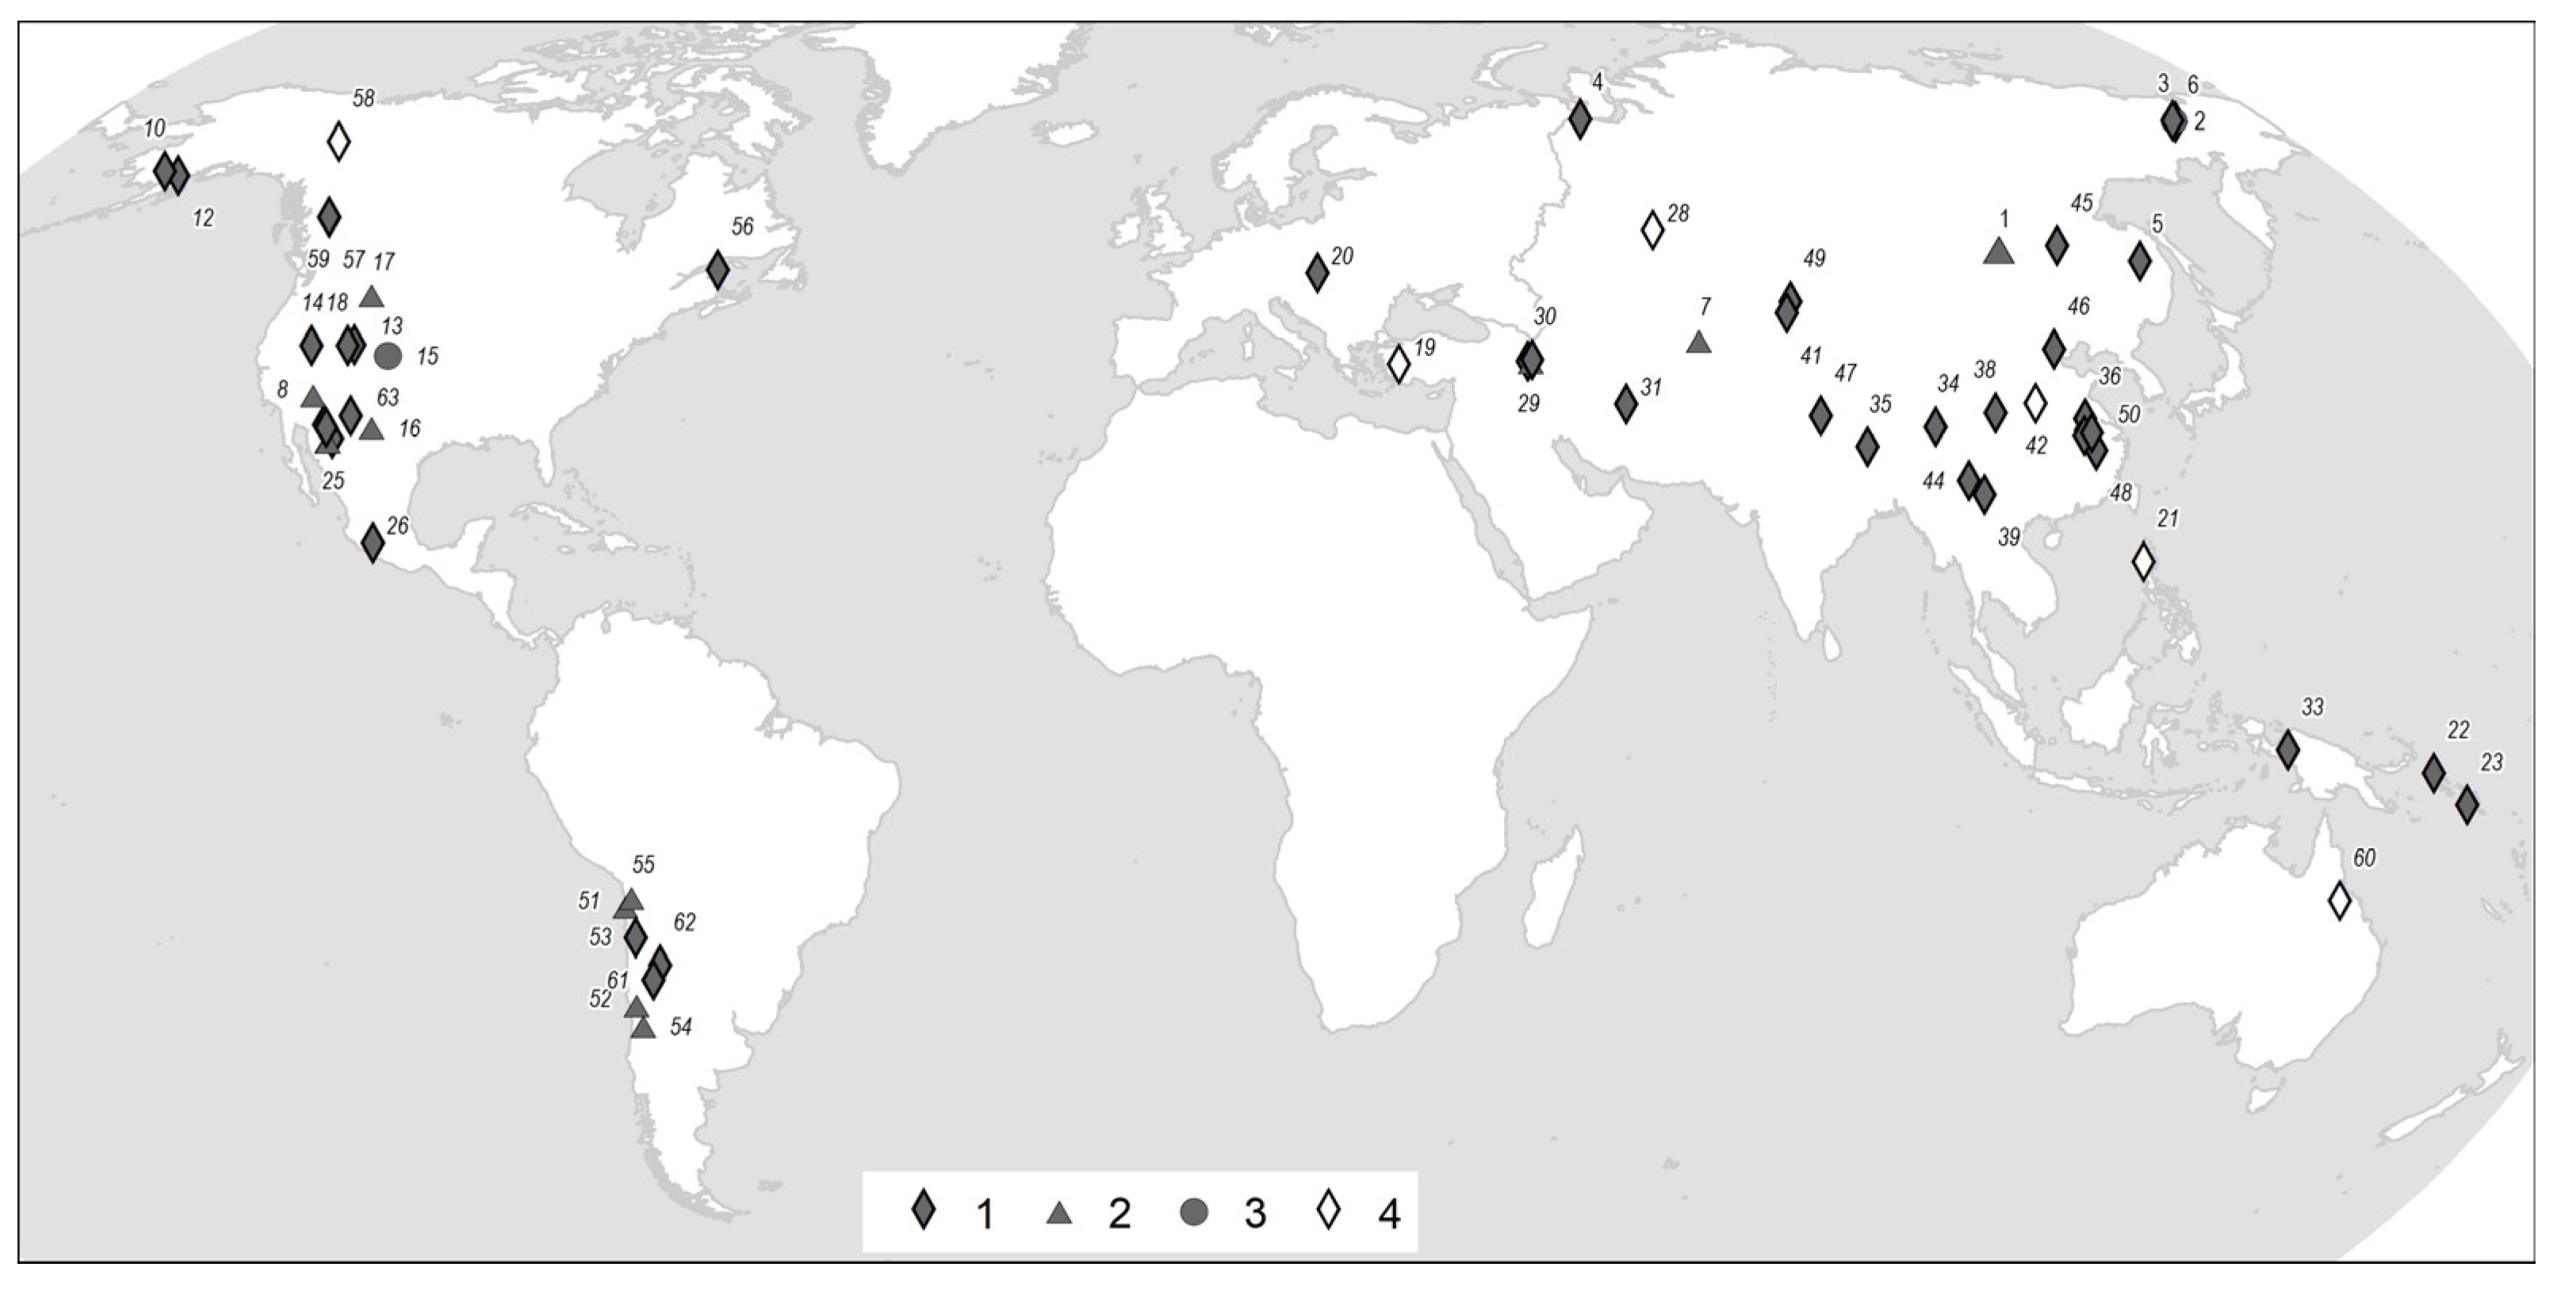
2. Overview of Deposits Discussed in This Publication
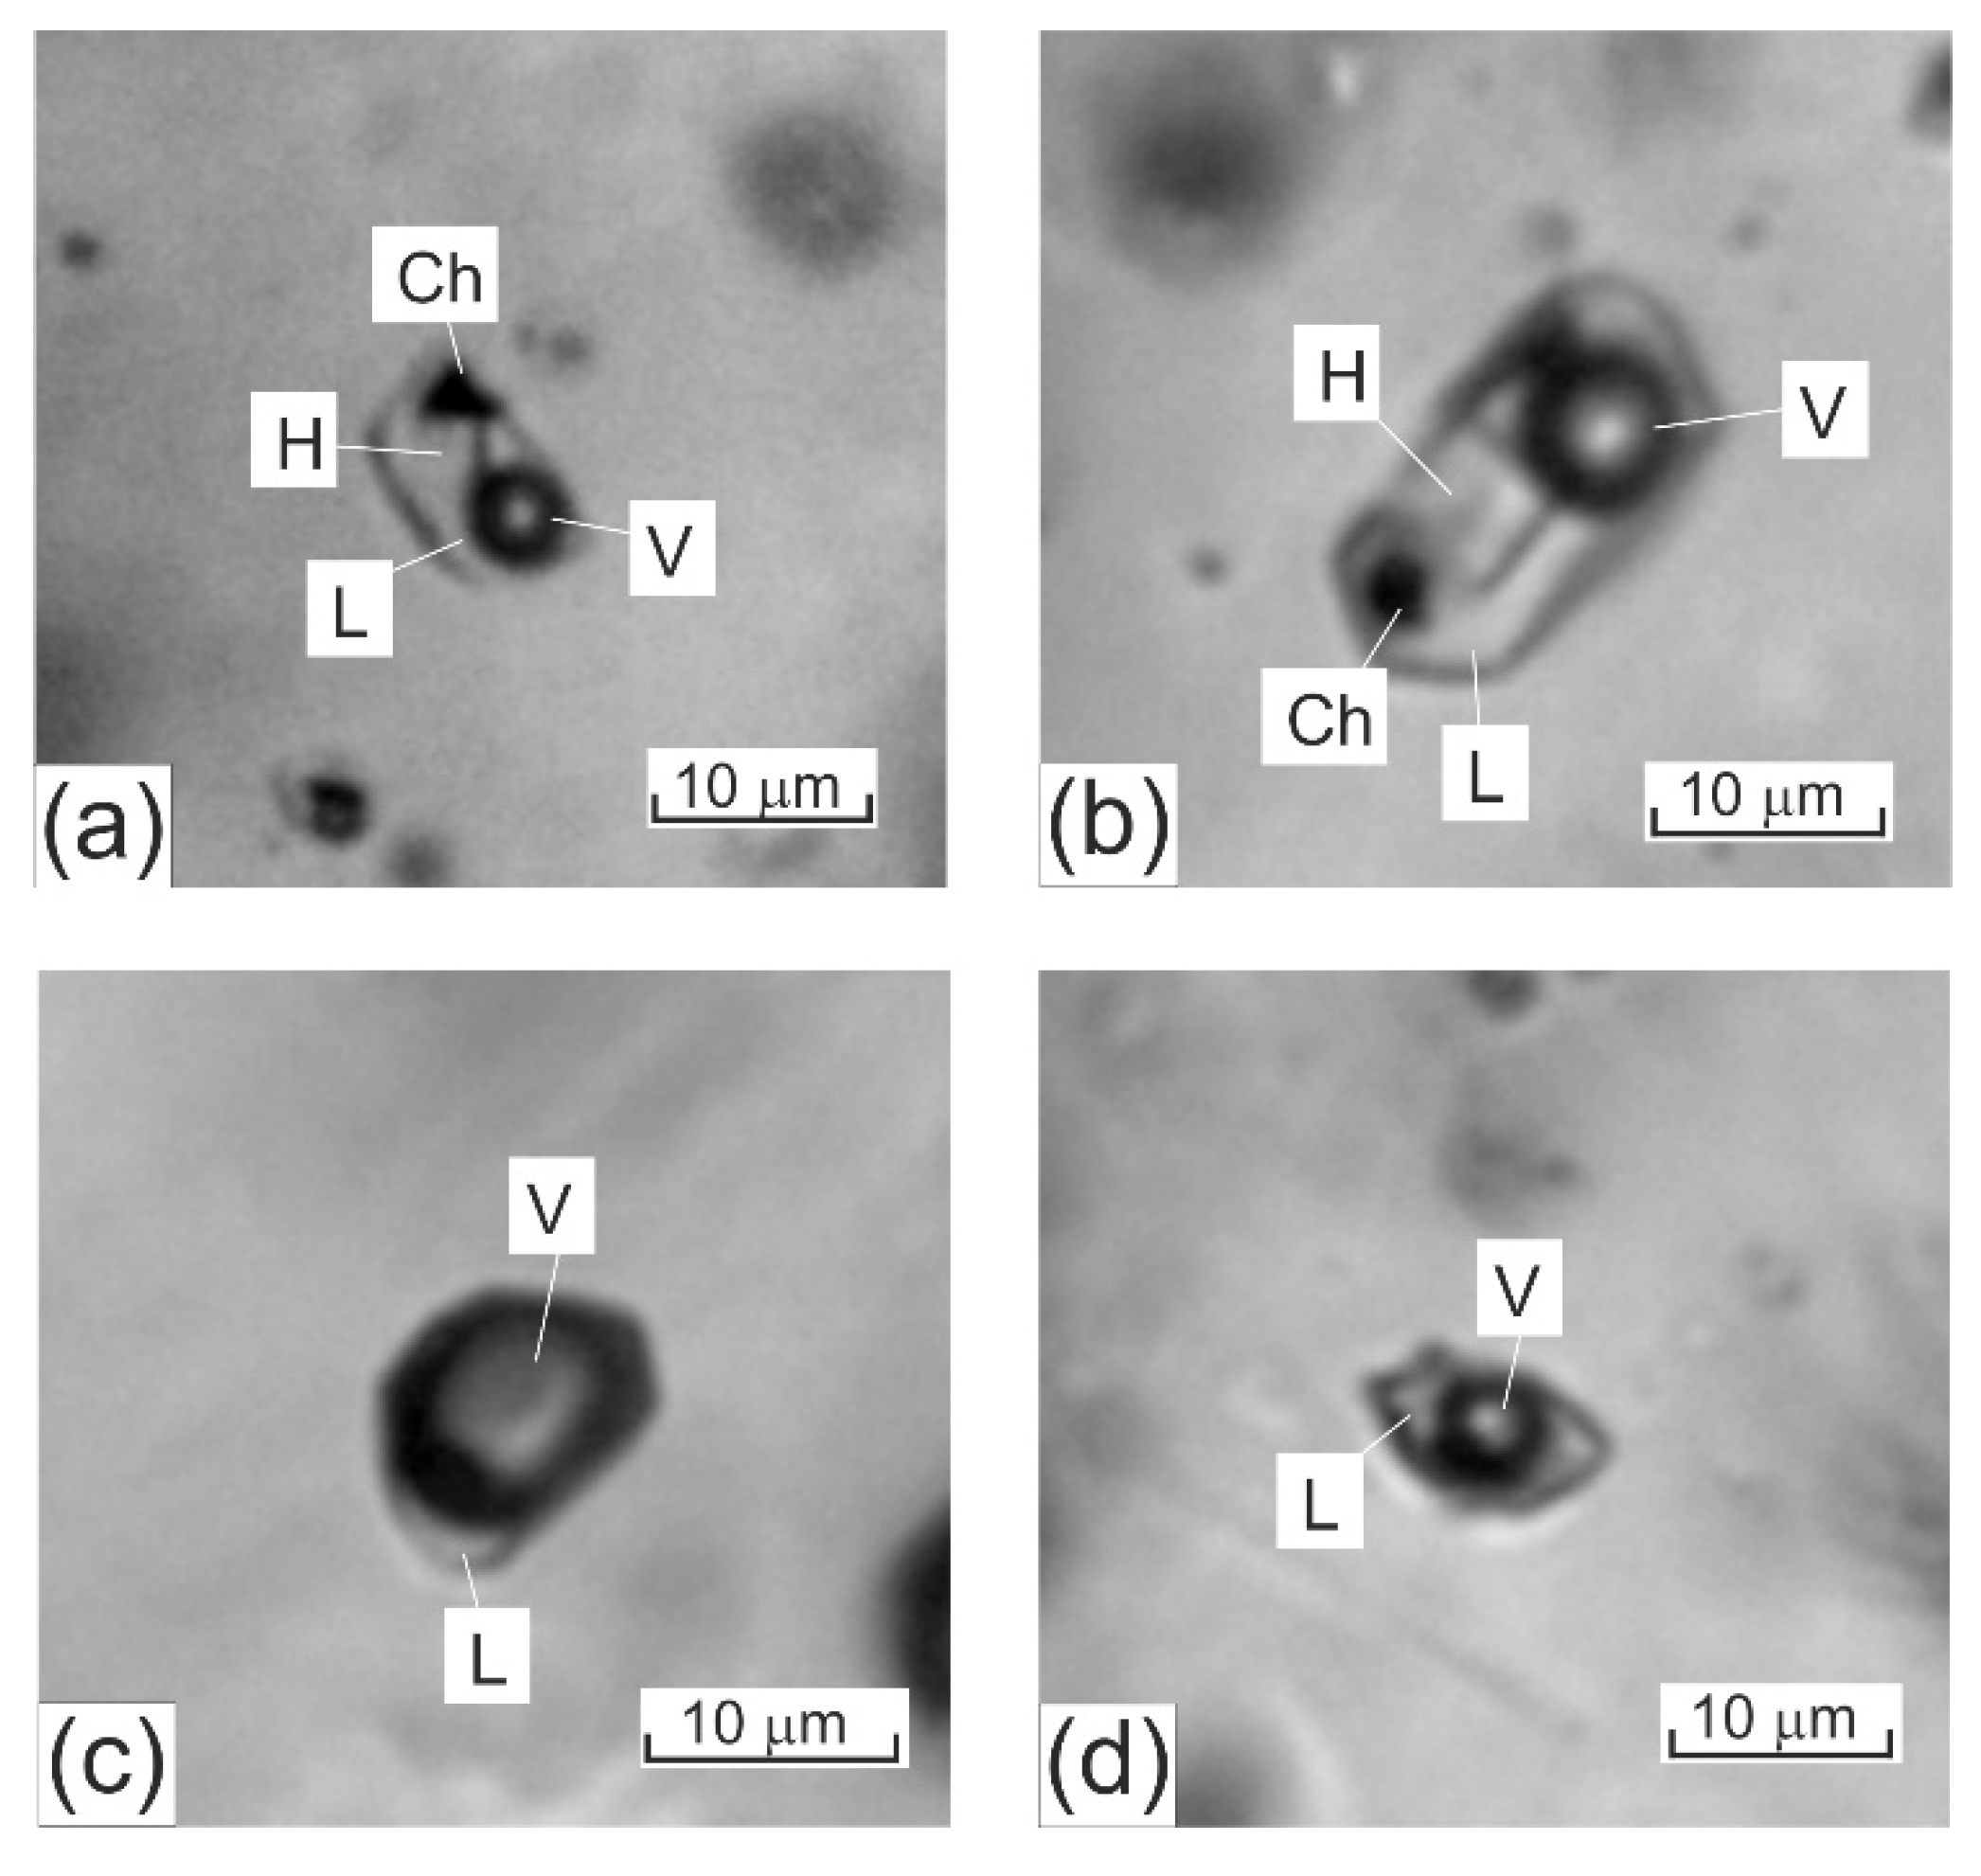
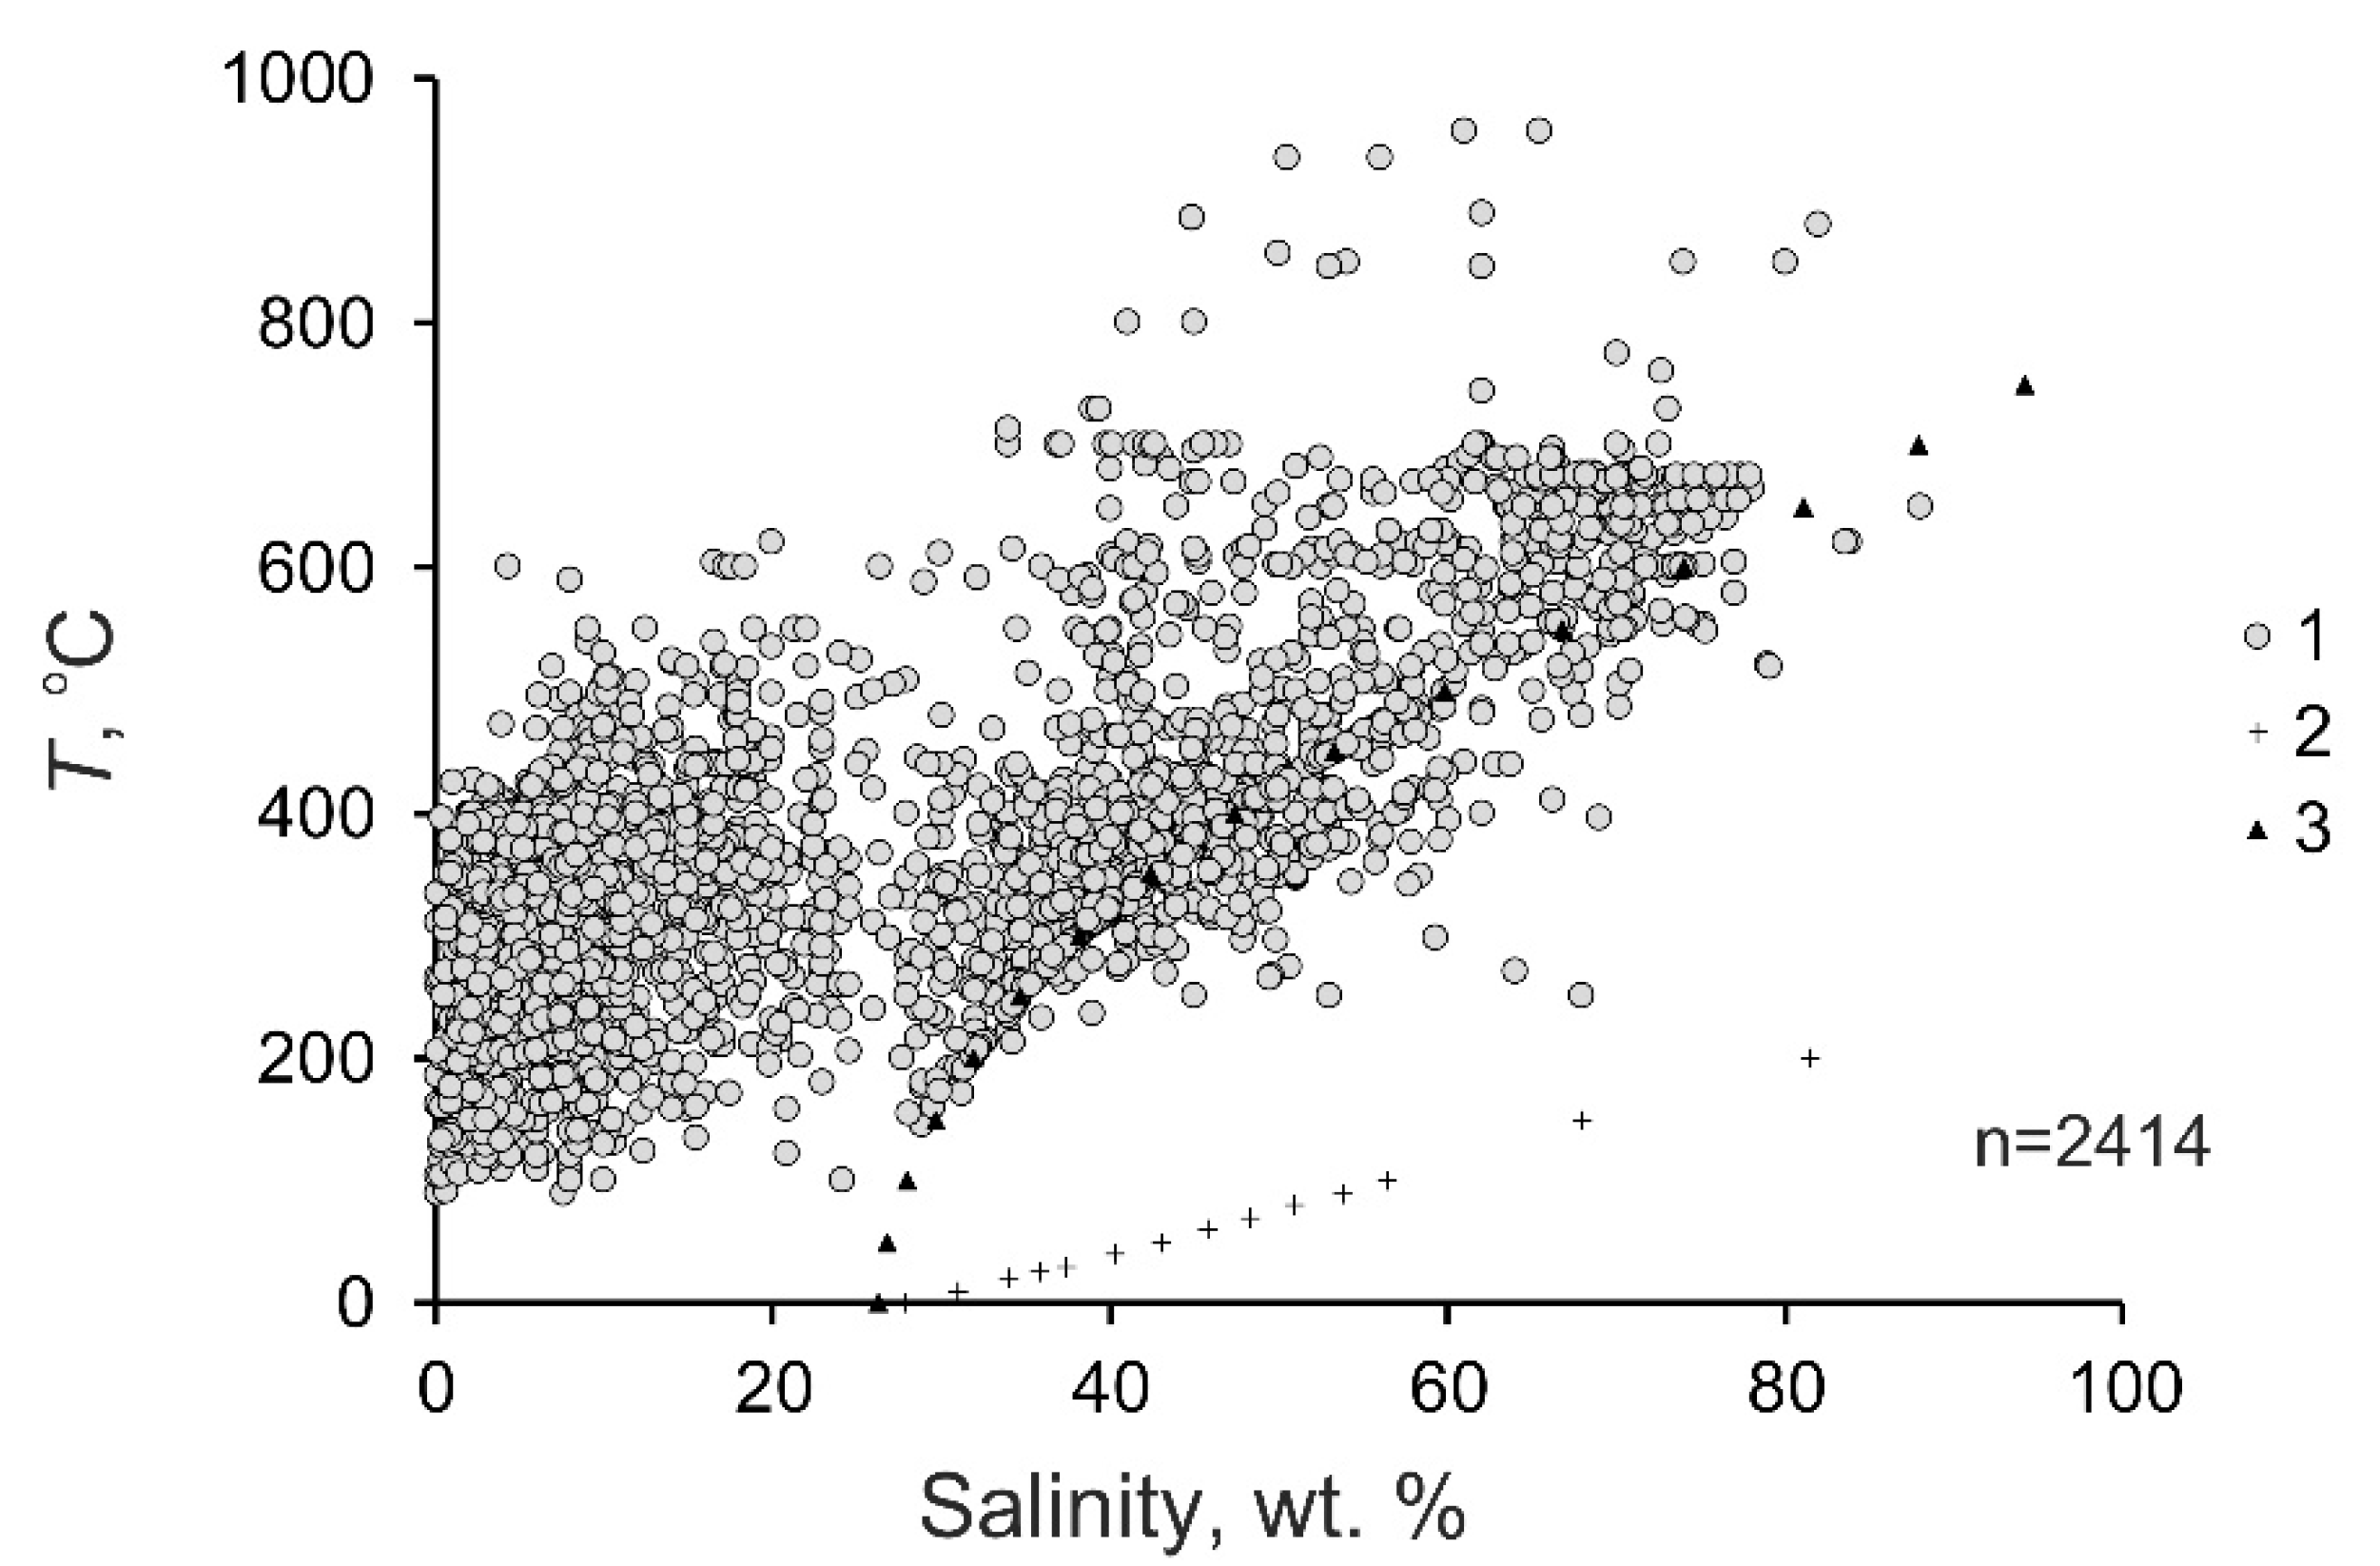
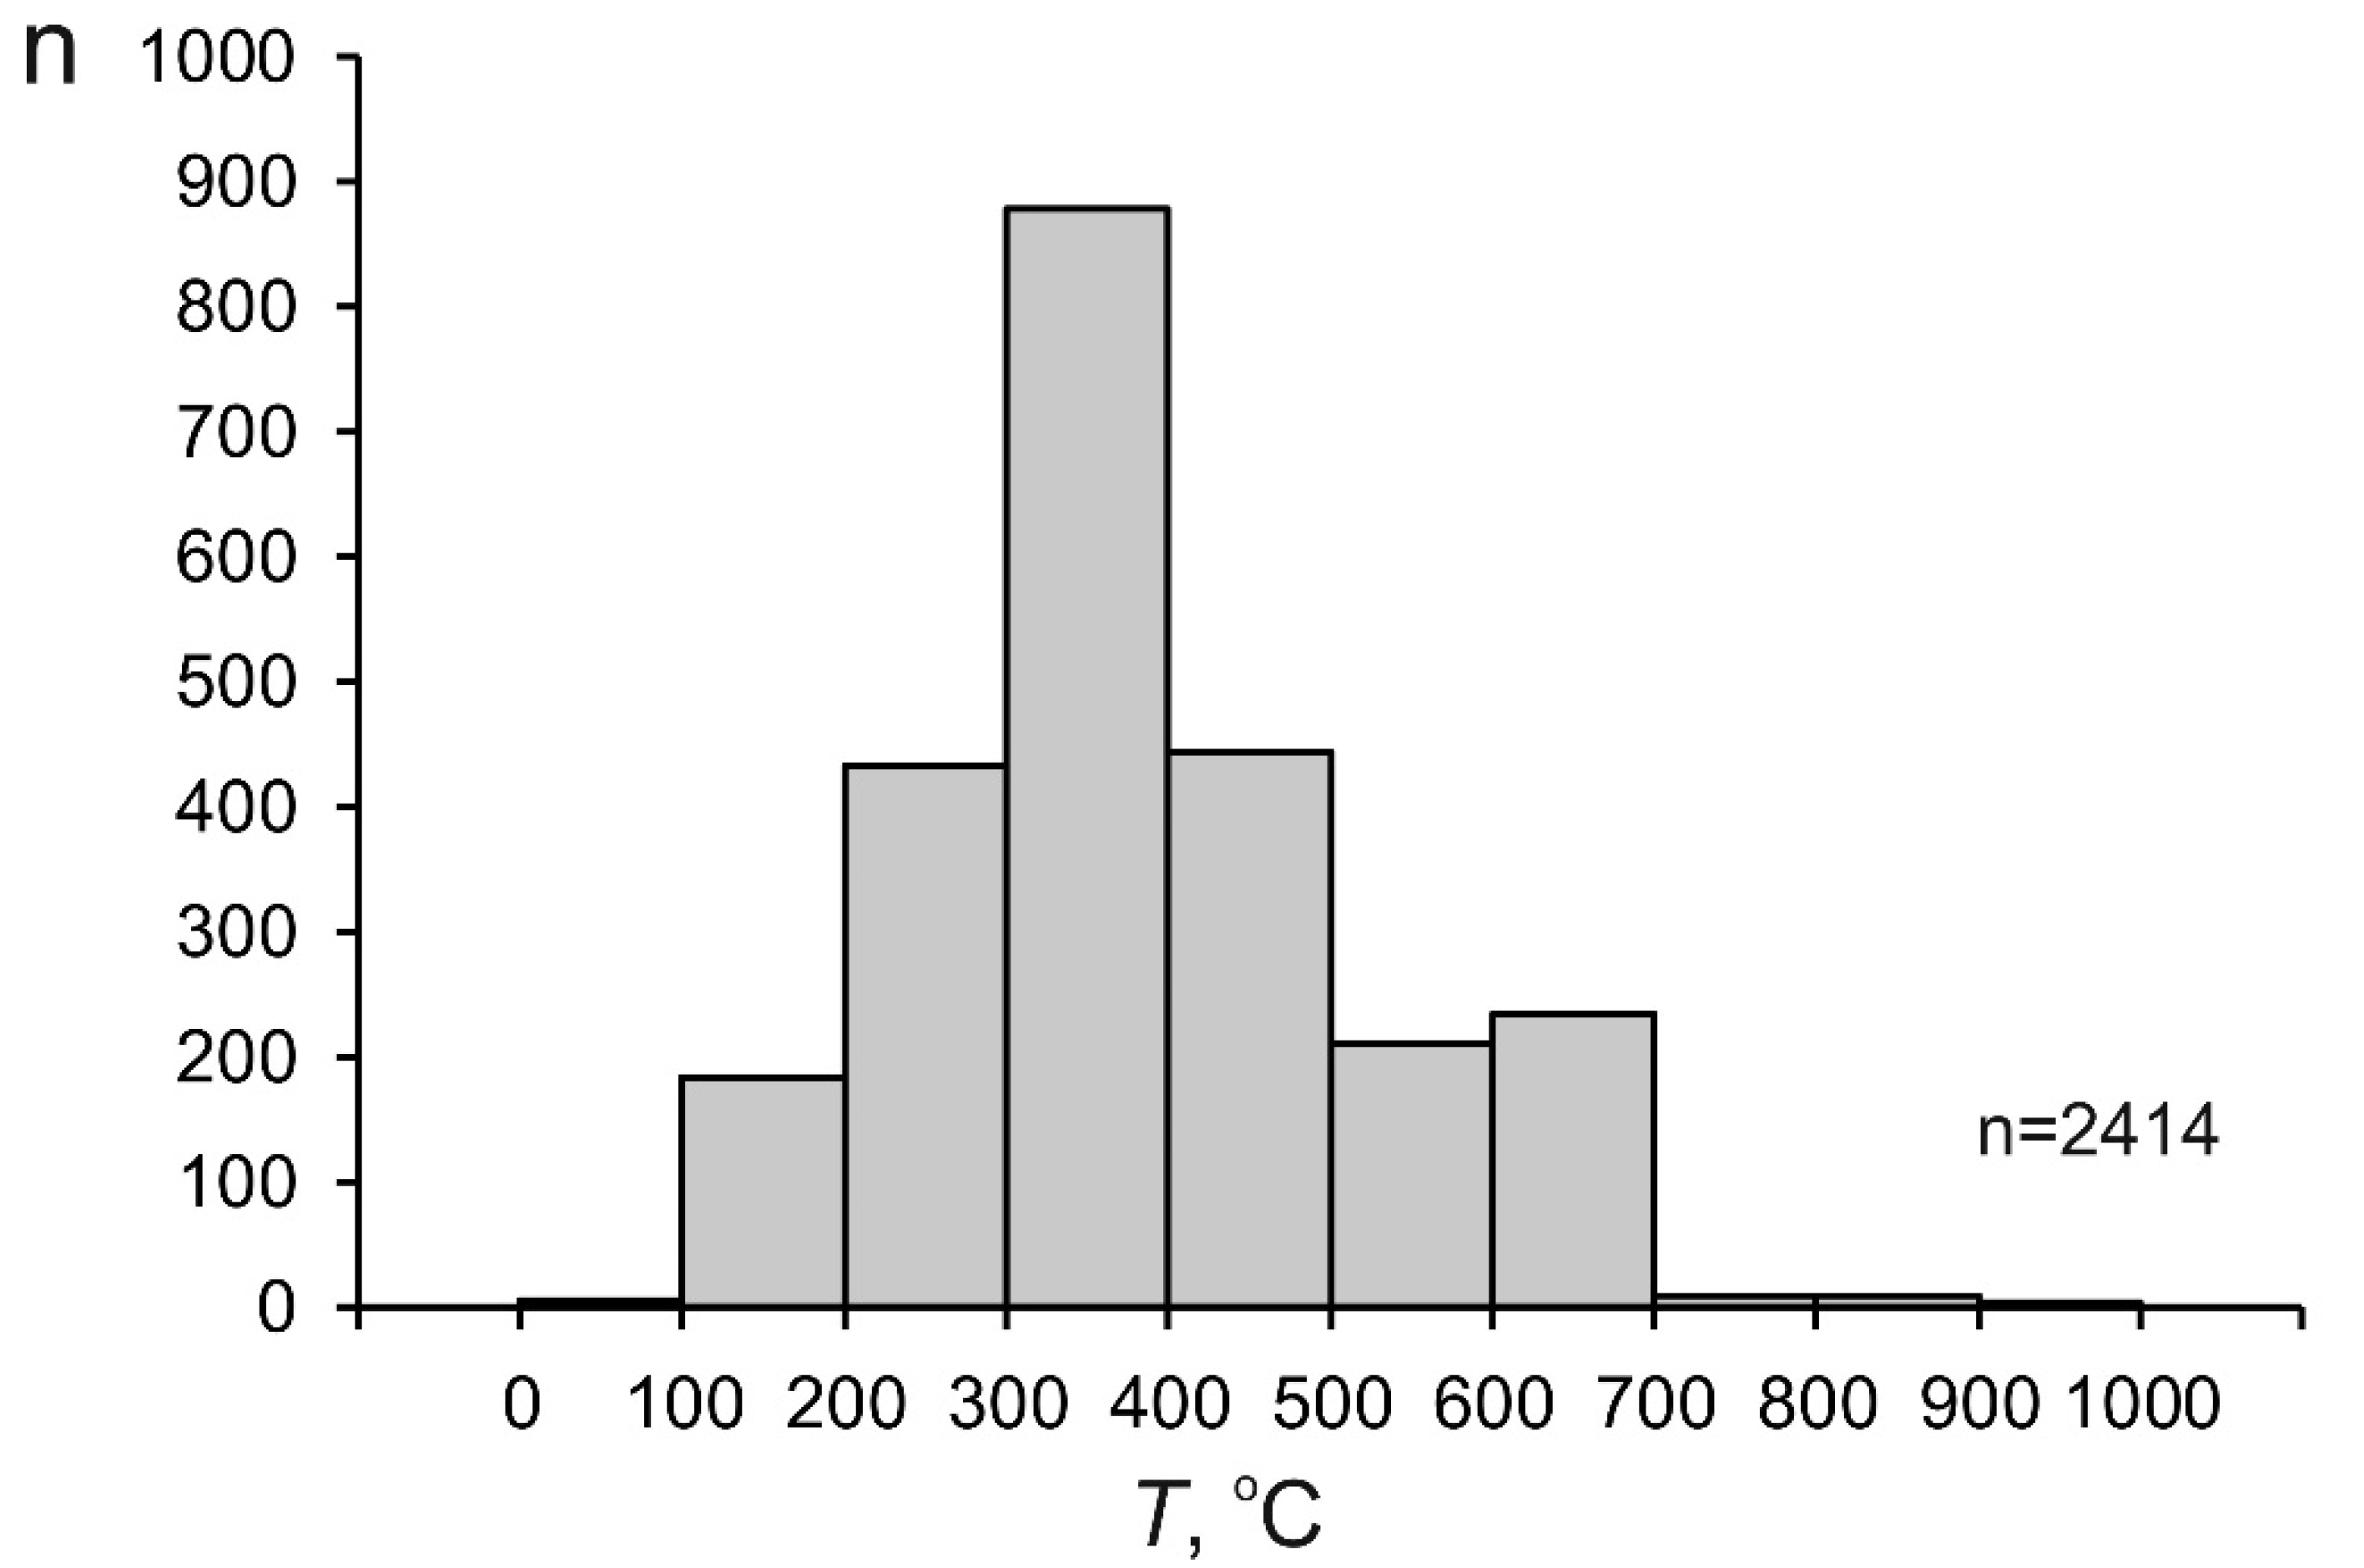
3. Characterization of Fluids at Porphyry Deposits
4. Discussion
5. Conclusions
Author Contributions
Funding
Data Availability Statement
Conflicts of Interest
References
- Sillitoe, R.H. A plate tectonic model for the origin of porphyry copper deposits. Econ. Geol. 1972, 67, 184–197. [Google Scholar] [CrossRef]
- Titley, S.R. Characteristics of porphyry copper occurrence in the American southwest. Miner. Depos. Modeling. Geol. Assoc. Can. Pap. 1993, 40, 433–464. [Google Scholar]
- Seedorf, E.; Dilles, J.H.; Proffett, J.M., Jr.; Einaudi, M.T.; Zurcher, L.; Stavasr, W.J.A.; Johnson, D.A.; Barton, M.D. Porphyry Deposits: Characteristics and Origin of Hypogene Features. Econ. Geol. 2005, 100, 251–298. [Google Scholar]
- Sillitoe, R.H. Porphyry copper systems. Econ. Geol. 2010, 105, 3–41. [Google Scholar] [CrossRef] [Green Version]
- Hedenquist, J.W.; Richards, J.P. The influence of geochemical techniques on the development of genetic models for porphyry copper deposits. Rev. Econ. Geol. 1998, 10, 235–256. [Google Scholar]
- Tosdal, R.M.; Richards, J.P. Magmatic and structural controls on the development of porphyry Cu ± Mo ± Au deposits. Rev. Econ. Geol. 2001, 14, 157–181. [Google Scholar]
- Richards, J.P. Tectonomagmatic precursors for porphyry Cu-(Mo-Au) deposit formation. Econ. Geol. 2003, 98, 1515–1533. [Google Scholar] [CrossRef]
- Richards, J.P. Magmatic to hydrothermal metal fluxes in convergent and collided margins. Ore Geol. Rev. 2011, 40, 1–26. [Google Scholar] [CrossRef]
- Cooke, D.R.; Hollings, P.; Walsh, J.L. Giant porphyry deposits: Characteristics, distribution, and tectonic controls. Econ. Geol. 2005, 100, 801–818. [Google Scholar] [CrossRef]
- Lowell, J.D.; Guilbert, J.M. Lateral and vertical alteration-mineralization zoning in porphyry ore deposits. Econ. Geol. 1970, 65, 373–408. [Google Scholar] [CrossRef]
- Kirkham, R.V. Intermineral intrusions and their bearing on the origin of porphyry copper and molybdenum deposits. Econ. Geol. 1971, 66, 1244–1249. [Google Scholar] [CrossRef]
- Beane, R.E.; Titley, S.R. Porphyry copper deposits: Part 2. Hydrothermal alteration and mineralization. Econ. Geol. 1981, 75, 235–269. [Google Scholar]
- Titley, S.R. The style and progress of mineralization and alteration in porphyry copper systems: American Southwest. In Advances in Geology of the Porphyry Copper Deposits, Southwestern North America; Titley, S.R., Ed.; University of Arizona Press: Tucson, AZ, USA, 1982; pp. 93–116. [Google Scholar]
- Beane, R.E.; Bodnar, R.J. Hydrothermal fluids and hydrothermal alteration in porphyry copper deposits. Ariz. Geol. Soc. Dig. 1995, 20, 83–93. [Google Scholar]
- Gustafson, L.B.; Hunt, J.P. The porphyry copper deposit at El Salvador, Chile. Econ. Geol. 1975, 70, 857–912. [Google Scholar] [CrossRef]
- Henley, R.W.; McNabb, A. Magmatic vapor plumes and groundwater interaction in porphyry copper emplacement. Econ. Geol. 1978, 73, 1–20. [Google Scholar] [CrossRef]
- Burnham, C.W. Magmas and hydrothermal fluids. In Geochemistry of Hydrothermal Ore Deposits; Barnes, H.L., Ed.; John Wiley & Sons: New York, NY, USA, 1979; pp. 71–136. [Google Scholar]
- Burnham, C.W. Magmas and hydrothermal fluids. In Geochemistry of Hydrothermal Ore Deposits; Barnes, H.L., Ed.; Wiley and Sons: New York, NY, USA, 1997; pp. 63–123. [Google Scholar]
- Holland, H.D. Granites, solutions, and base metal deposits. Econ. Geol. 1972, 67, 281–301. [Google Scholar] [CrossRef]
- Kilinc, I.A.; Burnham, C.W. Partitioning of chloride between a silicate melt and coexisting aqueous phase from 2 to 8 kilobars. Econ. Geol. 1972, 67, 231–235. [Google Scholar] [CrossRef]
- Candela, P.A.; Holland, H.D. The partitioning of copper and molybdenum between silicate melts and aqueous fluids. Geochim. Cosmochim. Acta 1984, 48, 373–380. [Google Scholar] [CrossRef]
- Candela, P.A. Magmatic ore-forming fluids: Thermodynamic and mass-transfer calculations of metal concentrations. In Ore Deposition Associated With Magmas. Reviews in Economic Geology, 4; Whitney, J.A., Naldrett, A.J., Eds.; Economic Geology Publishing Company: El Paso, TX, USA, 1989; pp. 203–221. [Google Scholar]
- Shinohara, H.; Iiyama, J.T.; Matsuo, S. Partition of chlorine compounds between silicate melt and hydrothermal solutions; I, partition of NaCl-KCl. Geochim. Cosmochim. Acta 1989, 53, 2617–2630. [Google Scholar] [CrossRef]
- Cline, J.S.; Bodnar, R.J. Can economic porphyry copper mineralization be generated by a typical calc-alkaline melt? J. Geophys. Res. 1991, 96, 8113–8126. [Google Scholar] [CrossRef]
- Cline, J.S.; Bodnar, R.J. Direct evolution of a brine from crystallizing silicic melt at the Questa, New Mexico, molybdenum deposit. Econ. Geol. 1994, 89, 1780–1802. [Google Scholar] [CrossRef]
- Bodnar, R.J. Fluid-inclusion evidence for a magmatic source for metals in porphyry copper deposits. Mineral. Assoc. Can. Short Course Ser. 1995, 23, 139–152. [Google Scholar]
- Holtz, F.; Johannes, W.; Tamic, N.; Behrens, H. Maximum and minimum water contents of granitic melts generated in the crust. Lithos 2001, 56, 1–14. [Google Scholar] [CrossRef]
- Heinrich, C.A.; Driesner, T.; Stefánsson, A.; Seward, T.M. Magmatic vapor concentration and the transport of gold from the porphyry environment to epithermal ore deposits. Geology 2004, 32, 761–764. [Google Scholar] [CrossRef]
- Rusk, B.; Reed, M.H.; Dilles, J.H.; Klemm, L. Compositions of magmatic-hydrothermal fluids determined by LA-ICPMS of fluid inclusions from the porphyry copper-molybdenum deposit at Butte. Montana. Chem. Geol. 2004, 210, 173–199. [Google Scholar] [CrossRef]
- Audetat, A.; Pettke, T.; Heinrich, C.A.; Bodnar, R.J. The composition of magmatic-hydrothermal fluids in barren and mineralized intrusions. Econ. Geol. 2008, 103, 877–908. [Google Scholar] [CrossRef]
- Bodnar, R.J.; Lecumberri-Sanchez, P.; Moncada, D.; Steele-Maclnnes, P. Fluid Inclusions in Hydrothermal Ore Deposits. Reference Module in Earth Systems and Environmental Sciences. Treatise on Geochemistry, 2nd ed.; Elsevier: Amsterdam, The Netherlands, 2014; pp. 119–142. [Google Scholar]
- Driesner, T. The system H2O-NaCl. Part II: Correlations for molar volume, enthalpy, and isobaric heat capacity from 0 to 1000 °C, 1 to 5000 bar, and 0 to 1 XNaCl. Geochim. Cosmochim. Acta 2007, 71, 4902–4919. [Google Scholar] [CrossRef]
- Driesner, T.; Heinrich, C.A. The system H2O-NaCl. Part I: Correlation formulae for phase relations in temperature-pressure-composition space from 0 to 1000 °C, 1 to 5000 bar, and 0 to 1 XNaCl. Geochim. Cosmochim. Acta 2007, 71, 4880–4901. [Google Scholar] [CrossRef]
- Roedder, E. Fluid inclusions: Reviews in Mineralogy. Mineral. Soc. Am. 1984, 12, 646p. [Google Scholar]
- Roedder, E. Fluid inclusions as samples of ore fluids. In Geochemistry of Hydrothermal Ore Deposits; Barnes, H.L., Ed.; Holt, Rinehart and Winston: New York, NY, USA, 1967; pp. 515–574. [Google Scholar]
- Nash, T.J. Fluid inclusion petrology—Data from porphyry copper deposits and applications to exploration. In U. S. Geological Survey Professional Paper 907-D; US Government Printing Office: Washington, DC, USA, 1976; p. 16. [Google Scholar]
- Bodnar, R.J. Fluid inclusions in porphyry-type deposits. In Mineral Deposits Research Review for Industry Course Notes; The Pennsylvania State University: University Park, PA, USA, 1982; pp. RB1–RB25. [Google Scholar]
- Roedder, E.; Bodnar, R.J. Fluid inclusion studies of hydrothermal ore deposits. In Geochemistry of Hydrothermal Ore Deposits; Barnes, H.L., Ed.; Wiley & Sons, Inc.: New York, NY, USA, 1997; pp. 657–698. [Google Scholar]
- Lecumberri-Sanchez, P.; Newton, M.C.; Westman, E.C.; Kamilli III, R.J.; Canby, V.M.; Bodnar, R.J. Temporal and spatial distribution of alteration, mineralization and fluid inclusion types in the transitional epithermal-porphyry copper system at Red Mountain AZ. J. Geochem. Explor. 2013, 125, 80–93. [Google Scholar] [CrossRef]
- Becker, S.P.; Bodnar, R.J.; Reynolds, T.J. Temporal and spatial variations in characteristics of fluid inclusions in epizonal magmatic-hydrothermal systems: Applications in exploration for porphyry copper deposits. J. Geochem. Explor. 2019, 204, 240–255. [Google Scholar] [CrossRef]
- Spooner, E.T.C. Fluid inclusion studies of hydrothermal ore deposits. Miner. Assoc. Can. Short Course Handb. 1981, 6, 209–240. [Google Scholar]
- Weisbrod, A. Fluid inclusions in shallow intrusive. Miner. Assoc. Can. Short Course Handb. 1981, 6, 241–271. [Google Scholar]
- Lattanzi, P. Applications of fluid inclusions in the study and exploration of mineral deposits. Eur. J. Miner. 1991, 3, 689–701. [Google Scholar] [CrossRef]
- Lattanzi, P. Fluids in ore deposits. In Fluid inclusions in minerals. Methods and applications; de Vivo, B., Frezzotti, M.L., Eds.; Virginia Polytechnic Institute and State University, International Mineralogical Association Working Group Short Course: Blacksburg, VA, USA, 1994; pp. 297–307. [Google Scholar]
- Wilkinson, J.J. Fluid inclusions in hydrothermal ore deposits. Lithos 2001, 55, 229–272. [Google Scholar] [CrossRef]
- Kouzmanov, K.; Pokrovski, G.S. Hydrothermal controls on metal distribution in porphyry Cu (-Mo-Au) systems. Soc. Econ. Geol. Inc. Spec. Publ. 2012, 16, 573–618. [Google Scholar]
- Naumov, V.B.; Dorofeeva, V.A.; Mironova, O.F. Physicochemical parameters of the origin of hydrothermal mineral deposits: Evidence from fluid inclusions. IV. Copper and molybdenum. Geochem. Internat. 2017, 55, 711–725. [Google Scholar] [CrossRef]
- Naumov, V.B.; Dorofeeva, V.A.; Mironova, O.F. Principal physicochemical parameters of natural mineral-forming fluids. Geochem. Internat. 2009, 47, 777–802. [Google Scholar] [CrossRef]
- Naumov, V.B.; Dorofeeva, V.A.; Mironova, O.F. Physicochemical parameters of the origin of hydrothermal mineral deposits: Evidence from fluid inclusions. VI. Fluorite and barite deposits. Geochem. Internat. 2020, 58, 1331–1342. [Google Scholar] [CrossRef]
- Kesler, S.E.; Wilkinson, B.H. The role of exhumation in the temporal distribution of ore deposits. Econ. Geol. 2006, 101, 919–922. [Google Scholar] [CrossRef]
- Roedder, E. Fluid inclusion studies on the porphyry-type ore deposits at Bingham, Utah, Butte, Montana, and Climax, Colorado. Econ. Geol. 1971, 66, 98–120. [Google Scholar] [CrossRef]
- Nash, J.T.; Theodore, T.G. Ore fluids in the porphyry copper deposit at Copper Canyon, Nevada. Econ. Geol. 1971, 66, 385–399. [Google Scholar] [CrossRef]
- Berzina, A.P.; Sotnikov, V.I. Some compositional features and parameters of mineral-forming solutions at the Kalmakyr deposit. Geol. Ore Dep. 1973, 4, 44–50. (In Russian) [Google Scholar]
- Moore, W.J.; Nash, J.T. Alteration and fluid inclusion studies of the porphyry copper ore body at Bingham, Utah. Econ. Geol. 1974, 69, 631–645. [Google Scholar] [CrossRef]
- Chivas, A.R.; Wilkins, R.W.T. Fluid inclusion studies in relation to hydrothermal alteration and mineralization at the Koloula porphyry copper prospect, Guadalcanal. Econ. Geol. 1977, 72, 153–169. [Google Scholar] [CrossRef]
- Sawkins, F.J. Fluid inclusion studies of the Inguaran copper-bearing breccia pipes, Michaocan, Mexico. Econ. Geol. 1978, 74, 924–927. [Google Scholar] [CrossRef]
- Eastoe, C.J. A fluid inclusion study of the Panguna porphyry copper deposit, Bougainville, Papua New Guinea. Econ. Geol. 1978, 73, 721–748. [Google Scholar] [CrossRef]
- Bodnar, R.J.; Bean, R.E. Temporal and spatial variations in hydrothermal fluid characteristics during vein filling in preore cover overlying deeply Buried porphyry copper-type mineralization at Red Mountain, Arizona. Econ. Geol. 1980, 75, 875–893. [Google Scholar] [CrossRef]
- Preece, R.K., III; Bean, R.E. Contrasting evolutions of hydrothermal alteration in quartz monzonite and quartz diorite wall rocks at the Sierrita porphyry copper deposit, Arizona. Econ. Geol. 1982, 77, 1621–1641. [Google Scholar] [CrossRef]
- Simmons, S.F.; Sawkins, F.J. Mineralogic and fluid inclusion studies of the Washington Cu-Mo-W-bearing breccia pipe, Sonora, Mexico. Econ. Geol. 1983, 78, 521–526. [Google Scholar] [CrossRef]
- Shelton, K.L. Composition and origin of ore-forming fluids in a carbonate-hosted porphyry copper and skarn deposit: A fluid inclusion and stable isotope study of Mines Gaspe, Quebec. Econ. Geol. 1983, 78, 387–421. [Google Scholar] [CrossRef]
- Reynolds, T.J.; Beane, R.E. Evolution of hydrothermal fluid characteristics at the Santa Rita, New Mexico, porphyry copper deposit. Econ. Geol. 1985, 80, 1328–1347. [Google Scholar] [CrossRef]
- Scherkenbach, D.A.; Sawkins, F.J.; Sayfried, W.E., Jr. Geologic, fluid inclusion, and geochemical studies of the mineralized breccias at Cumobabi, Sonora, Mexico. Econ. Geol. 1985, 80, 1566–1592. [Google Scholar] [CrossRef]
- Lang, J.R.; Eastoe, C.J. Relationships between a porphyry Cu-Mo deposit, base and precious metal veins, and Laramide intrusions, Mineral Park, Arizona. Econ. Geol. 1988, 83, 551–567. [Google Scholar] [CrossRef]
- Anderson, A.J.; Clark, A.H.; Ma, X.-P.; Palmer, G.R.; MacArtur, D.; Roedder, E. Proton-induced X-Ray and Gamma-Ray emission analysis of unopened fluid inclusions. Econ. Geol. 1989, 84, 924–939. [Google Scholar] [CrossRef]
- John, D.A. Evolution of hydrothermal fluids in the Park Premier Stock, Central Wasatch Mountains, Utah. Econ. Geol. 1989, 84, 879–902. [Google Scholar] [CrossRef]
- Hezarkhani, A.; Williams-Jones, A.E. Controls of alteration and mineralization in the Sungun porphyry copper deposit, Iran: Evidence from fluid inclusions and stable isotopes. Econ. Geol. 1998, 93, 651–670. [Google Scholar] [CrossRef]
- Hedenquist, J.W.; Arribas, A.J.; Reynolds, T.J. Evolution of an Intrusion-Centered Hydrothermal System: Far Southeast-Lepanto Porphyry and Epithermal Cu-Au Deposits, Philippines. Econ. Geol. 1998, 93, 373–404. [Google Scholar] [CrossRef] [Green Version]
- Ulrich, T.; Günther, D.; Heinrich, C.A. Gold concentrations of magmatic brines and the metal budget of porphyry copper deposits. Nature 1999, 399, 676–679. [Google Scholar] [CrossRef]
- Rombach, C.S.; Newberry, R.J. Shotgun deposit: Granite porphyry-hosted gold-arsenic mineralization in southwestern Alaska, USA. Mineral. Depos. 2001, 36, 607–621. [Google Scholar] [CrossRef]
- Vanko, D.A.; Bonnin-Mosbah, M.; Philippot, P.; Roedder, E.; Sutton, S.R. Fluid inclusions in quartz from oceanic hydrothermal specimens and the Bingham, Utah porphyry-Cu deposit: A study with PIXE and SXRF. Chem. Geol. 2001, 173, 227–238. [Google Scholar] [CrossRef]
- Ulrich, T.; Gunther, D.; Heinrich, C.A. The evolution of a porphyry Cu-Au deposit, based on LA-ICP-MS analysis of fluid inclusions: Bajo de la Alumbrera, Argentina. Econ. Geol. 2002, 97, 1889–1920. [Google Scholar] [CrossRef]
- Audétat, A.; Pettke, T. The magmatic-hydrothermal evolution of two barren granites: A melt and fluid inclusion study of the Rito del Medio and Cañada Pinabete plutons in northern New Mexico (USA). Geochim. Cosmochim. Acta 2003, 67, 97–121. [Google Scholar] [CrossRef]
- Harris, A.C.; Kamenetsky, V.S.; White, N.C.; van Achterbergh, E.; Ryan, C.G. Melt inclusions in veins: Linking magmas and porphyry Cu deposits. Science 2003, 302, 2109–2111. [Google Scholar] [CrossRef] [Green Version]
- Padilla-Garza, R.A.; Titley, S.R.; Eastoe, C.J. Hypogene evolution of the Escondida porphyry copper deposit, Chile. Econ. Geol. Spec. Publ. 2004, 11, 141–165. [Google Scholar]
- Harris, A.C.; Kamenetsky, V.S.; White, N.C.; Steele, D.A. Volatile phase separation in silicic magmas at Bajo de la Alumbrera porphyry Cu-Au deposit, NW Argentina. Resour. Geol. 2004, 54, 341–356. [Google Scholar] [CrossRef] [Green Version]
- Landtwing, M.R.; Pettke, T.; Halter, W.E.; Heinrich, C.A.; Redmond, P.B.; Einaudi, M.T.; Kunze, K. Copper deposition during quartz dissolution by cooling magmatic–hydrothermal fluids: The Bingham porphyry. Earth Planet. Sci. Lett. 2005, 235, 229–243. [Google Scholar] [CrossRef]
- Davidson, P.; Kamenetsky, V.; Cook, D.R.; Frikken, P.; Hollings, P.; Ryan, C.; Achtenbergh, E.V.; Mernagh, T.; Scarmeta, J.; Serrano, L.; et al. Magmatic precursors of hydrothermal fluids at the Río Blanco Cu-Mo deposit, Chile: Links to silicate magmas and metal transport. Econ. Geol. 2005, 100, 963–978. [Google Scholar] [CrossRef]
- Masterman, G.J.; Cooke, D.R.; Berry, R.F.; Walshe, J.L.; Lee, A.W.; Clark, A.H. Fluid chemistry, structural setting, and emplacement history of the Rosario Cu-Mo porphyry and Cu-Ag-Au epithermal veins, Collahuasi district, Northern Chile. Econ. Geol. 2005, 100, 835–862. [Google Scholar] [CrossRef]
- Bouzari, F.; Clark, A.H. Prograde evolution and geothermal affinities of a major porphyry copper deposit: The Cerro Colorado hypogene protore, I Región, Northern Chile. Econ. Geol. 2006, 101, 95–134. [Google Scholar] [CrossRef]
- Klemm, L.M.; Pettke, T.; Heinrich, C.A.; Campos, E. Hydrothermal evolution of the El Teniente deposit, Chile: Porphyry Cu-Mo ore deposition from low-salinity magmatic fluids. Econ. Geol. 2007, 102, 1021–1045. [Google Scholar] [CrossRef]
- Kovalenkev, V.A.; Krylova, T.L.; Kiseleva, G.D.; Kigai, I.N. Parameters of processes that produced the atypical Bugdainskoe Au-Mo(W)-Pb-Zn porphyry deposit, eastern Transbaikalia, Russia. Dokl. Acad. Sci. Rus. 2007, 416, 96–99. (In Russian) [Google Scholar]
- Lai, J.; Chi, G.; Peng, S.; Shao, Y.; Yang, B. Fluid evolution in the formation of the Fenghuangshan Cu-Fe-Au deposit, Tongling, Anhui, China. Econ. Geol. 2007, 102, 949–970. [Google Scholar] [CrossRef]
- Prokofiev, V.Y.; Zorina, L.D.; Kovalenker, V.A.; Akinfiev, N.N.; Baksheev, I.A.; Krasnov, A.N.; Yurgenson, G.A.; Trubkin, N.V. Composition, Formation Conditions, and Genesis of the Talatui Gold Deposit, the Eastern Transbaikal Region, Russia. Geol. Ore Depos. 2007, 49, 31–68. [Google Scholar] [CrossRef]
- Rusk, B.G.; Reed, M.H.; Dilles, J.H. Fluid inclusion evidence for magmatic-hydrothermal fluid evolution in the porphyry copper-molybdenum deposit at Butte, Montana. Econ. Geol. 2008, 103, 307–334. [Google Scholar] [CrossRef]
- Valencia, V.A.; Eastoe, C.; Ruiz, J.; Ochoa-Landin, L.; Gehrels, G.; Gonzalez-Lion, C.; Barra, F.; Espinoza, E. Hydrothermal evolution of the porphyry copper deposit at La Caridad, Sonora, Mexico, and the relationship with a neighboring high-sulfidation epithermal deposit. Econ. Geol. 2008, 103, 475–491. [Google Scholar] [CrossRef]
- Klemm, L.M.; Pettke, T.; Heinrich, C.A. Fluid and source magma evolution of the Questa porphyry Mo deposit, New Mexico, USA. Mineral. Depos. 2008, 43, 533–552. [Google Scholar] [CrossRef] [Green Version]
- Pudack, C.; Halter, W.E.; Heinrich, C.A.; Pettke, T. Evolution of magmatic vapor to gold-rich epithermal liquid: The porphyry to epithermal transition at Nevados de Famatina, Northwest Argentina. Econ. Geol. 2009, 104, 449–477. [Google Scholar] [CrossRef]
- Xu, W.Y.; Pan, F.C.; Qu, X.M.; Hou, Z.Q.; Yang, Z.S.; Chen, W.S.; Yang, D.; Cui, Y. Xiongcun, Tibet: A telescoped system of veinlet-disseminated Cu (Au) mineralization and late vein-style Au (Ag)-polymetallic mineralization in a continental collision zone. Ore Geol. Rev. 2009, 36, 174–193. [Google Scholar] [CrossRef]
- Chen, Y.J.; Pirajno, F.; Li, N.; Guo, D.S.; Lai, Y. Isotope systematics and fluid inclusion studies of the Qiyugou breccia pipe-hosted gold deposit, Qinling Orogen, Henan province, China: Implications for ore genesis. Ore Geol. Rev. 2009, 35, 245–261. [Google Scholar] [CrossRef]
- Seo, J.H.; Guillong, M.; Heinrich, C.A. The role of sulfur in the formation of magmatic-hydrothermal copper-gold deposits. Earth Planet Sci. Lett. 2009, 282, 323–328. [Google Scholar] [CrossRef] [Green Version]
- Landtwing, M.R.; Furrer, C.; Redmond, P.B.; Pettke, T.; Guillong, M.; Heinrich, C.A. The Bingham Canyon Porphyry Cu-Mo-Au Deposit. III. Zoned Copper-Gold Ore Deposition by Magmatic Vapor Expansion. Econ. Geol. 2010, 105, 91–118. [Google Scholar] [CrossRef]
- Shen, P.; Shen, Y.C.; Wang, J.B.; Zhu, H.P.; Wang, L.J.; Meng, L. Methane-rich fluid evolution of the Baogutu porphyry Cu-Mo-Au deposit, Xinjiang, NW China. Chem. Geol. 2010, 275, 78–98. [Google Scholar] [CrossRef]
- Fan, H.R.; Hu, F.F.; Wilde, S.A.; Yang, K.F.; Jin, C.W. The Qiyugou gold-bearing breccia pipes, Xiong’ershan region, central China: Fluid-inclusion and stable-isotope evidence for an origin from magmatic fluids. Intern. Geol. Rev. 2011, 53, 25–45. [Google Scholar] [CrossRef]
- Deng, J.; Wang, Q.F.; Xiao, C.H.; Yang, L.Q.; Liu, H.; Gong, Q.G.; Zhang, J. Tectonic-magmatic-metallogenic system, Tongling ore cluster region, Anhui Province, China. Intern. Geol. Rev. 2011, 53, 449–476. [Google Scholar] [CrossRef]
- Gu, L.X.; Wu, C.Z.; Zhang, Z.Z.; Pirajno, F.; Ni, P.; Chen, P.R.; Xiao, X.J. Comparative study of ore-forming fluids of hydrothermal copper-gold deposits in the lower Yangtze River Valley, China. Intern. Geol. Rev. 2011, 53, 477–498. [Google Scholar] [CrossRef]
- Xu, X.C.; Zhang, Z.Z.; Liu, Q.N.; Lou, J.W.; Xie, Q.Q.; Chu, P.L.; Frost, R.L. Thermodynamic study of the association and separation of copper and gold in the Shizishan ore field, Tongling, Anhui Province, China. Ore Geol. Rev. 2011, 43, 347–358. [Google Scholar] [CrossRef]
- Li, J.X.; Li, G.M.; Qin, K.Z.; Xiao, B. High-temperature magmatic fluid exsolved from magma at the Duobuza porphyry copper-gold deposit, Northern Tibet. Geofluids 2011, 11, 134–143. [Google Scholar] [CrossRef]
- Allan, M.M.; Morrison, G.W.; Yardley, B.W.D. Physicochemical evolution of a porphyry-breccia system: A laser ablation ICP-MS study of fluid inclusions in the Mount Leyshon Au deposit, Queensland, Australia. Econ. Geol. 2011, 106, 413–436. [Google Scholar] [CrossRef]
- Wolf, R.C.; Cooke, D.R. Geology of the Didipio region and genesis of the Dinkidi alkalic porphyry Cu-Au deposit and related pegmatites, northern Luzon, Philippines. Econ. Geol. 2011, 106, 1279–1315. [Google Scholar] [CrossRef]
- Seo, J.H.; Guillong, M.; Heinrich, C.A. Separation of molybdenum and copper in porphyry deposits: The roles of sulfur, redox, and pH in ore mineral deposition at Bingham Canyon. Econ. Geol. 2012, 107, 333–356. [Google Scholar] [CrossRef]
- Soloviev, S.G.; Kryazhev, S.G.; Dvurechenskaya, S.S. Geology, mineralization, stable isotope geochemistry, and fluid inclusion characteristics of the Novogodnee-Monto oxidized Au-(Cu) skarn and porphyry deposit, Polar Ural, Russia. Mineral. Depos. 2013, 48, 603–627. [Google Scholar] [CrossRef]
- Koděra, P.; Heinrich, C.A.; Wälle, M.; Lexa, J. Magmatic salt melt and vapor: Extreme fluids forming porphyry gold deposits in shallow subvolcanic settings. Geology 2014, 42, 495–498. [Google Scholar] [CrossRef]
- Zhang, H.D.; Zhang, H.-F.; Santosh, M.; Li, S.R. Fluid inclusions from the Jinchang Cu–Au deposit, Heilongjiang Province, NE China: Genetic style and magmatic-hydrothermal evolution. J. Asian Earth Sci. 2014, 82, 103–114. [Google Scholar] [CrossRef]
- Siahcheshm, K.; Calagari, A.A.; Abedini, A. Hydrothermal evolution in the Maher-Abad porphyry Cu–Au deposit, SW Birjand, Eastern Iran: Evidence from fluid inclusions. Ore Geol. Rev. 2014, 58, 1–13. [Google Scholar] [CrossRef]
- Nikolaev, Y.N.; Prokof’ev, V.Y.; Baksheev, I.A.; Chitalin, A.F.; Marushchenko, L.I.; Kal’ko, I.A. The First Data on the Zoned Distribution of Fluid Inclusionsin the Ore-Forming System of the Peschanka Gold-Copper-Porphyry Deposit (Northeast Russia). Dokl. Earth Sci. 2014, 459, 1615–1618. [Google Scholar] [CrossRef]
- Simmonds, V.; Calagari, A.A.; Kyser, K. Fluid inclusion and stable isotope studies of the Kighal porphyry Cu–Mo prospect, East-Azerbaijan, NW Iran. Arab. J. Geosci. 2015, 8, 437–453. [Google Scholar] [CrossRef]
- Audetat, A. Compositional evolution and formation conditions of magmas and fluids related to porphyry Mo mineralization at Climax, Colorado. J. Petrol. 2015, 56, 1519–1546. [Google Scholar] [CrossRef] [Green Version]
- Nikolaev, Y.N.; Baksheev, I.A.; Prokofiev, V.Y.; Nagornaya, E.V.; Marushchenko, L.I.; Sidorina, Y.N.; Chitalin, A.F.; Kal’ko, I.A. Gold–Silver Mineralization in Porphyry–Epithermal Systems of the Baimka Trend, Western Chukchi Peninsula, Russia. Geol. Ore Depos. 2016, 58, 319–345. [Google Scholar] [CrossRef]
- Liu, X.; Fan, H.R.; Hu, F.F.; Yang, K.F.; Wen, B.J. Nature and evolution of the ore-forming fluids in the giant Dexing porphyry Cu–Mo–Au deposit, Southeastern China. J. Geochem. Explor. 2016, 171, 83–95. [Google Scholar] [CrossRef]
- Khomenko, M.O.; Giebsher, N.A.; Tomilenko, A.A.; Bul’bak, T.A.; Ryabukha, M.A.; Semenova, D.V. Phisicochemical parameters and age of the Vasil’kovskoe gold deposit (northern Kazakhstan). Russ. Geol. Geophys. 2016, 57, 1728–1744. [Google Scholar] [CrossRef]
- Bukhanova, D.S.; Plechov, P.Y. Parameters of processes that produced the Malmyzhskoe Au–Cu porphyry deposit: Evidence from fluid inclusions. Her. KRAUNTs 2017, 34, 61–71. (In Russian) [Google Scholar]
- Gregory, M.J. A fluid inclusion and stable isotope study of the Pebble porphyry copper-gold-molybdenum deposit, Alaska. Ore Geol. Rev. 2017, 80, 1279–1303. [Google Scholar] [CrossRef]
- Kouhestani, H.; Mokhtari, M.A.A.; Chang, Z.; Stein, H.J.; Johnson, C.A. Timing and genesis of ore formation in the Qarachilar Cu-Mo-Au deposit, Ahar-Arasbaran metallogenic zone, NW Iran: Evidence from geology, fluid inclusions, O–S isotopes and Re–Os geochronology. Ore Geol. Rev. 2018, 102, 757–775. [Google Scholar] [CrossRef]
- Wang, D.; Bi, X.; Lu, H.; Hu, R.; Wang, X.; Xu, L. Fluid and melt inclusion study on mineralized and barren porphyries, Jinshajiang-Red River alkali-rich intrusive belt, and significance to metallogenesis. J. Geochem. Explor. 2018, 184, 28–39. [Google Scholar] [CrossRef]
- Zhang, W.; Williams-Jones, A.E.; Leng, C.-B.; Zhang, X.-C.; Chen, W.T.; Qin, C.-J.; Su, W.-C.; Yan, J.-H. The origin of CH4-rich fluids in reduced porphyry–skarn Cu–Mo–Au systems. Ore Geol. Rev. 2019, 114, 103135. [Google Scholar] [CrossRef]
- Soloviev, S.G.; Kryazhev, S.G.; Dvurechenskay, S.S.; Vasyukov, V.E.; Shumilin, D.A.; Voskresensky, K.I. The superlarge Malmyzh porphyry Cu-Au deposit, Sikhote-Alin, eastern Russia: Igneous geochemistry, hydrothermal alteration, mineralization, and fluid inclusion characteristics. Ore Geol. Rev. 2019, 113, 103112. [Google Scholar] [CrossRef]
- Mernagh, T.; Mavrogenes, J. Significance of high temperature fluids and melts in the Grasberg porphyry copper gold deposit. Chem. Geol. 2019, 508, 210–224. [Google Scholar] [CrossRef]
- Lang, X.; Deng, Y.; Wang, X.; Tang, J.; Xie, F.; Yang, Z.; Yin, Q.; Jiang, K. Reduced fluids in porphyry copper-gold systems reflect the occurrence of the wall-rock thermogenic process: An example from the No.1 deposit in the Xiongcun district, Tibet, China. Ore Geol. Rev. 2020, 118, 103212. [Google Scholar] [CrossRef]
- Hanilçi, N.; Bozkaya, G.; Banks, D.A.; Bozkaya, O.; Prokofiev, V.; Öztaş, Y. Fluid inclusion characteristics of the Kışladağ porphyry Au deposit, Western Turkey. Minerals 2020, 10, 64. [Google Scholar] [CrossRef] [Green Version]
- Mernagh, T.; Leys, C.; Henley, R.W. Fluid inclusion systematics in porphyry copper deposits: The super-giant Grasberg deposit, Indonesia, as a case study. Ore Geol. Rev. 2020, 123, 103570. [Google Scholar] [CrossRef]
- Chen, P.; Zeng, Q.; Zhou, L.; Zhou, T. Fluid inclusion evidence for hydrothermal evolution of the Sadaigoumen porphyry Mo deposit on the northern margin of the north China Craton. Ore Geol. Rev. 2021, 134, 104145. [Google Scholar] [CrossRef]
- Brown, P.E. Flincor: A microcomputer program for the reduction and investigation of fluid inclusion data. Am. Mineral. 1989, 74, 1390–1393. [Google Scholar]
- Koděra, P.; Tacách, Á.; Racek, M.; Šimko, F.; Luptáková, I.; Váczi, T.; Antal, P. Javorieite, KFeCl3: A new mineral hosted by salt melt inclusions in porphyry gold systems. Eur. J. Mineral. 2017, 6, 995–1004. [Google Scholar] [CrossRef]
- Pintea, I.; Udubaşa, S.S.; Latan, E.L.; Berbeleac, I.; Bĭrgăoanu, D.; Ciobotea-Barbu, O.C.; Ghinescu, E. Microthermometry and Raman spectroscopy of fluid and melt inclusions in the alpine porphyry copper deposits from Romania: Insights on micrometallogeny. Rom. J. Miner. Depos. 2019, 92, 9–32. [Google Scholar]
- Roedder, E.; Skinner, B.J. Experimental evidence that fluid inclusions do not leak. Econ. Geol. 1968, 63, 715–730. [Google Scholar] [CrossRef]
- Mavrogenes, J.A.; Bodnar, R.J. Hydrogen movement into and out of fluid inclusions in quartz: Experimental evidence and geologic implications. Geochim. Cosmochim. Acta 1994, 58, 141–148. [Google Scholar] [CrossRef]


| Deposit, Country | Type * | Age, Ma | References |
|---|---|---|---|
| Bingham Canyon, USA | 2 | 37.7–38.6 | [51] |
| Butte, USA | 2 | 66 | [51] |
| Climax, USA | 3 | 29.8 | [51] |
| Copper Canyon, USA | 1 | Eocene? ** | [52] |
| Kalmakyr, Uzbekistan | 2 | Paleozoic | [53] |
| Bingham Canyon, USA | 2 | 37.7–38.6 | [54] |
| Coloula, Papua New Guinea | 1 | 1.5 | [55] |
| Inguaran district, Mexico | 1 | 50 | [56] |
| Panguna, Papua New Guinea | 1 | Miocene | [57] |
| Red Mountain, USA | 1 | 60 | [58] |
| Sierrita, USA | 1 | 57–59 | [59] |
| Washington, Mexico | 2 | 46 | [60] |
| Mines Gaspe, Canada | 2 | Devonian | [61] |
| Santa Rita, New Mexico, USA | 2 | Paleocene | [62] |
| Cumobabi, Mexico | 2 | 55.6–63.1 | [63] |
| Wallapai mining district, USA | 2 | 73 | [64] |
| Bingham Canyon, USA | 2 | 37.7–38.6 | [65] |
| Park Premier Stock, USA | 1 | 31–35 | [66] |
| Questa, USA | 3 | 24.2 | [25] |
| Sungun, Iran | 2 | Miocene | [67] |
| Far Southeast, Philippines | 4 | 1.3–1.4 | [68] |
| Bajo de la Alumbrera, Argentina | 1 | 6.1–9.7 | [69] |
| Grasberg, Indonesia | 1 | 2.6–4.4 | [69] |
| Shotgun, USA | 2 | 67 | [70] |
| Bingham Canyon, USA | 2 | 37.7–38.6 | [71] |
| Bajo de la Alumbrera, Argentina | 1 | 6.1–9.7 | [72] |
| Santa Rita, New Mexico, USA | 2 | Paleocene | [73] |
| Bajo de la Alumbrera, Argentina | 1 | 6.1–9.7 | [74] |
| Escondida, Chile | 1 | 34–36 | [75] |
| Bajo de la Alumbrera, Argentina | 1 | 6.1–9.7 | [76] |
| Butte, USA | 2 | 66 | [29] |
| Bingham Canyon, USA | 2 | 37.7–38.6 | [77] |
| Río Blanco, Chile | 2 | 4.0–5.2 | [78] |
| Rosario, Chile | 2 | 32.6–34.5 | [79] |
| Cerro Colorado, Chile | 2 | 51.8 | [80] |
| El Teniente, Chile | 2 | 4.4–6.3 | [81] |
| Bugdainskoe, Russia | 2 | Jurassic | [82] |
| Fenghuangshan, China | 1 | Jurassic–Cretaceous | [83] |
| Talatui, Russia | 4 | Jurassic | [84] |
| Butte, USA | 2 | 66 | [85] |
| Cave Peak, USA | 2 | 32–39 | [30] |
| La Caridad Antigua, Mexico | 1 | 55 | [86] |
| Questa, USA | 3 | 24.2 | [87] |
| Nevados de Famatina, Argentina | 2 | 5.3 | [88] |
| Xiongcun, China | 1 | 14–39 | [89] |
| Qiyugou, China | 4 | 105-183 | [90] |
| Bingham Canyon, USA | 2 | 37.7–38.6 | [91] |
| Bajo de la Alumbrera, Argentina | 1 | 6.1–9.7 | [91] |
| Bingham Canyon, USA | 2 | 37.7–38.6 | [92] |
| Baogutu, China | 2 | 309–326 | [93] |
| Qiyugou, China | 2 | 105–183 | [94] |
| Xishizishan, China | 1 | Triassic | [95] |
| Huashupo, China | 1 | Triassic | [95] |
| Datuanshan, China | 1 | Triassic | [95] |
| Tongguanshan, China | 1 | Triassic | [95] |
| Shizishan, China | 1 | Triassic | [95] |
| Shizishan, China | 1 | Triassic | [96] |
| Shaxi, China | 1 | 128 | [96] |
| Tongniujing, China | 1 | 128 | [96] |
| Xiaomiaoshan, China | 1 | 128 | [96] |
| Baocun, China | 1 | 135–145 | [97] |
| Datuanshan, China | 1 | 135–145 | [97] |
| Dongguashan, China | 1 | 135–145 | [97] |
| Chaoshan, China | 1 | 135–145 | [97] |
| Duobuza, China | 1 | 121.6 | [98] |
| Mount Leyshon, Australia | 4 | 290 | [99] |
| Dinkidi, Philippines | 1 | 25.12 | [100] |
| Bingham Canyon, USA | 2 | 37.7–38.6 | [101] |
| Novogodnee Manto, Russia | 1 | 400 | [102] |
| Biely Vrch, Slovakia | 2 | Miocene | [103] |
| Jinchang, China | 1 | 110–120 | [104] |
| Maher-Abad, Iran | 1 | Eocene | [105] |
| Peschanka, Russia | 1 | Cretaceous | [106] |
| Kighal, Iran | 2 | Eocene | [107] |
| Climax, USA | 3 | 29.8 | [108] |
| Malysh, Russia | 3 | Cretaceous | [109] |
| Peschanka, Russia | 1 | Cretaceous | [109] |
| Nakhodka, Russia | 1 | Cretaceous | [109] |
| Dexing, China | 2 | 154–173 | [110] |
| Vasil’kovskoe, Kazakhstan | 4 | 279–312 | [111] |
| Malmyzh, Russia | 1 | Cretaceous | [112] |
| Pebble, USA | 2 | 90 | [113] |
| Qarachilar, Iran | 2 | 42.35 | [114] |
| Machangqing, China | 2 | 35.0 | [115] |
| Yulong, China | 2 | 43.2 | [115] |
| Tongchang, China | 2 | 34.0–35.8 | [115] |
| Seleteguole, China | 2 | 302–307 | [116] |
| Malmyzh, Russia | 1 | 96–128 | [117] |
| Grasberg, Indonesia | 1 | 2.6–4.4 | [118] |
| № 1, China | 1 | 161.5 | [119] |
| Kışladağ, Turkey | 4 | 17.29–12.15 | [120] |
| Grasberg, Indonesia | 1 | 2.6–4.4 | [121] |
| Sadaigoumen, China | 3 | 240–243.7 | [122] |
| Deposit, Country, or Area | Physical Parameters of Fluid | Type ** of Deposit | References | |||
|---|---|---|---|---|---|---|
| T, °C | S *, wt % | d, g/cm3 | Р, bar | |||
| Bingham Canyon, USA | 405 (1) | 49.0 | 1.25 | - | 2 | [51] |
| Butte, USA | 275–335 (2) | 1.0 | 0.62–0.76 | - | 2 | [51] |
| Climax, USA | 566 (1) | 69.0 | 1.45 | - | 3 | [51] |
| Copper Canyon, USA | 250–345 (3) | 1.2–40.0 | 0.80–1.06 | - | 1 | [52] |
| Kalmakyr, Uzbekistan | 375–800 (7) | 33.8–69.0 | 0.94–1.20 | 1000–1500 (4) | 2 | [53] |
| Bingham Canyon, USA | 350–616 (17) | 42.0–53.0 | 0.95–1.21 | - | 2 | [54] |
| Coloula, Papua New Guinea | 400–700 (4) | 34.0–62.0 | 0.60–1.30 | 1200 (1) | 1 | [55] |
| Inguaran district, Mexico | 226–360 (17) | 11.9–36.0 | 0.78–1.07 | - | 1 | [56] |
| Red Mountain, USA | 448–576 (6) | 52.0–68.0 | 1.12–1.50 | - | 1 | [58] |
| Washington, Mexico | 364–550 (2) | 34.5 | 0.81–0.98 | - | 2 | [60] |
| Mines Gaspe, Canada | 138-506 (68) | 9.5–56.0 | 0.60–1.25 | - | 1 | [61] |
| Santa Rita, USA | 775 (1) | 70.0 | 1.50 | - | 2 | [62] |
| Cumobabi, Mexico | 235–480 (8) | 2.9–50.0 | 0.63–1.12 | - | 2 | [63] |
| Questa, USA | 150–500 (16) | 2.0–57.0 | - | 800–1400 (8) | 3 | [25] |
| Sungun, Iran | 215–605 (54) | 2.2–59.8 | 0.54–1.12 | - | 1 | [67] |
| Far Southeast, Philippines | 450–550 (2) | 48.5–55.0 | 1.07–1.25 | - | 4 | [68] |
| Shotgun, USA | 270–509 (8) | 28.0–69.0 | 0.76–1.50 | - | 2 | [70] |
| Bajo de la Alumbrera, Argentina | 745–845 (2) | 62.0 | - | - | 1 | [74] |
| Escondida, Chile | 270–680 (10) | 3.0–67.0 | 0.68–1.23 | - | 1 | [75] |
| Bajo de la Alumbrera, Argentina | 615–845 (3) | 45.0–53.0 | - | - | 1 | [76] |
| Rosario, Chile | 237–593 (31) | 0.7–73.0 | 0.58–1.65 | - | 2 | [79] |
| Cerro Colorado, Chile | 90–544 (32) | 0.1–52.0 | 0.60–1.30 | - | 2 | [80] |
| El Teniente Deposit, Chile | 262–515 (49) | 2.1–60.5 | 0.47–1.15 | - | 2 | [81] |
| Bugdainskoe, Russia | 205–576 (11) | 6.9–70.5 | 0.66–1.45 | - | 2 | [82] |
| Fenghuangshan, China | 122–620 (100) | 3.4–71.5 | 0.63–1.40 | 1 | [83] | |
| Talatui, Russia | 133–611 (50) | 0.4–56.3 | 0.47–1.21 | 108–3366 (37) | 4 | [84] |
| Butte, USA | 140–413 (14) | 1.0–48.0 | 0.41–1.14 | - | 2 | [85] |
| Questa, USA | 271–429 (21) | 2/8–50/0 | 0/43–1/12 | - | 3 | [87] |
| La Caridad Antigua, Mexico | 330–470 (13) | 28.0–56.0 | 0.95–1.15 | - | 1 | [86] |
| Nevados de Famatina, Argentina | 175–552 (22) | 1.5–64.4 | 0.46–1.48 | - | 2 | [88] |
| Xiongcun, China | 121–382 (37) | 1.9–34.6 | 0.59–1.16 | - | 1 | [89] |
| Qiyugou, China | 157–460 (24) | 3.7–37.2 | 0.58–1.02 | - | 4 | [90] |
| Bingham Canyon, USA | 323–492 (3) | 34.7–50.4 | 0.90–1.10 | - | 2 | [91] |
| Baogutu, China | 151–550 (90) | 0.2–66.8 | 0.46–1.22 | 307–3128 (9) | 2 | [93] |
| Qiyugou, China | 109–476 (21) | 3.9–47.0 | 0.65–1.10 | - | 4 | [94] |
| Xishizishan, China | 131–570 (7) | 1.1–54.5 | 0.87–1.12 | - | 1 | [95] |
| Huashupo, China | 191–525 (10) | 9.6–49.9 | 0.70–1.01 | - | 1 | [95] |
| Datuanshan, China | 205–437 (7) | 7.6–43.8 | 0.72–1.09 | - | 1 | [95] |
| Tongguanshan, China | 289–885 (12) | 6.0–44.9 | 0.64–1.16 | - | 1 | [95] |
| Shizishan, China | 148–600 (11) | 2.1–56.2 | 0.52–1.10 | 1 | [95] | |
| Shizishan, China | 158–610 (13) | 2.1–56.2 | 0.56–1.19 | - | 1 | [96] |
| Shaxi, China | 110–520 (10) | 8.0–58.0 | 0.71–1.13 | - | 1 | [96] |
| Tongniujing, China | 192–450 (3) | 30.0–48.0 | 1.00–1.11 | - | 1 | [96] |
| Xiaomiaoshan, China | 91–369 (4) | 0.7–43.0 | 0.81–1.14 | - | 1 | [96] |
| Baocun, China | 240–310 (4) | 16.1–26.0 | 0.91–1.01 | - | 1 | [97] |
| Datuanshan, China | 160–440 (12) | 8.7–29.3 | 0.67–1.03 | - | 1 | [97] |
| Dongguashan, China | 170–450 (7) | 17.0–53.3 | 0.93–1.12 | - | 1 | [97] |
| Chaoshan, China | 220–280 (2) | 17.0 | 0.91–0.98 | - | 1 | [97] |
| Duobuza, China | 616–957 (33) | 34.0–74.0 | 0.75–1.80 | 400–1600 (15) | 1 | [98] |
| Mount Leyshon, Australia | 150–595 (64) | 0.2–61.9 | 0.38–1.13 | - | 4 | [99] |
| Bingham Canyon, USA | 313–610 (121) | 3.3–59.0 | 0.42–1.21 | - | 2 | [101] |
| Novoe Manto, Russia | 100–365 (9) | 9.6–24.2 | 0.86–1.15 | - | 1 | [102] |
| Jinchang, China | 200–620 (42) | 0.4–74.0 | 0.40–1.55 | - | 1 | [104] |
| Maher-Abad, Iran | 150–488 (20) | 9.5–47.9 | 0.80–1.13 | - | 1 | [105] |
| Peschanka, Russia | 205–506 (10) | 0.2–55.0 | 0.4–1.11 | - | 1 | [106] |
| Kighal, Iran | 180–600 (6) | 23.0–70.0 | 0.79–1.50 | 2 | [107] | |
| Malysh, Russia | 129–545 (26) | 0.7–47.0 | 0.55–1.09 | 270–470 (2) | 3 | [109] |
| Peschanka, Russia | 104–506 (40) | 0.2–55.7 | 0.43–1.36 | 220–540 (8) | 1 | [109] |
| Nakhodka, Russia | 122–581 (10) | 2.1–57.8 | 0.51–1.14 | 280–850 (3) | 1 | [109] |
| Dexing, China | 105–524 (33) | 1.1–63.0 | 0.58–1.19 | 1500–3000 (2) | 2 | [110] |
| Vasil’kovskoe, Kazakhstan | 100–550 (126) | 2.0–22.5 | 0.47–1.03 | 150–2300 (69) | 4 | [111] |
| Malmyzh, Russia | 331–850 (9) | 27.0–80.0 | 0.95–1.13 | - | 1 | [112] |
| Pebble, USA | 147–535 (157) | 0.1–61.0 | 0.41–1.20 | - | 2 | [113] |
| Qarachilar, Iran | 190–530 (15) | 9.2–55.0 | 0.65–1.12 | - | 2 | [114] |
| Machangqing, China | 202–550 (15) | 12.7–22.1 | 0.51–1.09 | - | 2 | [115] |
| Yulong, China | 220–600 (20) | 2.0–46.0 | 0.48–1.07 | - | 2 | [115] |
| Tongchang, China | 240–460 (15) | 2.0–52.0 | 0.80–1.13 | - | 2 | [115] |
| Seleteguole, China | 268–483 (54) | 2.1–57.4 | 0.48–1.14 | - | 2 | [116] |
| Malmyzh, Russia | 260–525 (10) | 0.4–60.0 | 0.45–1.14 | 500 (2) | 1 | [117] |
| Grasberg, Indonesia | 255–700 (25) | 6.4–74.7 | 0.48–1.12 | - | 1 | [118] |
| № 1, China | 132–522 (104) | 0.9–62.8 | 0.41–1.19 | 1 | [119] | |
| Kışladağ, Turkey | 250–600 (35) | 1.0–49.0 | 0.47–1.04 | - | 4 | [120] |
| Grasberg, Indonesia | 228–700 (403) | 1.4–88.0 | 0.625–1.47 | - | 1 | [121] |
| Sadaigoumen, China | 211–510 (122) | 1.2–50.6 | - | 10–600 (8) | 3 | [122] |
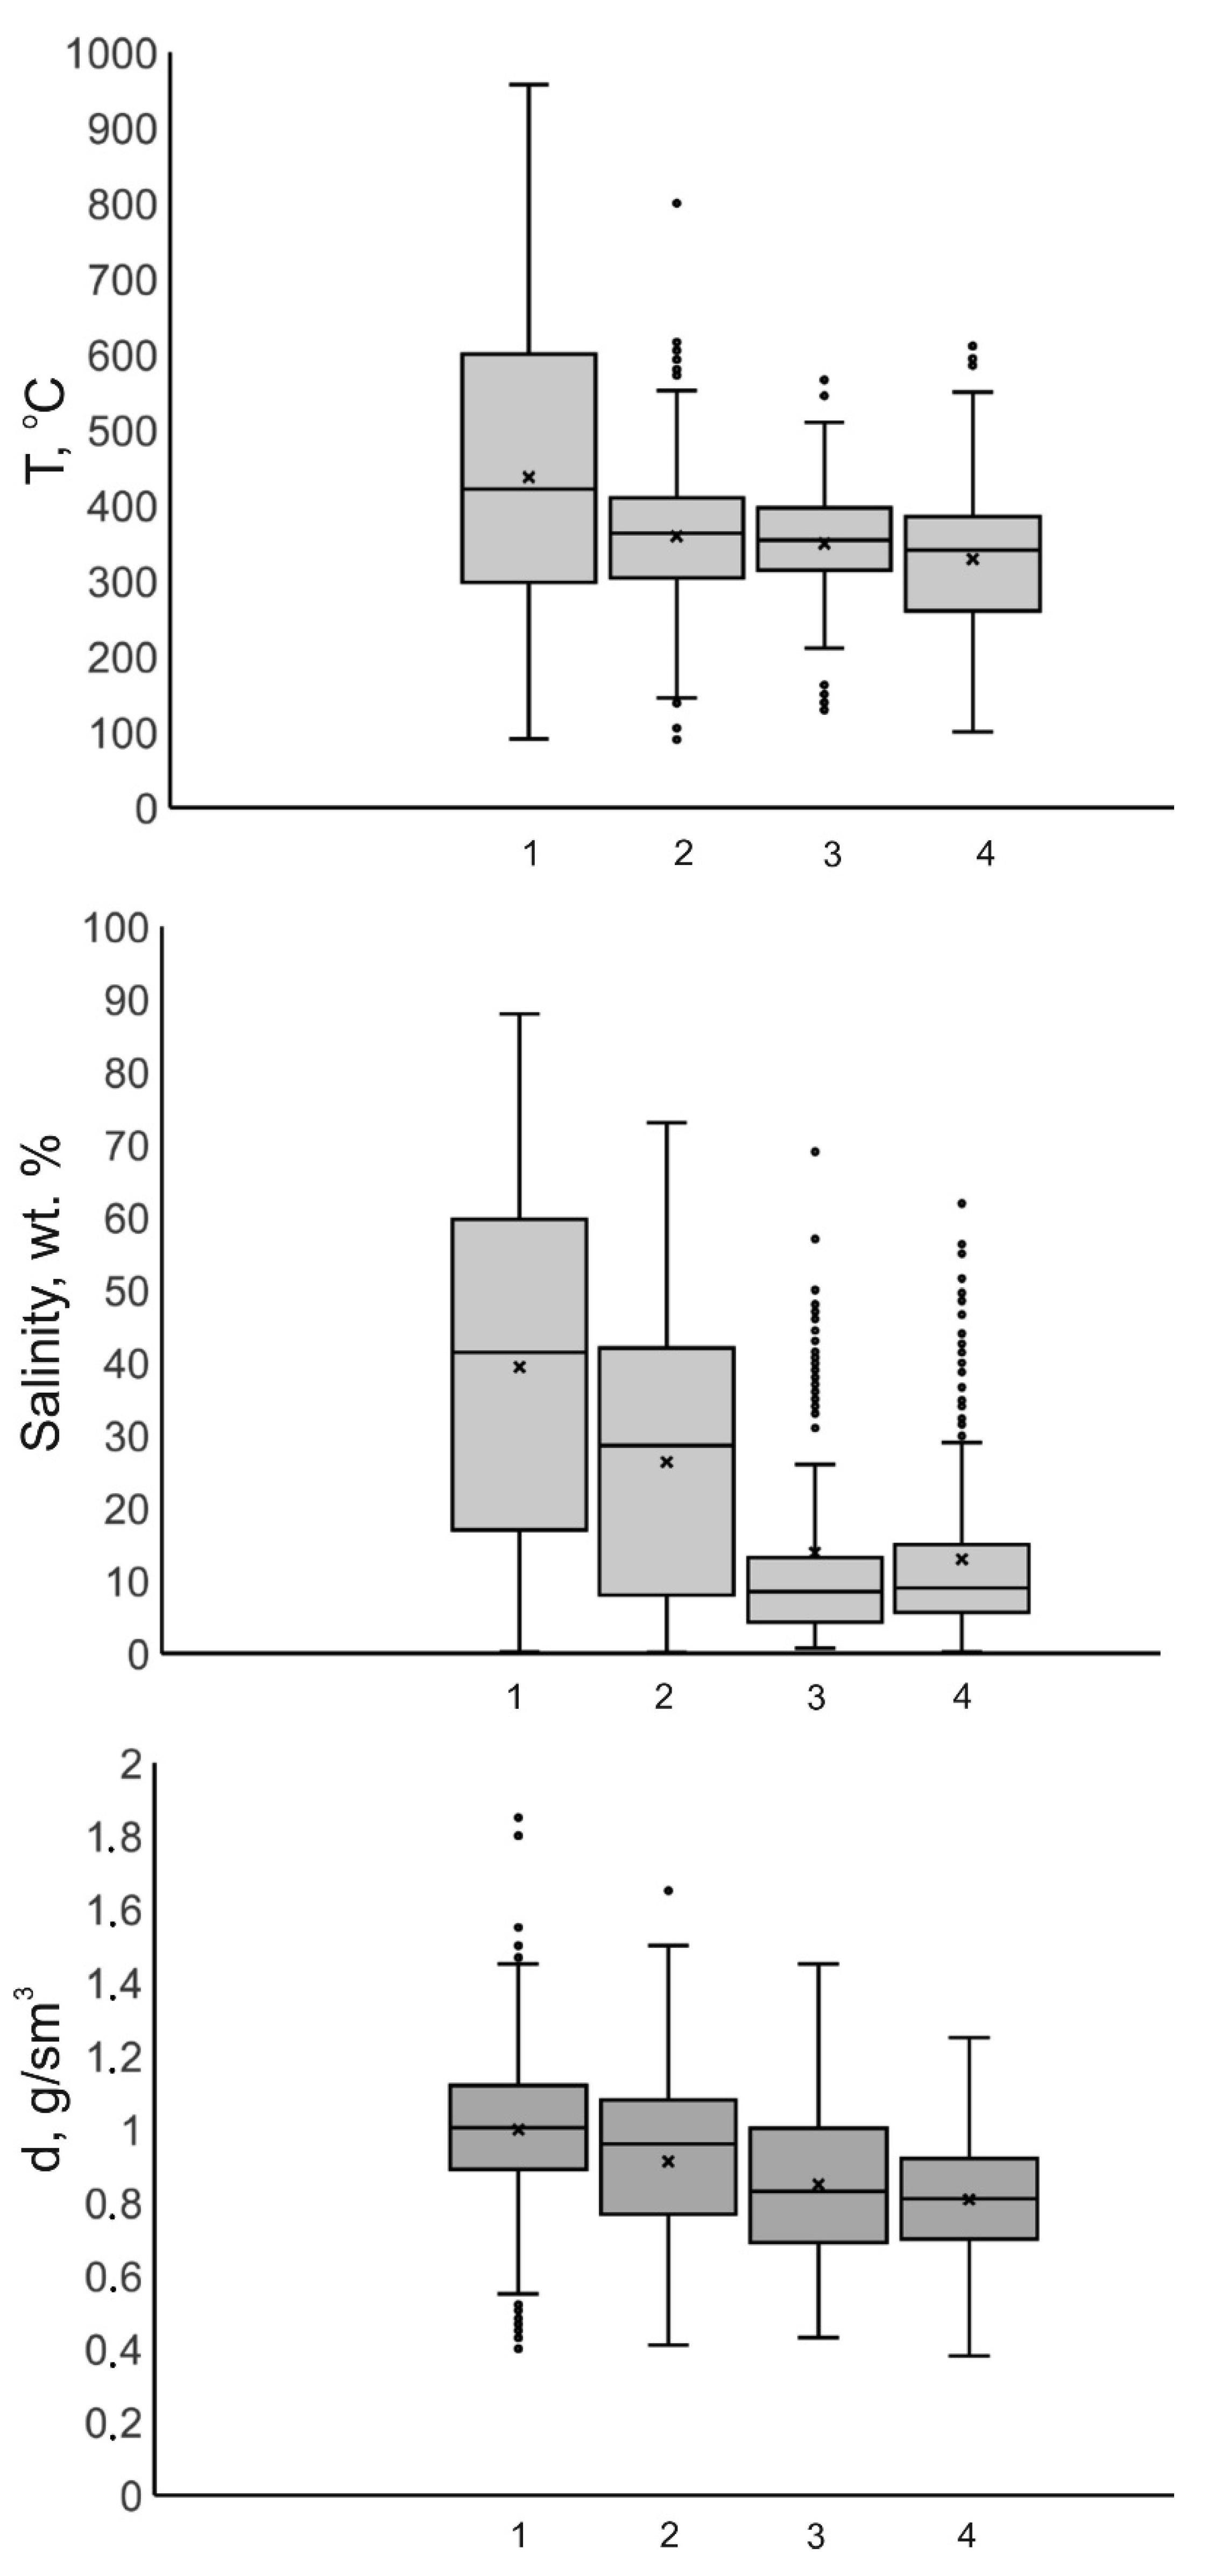
| Types * of Deposits | n | Temperature, °C | Salinity, wt. % | Density of Fluid, g/cm3 | ||||||
|---|---|---|---|---|---|---|---|---|---|---|
| Interval | Average Arithmetic | Average Geometric | Interval | Average Arithmetic | Average Geometric | Interval | Average Arithmetic | Average Geometric | ||
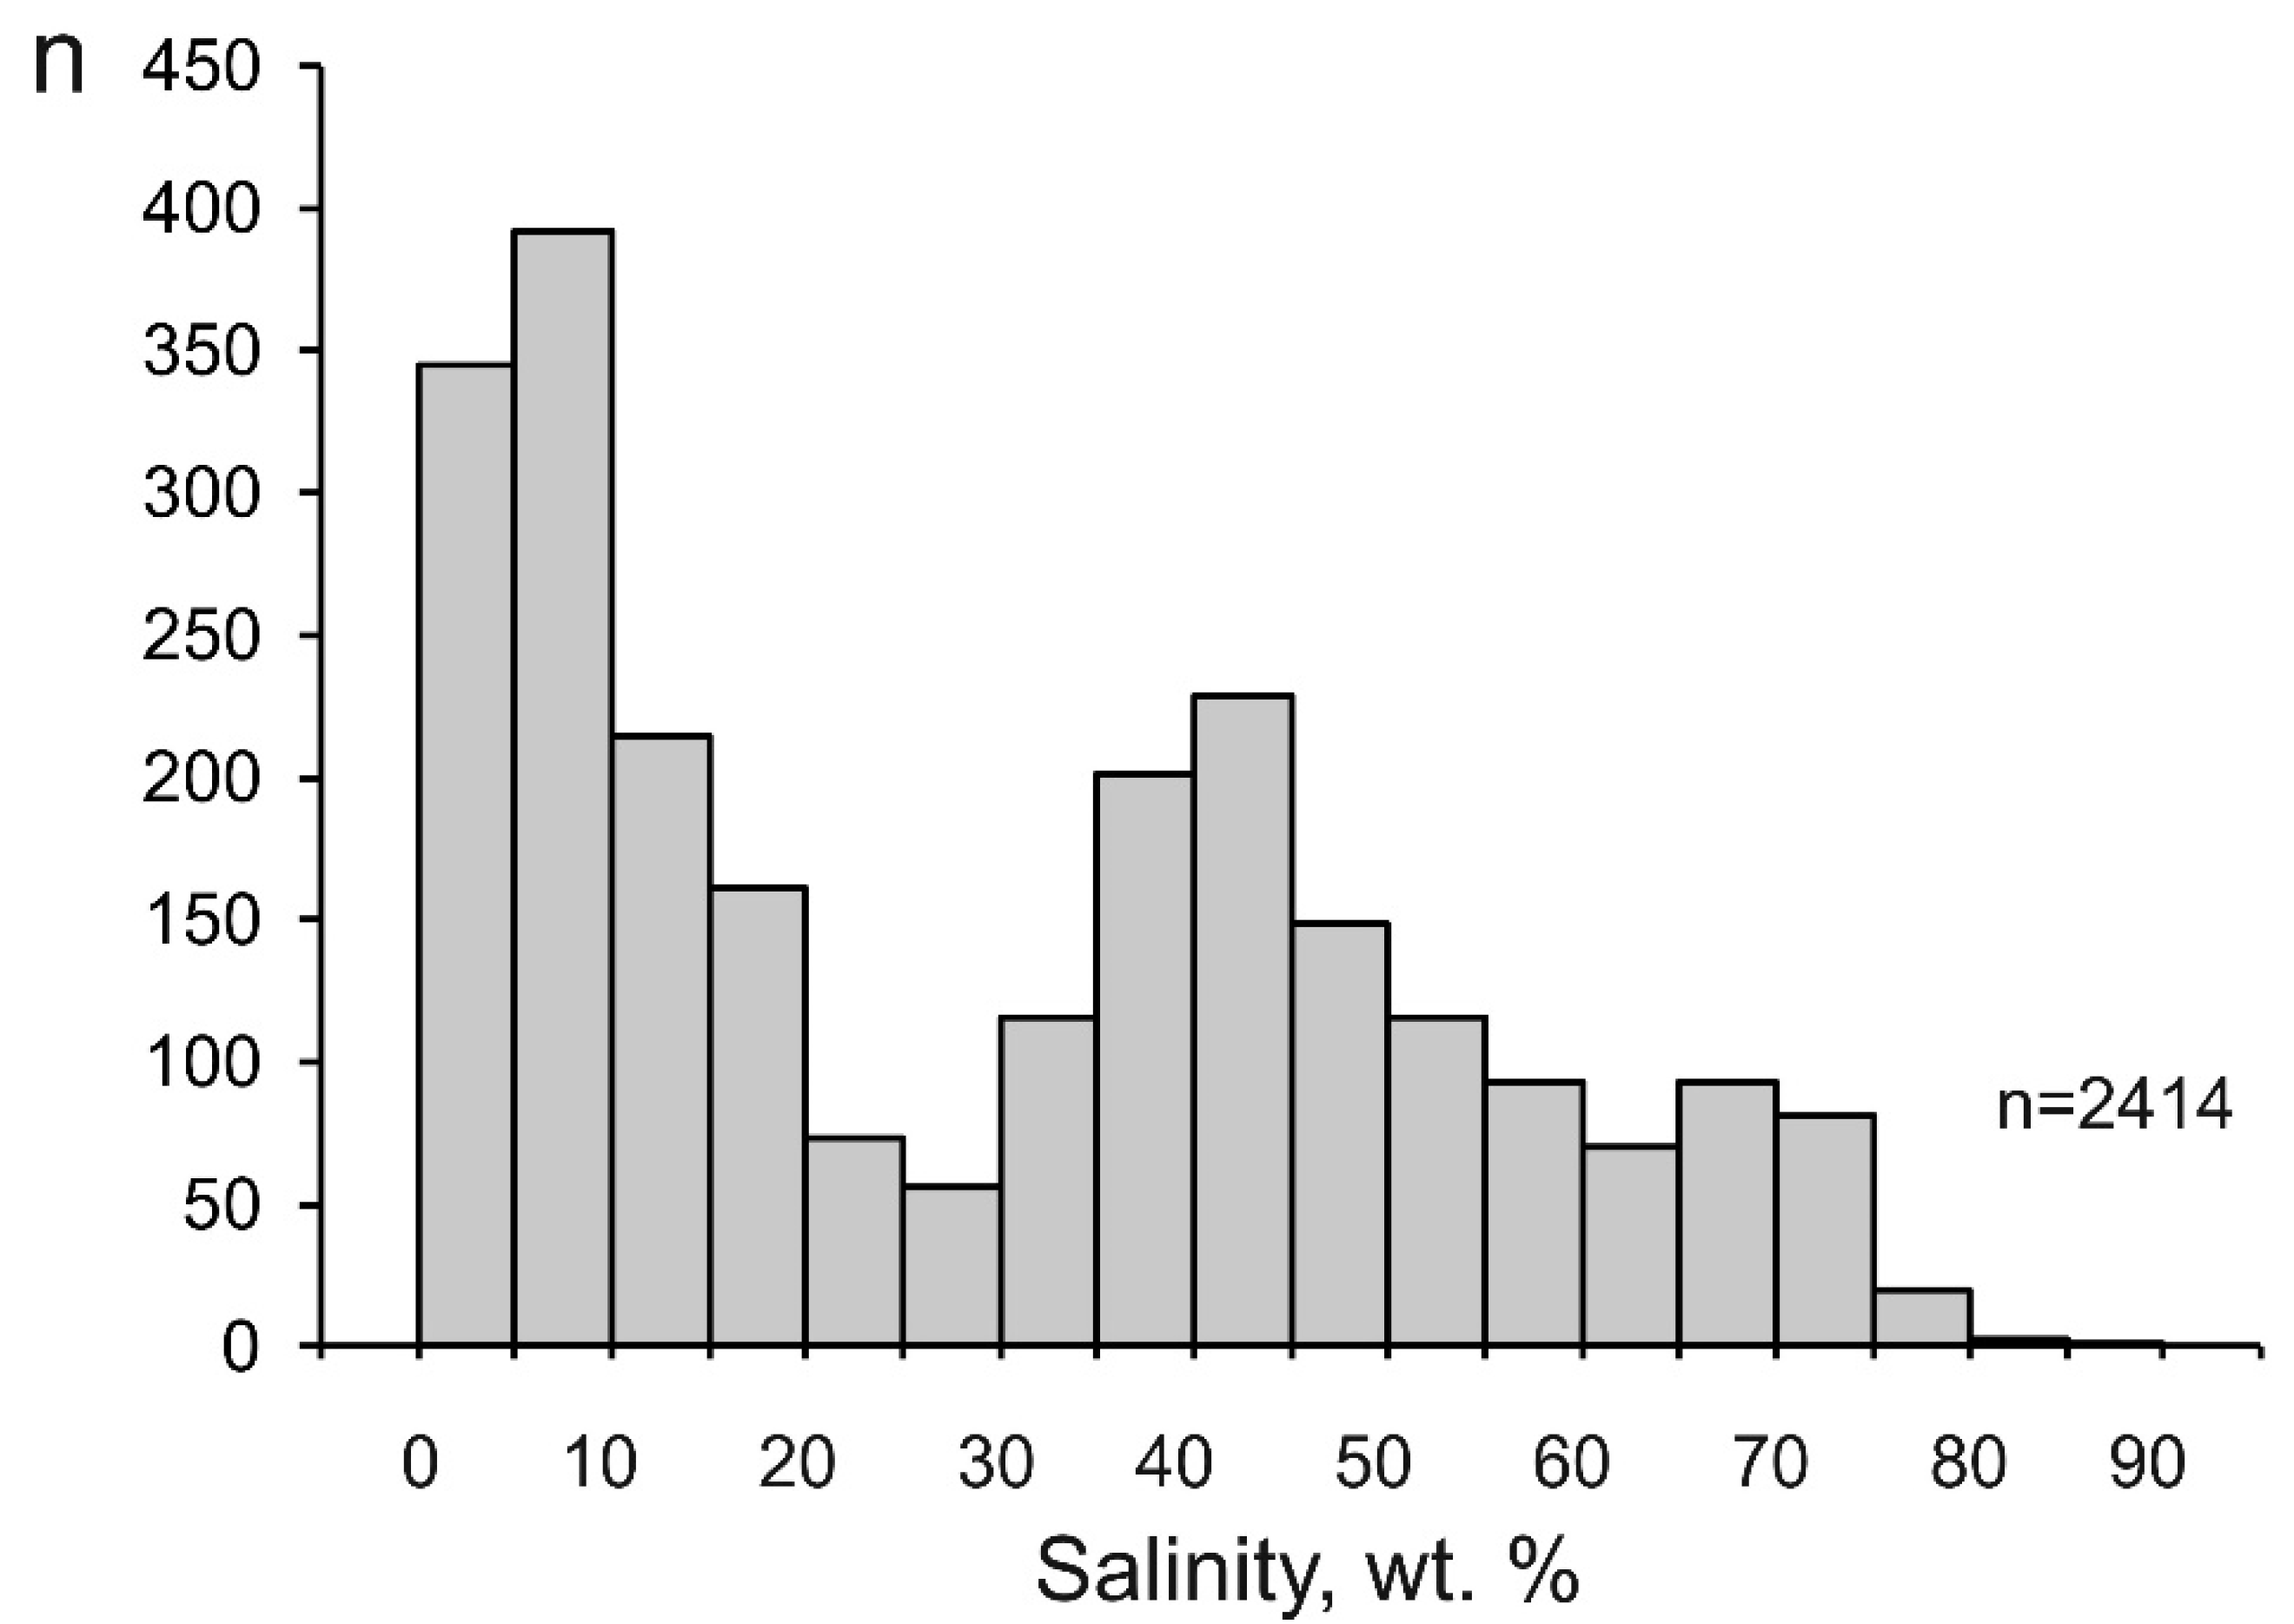
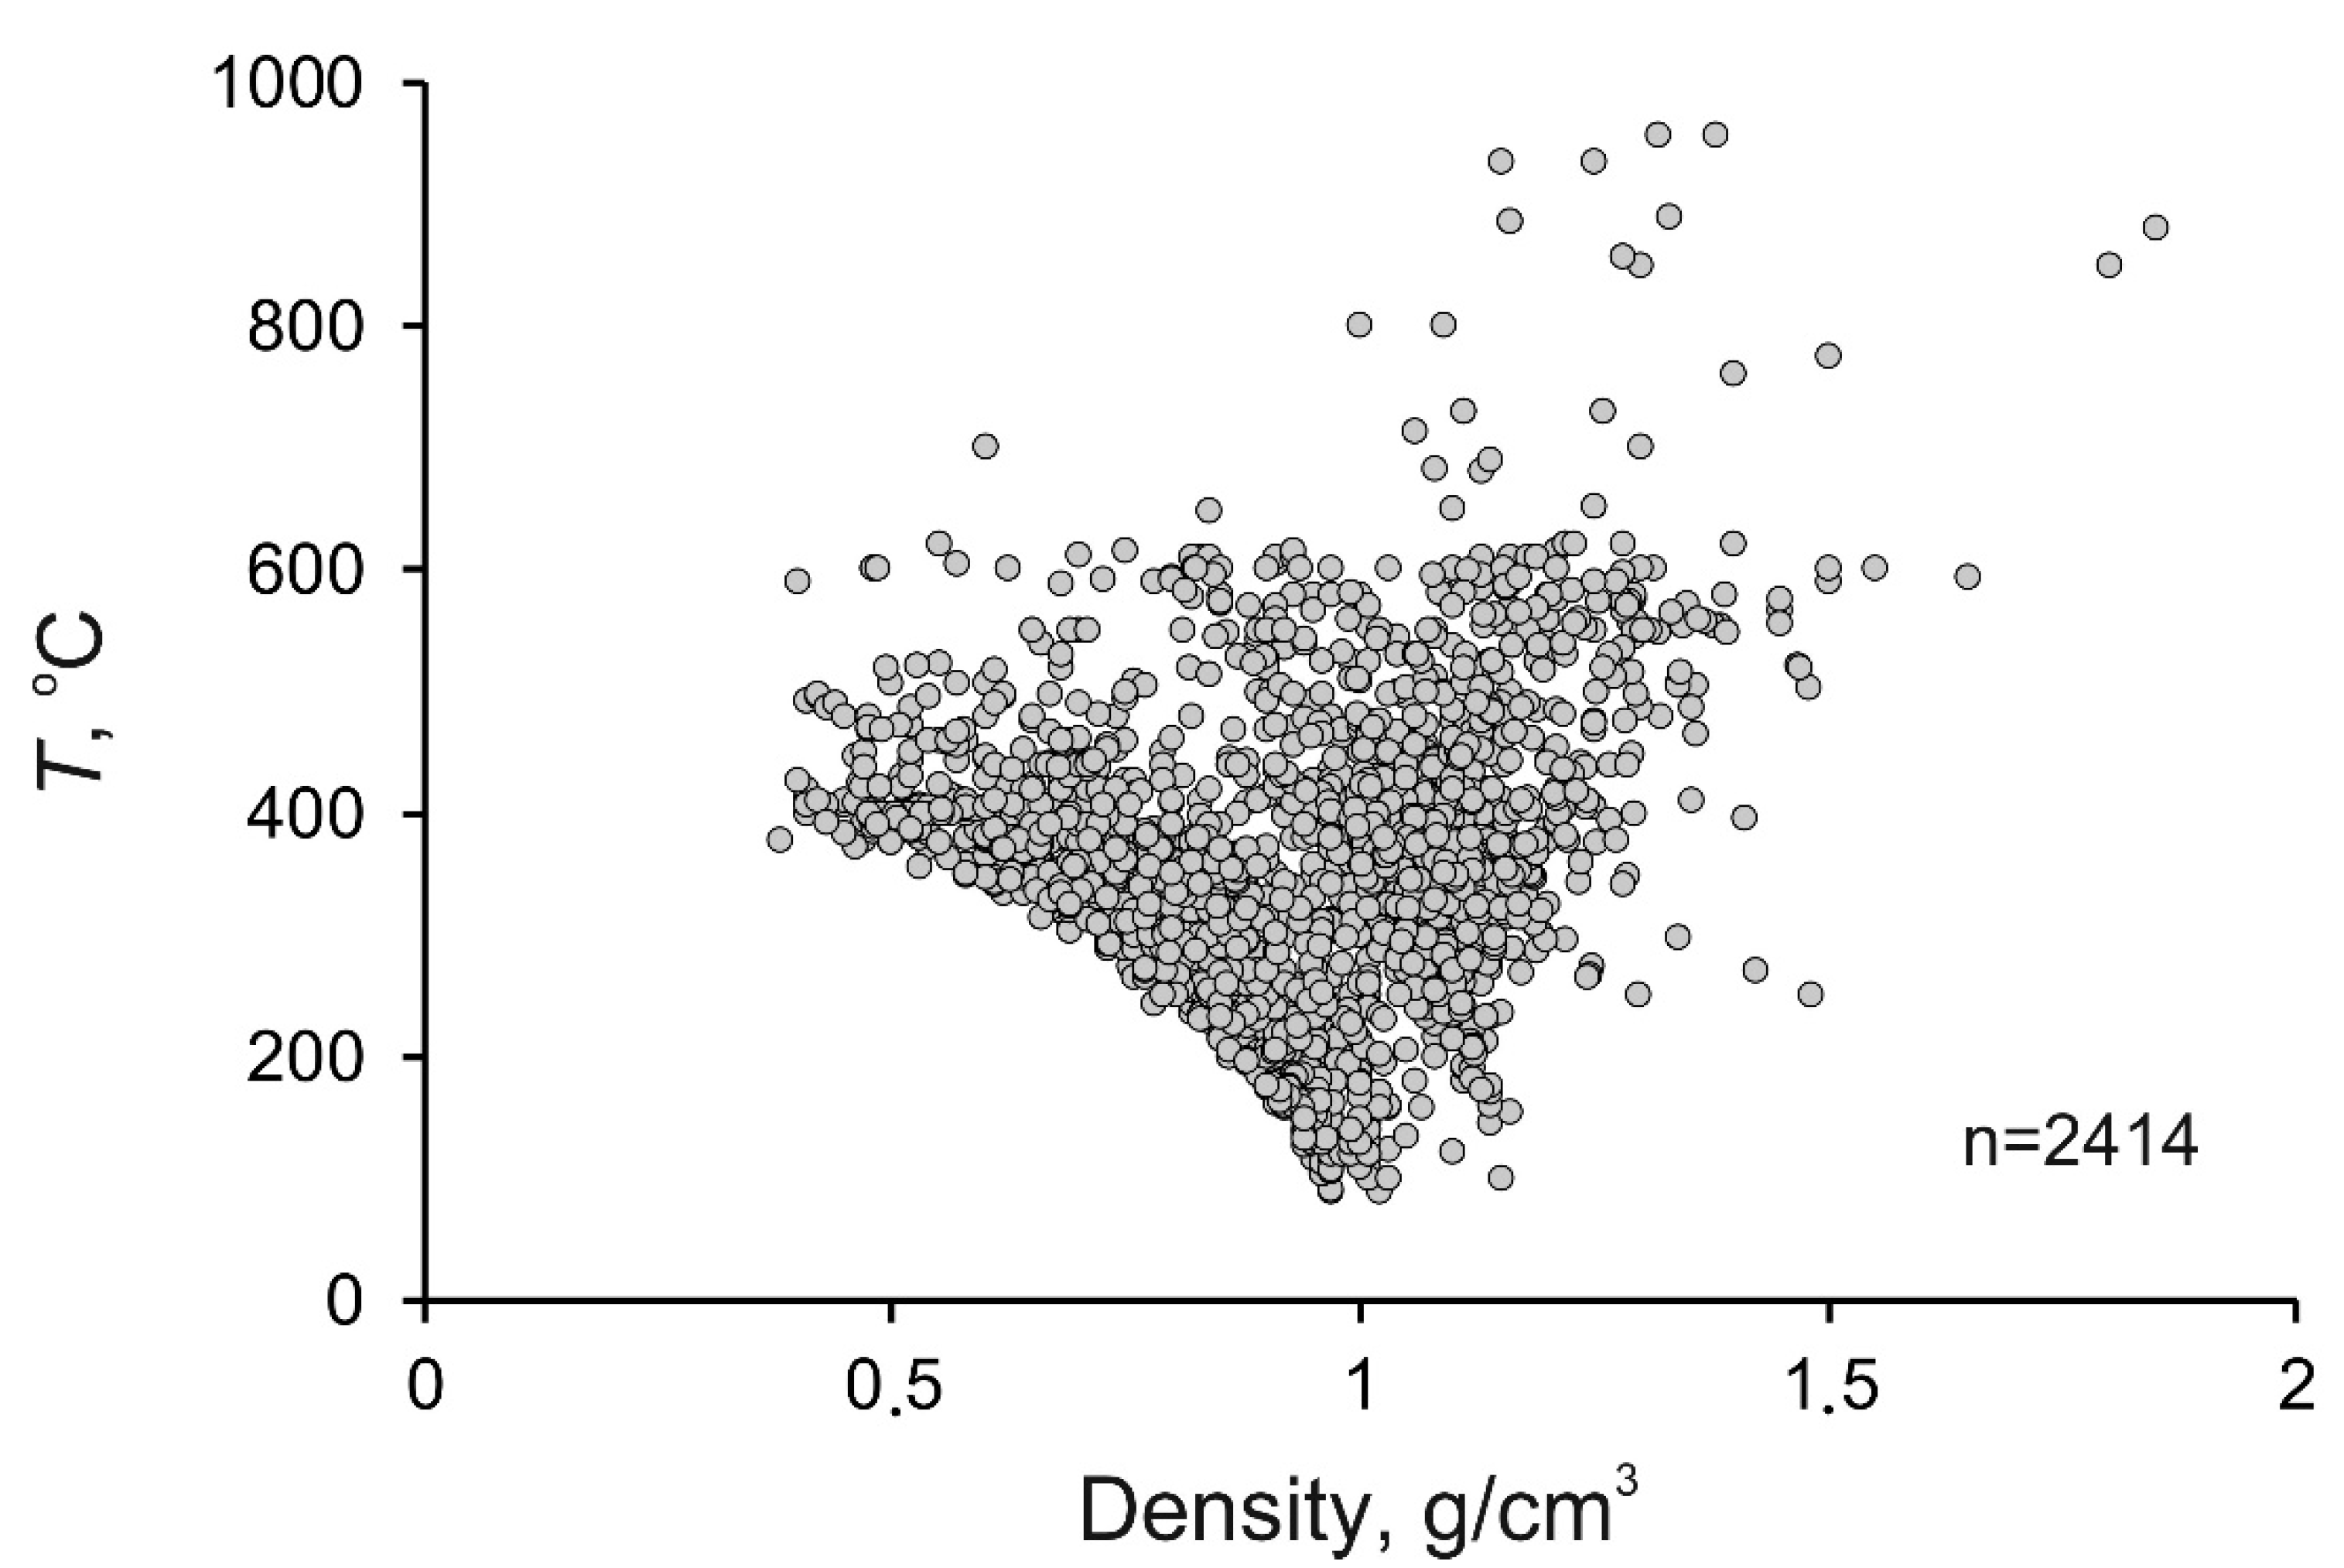
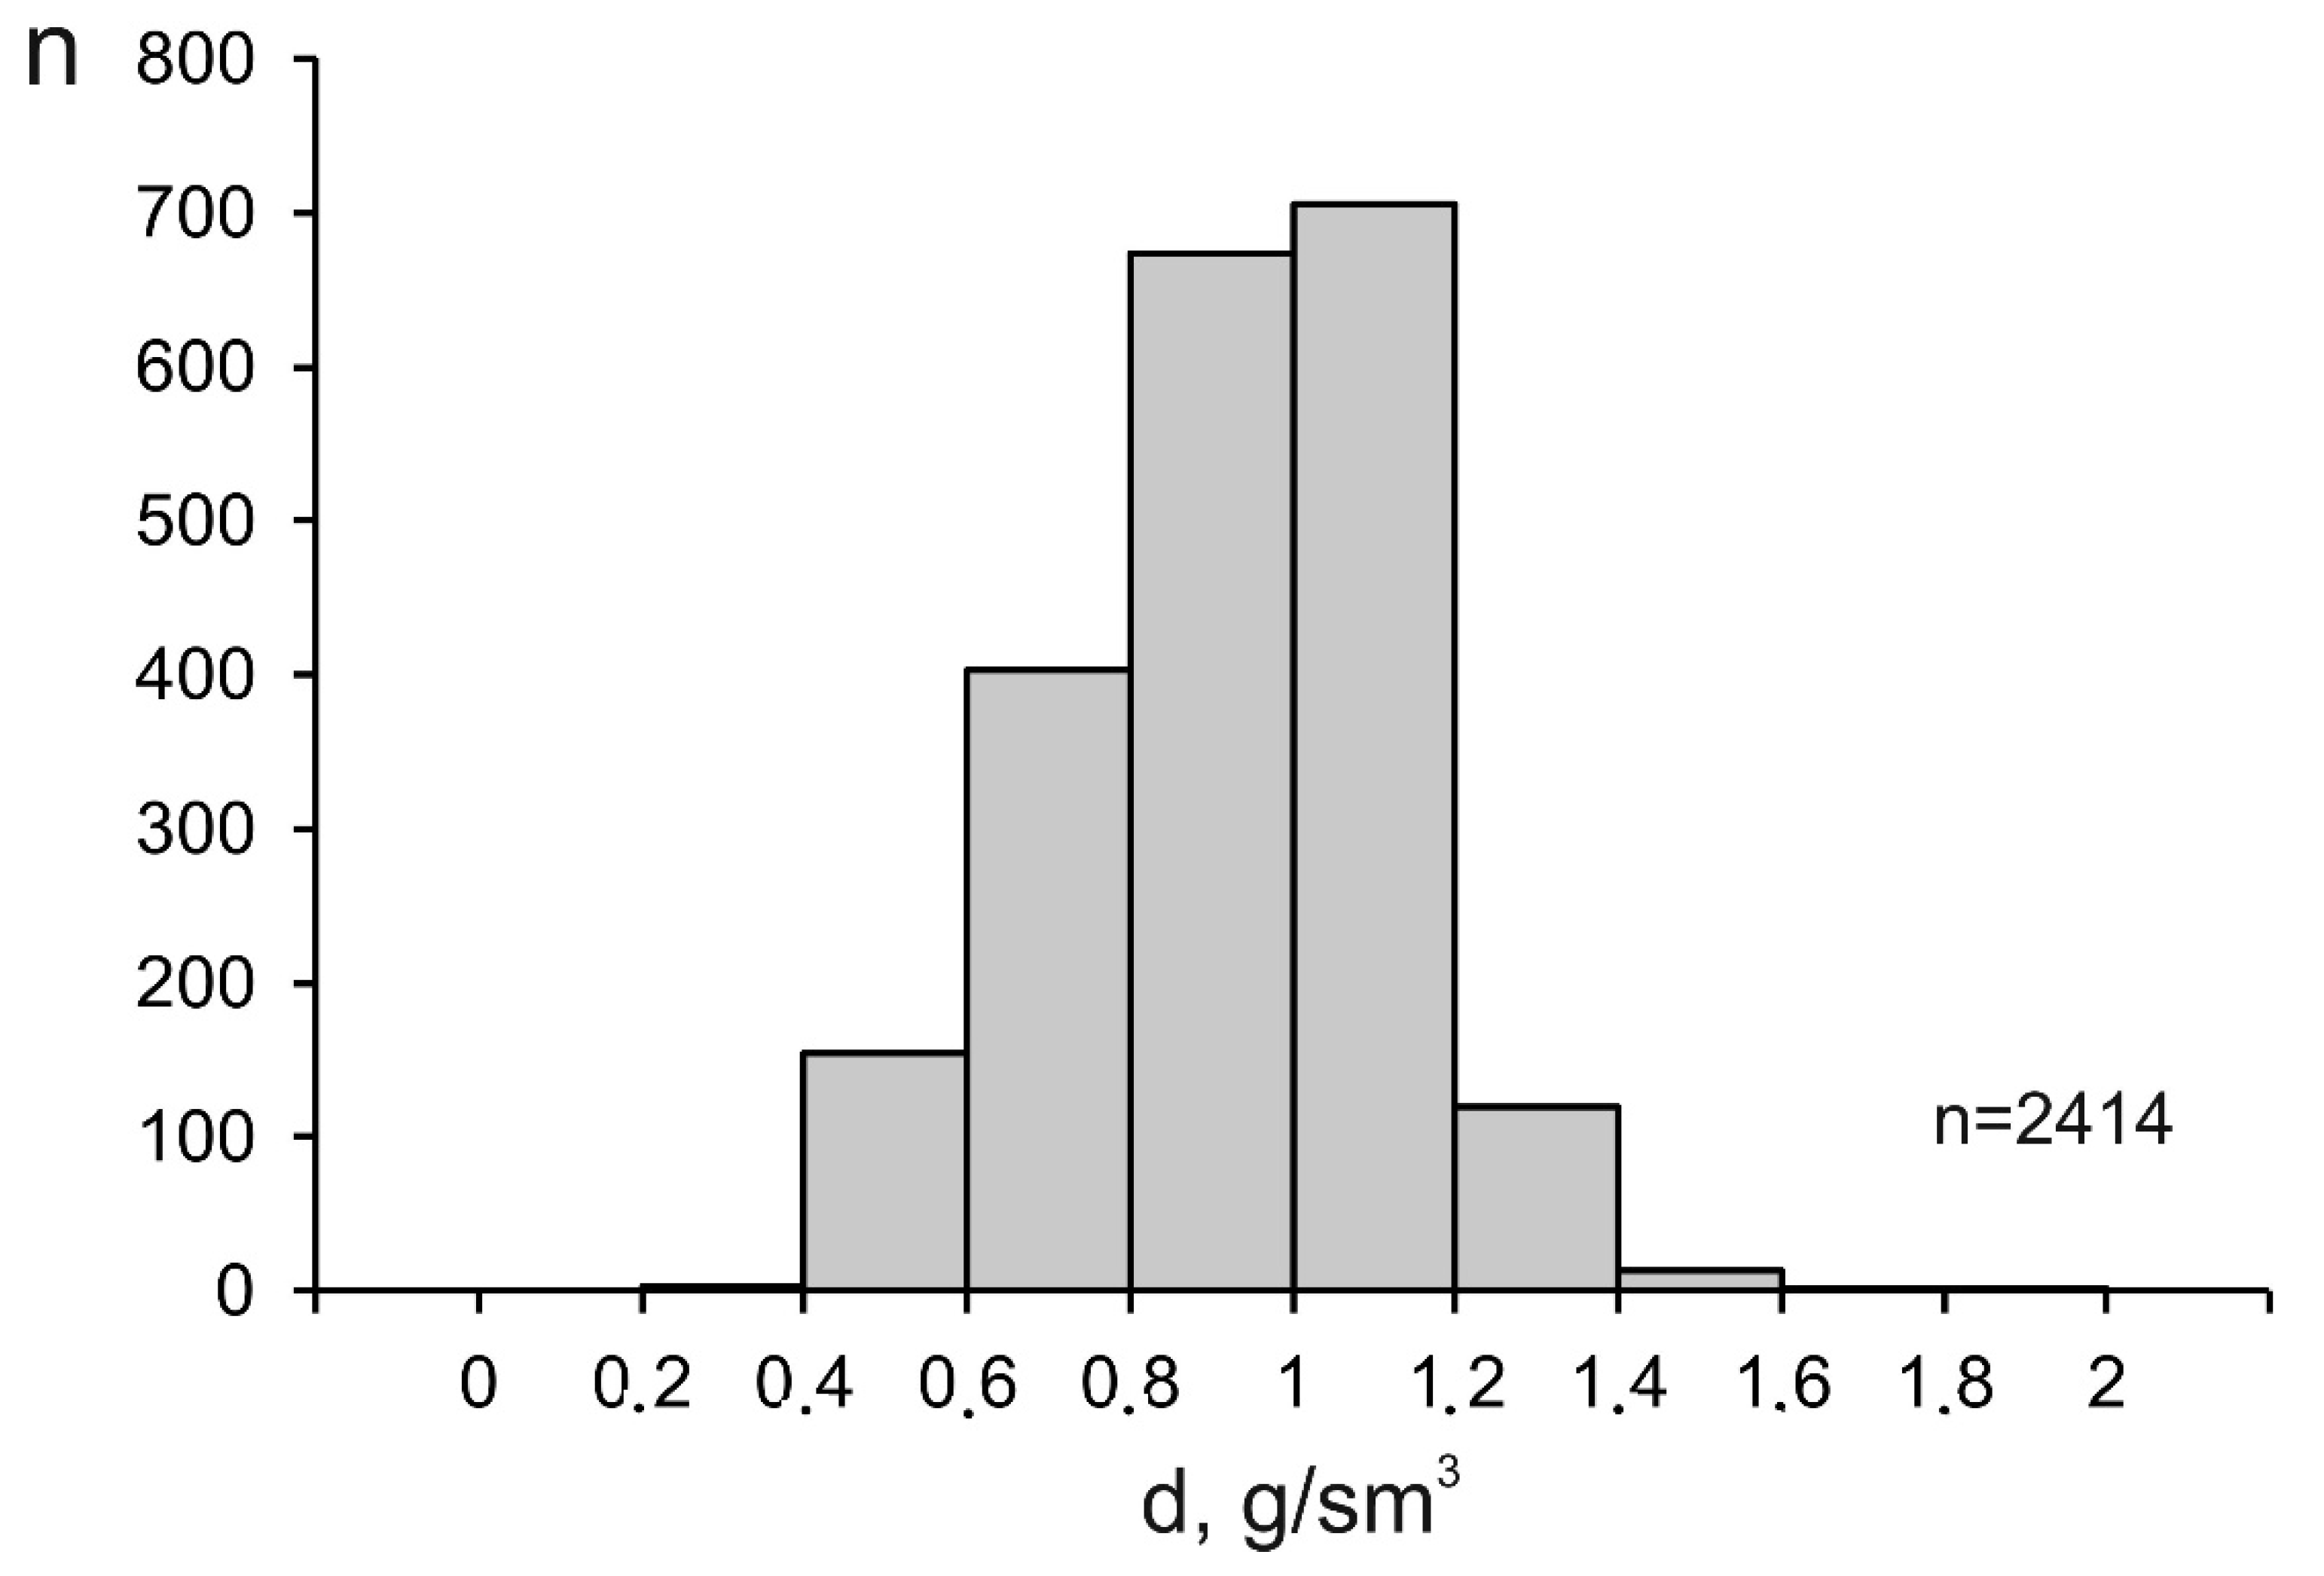
| All | 2414 | 90–957 | 388 | 372 | 0.1-88.0 | 29.4 | 28.2 | 0.38–1.85 | 0.93 | 0.95 |
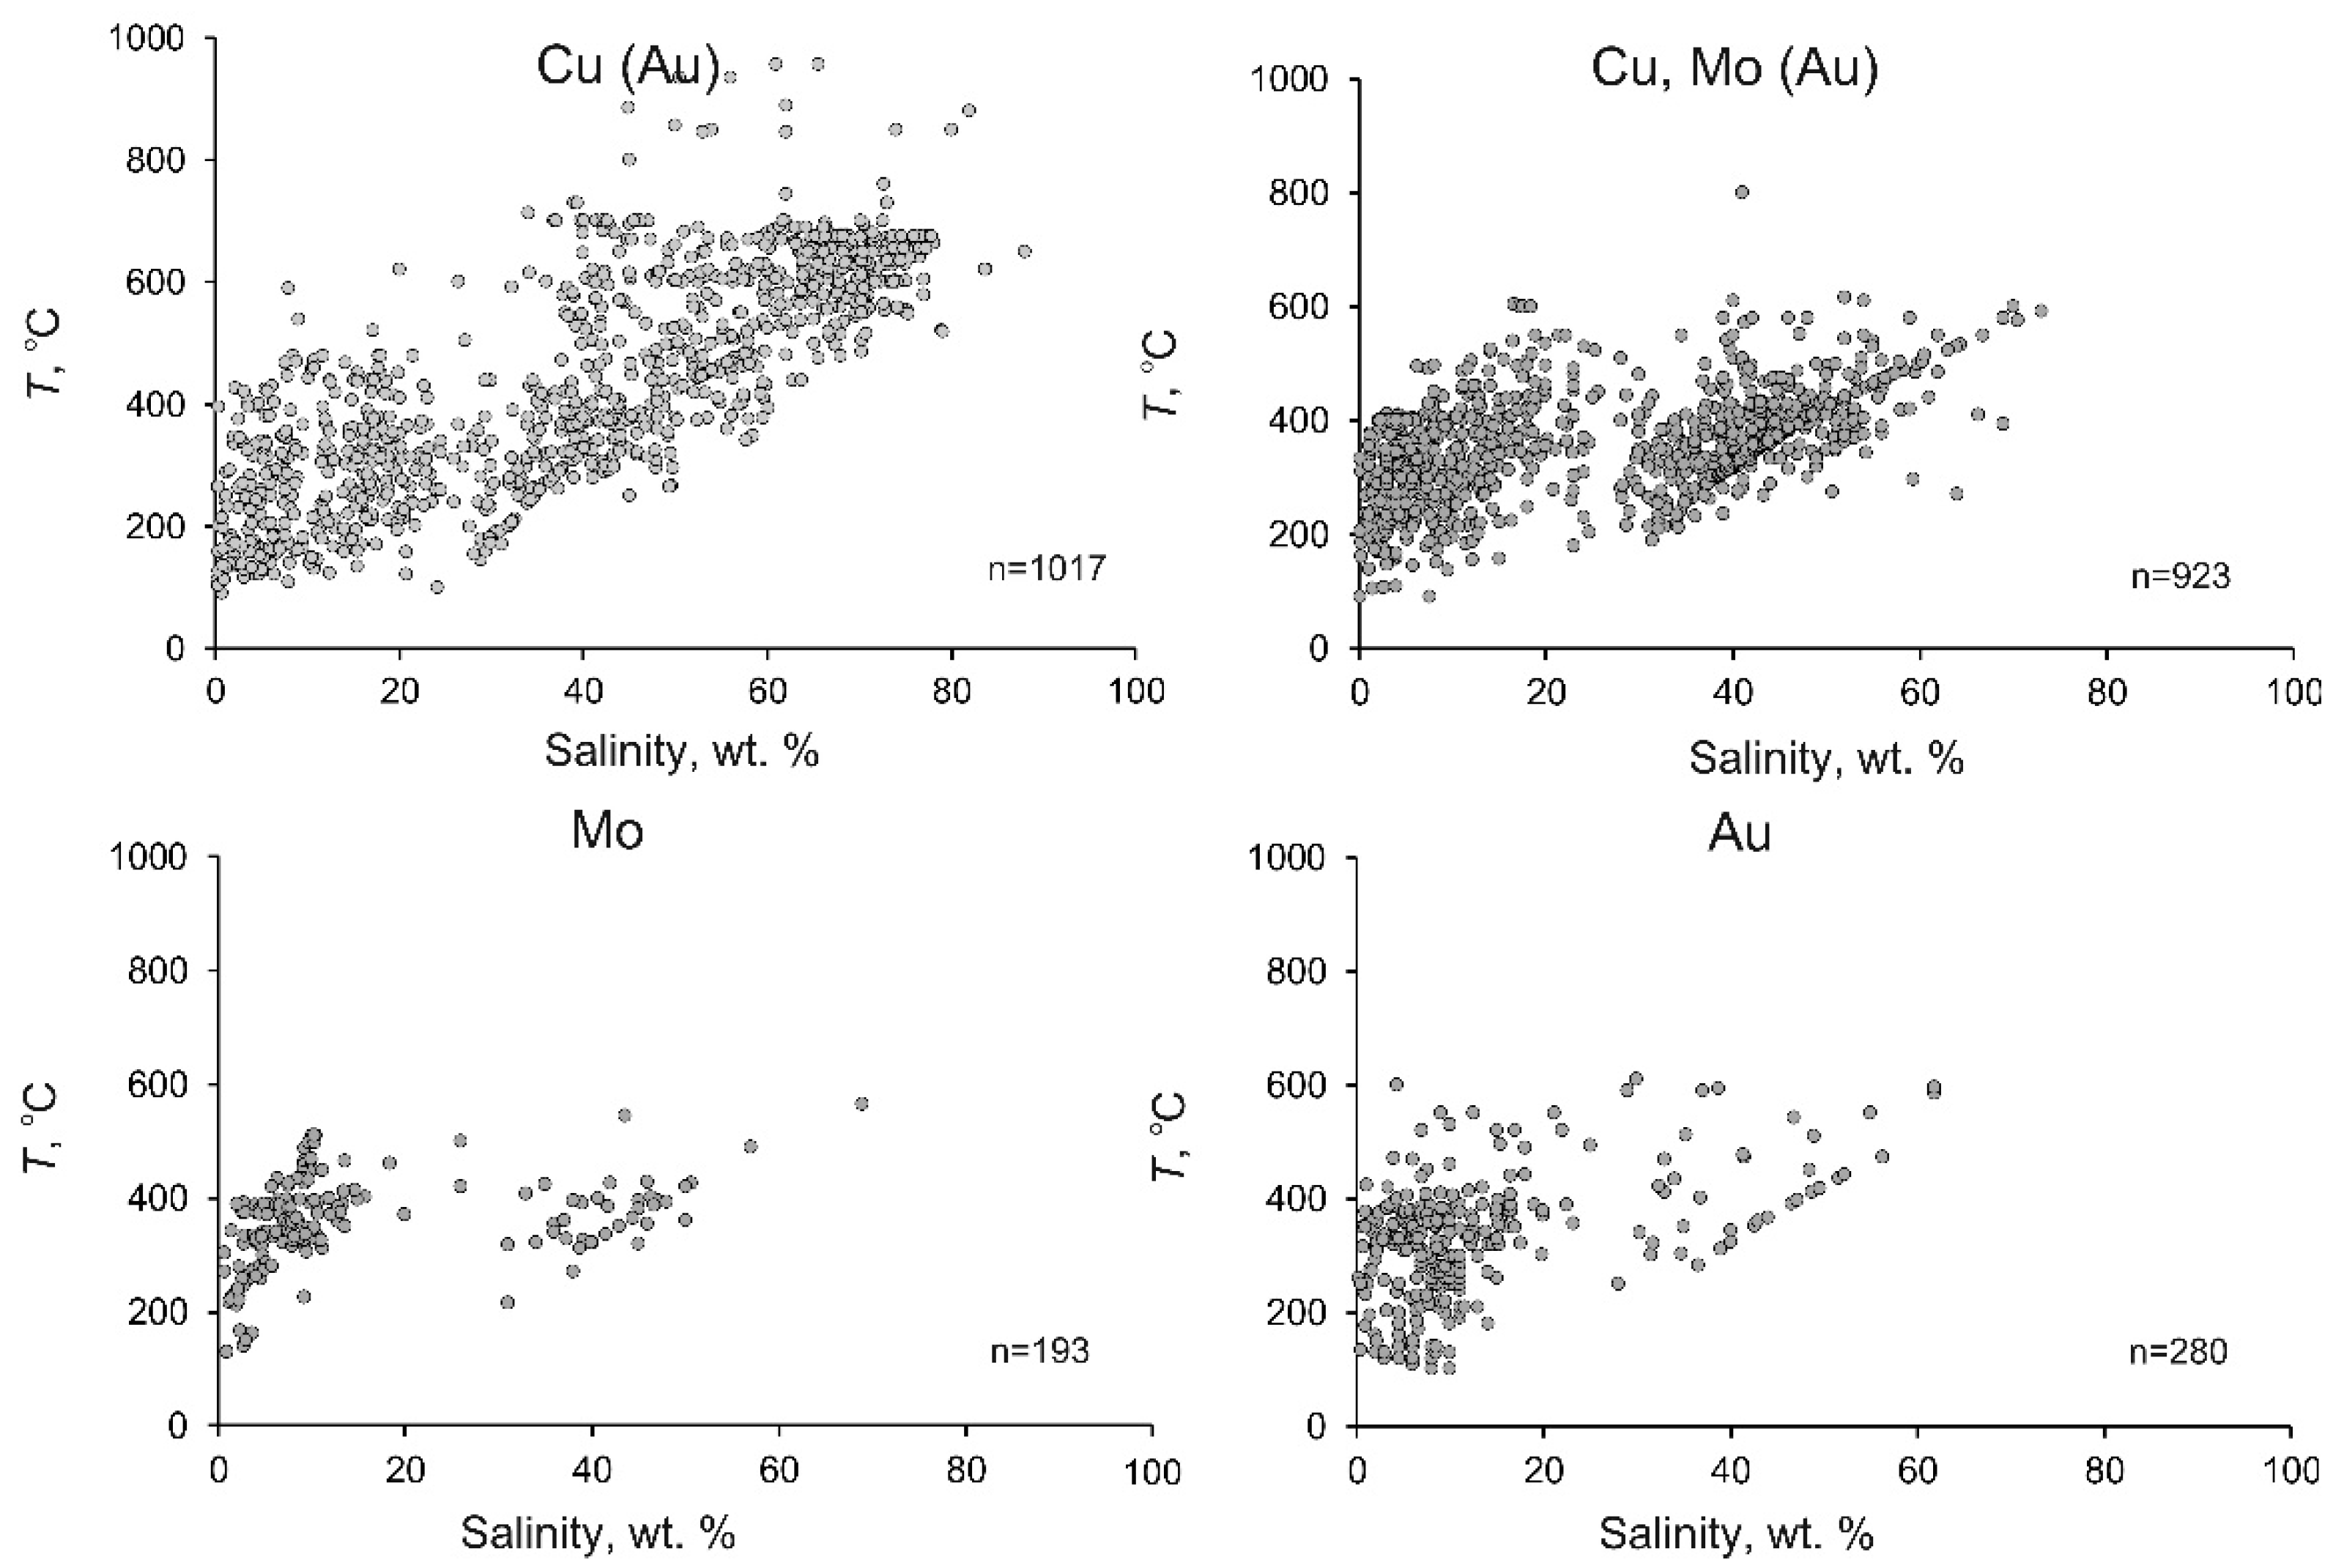
| 1 | 1017 | 91–957 | 437 | 421 | 0.2-88.0 | 39.4 | 41.4 | 0.40–1.85 | 1.00 | 1.00 |
| 2 | 923 | 90–800 | 359 | 363 | 0.1-73.0 | 26.3 | 28.6 | 0.41–1.65 | 0.91 | 0.96 |
| 3 | 193 | 129–566 | 349 | 354 | 0.7-69.0 | 13.8 | 8.5 | 0.43–1.45 | 0.85 | 0.83 |
| 4 | 280 | 100–611 | 329 | 341 | 0.2-61.9 | 13.0 | 9.0 | 0.38–1.25 | 0.81 | 0.81 |
| Element | Number of Determinations | Concentration (from–to) | Average | Types ** of Deposits | |
|---|---|---|---|---|---|
| Arithmetic | Geometric | ||||
| Cl | 152 | 1200–941,000 | 218,849 | 74,010 | 1, 2, 3, 4 |
| S | 191 | 200–66,300 | 9488 | 6930 | 1, 2, 3 |
| Na | 760 | 562–350,000 | 63,957 | 37,400 | 1, 2, 3, 4 |
| K | 779 | 200–267,000 | 49,791 | 29,590 | 1, 2, 3, 4 |
| Ca | 254 | 20–150,000 | 13,214 | 7065 | 1, 2, 3, 4 |
| Mg | 220 | 5.4–152,000 | 5197 | 468 | 1, 2, 3, 4 |
| Cu | 696 | 0.77–95,680 | 4303 | 1900 | 1, 2, 3, 4 |
| Fe | 709 | 20–383,614 | 48,321 | 26,500 | 1, 2, 3, 4 |
| Zn | 538 | 12–21,400 | 2569 | 1700 | 1, 2, 3, 4 |
| Mo | 470 | 1.7–6400 | 219 | 50 | 1, 2, 3, 4 |
| W | 269 | 1.0–3829 | 172 | 26 | 1, 2, 3, 4 |
| Sn | 174 | 0.09–2200 | 266 | 25.6 | 1, 2, 3 |
| Pb | 600 | 3–55,000 | 1609 | 578 | 1, 2, 3, 4 |
| Au | 181 | 0.07–107.8 | 3.65 | 1.0 | 1, 2, 3 |
| Ag | 224 | 1.0–3370 | 62.7 | 19.5 | 1, 2, 3, 4 |
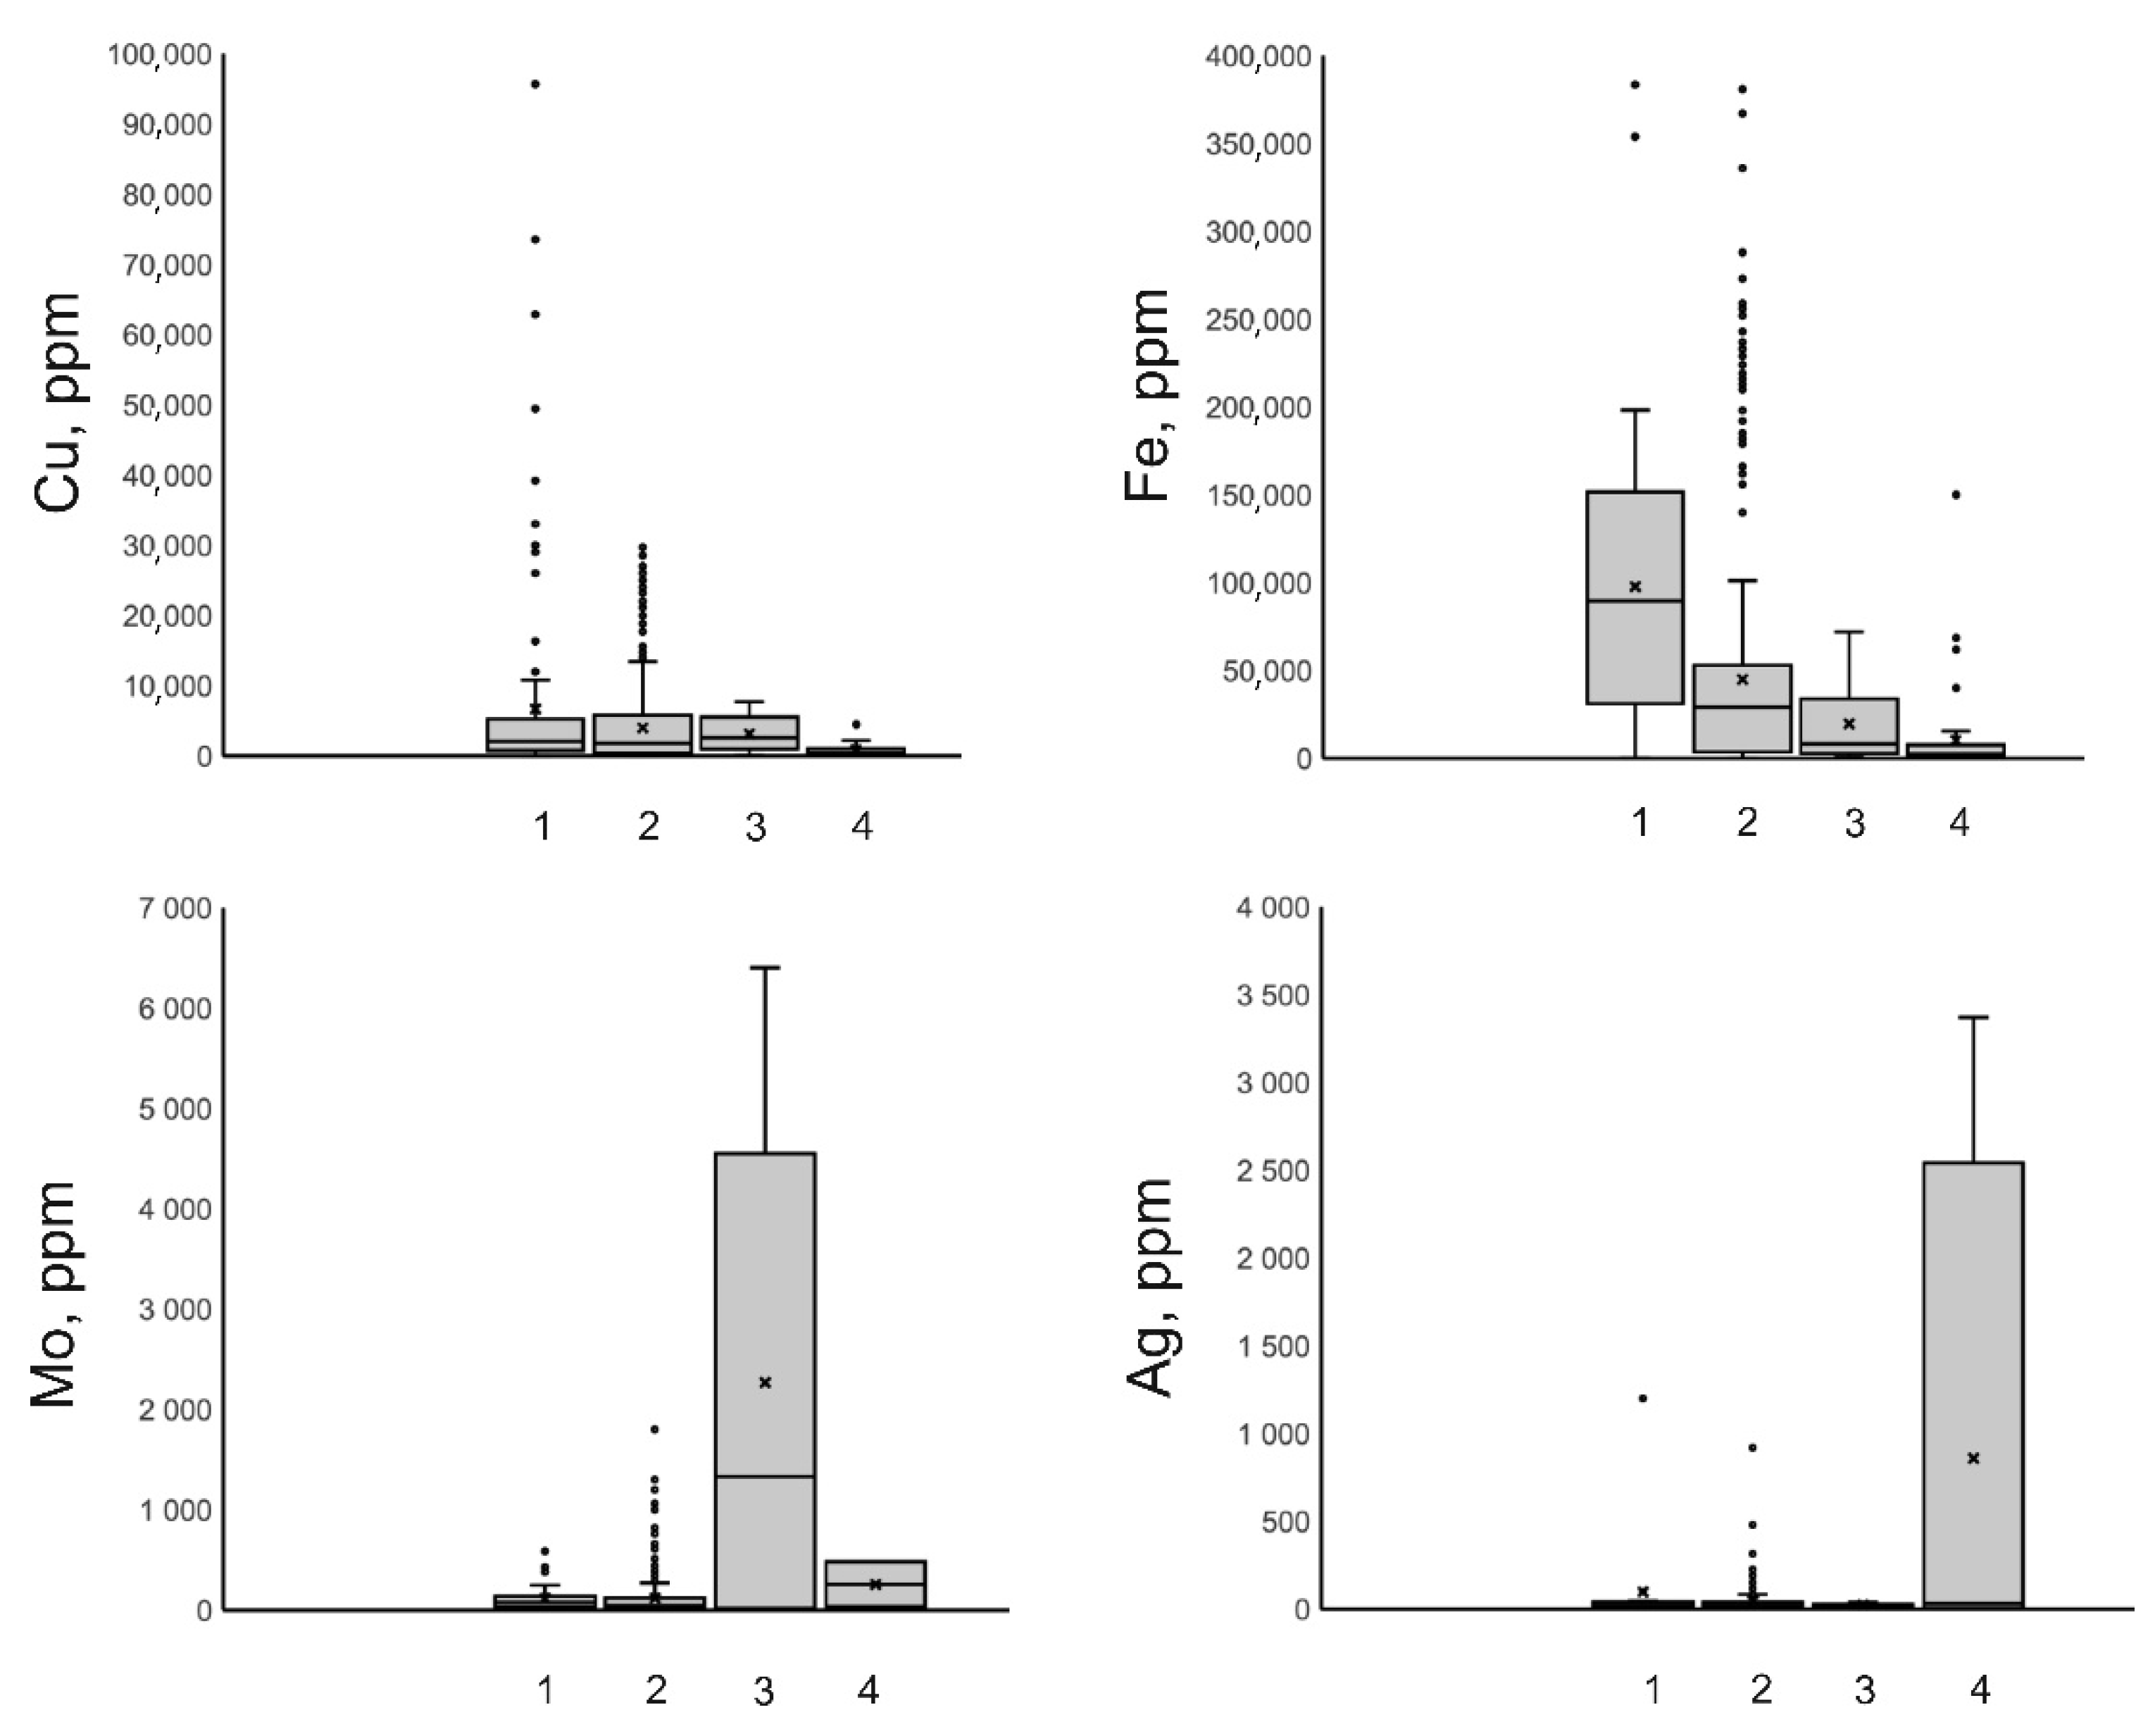
| Element | Number of Determinations | Concentration (from–to) | Average | Types ** of Deposits | |
|---|---|---|---|---|---|
| Arithmetic | Geometric | ||||
| Cl | 9 | 9500–464,000 | 198,566 | 215,560 | 1 Cu (Au) |
| Cl | 56 | 10412–941,000 | 440,686 | 452,500 | 2 Cu, Mo (Au) |
| Cl | 11 | 190000–390,000 | 303,636 | 280,000 | 3 Mo |
| Cl | 76 | 1200–375,000 | 45,520 | 31,000 | 4 Au |
| S | 10 | 1618–36,648 | 11,382 | 5671 | 1 Cu (Au) |
| S | 171 | 200–66,300 | 9633 | 7100 | 2 Cu, Mo (Au) |
| S | 10 | 2640–7260 | 5115 | 5115 | 3 Mo |
| Cu | 114 | 1–95,680 | 6659 | 2045.5 | 1 Cu (Au) |
| Cu | 521 | 0.77–29,680 | 3983 | 1800 | 2 Cu, Mo (Au) |
| Cu | 47 | 58–7700 | 3160 | 2600 | 3 Mo |
| Cu | 14 | 51–4480 | 876 | 410 | 4 Au |
| Fe | 103 | 195–383,614 | 97,807 | 89,600 | 1 Cu (Au) |
| Fe | 507 | 101.4–381,000 | 44,866 | 29,000 | 2 Cu, Mo (Au) |
| Fe | 45 | 630–72,000 | 19,663 | 8200 | 3 Mo |
| Fe | 54 | 20–150,000 | 10,254 | 2400 | 4 Au |
| Mo | 70 | 2–600 | 117 | 77.5 | 1 Cu (Au) |
| Mo | 376 | 1.7–1800 | 118 | 42 | 2 Cu, Mo (Au) |
| Mo | 22 | 1.78–6400 | 2267 | 1330 | 3 Mo |
| Mo | 2 | 32–480 | 256 | 256 | 4 Au |
| W | 17 | 1–160 | 47.9 | 22 | 1 Cu (Au) |
| W | 228 | 2–1900 | 68.4 | 25 | 2 Cu, Mo (Au) |
| W | 21 | 6–3829 | 1420 | 183 | 3 Mo |
| W | 2 | 62–77 | 69.5 | 69.5 | 4 Au |
| Sn | 9 | 0.09–1400 | 529 | 570 | 1 Cu (Au) |
| Sn | 146 | 0.85–2200 | 264 | 150 | 2 Cu, Mo (Au) |
| Sn | 19 | 15–398 | 160 | 76 | 3 Mo |
| Pb | 109 | 40–15,000 | 2621 | 2566 | 1 Cu (Au) |
| Pb | 454 | 3–55,000 | 1412 | 455 | 2 Cu, Mo (Au) |
| Pb | 21 | 224–3532 | 1464 | 1099 | 3 Mo |
| Pb | 16 | 21–2740 | 479 | 155 | 4 Au |
| Zn | 49 | 49.4–18,300 | 5317 | 4800 | 1 Cu (Au) |
| Zn | 391 | 12–16,000 | 2271 | 1700 | 2 Cu, Mo (Au) |
| Zn | 47 | 57.6–15,000 | 3014 | 1214 | 3 Mo |
| Zn | 51 | 46–21,400 | 1807 | 960 | 4 Au |
| Au | 10 | 0.3–10.2 | 1.7 | 0.8 | 1 Cu (Au) |
| Au | 168 | 0.07–107.8 | 3.8 | 1.1 | 2 Cu, Mo (Au) |
| Au | 3 | 0.1–0.2 | 0.1 | 0.1 | 3 Mo |
| Ag | 16 | 3–1200 | 98 | 20 | 1 Cu (Au) |
| Ag | 193 | 1–919 | 45.5 | 19 | 2 Cu, Mo (Au) |
| Ag | 11 | 11–38 | 22.9 | 22 | 3 Mo |
| Ag | 4 | 2.2–3370 | 858 | 30.8 | 4 Au |
Publisher’s Note: MDPI stays neutral with regard to jurisdictional claims in published maps and institutional affiliations. |
© 2022 by the authors. Licensee MDPI, Basel, Switzerland. This article is an open access article distributed under the terms and conditions of the Creative Commons Attribution (CC BY) license (https://creativecommons.org/licenses/by/4.0/).
Share and Cite
Prokofiev, V.Y.; Naumov, V.B. Ranges of Physical Parameters and Geochemical Features of Mineralizing Fluids at Porphyry Deposits of Various Types of the Cu−Mo−Au System: Evidence from Fluid Inclusions Data. Minerals 2022, 12, 529. https://0-doi-org.brum.beds.ac.uk/10.3390/min12050529
Prokofiev VY, Naumov VB. Ranges of Physical Parameters and Geochemical Features of Mineralizing Fluids at Porphyry Deposits of Various Types of the Cu−Mo−Au System: Evidence from Fluid Inclusions Data. Minerals. 2022; 12(5):529. https://0-doi-org.brum.beds.ac.uk/10.3390/min12050529
Chicago/Turabian StyleProkofiev, Vsevolod Yu., and Vladimir B. Naumov. 2022. "Ranges of Physical Parameters and Geochemical Features of Mineralizing Fluids at Porphyry Deposits of Various Types of the Cu−Mo−Au System: Evidence from Fluid Inclusions Data" Minerals 12, no. 5: 529. https://0-doi-org.brum.beds.ac.uk/10.3390/min12050529