Article

A Chemical Separation and Measuring Technique for Titanium Isotopes for Titanium Ores and Iron-Rich Minerals

1
Department of Geology, Juniata College, Huntingdon, PA 16652, USA
2
Department of Earth and Environmental Sciences, University of Michigan, Ann Arbor, MI 48109, USA
3
Department of Earth and Planetary Sciences, Rutgers University, Piscataway, NJ 08854, USA
4
School of the Environment, Washington State University, Pullman, WA 99164, USA
*
Author to whom correspondence should be addressed.
Submission received: 22 March 2022 / Revised: 30 April 2022 / Accepted: 11 May 2022 / Published: 20 May 2022

Abstract

:
Ti-isotope fractionation on the most Ti-rich minerals on Earth has not been reported. Therefore, we present a chemical preparation and separation technique for Ti-rich minerals for mineralogic, petrologic, and economic geologic studies. A two-stage ion-exchange column procedure modified from the previous literature is used in the current study to separate Ti from Fe-rich samples, while α-TiO2 does not require chemical separation. Purified solutions in conjunction with solution standards were measured on two different instruments with dry plasma and medium-resolution mode providing mass-dependent results with the lowest errors. 49/47TiOL-Ti for the solution and solids analyzed here demonstrate a range of >5 far greater than the whole procedural 1 error of 0.10 for a synthetic compound and 0.07 for the mineral magnetite; thus, the procedure produces results is resolvable within the current range of measured Ti-isotope fractionation in these minerals.

1. Introduction

A significant volume of literature has focused on robust means to separate and measure titanium isotope fractionation in extraterrestrial materials, with studies starting the late 1970s and progressing to today [1,2,3,4,5,6]. Titanium isotopes in these materials have been demonstrated experimentally and directly to span a large range of isotopic space in non-mass-dependent (>98‰ [7,8] and mass-dependent fractionations [4,9,10,11,12]. More recently, these techniques have been used to fingerprint terrestrial processes through the analysis of whole-rock sedimentary, igneous, and metamorphic materials, where the amount of Ti fractionation is significantly less (in the order of 2–3‰) [6,11,13,14,15,16].
The focus of this contribution is to develop a method for Ti ores as a means to apply Ti-isotope geochemistry to Ti-rich minerals. Surprisingly, no comprehensive work exists documenting Ti-isotope compositions for common Ti-bearing rock-forming minerals, such as rutile (α-TiO2), ilmenite ((FeTi)2O3), or (titano)magnetite. From an economic geology perspective, monitoring the Ti-isotope composition of these phases could provide a means to understand the hydrothermal and magmatic processes associated with the concentration of titanium in minerals and the formation of Fe–Ti oxide ore deposits. From a petrological perspective, titanium concentrations in magnetites and the presence/absence of rutile and ilmenite are foundational to ore-deposit and igneous-rock classifications, respectively. These phases are geochemically less diverse than whole rocks and silicate minerals in extraterrestrial materials, and thus pose fewer problems during the chemical purification process, since they lack most of the rock-forming elements that can cause isobaric interference with several of the Ti masses.
Here, we present a combination of the previously established chemical separations of Fe and Ti and apply them to the Ti-rich minerals magnetite, ilmenite, and rutile. The mass-dependent results using 46Ti, 47Ti, and 49Ti represent the quality and reliability of the measurements. The methods for measuring Ti isotopes on a multi-collector ICP-MS are also explored. Thus, the document provides purification and measurement strategies modified from several different sources to apply Ti-isotope geochemistry to Ti-rich ores.

2. Materials and Methods

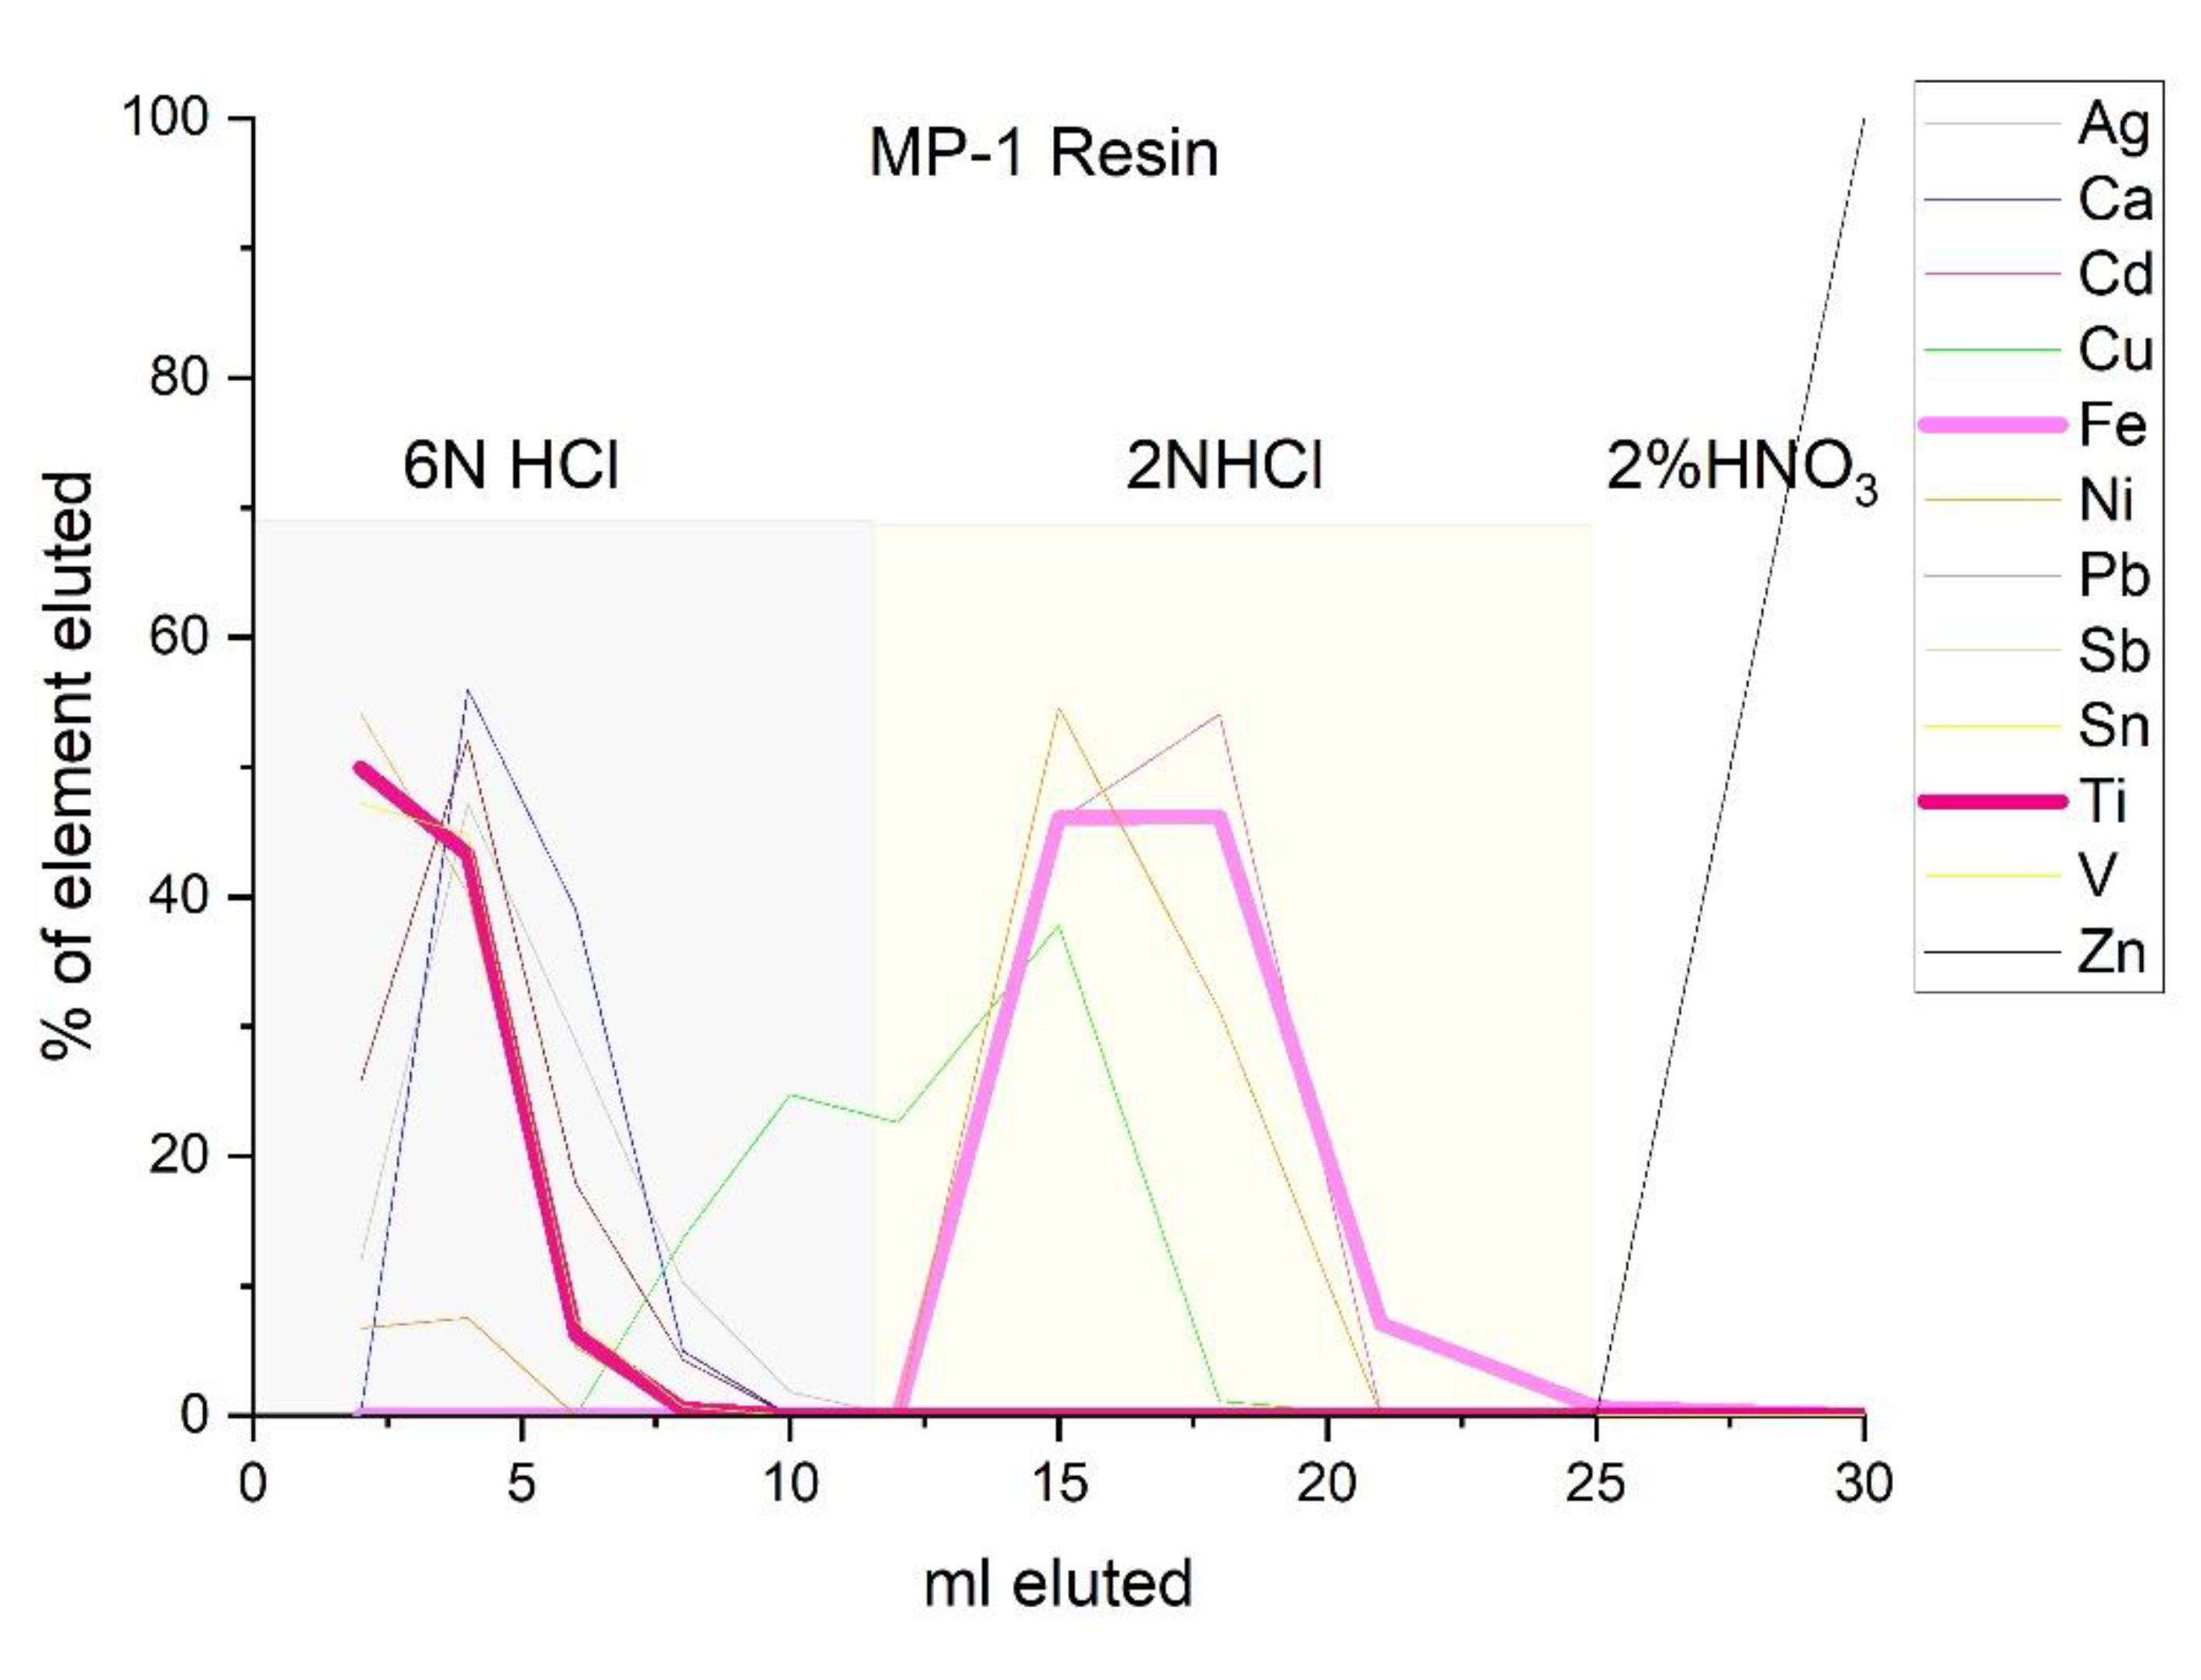
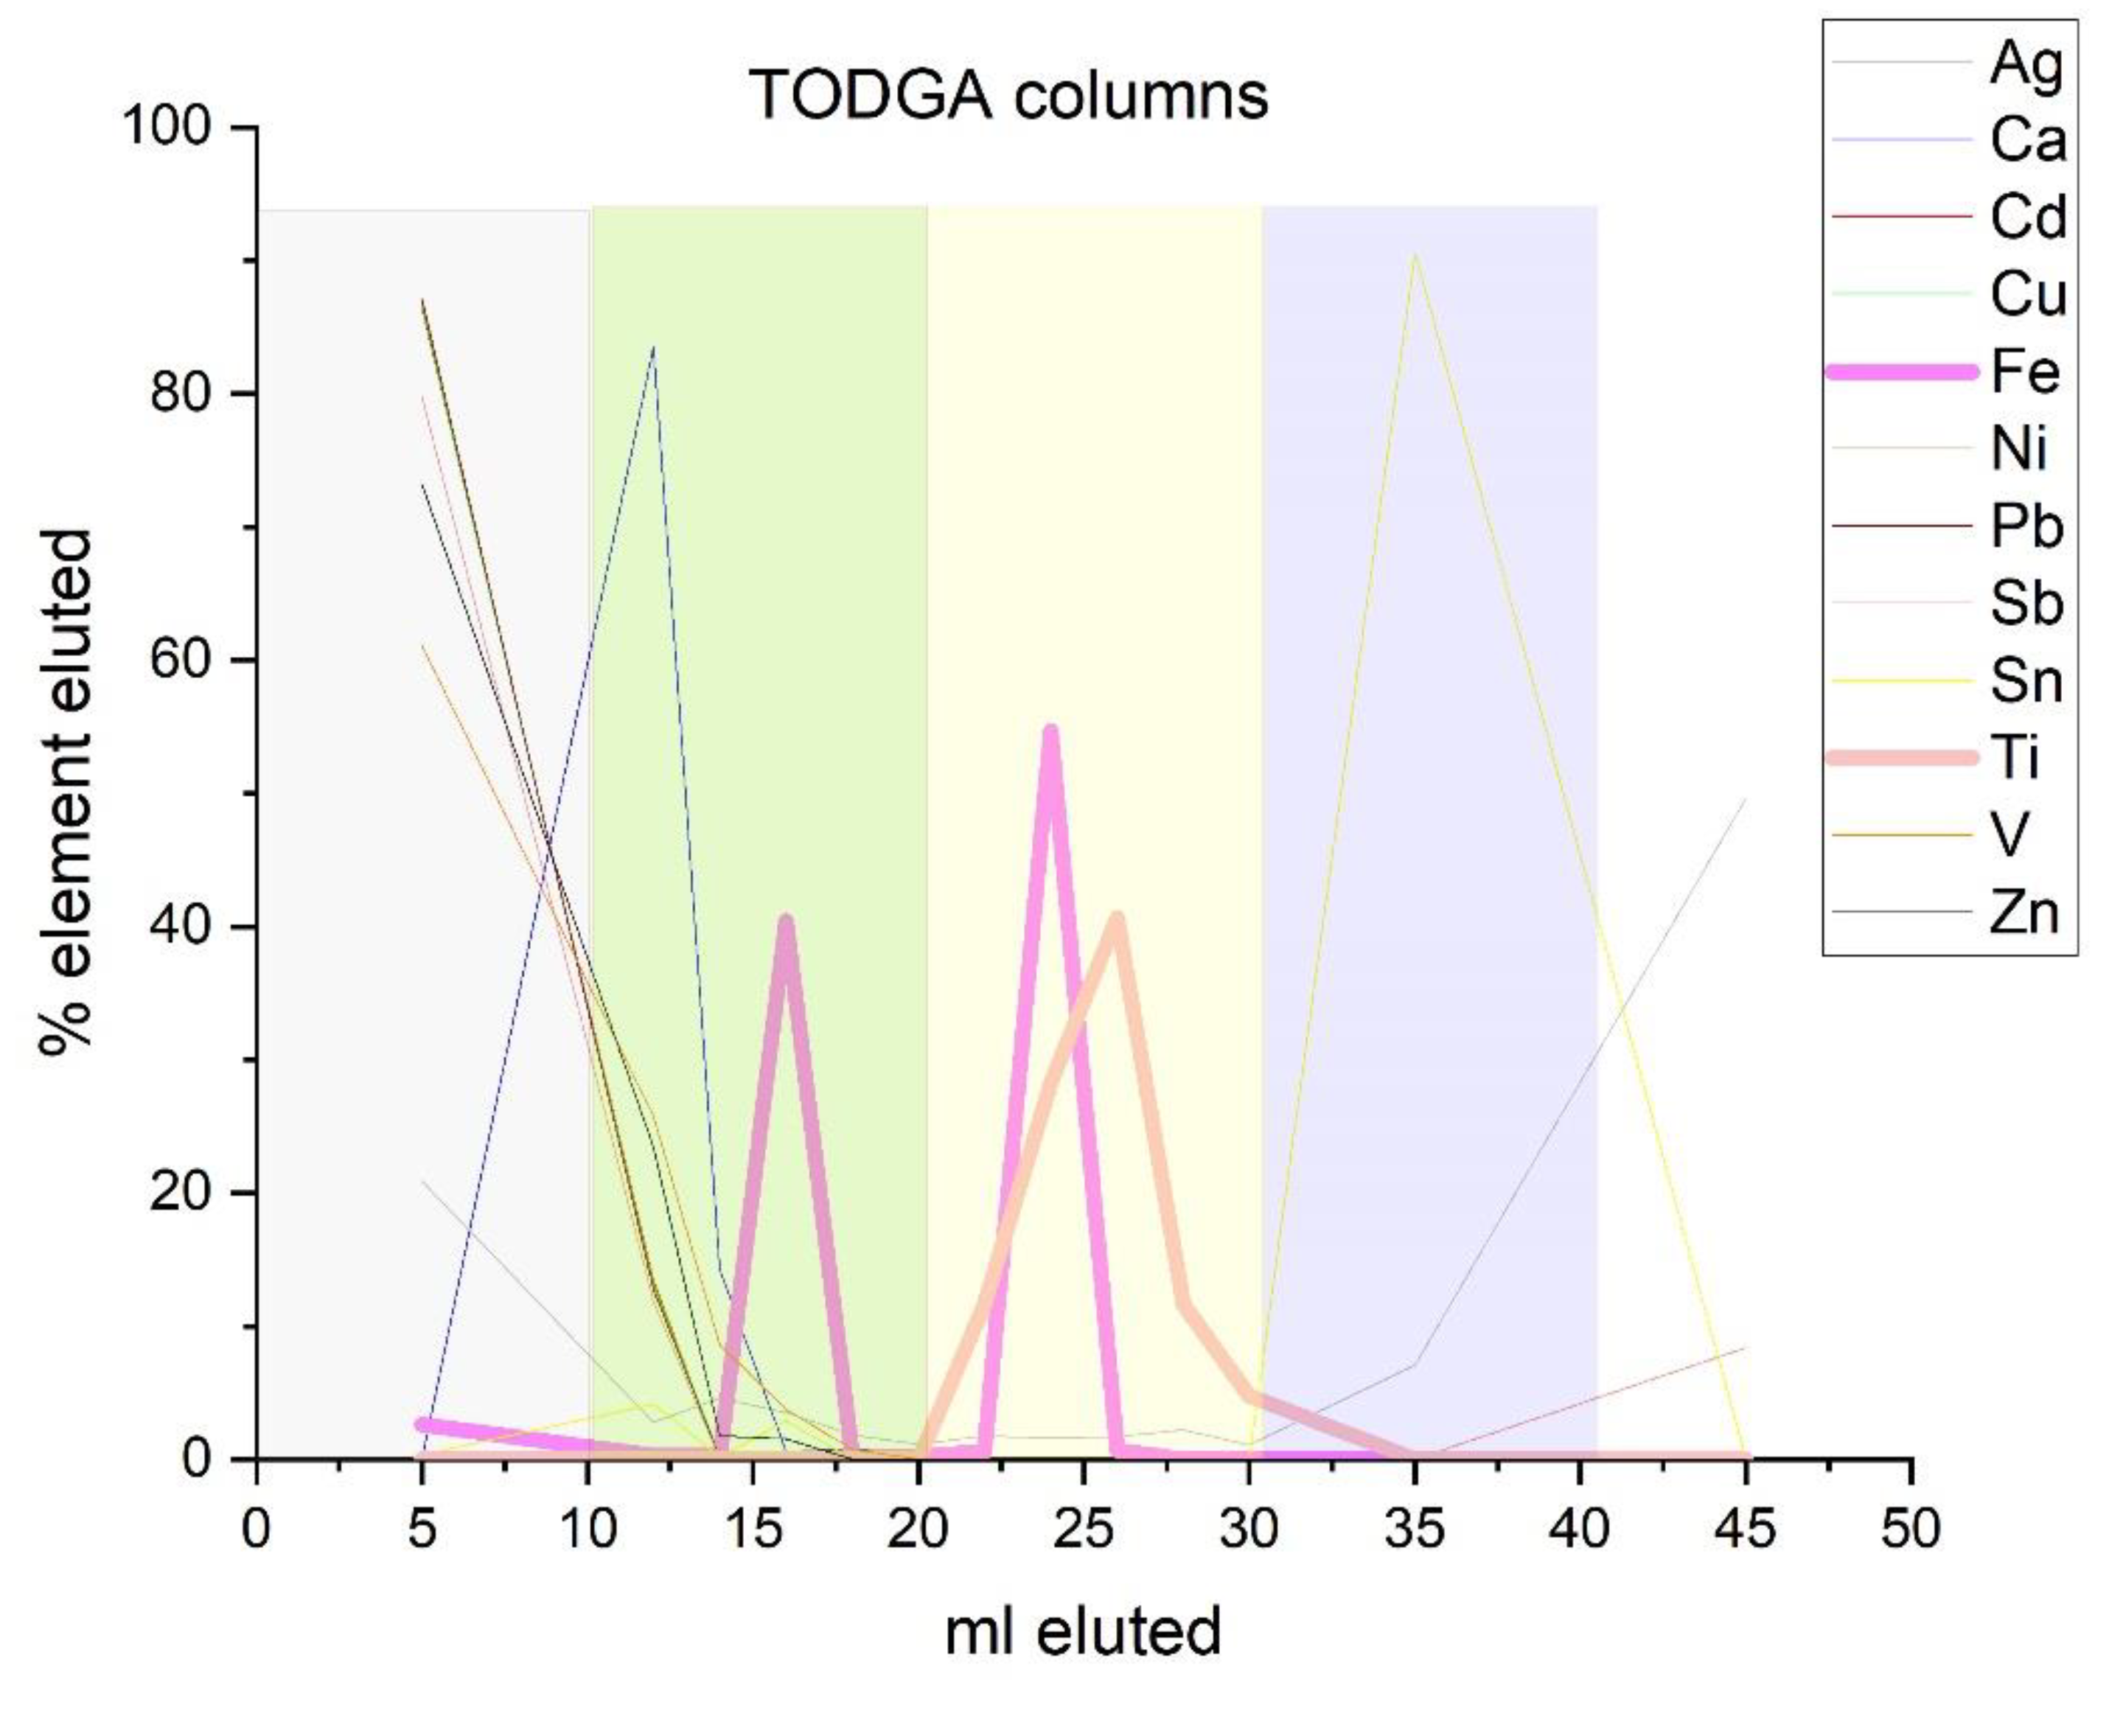
2.1. Sample Preparation and Ion-Exchange Chromatography

Several materials were prepared to be chemically processed through ion-exchange chromatography. Magnetite, an the Fe–Ti oxide compound from VWR, an Alfa Star ICP-MS standard solution, and several rutile crystals from Magnet Cove provided by the Carnegie Museum Hillman Hall of minerals (CM3218) were used. The minerals were powdered and sieved to silt-sized particles to aid in dissolution. A dried aliquot of the ICP-MS titanium concentration solution standard was also processed as a means to monitor potential titanium-isotope fractionation in the resins. Four other reference standards were used during the study: the in-house standard developed by the University of Chicago Origins Lab at 1000 ppm [13,17], NIST 3161A 1000 ppm (also reported in [2,5]), High-Purity Standard (HPS) 10ppm (cat no 10-62-4-100, lot# 20009813-100), and ARISTAR 1000 ppm (Lot# J2-T102102R). All data were presented relative to the OL-Ti standard [3,6,13].
A total of 50 milligrams of mineral powder was dissolved in 4 ml of ultrapure acid (3:1 proportion of 10 molar HCl to 15.2 molar HNO3) at 80 °C for at least 8 h. All acids were purchased from J.T. Baker and were certified ultrapure reagents. Before drying for chromatography, a 0.1 mL aliquot was removed for concentration analysis and yield checks on the columns. Concentration data were also measured on column calibrations described below, where every 2 ml fraction of the eluted column solutions was analyzed (Figure 1). Concentration measurements for these minerals and solutions from the chromatography were conducted on ICP-OES instruments at PSU and Juniata College, respectively. For both instruments, In was used as an internal check for all solutions.
Solutions from magnetite, rutile, and the Alfa Star ICP-MS standard were dried and processed through a 2-stage column procedure. In the first column, Fe was removed from the matrix through the use of a MP-AG-1 Bio-Rad resin, 200–400 mesh, HCl form. The column setup was identical to that in [18,19], where 1.6 to 1.8 mL of resin was loaded onto a 10 mL Bio-Rad polypropylene column. The resin was cleaned with 10 mL of ultrapure water (18 Ω), 10 mL of 0.5 molar HNO3 acid, and 6 mL of 6 molar HCl. The sample was loaded onto the resins as 2 mL of 6 molar HCl and 8 mL of 6 molar HCl. These 2 mL and an additional 8 ml were collected because Ti does not appreciably adhere to resin, as evidenced in the column calibration (Figure 1). However, this solution required further purification because Ca and other major cations also pass through the resin during this step. The Fe was retained on the resin and could be collected using the 2-molar HCl elution shown on the calibration.
The second column step isolated Ti from Ca and other unwanted ions in the matrix (Figure 2) using the TODGA prepacked column by Eichrom. Most Ti-separation techniques use these resins with complex silicate-dissolved mineral matrices. These column purification steps were conducted under vacuum in a 24-sample vacuum box. Flow rates were monitored to maintain a sub-1 ml-per-minute drip rate. This protocol was identical to that used in [12,16], where the resin was first cleaned with 10 mL of ultrapure water (18 Ω), 10 mL of 3 molar HNO3, and 10 mL of 12 molar HNO3. The sample was loaded in 10 mL of 12-molar HNO3 and the matrix was eluted with the next 10 mL of 12-molar HNO3. The Ti fraction was collected in 10 mL of nitric acid +1% ultrapure hydrogen peroxide.
The importance of using this two-stage column procedure for Fe-rich Ti ores is that only using the TODGA resin does not eliminate all of the Fe. As seen in Figure 2, in samples with elevated Fe, Fe breaks through in multiple elutions of the profile. Significantly, 40% of the total Fe in magnetite elutes with the Ti. Given the masses that were loaded, the total Fe in the Ti aliquot would be several orders of magnitude greater than the total Ti. In this instance, there would be approximately 14,000 micrograms of Fe to 17 micrograms of Ti in the Ti elution. Therefore, the rationale for using a separate first column with BIORAD resin was to ‘catch’ Fe, because one TODGA column pass cannot properly remove all of the unwanted chemical matrix.
The volumetric yield calculations revealed >93% of the Ti was recovered in the process. The collected sample was dried and ready for analysis on the ICP-MS multi-collector. Trace HF (0.1%) was added to the 0.5 N HNO3 for analyses on Neptune plus multi-collectors. Volumetric yield checks were conducted on all samples; only the samples that yielded Ti greater than 93% were presented. Full procedural blanks through both columns yielded <1 nanogram total of Ti.
The column procedures presented here did not fractionate Ti during the elution process (Table 1). This is shown in two manners. First, ion-exchange chromatography does not appear to be required for more Ti-rich mineral phases, such as rutile, as the results for CM3218 (a rutile sample) are indistinguishable within analytical error. Secondly, the chromatography does not fractionate Ti to any large degree as the ARISTAR solution standard value overlaps the results from samples processed with and without column chromatography. Thus, high-concentration solutions derived from Ti-rich materials (minerals or other solids, such as pure Ti metal) do not require ion-exchange chromatography.

2.2. Mass Spectrometry

The samples were measured on two different Neptune plus multi-collectors, one at Rutgers and the other at Washington State University. The instrumentation cup configuration was identical to the previously reported articles [2,3,16] with L4-44Ca, L1-46Ti, Ax-47Ti, H1-48Ti, H2-49Ti and H3-50Ti. We monitored Cr and V as a sub-method in the cup-configuration setup. These elements were monitored as potential interferences on the 50Ti mass. The 44Ca was monitored as 46Ca can have a direct interference on the 46Ti mass. All the presented data had V or Cr signals less than 50 mV and 44Ca/47Ti < 0.00X, respectively. The ion chromatography removed these potential inferences. Further evidence that the matrix was removed was demonstrated in the mass dependence of the solid and solution standard data in Figure 3, which had a slope of 1.495 compared to the theoretical mass dependence of these isotopes that should be 1.5.
All recent studies used dry plasma for measuring Ti and that method was adopted here (a comparison to the wet-mode results as a means to demonstrate the need to use dry plasma). The inlet systems at both locations were slightly different; at Rutgers, the Aridus 2 was used, whereas, at Washington State University, the Apex Omega was used. Both desolivation units used a mixture of trace N and Ar in the sweep gases with the proportion of the gases. The desolvation process is thought to be similar in both inlet systems and the differences between the systems have been carefully presented in [20]. To assess the need for using the dry plasma, the standards were compared to each in wet and dry modes. Peak shapes of 46Ti, 47Ti, and 49Ti were monitored at low, medium, and high resolution in search of isobars. No scans yielded altered peak shapes in the dry- or wet-plasma modes.
The reported results are in the traditional per-mil format, with all samples relative to the University of Chicago Origins Lab Ti (OL-Ti) standard. Mass bias was corrected through the use of standard-sample-standard bracketing, as presented in Zhu et al. 2002, and many transition metal isotopes with relatively similar masses (Fe, Ni, and Cu). Since the samples lacked high concentrations of rock-forming elements and in consideration of the isobars described above, we present the data in the traditional per-mil format:
δ 49 Ti =   49 Ti /   47 Ti   sample   49 Ti /   47 Ti   OL Ti 1 × 1000
The samples were measured in medium resolution in dry plasma and low resolution in wet plasma. Solutions for dry plasma were kept at 150 ppb at Washington State University and 250 ppb at Rutgers, and measured in duplicate. In both locations, these solutions produced approximately 0.8 V on 47Ti, the mass in the axial position. The concentration of titanium was set as equal to or up to no greater than 25% more than the bracketing OL-Ti standard. As seen in Figure 4, the linearity of the instrument is robust for samples that range from 0.5 to 2 V on mass 47Ti. Since 48Ti (the dominant isotope) was around 22 V at this range, we did not test higher concentrations. All the reported measurements are a duplicate of a 1 block of 30 ratios with 8 s integration times. On-peak blanks were subtracted from each measurement.

3. Discussion

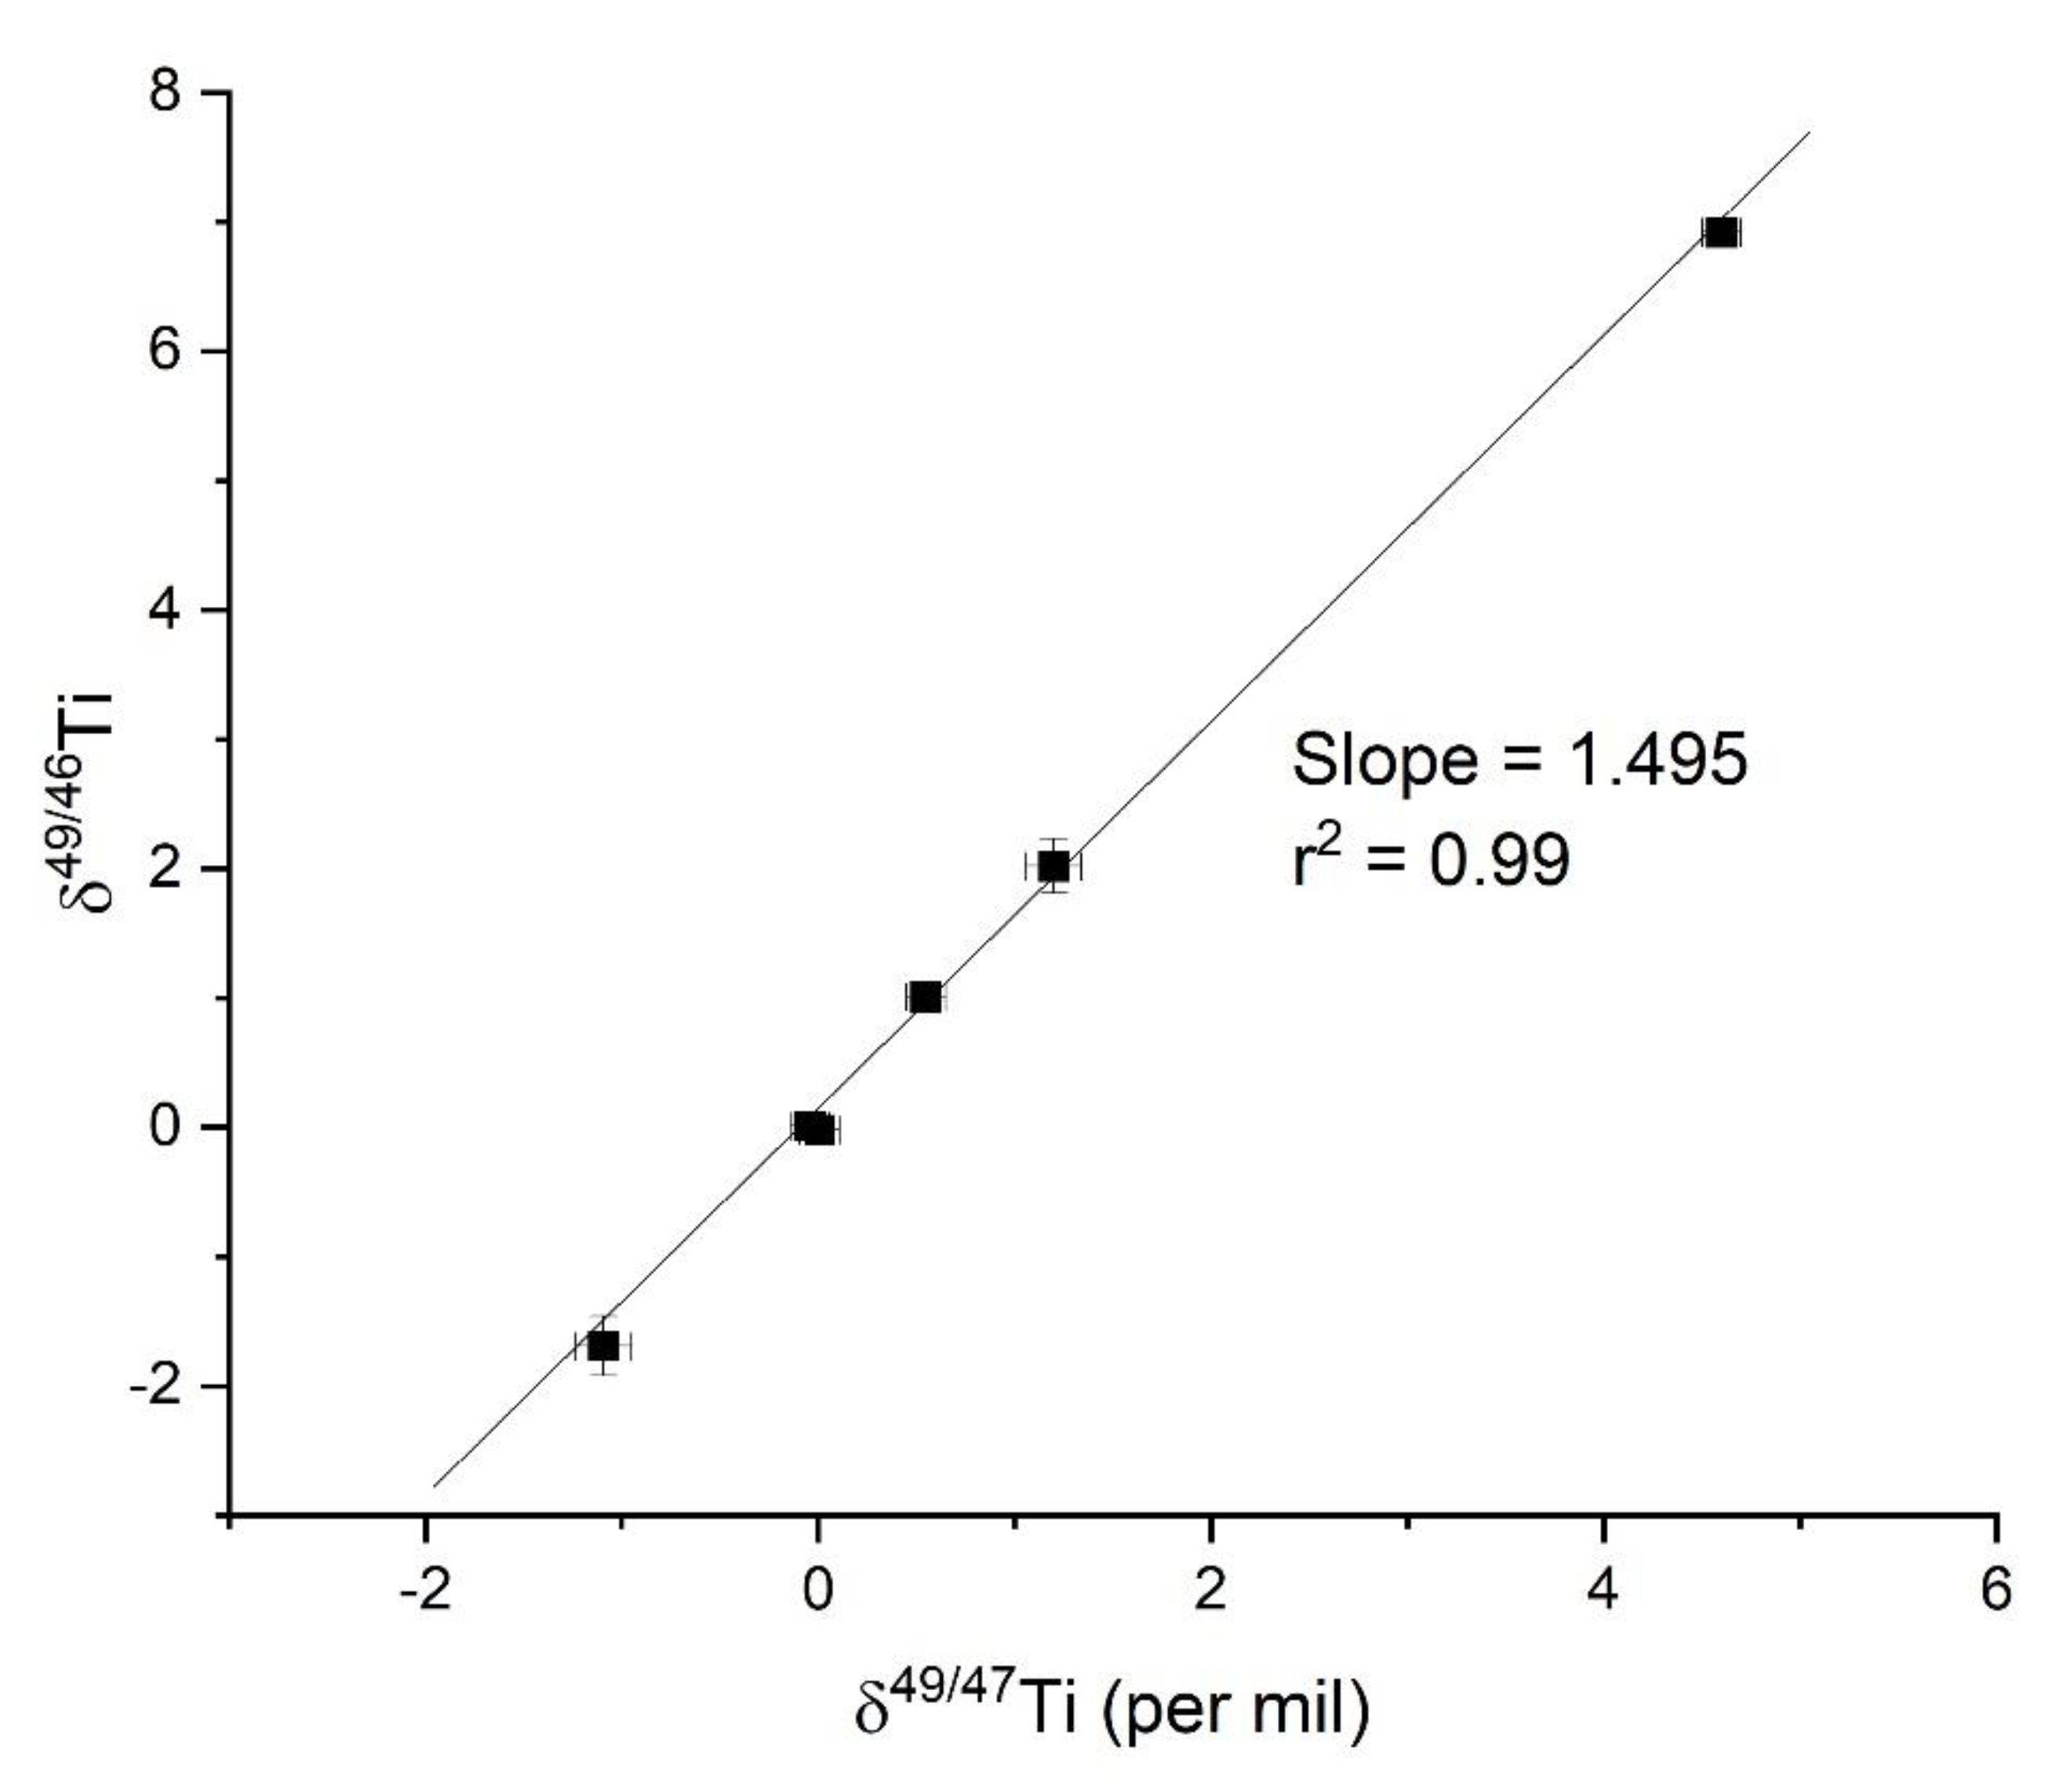
3.1. Rationale to Use 46Ti, 47Ti, and 49Ti, Mass Dependence, and the Bracketing Approach

For the purposes of solving the problems related to economic geology and mineral geochemistry, providing mass-dependent results illuminates the physical processes. Thus, three isotopes were needed to accomplish this. Magnetite potentially possesses high concentrations of elements that would cause isobaric interference. For instance, magnetite associated with mineral deposits commonly possess trace apatite (calcium-rich phosphate) coupled with high (on the ppm level) concentrations of V and Cr. Calcium is an isobar for 48Ti, while V and Cr have isobars for 50Ti. Phosphorous has nitride and oxide interferences across all Ti isotopes. (However, in 2002, Zhu et al. demonstrated that only in the samples where the P/Ti > 10 did samples exhibit problems; with the materials presented here, none of the samples have P/Ti values > 0.00X). Therefore, 46Ti, 47Ti, and 49Ti were chosen to monitor the mass dependence in the presented results.
Multiple strategies exist to avoid issues with these isobars. A common method used is the double spike, which allows for the correction of mass bias through the addition of known isotopes. The method also aids in correcting for poor yields during the chromatographic purification process, while routinely generating the lowest errors for isotopic analysis [21,22]. Other approaches employed to avoid isobars involve careful chromatographic separations, which mandate retaining high yields through the chromatographic process or measuring samples that lack potential inferences. In this contribution, we employed the latter path and did not use the double spike for the high-Ti-concentration materials analyzed here because:
(1)
The concentrations of Ti in the solutions are high (dissolution of materials that have Ti in 1000 of ppm to % level ranges), which demands copious amounts of spike or an extraordinarily low amount of sample. This is why multiple scientists analyze transition metal isotopes, such as Ti, in higher-concentration materials (for instance, Zn, Mo, Sb, and Sn [20,23,24,25,26,27,28,29,30,31,32,33,34]) and correct for mass bias with the purification and bracketing techniques presented here.
(2)
Sample-spike equilibration can be an issue for isotopic analysis when compounds and other chemical reactions can hinder this from occurring, as demonstrated in multiple-isotope systems that use spiking techniques [35,36,37,38,39].
(3)
Although mass bias corrections with bracketing provide significantly higher errors, as demonstrated here, the full procedural error of approximately 0.1‰ is adequate to differentiate the variations observed in 2 mineral and 4 solution standards, which span over 5 per mil. Given the significant isotopic ranges observed in these materials and the known Ti-isotope values in the published works, the higher error limits the discrimination of differences among the materials. Equally important, Zhu et al. [2] presented the results using this technique for Ti-isotope compositions in rocks, which possess a more complicated chemical matrix associated with the dissolution of rocks that possess multiple-mineral species
Mass dependence demonstrates the robustness of the data and lack of interference of unwanted ions on the three masses suggested here. Thus, we employed a modified routine described below as a means to avoid any further issues with potential isobars; we simply presented δ49/47Ti and δ49/46 Ti and demonstrated mass dependence as a means to show quality in the presented data.

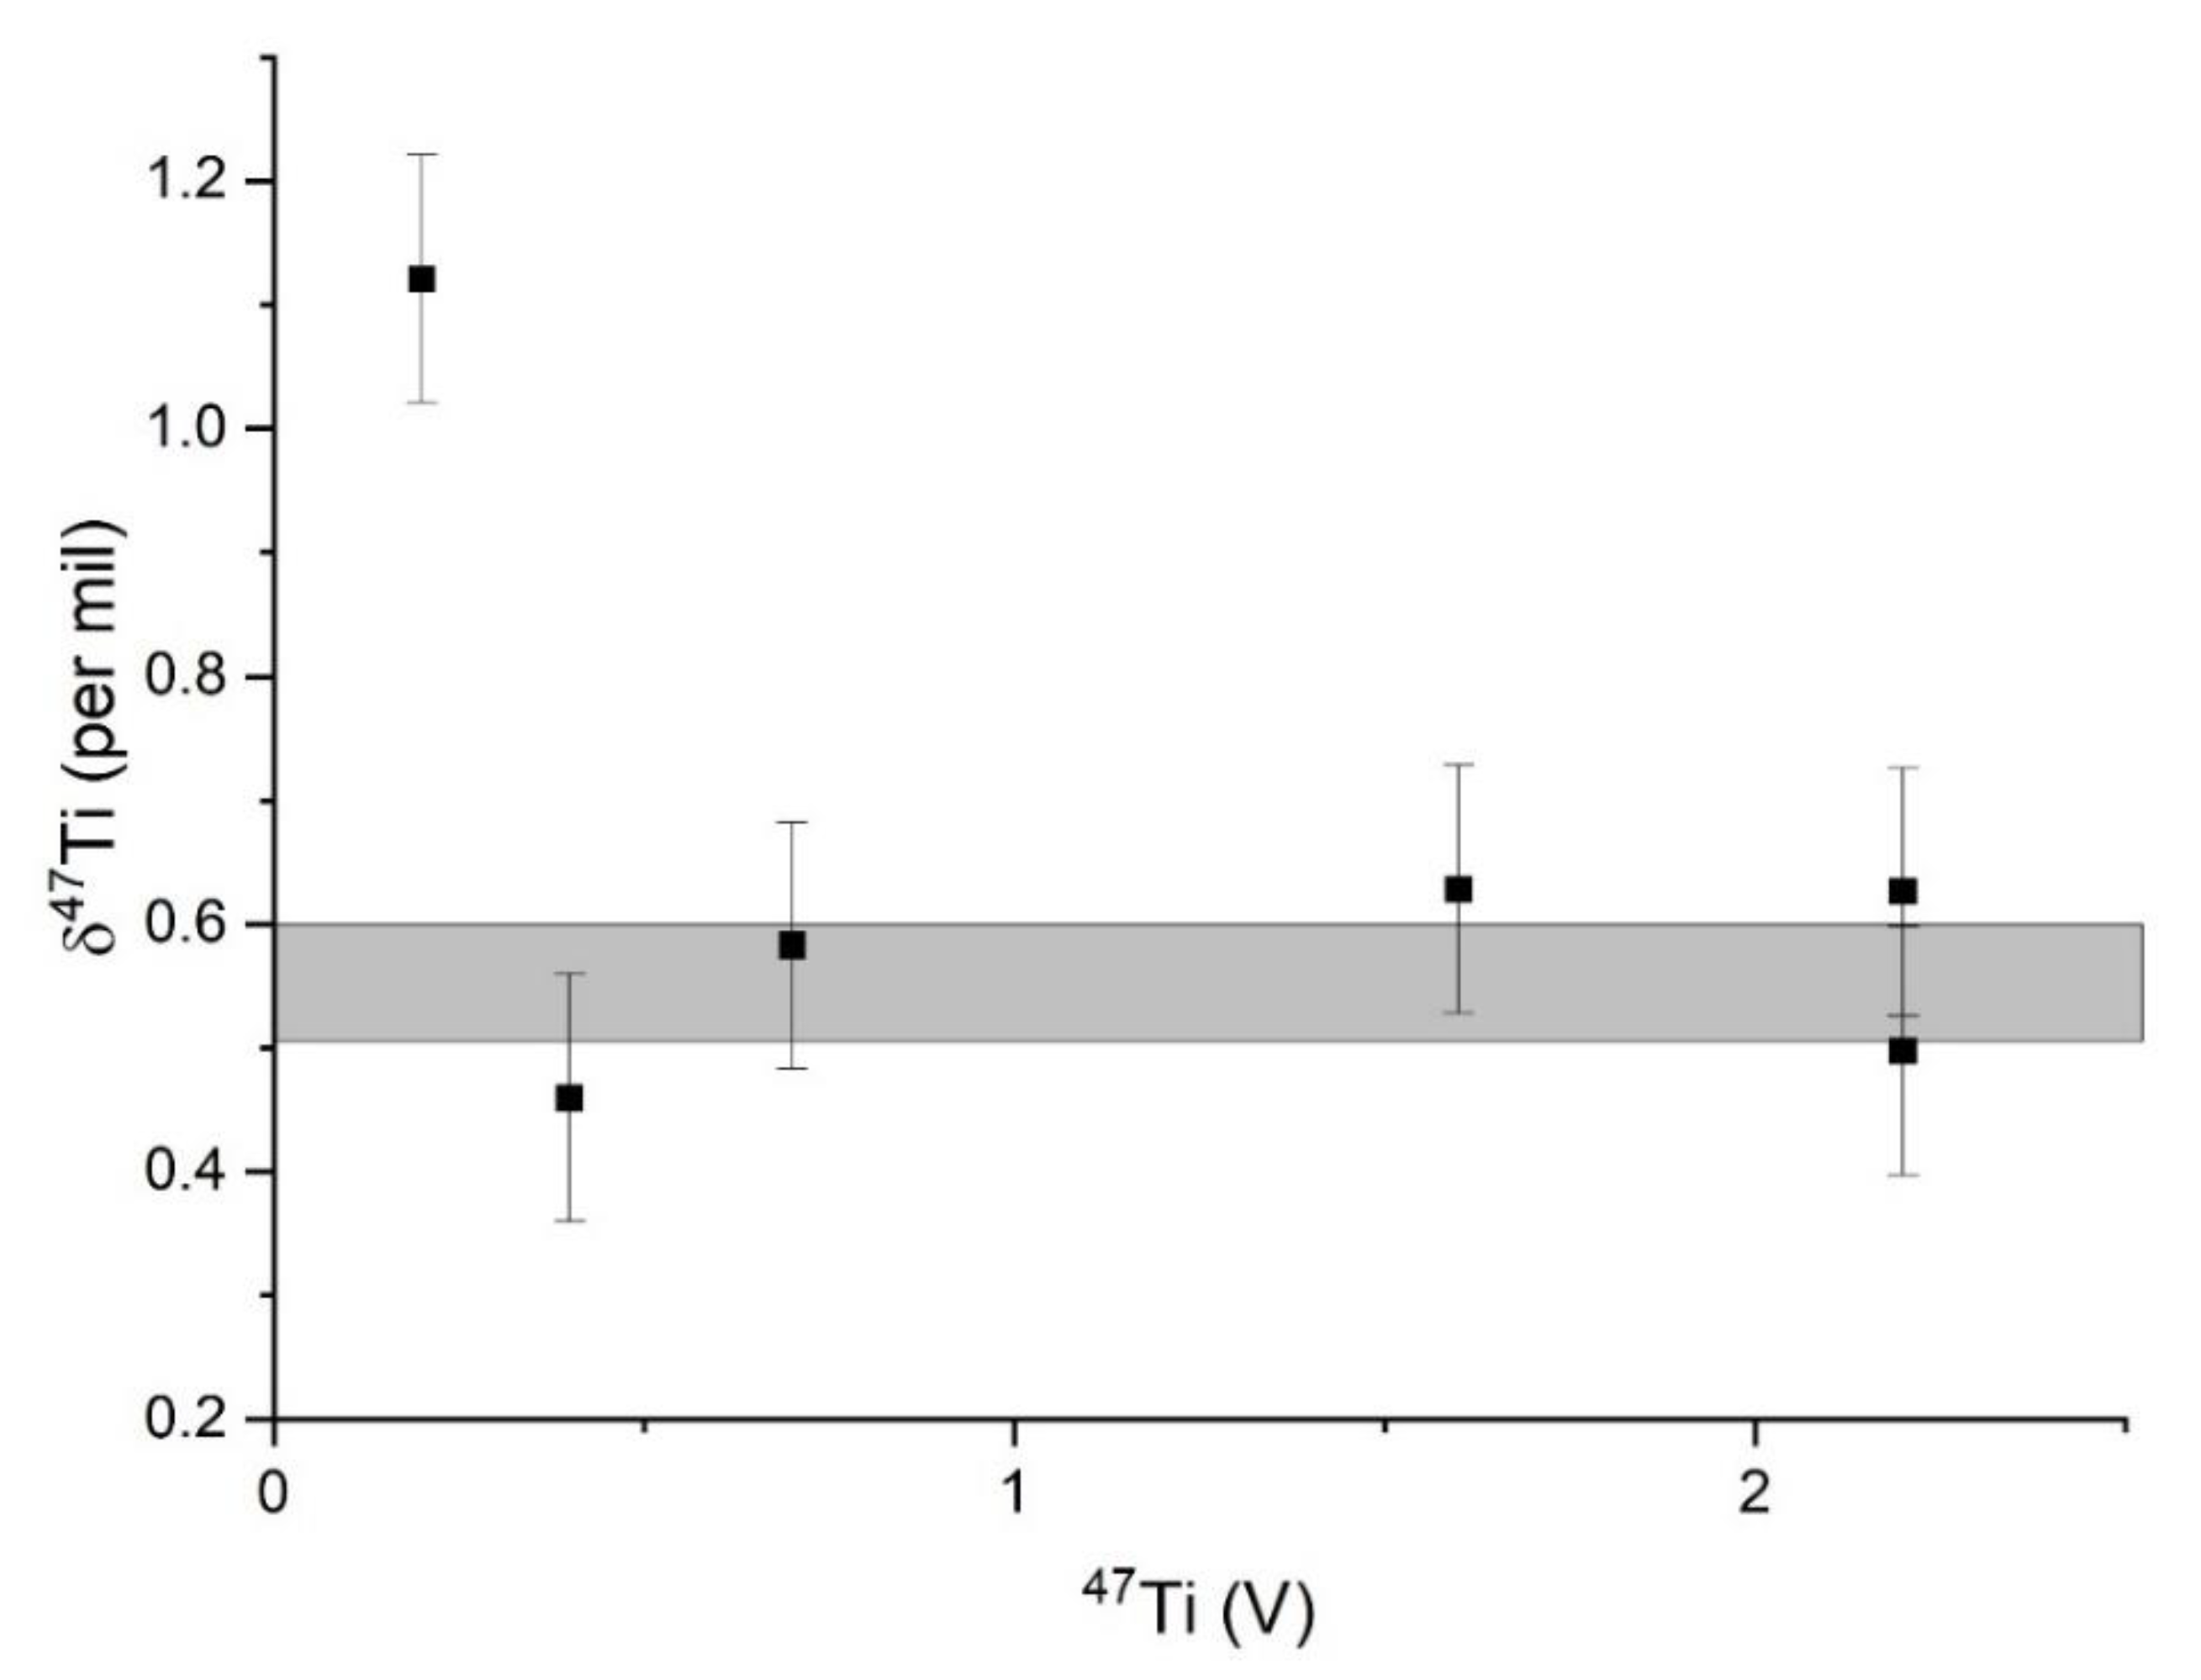
3.2. Error Analysis and the Importance of Dry Plasma in Measurements

To demonstrate the repeatability and ideal run conditions, we presented the full procedural analytical errors, as well as the repeated errors associated with repeated analysis of the same synthetic solutions and minerals for different instruments in both wet- and dry-plasma conditions (Table 1 and Table 2). Measured ratios have errors in the 4th decimal place or less. As observed from simply repeating the same standard solution throughout the run sessions in both wet and dry modes, the errors were much greater for the same solution throughout the session, and thus a full procedural error calculation is necessary.
To evaluate the full procedural errors for iron-rich matrices in dry plasma, several experiments were conducted (Table 1). First, separate aliquots of magnetite were processed through the whole-column procedure for different analytical sessions over a three-year interval. The magnetite sample measured at Rutgers had a mean value of δ49/47Ti = 1.21 ± 0.07‰ (1σ, n = 6). The same sample processed and measured at WSU produced a slightly lower δ49/47Ti = 1.07 ± 0.06‰, (1σ, n = 2). Secondly, multiple whole-procedural repeats measured in dry plasma during the same session were also analyzed for the FeTi oxide from VWR and generated a value of δ49/47Ti= −1.09 ± 0.10‰ (1σ, n = 9). The 1σ errors of 0.07‰, 0.06‰, and 0.10‰ for each sample were greater than the duplicated errors of the same solution throughout the run for all the analyses. Therefore, the most conservative 1σ estimate for error for the technique presented here was 0.10‰. The reason that the natural magnetite could show slightly greater errors is that this material might not be the most isotopically heterogenous material analyzed. Micro-scale variations of transition metals, such as Fe, have been demonstrated to show significant isotopic variations [40,41].
The errors presented here are greater than the use of the double-spike technique [3,17,42]. However, given that the δ49/47Ti range for terrestrial samples in the literature is c. 3‰ and the δ49/47Ti range of the solids and standards presented here is c. >5‰, the error is adequate to differentiate between the different minerals in terrestrial systems with major oxide precipitation.
The errors associated with the multiple analyses of the synthetic standard solutions were nearly identical for the dry-mode measurements. Slightly larger errors exist for the HPS 10ppm standard that sits at +4.6‰, and might be related to the fact that the isotopic composition of the standard significantly differs from that of the bracketing standard. Both instruments yielded the highest error for this synthetic solution standard.
Both the precision and accuracy of the measurements were greatly improved by using the dry mode. Dry plasma in the medium-resolution mode was the most ideal condition for measuring the Ti isotopes, as demonstrated in Table 1. As can be observed from the data, the 2σ errors are significantly higher for the solutions and most likely indicate the presence of isobars. Notably, the mean values of the standards in wet mode are all higher and indicate that the isobar is most likely on 49Ti. However, as stated above, no peak scans revealed distinct shoulders or uneven peak tops that are associated with isobaric interferences.

4. Conclusions

A two-stage ion-exchange column procedure effectively isolated titanium from Ti-rich ore minerals. Pure α-TiO2 (rutile) did not require ion-exchange chromatography. Measurement errors associated with full procedural replicates of magnetite and ilmenite were 0.14‰, which were sufficient to resolve the differences in the 5‰ range observed in the previous literature, the standard solutions, and the minerals presented. The range of isotopic variations demonstrated their potential ability to trace the physiochemical processes for economic geology and igneous/metamorphic petrology issues, as well as set the path for applications in metallurgical and archaeological studies.

Author Contributions

Conceptualization and methodology R.M., C.E. and A.C.S.; Formal analysis and measurement resources L.G., C.K. and J.D.V. All authors have read and agreed to the published version of the manuscript.

Funding

This research was funded by the National Science Foundation (NSF) award number 1924177.

Data Availability Statement

Not applicable.

Conflicts of Interest

The authors declare no conflict of interest.

References

  1. Niederer, F.; Papanastassiou, D.; Wasserburg, G. The Isotopic Composition of Titanium in the Allende and Leoville Meteorites. Geochim. Cosmochim. Acta 1981, 45, 1017–1031. [Google Scholar] [CrossRef]
  2. Zhu, X.K. High Precision Measurement of Titanium Isotope Ratios by Plasma Source Mass Spectrometry. Int. J. Mass Spectrom. 2002, 220, 21–29. [Google Scholar] [CrossRef]
  3. Zhang, J. A New Method for MC-ICPMS Measurement of Titanium Isotopic Composition: Identification of Correlated Isotope Anomalies in Meteorites. J. Anal. At. Spectrom. 2011, 26, 2197–2205. [Google Scholar] [CrossRef]
  4. Torrano, Z.A. Titanium Isotope Signatures of Calcium-Aluminum-Rich Inclusions from CV and CK Chondrites: Implications for Early Solar System Reservoirs and Mixing. Geochim. Cosmochim. Acta 2019, 263, 13–30. [Google Scholar] [CrossRef] [PubMed]
  5. Makishima, A. Separation of Titanium from Silicates for Isotopic Ratio Determination Using Multiple Collector ICP-MS. J. Anal. At. Spectrom. 2002, 17, 1290–1294. [Google Scholar] [CrossRef]
  6. Johnson, A.C. Titanium Isotopic Fractionation in Kilauea Iki Lava Lake Driven by Oxide Crystallization. Geochim. Cosmochim. Acta 2019, 264, 180–190. [Google Scholar] [CrossRef]
  7. Hinton, R.W.; Davis, A.M.; Scatena-Wachel, D.E. Large Negative Ti-50 Anomalies in Refractory Inclusions from the Murchison Carbonaceous Chondrite-Evidence for Incomplete Mixing of Neutron-Rich Supernova Ejecta into the Solar System. Astrophys. J. 1987, 313, 420–428. [Google Scholar] [CrossRef]
  8. Fahey, A. 26Al, 244Pu, 50Ti, REE, and trace element abundances in hibonite grains from CM and CV meteorites. Geochim. Cosmochim. Acta 1987, 51, 329–350. [Google Scholar] [CrossRef]
  9. Zhang, J. Calcium and Titanium Isotopic Fractionations during Evaporation. Geochim. Cosmochim. Acta 2014, 140, 365–380. [Google Scholar] [CrossRef]
  10. Millet, M.-A. Titanium Stable Isotope Investigation of Magmatic Processes on the Earth and Moon. Earth Planet. Sci. Lett. 2016, 449, 197–205. [Google Scholar] [CrossRef] [Green Version]
  11. Wang, W. Equilibrium Inter-Mineral Titanium Isotope Fractionation: Implication for High-Temperature Titanium Isotope Geochemistry. Geochim. Cosmochim. Acta 2020, 269, 540–553. [Google Scholar] [CrossRef]
  12. Williams, N.H. Titanium Isotope Fractionation in Solar System Materials. Chem. Geol. 2021, 568, 120009. [Google Scholar] [CrossRef]
  13. Greber, N.D. Titanium Isotopic Evidence for Felsic Crust and Plate Tectonics 3.5 Billion Years Ago. Science 2017, 357, 1271–1274. [Google Scholar] [CrossRef] [PubMed] [Green Version]
  14. Deng, Z. Titanium Isotopes as a Tracer for the Plume or Island Arc Affinity of Felsic Rocks. Proc. Natl. Acad. Sci. USA 2019, 116, 1132–1135. [Google Scholar] [CrossRef] [PubMed] [Green Version]
  15. Zhao, X. Titanium Isotopic Fractionation during Magmatic Differentiation. Contrib. Mineral. Petrol. 2020, 175, 1–16. [Google Scholar] [CrossRef]
  16. Hoare, L. Melt Chemistry and Redox Conditions Control Titanium Isotope Fractionation during Magmatic Differentiation. Geochim. Cosmochim. Acta 2020, 282, 38–54. [Google Scholar] [CrossRef]
  17. Millet, M.-A.; Dauphas, N. Ultra-Precise Titanium Stable Isotope Measurements by Double-Spike High Resolution MC-ICP-MS. J. Anal. At. Spectrom. 2014, 29, 1444–1458. [Google Scholar] [CrossRef]
  18. Marechal, C.N.; Telouk, P.; Albarede, F. Precise Analysis of Copper and Zinc Isotopic Compositions by Plasma-Source Mass Spectrometry. Chem. Geol. 1999, 156, 251–273. [Google Scholar] [CrossRef]
  19. Mathur, R. Cu Isotopic Fractionation in the Supergene Environment with and without Bacteria. Geochim. Cosmochim. Acta 2005, 69, 5233–5246. [Google Scholar] [CrossRef]
  20. Mason, T.F.D. Zn and Cu Isotopic Variability in the Alexandrinka Volcanic-Hosted Massive Sulphide (VHMS) Ore Deposit, Urals, Russia. Chem. Geol. 2005, 221, 170–187. [Google Scholar] [CrossRef]
  21. Rudge, J.F.; Reynolds, B.C.; Bourdon, B. The Double Spike Toolbox. Chem. Geol. 2009, 265, 420–431. [Google Scholar] [CrossRef]
  22. John, S.G. Optimizing Sample and Spike Concentrations for Isotopic Analysis by Double-Spike ICPMS. J. Anal. At. Spectrom. 2012, 27, 2123–2131. [Google Scholar] [CrossRef]
  23. Weiss, D.J. Controls of Cu and Zn Isotope Variability within a VHMS Deposit. Abstracts with Programs; Geological Society of America: Boulder, CO, USA, 2004; Volume 36. [Google Scholar]
  24. John, S.G. Zinc Stable Isotopes in Seafloor Hydrothermal Vent Fluids and Chimneys. Earth Planet. Sci. Lett. 2008, 269, 17–28. [Google Scholar] [CrossRef]
  25. Zeng, Z. Iron, Copper, and Zinc Isotopic Fractionation in Seafloor Basalts and Hydrothermal Sulfides. Mar. Geol. 2021, 436, 106491. [Google Scholar] [CrossRef]
  26. Barling, J.; Arnold, G.L.; Anbar, A.D. Natural Mass-Dependent Variations in the Isotopic Composition of Molybdenum. Earth Planet. Sci. Lett. 2001, 193, 447–457. [Google Scholar] [CrossRef]
  27. Hannah, J.L. Molybdenum Isotope Variations in Molybdenite: Vapor Transport and Rayleigh Fractionation of Mo. Geology 2007, 35, 703–706. [Google Scholar] [CrossRef]
  28. Mathur, R. Variation of Mo Isotopes from Molybdenite in High-Temperature Hydrothermal Ore Deposits. Miner. Depos. 2010, 45, 43–50. [Google Scholar] [CrossRef]
  29. Zhai, D. Antimony Isotope Fractionation in Hydrothermal Systems. Geochim. Cosmochim. Acta 2021, 306, 84–97. [Google Scholar] [CrossRef]
  30. Yamazaki, E. Feasibility Studies of Sn Isotope Composition for Provenancing Ancient Bronzes. J. Archaeol. Sci. 2014, 52, 458–467. [Google Scholar] [CrossRef]
  31. Brügmann, G.; Berger, D.; Pernicka, E. Determination of the Tin Stable Isotopic Composition in Tin-Bearing Metals and Minerals by MC-ICP-MS. Geostand. Geoanal. Res. 2017, 41, 437–448. [Google Scholar] [CrossRef]
  32. Badullovich, N. Tin Isotopic Fractionation during Igneous Differentiation and Earth’s Mantle Composition. Geochem. Perspect. Lett. 2017, 5, 24–28. [Google Scholar] [CrossRef] [Green Version]
  33. Mason, A. Provenance of Tin in the Late Bronze Age Balkans Based on Probabilistic and Spatial Analysis of Sn Isotopes. J. Archaeol. Sci. 2020, 122, 105181. [Google Scholar] [CrossRef]
  34. She, J.-X. Sn Isotope Fractionation during Volatilization of Sn (IV) Chloride: Laboratory Experiments and Quantum Mechanical Calculations. Geochim. Cosmochim. Acta 2020, 269, 184–202. [Google Scholar] [CrossRef]
  35. Klaver, M.; Coath, C.D. Obtaining Accurate Isotopic Compositions with the Double Spike Technique: Practical Considerations. Geostand. Geoanal. Res. 2019, 43, 5–22. [Google Scholar] [CrossRef] [Green Version]
  36. Shirey, S.B.; Walker, R.J. Carius Tube Digestion for Low-Blank Rhenium-Osmium Analysis. Anal. Chem. 1995, 67, 2136–2141. [Google Scholar] [CrossRef]
  37. Kurzweil, F. Accurate Stable Tungsten Isotope Measurements of Natural Samples Using a 180 W–183 W Double-Spike. Chem. Geol. 2018, 476, 407–417. [Google Scholar] [CrossRef]
  38. Blichert-Toft, J.; Chauvel, C.; Albarède, F. Separation of Hf and Lu for High-Precision Isotope Analysis of Rock Samples by Magnetic Sector-Multiple Collector ICP-MS. Contrib. Mineral. Petrol. 1997, 127, 248–260. [Google Scholar] [CrossRef]
  39. Albarede, F. Precise and accurate isotopic measurements using multiple-collector ICPMS. Geochim. Cosmochim. Acta 2004, 68, 2725–2744. [Google Scholar] [CrossRef]
  40. Horn, I. In Situ Iron Isotope Ratio Determination Using UV-Femtosecond Laser Ablation with Application to Hydrothermal Ore Formation Processes. Geochim. Cosmochim. Acta 2006, 70, 3677–3688. [Google Scholar] [CrossRef]
  41. Kuhn, H.-R.; Pearson, N.; Jackson, S. The Influence of the Laser Ablation Process on Isotopic Fractionation of Copper in LA-MC-ICP-MS. J. Anal. At. Spectrom. 2007, 22, 547–552. [Google Scholar] [CrossRef]
  42. Greber, N.D. Titanium Isotopic Compositions of Bulk Rocks and Mineral Separates from the Kos Magmatic Suite: Insights into Fractional Crystallization and Magma Mixing Processes. Chem. Geol. 2021, 578, 120303. [Google Scholar] [CrossRef]
Figure 1. Plot showing the elution flux as a percentage of the cumulative solute at each elution step for the MP-1 resin.
Minerals 12 00644 g001
Figure 2. Plot showing the elution flux as a percentage of the cumulative solute at each elution step for the MP-1 resin. The changing colors indicate different acids eluted from the resin to purify the samples (from right to left, 12 molar nitric acid +sample, 12 molar nitric acid rinse, 12 molar nitric acid with 0.1%H2O2, and 2 molar nitric acid).
Minerals 12 00644 g002
Figure 3. Plot showing Ti-mass dependence for samples with a slope of c. 1.5 and a high coefficient of determination, indicating that the matrix was successfully removed. Black squares represent materials analyzed.
Minerals 12 00644 g003
Figure 4. Linearity of the Ti-isotope measurements demonstrating that Ti-isotope values at twice the concentration of the bracketing standard still produce similar values. The black squares are the measured values of the sample at different voltages.
Minerals 12 00644 g004
Table 1. Replicate analyses of the minerals and standard solutions with and without ion-exchange chromatography. A.S. = analytical session, n = number of samples measured with each representing and sample processed with ion-exchange chromatography, and I.C. = ion-exchange chromatography.
SampleAnalyteδ49/47Tiδ49/46TiA.S.nLocationI.C.
LC 05 82.6Magnetite1.210.112.020.1488RutgersYes
LC 05 82.6 1Magnetite1.070.081.920.0912WSUYes
CM3218Rutile−0.040.060.010.0624RutgersYes
CM3218Rutile−0.120.06−0.090.0612RutgersNo
Alfa StarStandard sol−0.040.040.010.0424RutgersYes
VWRFe–Ti oxide−1.640.06−2.240.119RutgersYes
Table 2. Comparison of Ti-isotope values in different plasma conditions. All values reported relative to the University of Chicago Origins Lab Ti-isotope standard.
Sampleδ49/47Ti1nδ49/47Ti2nδ49/47Ti3n
Wet plasma (WSU)1.50.25125.10.380.250.3113
Dry plasma (WSU)0.550.05144.60.1100.060.0312
Dry plasma (Rutgers)n.a.n.a.n.a.4.60.076−0.090.057
Publisher’s Note: MDPI stays neutral with regard to jurisdictional claims in published maps and institutional affiliations.

