
Modeling of Brine/CO2/Mineral Wettability Using Gene Expression Programming (GEP): Application to Carbon Geo-Sequestration

 , , ,
, , , 
Abstract
:1. Introduction
2. Theoretical Background
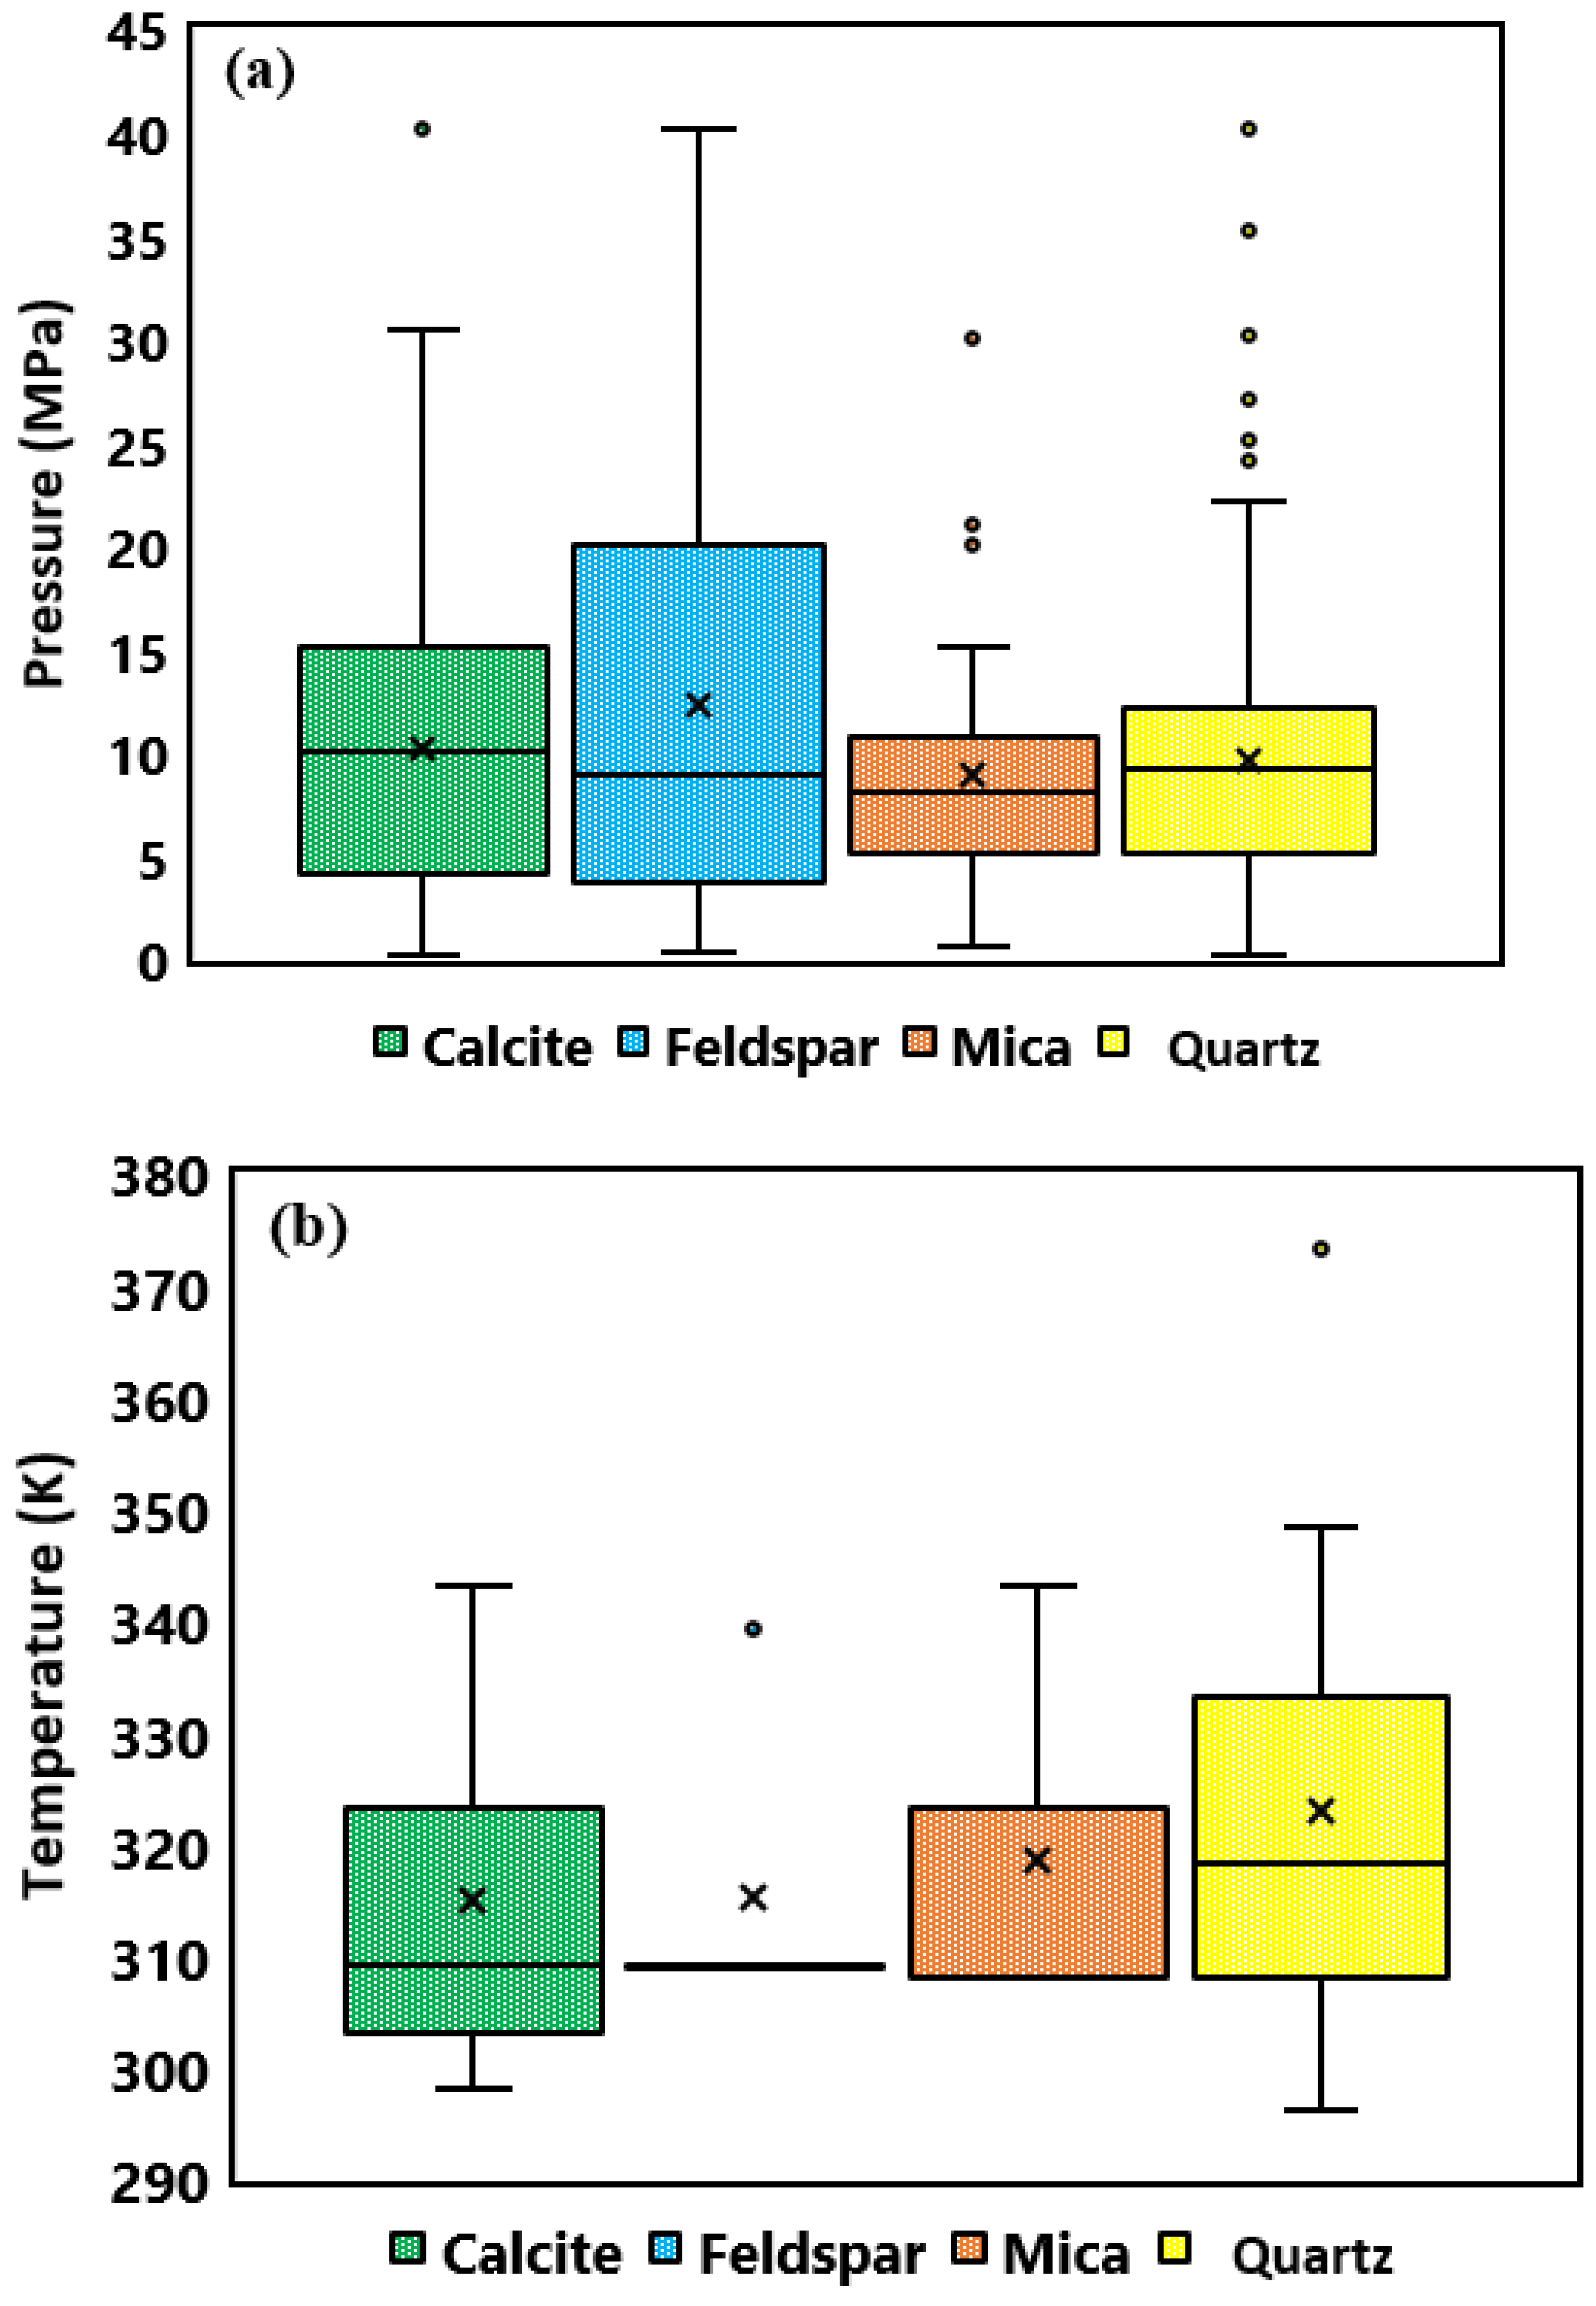
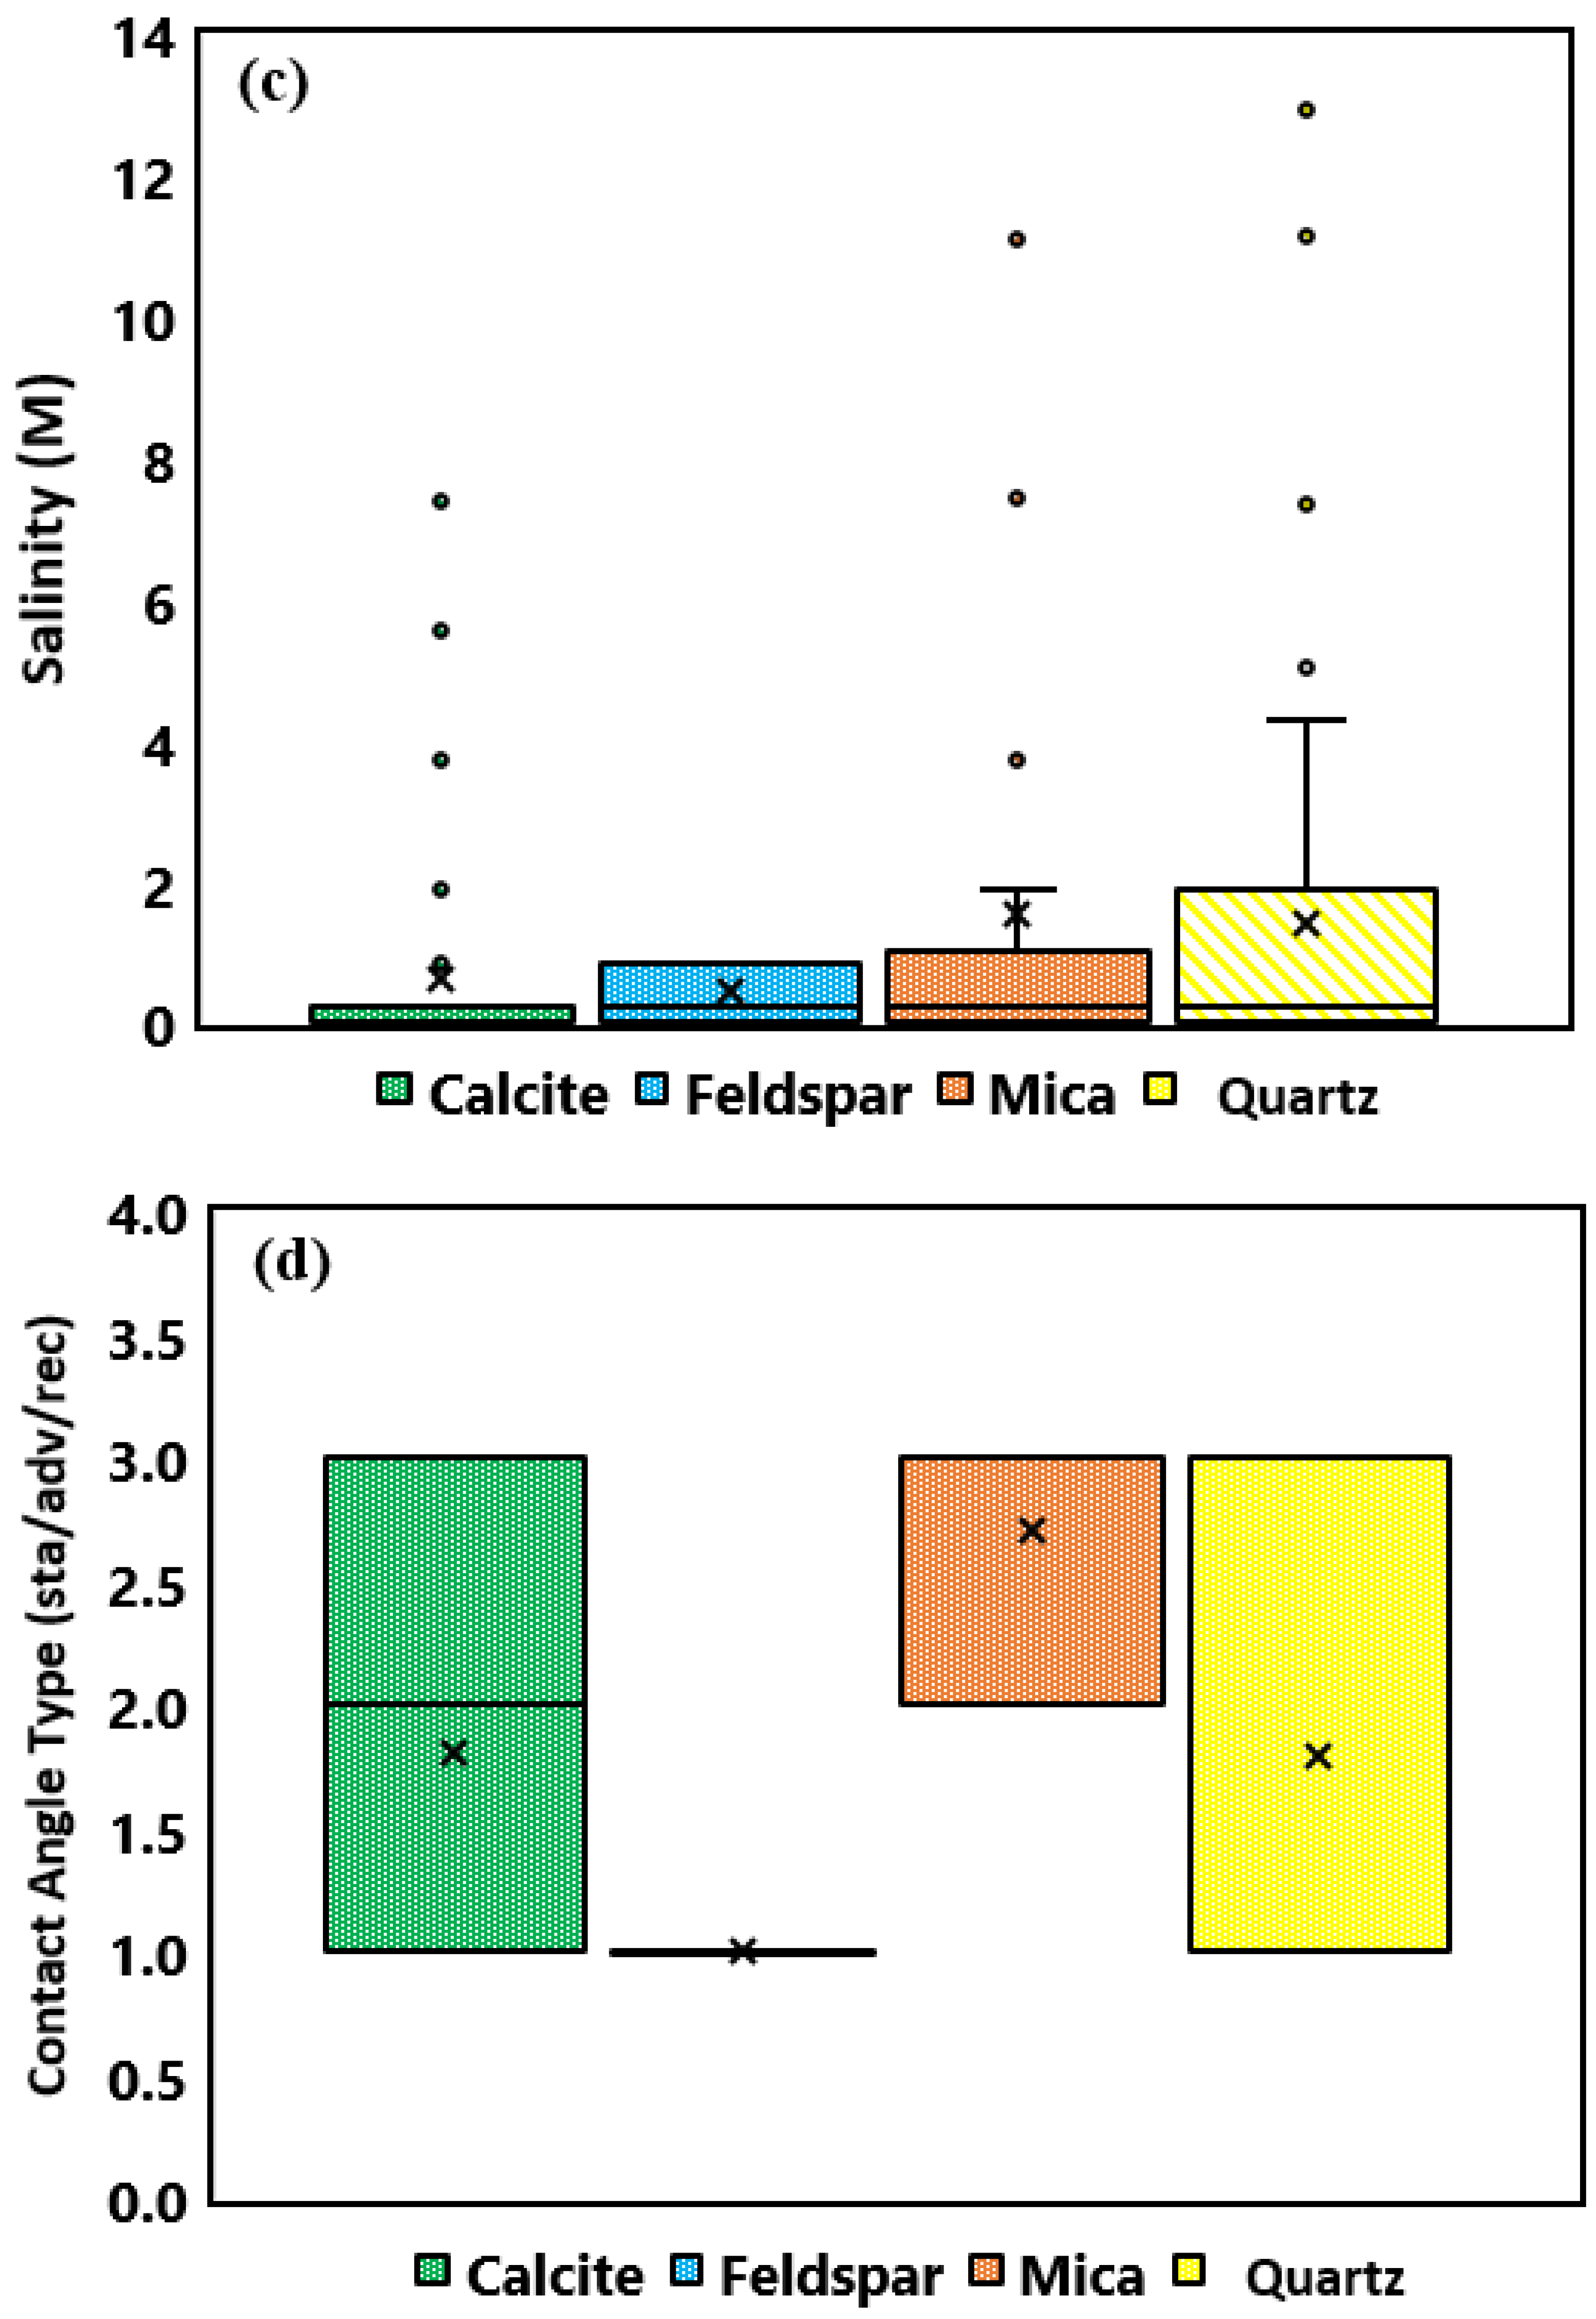
2.1. Data Collection
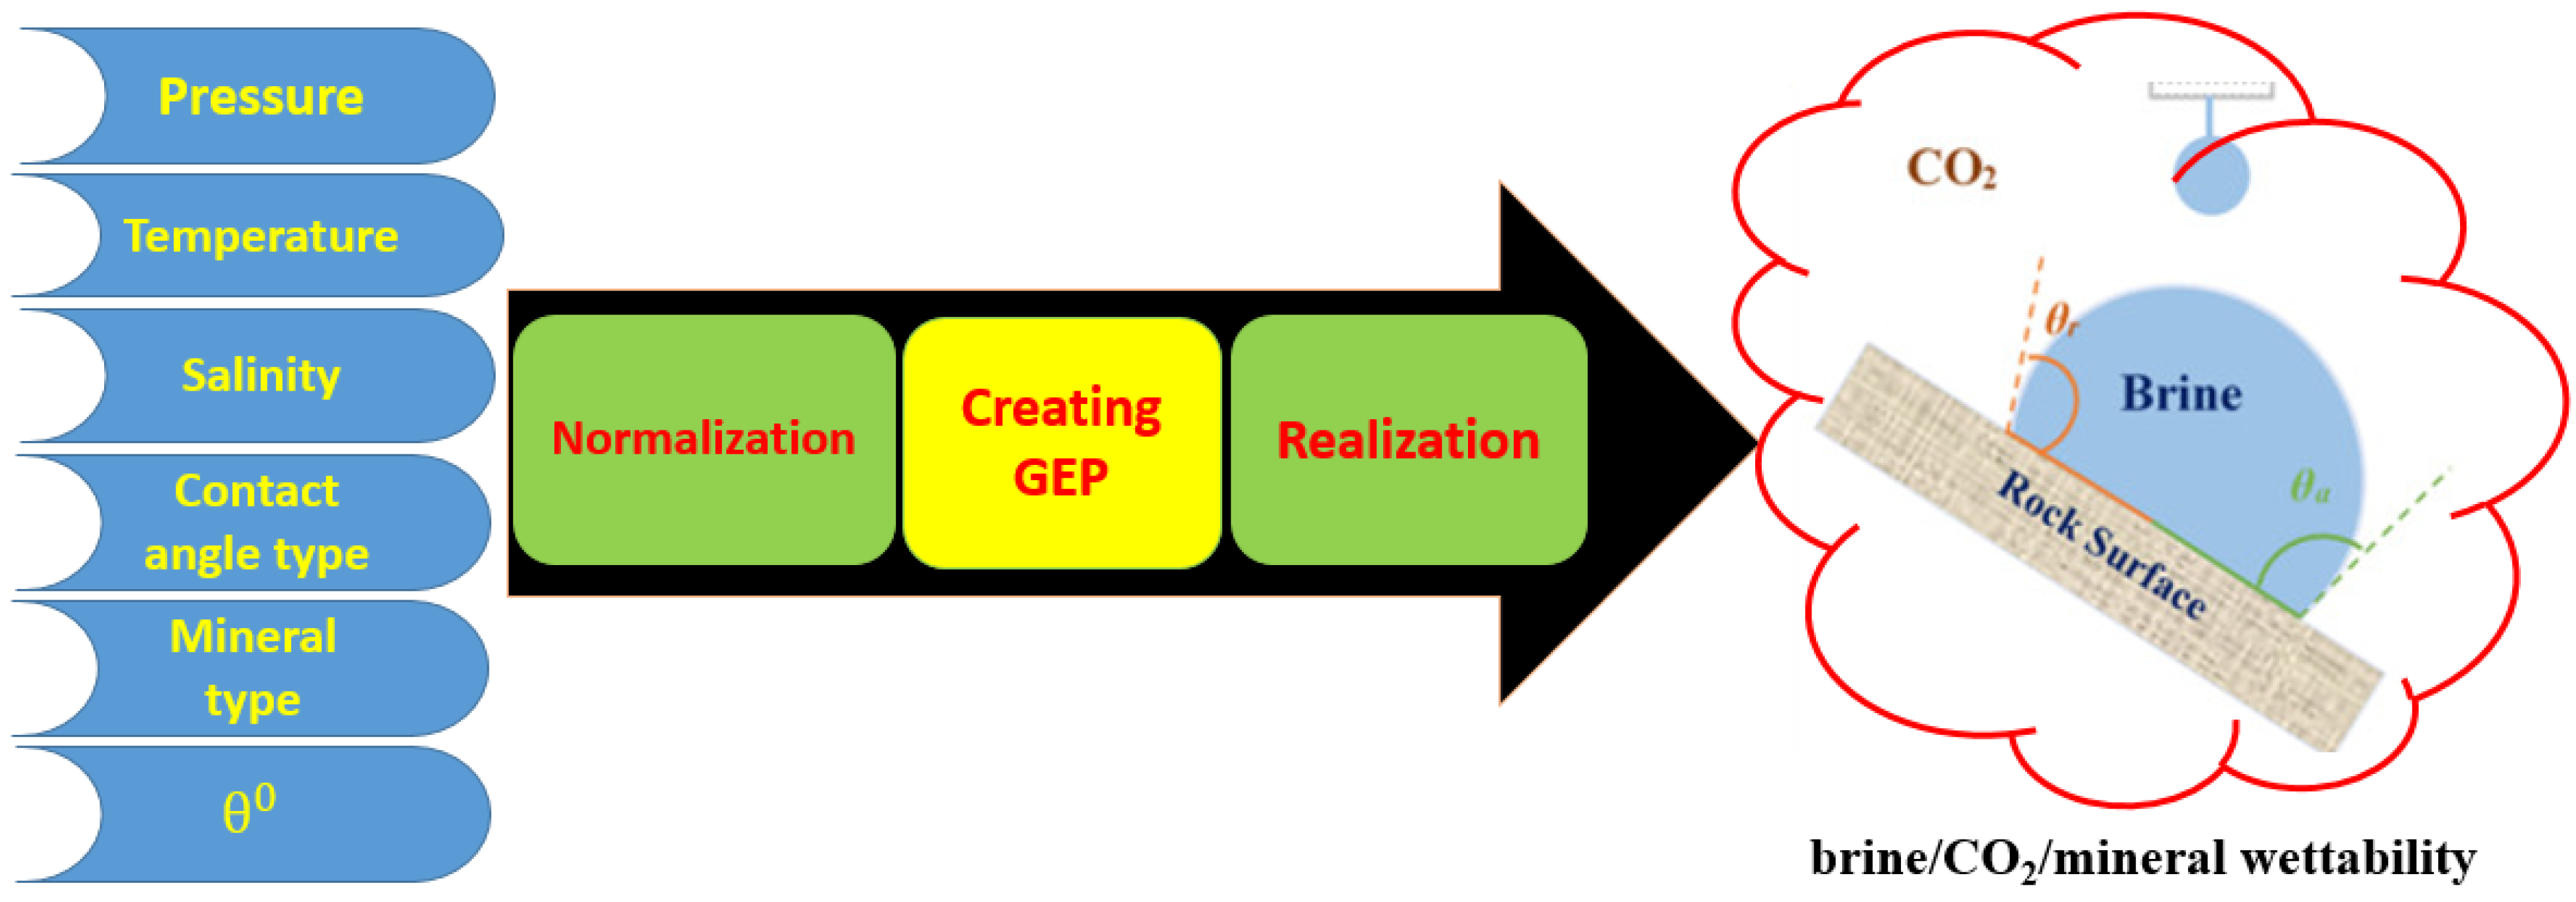
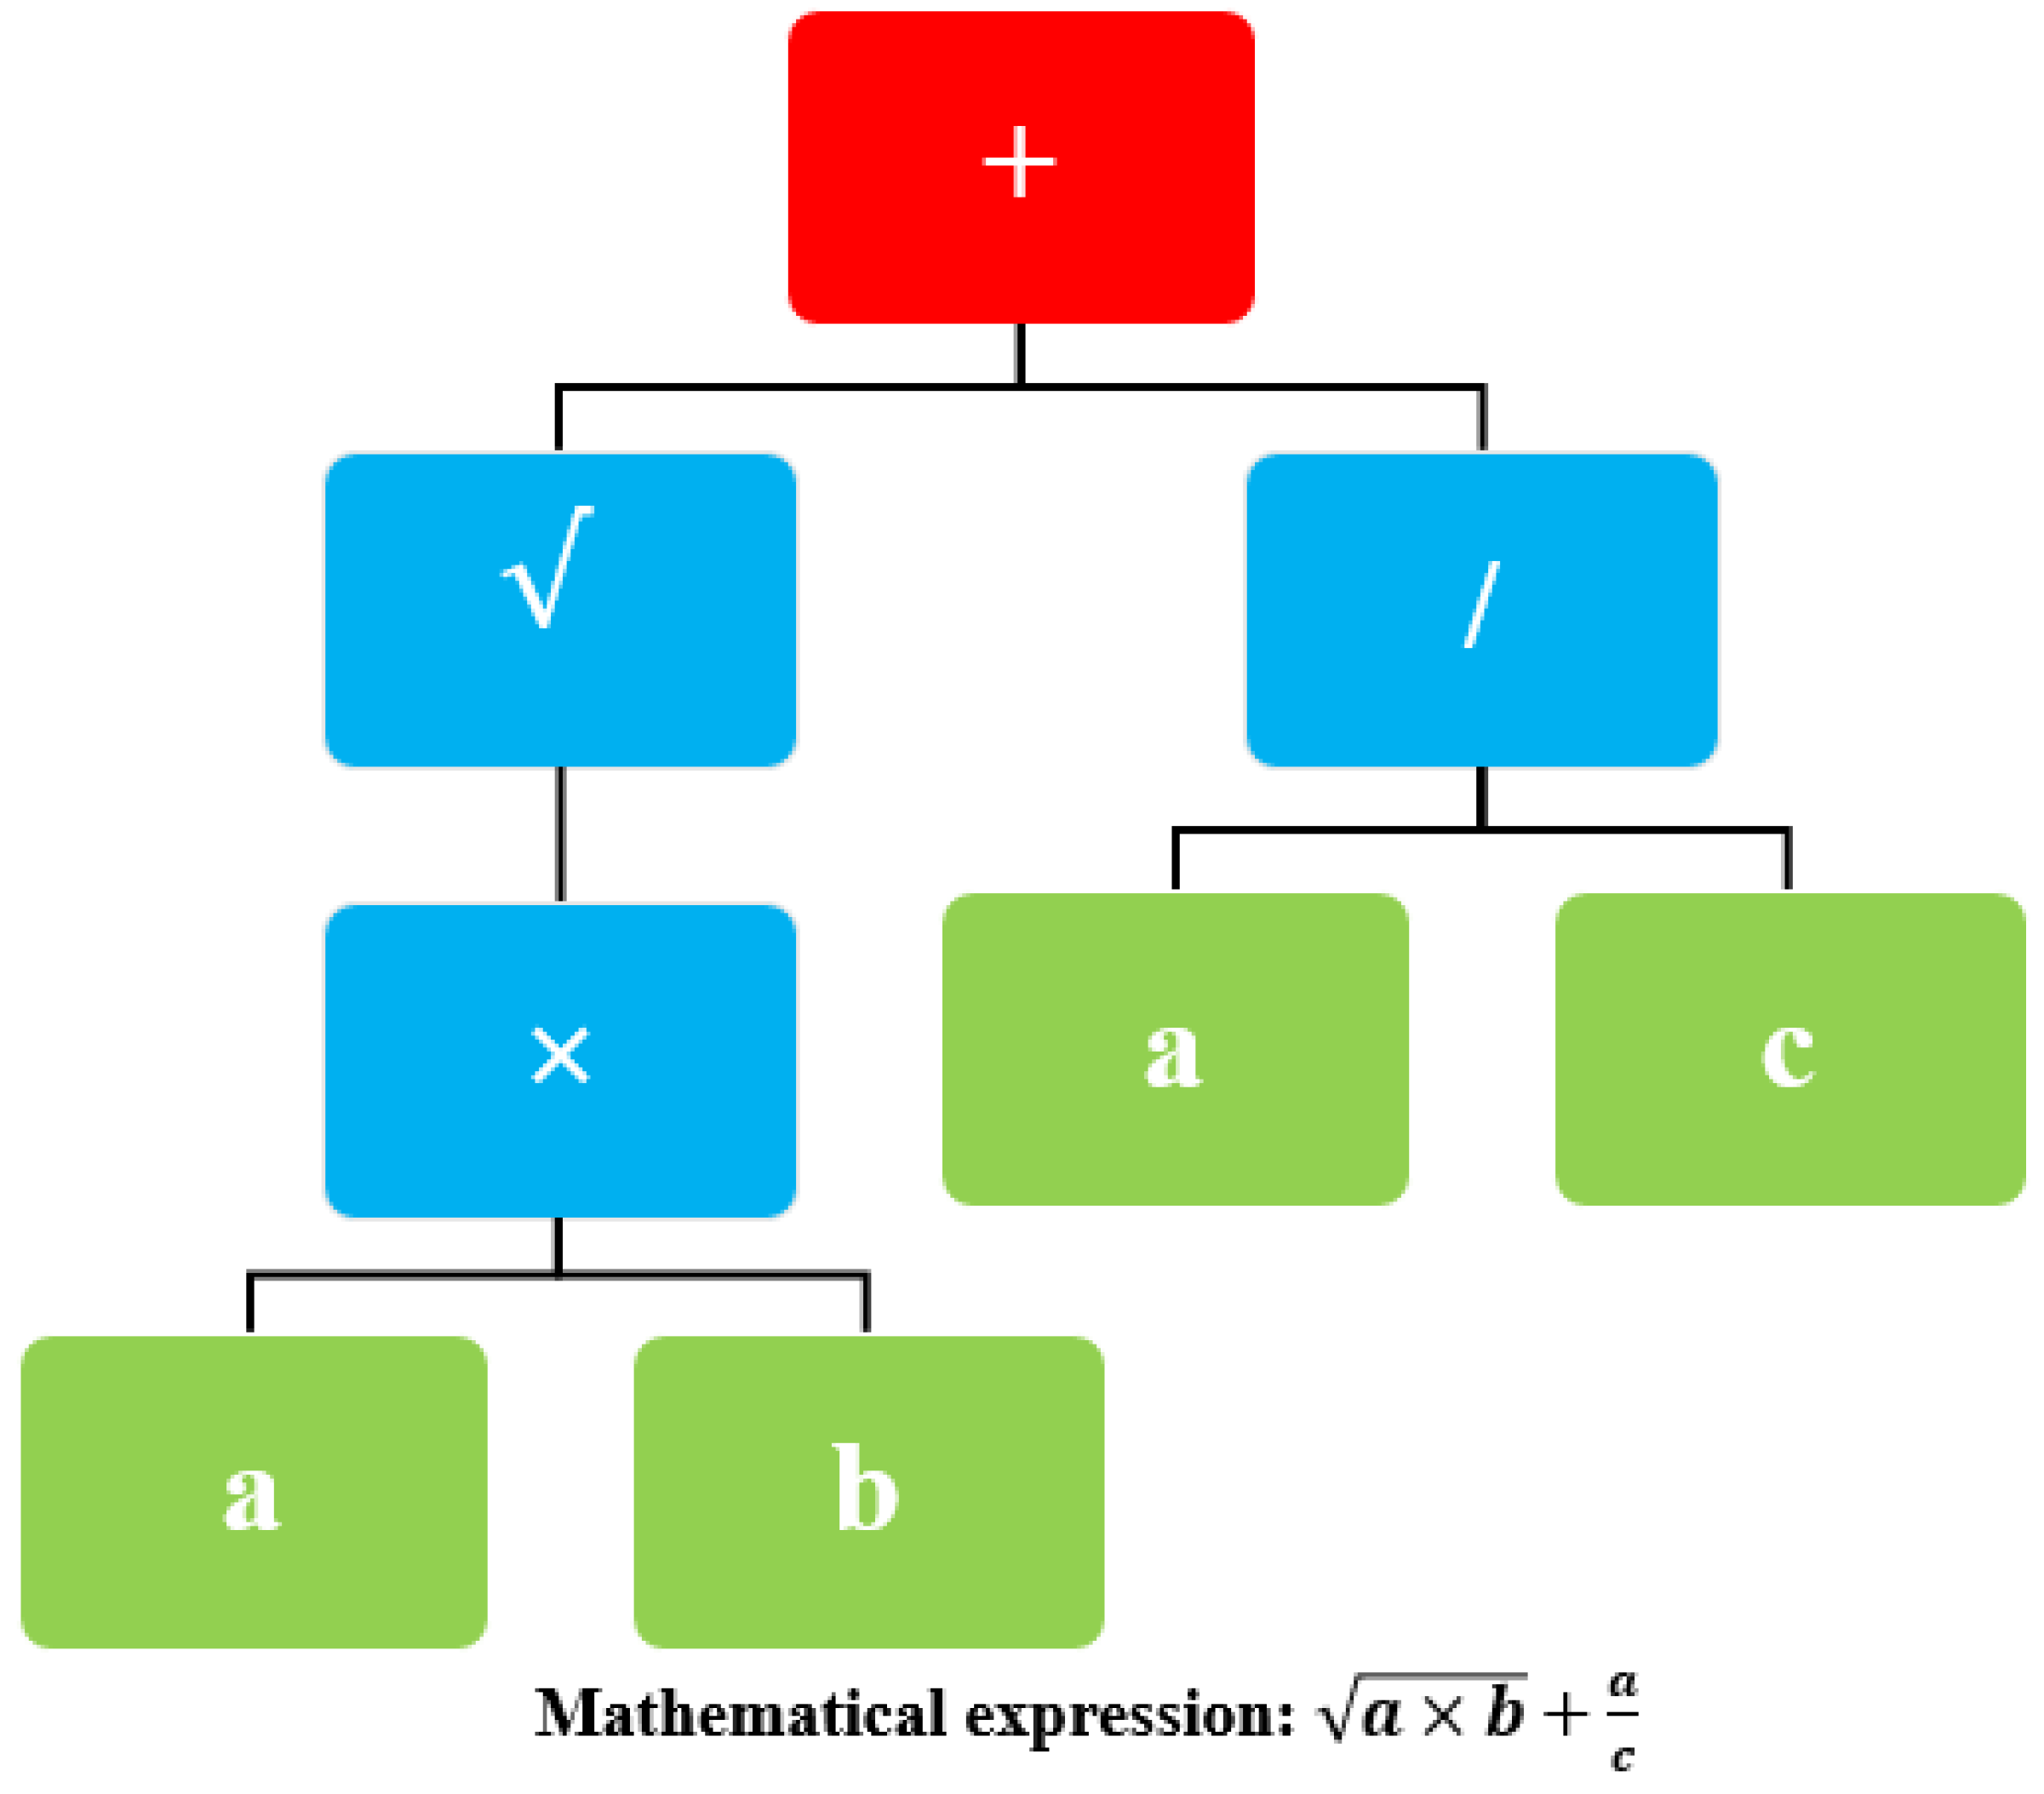
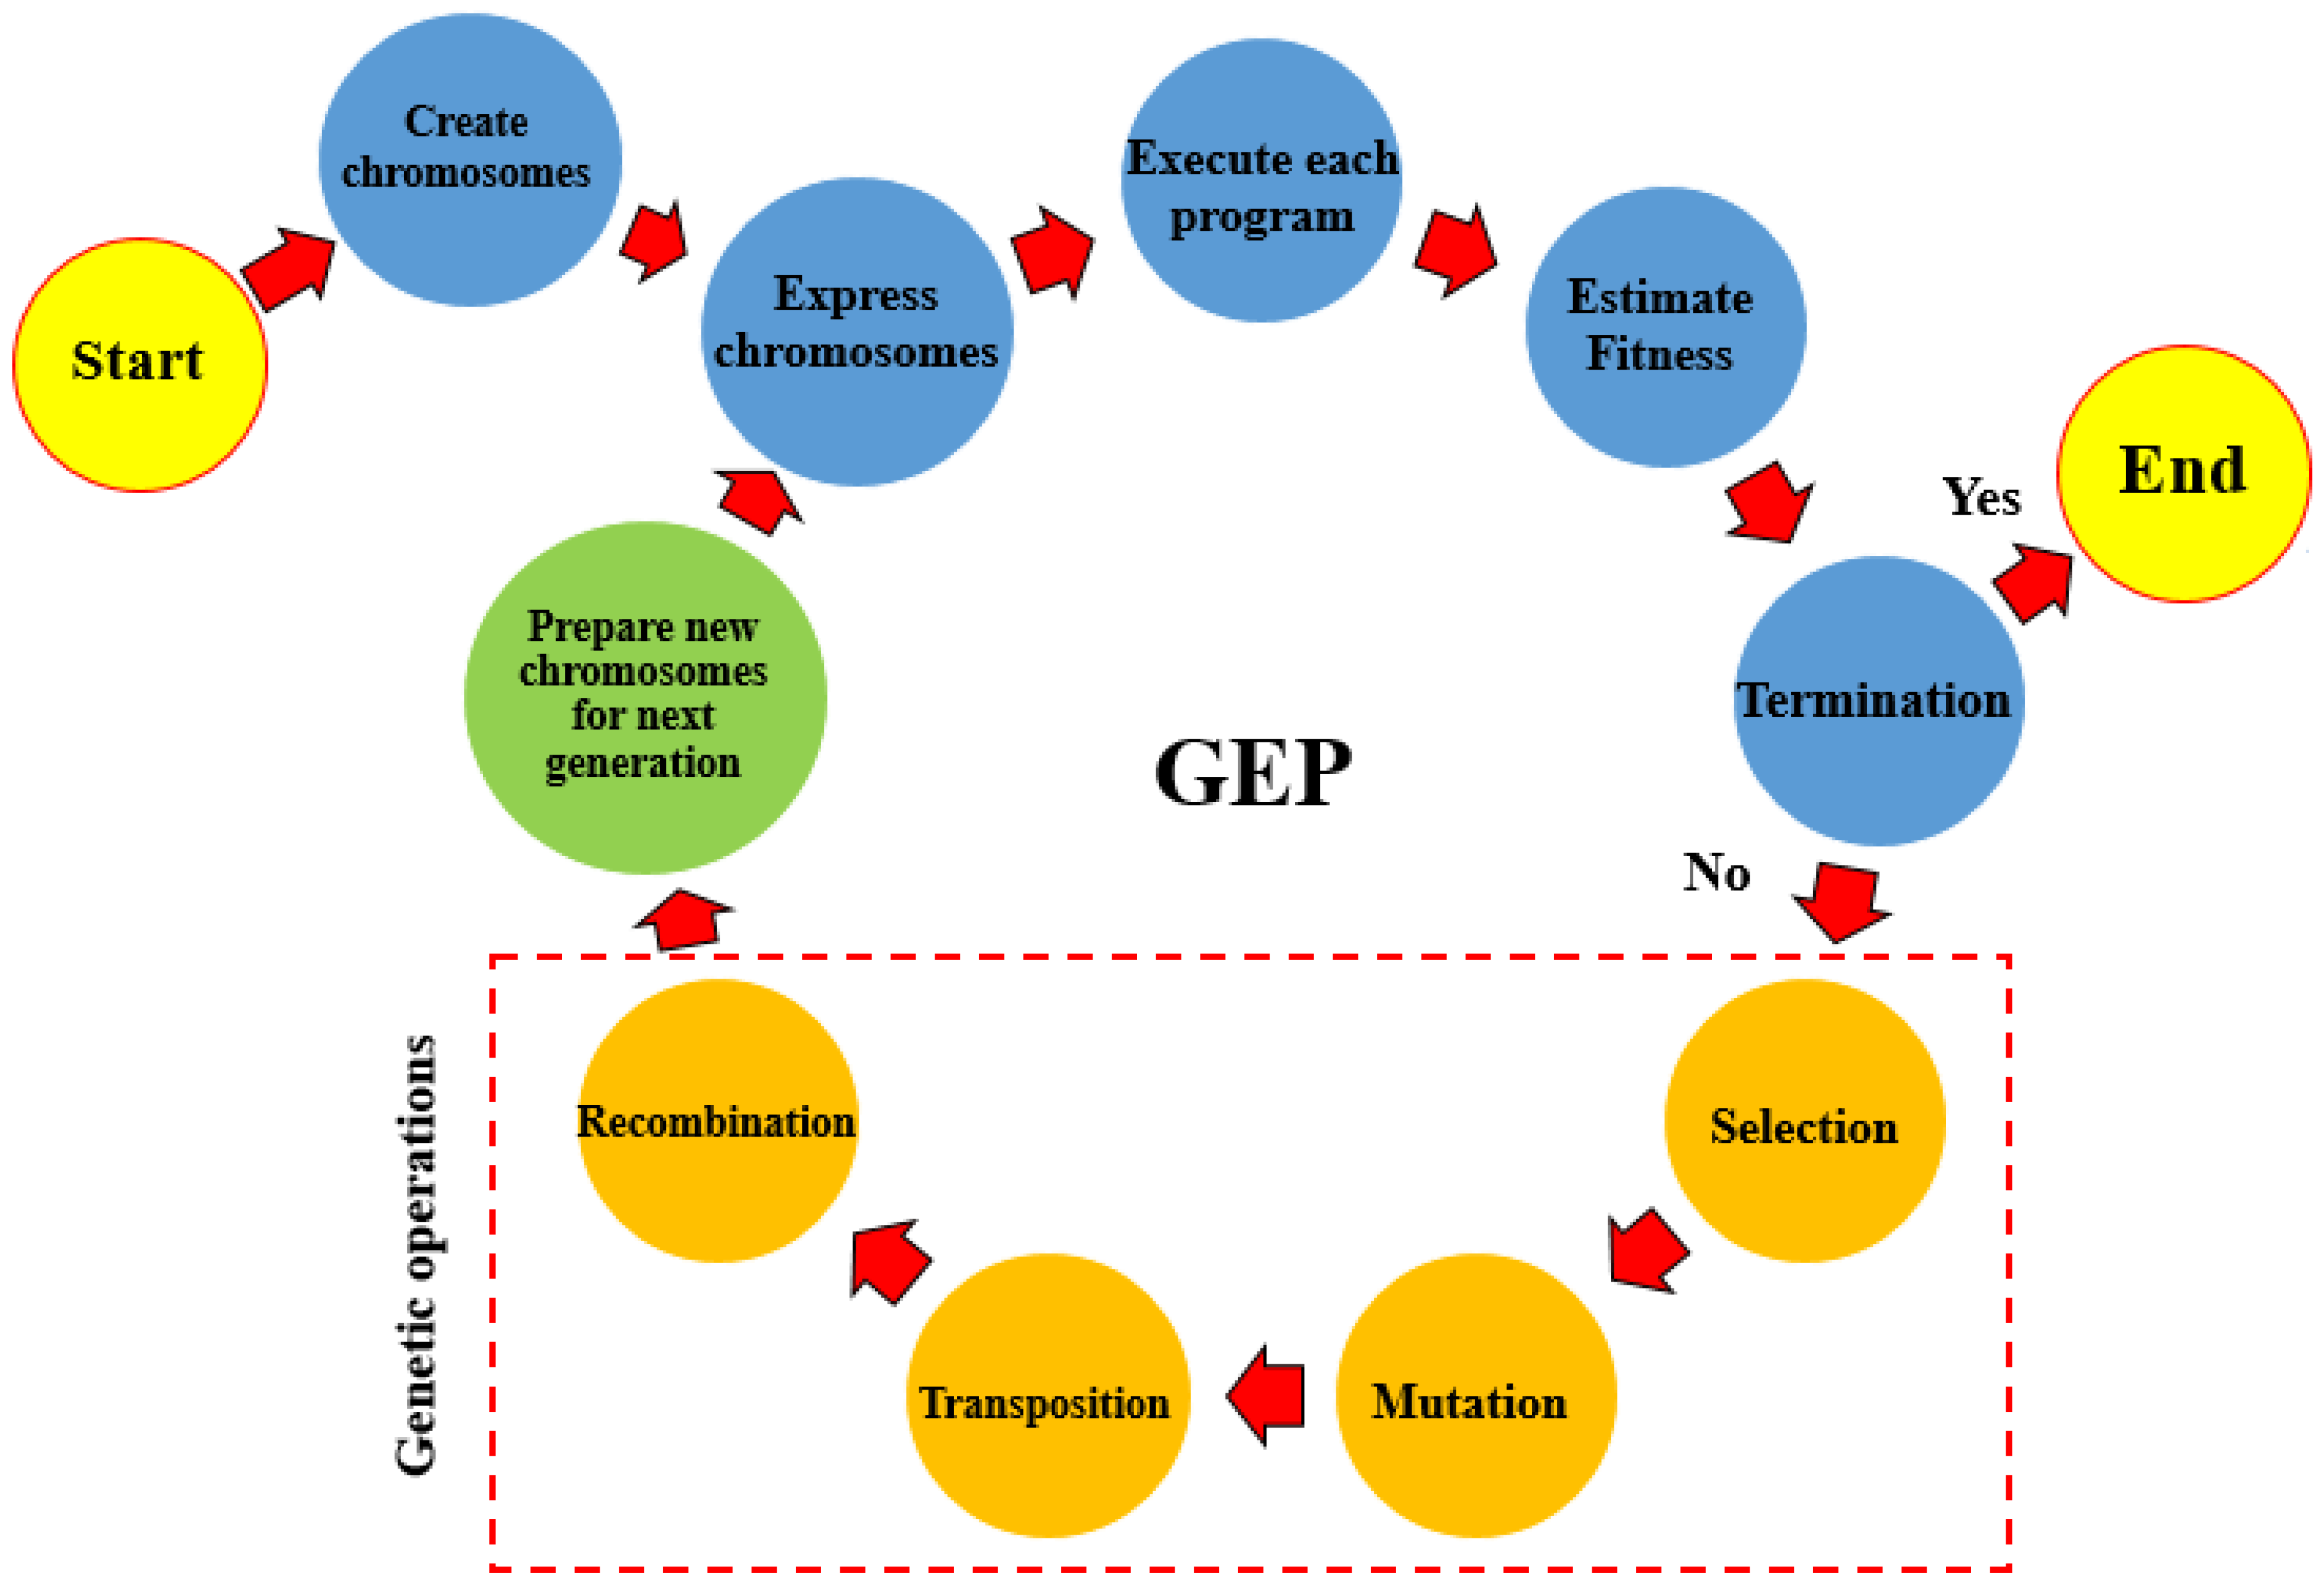
2.2. Gene Expression Programming (GEP)
2.3. Model Development
- A.
- Average percent relative error (APRE). It measures the relative deviation from the experimental data and is defined by:
- B.
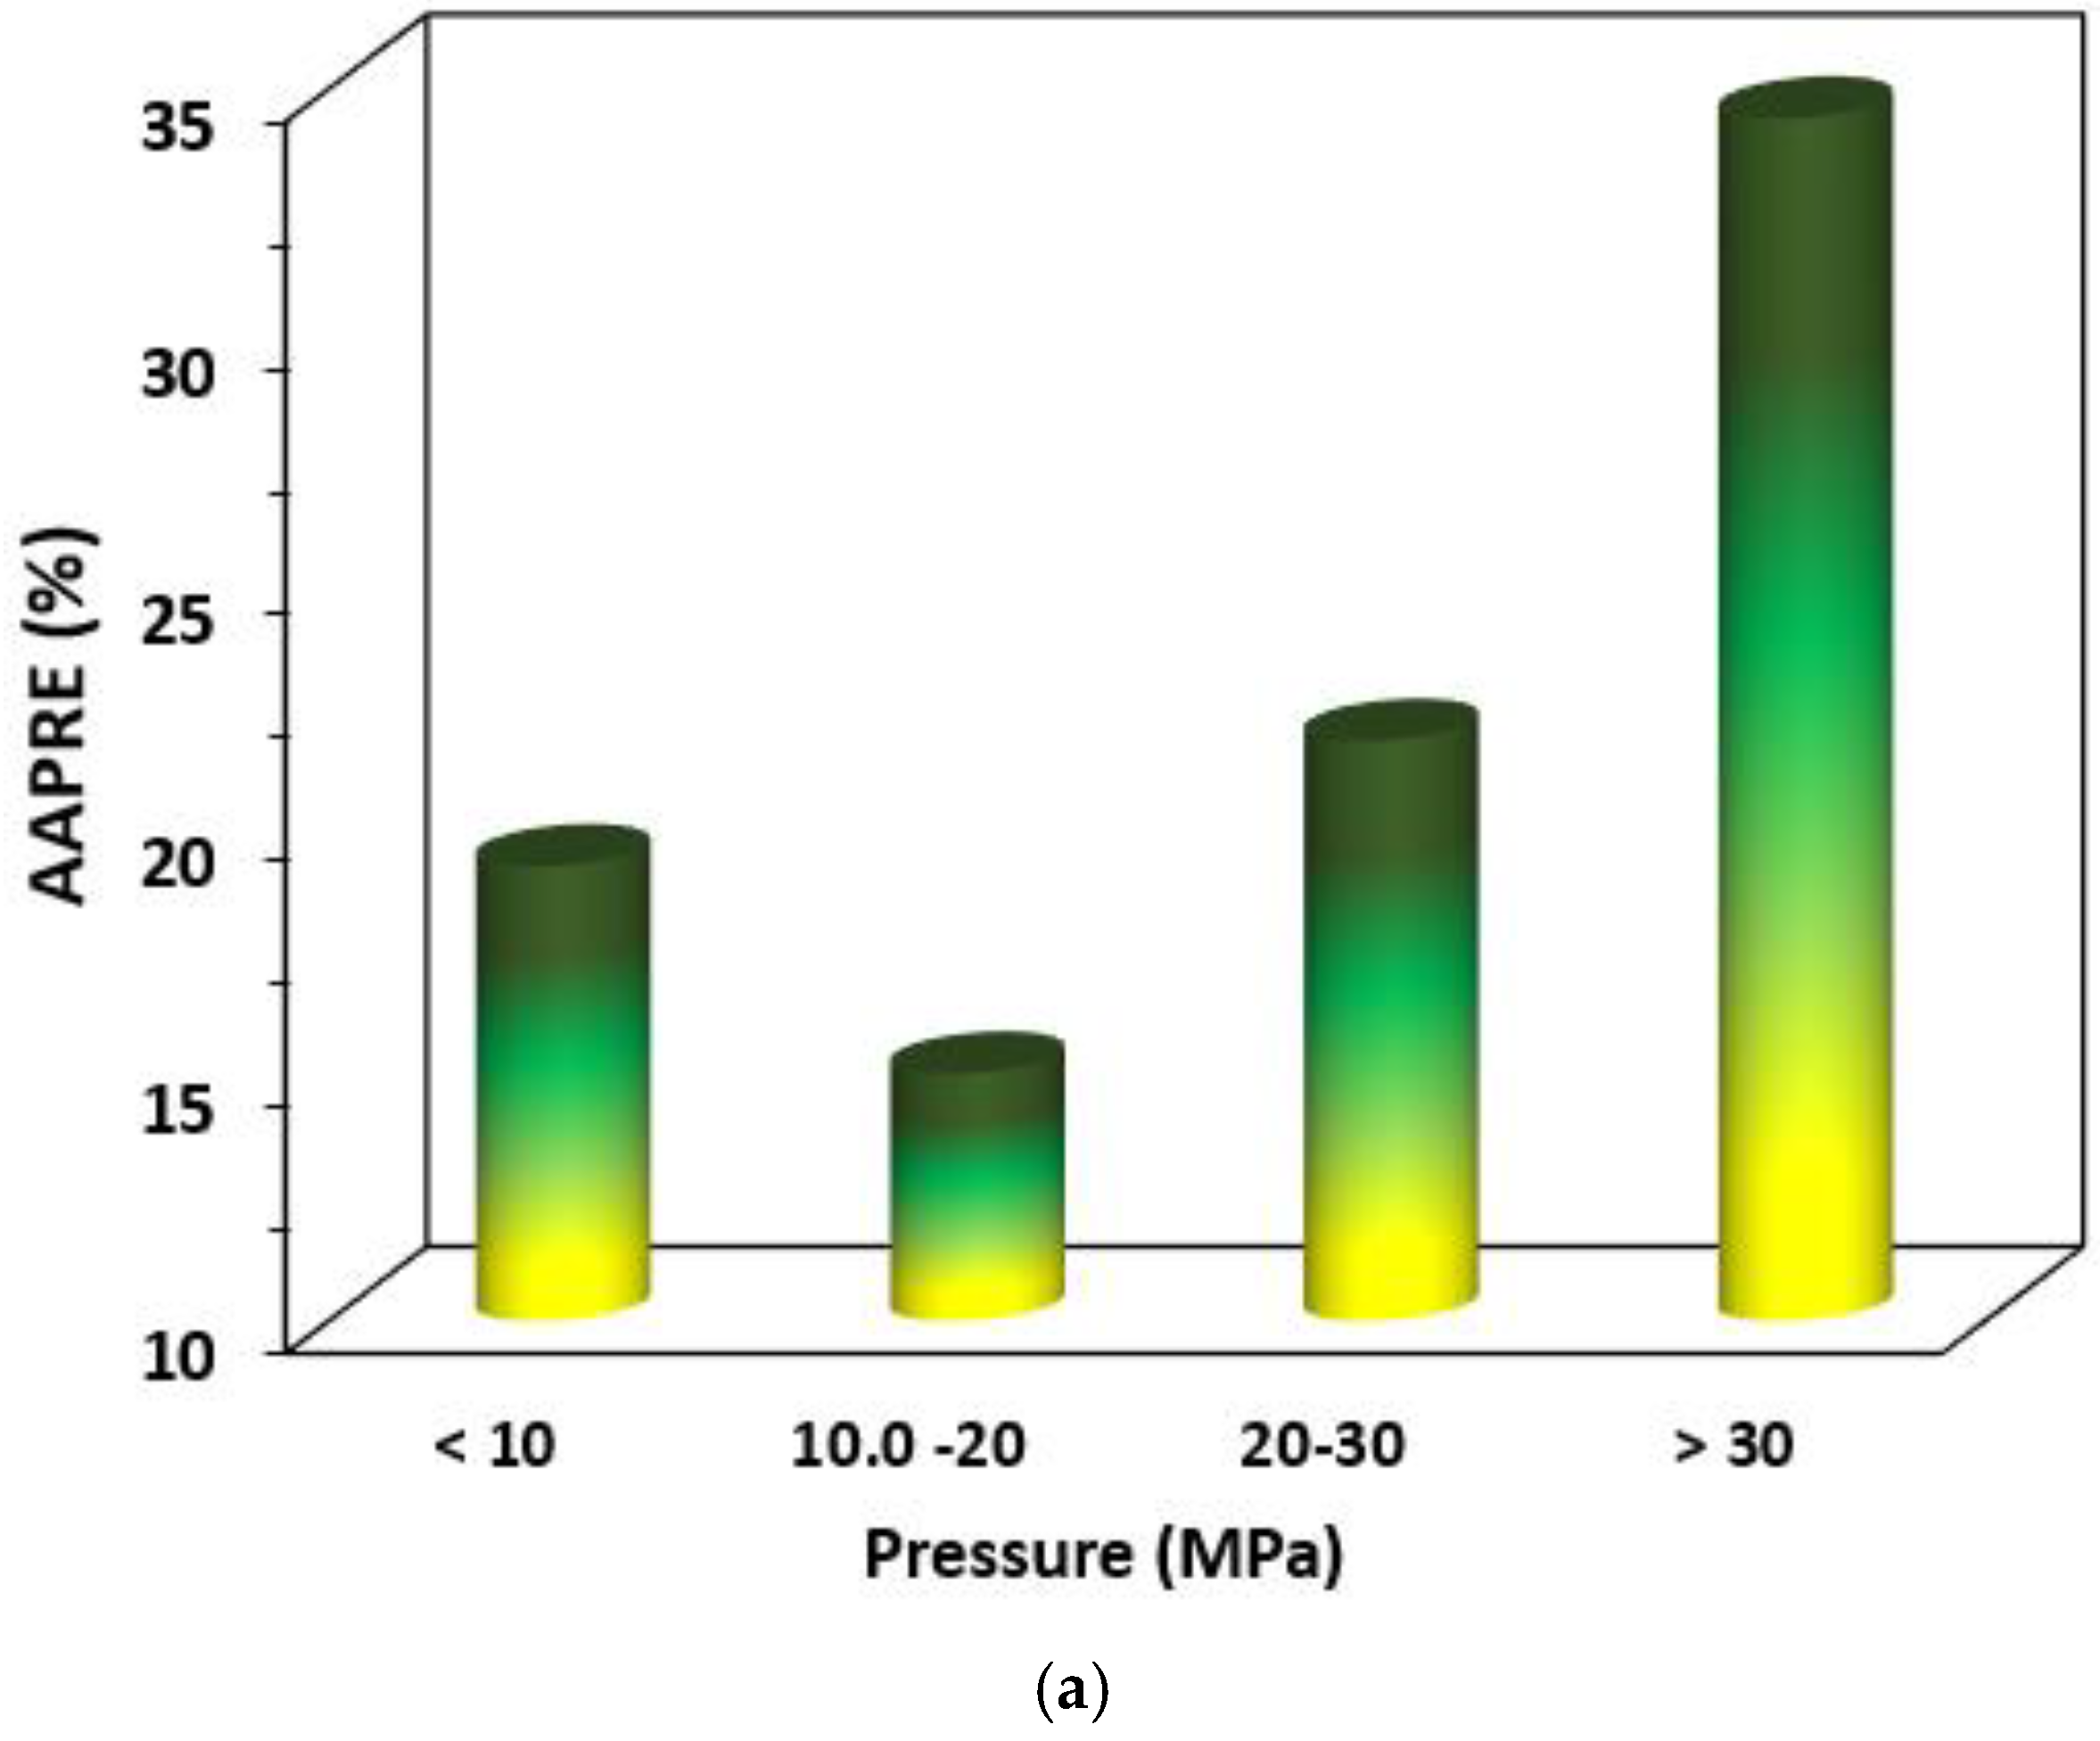
- Average absolute percent relative error (AAPRE). It measures the relative absolute deviation from the experimental data and is defined as:
- C.
- Root mean square error (RMSE). It measures the data dispersion around the zero deviation and is defined by:
- D.
- Standard deviation (SD). It is a measure of dispersion, and a lower value shows a smaller degree of scattering. It is defined as:
- E.
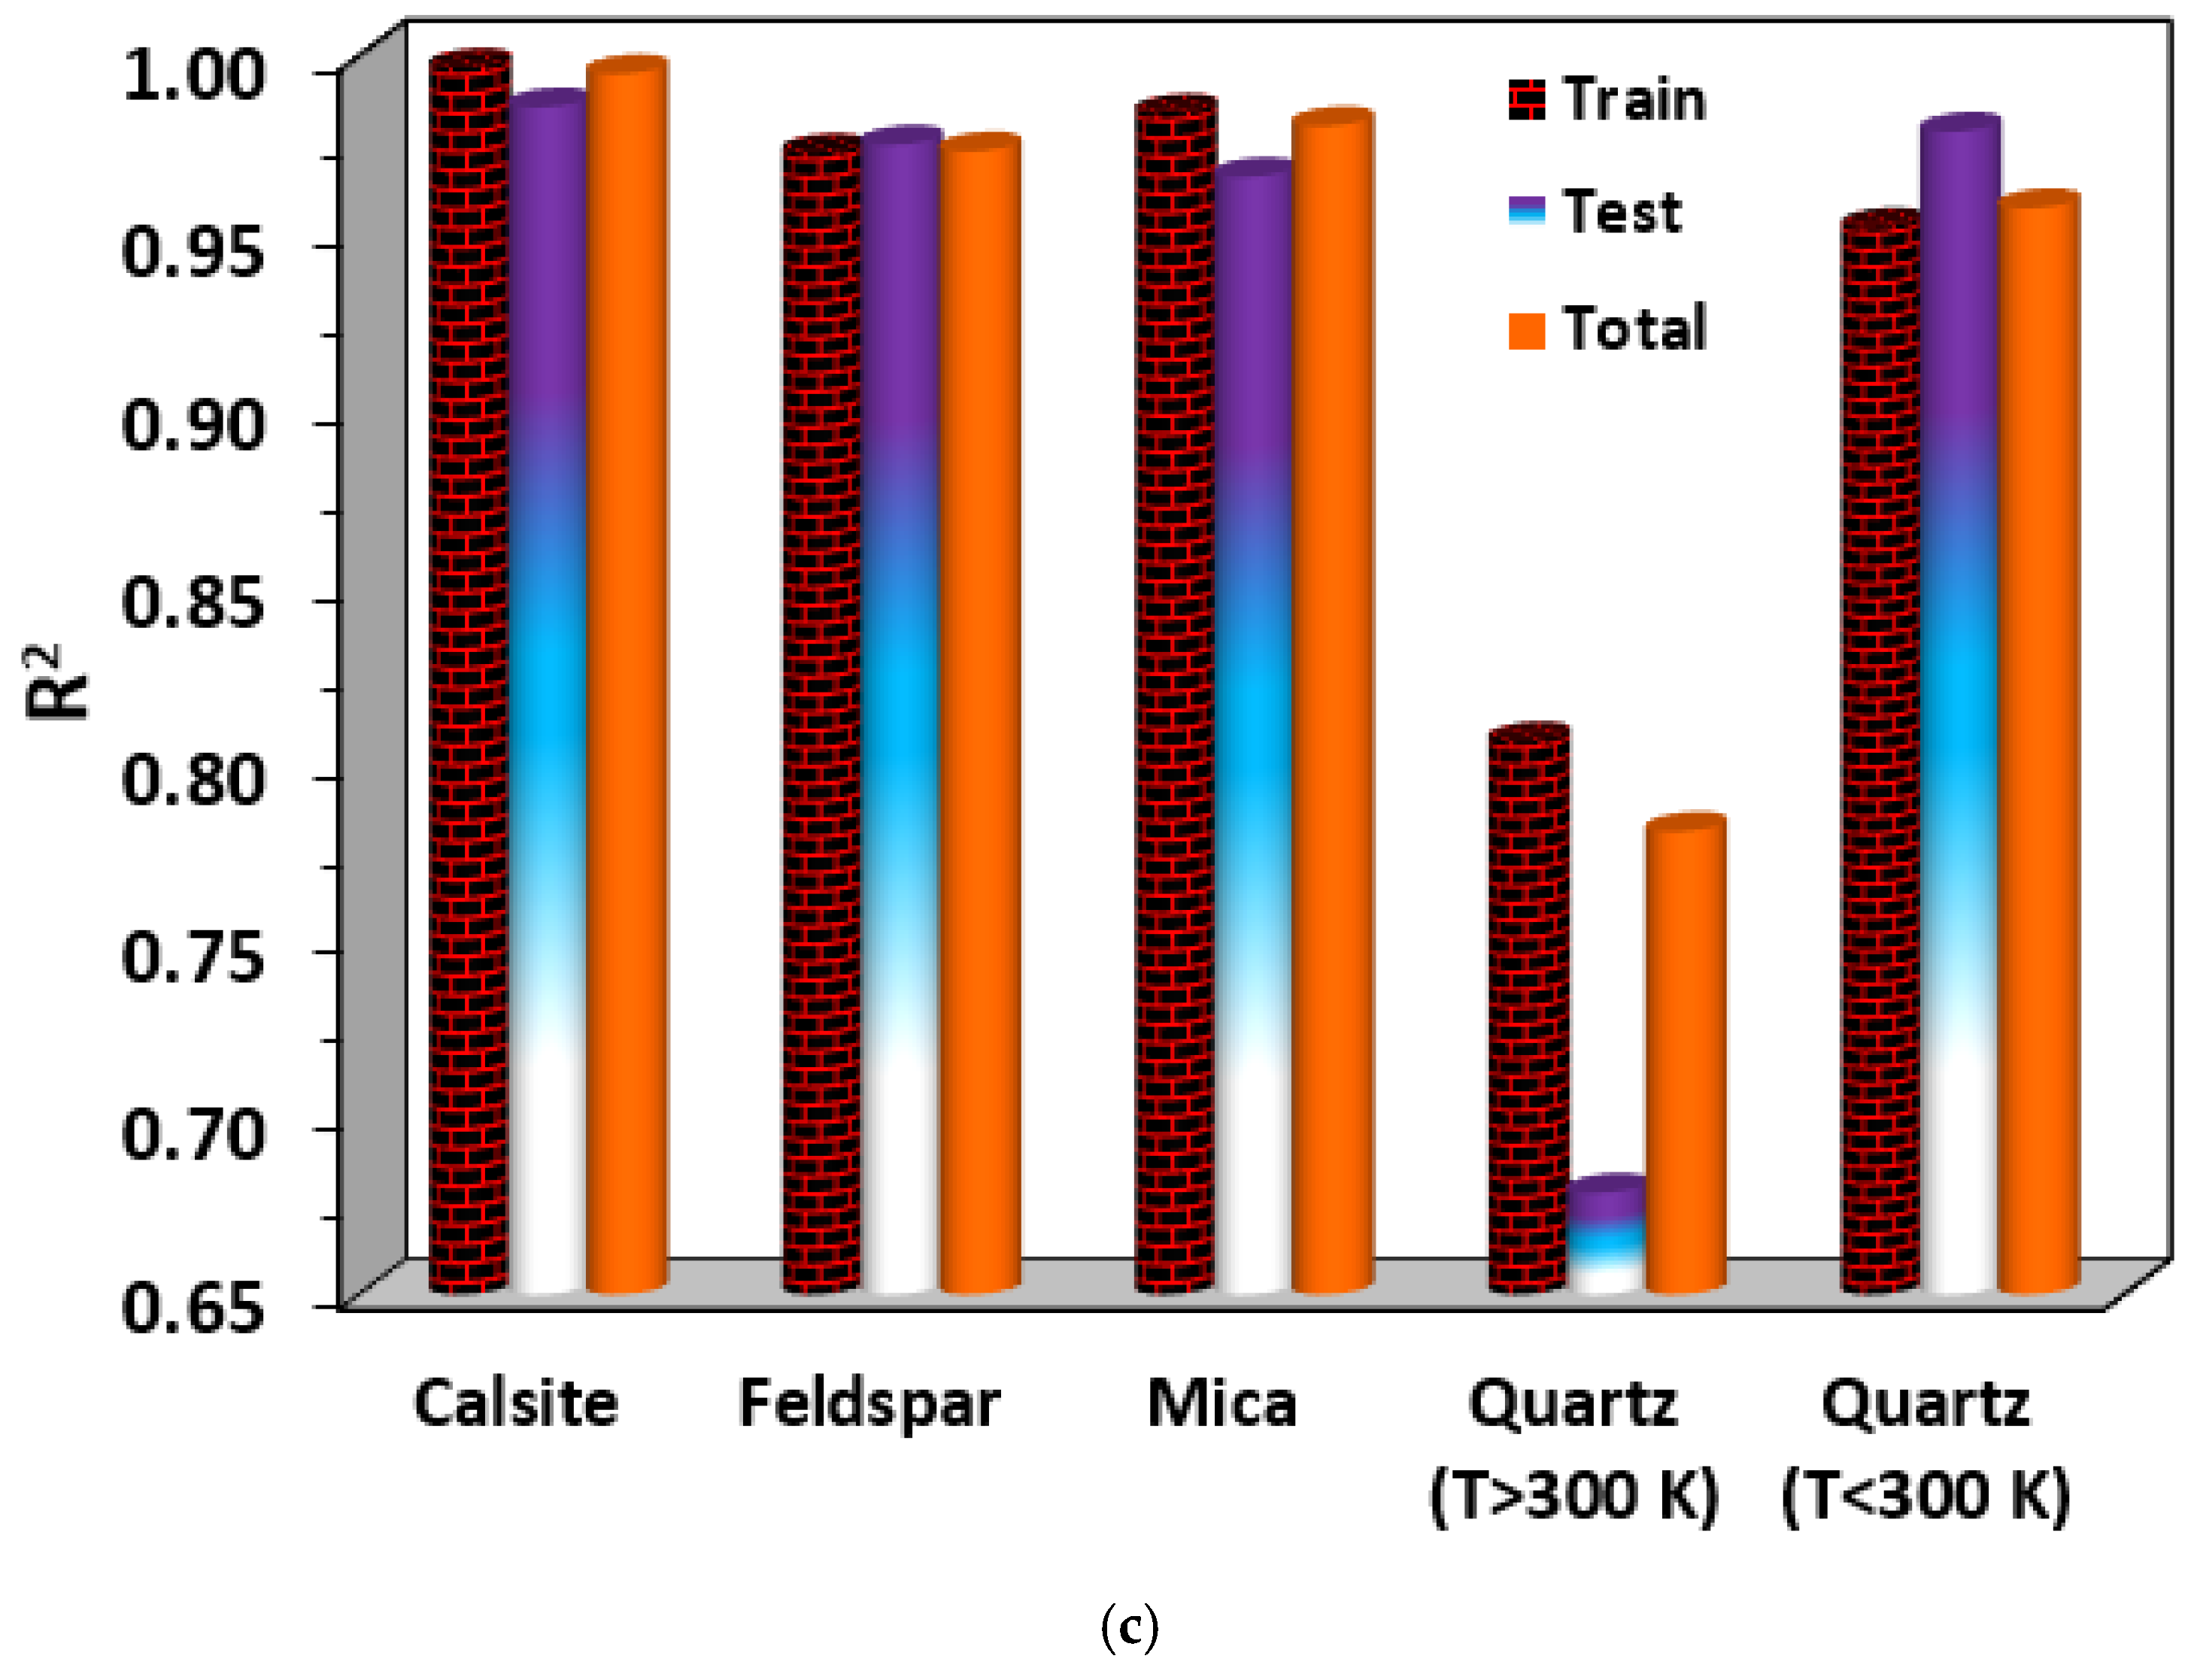
- Coefficient of determination (R2). It is a simple statistical parameter that exhibits how a good model matches the data. The closer the R2 value is to 1 confirms the better fitting of the model. It is defined as:
3. Results and Discussion
3.1. Model Implementation
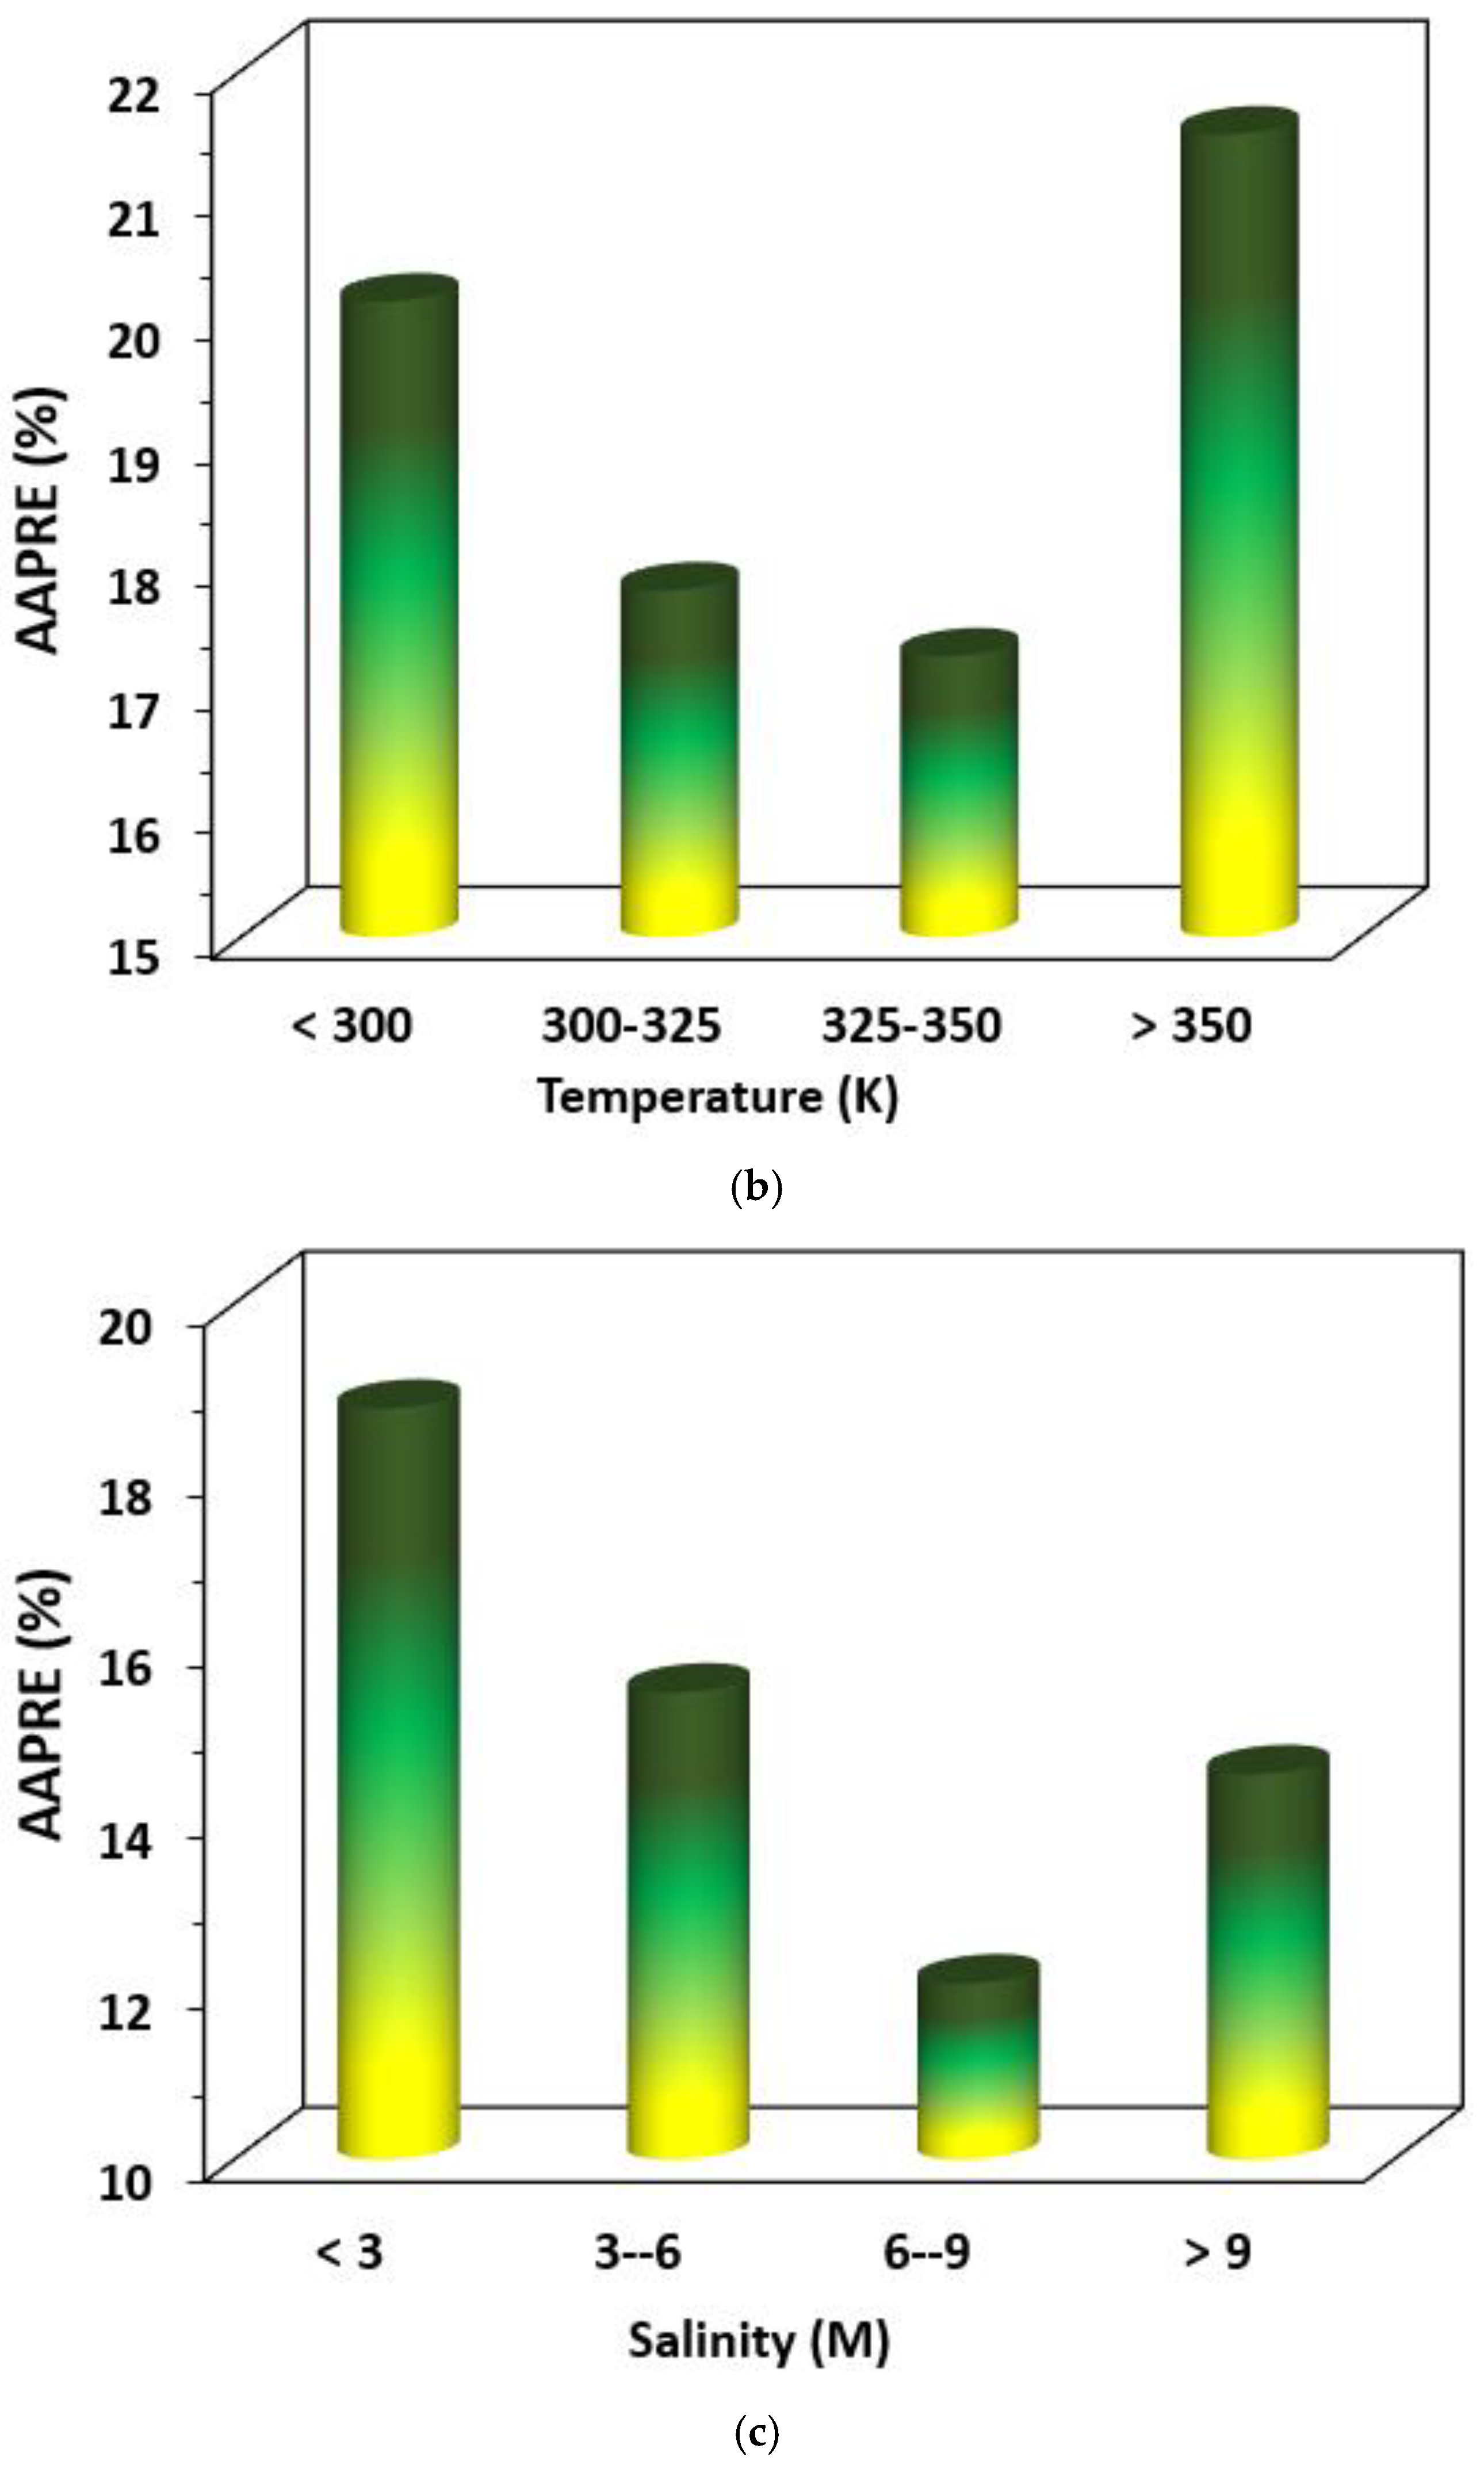
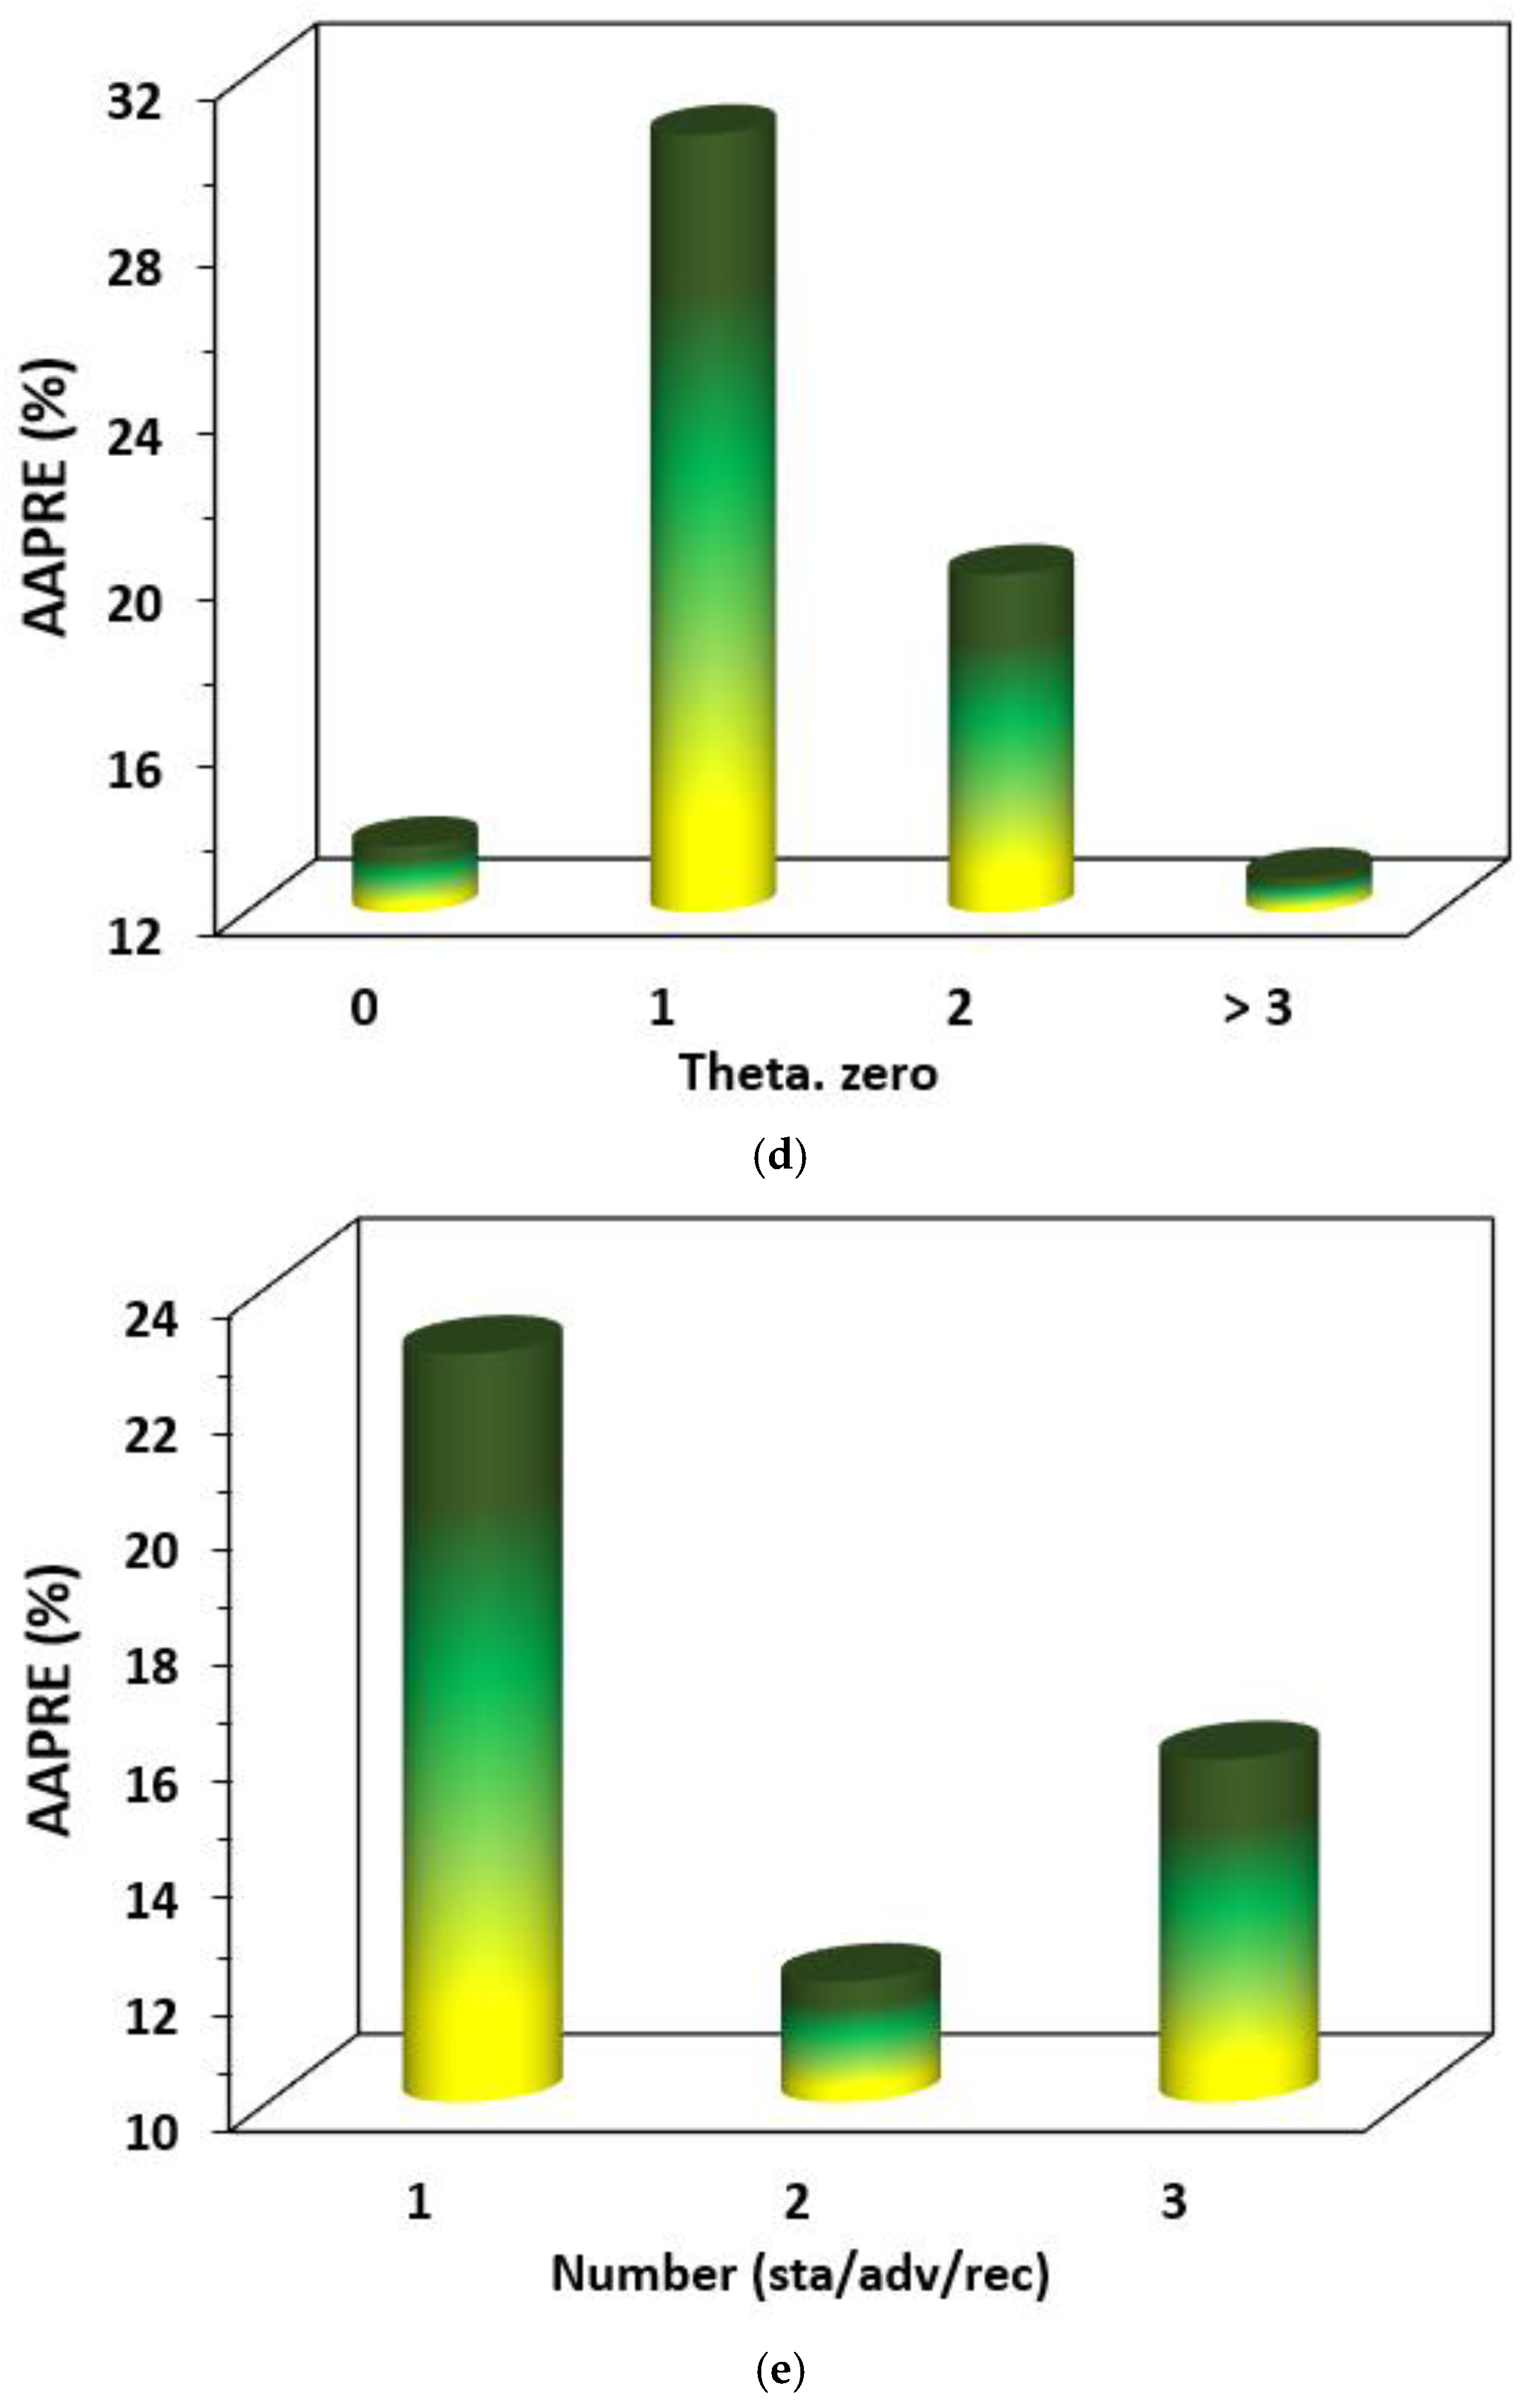
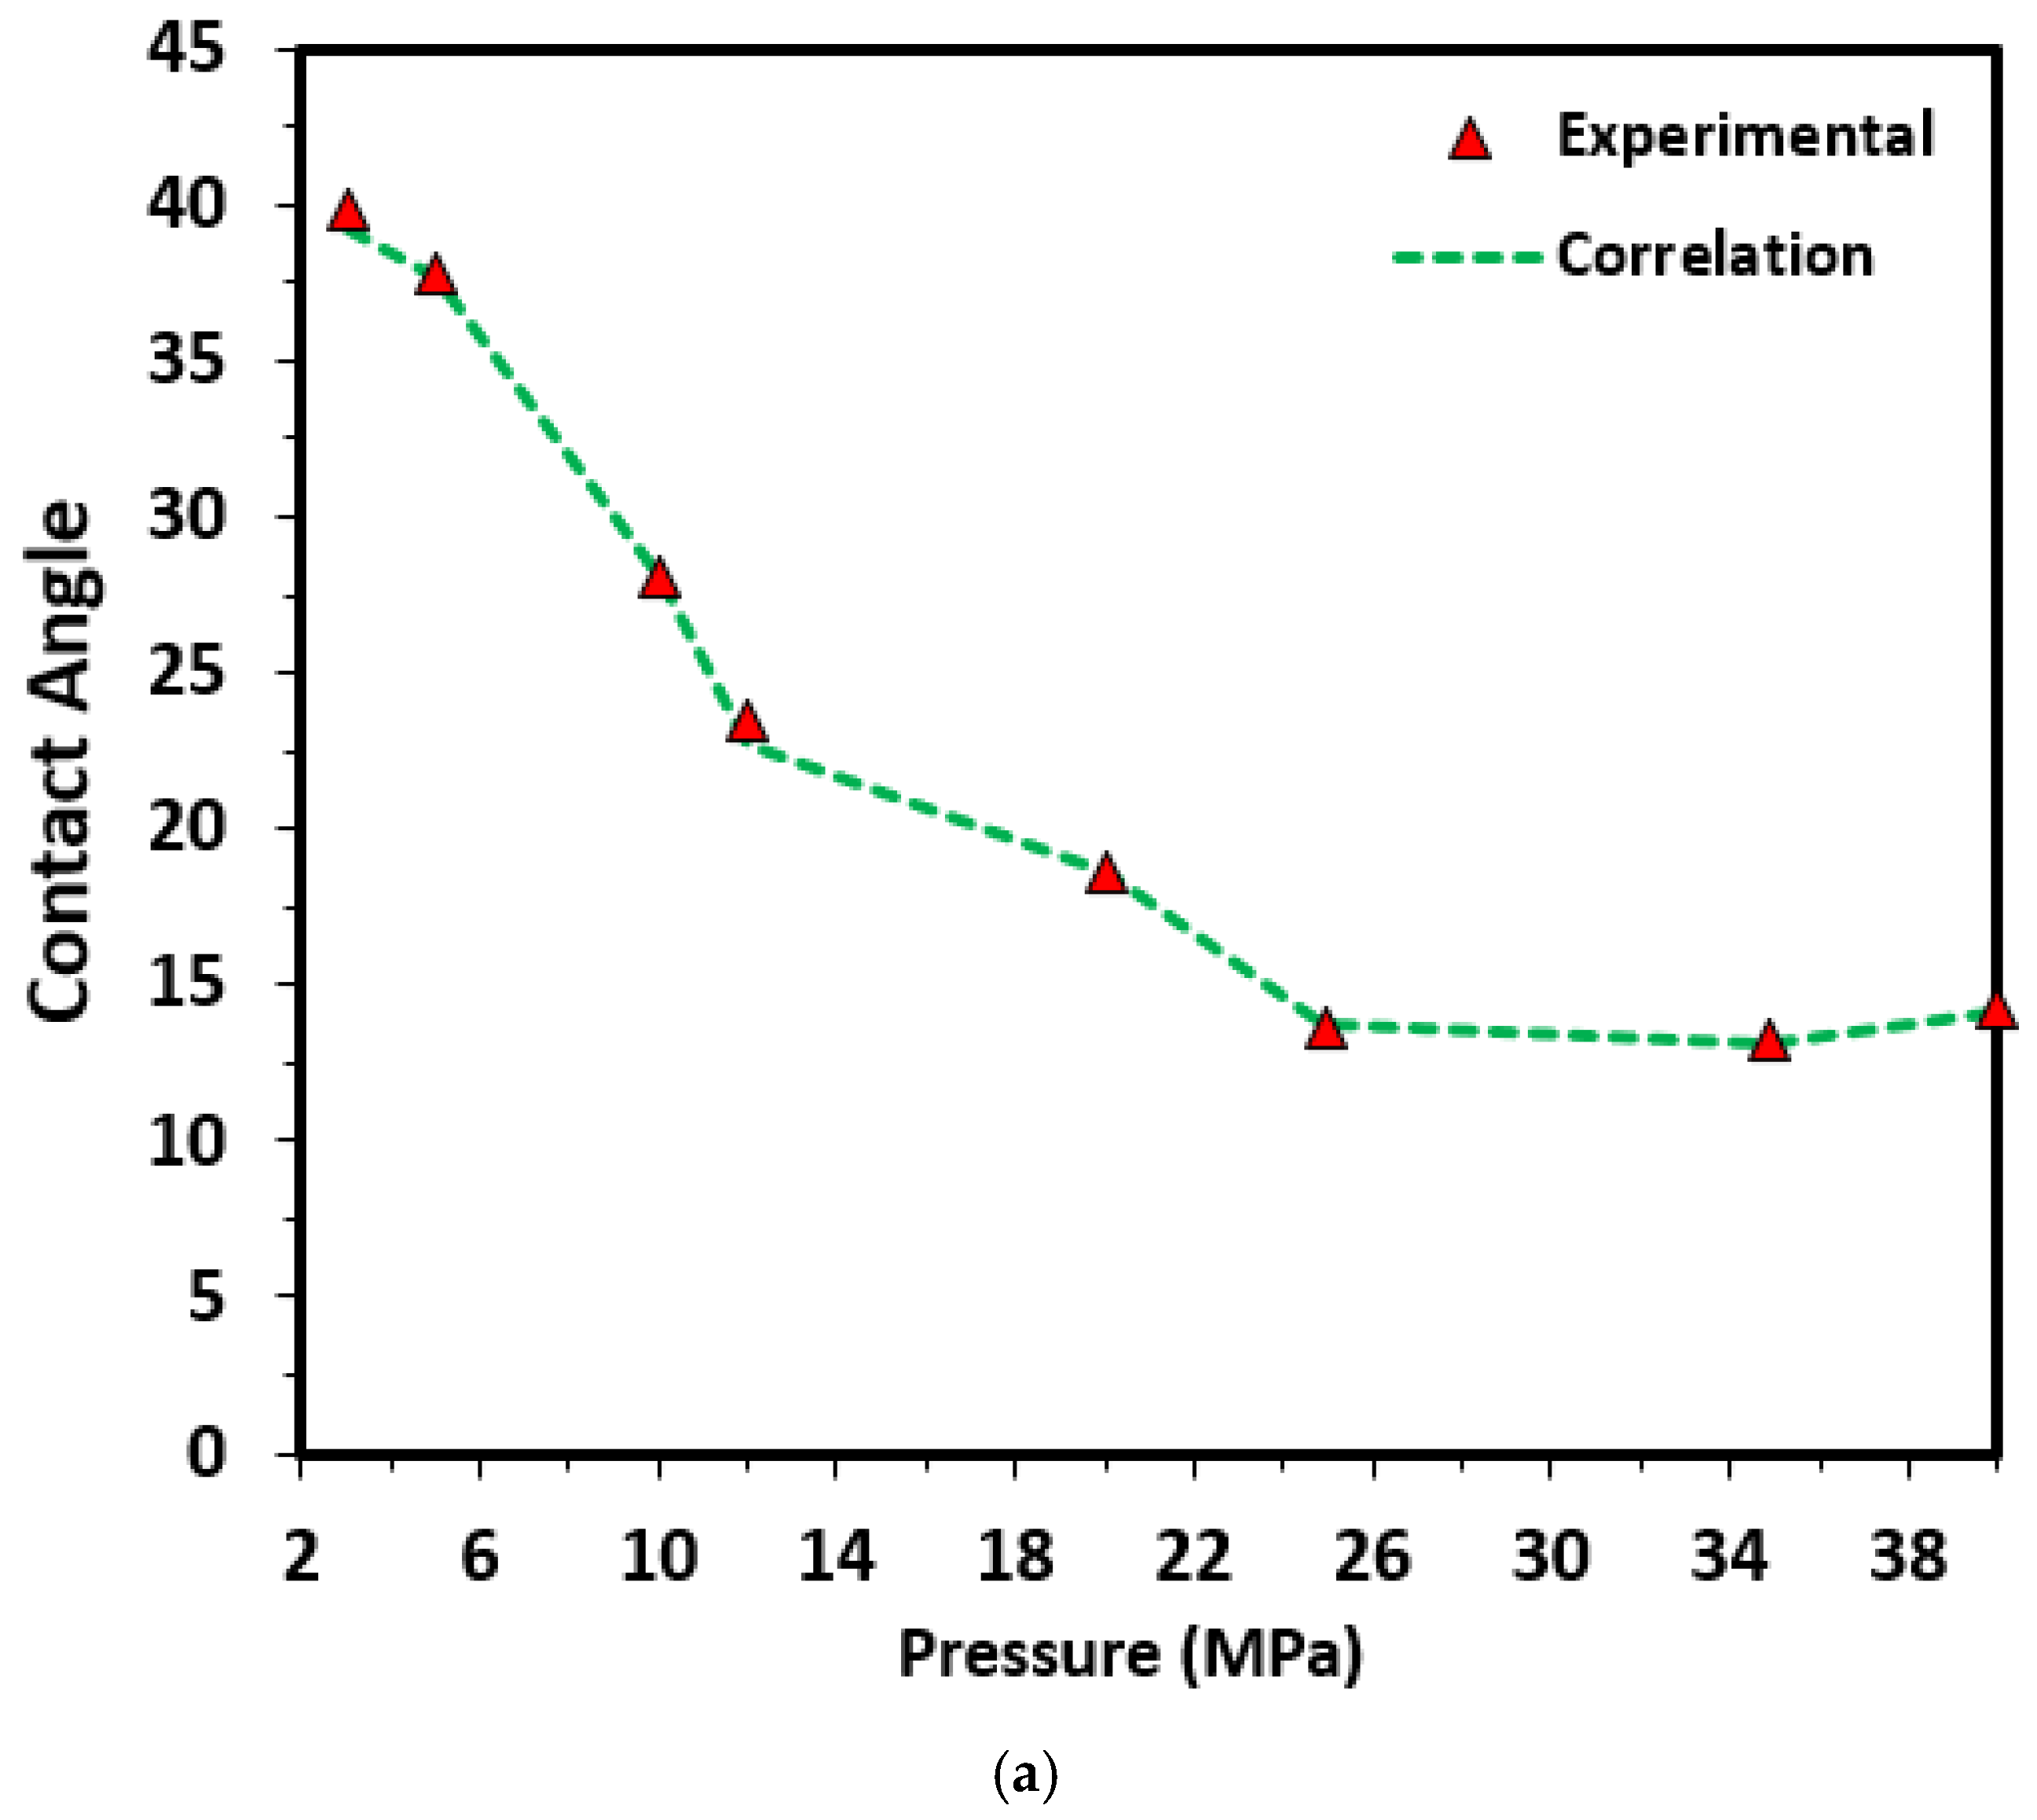
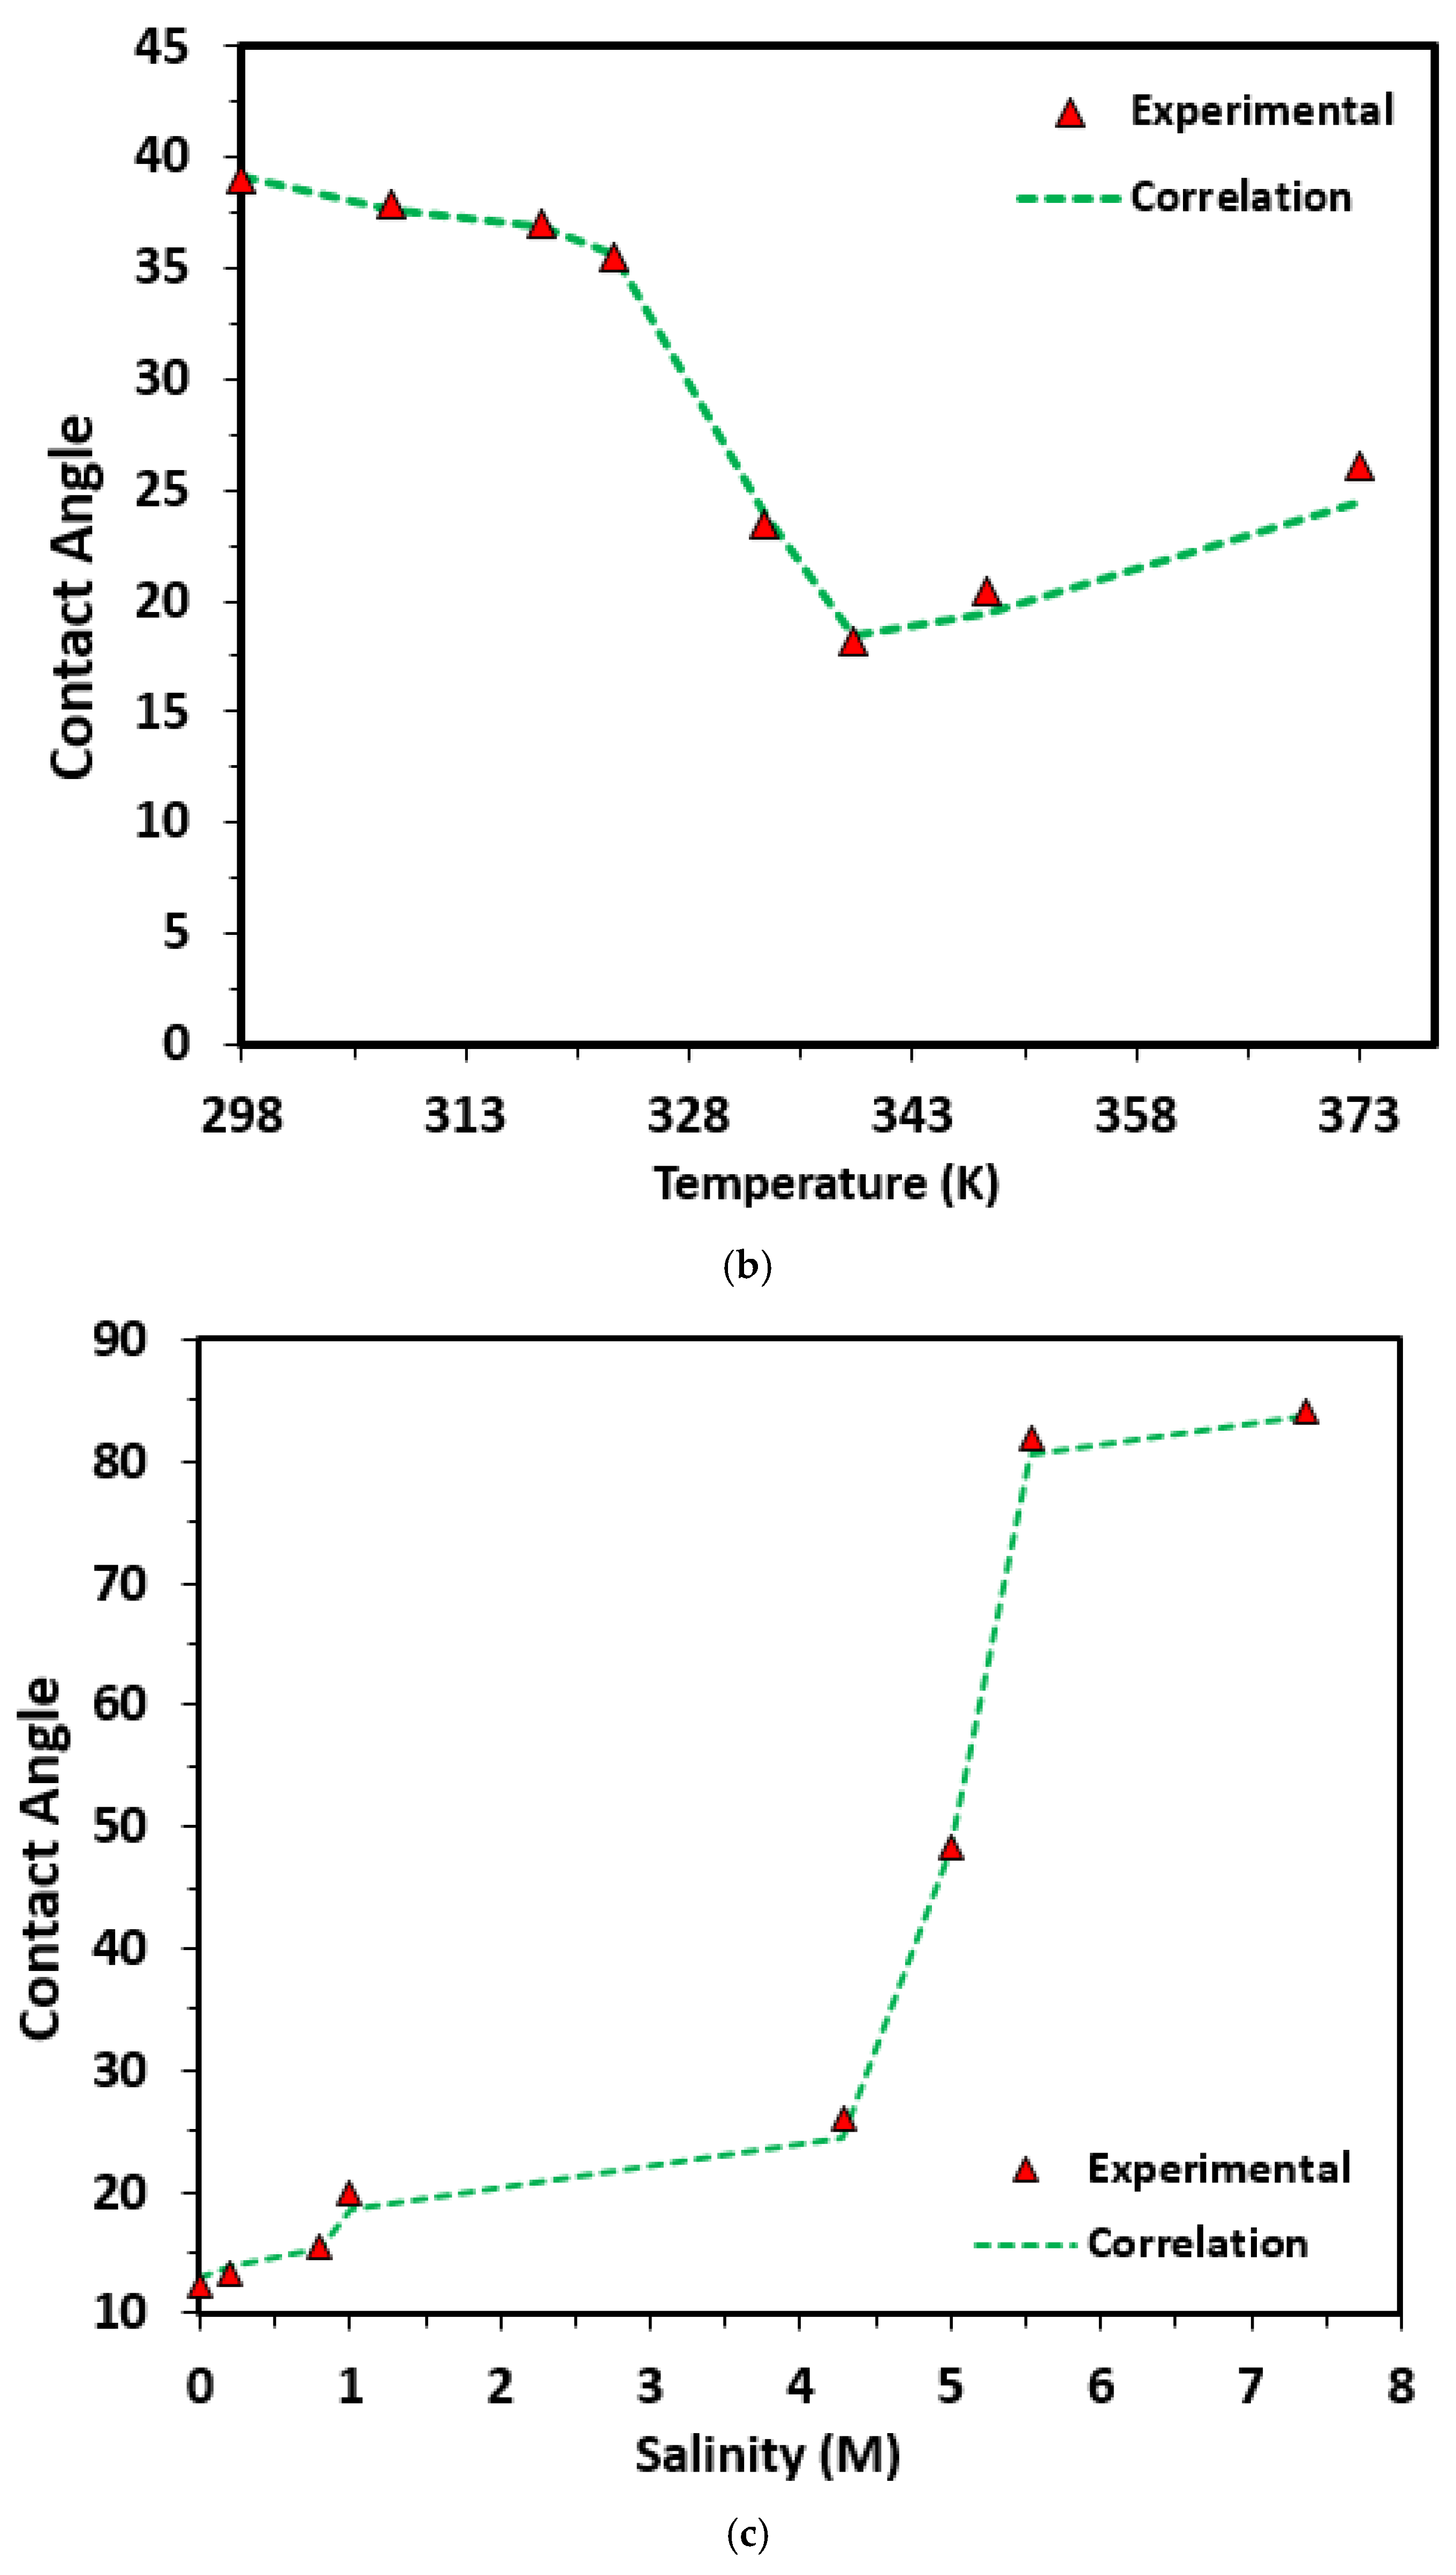
3.2. Effect of Operational Parameters on Contact Angles
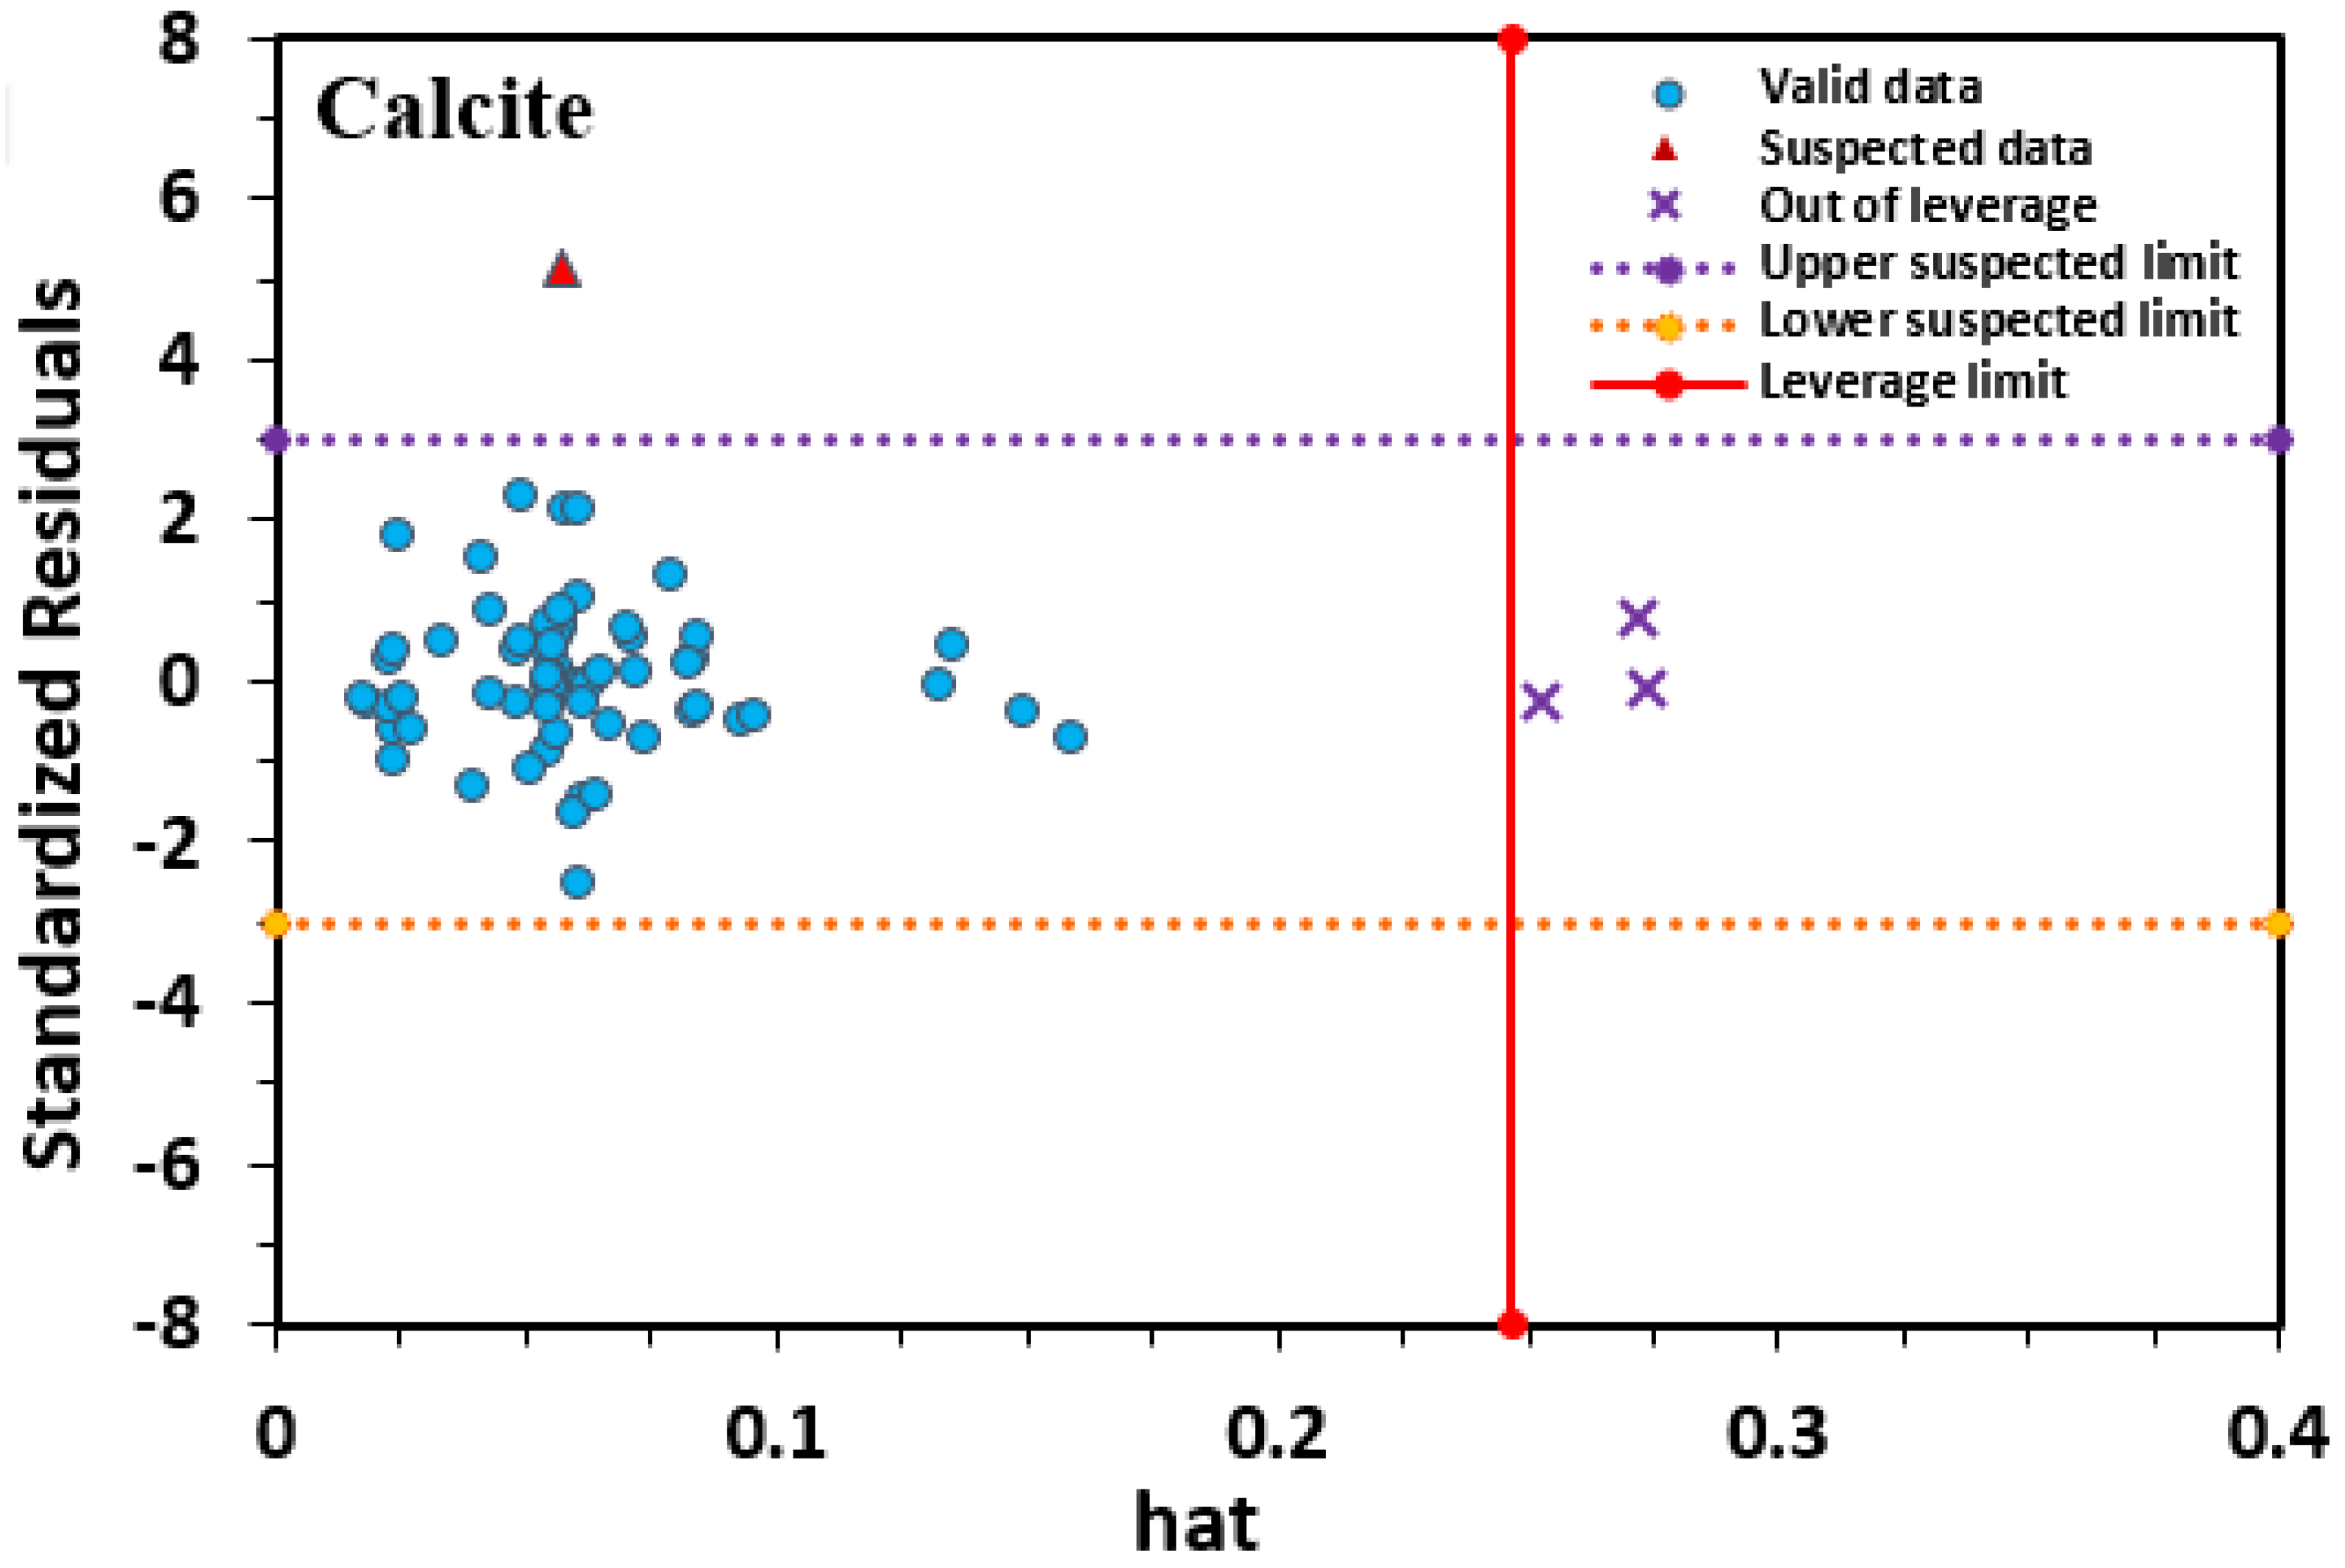
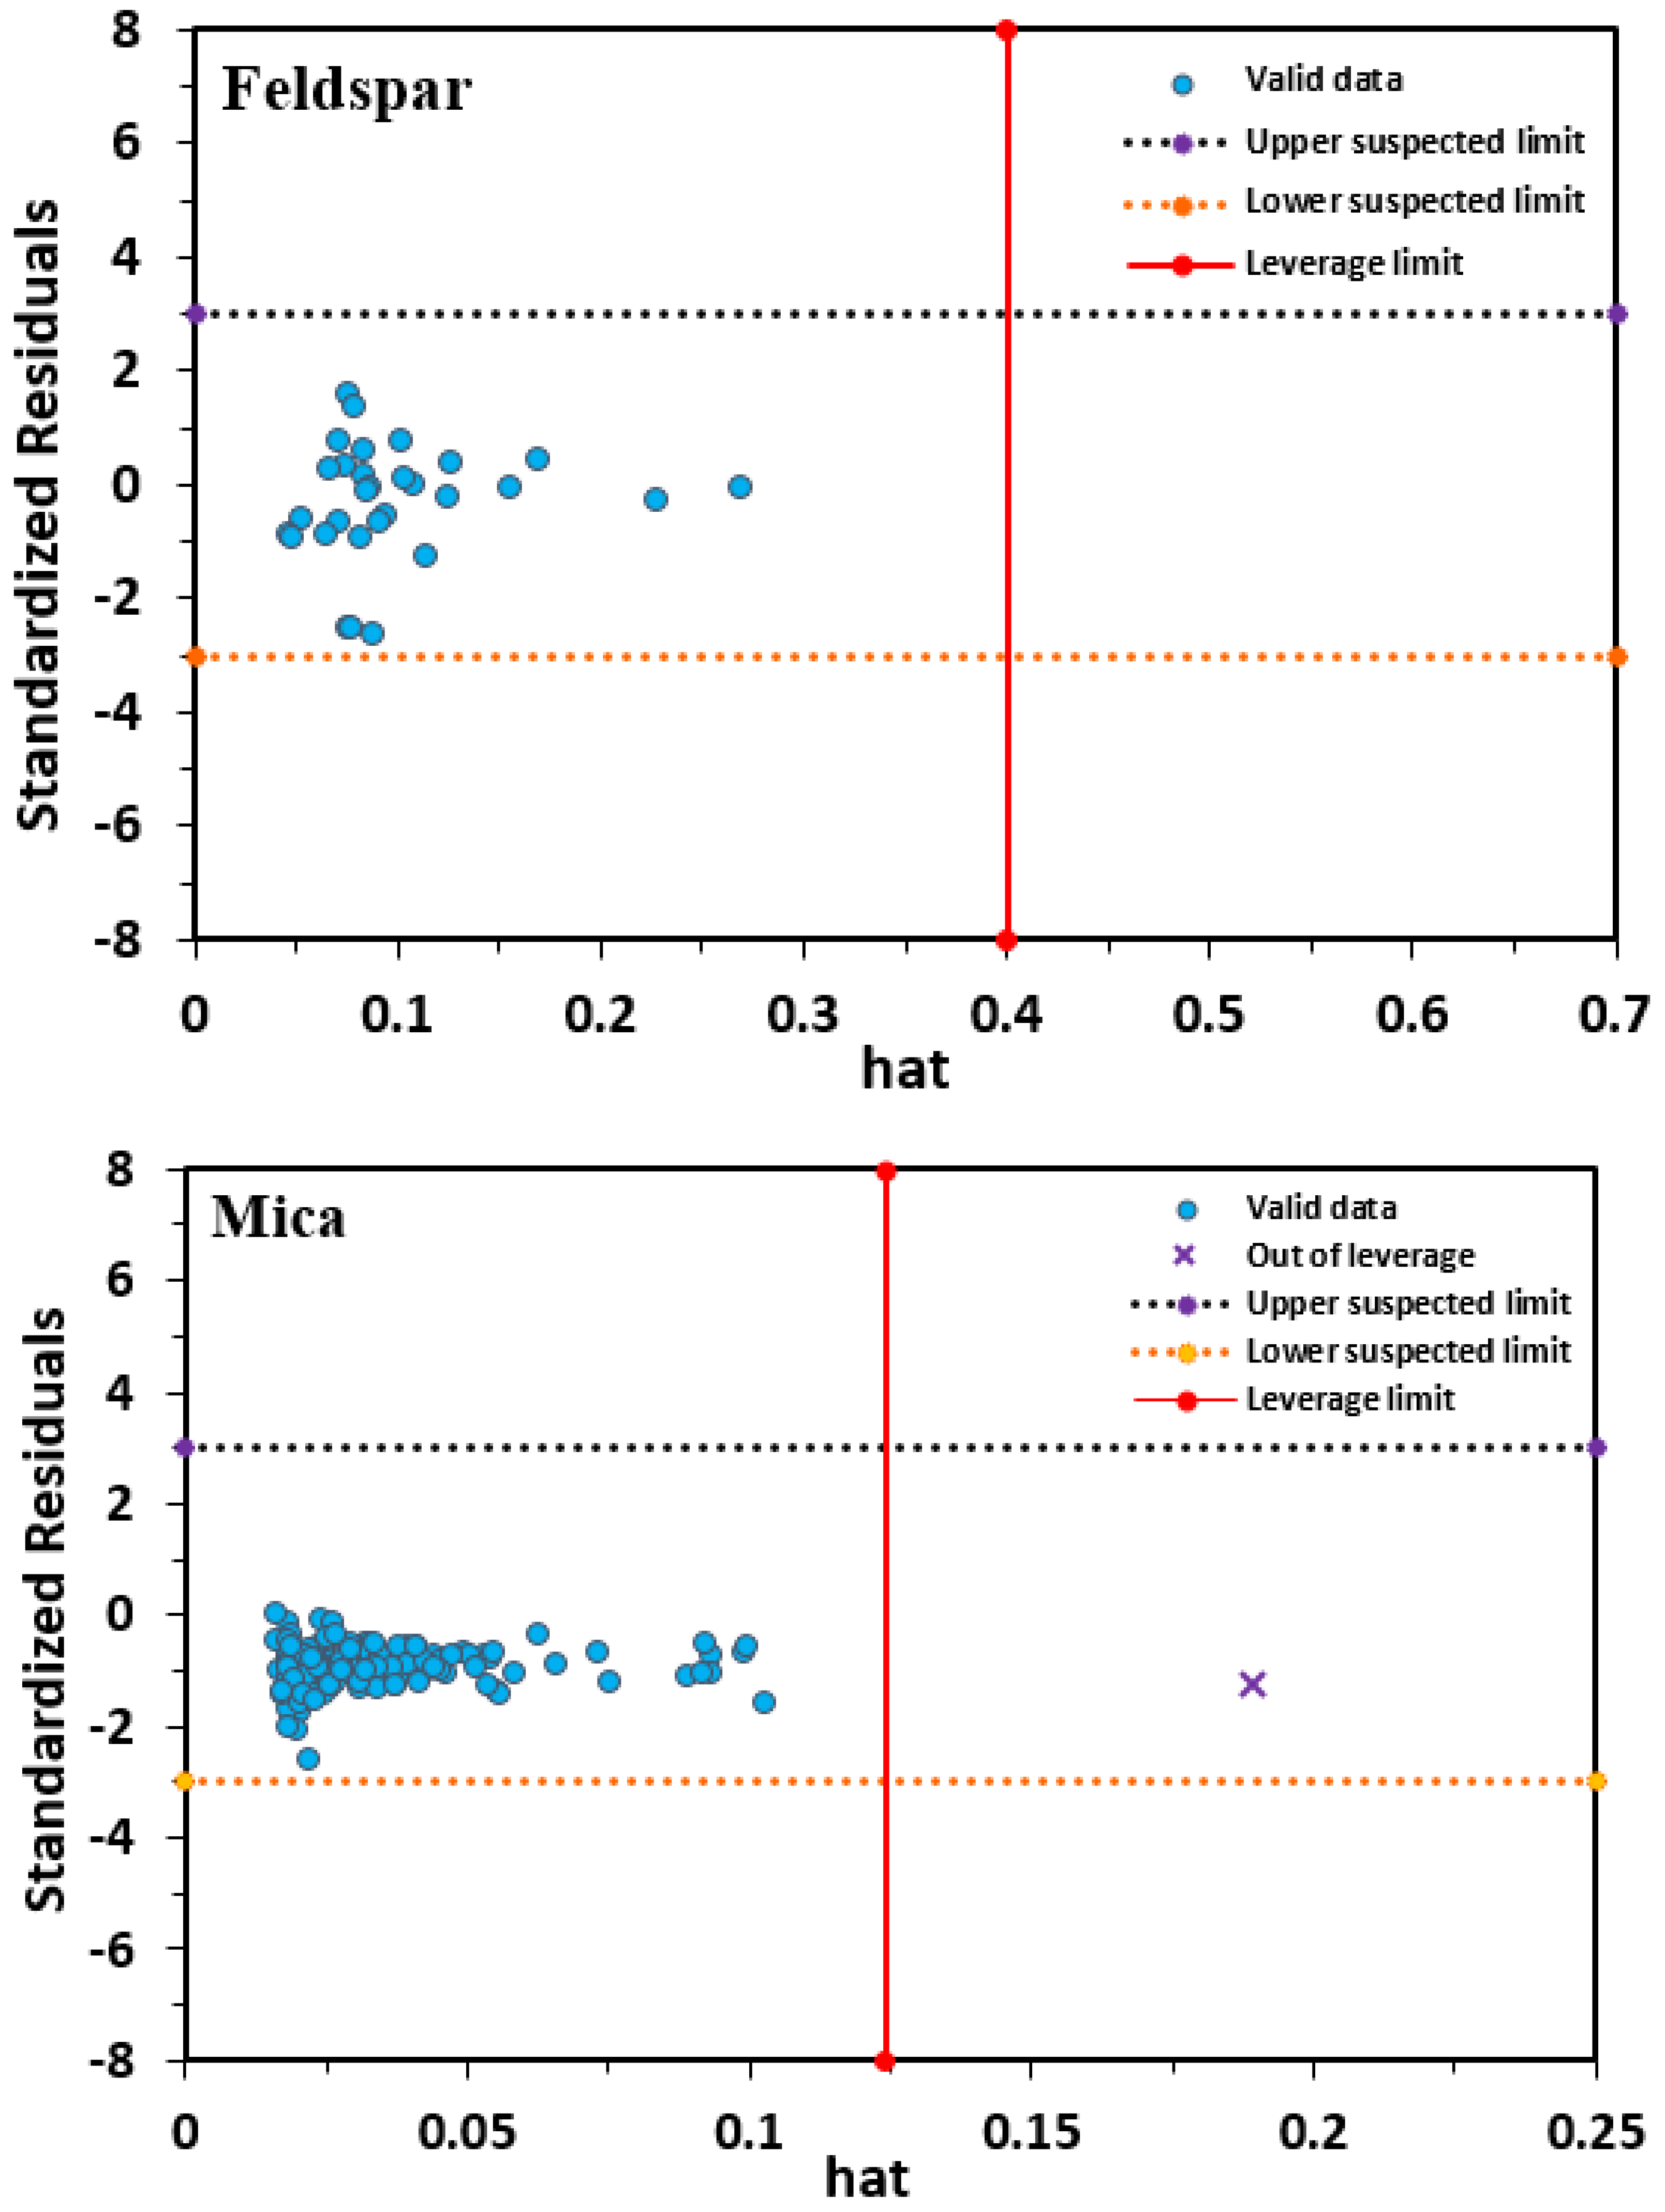
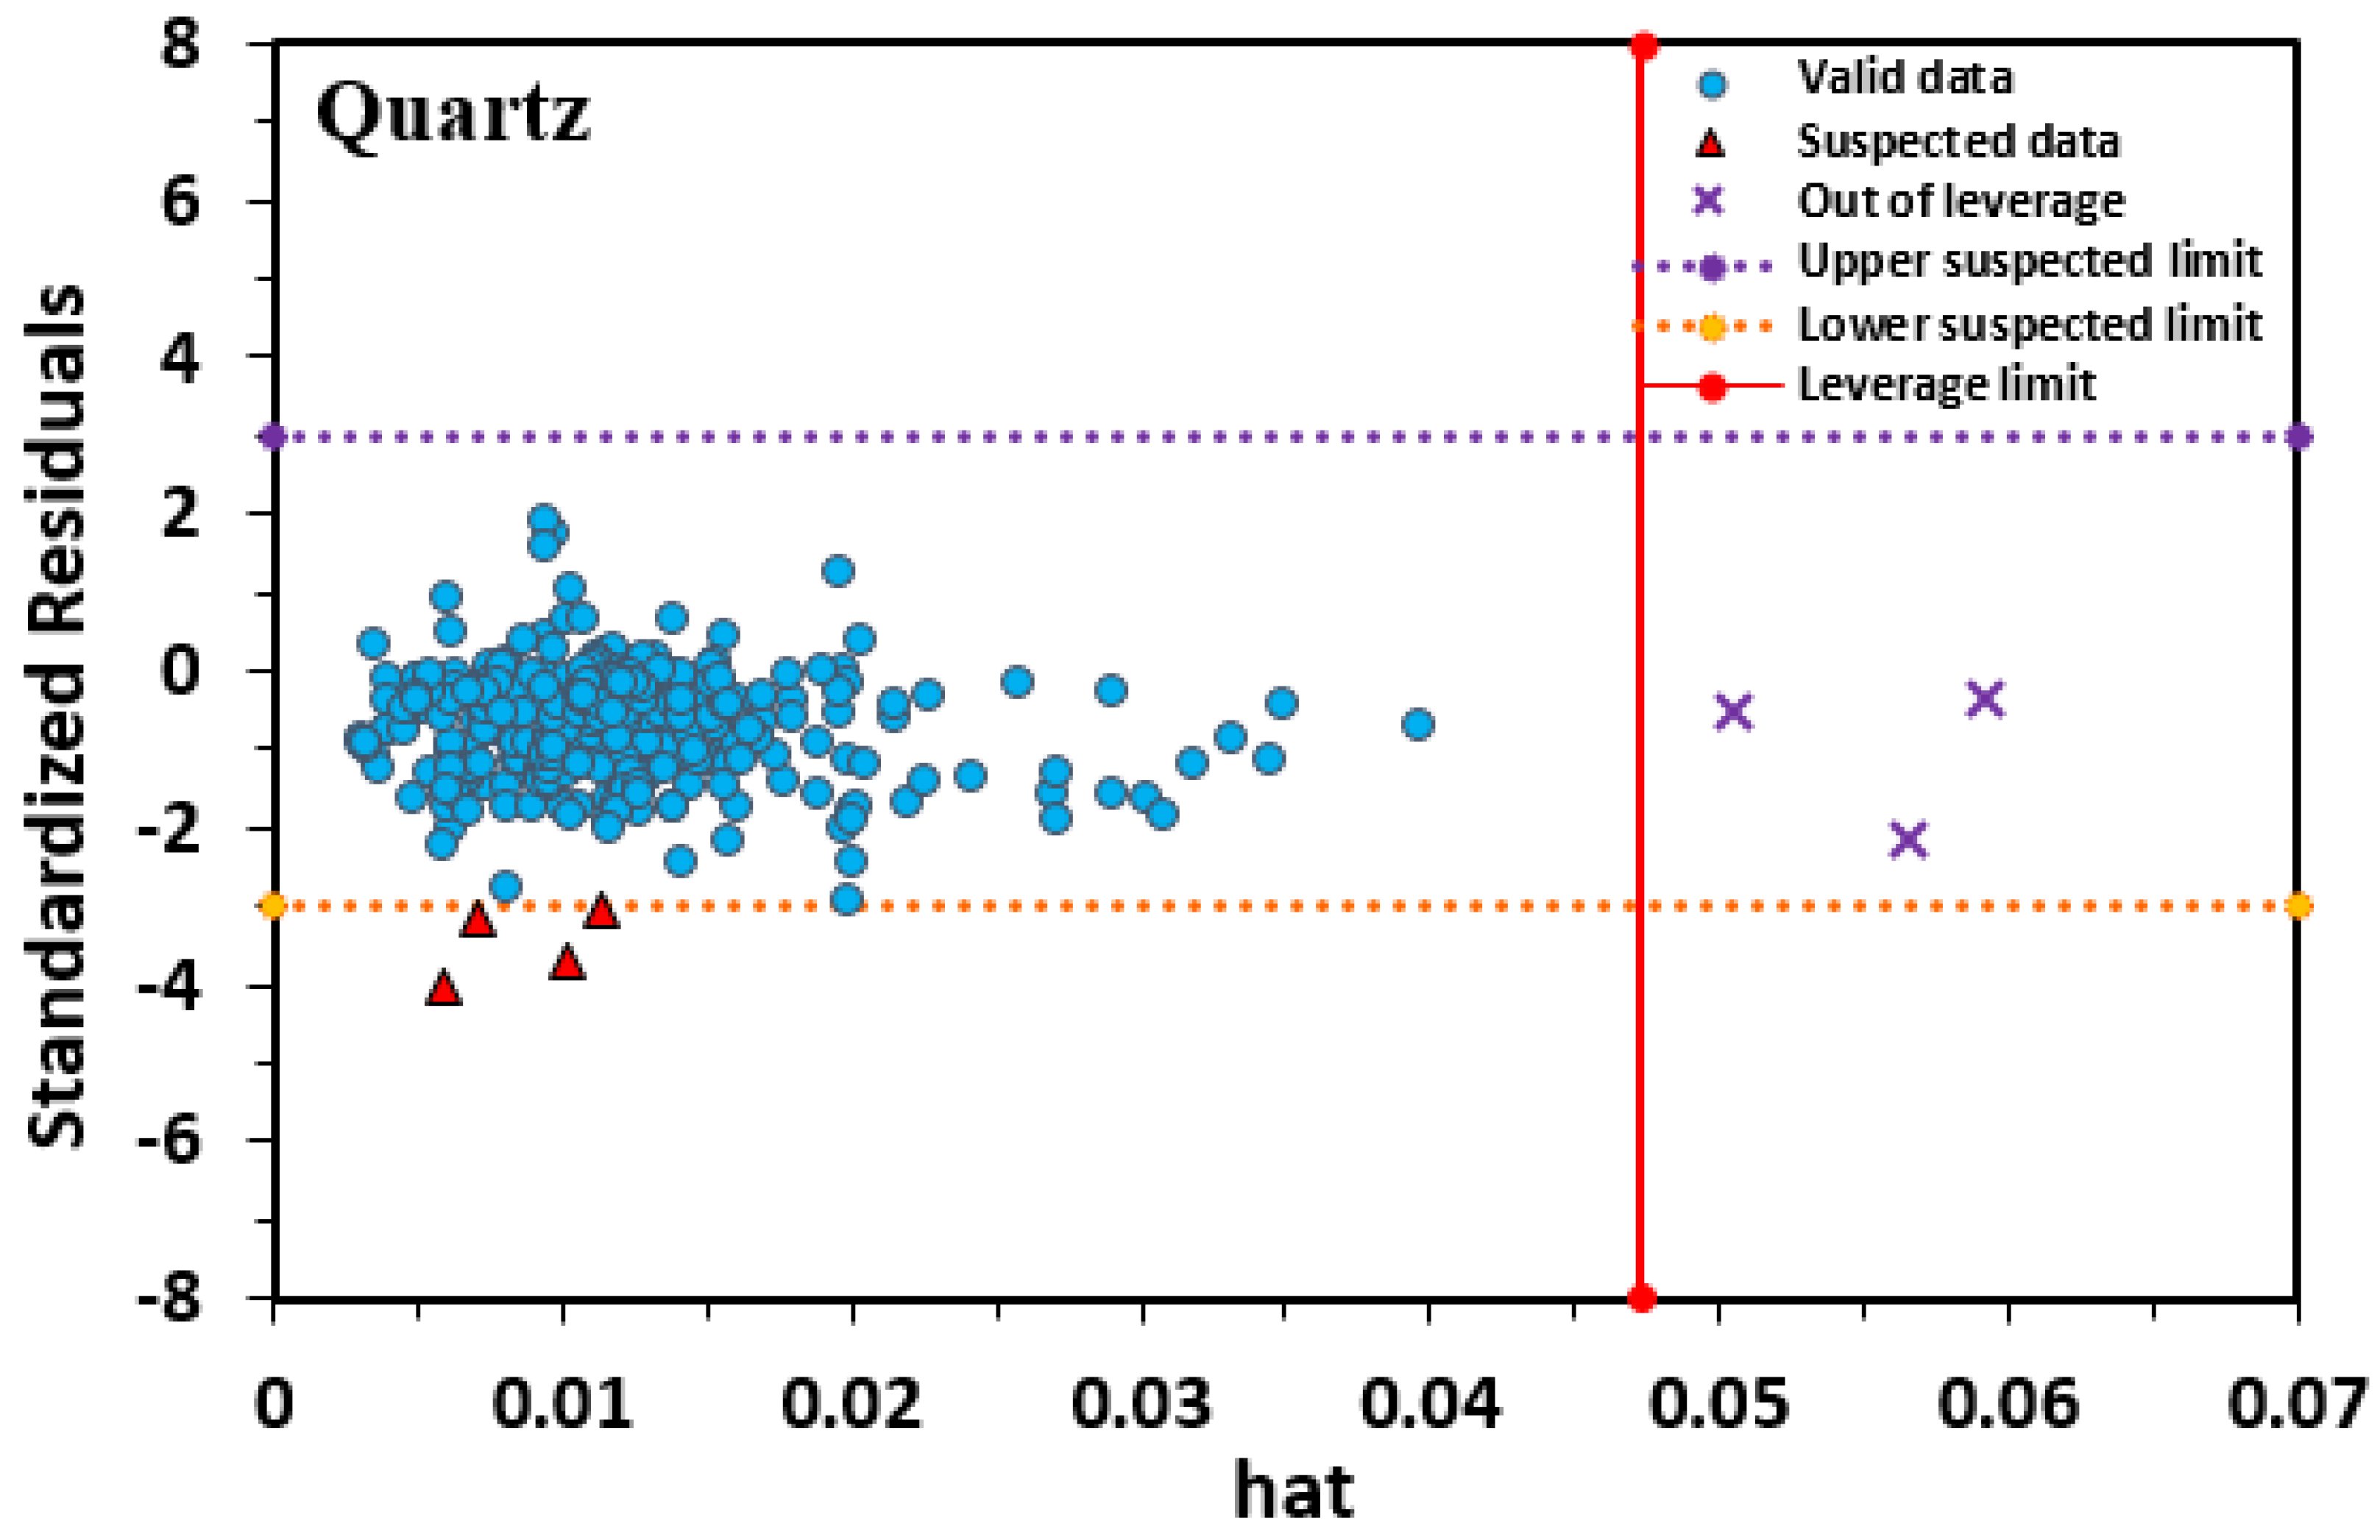
3.3. Applicability Domain and Sensitivity Analysis
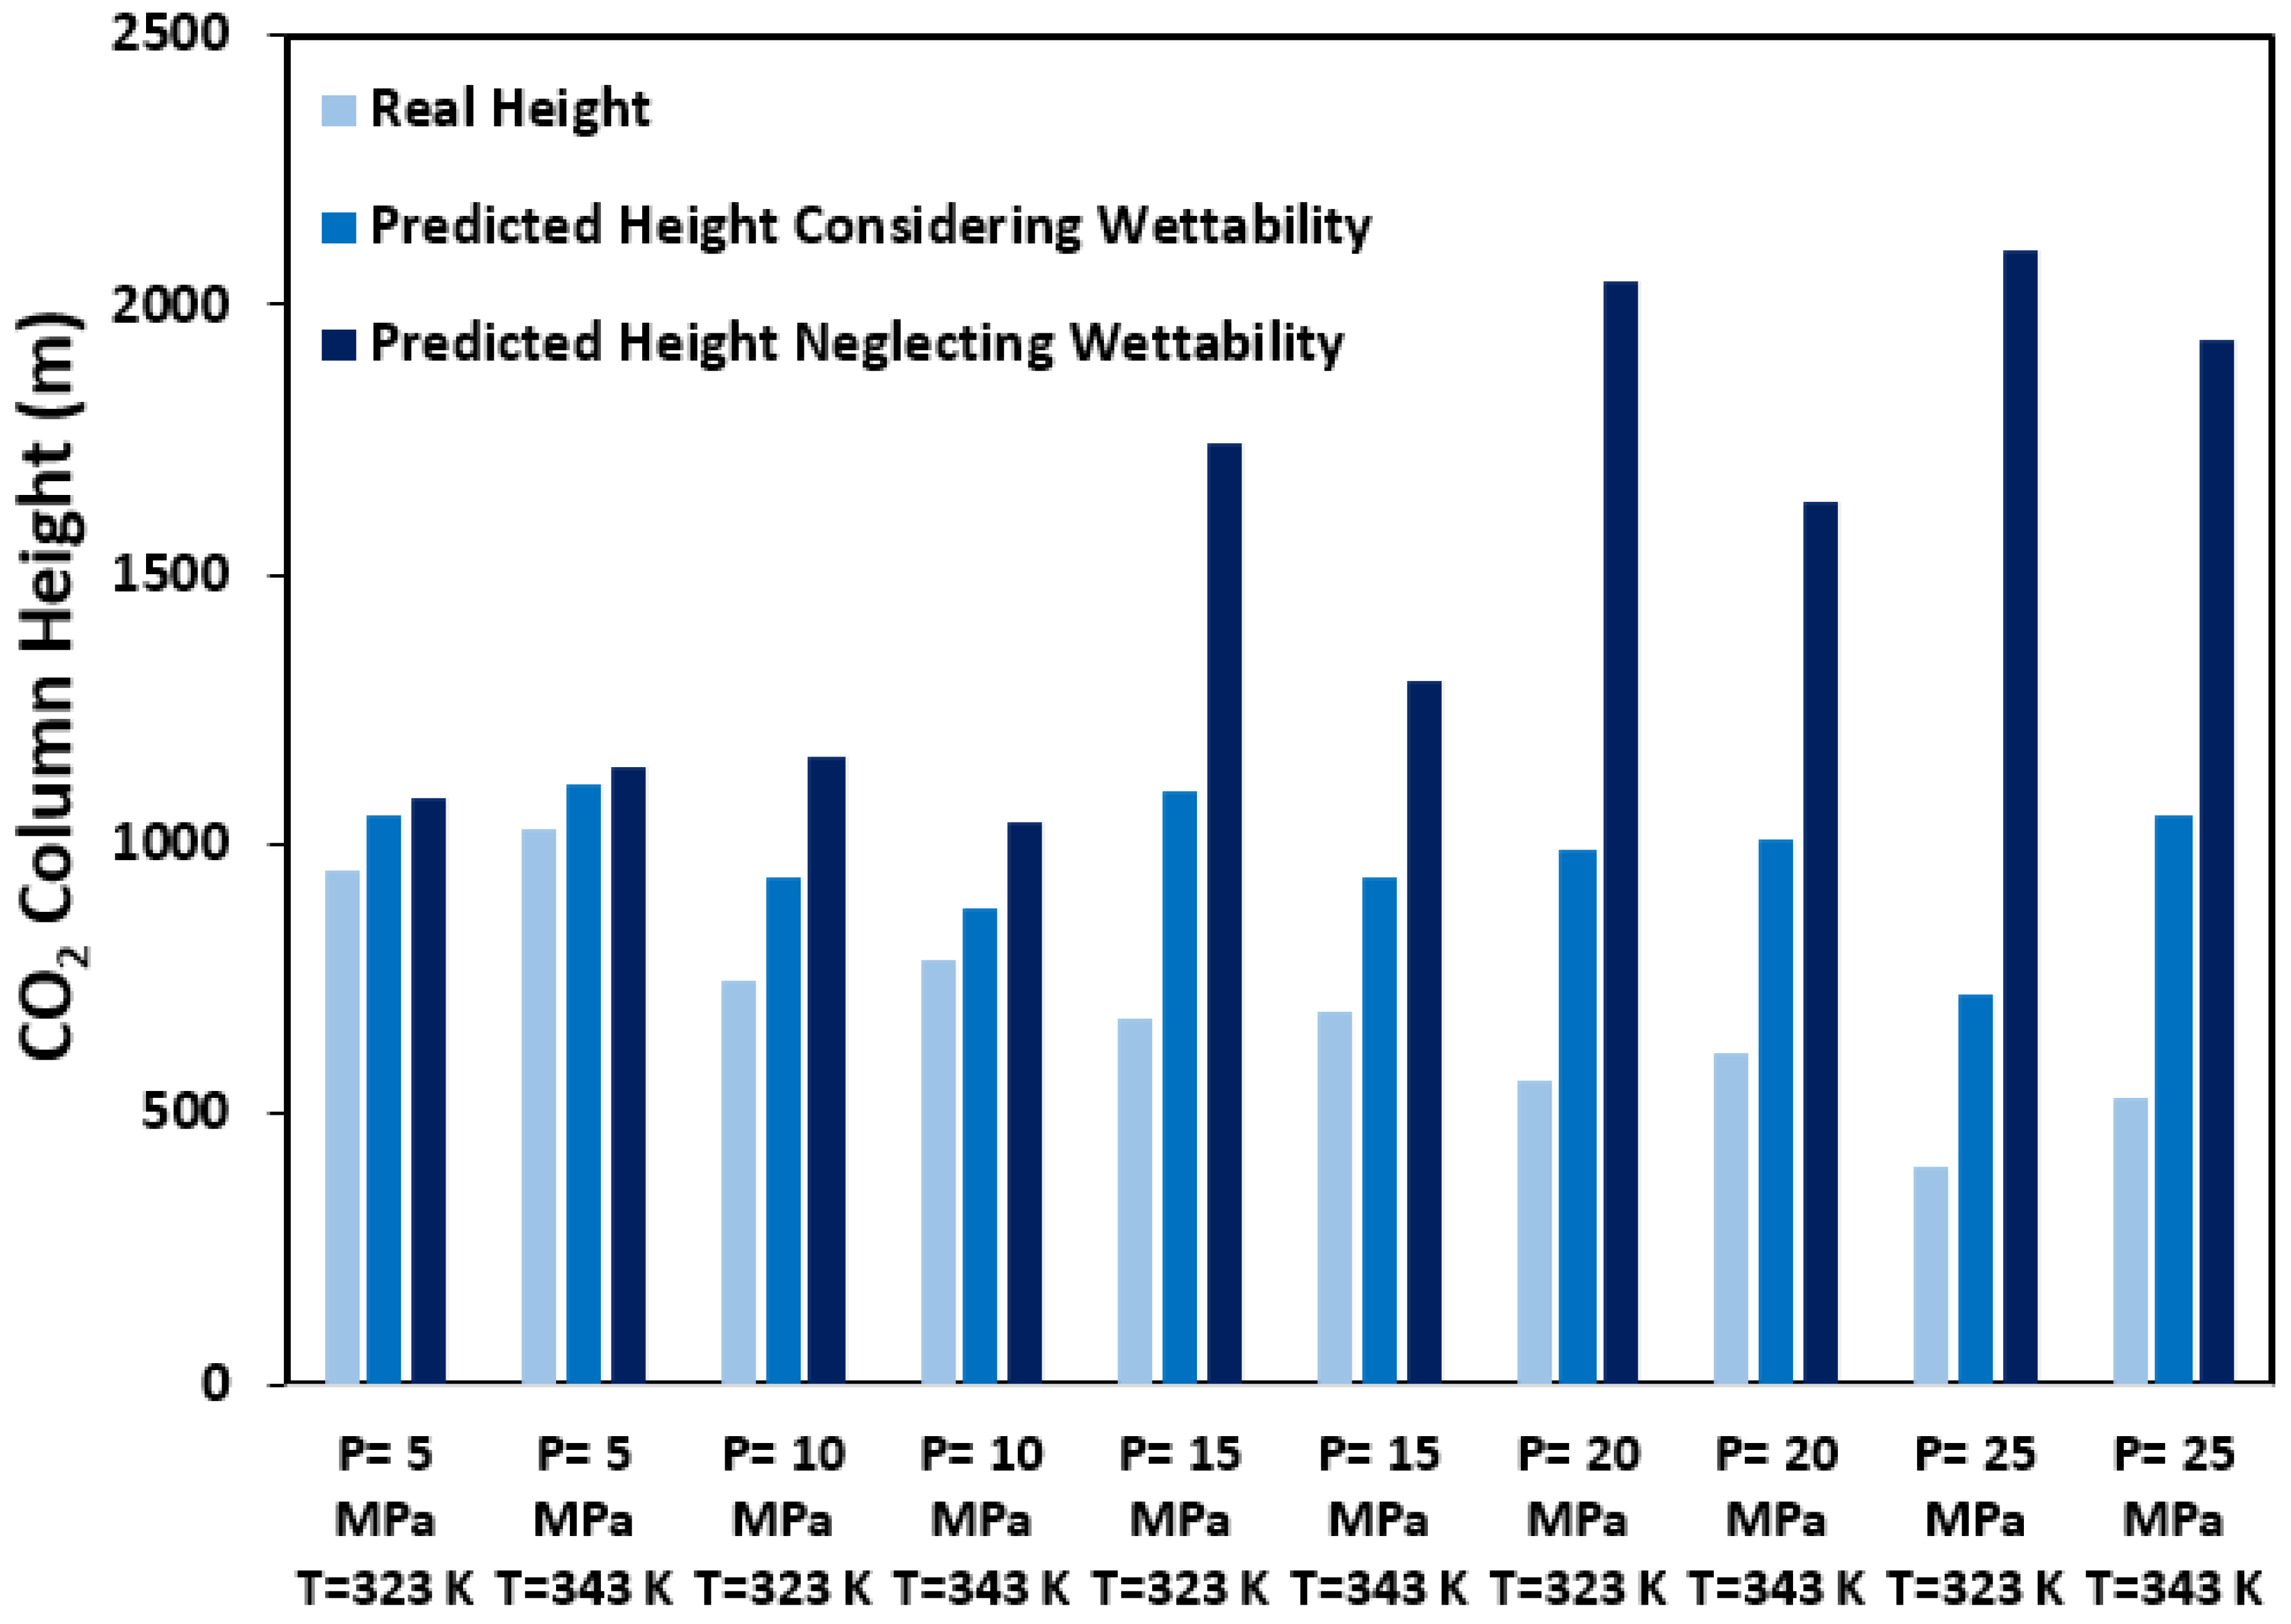
3.4. Application of the Proposed Model for CO2 Sequestration
4. Summary and Conclusions
- Different measurements indexes, such as APRE, AAPRE, RMSE, STD, and R2, confirmed the reliability and accuracy of the implemented model.
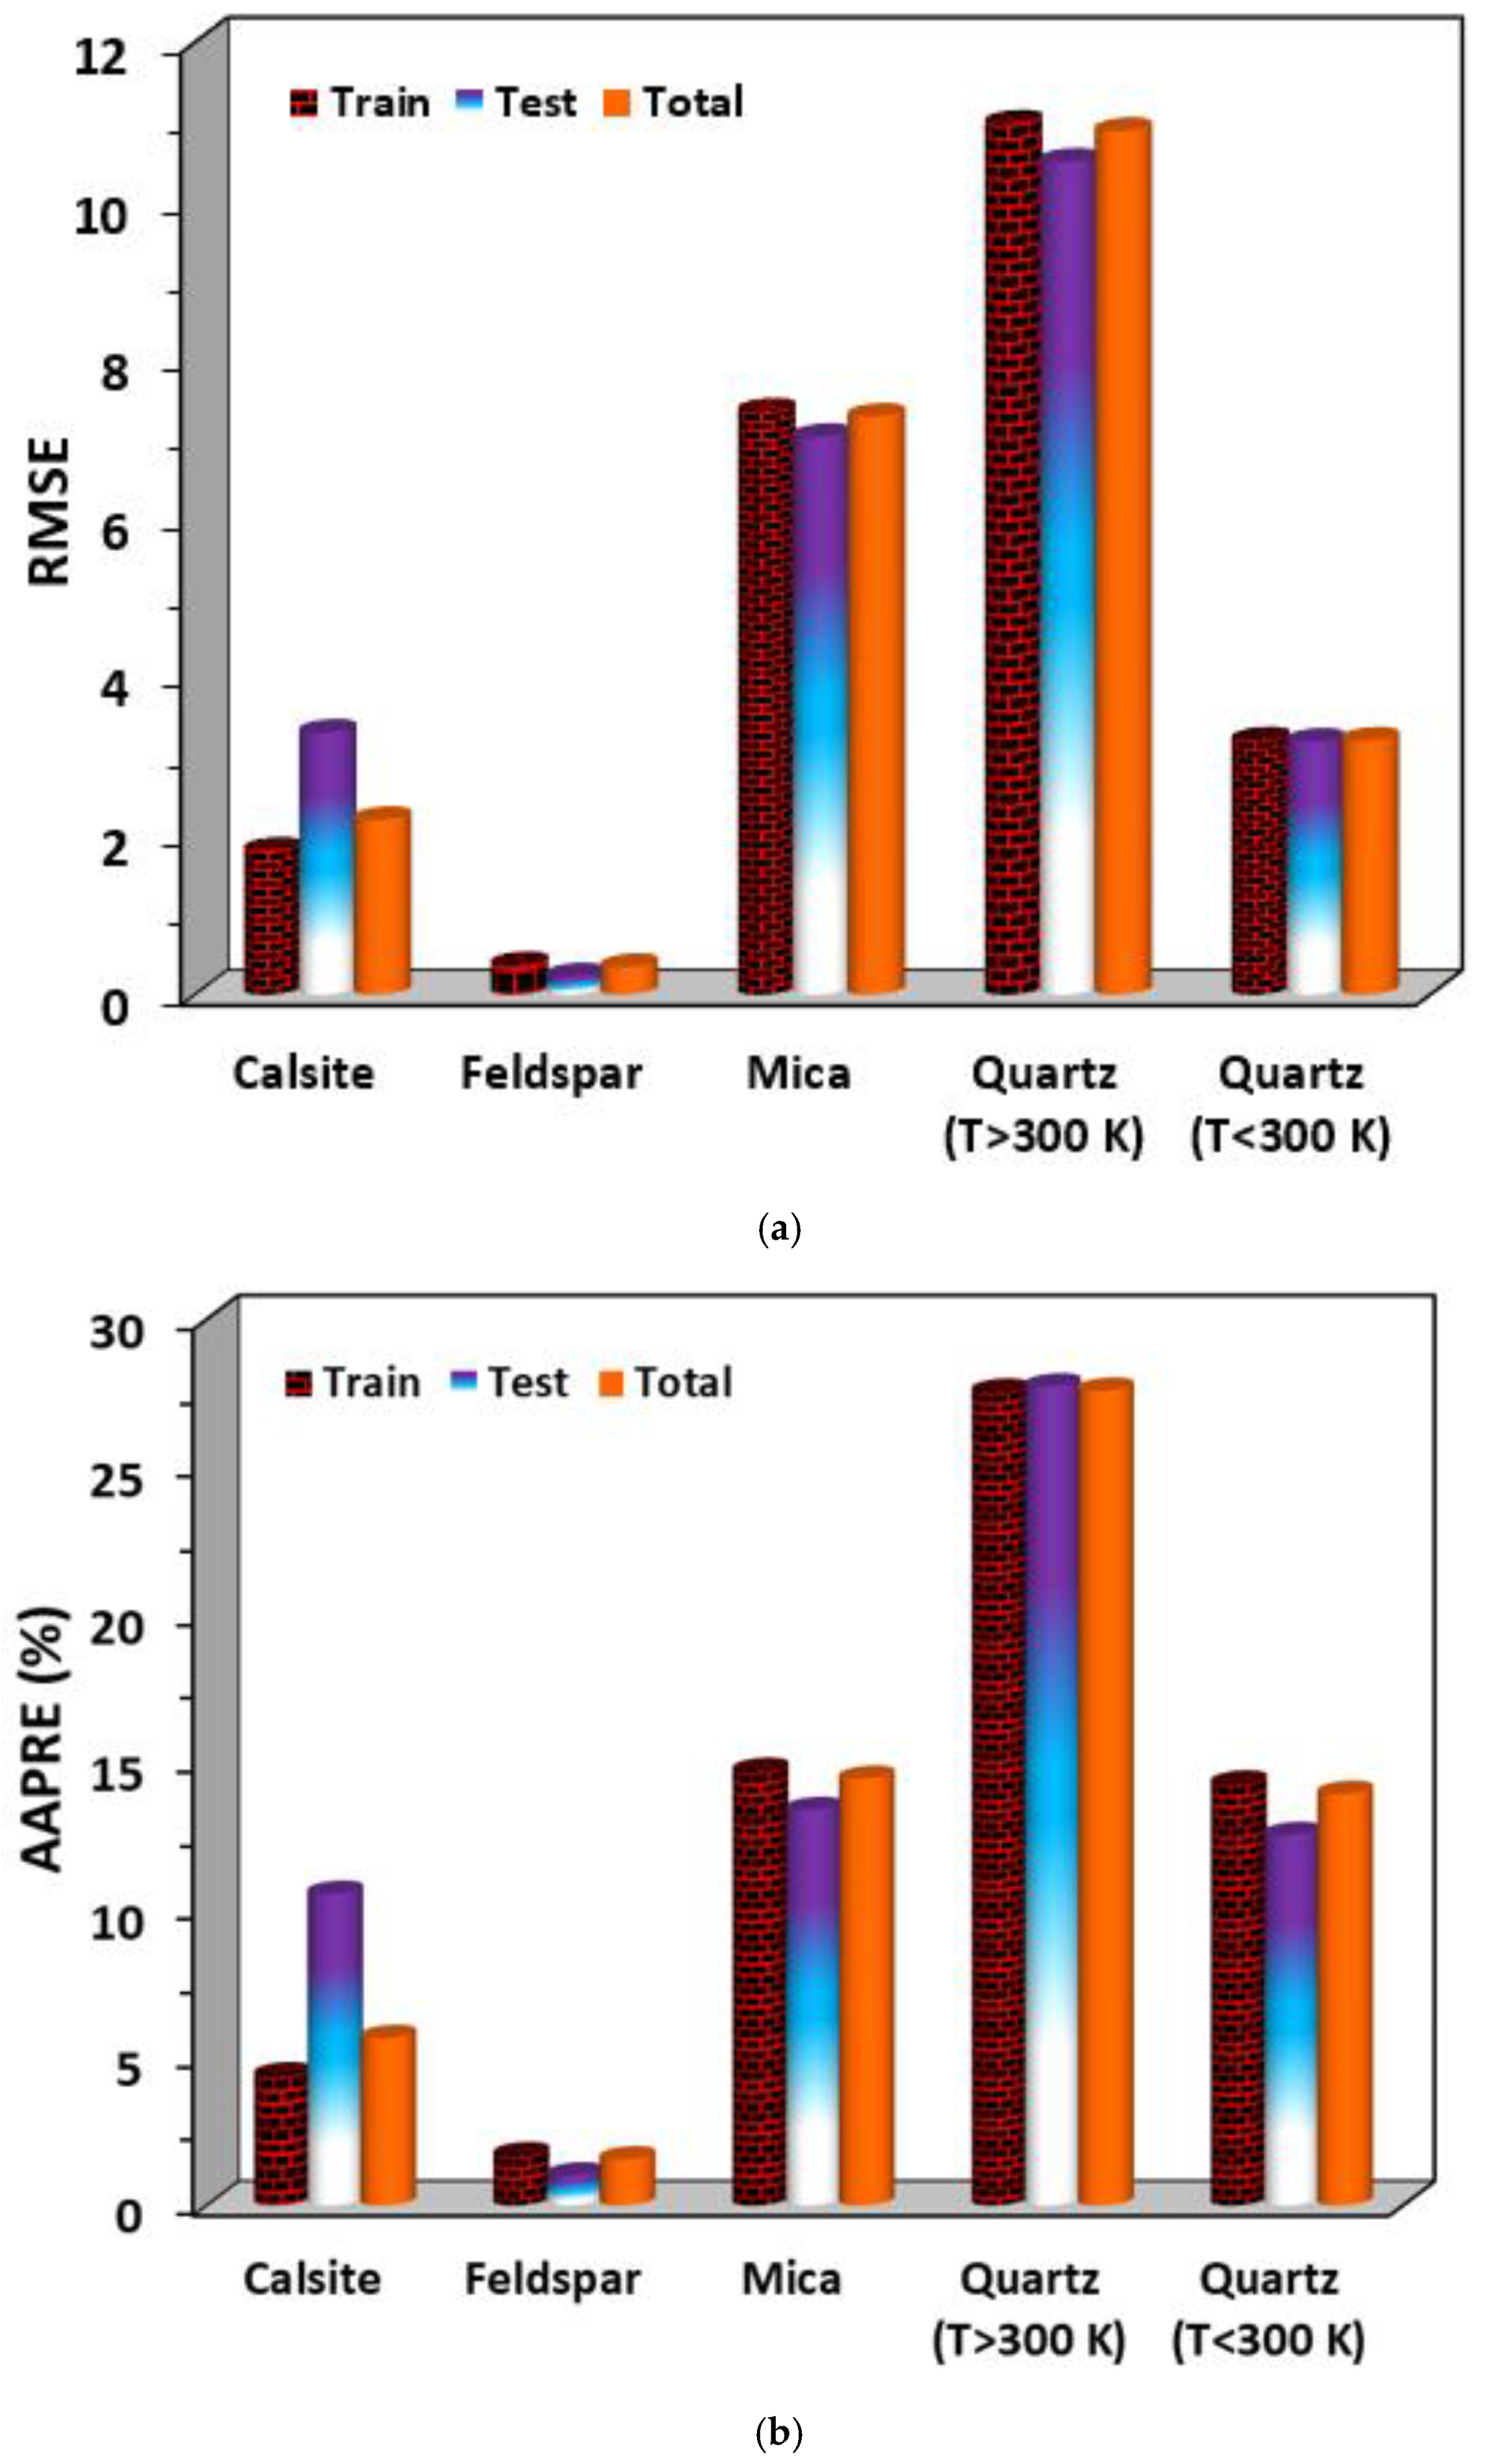
- Average absolute percent relative errors of the implemented model proposed for calcite, feldspar, mica, and quartz were obtained 5.66%, 1.56%, 14.44%, and 13.93%, respectively, which confirms the significant performance of the GEP algorithm.
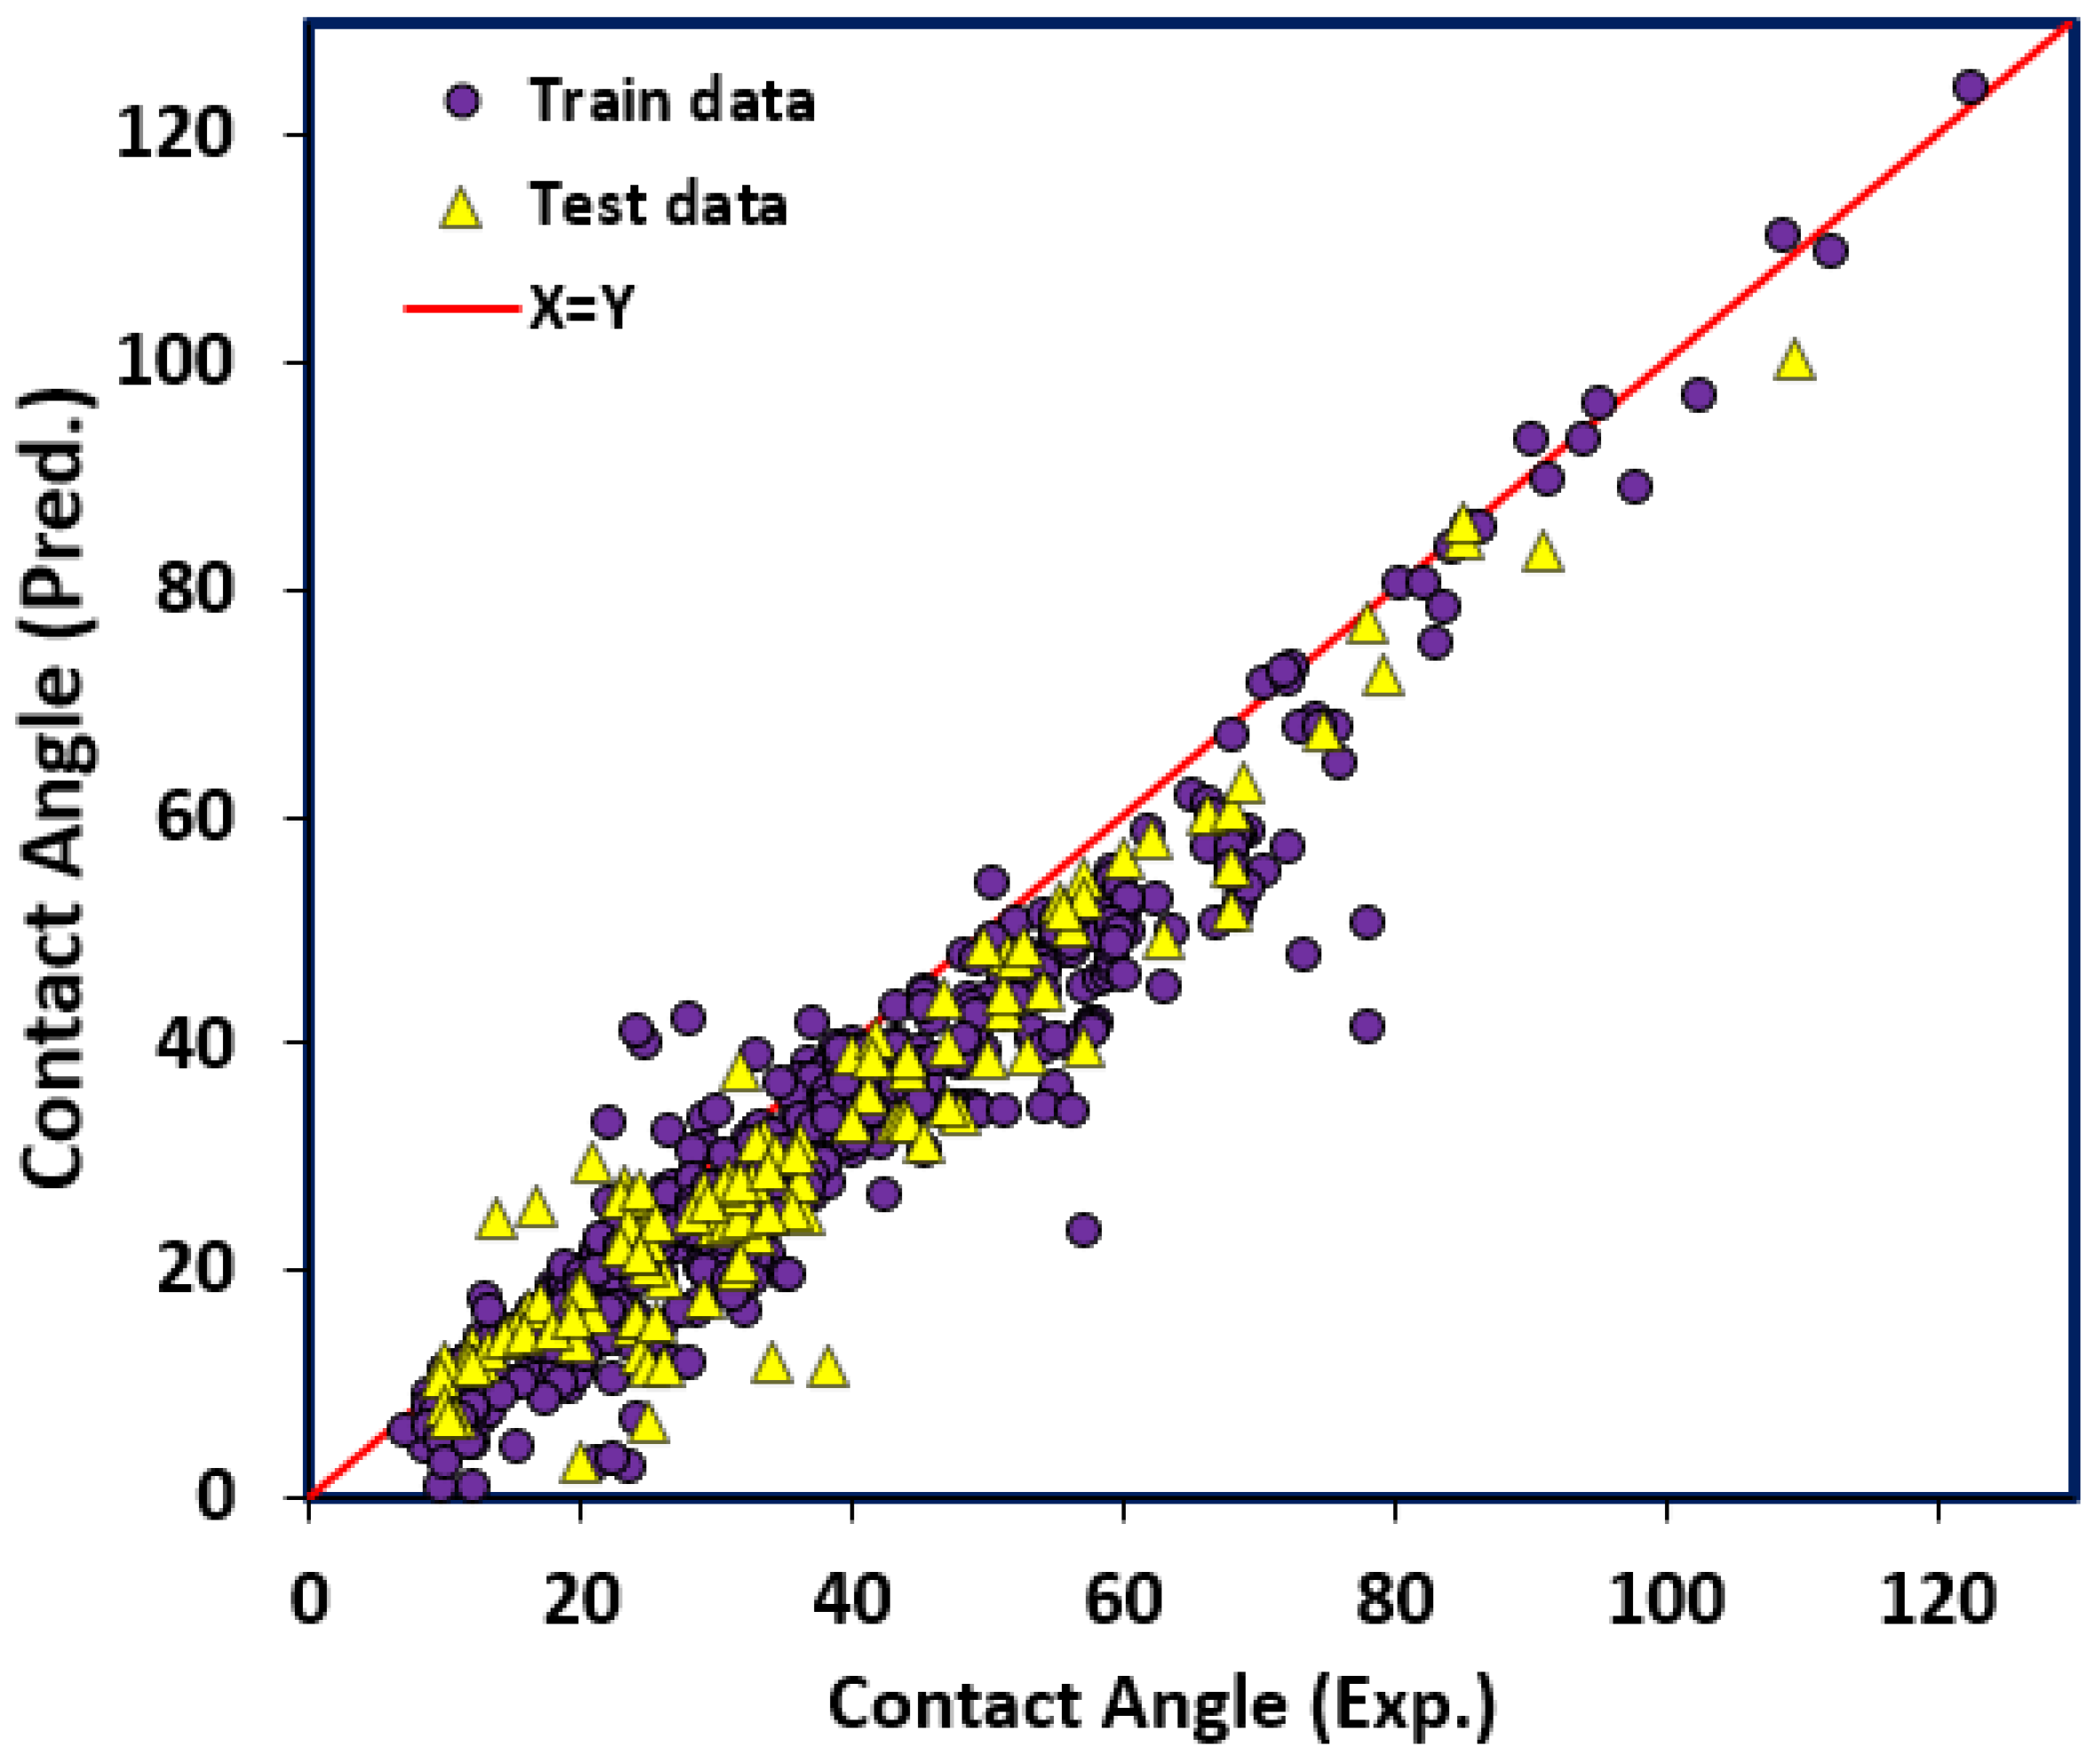
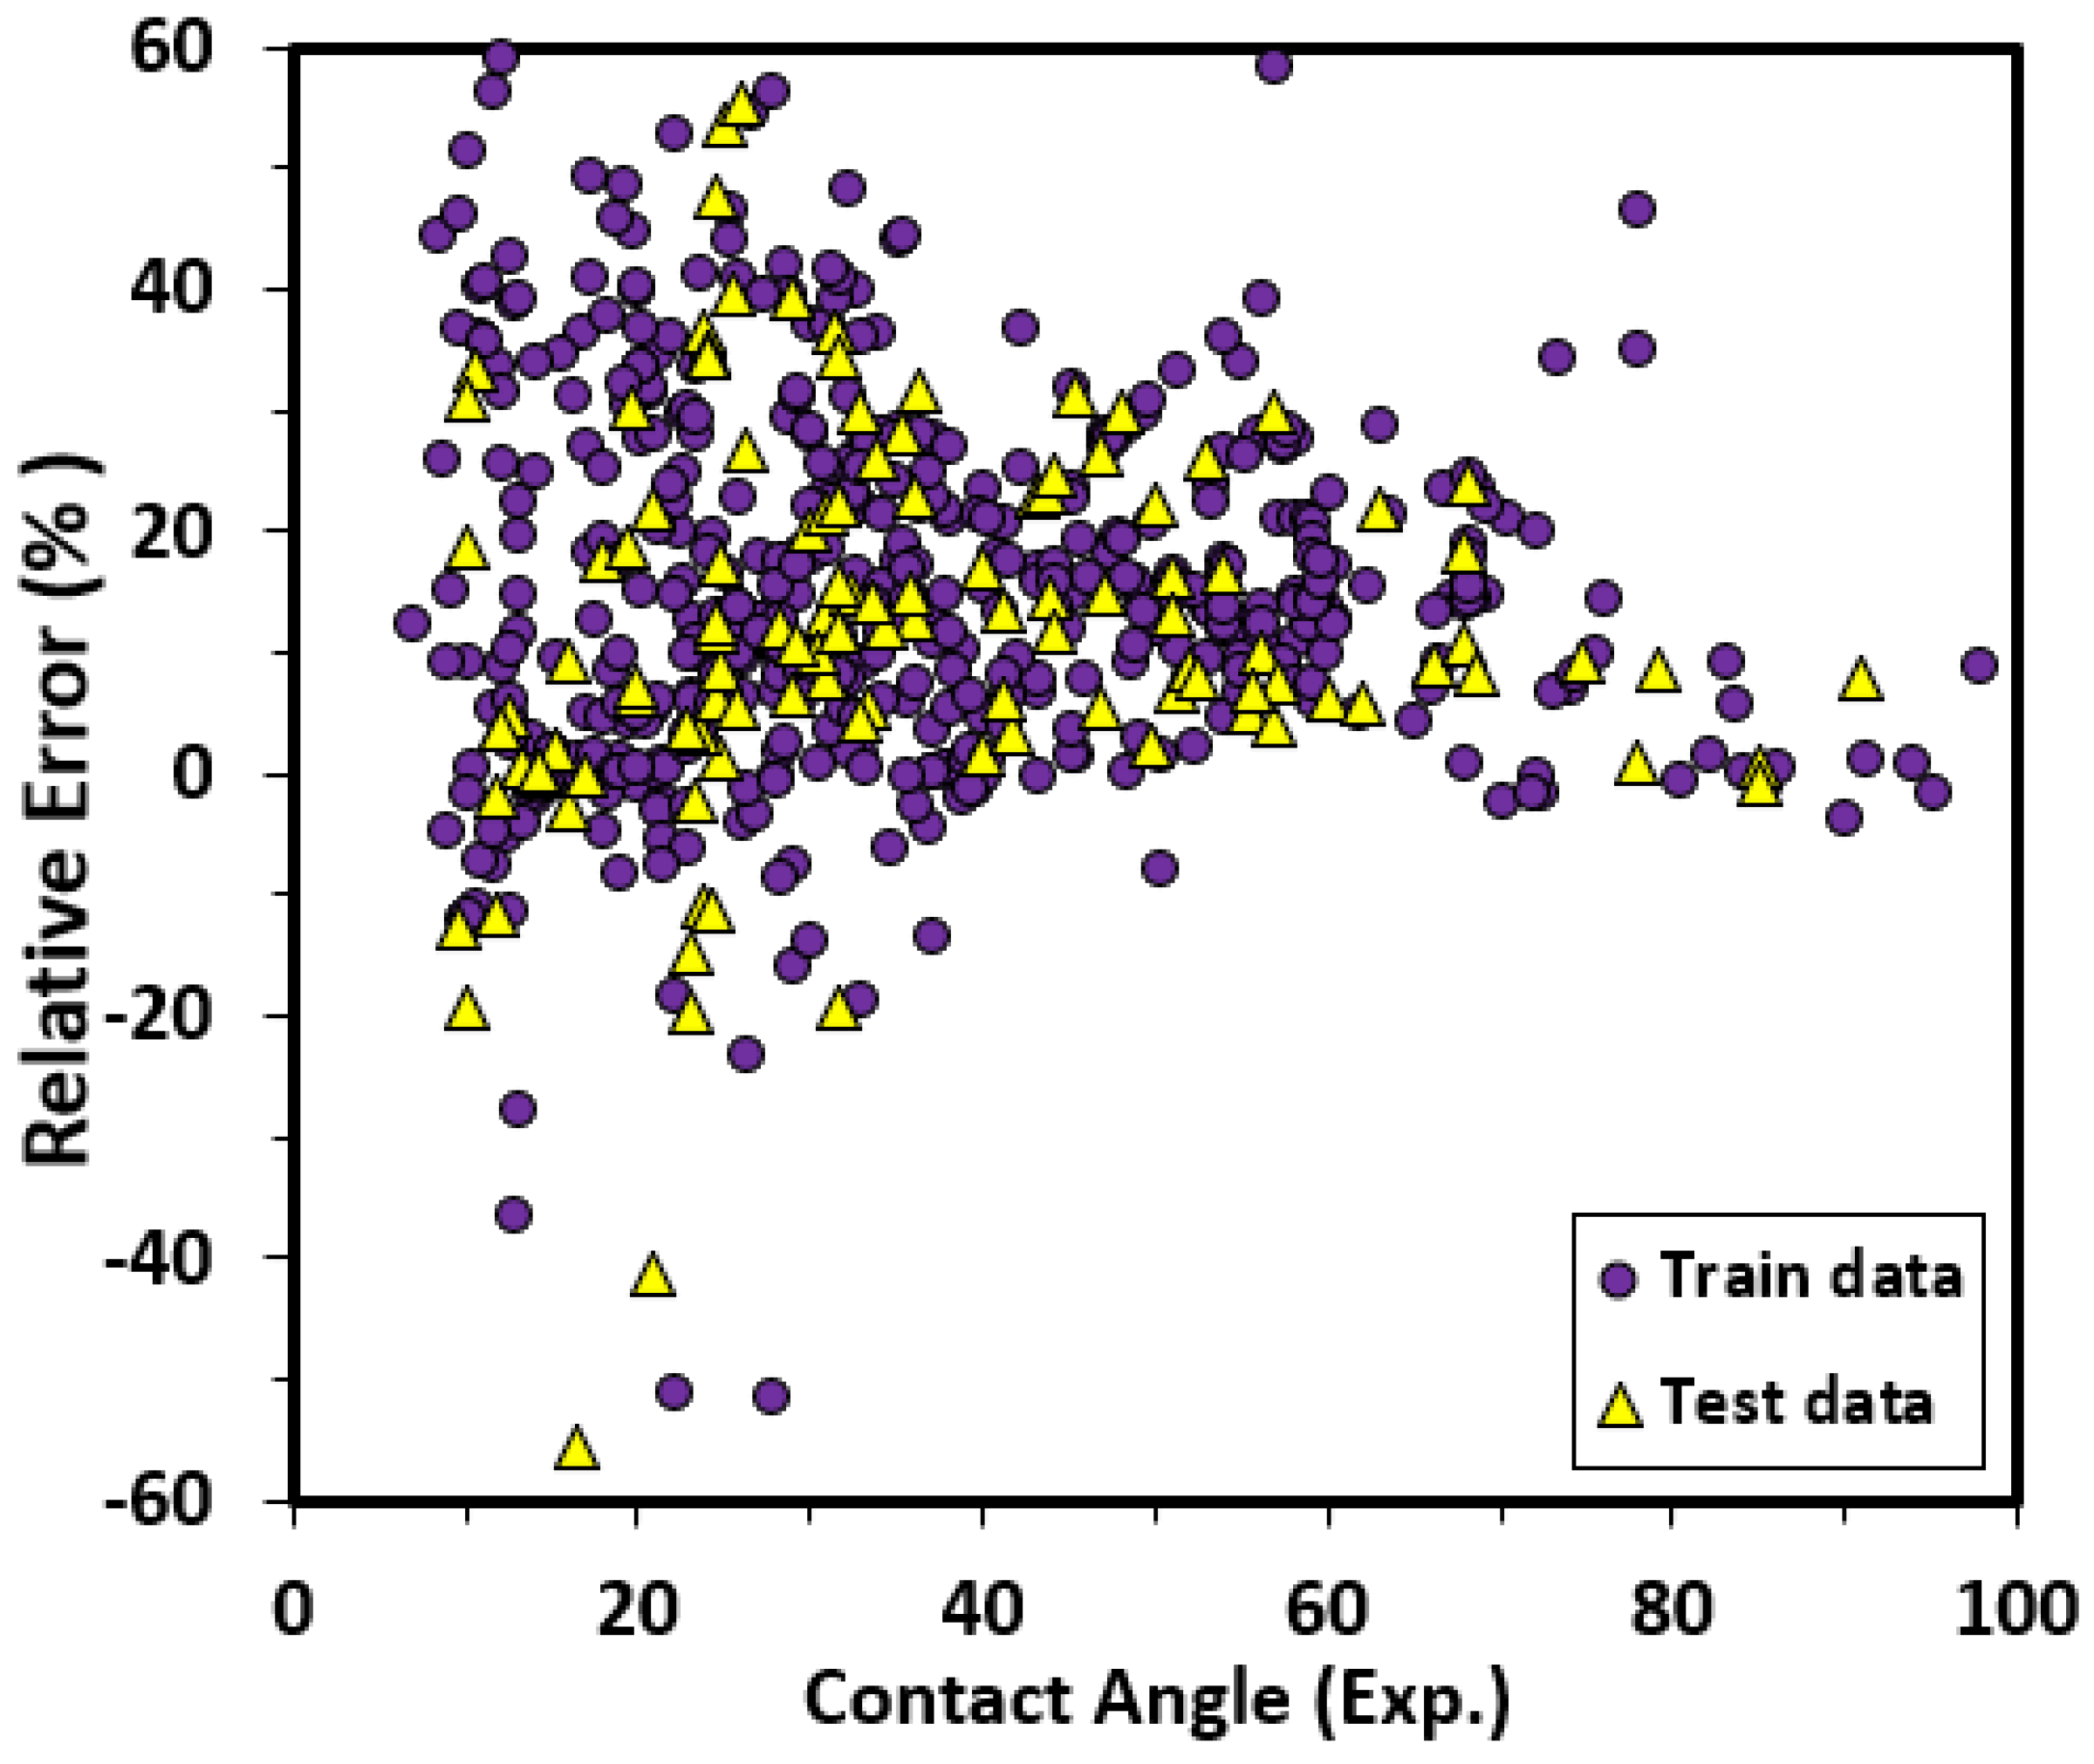
- The GEP correlation was able to predict more than 80% of the considered data points with ARE less than 25%.
- The applied data points did not show significant outliers, and the proposed GEP model was successful in the trend estimation of brine/CO2 contact angles for different minerals under wide ranges of pressure, temperature, and salinity.
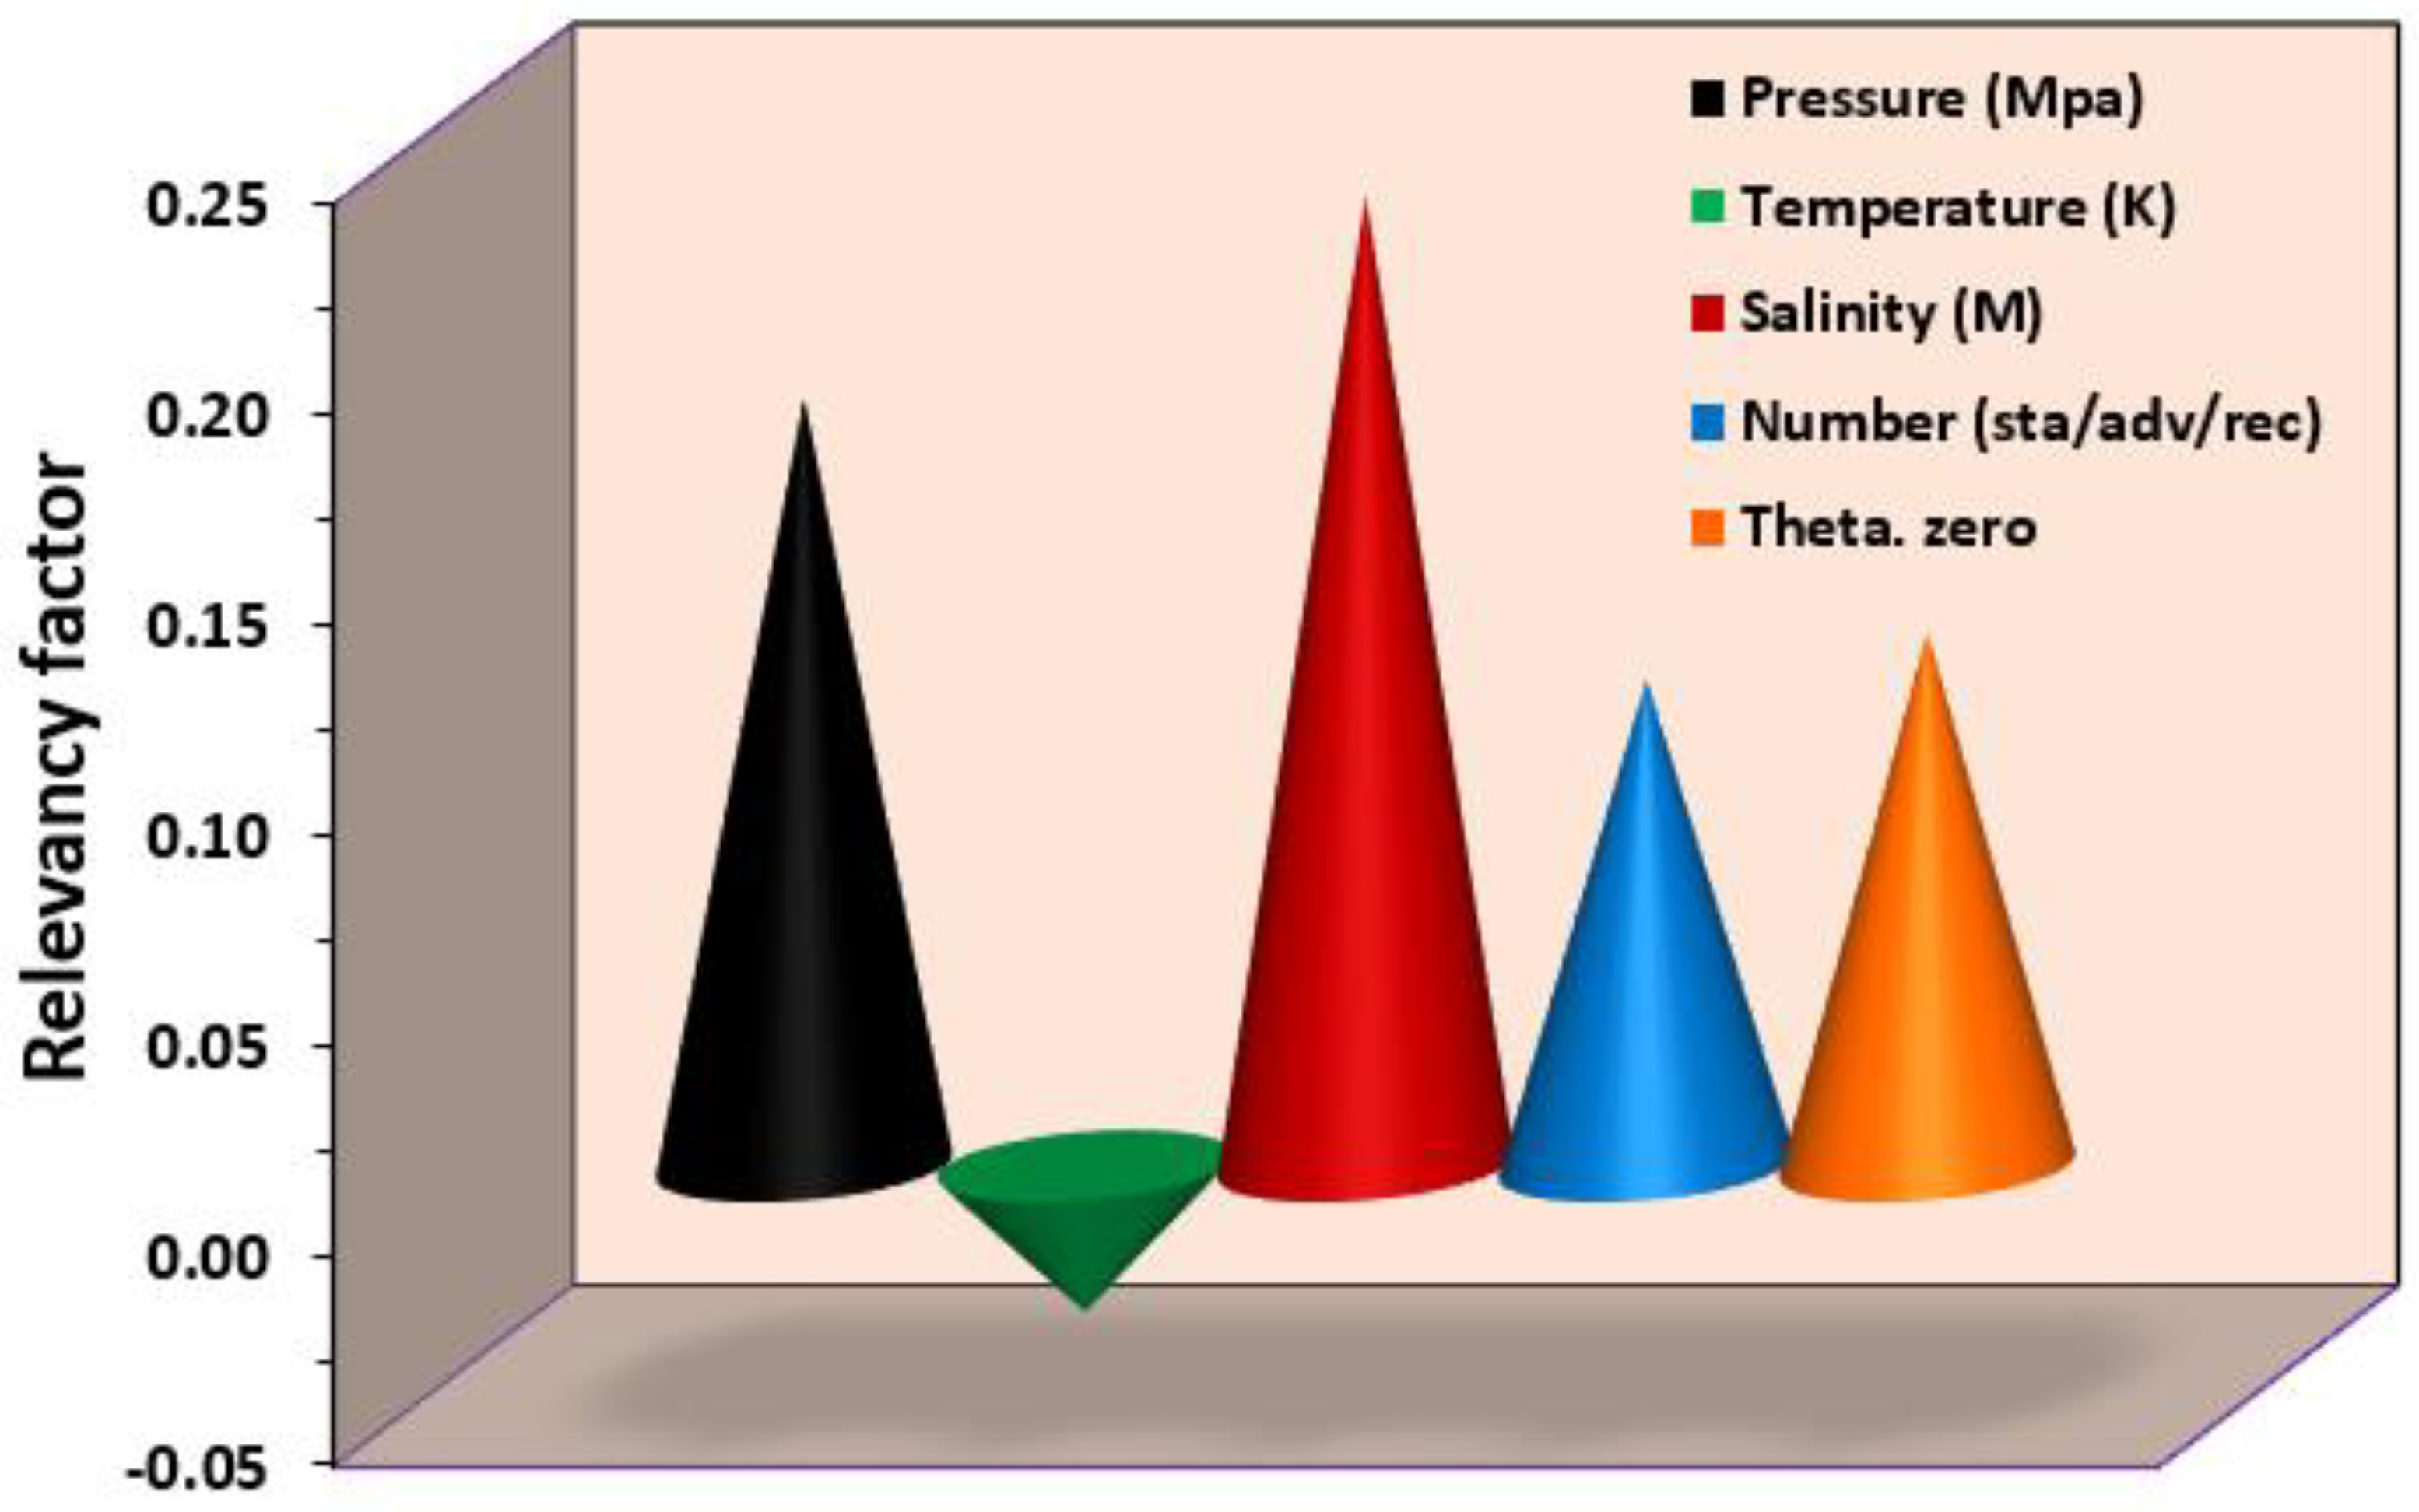
- Investigation of sensitivity analysis indicated that the contact angles of brine/CO2 on various minerals could be positively affected by salinity and pressure and negatively by temperature.
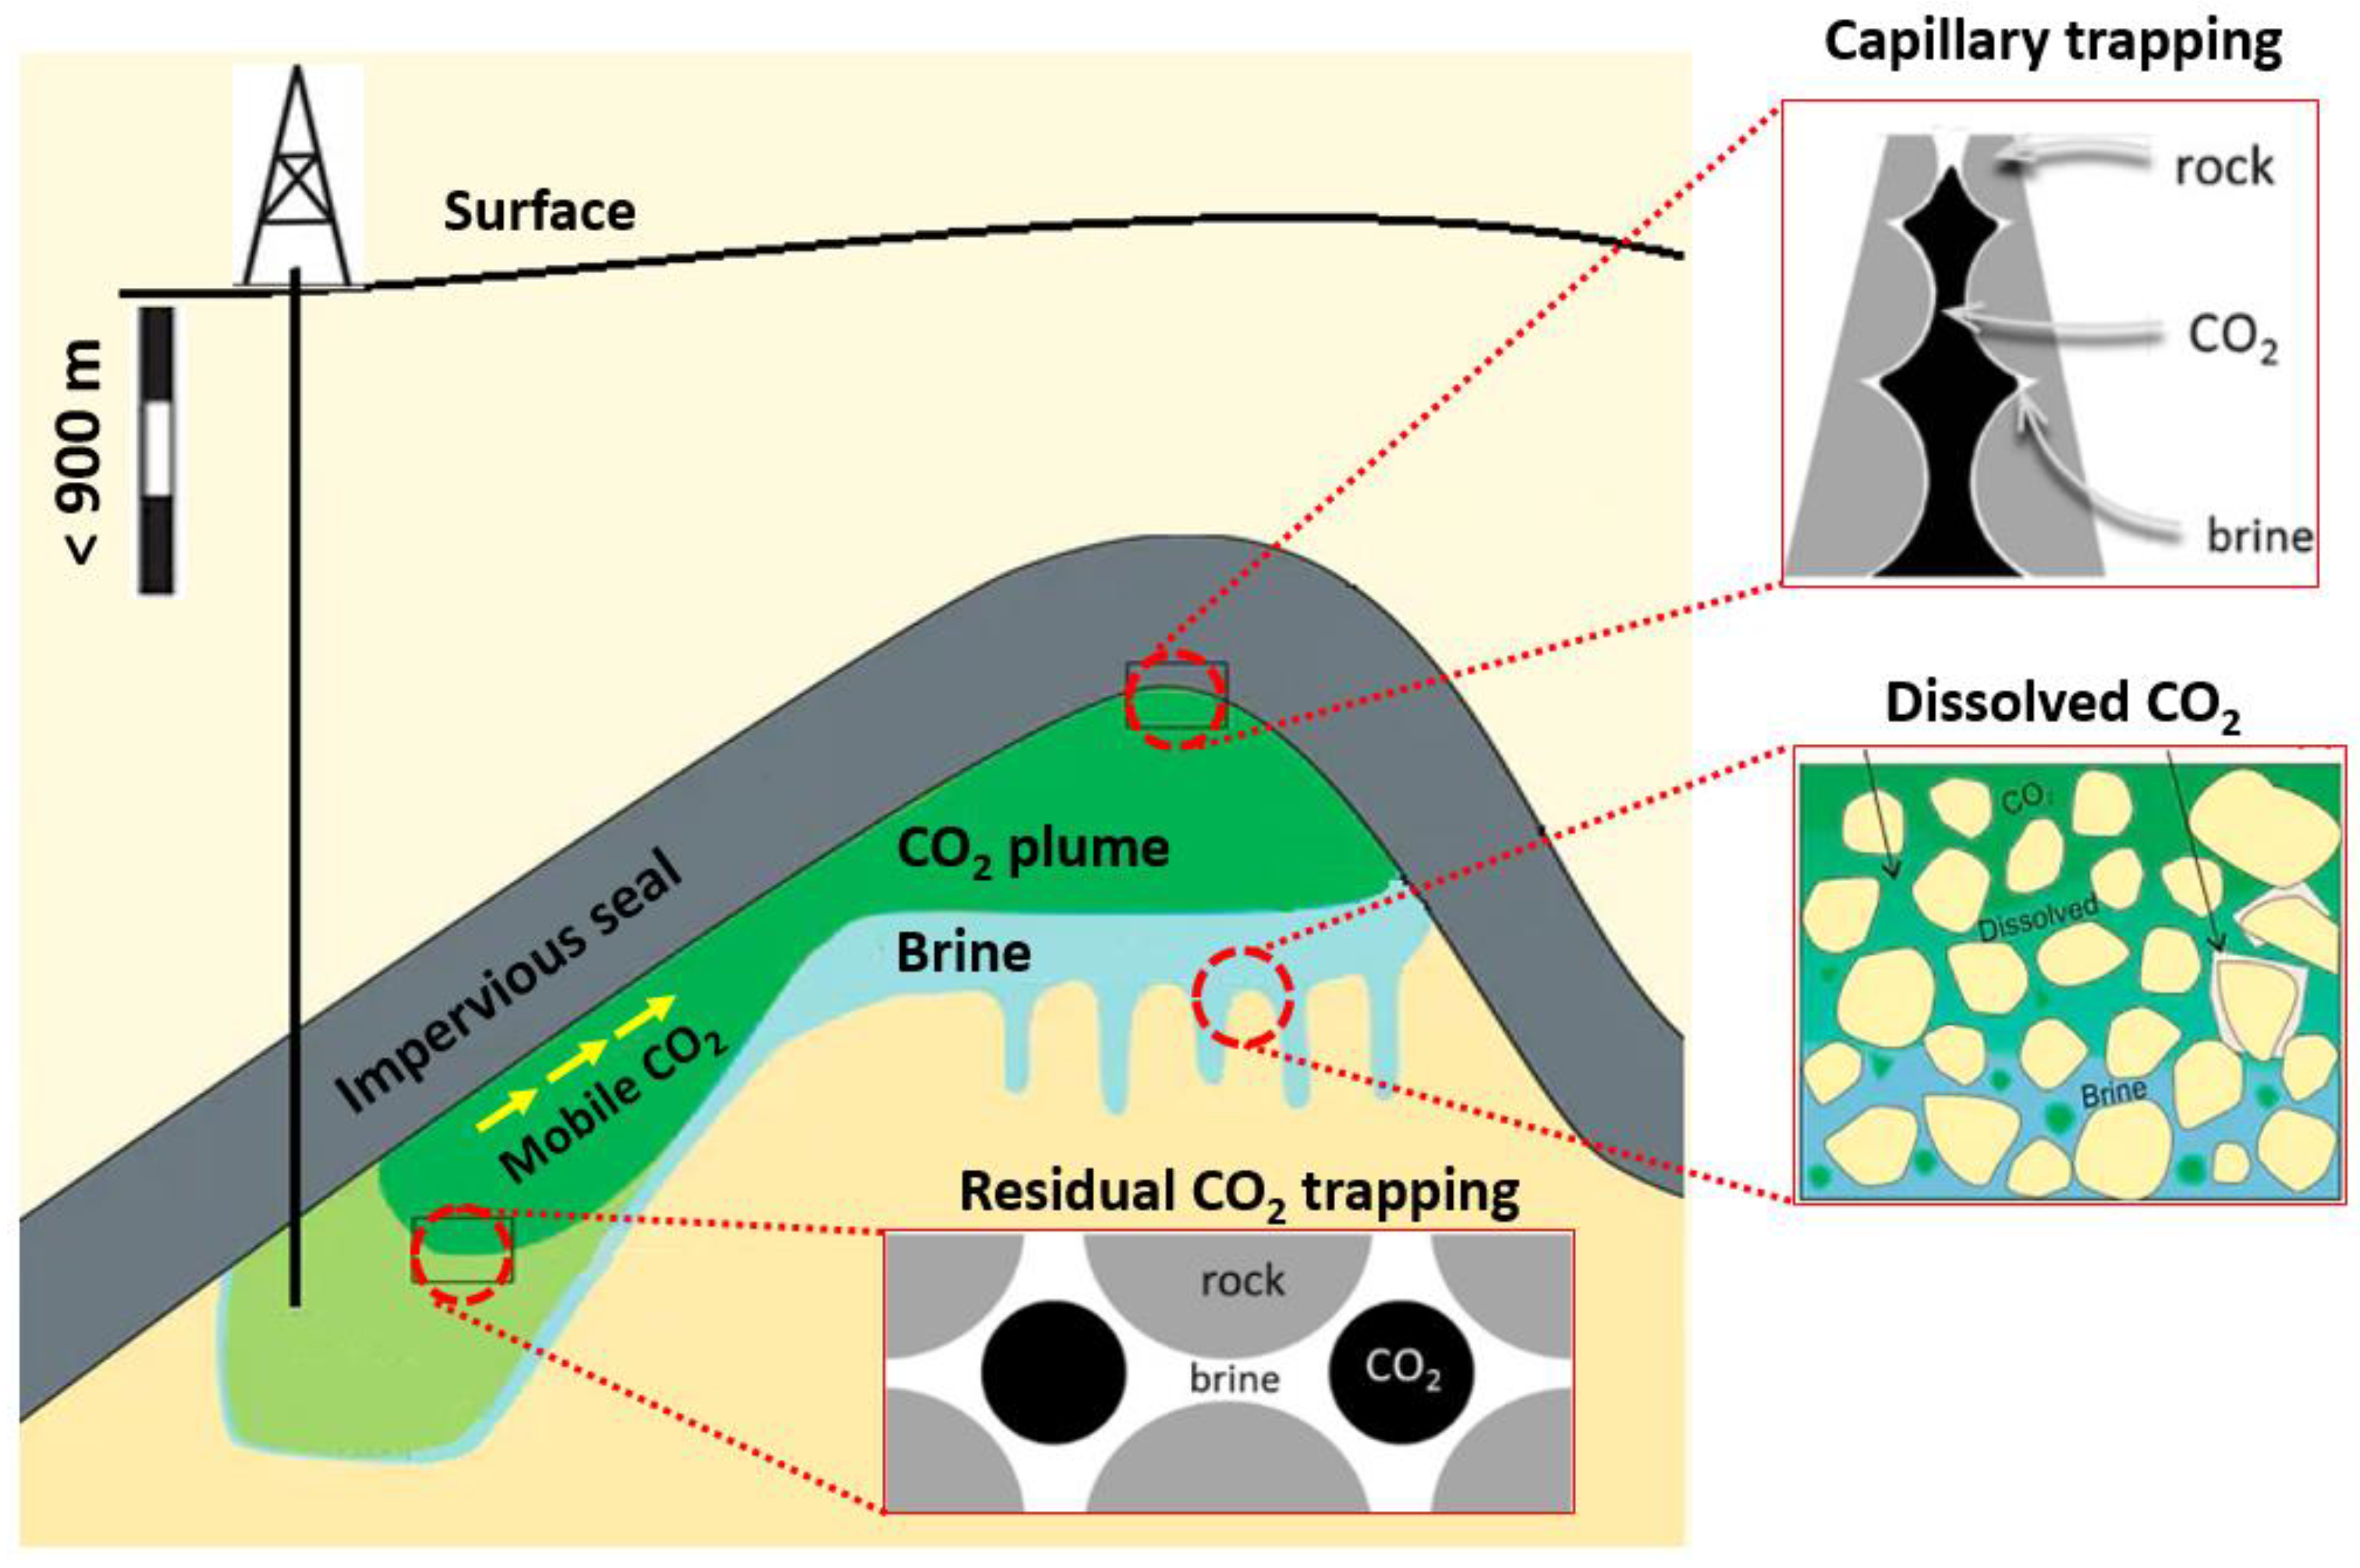
- According to the impact of wettability on the residual and structural trapping mechanisms during the carbon geo-sequestration process, the outcomes of the GEP model in this study can be beneficial for the precise prediction of these mechanisms’ capacity.
Author Contributions
Funding
Institutional Review Board Statement
Informed Consent Statement
Data Availability Statement
Conflicts of Interest
Nomenclature
| Acronyms | Variables | ||
| AAPRE | average absolute percent relative error | wettability of minerals | |
| APRE | average percent relative error | contact angle with zero salinity | |
| adv | advancing | Calc. (i) | predicted value |
| CGS | carbon geo-sequestration | exp. (i) | actual value |
| ET | expression tree | Hat matrix | |
| EWR | enhanced water recovery | h* | leverage limit |
| GEP | gene expression programming | X | p × q matrix |
| P | pressure | XT | transpose matrix |
| rec | receding | p | number of actual data points |
| R2 | coefficient of determination | q | dimension of the model |
| RMSE | root mean square error | relevancy factor in sensitivity analysis | |
| STD | standard deviation error | input parameter in sensitivity analysis | |
| st | static | average of inputs | |
| T | temperature | number of the data points | |
| Superscripts | output parameter | ||
| 0 | zero | average of outputs | |
| H | CO2 column height | ||
| Subscripts | S (Table 3) | salinity | |
| i | counter of data | N (Table 3) | contact angle type |
| k | counter of data | ||
References
- Zhang, Z.; Huisingh, D. Carbon dioxide storage schemes: Technology, assessment and deployment. J. Clean. Prod. 2017, 142, 1055–1064. [Google Scholar] [CrossRef]
- Amar, M.N.; Ghahfarokhi, A.J. Prediction of CO2 diffusivity in brine using white-box machine learning. J. Pet. Sci. Eng. 2020, 190, 107037. [Google Scholar] [CrossRef]
- Chen, L.; Liu, D.; Agarwal, R. Numerical simulation of enhancement in CO2 sequestration with various water production schemes under multiple well scenarios. J. Clean. Prod. 2018, 184, 12–20. [Google Scholar] [CrossRef] [Green Version]
- Mahmoodpour, S.; Amooie, M.A.; Rostami, B.; Bahrami, F. Effect of gas impurity on the convective dissolution of CO2 in porous media. Energy 2020, 199, 117397. [Google Scholar] [CrossRef]
- Omrani, S.; Mahmoodpour, S.; Rostami, B.; Salehi Sedeh, M.; Sass, I. Diffusion coefficients of CO2–SO2–water and CO2–N2–water systems and their impact on the CO2 sequestration process: Molecular dynamics and dissolution process simulations. Greenh. Gases Sci. Technol. 2021, 11, 764–779. [Google Scholar] [CrossRef]
- Jing, J.; Yang, Y.; Tang, Z. Effects of formation dip angle and salinity on the safety of CO2 geological storage-a case study of Shiqianfeng strata with low porosity and low permeability in the Ordos Basin, China. J. Clean. Prod. 2019, 226, 874–891. [Google Scholar] [CrossRef]
- Hesse, M.A.; Orr, F., Jr.; Tchelepi, H. Gravity currents with residual trapping. J. Fluid Mech. 2008, 611, 35. [Google Scholar] [CrossRef]
- Gaus, I. Role and impact of CO2–rock interactions during CO2 storage in sedimentary rocks. Int. J. Greenh. Gas Control. 2010, 4, 73–89. [Google Scholar] [CrossRef]
- Iglauer, S. Dissolution Trapping of Carbon Dioxide in Reservoir Formation Brine—A Carbon Storage Mechanis; INTECH Open Access Publisher: London, UK, 2011. [Google Scholar]
- Juanes, R.; Spiteri, E.; Orr, F., Jr.; Blunt, M. Impact of relative permeability hysteresis on geological CO2 storage. Water Resour. Res. 2006, 42. [Google Scholar] [CrossRef]
- Busch, A.; Alles, S.; Gensterblum, Y.; Prinz, D.; Dewhurst, D.N.; Raven, M.D.; Stanjek, H.; Krooss, B.M. Carbon dioxide storage potential of shales. Int. J. Greenh. Gas Control. 2008, 2, 297–308. [Google Scholar] [CrossRef]
- Giesting, P.; Guggenheim, S.; Van Groos, A.F.K.; Busch, A. Interaction of carbon dioxide with Na-exchanged montmorillonite at pressures to 640 bars: Implications for CO2 sequestration. Int. J. Greenh. Gas Control. 2012, 8, 73–81. [Google Scholar] [CrossRef]
- Al-Khdheeawi, E.A.; Vialle, S.; Barifcani, A.; Sarmadivaleh, M.; Iglauer, S. Influence of CO2-wettability on CO2 migration and trapping capacity in deep saline aquifers. Greenh. Gases Sci. Technol. 2017, 7, 328–338. [Google Scholar] [CrossRef] [Green Version]
- Iglauer, S.; Mathew, M.; Bresme, F. Molecular dynamics computations of brine–CO2 interfacial tensions and brine–CO2–quartz contact angles and their effects on structural and residual trapping mechanisms in carbon geo-sequestration. J. Colloid Interface Sci. 2012, 386, 405–414. [Google Scholar] [CrossRef] [PubMed] [Green Version]
- Qi, R.; LaForce, T.C.; Blunt, M.J. Design of carbon dioxide storage in aquifers. Int. J. Greenh. Gas Control. 2009, 3, 195–205. [Google Scholar] [CrossRef]
- Ding, S.; Xi, Y.; Jiang, H.; Liu, G. CO2 storage capacity estimation in oil reservoirs by solubility and mineral trapping. Appl. Geochem. 2018, 89, 121–128. [Google Scholar] [CrossRef]
- Mahyapour, R.; Mahmoodpour, S.; Singh, M.; Omrani, S. Effect of permeability heterogeneity on the dissolution process during carbon dioxide sequestration in saline aquifers: Two-and three-dimensional structures. Geomech. Geophys. Geo-Energy Geo-Resour. 2022, 8, 70. [Google Scholar] [CrossRef]
- Pentland, C.H.; El-Maghraby, R.; Iglauer, S.; Blunt, M.J. Measurements of the capillary trapping of super-critical carbon dioxide in Berea sandstone. Geophys. Res. Lett. 2011, 38. [Google Scholar] [CrossRef] [Green Version]
- Raza, A.; Gholami, R.; Sarmadivaleh, M.; Tarom, N.; Rezaee, R.; Bing, C.H.; Nagarajan, R.; Hamid, M.A.; Elochukwu, H. Integrity analysis of CO2 storage sites concerning geochemical-geomechanical interactions in saline aquifers. J. Nat. Gas Sci. Eng. 2016, 36, 224–240. [Google Scholar] [CrossRef] [Green Version]
- Daryasafar, A.; Keykhosravi, A.; Shahbazi, K. Modeling CO2 wettability behavior at the interface of brine/CO2/mineral: Application to CO2 geo-sequestration. J. Clean. Prod. 2019, 239, 118101. [Google Scholar] [CrossRef]
- Farokhpoor, R.; Bjørkvik, B.J.; Lindeberg, E.; Torsæter, O. Wettability behaviour of CO2 at storage conditions. Int. J. Greenh. Gas Control. 2013, 12, 18–25. [Google Scholar] [CrossRef]
- Chen, C.; Dong, B.; Zhang, N.; Li, W.; Song, Y. Pressure and temperature dependence of contact angles for CO2/water/silica systems predicted by molecular dynamics simulations. Energy Fuels 2016, 30, 5027–5034. [Google Scholar] [CrossRef]
- Mutailipu, M.; Liu, Y.; Jiang, L.; Zhang, Y. Measurement and estimation of CO2–brine interfacial tension and rock wettability under CO2 sub-and super-critical conditions. J. Colloid Interface Sci. 2019, 534, 605–617. [Google Scholar] [CrossRef] [PubMed]
- Abdi, J.; Bastani, D.; Abdi, J.; Mahmoodi, N.M.; Shokrollahi, A.; Mohammadi, A.H. Assessment of competitive dye removal using a reliable method. J. Environ. Chem. Eng. 2014, 2, 1672–1683. [Google Scholar] [CrossRef]
- Abdi, J.; Vossoughi, M.; Mahmoodi, N.M.; Alemzadeh, I. Synthesis of amine-modified zeolitic imidazolate framework-8, ultrasound-assisted dye removal and modeling. Ultrason. Sonochem. 2017, 39, 550–564. [Google Scholar] [CrossRef]
- Mahmoodi, N.M.; Arabloo, M.; Abdi, J. Laccase immobilized manganese ferrite nanoparticle: Synthesis and LSSVM intelligent modeling of decolorization. Water Res. 2014, 67, 216–226. [Google Scholar] [CrossRef]
- Amooie, M.A.; Hemmati-Sarapardeh, A.; Karan, K.; Husein, M.M.; Soltanian, M.R.; Dabir, B. Data-driven modeling of interfacial tension in impure CO2-brine systems with implications for geological carbon storage. Int. J. Greenh. Gas Control. 2019, 90, 102811. [Google Scholar] [CrossRef]
- Hemmati-Sarapardeh, A.; Amar, M.N.; Soltanian, M.R.; Dai, Z.; Zhang, X. Modeling CO2 Solubility in Water at High Pressure and Temperature Conditions. Energy Fuels 2020, 34, 4761–4776. [Google Scholar] [CrossRef]
- Menad, N.A.; Hemmati-Sarapardeh, A.; Varamesh, A.; Shamshirband, S. Predicting solubility of CO2 in brine by advanced machine learning systems: Application to carbon capture and sequestration. J. CO2 Util. 2019, 33, 83–95. [Google Scholar] [CrossRef]
- Sun, X.; Bi, Y.; Guo, Y.; Ghadiri, M.; Mohammadinia, S. CO2 geo-sequestration modeling study for contact angle estimation in ternary systems of brine, CO2, and mineral. J. Clean. Prod. 2021, 283, 124662. [Google Scholar] [CrossRef]
- Andrew, M.; Bijeljic, B.; Blunt, M.J. Pore-scale contact angle measurements at reservoir conditions using X-ray microtomography. Adv. Water Resour. 2014, 68, 24–31. [Google Scholar] [CrossRef] [Green Version]
- Iglauer, S.; Pentland, C.; Busch, A. CO2 wettability of seal and reservoir rocks and the implications for carbon geo-sequestration. Water Resour. Res. 2015, 51, 729–774. [Google Scholar] [CrossRef] [Green Version]
- Bikkina, P.K. Contact angle measurements of CO2–water–quartz/calcite systems in the perspective of carbon sequestration. Int. J. Greenh. Gas Control. 2011, 5, 1259–1271. [Google Scholar] [CrossRef]
- Palamara, D.; Neeman, T.; Golab, A.; Sheppard, A. A statistical analysis of the effects of pressure, temperature and salinity on contact angles in CO2–brine–quartz systems. Int. J. Greenh. Gas Control. 2015, 42, 516–524. [Google Scholar] [CrossRef]
- Ferreira, C. Gene expression programming: A new adaptive algorithm for solving problems. arXiv 2001, arXiv:0102027. [Google Scholar] [CrossRef]
- Ferreira, C. Gene Expression Programming in Problem Solving. In Soft Computing and Industry: Recent Applications; Roy, R., Köppen, M., Ovaska, S., Furuhashi, T., Hoffmann, F., Eds.; Springer: London, UK, 2002; pp. 635–653. [Google Scholar]
- Koza, J.R. Genetic Programming II: Automatic Discovery of Reusable Subprograms; The MIT Press: Boston, MA, USA, 1994; Volume 13, p. 32. [Google Scholar]
- Amar, M.N. Prediction of hydrate formation temperature using gene expression programming. J. Nat. Gas Sci. Eng. 2021, 89, 103879. [Google Scholar] [CrossRef]
- Nait Amar, M.; Ghriga, M.A.; Hemmati-Sarapardeh, A. Application of gene expression programming for predicting density of binary and ternary mixtures of ionic liquids and molecular solvents. J. Taiwan Inst. Chem. Eng. 2020, 117, 63–74. [Google Scholar] [CrossRef]
- Teodorescu, L.; Sherwood, D. High energy physics event selection with gene expression programming. Comput. Phys. Commun. 2008, 178, 409–419. [Google Scholar] [CrossRef]
- Saraji, S.; Piri, M.; Goual, L. The effects of SO2 contamination, brine salinity, pressure, and temperature on dynamic contact angles and interfacial tension of supercritical CO2/brine/quartz systems. Int. J. Greenh. Gas Control. 2014, 28, 147–155. [Google Scholar] [CrossRef] [Green Version]
- Goodall, C.R. 13 Computation Using the QR Decomposition. 1993. Available online: https://0-doi-org.brum.beds.ac.uk/10.1016/S0169-7161(05)80137-3 (accessed on 23 April 2022).
- Gramatica, P. Principles of QSAR models validation: Internal and external. QSAR Comb. Sci. 2007, 26, 694–701. [Google Scholar] [CrossRef]
- Leroy, A.M.; Rousseeuw, P.J. Robust Regression and Outlier Detection. In Wiley Series in Probability and Mathematical Statistics; Wiley: Hoboken, NJ, USA, 1987. [Google Scholar]
- Nabipour, N.; Daneshfar, R.; Rezvanjou, O.; Mohammadi-Khanaposhtani, M.; Baghban, A.; Xiong, Q.; Li, L.K.B.; Habibzadeh, S.; Doranehgard, M.S. Estimating biofuel density via a soft computing approach based on intermolecular interactions. Renew. Energy 2020, 152, 1086–1098. [Google Scholar] [CrossRef]
- Hemmati-Sarapardeh, A.; Ameli, F.; Dabir, B.; Ahmadi, M.; Mohammadi, A.H. On the evaluation of asphaltene precipitation titration data: Modeling and data assessment. Fluid Phase Equilibria 2016, 415, 88–100. [Google Scholar] [CrossRef]
- Bemani, A.; Xiong, Q.; Baghban, A.; Habibzadeh, S.; Mohammadi, A.H.; Doranehgard, M.H. Modeling of cetane number of biodiesel from fatty acid methyl ester (FAME) information using GA-, PSO-, and HGAPSO-LSSVM models. Renew. Energy 2020, 150, 924–934. [Google Scholar] [CrossRef]
- Amooie, M.A.; Soltanian, M.R.; Moortgat, J. Solutal convection in porous media: Comparison between boundary conditions of constant concentration and constant flux. Phys. Rev. E 2018, 98, 033118. [Google Scholar] [CrossRef] [Green Version]
- Arif, M.; Al-Yaseri, A.Z.; Barifcani, A.; Lebedev, M.; Iglauer, S. Impact of pressure and temperature on CO2–brine–mica contact angles and CO2–brine interfacial tension: Implications for carbon geo-sequestration. J. Colloid Interface Sci. 2016, 462, 208–215. [Google Scholar] [CrossRef] [PubMed]


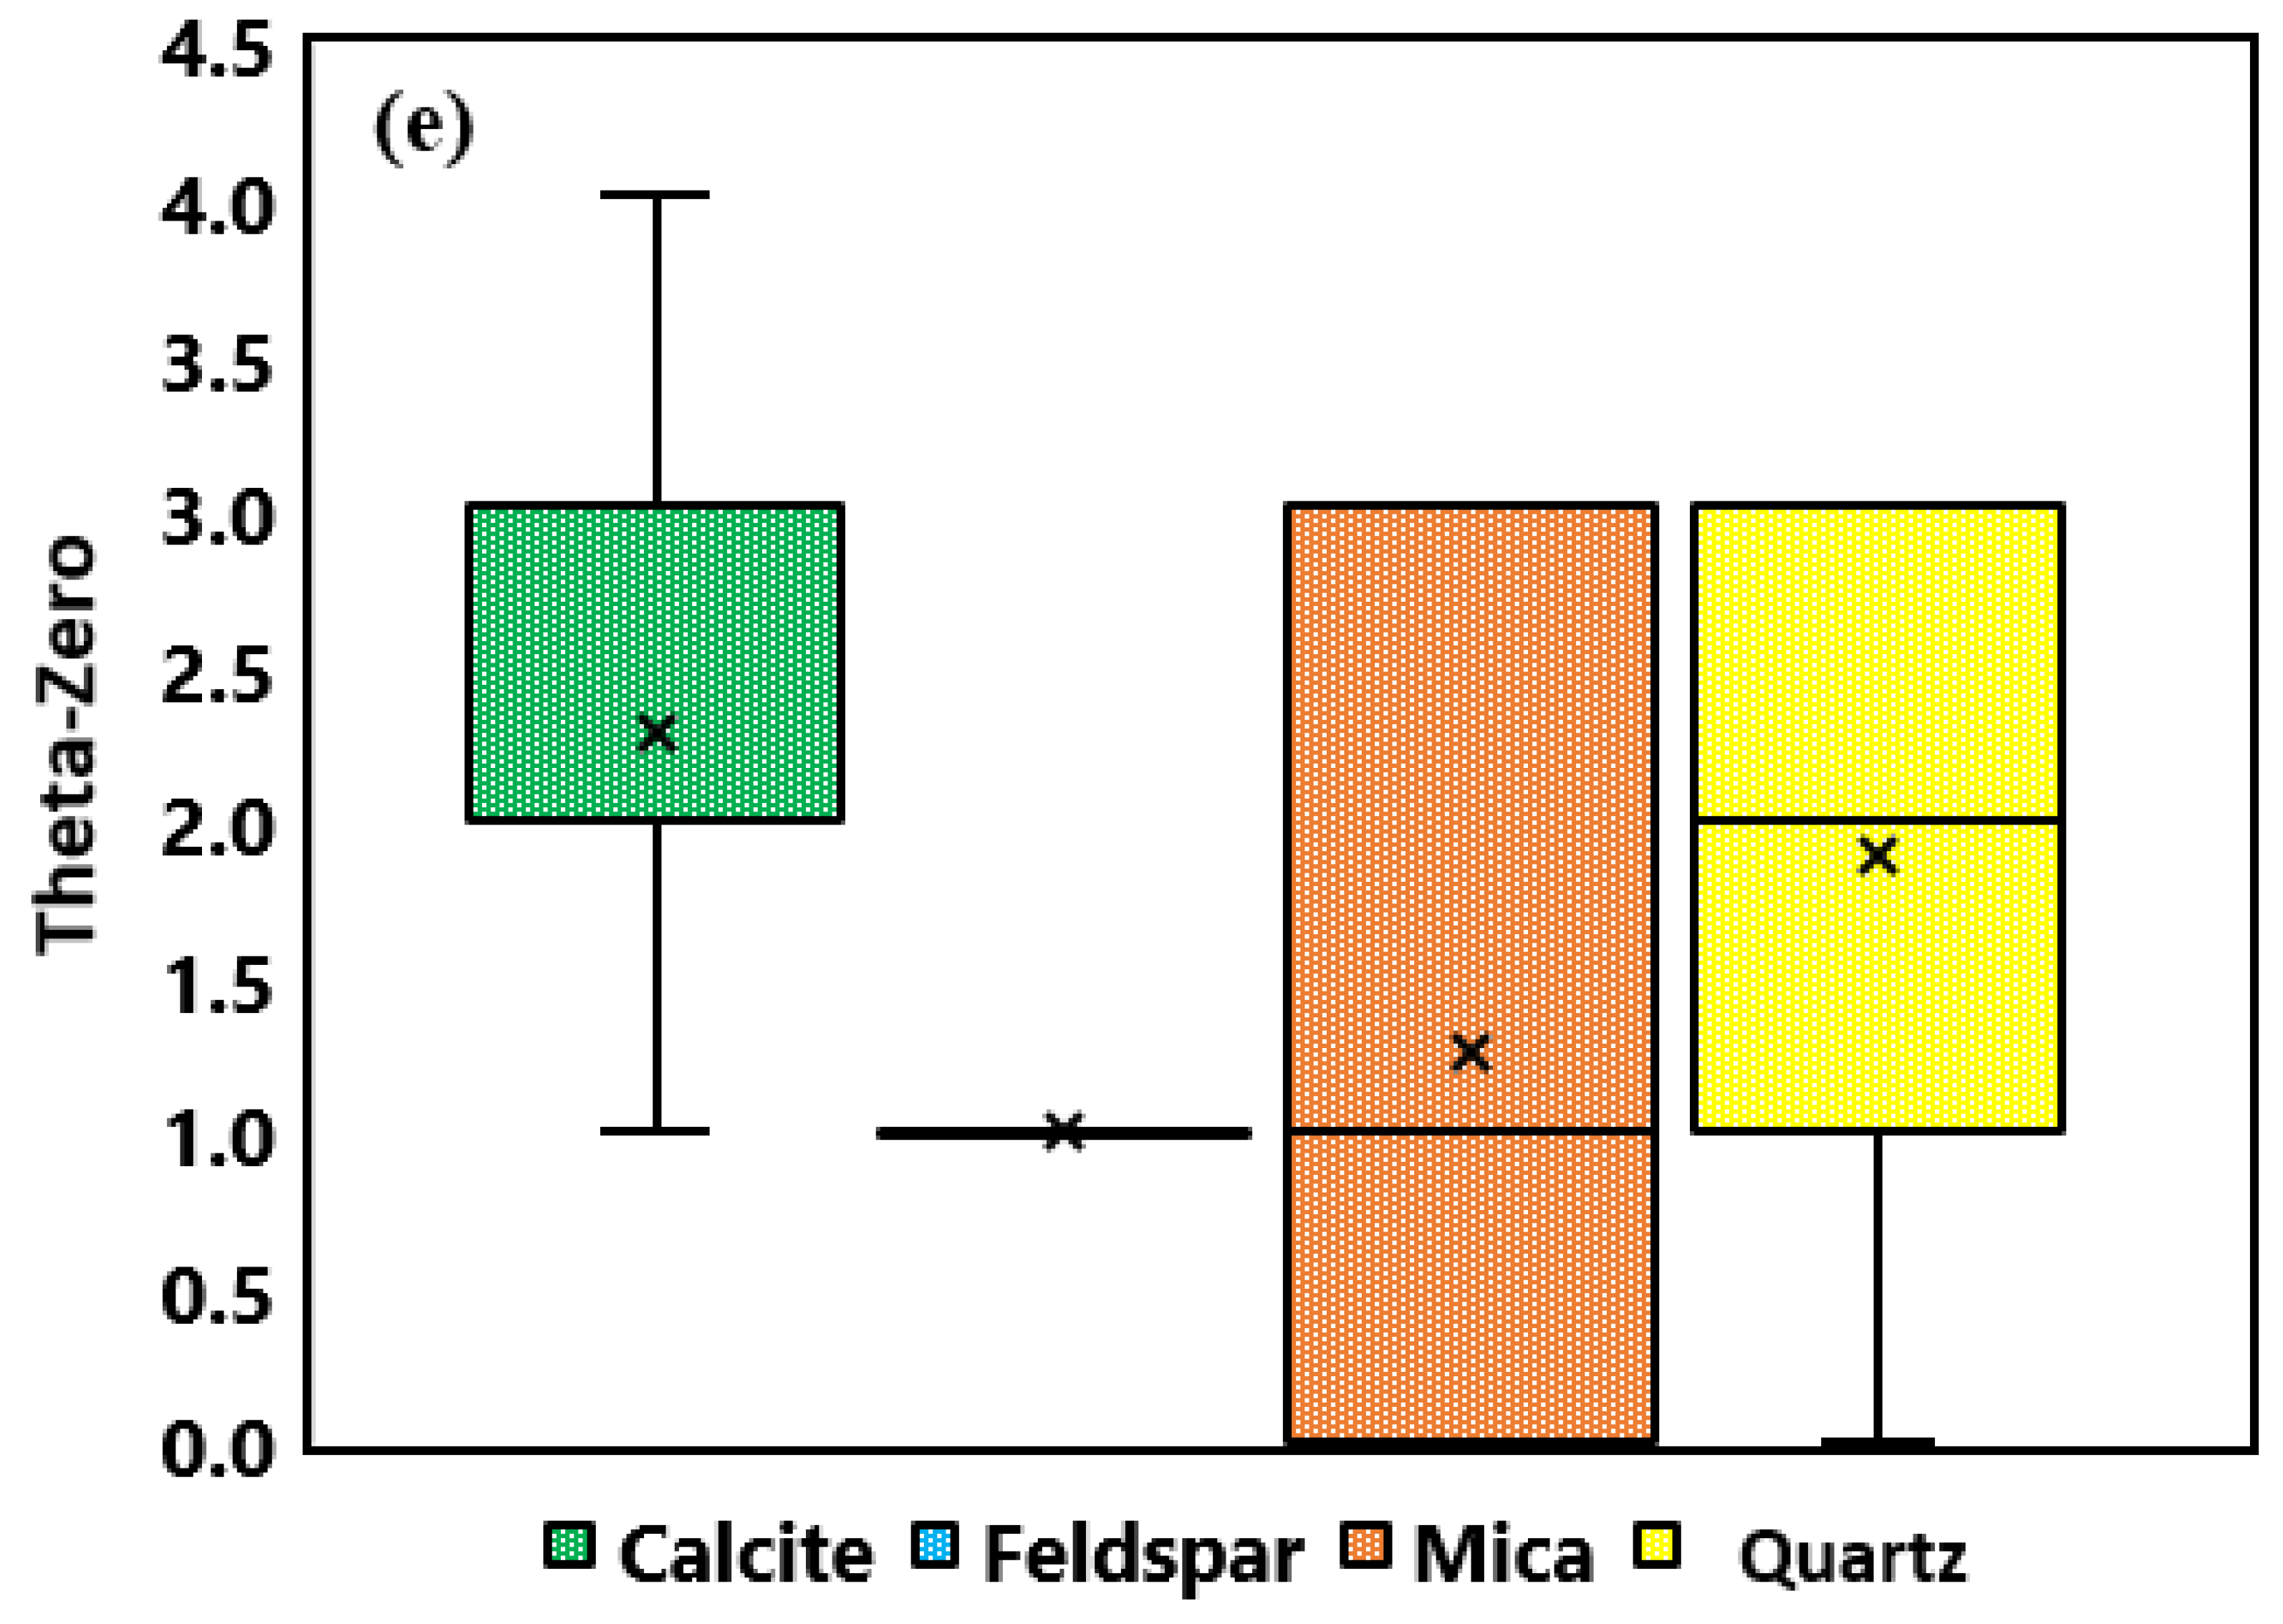
| Pressure (MPa) | Temperature (K) | Salinity (M) | Number (sta/adv/rec) | Theta. zero | Contact Angle | |
| Minimum | 0.04 | 296 | 0 | 1 | 0 | 6.84 |
| Average | 9.59 | 320.52 | 1.27 | 1.95 | 1.73 | 36.85 |
| Maximum | 40.05 | 373 | 12.88 | 3 | 4 | 122.32 |
| Median | 9.02 | 318 | 0.2 | 2 | 2 | 32.59 |
| Mode | 10 | 308 | 0 | 1 | 3 | 68.03 |
| Kurtosis | 3.05 | 1.09 | 7.73 | −1.74 | −1.22 | 0.96 |
| Skewness | 1.32 | 1.17 | 2.65 | 0.08 | −0.16 | 0.96 |
| Parameters | Value/Setting |
|---|---|
| Population size | 60 |
| Crossover’s probability | 90% |
| Mutation’s probability | 15% |
| Elitism | 10% |
| Type of selection | Linear ranking |
| Max. number of generations | 100 |
| Mineral/Parameters | Correlations |
|---|---|
| Calcite | |
| Feldspar | |
| Mica | |
| Quartz (T > 300 K) | |
| Quartz (T < 300 K) | |
| Calcite | Feldspar | Mica | Quartz (T > 300 K) | Quartz (T < 300 K) | ||
|---|---|---|---|---|---|---|
| Training set | APRE (%) | −0.5 | 0.71 | 14.71 | 23.62 | 13.45 |
| AAPRE (%) | 4.4 | 1.69 | 14.71 | 27.54 | 14.28 | |
| RMSE | 1.81 | 0.37 | 7.340 | 10.97 | 3.2 | |
| STD | 0.004 | 0.0004 | 0.026 | 0.110 | 0.037 | |
| R2 | 0.996 | 0.972 | 0.983 | 0.806 | 0.951 | |
| Test set | APRE (%) | −7.12 | −0.001 | 13.38 | 21.11 | 12.54 |
| AAPRE (%) | 10.55 | 1.01 | 13.38 | 27.71 | 12.54 | |
| RMSE | 3.29 | 0.23 | 7.020 | 10.49 | 3.180 | |
| STD | 0.04 | 0.0002 | 0.022 | 0.112 | 0.020 | |
| R2 | 0.985 | 0.974 | 0.965 | 0.678 | 0.978 | |
| Total | APRE (%) | −1.86 | 0.57 | 14.44 | 23.12 | 13.26 |
| AAPRE (%) | 5.66 | 1.56 | 14.44 | 27.57 | 13.93 | |
| RMSE | 2.2 | 0.340 | 7.280 | 10.87 | 3.190 | |
| STD | 0.013 | 0.0004 | 0.025 | 0.110 | 0.034 | |
| R2 | 0.994 | 0.972 | 0.980 | 0.780 | 0.956 |
| Consideration of the wettability measurements reported in the study of Arif et al. [46] | Temperature (K) | Pressure (MPa) | (kg/m3) | (mN/m) | (°) | CO2 column height (m) |
| 323 | 5 | 1031 | 55 | 29 | 952 | |
| 10 | 755 | 43 | 50 | 747 | ||
| 15 | 445 | 38 | 67 | 681 | ||
| 20 | 359 | 36 | 74 | 562 | ||
| 25 | 320 | 33 | 79 | 402 | ||
| 343 | 5 | 1032 | 58 | 26 | 1031 | |
| 10 | 881 | 45 | 41 | 786 | ||
| 15 | 625 | 40 | 58 | 691 | ||
| 20 | 474 | 38 | 68 | 613 | ||
| 25 | 380 | 36 | 74 | 533 | ||
| Temperature (K) | Pressure (MPa) | (kg/m3) | (mN/m) | (°) | CO2 column height (m) | |
| Consideration of the estimations of wettability using the suggested GEP-based correlation | 323 | 5 | 1031 | 55 | 14.04 | 1056.18 |
| 10 | 755 | 43 | 36 | 940.34 | ||
| 15 | 445 | 38 | 51 | 1096.73 | ||
| 20 | 359 | 36 | 61 | 992.16 | ||
| 25 | 320 | 33 | 70 | 719.81 | ||
| 343 | 5 | 1032 | 58 | 13.62 | 1114.72 | |
| 10 | 881 | 45 | 32 | 884.02 | ||
| 15 | 625 | 40 | 44 | 939.55 | ||
| 20 | 474 | 38 | 52 | 1007.28 | ||
| 25 | 380 | 36 | 57 | 1053.01 | ||
| Temperature (K) | Pressure (MPa) | (kg/m3) | (mN/m) | (°) | CO2 column height (m) | |
| °) | 323 | 5 | 1031 | 55 | 0 | 1088.699 |
| 10 | 755 | 43 | 0 | 1162.319 | ||
| 15 | 445 | 38 | 0 | 1742.72 | ||
| 20 | 359 | 36 | 0 | 2046.501 | ||
| 25 | 320 | 33 | 0 | 2104.592 | ||
| 343 | 5 | 1032 | 58 | 0 | 1146.97 | |
| 10 | 881 | 45 | 0 | 1042.41 | ||
| 15 | 625 | 40 | 0 | 1306.12 | ||
| 20 | 474 | 38 | 0 | 1636.10 | ||
| 25 | 380 | 36 | 0 | 1933.40 |
Publisher’s Note: MDPI stays neutral with regard to jurisdictional claims in published maps and institutional affiliations. |
© 2022 by the authors. Licensee MDPI, Basel, Switzerland. This article is an open access article distributed under the terms and conditions of the Creative Commons Attribution (CC BY) license (https://creativecommons.org/licenses/by/4.0/).
Share and Cite
Abdi, J.; Amar, M.N.; Hadipoor, M.; Gentzis, T.; Hemmati-Sarapardeh, A.; Ostadhassan, M. Modeling of Brine/CO2/Mineral Wettability Using Gene Expression Programming (GEP): Application to Carbon Geo-Sequestration. Minerals 2022, 12, 760. https://0-doi-org.brum.beds.ac.uk/10.3390/min12060760
Abdi J, Amar MN, Hadipoor M, Gentzis T, Hemmati-Sarapardeh A, Ostadhassan M. Modeling of Brine/CO2/Mineral Wettability Using Gene Expression Programming (GEP): Application to Carbon Geo-Sequestration. Minerals. 2022; 12(6):760. https://0-doi-org.brum.beds.ac.uk/10.3390/min12060760
Chicago/Turabian StyleAbdi, Jafar, Menad Nait Amar, Masoud Hadipoor, Thomas Gentzis, Abdolhossein Hemmati-Sarapardeh, and Mehdi Ostadhassan. 2022. "Modeling of Brine/CO2/Mineral Wettability Using Gene Expression Programming (GEP): Application to Carbon Geo-Sequestration" Minerals 12, no. 6: 760. https://0-doi-org.brum.beds.ac.uk/10.3390/min12060760