Article

Unusual Luminescence of Quartz from La Sassa, Tuscany: Insights on the Crystal and Defect Nanostructure of Quartz Further Developments

1
Department of Materials Science, University of Milano—Bicocca, Via R. Cozzi 55, 20125 Milan, Italy
2
Department of Geosciences, University of Padova, 35131 Padua, Italy
3
Department of Chemical and Geological Sciences, University of Modena and Reggio Emilia, 41125 Modena, Italy
4
Department of Cultural Heritage, University of Bologna, 48121 Ravenna, Italy
*
Author to whom correspondence should be addressed.
Submission received: 25 May 2022 / Revised: 14 June 2022 / Accepted: 25 June 2022 / Published: 29 June 2022

Abstract

:
Quartz luminescence finds applications on many fields, but much work still needs to be done to precisely characterize it. In this work, we made further developments on the study of luminescence of quartz from La Sassa, Tuscany: a sample with unique properties in this regard. Photoluminescence (PL) measurements allowed study of the excitation profile of the previously reported luminescence, showing an excitation maximum at around 4.3 eV, among other minor ones. This kind of luminescence has also been studied as a function of X-ray irradiation, showing that ionizing radiation desensitizes the photoluminescence emissions. New radioluminescence (RL) measurements have been done to study the effect of thermal annealing at 1000 °C, showing a more complex emission picture in the red region (1.8–2.0 eV), with multiple emissions. The data presented here allow more precise assumptions regarding the assignment of the centers responsible for each emission. The assignment has been confirmed by chemical profiles measured by laser-ablation inductively coupled plasma (ICP) mass spectrometry. The previously tentative assignment of non-bridging oxygen hole centers (NBOHCs) has been disproved for the PL and LIF emissions and confirmed for the RL ones.

1. Introduction

This paper follows the findings of our previous work, published on this journal [1], about a peculiar quartz from La Sassa, Tuscany, known for its luminescence properties. The parts of that work that concern our new findings will be briefly summarized. This sample comes from an area of the well-known geothermal system Larderello [2,3,4,5] and was first studied by Dallegno and Mazzoleni [6]. For further details about the origin of this sample, we point to our previous paper and the other references therein [1]. Quartz luminescence properties are used for applications in many fields, from geology, to archaeometry, to accident dosimetry [7,8,9,10,11,12]. Such properties are due to the presence in quartz of defects in the crystalline structure and impurities, but currently, a precise assignation of each emission to a specific defect is still missing and under debate [12,13,14].
In our previous work, we studied the sample with cathodoluminescence (CL), laser-induced fluorescence (LIF), radioluminescence (RL), and wavelength-resolved thermoluminescence (WR-TL). The CL results showed how this sample has banded growth zones from the evident different-colored bands. The LIF measurements (excitation wavelength at 266 nm) showed a strong emission with at least three main components at around 500 nm, 547 nm, and 600 mn. The RL measurements showed an emission at 620 nm that kept increasing with irradiation, with the WR-TL experiment showing an equivalent emission from the so-called 110 °C TL peak of quartz. From references in the literature, we tentatively tried to assign these emissions to probable emission centers. In particular, we assigned the emission observed in RL and WR-TL to non-bridging oxygen hole centers (NBOHCs), including possibly the emission at 600 nm observed in LIF, suggesting the presence of different paths of excitation that lead to the different emissions observed with different techniques.
In this work, we further studied the properties of this peculiar quartz from La Sassa by measuring the changes in its luminescence induced by thermal annealing and irradiation. It is known in the literature that thermal annealing and combination of thermal annealing with irradiation may enhance, even by orders of magnitude, the intensity of quartz emissions. Some examples have been reported in [15,16,17,18,19]; a notable case of combination of thermal annealing with irradiation is the so-called “predose effect” [15]. This sensitization process can have an impact in applications where quartz is used as a natural dosimeter [12]. Following our tentative assignment of part of the emission from this sample to NBOHCs and the works from Skuja [20,21], we also tried to observe the influence of X-ray irradiation on its photoluminescence (PL) properties, which are based on the same principles of the previous LIF experiment. Using PL, which also served as a reproducibility proof of the LIF data, we obtained additional information regarding the excitation spectrum of the observed emission, which we could not study with LIF. The new data allowed partial confirmation of our assignment of NBOHCs to the emission observed with RL and TL, while also disproving the relation with the 600 nm component observed with LIF. The assignment of the Al hole centers to chemical species is confirmed by chemical profiles measured by high-sensitivity laser ablation-inductively coupled plasma mass spectrometry (LA-ICPMS) across the banded growth zones of the La Sassa quartz, showing different luminescent emissions.

2. Materials and Methods

Fragments of quartz from La Sassa (Q_LS) were crushed into powder of granulometry between 100 and 200 µm. Crushing into powder reduced the inhomogeneity of the sample and ensured better reproducibility of our experiments. Part of the obtained powder was annealed at 1000 °C for 10 min and then rapidly cooled at room temperature. The samples were studied with PL and RL. For the RL and PL experiments, the sample was irradiated with an X-ray tube, model Philips 2274, equipped with a tungsten target and connected to the measurement chamber via a beryllium window. For the RL measurements, the prompt emission caused by the X-ray irradiation was converged by an optical system onto a monochromator, a Jobin-Yvon Triax 180 spectrograph operating in the 200–1100 nm range, which then was detected by a CCD [19,22]: a new Jobin-Yvon Symphony II CCD. The PL equipment used a Horiba Symphony charged coupled device (CCD) as a detector, preceded by a Horiba–Jobin Yvon MicroHR monochromator featuring a diffraction grating [1,23]. For sample excitation, it used a Xenon lamp equipped with a double monochromator to select the desired wavelength. The system allowed acquisition of the emission spectra as a function of exciting wavelength or temperature. For the RL experiments, the samples were deposited on stainless steel plates and glued with silicon oil. For PL experiments, the powder was held inside a fused quartz tube.
The RL experiments were conducted on the annealed powder by acquiring the emitted light every 0.16 Gy up to 6.7 Gy (X-ray tube set to 20 kV and 20 mA; dose calibration obtained with ionizing chamber). After a first measurement, the sample was heated at 500 °C with a heating rate of 1 °C/s and then cooled down to RT. After this second heating, the sample RL was recorded again in the same conditions. The heating at 500 °C was performed to study the effect of the combination of both heating and irradiation on the sample, similar to a predose effect.
In the PL experiments, the powder was irradiated with X-rays from 0 Gy to 1 kGy. To exclude the excitation light from detection, a KV418 Schott filter was applied between the sample and the detector. The excitation was performed from 200 nm up to 420 nm.
The medium-resolution high-sensitivity chemical profiles were acquired through LA-ICPMS at the CIGS laboratories of the University of Modena and Reggio Emilia. The sample used is the same from the CL images of our previous work [1]. The instrumental setup consists of a NewWave Up 213 nm Nd:YAG laser ablation system, coupled to a Thermo Scientific ICPMS iCAP TQ. Line scans were acquired on sample surface using a scan speed of 3 µm/s, a spot size of 65–80 µm, a frequency of 10 Hz, a fluence of ~6 J/cm2, and an He flux of 0.6 L/min. The following isotopes (m/z) were acquired: 7Li, 27Al, 29Si, 48Ti, 73Ge, 74Ge, 139La, 140Ce, 147Sm, 153Eu, 172Yb, 232Th, and 238U. Data reduction was performed following Longerich et al. (1996) [24] and using NIST612 glass as external reference material. Si was employed as internal standard, assuming a constant SiO2 content for the sample, equal to ~99%.

3. Results

3.1. PL Measurements

We report in Figure 1 the contour plot of the PL measurements after irradiating the sample with 0 Gy and 1 kGy. Being the main emission at around 2.24 eV, we report in Figure 2 the excitation spectra of this emission at different irradiation doses. The optical filter starts operating at around 3.1 eV, so all information below that excitation energy (or above that emission energy) should be treated with this in mind. From the excitation spectra, it appears that there is a strong excitation maximum at around 4.3 eV, with other minor ones at around 3.7, 3.6, and 3.3 eV. Considering that the equipment we used to acquire these spectra is not suited for quantitative analysis, it is still interesting to notice that there is a general decrease in intensity with increasing dose. The minor excitation maxima show a strong decrease from the lower doses, while the main one seems to be affected only after a strong dose of 1 kGy.
By studying the emission spectra, it is clear that the spectral shape is perfectly reproducing the results shown in our previous work [1], with no major changes across the excitation range. During the experiments, it was evident that X-ray irradiation also caused a phosphorescence process with an emission centered at 2 eV, compatible with the wavelength-resolved thermoluminescence (WR-TL) emission reported in our previous paper. We report its spectrum in Figure 3, acquired after irradiation at 1 kGy. The emission was also observable at lower doses, but at a much lower intensity. The spectra in Figure 1 were acquired after the complete disappearance of the phosphorescence process, which took around 1h. Illumination with the PL source also caused a phosphorescence emission at 2.48 eV (500 nm), of much lower intensity and that lasted only few minutes, which is one of the three main components we detected with the LIF experiment in our previous paper.

3.2. RL Measurements

We report in Figure 4a the results of the first RL measurement on the annealed powder. We report in Figure 4b the second RL measurement, obtained after heating the sample to 500 °C after the first one. The color scale indicates the changes in intensity during the experiment going from red to blue (first to last). When compared from our previous publication, one instantly notices in Figure 4a the appearance of emission bands in the UV region with an intensity comparable to the one in the red region, specifically the ones which were named C band, M band, and X band (3.42 eV/360 nm, 3.73 eV/330 nm and 3.06 eV/395 nm respectively [25]). It also appears that there are at least two different emissions in the red region; one already observed in our previous paper, at 2.0 eV/620 nm, and another at around 1.80 eV/690 nm. In Figure 4b, the second RL measurement after heating the sample to 500 °C, the presence of different emissions in the red region become more apparent with the one at 1.8 eV that decreases in intensity with irradiation, while the one at 2.0 eV continues to grow. The part in the UV region becomes dominated by intense C and M bands emissions, which decrease with irradiation in the same way as already reported in the literature in other quartz samples [25]. For comparison, we report in Figure 4c the RL spectrum from untreated Q_LS, which was already reported in our previous work [1].

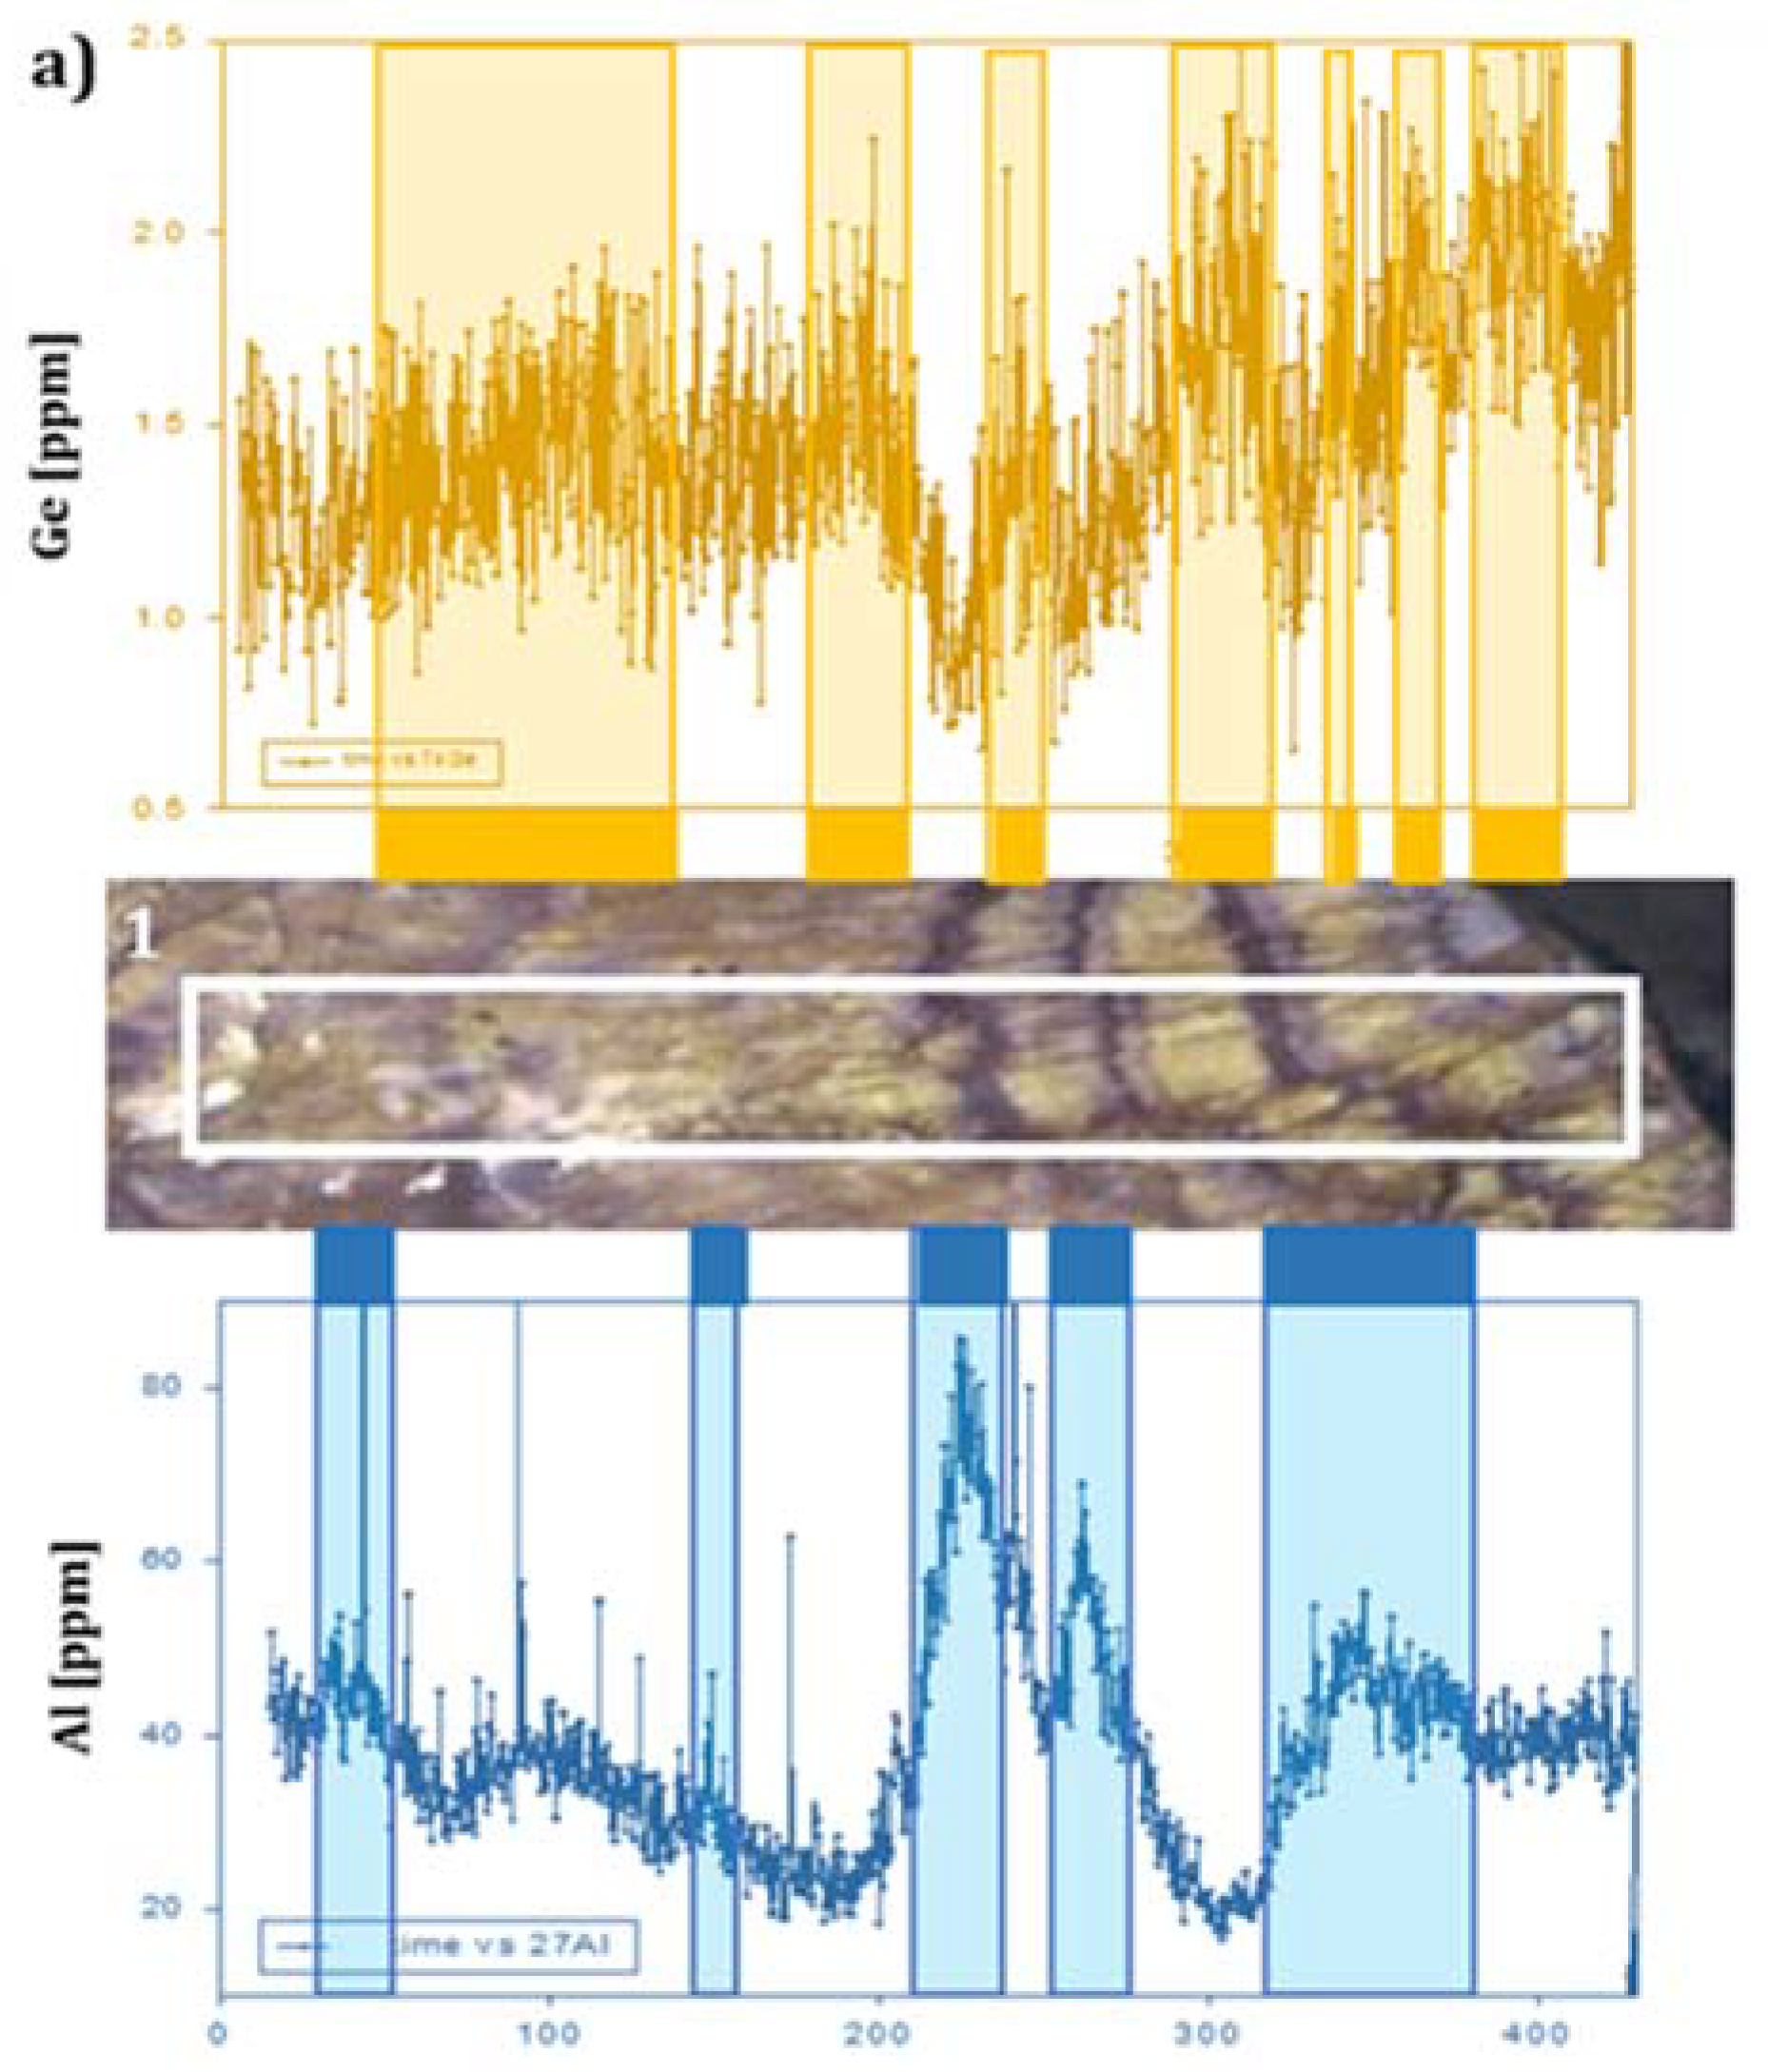
3.3. LA-ICPMS Measurements

Four major chemical traces were measured across the alternating yellow–blue emission bands already observed in the fibrous quartz of La Sassa [1]. Figure 5a,b shows the actual location of the laser ablation traces measured by scanning electron microscopy (SEM) after the mass spectrometry experiments.
Along each trace, the relative amount of Ge and Al were measured continuously, and their concentration quite consistently maps the yellow and blue banding of the luminescent emission, respectively. Figure 6a–c shows the concentration profiles related to the optical emission bands. Despite some blurring due to the size of the laser beam (80 μm traces), it is quite evident that there is a nice alternation of Ge concentration (1–3 ppm) in the bands with yellow emission and a higher concentration of Al (20–140 ppm) in the bands with blue emission, overriding the yellow luminescence. The chemical analyses provide additional indication of the chemistry related to the Al hole mechanisms, showing a direct correlation of the Li content with the Al concentration (Figure 7). Furthermore, the lack of Ti, U, and several REEs probed (La, Ce, Sm, Eu, Yb), which are all undetected with the sensitivity limits of the ICP-MS technique, safely confirms that these elements do not contribute to the discussed emission features.

4. Discussion

The results presented here, our second work on luminescence properties of Q_LS, show, first, that the results obtained with the LIF technique are perfectly reproducible with different instrumentation. If one would take the single emission spectrum obtained at 265 nm in the PL experiment (Figure 1), they would find that it overlaps perfectly with Figure 4a from our first paper [1]. In addition, these new measurements bring useful information on the excitation spectrum. In our previous paper, we advanced the hypothesis to assign at least part of the emission spectrum observed with the LIF experiment to NBOHCs (the component observed at around 600 nm). In the light of the new information here presented, we may exclude this hypothesis, at least for the ones observed via LIF and PL. In the literature, it is known that NBOHCs emissions occurring in the red region (around 600–650 nm/1.9–2.0 eV) in silica and quartz have two main excitation bands, centered at 2.0 eV and 4.8 eV [20]. We were not able to observe the lower energy one, due to the optical filters used, but we certainly do not observe the second one, at 4.8 eV. In fact, we see a major excitation band at around 4.3 eV instead, certainly incompatible with the ones known for NBOHCs. At the current time, we have not been able to find possible other candidates with an excitation spectrum that fits our findings, so we can safely rely on the assumptions found in the literature and as listed in our first paper on Q_LS [1], such as Al impurity centers and possibly self-trapped excitons. This has been neatly confirmed by the LA-ICPMS scans that show Al concentrations corresponding to the blue emitted area of the sample. Another point in favor of excluding NBOHCs from all the emission observed in PL and LIF experiments is shown in Figure 2. The fact that the emission intensity is apparently decreasing with irradiation seems to contradict the works of Skuja et al. [20,21], where clearly the behavior of NBOHCs is the opposite: irradiation should increase the number of these centers. Unfortunately, with our equipment, we are not able to explore the same dose ranges studied by Skuja et al. in reasonable time (above the MGy, even GGy), and as already stated, the quantitative part of the results should be taken with a grain of salt, but they seem to point to a relevant fact, nonetheless.
On the other hand, during the PL experiments, it was possible to coincidentally observe a phosphorescence emission caused by irradiation. This emission is compatible with the one from the WR-TL experiment reported in our previous paper on Q_LS. The time needed for this emission to disappear (around 1 h at RT) is also consistent with previous decay measurements of the so called “110 °C TL peak of quartz” [26,27]. This emission is unrelated to any of the components observed in Figure 1 and is not PL active in the studied excitation range. It is also compatible with the RL spectrum reported in our first work on Q_LS, where we observed that this emission increases with irradiation. With this information, we propose that only this very specific component that we previously observed in Q_LS with RL, and as phosphorescence in this work, is to be assigned to NBOHCs. Its properties are compatible with the works from Skuja et al. [14,20,21]: emission wavelength and increased sensitivity with irradiation.
Additionally, it appears that the emission spectrum does not change significantly in the studied excitation range, including the other excitation maxima reported in Figure 2, which refers only to the main emission at 2.24 eV.
Regarding the new RL experiments done on the sample annealed at 1000 °C, it is still peculiar to observe that the strong red emission is present and of intensity comparable to the UV ones. The latter ones are expected to be observed in most annealed quartz samples [18,25]. New info can be found by noticing that the red emission is now not composed only of a single component, like the untreated sample of our previous paper, but there are at least two different ones, each with its own sensitivity to irradiation. In the second RL measurement on the same sample, following the heating to 500 °C, the red components change again, at least in their response to irradiation. It is very clear that the components at lower emission energies drop in intensity with irradiation, while the ones at higher energies keep increasing during the whole experiment. Given what we discussed regarding the PL experiment and the phosphorescence observed, we believe that only the emission around 2.0 eV, which is the part that keeps increasing with irradiation, may be related to the NBOHCs. So far, we are not able to assign the other red components beyond what already is present in the literature, such as proposals of oxygen vacancies and peroxy linkages that we already pointed out in our previous paper [8,28] and references therein. The UV components are very similar to other published results of different quartz samples and are peculiar of quartz samples in general, and we believe they do not need further comment regarding this specific sample [18,25].
Finally, it is interesting to point out the striking alternance between Ge and Al content. A defect pair mechanism to describe the TL emissions in quartz involving these impurities has been proposed in the literature [29]. Although the emitting center, Al, is always at least an order of magnitude more abundant than Ge, the trap center, the alternation of their concentration seems to point away from this concept, while not completely discrediting such a model.

5. Conclusions

To summarize, further development on our study on Q_LS has been obtained. The PL measurements could exclude NBOHCs as responsible for the unusual luminescence of Q_LS under optical stimulation, while still providing new and useful excitation data about it. Additionally, such measurements have shown that this luminescence is not related to the RL and WR-TL ones previously shown, suggesting instead that NBOHCs may be related only with the latter ones. LA-ICPMS scans showed the relation of Al content to the blue emissions observed in Q_LS. Further insight could be achieved with more specific measurements, such as electron paramagnetic resonance (EPR), capable of identifying specific centers. Lastly, the new RL measurements showed once again the complexity of quartz luminescence, specifically that of the red region, by showing the presence of different components that are activated with irradiation and annealing, each with its own behavior.

Author Contributions

Conceptualization, A.M.M., G.R., M.M. and G.A.; methodology, A.M.M., F.L., M.C.D. and G.A.; validation, A.M.M.; formal analysis, A.M.M., G.A. and G.R.; investigation, A.M.M., G.R., F.L., M.C.D. and G.A.; resources, M.M. and G.A.; data curation, A.M.M., F.L., G.A. and G.R.; writing—original draft preparation, A.M.M.; writing—review and editing, A.M.M., G.R., A.G., F.L., M.M. and G.A.; visualization, A.M.M. and G.A.; supervision, M.M. and G.A. All authors have read and agreed to the published version of the manuscript.

Funding

This research received no external funding.

Acknowledgments

We thank Anna Cipriani for the use of geochemical facilities at Unimore.

Conflicts of Interest

The authors declare no conflict of interest.

References

  1. Ricci, G.; Monti, A.M.; Pagano, R.; Martini, M.; Caneve, L.; Artioli, G. Unusual Luminescence of Quartz from La Sassa, Tuscany: Insights on the Crystal and Defect Nanostructure of Quartz. Minerals 2021, 11, 1345. [Google Scholar] [CrossRef]
  2. Cavarretta, G.; Gianelli, G.; Puxeddu, M. Hydrothermal Metamorphism in the Larderello Geothermal Field. Geothermics 1980, 9, 297–314. [Google Scholar] [CrossRef]
  3. Liotta, D.; Brogi, A. Pliocene-Quaternary Fault Kinematics in the Larderello Geothermal Area (Italy): Insights for the Interpretation of the Present Stress Field. Geothermics 2020, 83, 101714. [Google Scholar] [CrossRef]
  4. Bolognesi, L. The Oxygen Isotope Exchange between Carbon Dioxide and Water in the Larderello Geothermal Field (Italy) during Fluid Reinjection. Geothermics 2011, 40, 181–189. [Google Scholar] [CrossRef]
  5. Gianelli, G.; Ruggieri, G.; Mussi, M. Isotopic and Fluid Inclusion Study of Hydrothermal and Metamorphic Carbonates in the Larderello Geothermal Field and Surrounding Areas, Italy. Geothermics 1997, 26, 393–417. [Google Scholar] [CrossRef]
  6. Dallegno, A.; Mazzoleni, G. A Preliminary Report: The Glowing Quartz from La Sassa, Tuscany, Italy. J. Fluoresc. Miner. Soc. 2012, 32, 15–37. [Google Scholar]
  7. Rusk, B.G.; Lowers, H.A.; Reed, M.H. Trace Elements in Hydrothermal Quartz: Relationships to Cathodoluminescent Textures and Insights into Vein Formation. Geology 2008, 36, 547–550. [Google Scholar] [CrossRef]
  8. Götze, J. Application of Cathodoluminescence Microscopy and Spectroscopy in Geosciences. Microsc. Microanal. 2012, 18, 1270–1284. [Google Scholar] [CrossRef] [Green Version]
  9. Richter, D.K.; Götte, T.; Götze, J.; Neuser, R.D. Progress in Application of Cathodoluminescence (CL) in Sedimentary Petrology. Mineral. Petrol. 2003, 79, 127–166. [Google Scholar] [CrossRef]
  10. Frelinger, S.N.; Ledvina, M.D.; Kyle, J.R.; Zhao, D. Scanning Electron Microscopy Cathodoluminescence of Quartz: Principles, Techniques and Applications in Ore Geology. Ore Geol. Rev. 2015, 65, 840–852. [Google Scholar] [CrossRef]
  11. Götze, J.; Plötze, M.; Graupner, T.; Hallbauer, D.K.; Bray, C.J. Trace Element Incorporation into Quartz: A Combined Study by ICP-MS, Electron Spin Resonance, Cathodoluminescence, Capillary Ion Analysis, and Gas Chromatography. Geochim. Cosmochim. Acta 2004, 68, 3741–3759. [Google Scholar] [CrossRef]
  12. Preusser, F.; Chithambo, M.L.; Götte, T.; Martini, M.; Ramseyer, K.; Sendezera, E.J.; Susino, G.J.; Wintle, A.G. Quartz as a Natural Luminescence Dosimeter. Earth Sci. Rev. 2009, 97, 184–214. [Google Scholar] [CrossRef]
  13. Hashimoto, T. An Overview of Red-Thermoluminescence (RTL) Studies on Heated Quartz and RTL Application to Dosimetry and Dating. Geochronometria 2008, 30, 9–16. [Google Scholar] [CrossRef] [Green Version]
  14. Skuja, L.; Kajihara, K.; Grube, J.; Hosono, H. Luminescence of Non-Bridging Oxygen Hole Centers in Crystalline SiO2; AIP Publishing LLC: Melville, NY, USA, 2014; Volume 1624, pp. 130–134. [Google Scholar]
  15. Zimmerman, J. The Radiation-Induced Increase of the 100 C Thermoluminescence Sensitivity of Fired Quartz. J. Phys. C Solid State Phys. 1971, 4, 3265. [Google Scholar] [CrossRef]
  16. Hunter, P.G.; Spooner, N.A.; Smith, B.W. Thermoluminescence Emission from Quartz at 480 nm as a High-Dose Radiation Marker. Radiat. Meas. 2018, 120, 143–147. [Google Scholar] [CrossRef]
  17. Woda, C.; Schilles, T.; Rieser, U.; Mangini, A.; Wagner, G.A. Point Defects and the Blue Emission in Fired Quartz at High Doses: A Comparative Luminescence and EPR Study. Radiat. Prot. Dosim. 2002, 100, 261–264. [Google Scholar] [CrossRef]
  18. Schilles, T.; Poolton, N.R.J.; Bulur, E.; Bøtter-Jensen, L.; Murray, A.S.; Smith, G.M.; Riedi, P.C.; Wagner, G.A. A Multi-Spectroscopic Study of Luminescence Sensitivity changes in Natural Quartz Induced by High-Temperature Annealing. J. Phys. D Appl. Phys. 2001, 34, 722. [Google Scholar] [CrossRef] [Green Version]
  19. Martini, M.; Fasoli, M.; Villa, I.; Guibert, P. Radioluminescence of Synthetic and Natural Quartz. Radiat. Meas. 2012, 47, 846–850. [Google Scholar] [CrossRef]
  20. Skuja, L.; Ollier, N.; Kajihara, K.; Smits, K. Creation of Glass-Characteristic Point Defects in Crystalline SiO2 by 2.5 MeV Electrons and by Fast Neutrons. J. Non-Cryst. Solids 2019, 505, 252–259. [Google Scholar] [CrossRef]
  21. Skuja, L.; Ollier, N.; Kajihara, K. Luminescence of Non-Bridging Oxygen Hole Centers as a Marker of Particle Irradiation of α-Quartz. Radiat. Meas. 2020, 135, 106373. [Google Scholar] [CrossRef]
  22. Martini, M.; Fasoli, M.; Galli, A.; Villa, I.; Guibert, P. Radioluminescence of Synthetic Quartz Related to Alkali Ions. J. Lumin. 2012, 132, 1030–1036. [Google Scholar] [CrossRef]
  23. Fasoli, M.; Martini, M. The Composite Nature of the Thermoluminescence UV Emission of Quartz. J. Lumin. 2016, 173, 120–126. [Google Scholar] [CrossRef]
  24. Longerich, H.P.; Jackson, S.E.; Günther, D. Inter-Laboratory Note. Laser Ablation Inductively Coupled Plasma Mass Spectrometric Transient Signal Data Acquisition and Analyte Concentration Calculation. J. Anal. At. Spectrom. 1996, 11, 899–904. [Google Scholar] [CrossRef]
  25. Martini, M.; Fasoli, M.; Villa, I. Defect Studies in Quartz: Composite Nature of the Blue and UV Emissions. Nucl. Instrum. Methods Phys. Res. Sect. B Beam Interact. Mater. At. 2014, 327, 15–21. [Google Scholar] [CrossRef]
  26. Vaccaro, G.; Panzeri, L.; Paleari, S.; Martini, M.; Fasoli, M. EPR Investigation of the Role of Germanium Centers in the Production of the 110°C Thermoluminescence Peak in Quartz. Quat. Geochronol. 2017, 39, 99–104. [Google Scholar] [CrossRef]
  27. Monti, A.M.; Buryi, M.; Fasoli, M.; Martini, M. Anomalous Thermal Stability of the [GeO4] Electron Paramagnetic Resonance Signal and the 110 °C Thermally Stimulated Luminescence Peak in Natural and Synthetic Quartz. J. Lumin. 2021, 238, 118263. [Google Scholar] [CrossRef]
  28. Götze, J.; Plötze, M.; Habermann, D. Origin, Spectral Characteristics and Practical Applications of the Cathodoluminescence (CL) of Quartz—A Review. Mineral. Petrol. 2001, 71, 225–250. [Google Scholar] [CrossRef]
  29. Williams, O.M.; Spooner, N.A. Defect Pair Mechanism for Quartz Intermediate Temperature Thermoluminescence Bands. Radiat. Meas. 2018, 108, 41–44. [Google Scholar] [CrossRef]
Figure 1. (a) PL contour plot of Q_LS not irradiated yet; (b) PL contour plot of irradiated Q_LS (1 kGy).
Minerals 12 00828 g001
Figure 2. Excitation spectra of Q_LS, emission at 2.24 eV at different irradiation doses.
Minerals 12 00828 g002
Figure 3. Phosphorescence emission spectrum from Q_LS observable right after 1 kGy irradiation.
Minerals 12 00828 g003
Figure 4. (a) RL spectra on Q_LS annealed at 1000 °C for 10 min; (b) RL spectra on Q_LS from previous figure after a new heating to 500 °C; (c) RL spectra of untreated Q_LS from our previous work [1]; The color scale represents the advancement of the irradiation, from red to green to blue, with each curve being roughly equivalent to 0.16 Gy.
Minerals 12 00828 g004
Figure 5. (a) Traces 1 and 2 and (b) trace 3 (mapped by SEM microscopy) performed by LA-ICPMS across the alternating luminescence bands observed by cathodoluminescence spectroscopy.
Minerals 12 00828 g005
Figure 6. The alternating luminescence emission bands observed by cathodo-luminescence spectroscopy (center image) spatially compared to the chemical scans performed by LA-ICPMS. (a) Trace 1, (b) trace 2, (c) trace 3, as reported in Figure 5. The white rectangle shows the area actually analyzed by the LA-ICPMS scan. The Ge peaks (upper scan, yellow) and the Al peaks (lower scan, blue) are graphically emphasized to show the alternation and the relationship with the luminescence emission bands. Profiles are reported as element concentration (ppm) vs. acquisition time (s).
Minerals 12 00828 g006aMinerals 12 00828 g006b
Figure 7. Close correlation observed between the measured concentrations of Al and Li along traces 1 (a) and 2 (b) as reported in Figure 5.
Minerals 12 00828 g007
Publisher’s Note: MDPI stays neutral with regard to jurisdictional claims in published maps and institutional affiliations.

