Article

Unusual Luminescence of Quartz from La Sassa, Tuscany: Insights on the Crystal and Defect Nanostructure of Quartz

1
Department of Geosciences, University of Padova, 35131 Padova, Italy
2
Inter-Departmental Research Centre for the Study of Cement Materials and Hydraulic Binders (CIRCe), University of Padova, 35131 Padua, Italy
3
Department of Materials Science, University of Milano-Bicocca, 20125 Milan, Italy
4
Via S. Francesco d’Assisi 30, I-20092 Cinisello, 20092 Milan, Italy
5
ENEA Technical Unit for the Development of Applications of Radiations, ENEA Frascati Research Center, 00044 Frascati, Italy
*
Author to whom correspondence should be addressed.
Submission received: 8 November 2021 / Revised: 25 November 2021 / Accepted: 25 November 2021 / Published: 30 November 2021

Abstract

:
Quartz from La Sassa (Tuscany, Italy) presents a unique luminescence related to intrinsic and extrinsic defects in the crystal lattice due to the growth mechanisms in hydrothermal conditions. The bright fluorescence under the UV lamp was apparent to collectors since the early 1970s, and it entered the literature as a reference case of yellow-luminescent quartz. Early reports present the history of the discovery, the geological context, and preliminary luminescence measurements of the quartz nodules, suggesting various activators as potentially responsible of the peculiar luminescence effects: uranyl groups (UO22+), rare earths (Tb3+, Eu3+, Dy3+, Sm3+, Ce3+) and polycyclic aromatic compounds (PAH). Here, we report a full investigation of the La Sassa material, by a multi-analytical approach encompassing cathodoluminescence optical microscopy (OM-CL), laser-induced fluorescence (LIF), wavelength resolved thermally stimulated luminescence (WR-TSL), trace elements analysis by mass spectrometry (ICP-MS) and Raman spectroscopy (RS). The results provide a significant step forward in the interpretation of the luminescence mechanisms: the main luminescent centres are identified as alkali-compensated (mainly Li+ and Na+, K+ and H+) aluminum [AlO4/M+]0 centres substituting for Si, where the recombination of a self-trapped exciton (STE) or an electron at a nonbridging oxygen hole centre (NBOHC) are active.

1. Introduction

In the early 1970s, a small deposit of bright luminescent quartz was discovered in a calcite/dolomite outcrop near the town of La Sassa, Tuscany (Italy). It has been defined as a “unique form of fluorescing quartz” showing “a unique response under UV light, in terms of intensity and quality of the excitation spectra” [1]. Dallegno and Mazzoleni [1,2] studied and analysed this peculiar quartz and assumed that there is only little evidence of other localities where similar fibrous and luminescent quartz occurs. As a matter of fact, the La Sassa specimens entered the collectors’ literature as a special case of bright-luminescing quartz, possibly linked to the early stages of the hydrothermal metamorphism of the Larderello geothermal field located at a short distance from La Sassa.
Luminescence studies of quartz have long been used by geologists in order to investigate the provenance, minerogenesis, sediment source, diagenesis and cementation history of quartz-containing materials [2,3,4,5,6,7]. Specifically, luminescence investigations are widely applied to the study of hydrothermal mineralization processes, and the data are often interpreted in relation to fluid inclusion microthermometry, trace element incorporation, and isotopic variability [6,8,9,10,11]. However, to date, luminescence data and publications on quartz from La Sassa are limited. A few spectra and preliminary information are available online [12,13,14]. On the basis of these early measurements, Dallegno and Mazzoleni [1,15] indicate that the luminescence centres responsible for the peculiar excitation spectra may be the substitution in the crystal lattice of (UO2)2+, Tb3+, Eu3+, Dy3+, and even in few ppb, Ce3+ and Sm3+. Furthermore, it has been suggested that organic impurities and/or polycyclic aromatic hydrocarbons (PAH) may also contribute to the luminescence signal as co-activators, together with REEs, Al3+, B3+, Zr4+and Li+ [1,15].
Here, several techniques were used to analyse the fibrous, pale honey-yellow quartz crystals from La Sassa: laser-induced fluorescence spectroscopy (LIF), wavelength resolved thermally stimulated luminescence (WR-TSL or WR-TL), radioluminescence measurements (RL), optical cathodoluminescence (OM-CL), micro-Raman spectroscopy (μ-Raman) and inductively coupled plasma mass spectrometry (ICP-MS).
The adopted multianalytical approach is aimed at contributing to the scientific knowledge of this peculiar glowing quartz, leading to a deeper understanding of the luminescence centres involved. The luminescence spectra were obtained using a UV excitation laser source (266 nm) and ionizing radiation (beta rays and X-rays), and these data were integrated with the OM-CL “true colours” images in order to achieve a more thorough understanding of the internal structure of the mineral. Luminescence measurements were combined with elemental chemical analysis and μ-Raman spectroscopy to evaluate trace elements in very low concentrations and investigate the presence of possible organic impurities.
The obtained results provide new preliminary insights of the luminescence interpretation and nature of the quartz from La Sassa formed in the geochemical and hydrothermal environment.

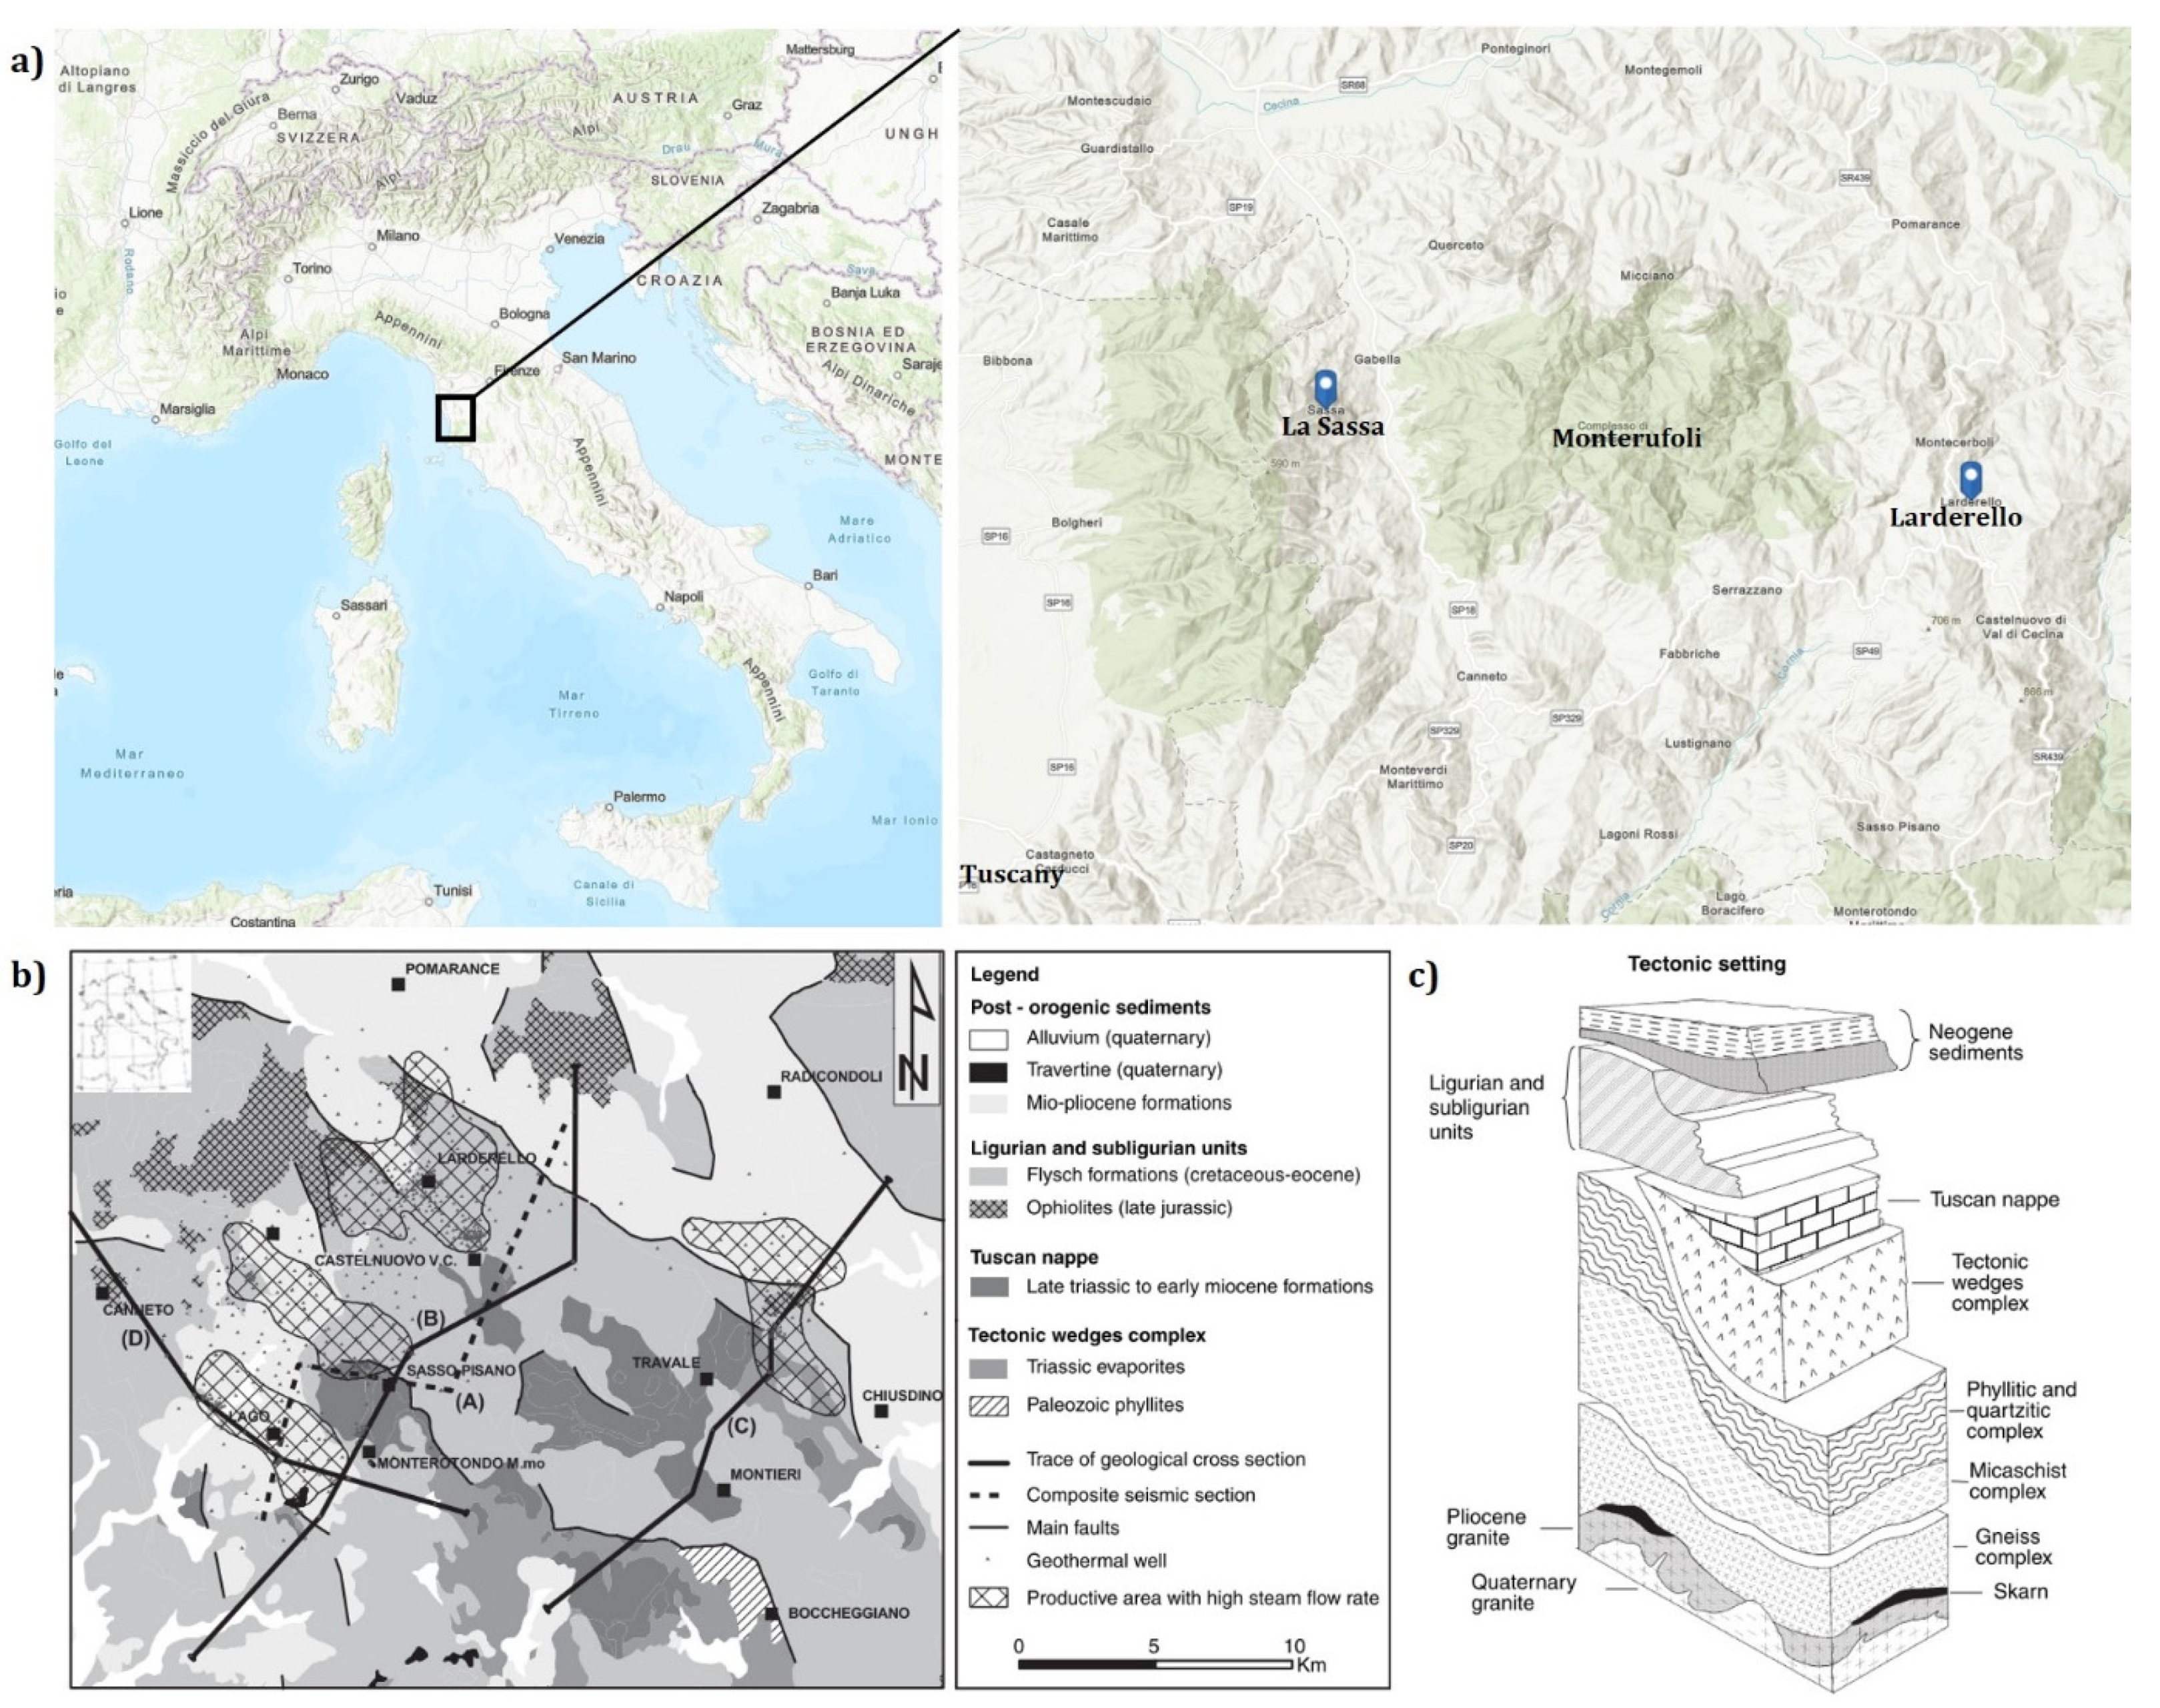
1.1. Geological and Mineralogical Background

The La Sassa area (Pisa, Tuscany) is located at the western edge of the well-described and studied geothermal system of Larderello [10,16,17,18,19] (Figure 1). The northern part includes an outcrop of calcite, with a minor amount of dolomite, quartz, traces of iron sulphides and oxides, barium sulphate, and antimony sulphide. In addition to crystalline α-quartz, cryptocrystalline quartz as chalcedony or opal (rarely) is also found [15,20]. In particular, the calcite outcrop contains quartz as vein-shaped, honey-yellow quartz nodules, similar to a network of calcite and silica veins. The quartz presents a length-slow fibrous texture that is a rare type of silica, almost exclusively associated with hydrothermal sulphates and an evaporites-rich environment [21,22]. As described by Dallegno and Mazzoleni [1], residue of recrystallized quartz in hot springs conditions is present in proximity of the sinter deposit, and it may be related to earlier geyser eggs. Since the silica deposit is partially coated by a younger carbonate-siliceous sediment, the latest emissions occurred in a lower temperature promoting the carbonate deposition. White and microcrystalline quartz can be found representing the final stage of the silica deposition. This quartz is usually non-luminescent, although rarely some bright residues might be found in its mass.
Crystallized quartz in a hydrothermal system is one of the most important and widespread hydrothermal minerals. The diagenetic formation occurs as overgrowths on sandstones, and recycled quartz derived from older sedimentary rocks can be recognized in many types of sediments. Hydrothermal chert (flint) contains crystalline α-quartz and metastable phases as moganite, opal and fibrous chalcedony [23]. Frequently, the hydrothermal quartz is idiomorphic and zoned exhibiting discontinuous internal fabrics suggesting changing growth conditions [7,8,24]. Temperature, fluid composition and saturation, and pH conditions influence the growth dynamic and the trace element composition. Furthermore, the incorporation of trace elements depends on the growth mechanism, kinetics and temperature. The most significant trace elements in hydrothermal quartz crystallized below 450 °C are: Al3+, Li+, Na+ and H+ [11,25]. In summary, the quartz luminescence is mostly linked to the stages of the hydrothermal growth or metamorphism.

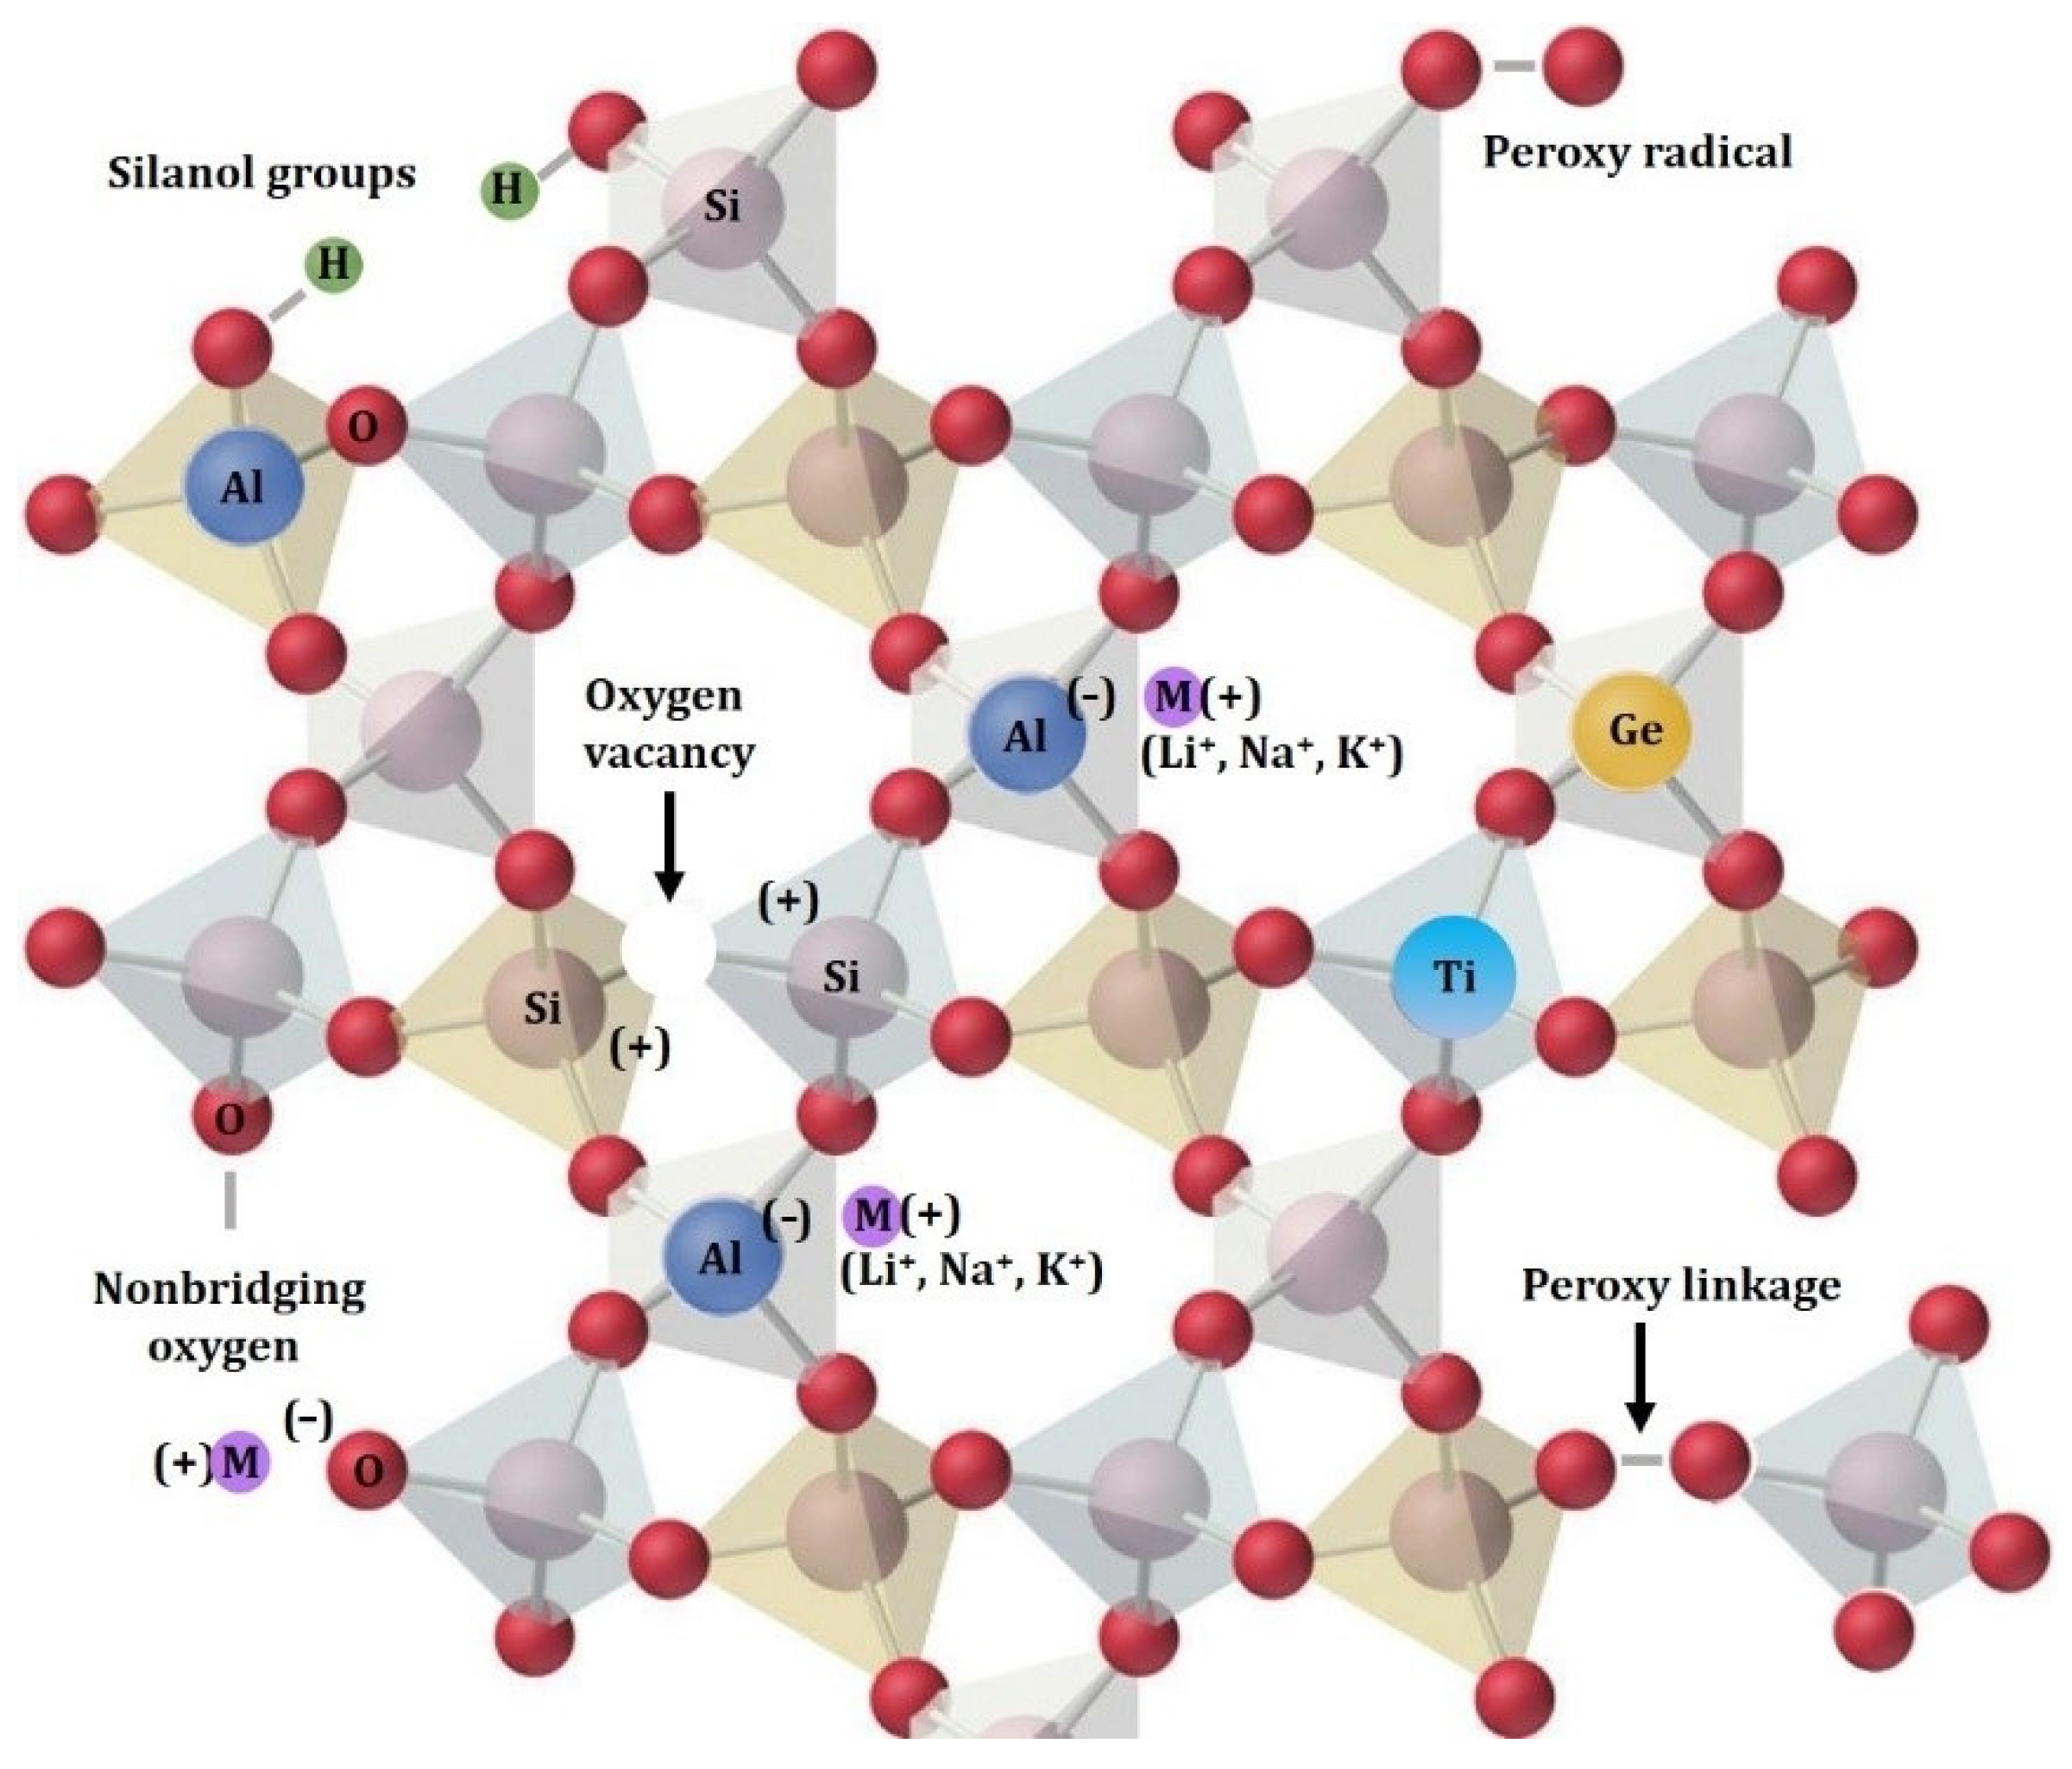
1.2. Luminescence of Quartz

Luminescence in minerals depends on intrinsic (lattice defects) and extrinsic (trace elements) point defects. The former, in quartz, can be related to structural defects as Si- and O-vacancies present in any real crystal. O-vacancy is more common, and it is related to the removal of an O atom from the lattice, leaving a direct bond between two Si atoms. Losing an electron, the so-called E’ centre is formed: the oxygen tetrahedra are transformed into a planar arrangement of three oxygen ions [27]. The Si-vacancy is less common because the Si ion is not replaced easily due to the small ion radius and high valence of Si4+. However, Si-vacancy may host three or four H+ ions creating H3O4 and H4O4, and Al3+, Ga3+, Fe3+, Ge4+, Ti4+ and P5+ have been detected as substitutes [23,27,28]. Al3+ is the main impurity substitution due to its similar ionic radius and, as in the other case of some elements, electric charge compensation is necessary. Therefore, additional monovalent substitutional cations such as H+, Li+ and Na+ (mainly) and K+, Cu+ and Ag+ (unusually) can be incorporated in the crystal lattice in conjunction with structural channels. These impurities, as extrinsic defects, can influence the luminescence of quartz, as they can be activators, sensitizers and/or quenchers [2,11,23,27,28,29] (see Figure 2 that shows the crystal structure and common defects of quartz).
The typical features of quartz—its non-cubic symmetry, the presence of large c-axis channels and its mixed covalent-ionic bond—are responsible for the large variety of defects, more than 20 different types, e.g., the two defects related to the Oxygen excess detected in amorphous silica, as Non-Bridging Oxygen Hole Centres (NBOHC) and Peroxy Radicals (POR) [23,28,31]. The defects cause holes and traps in the band gap, which are able to capture and momentarily hold electrons. Once the electron is able to escape and recombine in some other point defect acting as a recombination centre, a photon is emitted and luminescence occurs with an intensity depending on the density of the point defects states within the band gap [2,4].
Quartz is known to emit light under different stimulations, and the luminescence properties have been widely studied considering their applications not only in geology and geochemistry but also in dosimetry for dating geological and archaeological materials such as sediments, ancient ceramics and mortars [23,32,33,34,35,36]. Despite the wide use of quartz in such applications, the full understanding of the defects responsible for the various luminescence emissions has not yet been achieved. However, interpretations of different luminescence signals involving trace elements in the crystal lattice or bound to micro-inclusions of quartz were discussed in literature, and the authors agree that the emission spectra are related to the genetic conditions of quartz formation [2,6,7,8,11,23,28]. For instance, substitution of Ti4+, forming [TiO4/Li+]0 and [TiO4/H+]0 has been detected in quartz in igneous rocks and seems to be absent in cryptocrystalline quartz, whereas the abundance of oxygen O23− in Si-vacancy and O-vacancy is high in rapid growth of silica as agate [37].
An irradiation source and its energy play a fundamental role in luminescence studies. Depending on the source (β, γ and X-rays, neutrons, temperature, dense electron beams, UV lasers, etc.), different luminescence centres can be excited and, consequently, the decay of different characteristic luminescence bands can appear. For instance, self-trapped exciton (STE) luminescence of α-quartz does not appear by thermally induced luminescence because it is a consequence of the strong electron-phonon interactions as a flux of ionizing radiation [38,39,40]. Moreover, the kind of irradiation may lead to creation of luminescence centres, i.e., the induced defects may be provided by neutron, γ-ray or dense electron beam [40,41].
A thorough study of the available literature, considering the comparison of the own results with those obtained by the same excitation source, may help in the interpretation and attribution of the emission band to particular point defects, both intrinsic and extrinsic. Furthermore, trace elements analyses are a useful tool helping to correlate the presence of impurities, considered as the main components able to influence the luminescence response, to the luminescence bands, although the relationships between quartz luminescence intensity and trace element concentrations are complex [4,8,28]. Hydrothermal quartz is often characterized by luminescence zoning, which cannot be related only to variations of the trace-element concentration but also to intrinsic defects caused by the effects of the growth conditions [28].
Götze et.al. [3,7,28] investigated natural and synthetic quartz samples by CL microscopy and spectroscopy, discussing the state of knowledge and summarizing some principal ideas about the origin of the different CL properties of quartz of various origin. RL (radioluminescence), TL (thermoluminescence) and OSL (optical stimulated luminescence) were also used as luminescence tools, working with different excitation sources to study quartz luminescence properties in different research fields [33,42,43,44,45,46,47].
In this work, our starting points were the luminescence results discussed by Dallegno et al. [1,15], which analysed quartz samples coming from La Sassa by coupled laser UV source and a high-resolution spectrometer. Their preliminary interpretations indicated an abundance of trace elements such as (UO2)2+, REEs, Tb3+, Eu3+, Dy3+, quantitatively subordinate Ce3+, Sm3+, and Al3+, Na+, B3+, Li+, Zr3+ as probable fluorescence activators in the La Sassa quartz. Polycyclic aromatic hydrocarbons (PAHs) and other organic impurities were not excluded as coactivators. Further investigations were needed, and here we present a multianalytical approach consisting of the use of luminescence techniques in combination with chemical analyses in order to contribute to the luminescence interpretation of this peculiar quartz.

2. Materials and Methods

Fragments of La Sassa quartz (Q_LS) were investigated by laser-induced fluorescence spectroscopy (LIF), wavelength resolved thermally stimulated luminescence (WR-TSL or WR-TL), radioluminescence measurements (RL), optical cathodoluminescence (OM-CL), micro-Raman spectroscopy (μ-Raman) and inductively coupled plasma mass spectrometry (ICP-MS). Moreover, a sample composed of organic bituminous material and oil inclusions (black and yellow) preserved within quartz on calcite cements (named Q_oil) from a private collection was analysed by LIF. Q_oil was used as reference of quartz characterized by organic inclusions, and the obtained LIF spectra from both Q_LS and Q_oil were compared.
LIF provides nondestructive qualitative analyses, and the used system was made at the ENEA laboratory (more details in the references [48,49,50]). ThomsomDIVA diode pulsed Nd:YAG laser with a UV excitation wavelength of 266 nm was used as radiation source at a repetition rate of 20 Hz with a pulse duration of 8 ns. The spectrometer (Ocean Optics USB 4000, Ocean Insight, Orlando, FL, USA) working range was 200–900 nm, and appropriate filters were placed at the entrance of the spectrometer in order to avoid the backscattered radiation and the second order of the emissions at lower wavelengths. No optical elements were used to collimate the laser beam. The obtained luminescence spectra were transferred to a portable computer where a LabView programme allowed the user to set the experimental parameters and to control data acquisition. LIF measurements were performed on untreated samples by scanning point by point and covering a surface of c.a. 1 cm2. Up to 16 spectra were collected for each fragment of quartz. All the acquired spectra from Q_LS are superimposable. Characteristic spectra were evaluated, and spectrum adjustments such as smoothing and baseline subtraction were carried out. The UV excitation spectra of natural quartz are very rare in the literature, and the attribution to the different luminescent centres is mainly made by comparison to available cathodoluminescence data with integration of the complementary trace elements analysis. Furthermore, A. Trukhin et al. [51] assert that some kinetic and transition behaviours of quartz can be observed with no contradiction under UV, X-ray and cathodo-exitations.
The WR-TL experiments were performed on a custom-made system, equipped with a Horiba-Jobin Yvon MicroHR monochromator featuring a diffraction grating and a Horiba Symphony charged coupled device (CCD) (Horiba, Kyoto, Japan) as a detector [42]. The system allows for acquiring the TL intensity as a function of both temperature and wavelength, i.e., a wavelength resolved TL (WRTL). The samples were irradiated with a beta source that is part of a commercial Riso TL-OSL reader DA-20 (Sr90-Y90,1.48 GBq, dose rate around 0.11 Gy/s on quartz grains between 100 and 200 µm).
The RL experiments were performed on a custom-made system similar to the WRTL one. It is equipped with a Jobin-Yvon Triax 180 spectrograph operating in the 200–1100 nm range and a Jobin-Yvon Spectrum One 3000 CCD as a detector. To excite the luminescence process, the samples were irradiated with a Philips 2274× ray tube equipped with a tungsten target. The tube was connected to the sample chamber through a beryllium window. The computer program that controls the system allows for acquiring many spectra over time, monitoring the changes in the emission properties of the sample [33,52].
For both TL and RL measurements, the sample was crushed to powder (grain diameter below 200 µm).
A polished section obtained by embedding a quartz fragment in epoxy resin was observed under an optical cathodoluminescence microscope (OM-CL). A NIKON Labophot2-POL petrographic microscope (Nikon, Tokyo, Japan) equipped with a cold cathode stage Cambridge Image Technology Ltd. (Hatfield, UK), CL8200 MK3 operated at a voltage of 15 kV, and a current of 250 µA was used. OM-CL can be considered a complementary luminescence technique [2,53] and allows optical examination performing imaging analysis in real-time “true colours” in the visible range.
Raman spectra were collected using a Thermo Scientific DXR Micro-Raman spectrometer (Thermo Fisher Scientific, Waltham, MA, USA) equipped with 10× and 50×-LWD objectives. Lasers working at 532 nm and 785 nm with 8 mW laser power were tested and the best spectra were obtained under the 785 nm illumination, due to the very intense luminescence observed in the spectra at 532 nm, which could cover Raman signals from the sample. The spectra were obtained by averaging 10 scans recorded from 150 to 3200 cm−1 with 2.7–4.2 cm−1 spectral resolution and 10 s of recording time. Different points of the polished section of the quartz were analysed in order to account for sample inhomogeneity and to evaluate the presence of organic inclusions in the sample. Spectra were collected and treated with OMNIC for Dispersive Raman software (Thermo Fisher Scientific, Waltham, MA, USA).
Trace elements concentration related to the luminescence centres present in quartz were investigated by inductively coupled plasma mass spectrometry (ICP-MS). The measurements were carried out by a Thermo Scientific iCAP RQ ICP-MS system for ultra-trace elemental analysis at the CNR-Institute for the Dynamics of Environmental Processes, located in the Department of Environmental Sciences at University Ca’ Foscari, Venice [54]. The preanalytical procedures were carried out in the clean laboratory available at the IGG-CNR-Institute, located in the Department of Geosciences at University of Padua, and all the materials used for sampling, treatment and storage of samples and solutions were carefully chosen, acid-cleaned and conditioned to minimize sample contamination [55]. The sample was ground and homogenized. Then, 25 mg was digested in PFA vials with 3 mL of concentrated HF at 200 °C for 15 min. After that, 1 mL of the solution was diluted with 15 mL of 5% v/v HNO3. A blank sample was also prepared, and element concentrations were calculated using an external calibration curve method; the calibration solutions were prepared in 5% v/v HNO3 by dilution from ICP multielement standard solutions IMS-101, IMS-102 and IMS-104 (Ultra Scientific, North Kingstown, RI, USA) at 11 different concentrations (0.01–500 ppb).

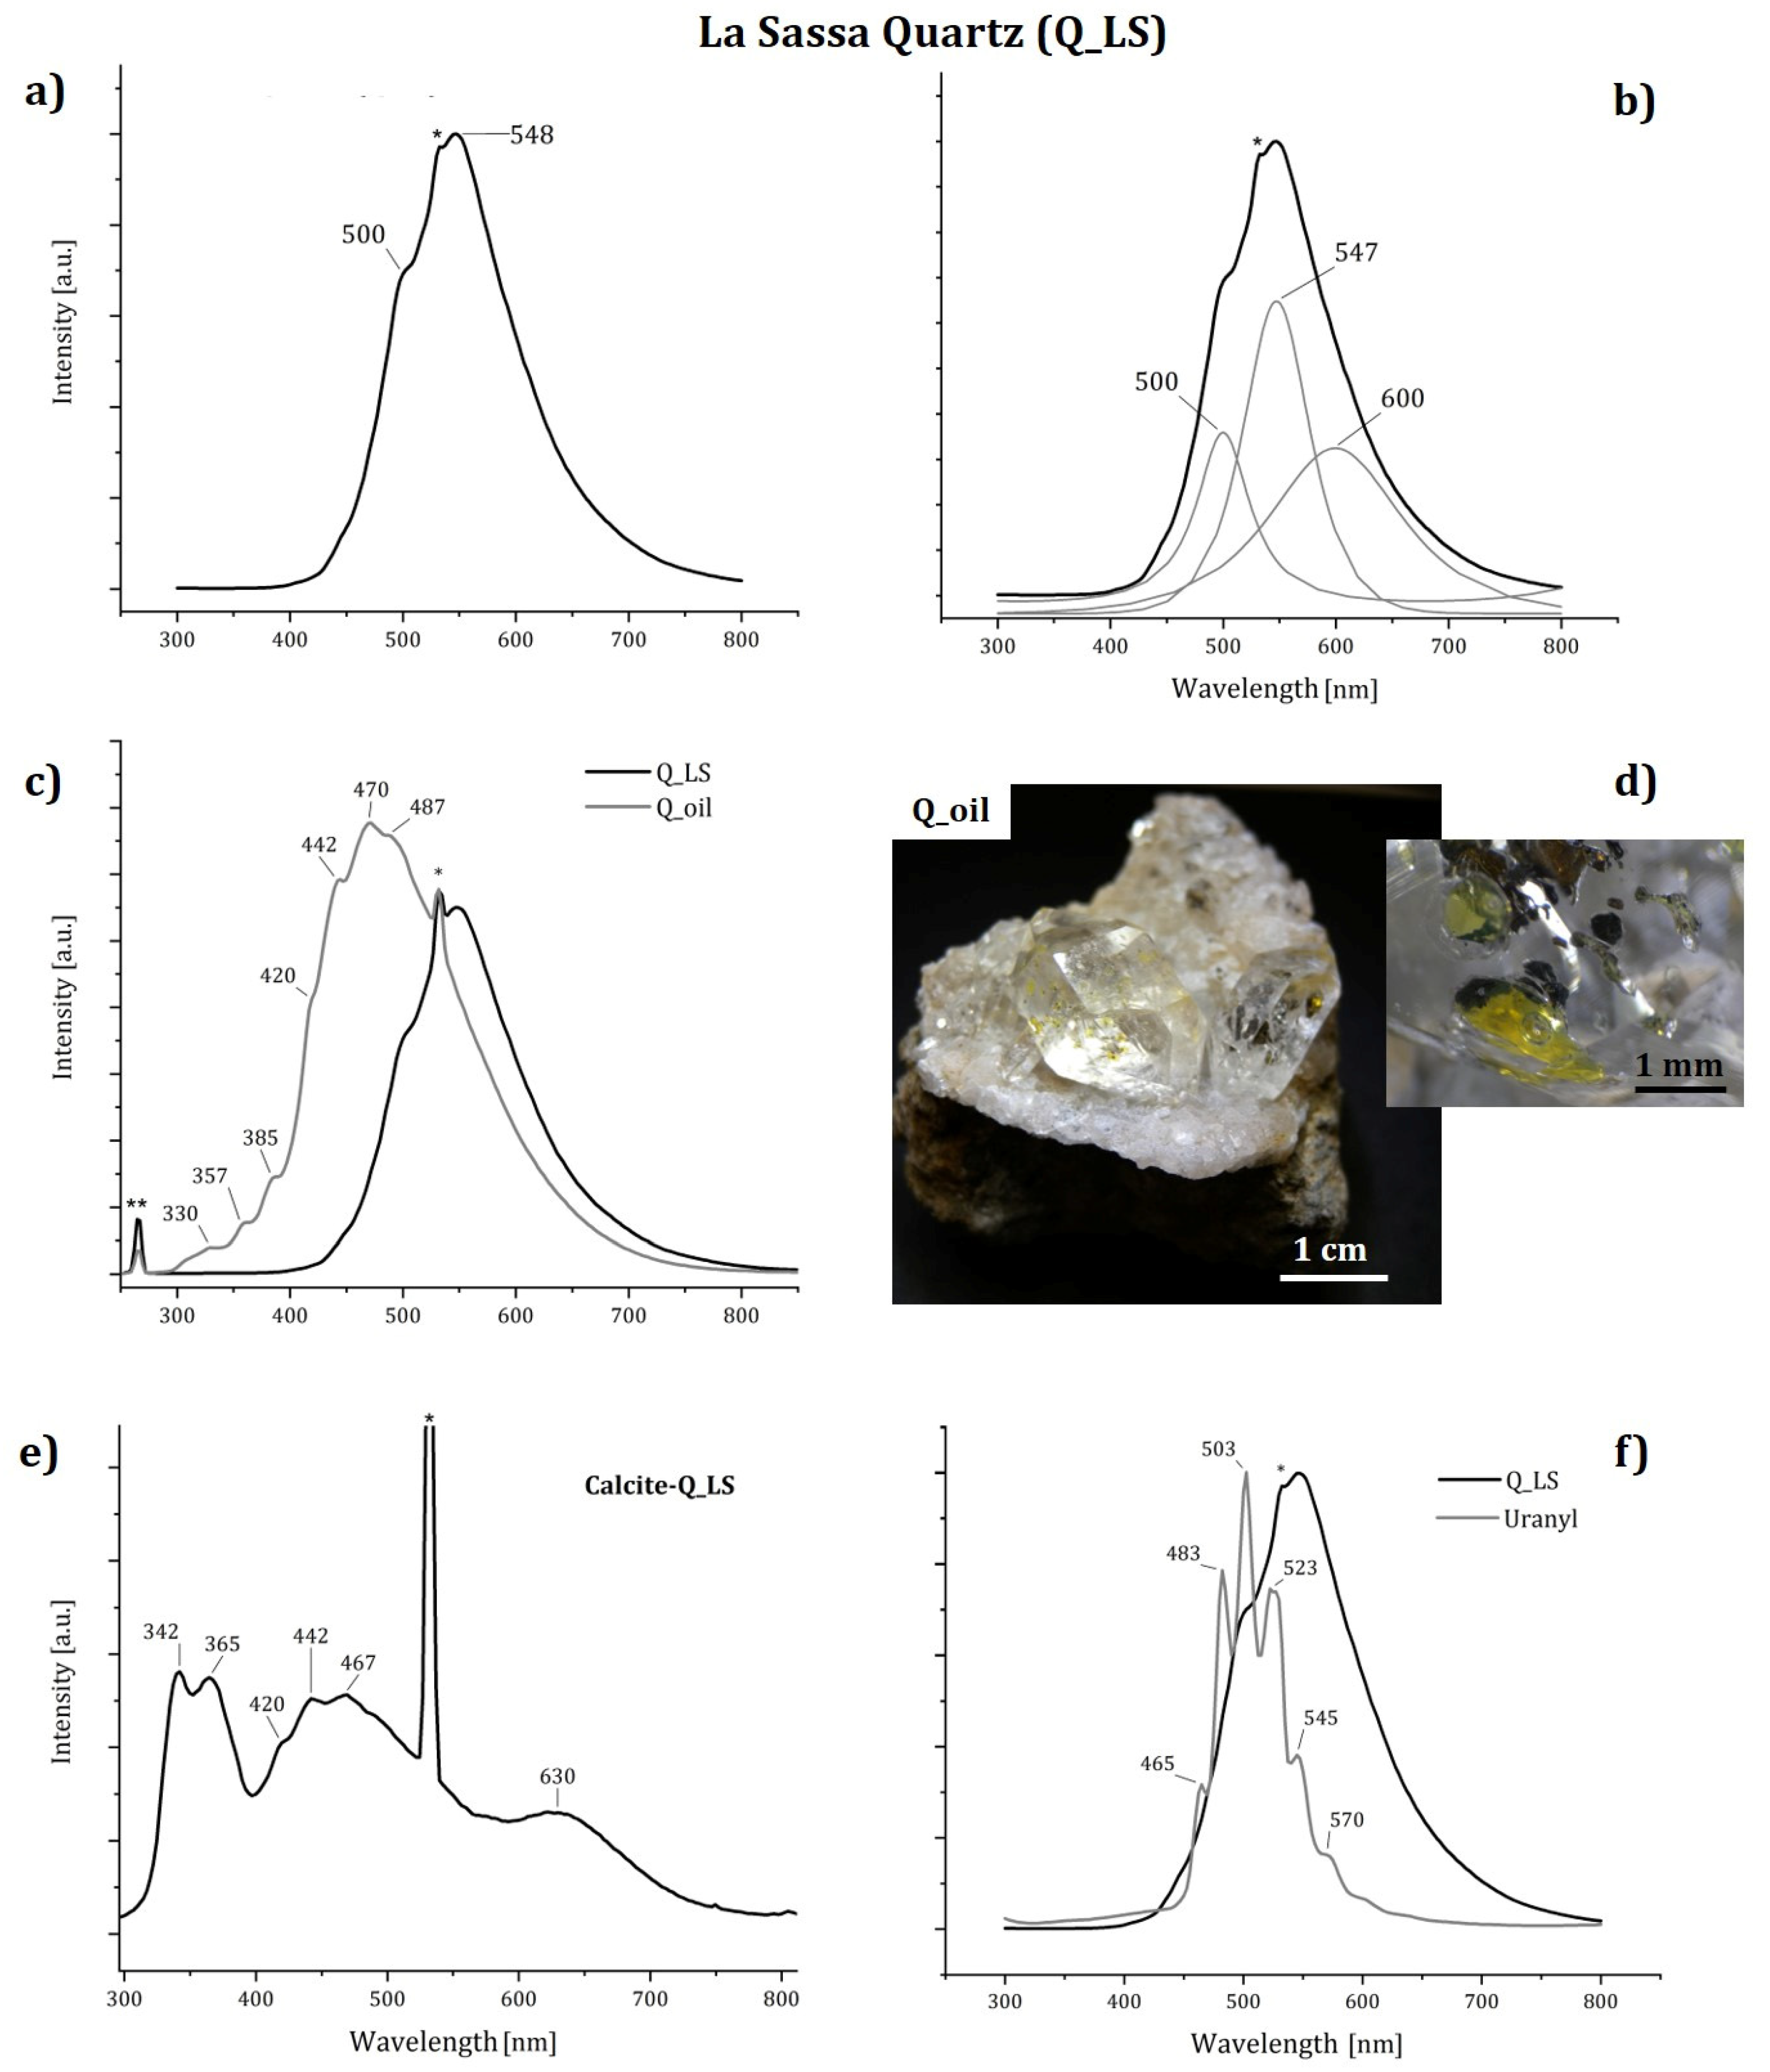
3. Results and Discussion

Cathodoluminescence images of the La Sassa sample (Figure 3) show bright luminescence colours related to distinct phases of crystal growth. The sample shows no homogeneous distribution of the incorporated trace elements. Moreover, growth sectorial zoning, sealing of fractures and other growth fabrics are present. Irregular and concentric layers of microcrystalline fibrous quartz are displayed and different luminescence colours, such as green, blue-purple and light purple, are due to the various luminescence centres. In particular, the blue-purple luminescence seems to follow the concentric growth layers being limited by the single rims, whereas the luminescence centres responsible for the bright light green colour are scattered over the section crossing layers in different directions. CL emission in the blue and green regions was observed in both natural and synthetic hydrothermal quartz samples, and it is related to intrinsic and extrinsic lattice defects [3,5,28,33]. The alkali-compensated aluminium substitution [AlO4/M+]0 centre might be responsible for these emissions. The CL images may indicate a relationship to the Al content of the different zones by varying the trace-element uptake during crystal growth. ICP-MS results (Table 1) show high aliquots of Al+3 and Li+, Na+ and K+ as positively charged interstitial cations. The growth mechanisms of quartz are indeed influenced by Al content, and the pronounced zoning occurs in a situation in which the Al amount is large [25,56,57]. Moreover, the high concentrations of Fe+3/+2 and Ti+4 suggest that they may have a role in the luminescence emission since both (Fe+3 and Ti+4) can substitute silicon atoms in the lattice due to their small ion radii. The blue emission visible in OM-CL images is a common feature of α-quartz crystallized from aqueous solutions as hydrothermal quartz [28].
Uranyl ions as an activator centre for the green luminescence were suggested in literature [15,58]. The data obtained by ICP-MS and LIF seem to not support this hypothesis: La Sassa quartz is characterized by very low concentration of U4+ (<0.1 ppm), and LIF spectra do not show the characteristic narrow peaks between 450 and 600 nm (Figure 4) [48,58,59,60]. In order to identify specific peaks within the broad asymmetric bands of the Q_LS LIF spectrum, peak deconvolution was carried out and it suggests that the main band may be composed of three different contributions at 500, 547 and 600 nm. The former one, at 500 nm, may be originated by the recombination of charge carriers at Al centres, although the role of Al in blue and UV emission is still under debate [28,61]. The emission at 547 nm is usually associated with self-trapped exciton (STE) from amorphous SiO2 outgrowth [38,39], but it should be noted that usually at room temperature this kind of emission is quenched, although sometimes it has been observed [62]. The emission at 600 nm is usually assigned to the recombination of electrons in the nonbridging oxygen hole centre (NBOHC) with hydrogen or sodium impurities as precursors [31,63]. The concentration of Al may be an indirect cause of the emission in the red region, by favouring the formation of NBOHCs [30]. These bands are considered typical emission of quartz crystallized from hydrothermal solutions. However, the intense band at 547 nm is rarely observed in natural quartz [28], and thus it may represent a peculiarity of La Sassa quartz luminescence emission. Trace elements such as Tb+3, Eu+3, Dy+3, Sm+3 and Ce+3, suspected to be activators [1,15], were not detected under ICP-MS measurements (Table 1).
Moreover, further investigations were carried out to verify the presence of aromatic hydrocarbons and/or other organic inclusions responsible for the luminescence in quartz. Firstly, there is no evidence of inclusions such as oil-bearing fluid inclusions under either the naked eye or optical microscope, and the μ-Raman results (λexc = 785 nm) on La Sassa quartz show a chemical composition of pure quartz (Figure 5). In addition, LIF measurements on quartz with organic bituminous material and oil inclusions (Q_oil) were carried out and the obtained spectra were compared with those obtained from Q_LS (Figure 4c,d). The two spectra show different luminescence bands: Q_oil bands are shifted to lower wavelengths, whereas those of Q_LS are shifted to higher wavelengths preserving the main band at 547 nm as the characteristic band.
Additionally, the emission of Q_LS was studied with RL and TL techniques. For the RL measurements, the sample was irradiated with a dose rate of 0.2 Gy/s, acquiring a spectrum every 30 s for a total of 50 acquisitions and 300 Gy. The spectra are reported in Figure 6. As it can be seen, the emission under ionizing excitation has a dominant component at around 620 nm that continues to grow during the whole experiment and at least 2 smaller components at around 390 nm and 340 nm. While the latter ones are to be expected in this kind of experiment in quartz samples [27], the strong component at 620 nm is quite peculiar, like the ones observed in the LIF experiment. Similar emissions were observed in a synthetic quartz sample of high purity during CL experiments [23], showing a similar behaviour of increasing intensity with irradiation. This emission is usually assigned to intrinsic defects of quartz, such as NBOHCs, and may be related to the component observed at 600 nm in the LIF experiment. The WR-TL experiment was performed by heating the sample at 1 °C/s after irradiating it with about 75 Gy of beta rays. The emission observed consisted of a single TL peak at around 90 °C in the 550–650 nm region. In Figure 7, the glow curve is given, as obtained after integrating the acquired data between 550 and 650 nm (a), and the spectrum was obtained by integrating the acquired data between 60 and 125 °C (b). In this case, only a single emission could be observed; it is centred at around 620 nm and is very similar to the one observed with the RL experiment. No components were observed in the blue and UV regions, most likely because they could not be detected due to the lower sensitivity of this kind of experiment when compared to a typical TL experiment using a PMT. Still, it is very peculiar that the TL experiment also showed only the 620 nm component. This may suggest that the LIF experiment is able to directly excite the centres responsible for the emissions at 600, 547 and 500 nm while creating free charge carriers in the conduction and valence bands with ionizing radiation such as beta rays and X-rays; there is a more favourable path of relaxation through the centres responsible for the dominant 600–620 nm emission. Interestingly, a red emission is rarely observed in the so-called 110 °C TSL peak of quartz, here observed at around 90 °C, e.g., it is observed in reference [64] but not in reference [61]. The presence of a red emission in the 110 °C TL peak of quartz in Q_LS may find application in dating by taking advantage of the so-called predose effect [23,65].

4. Conclusions

Luminescent quartz occurring at La Sassa shows peculiar and very intense emission bands rarely found in natural quartz. The complementary techniques used to investigate the intrinsic and extrinsic defects responsible for the luminescence emissions contribute to a deeper understanding of the luminescence centres involved. LIF was applied as a nondestructive and sensitive spectroscopic tool, and the results were integrated and combined with those obtained by WR-TL, RL, ICP-MS, OM-CL and Raman spectroscopy.
Both RL and WR-TL results show a strong and peculiar component at around 620 nm that could be assigned to intrinsic defects of quartz, such as NBOHCs, and may be related to the band observed at 600 nm in the LIF spectrum. The reported “unique form of luminescence”, specific to the La Sassa quartz, largely depends on the combination of charge-compensated aluminum-alkali ion centres and NBOHCs with a possible recombination of STE from amorphous SiO2. The results obtained in this research may safely exclude organic inclusions, uranyl ions and REEs as luminescence activators in the La Sassa quartz.

Author Contributions

Conceptualization, G.R., M.M. and G.A.; data curation, G.R. and A.M.M.; formal analysis, G.R., A.M.M. and L.C.; methodology, G.R., A.M.M., M.M., L.C. and G.A.; writing—original draft, G.R.; writing—review and editing, G.R., A.M.M., R.P., M.M., L.C. and G.A. All authors have read and agreed to the published version of the manuscript.

Funding

This research received no external funding.

Data Availability Statement

All data is contained within the article.

Acknowledgments

Maria Chiara Dalconi helped with measurements and fostered interest on the luminescence of La Sassa quartz. Telemaco Tesei provided a technical contribution in the CL-OM analyses. Guido Mazzoleni kindly provided details of early measurements and unpublished data. Giancarlo Cavazzini of CNR-IGG maintained the ultra-clean room for sample treatment, and Clara Turetta and Andrea Barbante at the CNR-Institute for the Dynamics of Environmental Processes helped with the mass spectrometry measurements.

Conflicts of Interest

The authors declare no conflict of interest.

References

  1. Dallegno, A.; Mazzoleni, G. A Preliminary Report: The Glowing Quartz from La Sassa, Tuscany, Italy. J. Fluoresc. Miner. Soc. 2012, 32, 15–37. [Google Scholar]
  2. Boggs, S.; Krinsley, D. Application of Cathodoluminescence Imaging to the Study of Sedimentary Rocks; Cambridge University Press (CUP): Cambridge, UK, 2006. [Google Scholar]
  3. Götze, J.; Plötze, M.; Graupner, T.; Hallbauer, D.K.; Bray, C.J. Trace element incorporation into quartz: A combined study by ICP-MS, electron spin resonance, cathodoluminescence, capillary ion analysis, and gas chromatography. Geochim. Cosmochim. Acta 2004, 68, 3741–3759. [Google Scholar] [CrossRef]
  4. Frelinger, S.N.; Ledvina, M.D.; Kyle, J.R.; Zhao, D. Scanning electron microscopy cathodoluminescence of quartz: Principles, techniques and applications in ore geology. Ore Geol. Rev. 2015, 65, 840–852. [Google Scholar] [CrossRef]
  5. Richter, D.K.; Götte, T.; Götze, J.; Neuser, R.D. Progress in application of cathodoluminescence (CL) in sedimentary petrology. Mineral. Petrol. 2003, 79, 127–166. [Google Scholar] [CrossRef]
  6. Rusk, B.; Reed, M.; Krinsley, D.; Bignall, G.; Tsuchiya, N. Natural and Synthetic Quartz Growth and Dissolution Revealed by Scanning Electron Microscope Cathodoluminescence. In Proceedings of the 14th International Conference on the Properties of Water and Steam, Kyoto, Japan, 29 August–3 September 2004; pp. 296–302. [Google Scholar]
  7. Götze, J. Application of Cathodoluminescence Microscopy and Spectroscopy in Geosciences. Microsc. Microanal. 2012, 18, 1270–1284. [Google Scholar] [CrossRef] [Green Version]
  8. Rusk, B.G.; Lowers, H.A.; Reed, M.H. Trace elements in hydrothermal quartz: Relationships to cathodoluminescent textures and insights into vein formation. Geology 2008, 36, 547. [Google Scholar] [CrossRef]
  9. Suchý, V.; Dobeš, P.; Sýkorová, I.; Machovič, V.; Stejskal, M.; Kroufek, J.; Chudoba, J.; Matějovský, L.; Havelcová, M.; Matysová, P. Oil-bearing inclusions in vein quartz and calcite and, bitumens in veins: Testament to multiple phases of hydrocarbon migration in the Barrandian basin (lower Palaeozoic), Czech Republic. Mar. Pet. Geol. 2010, 27, 285–297. [Google Scholar] [CrossRef]
  10. Gianelli, G.; Ruggieri, G.; Mussi, M. Isotopic and fluid inclusion study of hydrothermal and metamorphic carbonates in the Larderello geothermal field and surrounding areas, Italy. Geothermics 1997, 26, 393–417. [Google Scholar] [CrossRef]
  11. Götte, T.; Pettke, T.; Ramseyer, K.; Koch-Müller, M.; Mullis, J. Cathodoluminescence properties and trace element signature of hydrothermal quartz: A fingerprint of growth dynamics. Am. Miner. 2011, 96, 802–813. [Google Scholar] [CrossRef]
  12. Fosbury, R. Quartz, La Sassa, Italy; Fluorescence 404 nm Laser and 254 nm Hg. 2012. Available online: https://www.flickr.com/photos/bob_81667/6708645453 (accessed on 7 September 2021).
  13. Barmarin, G. Database of Luminescent Minerals. Quartz. Available online: https://www.fluomin.org/uk/fiche.php?id=628 (accessed on 7 September 2021).
  14. Mindat.Org. Quartz from La Sassa Carbonate Vein, La Sassa, Montecatini Val di Cecina, Pisa Province, Tuscany, Italy. Available online: https://www.mindat.org/locentry-1413274.html (accessed on 13 September 2021).
  15. Dallegno, A.; Mazzoleni, G.; Pasqua, C. Luminescence Spectroscopy: A Powerful Tool for Studying Hydrothermal Minerals. The Example of Ree-Doped Silica Phases in a Sinter Deposit Close To Larderello Geothermal Field, Italy. In Proceedings of the 13th Indonesia International GEOTHERMAL Convention & Exhibition, Jakarta, Indonesia, 12–14 June 2013. [Google Scholar]
  16. Bolognesi, L. The oxygen isotope exchange between carbon dioxide and water in the Larderello geothermal field (Italy) during fluid reinjection. Geothermics 2011, 40, 181–189. [Google Scholar] [CrossRef]
  17. Liotta, D.; Brogi, A. Pliocene-Quaternary fault kinematics in the Larderello geothermal area (Italy): Insights for the interpretation of the present stress field. Geothermics 2020, 83, 101714. [Google Scholar] [CrossRef]
  18. Cavarretta, G.; Gianelli, G.; Puxeddu, M. Hydrothermal metamorphism in the Larderello geothermal field. Geothermics 1980, 9, 297–314. [Google Scholar] [CrossRef]
  19. Orlandi, P.; Cortecci, G.; Protano, G.; Riccobono, F. Mineral assemblages, stable isotopes and fluid inclusions in ore veins from the Macigno Formation at Calafuria (Livorno Mountains, northern Tuscany, Italy). Period. Mineral. 2006, 75, 73–84. [Google Scholar]
  20. Boschi, C.; Dini, A.; Dallai, L.; Ruggieri, G.; Gianelli, G. Enhanced CO2-mineral sequestration by cyclic hydraulic fracturing and Si-rich fluid infiltration into serpentinites at Malentrata (Tuscany, Italy). Chem. Geol. 2009, 265, 209–226. [Google Scholar] [CrossRef]
  21. Folk, R.L.; Pittman, J.S. Length-slow Chalcedony: A New Testament for Vanished Evaporites. J. Sediment. Petrol. 1971, 41, 1045–1058. [Google Scholar]
  22. Pirajno, F. Subaerial hot springs and near-surface hydrothermal mineral systems past and present, and possible extraterrestrial analogues. Geosci. Front. 2020, 11, 1549–1569. [Google Scholar] [CrossRef]
  23. Preusser, F.; Chithambo, M.L.; Götte, T.; Martini, M.; Ramseyer, K.; Sendezera, E.J.; Susino, G.; Wintle, A.G. Quartz as a natural luminescence dosimeter. Earth-Sci. Rev. 2009, 97, 184–214. [Google Scholar] [CrossRef]
  24. Lueth, V.W.; Goodell, P.C. Fluid Inclusion Analysis and Manganese-Iron Oxide Mineralogy of Quartz-Chalcedony Geodes from the Parana Basalts, Rio Grande do Sul, Brazil. In Proceedings of the Symposium on Agate and Cryptocrystalline Quartz, Golden, CO, USA, 10–13 September 2005; pp. 53–59. [Google Scholar]
  25. Jourdan, A.-L.; Vennemann, T.W.; Mullis, J.; Ramseyer, K. Oxygen isotope sector zoning in natural hydrothermal quartz. Miner. Mag. 2009, 73, 615–632. [Google Scholar] [CrossRef]
  26. Bertini, G.; Casini, M.; Gianelli, G.; Pandeli, E. Geological structure of a long-living geothermal system, Larderello, Italy. Terra Nova 2006, 18, 163–169. [Google Scholar] [CrossRef]
  27. Feigl, F.J.; Fowler, W.B.; Yip, K.L. Oxygen vacancy model for E’1 center in SiO2. Solid State Commun. 1974, 14, 225–229. [Google Scholar] [CrossRef]
  28. Götze, J.; Plötze, M.; Habermann, D. Origin, spectral characteristics and practical applications of the cathodoluminescence (CL) of quartz—A review. Miner. Pet. 2001, 71, 225–250. [Google Scholar] [CrossRef]
  29. Trukhin, A. Luminescence of natural α-quartz crystal with aluminum, alkali and noble ions impurities. J. Lumin. 2019, 214, 116602. [Google Scholar] [CrossRef]
  30. Hashimoto, T. An Overview of Red-Thermoluminescence (RTL) Studies on Heated Quartz and RTL Application to Dosimetry and Dating. Geochronometria 2008, 30, 9–16. [Google Scholar] [CrossRef] [Green Version]
  31. Skuja, L.; Kajihara, K.; Grube, J.; Hosono, H. Luminescence of non-bridging oxygen hole centers in crystalline SiO2. In Proceedings of the Fundamentals and Applications in Silica and Advanced Dielectrics (SIO2014): X International Symposium on SiO2, Advanced Dielectrics and Related Devices; AIP Publishing: College Park, MD, USA, 2014; Volume 1624, pp. 130–134. [Google Scholar]
  32. Trukhin, A.N.; Truhins, K. Luminescence of α-quartz. arXiv 2012, arXiv:1209.4200. Available online: https://arxiv.org/abs/1209.4200 (accessed on 13 September 2021).
  33. Martini, M.; Fasoli, M.; Villa, I.; Guibert, P. Radioluminescence of synthetic and natural quartz. Radiat. Meas. 2012, 47, 846–850. [Google Scholar] [CrossRef]
  34. Sanjurjo-Sánchez, J. An Overview of the Use of Absolute Dating Techniques in Ancient Construction Materials. Geosciences 2016, 6, 22. [Google Scholar] [CrossRef] [Green Version]
  35. Pecci, A.; Grassi, F.; Salvini, L.; Giorgi, G. Cooking activities in a building yard during the Middle Age. Organic residues in potsherds recovered from the Carmine Convent in Siena. In Proceedings of the 34th Symposium on Archaeometry, Zaragoza, Spain, 3–7 May 2004; pp. 583–588. [Google Scholar]
  36. Urbanová, P.; Michel, A.; Cantin, N.; Guibert, P.; Lanos, P.; Dufresne, P.; Garnier, L. A novel interdisciplinary approach for building archaeology: The integration of mortar “single grain” luminescence dating into archaeological research, the example of Saint Seurin Basilica, Bordeaux. J. Archaeol. Sci. Rep. 2018, 20, 307–323. [Google Scholar] [CrossRef]
  37. Götze, J.; Plötze, M.; Fuchs, H.; Habermann, D. Defect structure and luminescence behaviour of agate—Results of electron paramagnetic resonance (EPR) and cathodoluminescence (CL) studies. Miner. Mag. 1999, 63, 149–163. [Google Scholar] [CrossRef]
  38. Song, J.; Jonsson, H.; Corrales, L. Self-trapped excitons in quartz. Nucl. Instrum. Methods Phys. Res. Sect. B Beam Interact. Mater. Atoms 2000, 166–167, 451–458. [Google Scholar] [CrossRef] [Green Version]
  39. Fisher, A.; Hayes, W.; Stoneham, A.M. Theory of the structure of the self-trapped exciton in quartz. J. Phys. Condens. Matter 1990, 2, 6707–6720. [Google Scholar] [CrossRef]
  40. Trukhin, A.N. Luminescence of silicon dioxide different polymorph modification: Silica glass, α-quartz, stishovite, coesite. In AIP Conference Proceedings; American Institute of Physics: College Park, MD, USA, 2014; Volume 1624, pp. 167–173. [Google Scholar]
  41. Cannas, M.; Agnello, S.; Gelardi, F.M.; Boscaino, R.; Trukhin, A.N.; Liblik, P.; Lushchik, C.; Kink, M.F.; Maksimov, Y.; Kink, R.A. Luminescence of γ-radiation-induced defects in α-quartz. J. Phys. Condens. Matter 2004, 16, 7931–7939. [Google Scholar] [CrossRef]
  42. Fasoli, M.; Martini, M. The composite nature of the thermoluminescence UV emission of quartz. J. Lumin. 2016, 173, 120–126. [Google Scholar] [CrossRef]
  43. Schmidt, C.; Kreutzer, S.; DeWitt, R.; Fuchs, M. Radiofluorescence of quartz: A review. Quat. Geochronol. 2015, 27, 66–77. [Google Scholar] [CrossRef]
  44. Pagonis, V.; Chithambo, M.; Chen, R.; Chruścińska, A.; Fasoli, M.; Li, S.; Martini, M.; Ramseyer, K. Thermal dependence of luminescence lifetimes and radioluminescence in quartz. J. Lumin. 2013, 145, 38–48. [Google Scholar] [CrossRef]
  45. Topaksu, M.; Yüksel, M.; Dogan, T.; Nur, N.; Akkaya, R.; Yegingil, Z.; Topak, Y. Investigation of the characteristics of thermoluminescence glow curves of natural hydrothermal quartz from Hakkari area in Turkey. Phys. B Condens. Matter 2013, 424, 27–31. [Google Scholar] [CrossRef]
  46. Topaksu, M.; Correcher, V.; Garcia-Guinea, J.; Topak, Y.; Göksu, H. Comparison of thermoluminescence (TL) and cathodoluminescence (ESEM-CL) properties between hydrothermal and metamorphic quartzes. Appl. Radiat. Isot. 2012, 70, 946–951. [Google Scholar] [CrossRef]
  47. Ngoc, T.; Van Tuyen, H.; Thi, L.A.; Hung, L.X.; Ca, N.X.; Thanh, L.D.; Van Do, P.; Son, N.M.; Thanh, N.T.; Quang, V.X. The role of sodium ions in the thermoluminescence peaks of laboratory-irradiated natural quartz. Radiat. Meas. 2021, 141, 106539. [Google Scholar] [CrossRef]
  48. Toffolo, M.B.; Ricci, G.; Caneve, L.; Kaplan-Ashiri, I. Luminescence reveals variations in local structural order of calcium carbonate polymorphs formed by different mechanisms. Sci. Rep. 2019, 9, 16170. [Google Scholar] [CrossRef]
  49. Fantoni, R.; Caneve, L.; Colao, F.; Fiorani, L.; Palucci, A.; Dell’Erba, R.; Fassina, V. Laser-induced fluorescence study of medieval frescoes by Giusto de’ Menabuoi. J. Cult. Herit. 2013, 14, S59–S65. [Google Scholar] [CrossRef] [Green Version]
  50. Ricci, G.; Caneve, L.; Pedron, D.; Holesch, N.; Zendri, E. A multi-spectroscopic study for the characterization and definition of production techniques of German ceramic sherds. Microchem. J. 2016, 126, 104–112. [Google Scholar] [CrossRef]
  51. Trukhin, A.; Kink, M.; Maksimov, Y.; Kink, R. Self-trapped exciton luminescence in crystalline α-quartz under two-photon laser excitation. Solid State Commun. 2003, 127, 655–659. [Google Scholar] [CrossRef]
  52. Martini, M.; Fasoli, M.; Villa, I. Defect studies in quartz: Composite nature of the blue and UV emissions. Nucl. Instrum. Methods Phys. Res. Sect. B Beam Interact. Mater. Atoms 2014, 327, 15–21. [Google Scholar] [CrossRef]
  53. Toffolo, M.B.; Ricci, G.; Chapoulie, R.; Caneve, L.; Kaplan-Ashiri, I. Cathodoluminescence and Laser-Induced Fluorescence of Calcium Carbonate: A Review of Screening Methods for Radiocarbon Dating of Ancient Lime Mortars. Radiocarbon 2020, 62, 545–564. [Google Scholar] [CrossRef]
  54. Turetta, C.; Barbante, C.; Capodaglio, G.; Gambaro, A.; Cescon, P. The distribution of dissolved thallium in the different water masses of the western sector of the Ross Sea (Antarctica) during the austral summer. Microchem. J. 2010, 96, 194–202. [Google Scholar] [CrossRef]
  55. Artioli, G.; Angelini, I.; Kaufmann, G.; Canovaro, C.; Sasso, G.D.; Villa, I.M. Long-distance connections in the Copper Age: New evidence from the Alpine Iceman’s copper axe. PLoS ONE 2017, 12, e0179263. [Google Scholar] [CrossRef] [Green Version]
  56. Yoshimura, J.; Kohra, K. Studies on growth defects in synthetic quartz by x-ray topography. J. Cryst. Growth 1976, 33, 311–323. [Google Scholar] [CrossRef]
  57. Larkin, J.J.; Armigton, A.F.; O’Connor, J.J.; Lipson, H.G.; Horrigan, J. Growth of quartz with high aluminium concentration. J. Cryst. Growth 1982, 60, 136–140. [Google Scholar] [CrossRef]
  58. Modreski, P.J. Fluorescence of Cryptocrystalline Quartz and Opal. In Proceedings of the Symposium on Agate and Cryptocrystalline Quartz, Golden, CO, USA, 10–13 September 2005; pp. 99–102. [Google Scholar]
  59. Reeder, R.J.; Nugent, M.; Lamble, G.M.; Tait, C.D.; Morris, D.E. Uranyl Incorporation into Calcite and Aragonite: XAFS and Luminescence Studies. Environ. Sci. Technol. 2000, 34, 638–644. [Google Scholar] [CrossRef]
  60. Smith, K.F.; Bryan, N.D.; Swinburne, A.N.; Bots, P.; Shaw, S.; Natrajan, L.S.; Mosselmans, J.F.W.; Livens, F.R.; Morris, K. U(VI) behaviour in hyperalkaline calcite systems. Geochim. Cosmochim. Acta 2015, 148, 343–359. [Google Scholar] [CrossRef]
  61. Scholefield, R.; Prescott, J. The red thermoluminescence of quartz: 3-D spectral measurements. Radiat. Meas. 1999, 30, 83–95. [Google Scholar] [CrossRef]
  62. Trukhin, A.; Haut, C.; Jacqueline, A.-S.; Poumellec, B. Microstructural and defect population change in electron beam irradiated Ge: SiO2 MCVD glasses in the conditions of refractive index change writing. J. Non. Cryst. Solids 2005, 351, 2481–2484. [Google Scholar] [CrossRef]
  63. Skuja, L.; Ollier, N.; Kajihara, K. Luminescence of non-bridging oxygen hole centers as a marker of particle irradiation of α-quartz. Radiat. Meas. 2020, 135, 106373. [Google Scholar] [CrossRef]
  64. Rink, W.; Rendell, H.; Marseglia, E.; Luff, B.; Townsend, P. Thermoluminescence spectra of igneous quartz and hydrothermal vein quartz. Phys. Chem. Miner. 1993, 20, 353–361. [Google Scholar] [CrossRef]
  65. Zimmerman, J. The radiation-induced increase of the 100 C thermoluminescence sensitivity of fired quartz. J. Phys. C Solid State Phys. 1971, 4, 3265–3276. [Google Scholar] [CrossRef]
Figure 1. (a) Italian map and the enlargement of the La Sassa and Larderello areas in Tuscany (black square). (b) Geological sketch map and (c) scheme of the tectonic setting of the Larderello geothermal area (figures modified from Bertini et al. [26]).
Minerals 11 01345 g001
Figure 2. Crystal structure of quartz showing possible defects and impurities. In the scheme are reported: oxygen vacancy, silanol groups (possible substitution of Si4+ by four H+), nonbridging oxygen, peroxy linkage and radicals, simple substitutions with Ti4+ and Ge4+, Al3+ substitutions with interstitial cations (Li+, Na+, K+) [28,30].
Minerals 11 01345 g002
Figure 3. Cathodoluminescence images (ac) obtained in different areas by OM-CL of La Sassa quartz polished section. The red-orange luminescent spots (a) and veins (b) are calcite.
Minerals 11 01345 g003
Figure 4. Representative LIF spectra of La Sassa quartz. The asterisk (*) mark in the spectra indicates the second harmonic at 532 nm of the laser (λexc = 266 nm). (a,b) La Sassa quartz spectrum and its peak fitting; (c) comparison between LIF spectrum of Q_LS and Q_oil characterized by visible oil inclusion (d); (e) LIF spectrum of the calcite where the La Sassa quartz growth as veins; (f) comparison of the Q_LS spectrum with uranyl characteristic spectrum obtained by the authors analysing a different kind of calcite, as reported in the literature [48].
Minerals 11 01345 g004
Figure 5. Raman spectra recorded in different points of La Sassa quartz (Q_LS_01-02) compared with a quartz reference Raman spectrum (OMNIC Picta™ reference spectral library).
Minerals 11 01345 g005
Figure 6. RL spectra of Q_LS under X-ray irradiation. Each spectrum corresponds to the total emitted light every 30 s (6 Gy per spectrum). The colour scale goes from red (first spectra), to green, to blue (last spectra).
Minerals 11 01345 g006
Figure 7. WR-TL experiment on Q_LS. (a) The glow curve obtained integrating the data between 550 nm and 650 nm, showing a single TL peak at around 90 °C. The intensity observer at the higher temperatures is from the black body radiation of the heater. (b) The emission spectra obtained by integrating the data between 60 °C and 125 °C, showing a single dominant emission at around 620 nm.
Minerals 11 01345 g007
Table 1. Trace element concentrations of La Sassa quartz obtained by ICP-MS.
ContentAlFeLiNaMoKMnTiSrAsZnBaZr
ppm248.99142.2579.4571.0042.9825.2623.5120.9019.895.293.361.751.29
CrBeVCoNiCuRbCsTlPbBiTh
0.10–1.00 ppm0.960.860.420.370.270.310.270.570.560.110.050.55
AgCdBiUREEs
Tb, Eu, Dy, Sm, Ce, etc.LaCe
<0.10 ppm0.040.010.050.01u.d.l. *0.020.04
* u.d.l: under detection limit.
Publisher’s Note: MDPI stays neutral with regard to jurisdictional claims in published maps and institutional affiliations.

