
Mineral Neutralizers as a Tool for Improving the Properties of Soil Contaminated with Copper


Department of Agricultural and Environmental Chemistry, University of Warmia and Mazury in Olsztyn, Łódzki 4 Sq., 10-721 Olsztyn, Poland
*
Author to whom correspondence should be addressed.
Minerals 2022, 12(7), 895; https://0-doi-org.brum.beds.ac.uk/10.3390/min12070895
Submission received: 14 June 2022
/
Revised: 13 July 2022
/
Accepted: 15 July 2022
/
Published: 17 July 2022
(This article belongs to the Special Issue Bio-Geochemistry of Heavy Metals/Metalloids)
Abstract
:In phytoremediation processes implemented in highly contaminated areas, there is a high risk of contaminant toxicity during the germination of freshly sown plants. In such conditions, it is recommended to support phytoremediation by using neutralizing additives. The present study aimed at assessing the effect of the addition of mineral neutralizers (MNs), i.e., limestone, clay, and zeolite, to soil contaminated with copper (0, 200, 400, 600 mg kg−1). Basic soil indicators were analyzed, such as pH, hydrolytic acidity (HAC), total exchangeable bases (TEB), cation exchange capacity (CEC), base saturation (BS), electrolytical conductivity (EC), total organic carbon (TOC), total nitrogen (Ntot), carbon to nitrogen ratio (C:N),, and interactions of soil micronutrients, such as Cu, Zn, Cd, Cr, Ni, Pb, Mn, and Fe with MNs. Copper contamination significantly decreased the soil pH and increased its HAC. A decrease in the share of TEB was found, which resulted in a decrease in the CEC and in BS of the soil. Among the additives, limestone had the most beneficial effect on reducing soil acidity, contributing to a significant increase in TEB, CEC, and BS. The least favorable effect was shown for clay, which generally caused the deterioration of soil properties. The MNs significantly increased the content of Zn, Cr, and Fe and lowered the content of Ni in the soil compared to the control. The demonstrated interactions indicate the diversified activity of MNs at different levels of soil contamination with copper.
1. Introduction
Dangerous anthropogenic activity related to the development of civilization intensifies the migration of heavy metals to the environment, causing unfavorable changes in the physicochemical and biological properties of soils, which constrains the development of plants or even causes their death [1,2,3,4]. These transformations occur mainly due to the deposition of heavy metals resulting from the emission of metal-bearing dust [5], liquid or solid pollutants generated from industrial infrastructure [6], and the use of agricultural fertilizers and plant protection products [7]. Another important source of metals in the environment is motor traffic and transport on highways and expressways [8,9,10]. Each heavy metal or metalloid is treated as an impurity if it occurs in the environment in concentrations that pose a risk to the development of living organisms, i.e., humans, animals, and plants [11]. Many reports confirm the unquestionably negative impact of the above pollutants on higher plants and microorganisms, i.e., soil microflora and microfauna [12,13,14,15]. Soil contamination with heavy metals very often occurs locally and mainly concerns high concentrations close to industrial and metallurgical plants [5,16]. Unfortunately, there are regions in Europe and in the world where emissions from these sources have polluted significant areas. According to Kabata-Pendias [17], the average copper content in the world’s soils is about 38.9 mg Cu kg−1 DM. In Poland, increased concentrations of copper occur near metallurgical plants. An example is Głogów Copper Smelter, where, depending on the depth of sampling, the content ranged from 2163 to 3230 mg Cu kg−1 [18]. In the world, the content of this metal in the soils of polluted areas is as high as 510–9700 mg Cu kg−1 (Sudbury, ON, Canada), 1400–3700 mg Cu kg−1 DM (Coniston, ON, Canada), and 11,600–14,200 mg Cu kg−1 (Lubumbashi, DR-Congo) [19]. Copper contamination of soil can also be the result of unprofessional and incorrect use of pesticides [20,21,22]. An example can be the application of the Bordeaux mixture, i.e., a copper-based fungicide used in many countries of the world until the 19th century [20,23]. This preparation was widely used in grapevine cultivation, which resulted in high accumulation of copper in the soils of vineyards of Western Europe and the Mediterranean Sea Basin [24]. The maximum levels of copper in the vineyards in France, Brazil, Croatia, and Spain have reached 1030, 3216, 700, and 603 mg Cu kg−1, respectively [23]. Copper fungicides have also been used to protect other crops, such as olives. The Cu content in the soil of the olive orchard in Aetoliko, Greece, has been shown to range from 77 to 647 mg Cu kg−1 [25]. The content of copper in soils under a 16-year-old cocoa plantation was 993 mg Cu kg−1, which was 50 times higher than in soils under other crops [24]. Copper preparations were also used to control fungi in apple orchards. According to Li et al. [26], the copper level in the British apple orchard soils reached 1500 mg Cu kg−1. Copper as a contaminant is an inorganic, non-biodegradable substance. Cu in soil can be in the form of soluble salts, chelated, or bound to soil minerals. It can also be absorbed by the organic fraction of the soil. Obviously, Cu can undergo biological sorption, i.e., it can be uptaken by microorganisms or higher organisms, but it can also be precipitated to insoluble mineral compounds [27]. The persistence of these forms depends on many factors, such as the soil reaction, amount and type of minerals, redox potential, sorption capacity, and organic matter content [28,29,30]. There are methods to reduce quantities of harmful heavy metals by adding neutralizing materials to the soil, which are to bind metals into insoluble compounds or organic-mineral complexes [31,32,33]. Metal-mineral or metal-organic forms, under appropriate conditions, can be trapped in a safe form in the soil for a long time [27]. The best-known substances that can be used for this purpose are, according to various authors, zeolites [3,5,28,34,35,36], bentonite [3,35,36], limestone [5,28,34] and clay minerals [5,34]. Very often, organic materials such as composts [31,34,35], and organic products such as biochar [37,38] and humic acids are also taken into account [37,39,40]. Until now, methods for the immobilization of metals in contaminated soils have focused mainly on available forms, which have a major impact on the restoration of biological life and the introduction of plants to degraded areas. However, high concentrations of heavy metals may contribute to very low efficiency of phytotechnological installations due to high concentrations of contaminants, which are particularly dangerous for germinating seeds, newly sown plants, or young seedlings used in phytoremediation [27]. The applied additives in the form of mineral neutralizers (MNs) may contribute to the mitigation of the toxic effect of metals on young plants, especially in the initial stage of the phytoremediation process, by directly affecting soil properties. Such parameters as soil reaction (pH), the content of soil organic matter (SOM), and the content of clay minerals affect the mobility of metals in the soil [9,28,32,41,42,43,44]. The application of mineral neutralizers, often in combination with organic amendments, depending on the type of metal, may bring satisfactory results or lead to increased toxicity, which may cause problems in phytoremediation processes [42].
In the light of the above findings, it was hypothesized that MNs used in sites contaminated with copper contribute to the improvement of soil properties by blocking Cu as a harmful factor. The use of MNs, apart from binding Cu in safe forms, also contributes to beneficial changes in the soil indicators important for plant growth and development.
The present research aimed to evaluate selected MNs used as a tool to improve the properties of soils contaminated with copper. The research on the physical and chemical properties of soil was carried out after harvesting the test plant, which was black mustard (Brassica nigra L. Koch).
2. Materials and Methods
2.1. Experimental Design
The research was based on an experiment carried out in a greenhouse at the University of Warmia and Mazury in Olsztyn (north-eastern Poland). Brown soil, a Cambisol [45], used in the experiment was taken from the Ap horizon, from a field of the Tomaszkowo Experimental Station, which belongs to the University of Warmia and Mazury and lies near Olsztyn (53°42′35″ N, 20°26′01″ E). The soil texture (according to the USDA) was classified as loamy sand [46] with the particle size distribution composed of 75.1% sand, 24.3% silt, and 0.6% clay. The basic properties of the soil were: reaction (pH) measured in deionized H2O and 1M KCl 7.07 and 6.44, respectively; hydrolytic acidity (HAC) 2.46 cmol kg−1; total exchangeable bases (TEB) 6.57 cmol kg−1; cation exchange capacity (CEC) 9.03 cmol kg−1; base saturation (BS) 72.75%; electrolytical conductivity (EC) 0.89 µS cm−1; total nitrogen (Ntot) 0.58 g kg−1; total organic carbon (TOC) 4.79 g kg−1; C/N ratio 4.79 and Cu content 18.21 mg kg−1.
The experiment was set up according to the randomized block method, in polyethylene pots filled with 8 kg of soil passed through a sieve with a mesh diameter of 1 cm. The experimental factors were (1) soil contamination with copper: 0, 200, 400, and 600 mg Cu kg−1 soil; (2) mineral neutralizers (MNs): ground limestone (98.66% CaCO3) (Polcalc, Łódź, Poland) in a dose corresponding to 1 HAC, i.e., 1.06 g CaCO3 kg soil−1, clay (GEOL-MIN, Kielce, Poland) (clay < 0.002 mm 85.2%, loam 0.05–0.002 mm 13.6%, sand 0.05–2.0 mm 1.2%, d = 2.73 g cm−3) and natural zeolite 1.0–2.5 mm (Subio Eko, Sosnowiec, Poland). Cu stock solution (100 mg Cu cm−3) was prepared by dissolving 392.9 g CuSO4∙5H2O (copper sulfate pentahydrate) in deionized water to the volume of the solution up to 1000 cm3. The soil in each pot was artificially enriched with Cu by adding 16, 32, and 48 cm3 of the Cu pot−1 stock solution. Each object along with the control (without enrichment) was carried out in triplicate. Limestone and zeolite were applied at a dose of 3% of the weight of the soil in a pot, i.e., 30 g kg−1 of soil. Before starting the experiment, NPK fertilization was applied: 2.17 g N—CO(NH2)2, 0.6 g P—KH2PO4, 1.25 g K—KH2PO4 (0.75 g K), and K2SO4 (0.5 g K), 0.18 g Mg—MgSO4 and 0.25 mg B—H3BO3 pot−1.
During the vegetative growth, the moisture of the soil in the pots was kept at the level of 60% of full water capacity. Black mustard (Brassica nigra L. Koch) of the local population (PPH “PIAST” Jan Kołodziej, Dębno, Poland) grown in the pots was harvested after the pods’ formation (BBCH 71-79).
2.2. Analytical Methods
Before setting up the experiment, the particle size distribution of the soil and clay used in the trials was determined with a Mastersizer 3000 (Malvern Instruments Ltd., Worcestershire, UK). The remaining properties of the soil, both before launching the experiment and after its termination, were determined with the same methods. After sieving through a sieve with a mesh diameter of 2 mm, the soil pH, HAC, TEB, CEC, BS, salinity, Ntot, TOC, C:N ratio, and total copper content (Cu) were determined. Soil analyses were performed using the following methods. Soil pH potentiometrically in deionized water and in 1 M KCl solution in the ratio of 1:2.5 (w/v), using a pH SenTix61 electrode and pH 538 WTW potentiometer (WTW, Wrocław, Poland). EC was determined with a portable multi-range conductivity meter HI-8733 (Hanna Instruments, Leighton Buzzard, United Kingdom) in a mixture of soil/deionized water in the 1:2 ratio (w/v). HAC and TEB were determined with the Kappen’s method [47] and the obtained values were used to calculate CEC (1) and BS (2) according to the following formulas:
The content of Ntot was determined by the Kjeldahl method [47]. Wet mineralization of the soil samples for Ntot was carried out in concentrated sulphuric acid (H2SO4 analytically pure). Next, samples were distilled in a Büchi K-355 Kjeldahl Distiller (BÜCHI Labortechnik AG, Flawil, Switzerland) and then titrated with TitroLine 7000 (Xylem Analytics, Weilheim, Germany). Total organic carbon (TOC) content was determined on a Shimadzu TOC-L analyzer (Shimadzu Corporation, Kyoto, Japan) coupled with a module SSM-5000A for solid samples. Total Cu content in the starting soil and total forms of Cu, Zn, Cd, Cr, Ni, Pb, Mn, and Fe content were determined in the samples mineralized according to the US-EPA3051 protocol in a MARS 5 microwave oven (CEM Corporation, Matthews, USA) in a mixture of acids: 65% HNO3 and 38% HCl mixed in the 4:1 ratio. The content of the metals in soil samples was determined using an atomic absorption spectrophotometer SpectrAA-240FS (Varian Inc. Mulgrave, VIC, Australia), with reference standards by MERCK (Darmstadt, Germany).
2.3. Experimental Data Analysis
A two-way analysis of variance at the level of significance of p ≤ 0.05, and principal component analysis (PCA) were processed using Statistica® v. 13.3 PL TIBCO Software Inc (Palo Alto, CA, USA) [48]. The correlation coefficients were established using a simple linear correlation model, with Microsoft Excel® for Microsoft 365 MSO (version 2206) [49].
3. Results
3.1. Reaction, Acidity, and Sorption Complex
The results presented in this section constitute the second part of the study, the scope of which regarding the response of the test plant black mustard (Brassica nigra L. Koch) to soil contamination with copper and the applied neutralizing additives was published in the manuscript of Żołnowski et al. [5]. The results presented in the current study focus on the shaping of the properties of the soil contaminated with copper under the conditions of the applied MNs. The results of soil analyses concern the soil samples taken for tests after harvesting the tested plant in comparison with the values of the investigated parameters in the starting soil.
The pH of the soil in the present experiment, in which black mustard was grown as a test plant, decreased from pH H2O = 7.07 (value before the experiment) to pH H2O = 6.80 (value recorded in the control object—not polluted with Cu and without the addition of MNs) (Table 1).
A similar relationship was found for the pH measured in 1M KCl solution. The value of pHKCl was 6.44 before setting the experiment, and 6.14 after harvesting the mustard plants. The increasing levels of soil contamination with copper analyzed in the experiment resulted in a gradual, significant decrease in the pH value measured both in H2O and in 1M KCl of the tested soils, on average from 7.13 to 5.96 and from 6.63 to 5.46, respectively, which was confirmed by very high, negative Pearson’s correlation coefficients (r). The applied MNs significantly increased the pH of the tested soils, where limestone acted much stronger than clay and zeolite, whose deacidification effect was similar. Analysis of the interaction between Cu pollution and MNs showed that limestone interacted significantly on all levels of soil polluted with Cu, increasing the pH value compared to that measured in the soil of the series without MNs. Zeolite and clay increased the pH H2O reaction compared to the control series only in objects not polluted with Cu. In the case of pHKCl, its value was increased by zeolite used in objects polluted with 200 and 600 mg Cu kg−1 of soil.
Hydrolytic acidity (HAC) measured in the soil slightly increased after the termination of the experiment compared to the starting soil. On average, the acidity increased by 1.11 cmol(+) kg−1 as a result of increasing soil contamination with copper (Table 2).
The HAC value was strongly positively correlated with the level of Cu contamination in each of the tested series. As in the case of pH, it was shown that limestone significantly improved the mentioned parameter. In comparison to the series without MNs, the HAC value after limestone application decreased by 1.07 cmol(+) kg−1. The remaining MNs performed favorably, but only in the non-copper polluted objects.
Total exchangeable bases (TEB) is an important parameter characterizing the soil in terms of the basic cations present (Table 2). Compared to the starting soil, after the end of the experiment, the TEB value slightly decreased by 0.4 cmol(+) kg−1 in the soil. Increasing copper pollution contributed significantly to the decrease in the average TEB value from 7.30 to 5.09 cmol(+) kg−1 on average, with no significant difference between the levels of 200 and 400 mg Cu kg−1, which in this case constituted a homogeneous group. The interactions that occurred indicated that limestone was definitively beneficial at any level of soil copper pollution. This series showed the highest value of TEB with a highly significant negative correlation coefficient (r = −0.955 **). The use of clay resulted in an unfavorable change in TEB. This value, concerning the series without MNs, decreased significantly by 1.60 cmol(+) kg−1. Zeolite did not cause a significant change in TEB compared to the series without MNs.
The capacity of the sorption complex (CEC) in the control object after the end of the experiment slightly decreased from 9.03 to 8.85 cmol(+) kg−1 (Table 2). Cu caused a significant decrease in CEC regardless of the level of pollution. Both in the case of the control series (without MNs) and the series with clay and zeolite, despite significant differences between the objects, there was no clear linearity of CEC changes depending on the level of pollution (no significant correlation between Cu and CEC). As in the case of TEB, limestone worked favorably, while clay caused a decrease in the CEC value.
In addition to CEC, an important factor is the pool of basic cations, i.e., base saturation (BS) (Table 2). The BS value in the control object compared to the starting soil slightly decreased from 72.75 to 69.75%. Cu soil pollution resulted in a significant decrease of BS from 77.13% to 60.46, while the levels of 400 and 600 mg Cu kg−1 did not differ significantly in this respect. The series with the addition of limestone was characterized by the most favorable BS. As in the case of CEC, zeolite did not cause a significant change, while clay drastically decreased BS value from 65.65% in objects without MNs to 54.65% in objects with clay addition.
Electrolytic conductivity (EC) in the starting soil was 0.89 μS cm−1 and it increased to 0.94 μS cm−1 during the growing season (Table 2). In all experimental series, a significant, highly positively correlated increase of EC was observed under the influence of increasing soil pollution with Cu. It should be noticed that the MNs used also significantly increased the EC value compared to the control series—without MNs. In this respect, zeolite produced a weaker effect than limestone and clay.
3.2. Total Organic Carbon, Total Nitrogen Content, and C/N Ratio
After the end of the experiment, the content of organic carbon (TOC) in the soil slightly increased by 0.26 g kg−1 of the soil compared to the starting soil (Table 3). It was shown that the copper content in soil generally did not affect this parameter, but the exception was the series with the addition of zeolite, where a significant linear decrease in TOC was demonstrated, confirmed by a high, negative correlation coefficient (r = −0.919**). Comparing the effect of MNs on the average TOC content in the series tested, no significant effect of these additives was demonstrated.
The content of N total (Ntot) was on average at the level of 0.56 g kg−1 of soil, and compared to the starting soil in the control, a decrease in the content of Ntot was shown after the end of the experiment, which was 0.08 g Ntot kg−1 of soil (Table 3). Soil contamination with Cu resulted in an increase in Ntot content by an average of 0.05 g Ntot kg−1 of soil, and it should be noted that the highest content of Ntot was found in the series with clay addition, while limestone and zeolite did not modify the Ntot content significantly.
A very important factor characterizing the soil in terms of humus abundance and susceptibility to soil degradation is the C/N ratio (Table 3). During the experiment, this parameter increased in the control object from 8.26 to 8.69. As the levels of soil pollution with Cu increased, the copper content did not significantly modify this coefficient, but it should be noted that there was a clear interaction between Cu and zeolite. In this series, there was a linear decrease in the TOC from 10.64 to 8.05, confirmed by a high negative correlation coefficient (r = −0.836 **).
3.3. Cu, Zn, Cr, Ni, Pb, Mn, and Fe Content
The Cu content in the soil, because of the plant development and copper uptake by the root system during the plant growing season, dropped from 18.21 mg kg−1 in the starting soil to 12.21 mg kg−1 in the soil from the control object—not contaminated with copper and without the addition of MNs (Table 4).
The average Cu content in polluted objects was in line with the pollution level, which is confirmed by high correlation coefficients. Among the applied MNs, the highest decrease in total copper content was caused by clay, followed by a lesser decrease induced by limestone. Zeolite did not cause significant changes in the Cu content. The beneficial effect of limestone was demonstrated at the highest level of contamination of 600 mg kg−1 of the soil, where the Cu content decreased from 553.25 to 482.92 mg kg−1 of soil.
The chemical analysis of soil samples showed that the level of soil pollution with copper and the applied MNs had different effects on the content of other trace elements (Table 4). Zn content was significantly dependent on the Cu pollution only in the control series (without MNs). Higher levels of Cu soil pollution were characterized by a higher Zn content in the soil. On the other hand, this relationship was not found in the series where MNs were introduced. The limestone, clay, and zeolite objects showed a higher content of Zn than the objects without MNs. The cadmium content also depended on the additives used. It was shown that the Cd content remained higher in the heavily contaminated with Cu objects of the control series than in the objects with low Cu pollution. The addition of zeolite reversed this relationship, causing a decrease in the Cd content in the 400 and 600 mg Cu kg−1 objects to 0.23 and 0.26 mg Cd kg−1, respectively, compared to the non-polluted Cu objects. Limestone and clay did not significantly modify the Cd content. The content of Cr and Ni was not significantly modified under the influence of increasing copper pollution. However, after plant harvesting, significantly more Cr remaining in the soil was found in the objects with the addition of limestone and clay than with zeolite. The use of clay and zeolite contributed to the reduction of the Ni content compared to the content found in the control object. Limestone did not cause any significant changes to the Ni content. The applied levels of copper pollution and MNs addition did not significantly affect the Pb and Mn levels in the soil after harvesting the test plant (Table 5).
Despite significant differences between the objects contaminated with Cu, no significant correlation was found between the level of soil Cu pollution and the content of Fe in the soil (Table 5). The addition of limestone and clay resulted in a significantly higher Fe content in the soil. Zeolite did not change the iron content in the soil significantly.
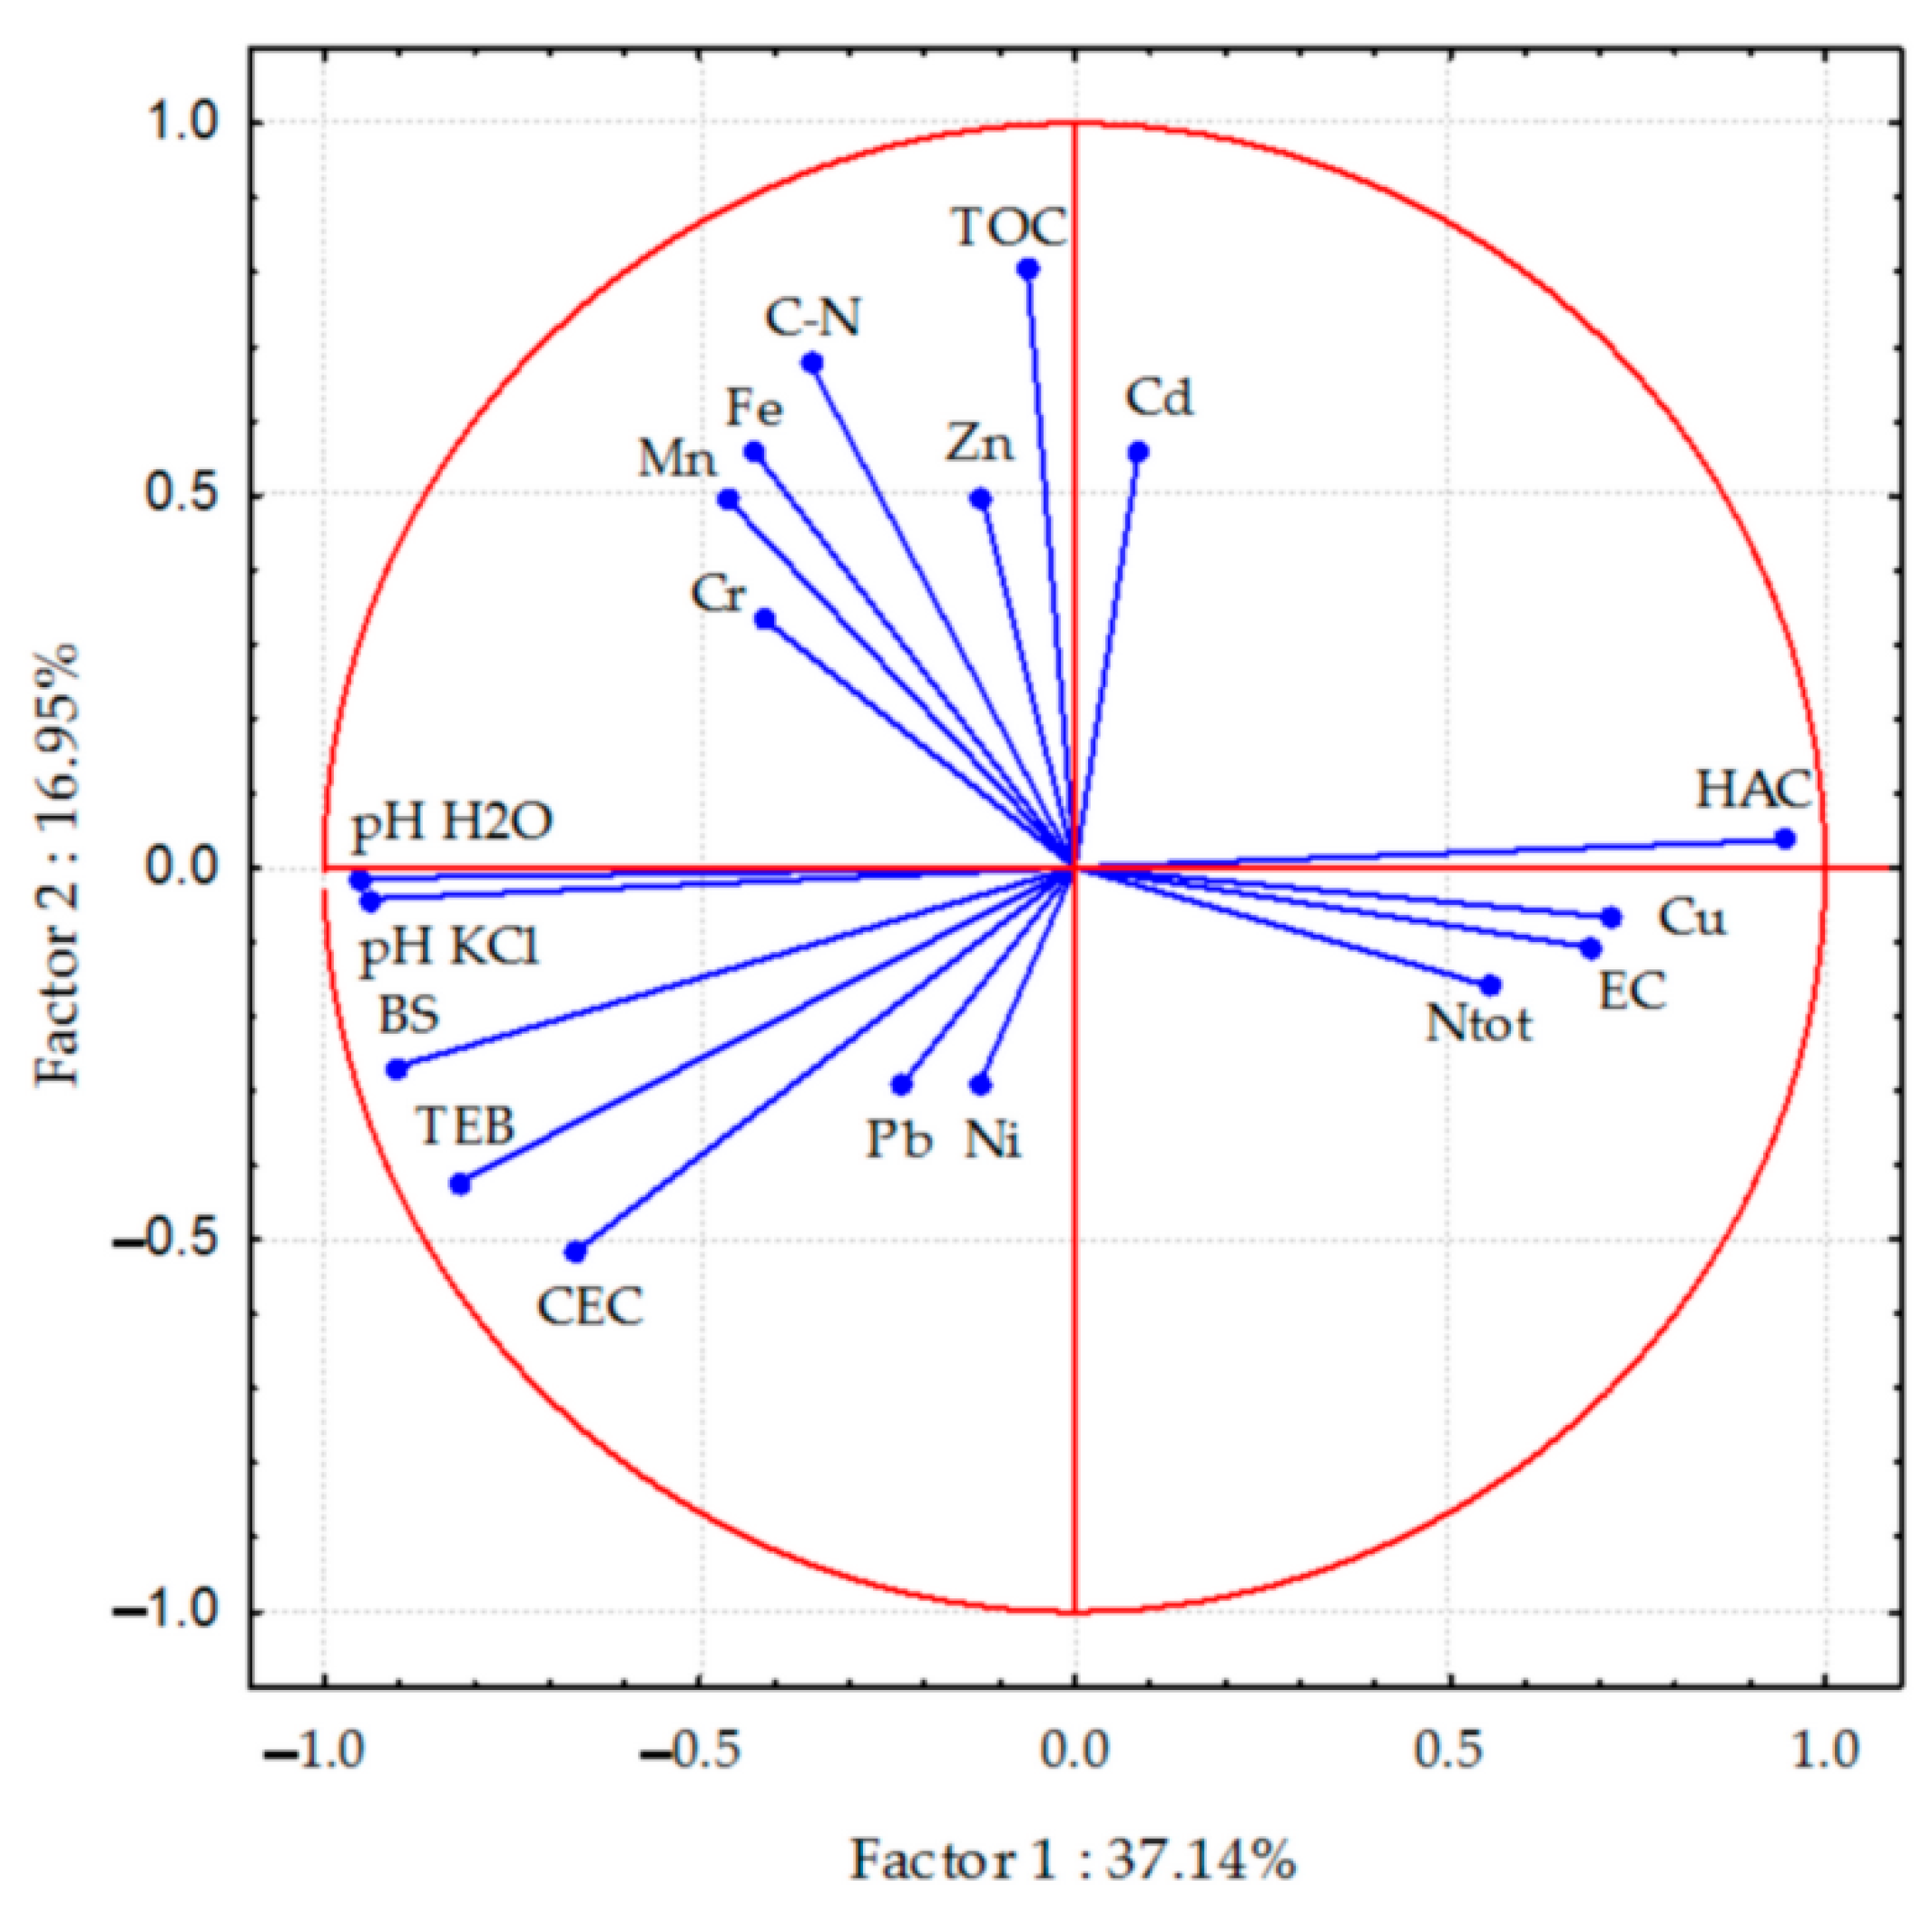
The PCA analysis (Figure 1) shows the cumulative effect of both soil contamination with copper and the application of MNs on the tested soil properties. The total correlation of the dataset of most analyzed soil properties was 37.14%, and for the CEC, TOC, C:N ratio, Mn, Zn, Cd, and Fe—16.95%. The longest vectors were noted for pH, TEB, BS, and HAC, and they had the greatest contribution to the variability. The importance of the other properties was smaller. The vector distribution shows strong positive correlations pH in H2O vs. pH in KCl; BS vs. TEB; BS and TEB vs. pHH2O and pHKCl; pHKCl and pHH2O vs. CEC, and weaker positive correlations between TOC vs. C:N ratio; Fe vs. Mn, EC vs. Cu. Strong negative relationships were also observed in the case of HAC vs. pH, TEB, and BS; pH vs. Cu; and Ntot vs. C:N ratio. Correlation analysis (Table 6) showed highly significant relationships also between the content of Cu and BS and significant ones between Cu and TEB.
4. Discussion
Polluted agricultural areas are becoming a growing problem for food producers due to past mismanagement. In recent years, more stringent requirements relating to high-quality health agricultural products, regulated by national [50] and international [51] standards, have resulted in the exclusion of some farmland from cultivation. The area of polluted sites in the European Union, the remediation of which would cost 17.3 billion EUR annually, highlights the scale of the problem on the continent [24]. The permissible content of Cu in agricultural soils of the European Union countries, defined as a warning and critical limits, is respectively 50 and 140 mg Cu kg−1 [23,51]. This study takes into account the average levels of soil contamination with copper that can be found in reports on copper-polluted sites [7,9,10,11,19,20]. According to many authors, Cu is an element whose activity depends on the soil pH [3,52,53], as well as the abundance of humus [32,35]. As a rule, its toxicity is higher in acidic than in alkaline soils [7,32,44,54]. The results obtained indicate that the applied MNs significantly influenced the soil pH measured in both H2O and 1M KCl, which was also observed in the case of HAC. Among the MNs used, lime had the greatest effect on increasing the pH, which was affected to a lesser extent by clay and zeolite. Carbonates and clay minerals, apart from changes in the reaction, are important components that bind copper into insoluble forms [17,55]. Soil analyses from the presented experiment, made after the test plant had been harvested, showed that zeolite had the highest copper binding force in the sorption complex, even though its neutralizing power was lower than that of limestone. In the series with zeolite, after the end of the experiment, the soil retained on average 274.32 mg Cu kg−1 of soil, which is 6.37 mg Cu kg−1 more than in the series without MNs. On the other hand, in the series with the addition of limestone, in which the highest Cu content was expected, no significant differences were found up to the level of 400 mg Cu, and even a decrease in the Cu content was noted in the combination with the highest pollution of 600 mg Cu, compared to the series without MNs. Such results suggest that the increase of pH contributed to the reduction of Cu toxicity, and this, in turn, increased the yield, which was confirmed in the studies presented earlier [5]. The mean black mustard yield in the individual series of this experiment was 57.5 in the series without MNs, 79.9—with limestone, 62.4—with clay, and 71.2 g pot−1—with zeolite, at the LSD value for MNs = 9.6 g pot−1. The MNs used had a different effect on copper. In the case of limestone, the Cu toxicity was reduced by increasing the pH reaction, which resulted in an improvement of the growth conditions of the test plant and an increase in its yield, as a result of which the Cu uptake from the soil was increased. On the other hand, zeolite was also shown to have a beneficial effect, binding Cu in micropores of its structure. Consequently, zeolite also resulted in a higher yield of the plant compared to the series without MNs. The former type of interaction could be considered in remediation techniques of polluted sites as an element accelerating phytoextraction, while the latter one, equally important, can be used to strengthen Cu stabilization in an aided phytostabilization technique [27,32]. The beneficial effect of zeolite consisting in a significant reduction in the mobility of copper in soil was also reported by Wyszkowski [3], Janoš et al. [56], and Zorpas et al. [57].
The above beneficial effects of lime and other minerals determining the soil sorption complex result in a reduction of available forms of Cu and other trace metals. In the presented experiment, the Cu content in the soil was correlated with the other parameters characterizing the soil sorption complex. Correlation analysis and PCA analysis showed significant relationships also between the content of Cu and BS and TEB. The significant relationships between Cu and BS as well as CEC are confirmed by Wyszkowski’s research [3]. However, no significant correlations with TOC, Ntot, C:N, and other trace elements were found, although, according to many authors, Cu is bound especially by organic matter and living organisms [32,58]. The content of organic matter, i.e., humic and fulvic acids, which are also more or less responsible for the sorption complex, is important in the adsorption of Cu and other trace metals [3,55,59,60].
The applied NMs, apart from changes in the sorption complex, also contributed to significant changes in the content of trace metals other than copper. Limestone significantly increased the content of Zn, Cr, and Fe, clay Zn, Cr, Fe, and zeolite Zn. It was not demonstrated that the applied MNs had a significant effect on the content of Cd, Pb, and Mn in the soils concerning the control series. On the other hand, all the MNs used reduced the nickel content. The increase in the content of the trace elements mentioned resulted from the chemical composition of the minerals used, while the decrease in the Ni content could result from the increased Ni uptake by plants owing to the favorable changes in soil chemistry. The presented dependencies suggest that apart from the expected effects related to the processes of Cu immobilization in soils of contaminated areas, it is also necessary to consider the possible effects of blocking other trace elements, deficiencies of which may be unfavorable for plants.
5. Conclusions
The presented results clearly show that the soil contamination with copper and the applied NMs in the form of limestone, clay, and zeolite had a significant impact on the content of Cu and other trace metals in the soil. In the control series objects, without NMs, a linear increase in the Cu content in the soil was observed. It was noted that the increasing level of pollution with Cu did not shape the levels of the remaining trace elements in the soil in any way. The MNs applied affected the content of Cu and other analyzed trace metals by modifying the soil reaction and other parameters of the sorption soil complex, such as HAC, TEB, and BS. It was not shown that the content of TOC was significantly dependent on the addition of limestone and clay, but this relationship was visible after the use of zeolite, which was reflected in the C:N ratio. Only clay had a significant effect on the content of Ntot under the conditions of soil contamination with Cu. NMs generally increased the content of Zn, Cr, and Fe in the soil, except for zeolite, which only increased the content of Zn and reduced the level of Ni. Thus, the MNs introduced to the soil did not only affect the contaminating Cu, but also led to the disadvantageous blocking of the remaining, essential trace elements. In this case, use of MNs should be accompanied by additional supplementation after a detailed chemical soil analysis. Among the additives used, lime and zeolite had a beneficial effect on shaping the conditions for phytoremediation. Clay turned out to be the most neutral in this respect.
Author Contributions
Conceptualization, A.C.Ż.; methodology, A.C.Ż.; software, A.C.Ż., M.W.; validation, A.C.Ż., M.W.; formal analysis, A.C.Ż.; investigation, A.C.Ż.; resources, M.W.; data curation, A.C.Ż.; writing—original draft preparation, A.C.Ż.; writing—review and editing, M.W.; visualization, A.C.Ż., M.W.; supervision, A.C.Ż., M.W.; project administration, M.W.; funding acquisition, M.W. All authors have read and agreed to the published version of the manuscript.
Funding
The results presented in this paper were obtained as part of a comprehensive study financed by the University of Warmia and Mazury in Olsztyn, Faculty of Environmental Management and Agriculture, Department of Environmental Chemistry (grant No. 20.610.003-110).
Institutional Review Board Statement
Not applicable.
Informed Consent Statement
Not applicable.
Data Availability Statement
Data are available by contacting the authors.
Acknowledgments
We acknowledge the Staff of the Department of Agricultural and Environmental Chemistry of UWM Olsztyn for their assistance in conducting the experimental work in the vegetation hall and for sample preparation for lab analysis.
Conflicts of Interest
The authors declare no conflict of interest.
References
- Hercer, M.; Wyszkowski, M.; Modrzewska, B. Impact of Traffic on the Content of Trace Elements in Soils along State Road 53 (Poland). Fresenius Environ. Bull. 2016, 25, 719–731. [Google Scholar]
- Plyatsuk, L.D.; Chernysh, Y.Y.; Ablieieva, I.Y.; Yakhnenko, O.M.; Bataltsev, E.V.; Balintova, M.; Hurets, L.L. Remediation of Soil Contaminated with Heavy Metals. J. Eng. Sci. 2019, 6, h1–h8. [Google Scholar] [CrossRef] [Green Version]
- Wyszkowski, M. Soil Contamination with Copper and Its Effect on Selected Soil Properties after Applying Neutralizing Substances. Polish J. Environ. Stud. 2019, 28, 2465–2471. [Google Scholar] [CrossRef]
- Bowszys, T.; Wierzbowska, J.; Bowszys, J. Content and Removal of Cu and Zn with Harvested Crops Grown on Soil Fertilized with Composted Municipal Sewage Sludge. J. Elem. 2009, 14, 23–32. [Google Scholar] [CrossRef]
- Żołnowski, A.C.; Wyszkowski, M.; Rolka, E.; Sawicka, M. Mineral Materials as a Neutralizing Agent Used on Soil Contaminated with Copper. Materials 2021, 14, 6830. [Google Scholar] [CrossRef]
- Pidlisnyuk, V.; Shapoval, P.; Zgorelec, Ž.; Stefanovska, T.; Zhukov, O. Multiyear Phytoremediation and Dynamic of Foliar Metal(Loid)s Concentration during Application of Miscanthus × Giganteus Greef et Deu to Polluted Soil from Bakar, Croatia. Environ. Sci. Pollut. Res. 2020, 27, 31446–31457. [Google Scholar] [CrossRef]
- Alengebawy, A.; Abdelkhalek, S.T.; Qureshi, S.R.; Wang, M.Q. Heavy Metals and Pesticides Toxicity in Agricultural Soil and Plants: Ecological Risks and Human Health Implications. Toxics 2021, 9, 42. [Google Scholar] [CrossRef]
- Rolka, E.; Żołnowski, A.C.; Sadowska, M. Assessment of Heavy Metal Content in Soils Adjacent to the Dk16-Route in Olsztyn (North-Eastern Poland). Polish J. Environ. Stud. 2020, 29, 4303–4311. [Google Scholar] [CrossRef]
- Wang, M.; Zhang, H. Accumulation of Heavy Metals in Roadside Soil in Urban Area and the Related Impacting Factors. Int. J. Environ. Res. Public Health 2018, 15, 1064. [Google Scholar] [CrossRef] [Green Version]
- Rolka, E.; Żołnowski, A.C.; Kozłowska, K.A. Assessment of the Content of Trace Elements in Soils and Roadside Vegetation in the Vicinity of Some Gasoline Stations in Olsztyn (Poland). J. Elem. 2020, 25, 549–563. [Google Scholar] [CrossRef]
- Panagos, P.; Van Liedekerke, M.; Yigini, Y.; Montanarella, L. Contaminated Sites in Europe: Review of the Current Situation Based on Data Collected through a European Network. J. Environ. Public Health 2013, 2013, 158764. [Google Scholar] [CrossRef] [PubMed]
- Borowik, A.; Kucharski, J.; Tomkiel, M.; Wyszkowska, J.; Baćmaga, M.; Boros-Lajszner, E. Sensitivity of Soil Enzymes to Excessive Zinc Concentrations. J. Elemntology 2012, 3, 637–648. [Google Scholar] [CrossRef]
- Szymańska-Pulikowska, A. Changes in the Content of Selected Heavy Metals in Groundwater Exposed to the Impact of a Municipal Landfill Site. J. Elem. 2012, 17, 689–702. [Google Scholar] [CrossRef]
- Wyszkowska, J.; Borowik, A.; Kucharski, M.; Kucharski, J. Applicability of Biochemical Indices to Quality Assessment of Soil Polluted with Heavy Metals. J. Elem. 2013, 18, 733–756. [Google Scholar] [CrossRef]
- Lenart, A.; Wolny-Koładka, K. The Effect of Heavy Metal Concentration and Soil pH on the Abundance of Selected Microbial Groups within Arcelormittal Poland Steelworks in Cracow. Bull. Environ. Contam. Toxicol. 2013, 90, 85–90. [Google Scholar] [CrossRef] [PubMed] [Green Version]
- Zwolak, A.; Sarzyńska, M.; Szpyrka, E.; Stawarczyk, K. Sources of Soil Pollution by Heavy Metals and Their Accumulation in Vegetables: A Review. Water. Air. Soil Pollut. 2019, 230, 164. [Google Scholar] [CrossRef] [Green Version]
- Kabata-Pendias, A. Trace Elements in Soils and Plants, 4th ed.; CRC Press: Boca Raton, FL, USA, 2010. [Google Scholar] [CrossRef]
- Kostecki, J.; Greinert, A.; Drab, M.; Wasylewicz, R.; Walczak, B. Chemical Soil Degradation n the Area of the Głogów Copper Smelter Protective Forest/Degradacja Ziemi Na Terenach Byłej Strefy Ochronnej Huty Miedzi Głogów. Civ. Environ. Eng. Rep. 2015, 17, 61–71. [Google Scholar] [CrossRef] [Green Version]
- Narendrula, R.; Nkongolo, K.K.; Beckett, P. Comparative Soil Metal Analyses in Sudbury (Ontario, Canada) and Lubumbashi (Katanga, DR-Congo). Bull. Environ. Contam. Toxicol. 2012, 88, 187–192. [Google Scholar] [CrossRef]
- Komárek, M.; Vaněk, A.; Chrastný, V.; Száková, J.; Kubová, K.; Drahota, P.; Balík, J. Retention of Copper Originating from Different Fungicides in Contrasting Soil Types. J. Hazard. Mater. 2009, 166, 1395–1402. [Google Scholar] [CrossRef]
- Huma Khan, N. Study of Copper Level in Soil of Selected Orchard and Non-Orchard Fields. Agric. Res. Technol. Open Access J. 2017, 9, 81–88. [Google Scholar] [CrossRef]
- Adrees, M.; Ali, S.; Rizwan, M.; Ibrahim, M.; Abbas, F.; Farid, M.; Zia-ur-Rehman, M.; Irshad, M.K.; Bharwana, S.A. The Effect of Excess Copper on Growth and Physiology of Important Food Crops: A Review. Environ. Sci. Pollut. Res. 2015, 22, 8148–8162. [Google Scholar] [CrossRef] [PubMed]
- Komárek, M.; Čadková, E.; Chrastný, V.; Bordas, F.; Bollinger, J.C. Contamination of Vineyard Soils with Fungicides: A Review of Environmental and Toxicological Aspects. Environ. Int. 2010, 36, 138–151. [Google Scholar] [CrossRef] [PubMed]
- Tóth, G.; Hermann, T.; Da Silva, M.R.; Montanarella, L. Heavy Metals in Agricultural Soils of the European Union with Implications for Food Safety. Environ. Int. 2016, 88, 299–309. [Google Scholar] [CrossRef] [PubMed]
- Avramidis, P.; Barouchas, P.; Dünwald, T.; Unkel, I.; Panagiotaras, D. The Influence of Olive Orchards Copper-Based Fungicide Use, in Soils and Sediments—The Case of Aetoliko (Etoliko) Lagoon Western Greece. Geoscience 2019, 9, 267. [Google Scholar] [CrossRef] [Green Version]
- Li, W.; Zhang, M.; Shu, H. Distribution and Fractionation of Copper in Soils of Apple Orchards. Environ. Sci. Pollut. Res. Int. 2005, 12, 168–172. [Google Scholar] [CrossRef]
- Kennen, K.; Kirkwood, N. Phyto. Principles and Resources for Site Remediation and Landscape Design; Routledge Taylor and Francis: London, UK, 2015. [Google Scholar] [CrossRef]
- Żołnowski, A.C.; Busse, M.K.; Zając, P.K. Response of Maize (Zea mays L.) to Soil Contamination with Copper Depending on Applied Contamination Neutralizing Substances. J. Elem. 2013, 18, 507–520. [Google Scholar] [CrossRef]
- van der Ent, A.; Baker, A.J.M.; Reeves, R.D.; Pollard, A.J.; Schat, H. Hyperaccumulators of Metal and Metalloid Trace Elements: Facts and Fiction. Plant Soil 2013, 362, 319–334. [Google Scholar] [CrossRef]
- Rolka, E.; Wyszkowski, M. Availability of Trace Elements in Soil with Simulated Cadmium, Lead and Zinc Pollution. Minerals 2021, 11, 879. [Google Scholar] [CrossRef]
- Nwachukwu, O.I.; Pulford, I.D. Comparative Effectiveness of Selected Adsorbant Materials as Potential Amendments for the Remediation of Lead-, Copper- and Zinc-Contaminated Soil. Soil Use Manag. 2008, 24, 199–207. [Google Scholar] [CrossRef]
- Radziemska, M.; Koda, E.; Bilgin, A.; Vaverková, M.D. Concept of Aided Phytostabilization of Contaminated Soils in Postindustrial Areas. Int. J. Environ. Res. Public Health 2018, 15, 24. [Google Scholar] [CrossRef] [Green Version]
- Wuana, R.A.; Okieimen, F.E. Heavy Metals in Contaminated Soils: A Review of Sources, Chemistry, Risks and Best Available Strategies for Remediation. ISRN Ecol. 2011, 2011, 402647. [Google Scholar] [CrossRef] [Green Version]
- Zolnowski, A.; Ciecko, Z.; Najmowicz, T. Arsenic Content in and Uptake by Plants from Arsenic-Contaminated Soil. In Application of Phytotechnologies for Cleanup of Industrial, Agricultural, and Wastewater Contamination; Kulakow, P.A., Pidlisnyuk, V.V., Eds.; Springer: Dordrecht, The Netherlands, 2010; pp. 135–145. [Google Scholar] [CrossRef]
- Wyszkowski, M.; Brodowska, M.S. Phytoextraction with Maize of Soil Contaminated with Copper after Application of Mineral and Organic Amendments. Agronomy 2020, 10, 1597. [Google Scholar] [CrossRef]
- Sądej, W.; Żołnowski, A.C.; Ciećko, Z.; Grzybowski, Ł.; Szostek, R. Evaluation of the Impact of Soil Contamination with Mercury and Application of Soil Amendments on the Yield and Chemical Composition of Avena sativa L. J. Environ. Sci. Health Part A Toxic/Hazardous Subst. Environ. Eng. 2020, 55, 82–96. [Google Scholar] [CrossRef] [PubMed]
- Park, J.H.; Lee, S.-J.; Lee, M.-E.; Chung, J.W. Comparison of Heavy Metal Immobilization in Contaminated Soils Amended with Peat Moss and Peat Moss-Derived Biochar. Environ. Sci. Process. Impacts 2016, 18, 514–520. [Google Scholar] [CrossRef]
- Radziemska, M.; Gusiatin, M.Z.; Cydzik-Kwiatkowska, A.; Blazejczyk, A.; Kumar, V.; Kintl, A.; Brtnicky, M. Effect of Biochar on Metal Distribution and Microbiome Dynamic of a Phytostabilized Metalloid-Contaminated Soil Following Freeze—Thaw Cycles. Materials 2022, 15, 3801. [Google Scholar] [CrossRef] [PubMed]
- Park, S.; Kim, K.S.; Kang, D.; Yoon, H.; Sung, K. Effects of Humic Acid on Heavy Metal Uptake by Herbaceous Plants in Soils Simultaneously Contaminated by Petroleum Hydrocarbons. Environ. Earth Sci. 2013, 68, 2375–2384. [Google Scholar] [CrossRef]
- Wu, S.; Li, R.; Peng, S.; Liu, Q.; Zhu, X. Effect of Humic Acid on Transformation of Soil Heavy Metals. In IOP Conference Series: Materials Science and Engineering; IOP Publishing: Bristol, UK, 2017; Volume 207. [Google Scholar] [CrossRef] [Green Version]
- Li, G.; Lu, N.; Wei, Y.; Zhu, D. Relationship between Heavy Metal Content in Polluted Soil and Soil Organic Matter and PH in Mining Areas. In IOP Conference Series: Materials Science and Engineering; IOP Publishing: Bristol, UK, 2018; Volume 394. [Google Scholar] [CrossRef]
- Violante, A.; Cozzolino, V.; Perelomov, L.; Caporale, A.G.; Pigna, M. Mobility and Bioavailability of Heavy Metals and Metalloids in Soil Environments. J. Soil Sci. Plant Nutr. 2010, 10, 268–292. [Google Scholar] [CrossRef] [Green Version]
- Rieuwerts, J.S.; Thornton, I.; Farago, M.E.; Ashmore, M.R. Factors Influencing Metal Bioavailability in Soils: Preliminary Investigations for the Development of a Critical Loads Approach for Metals. Chem. Speciat. Bioavailab. 1998, 10, 61–75. [Google Scholar] [CrossRef] [Green Version]
- Ali, R.M.; Hamad, H.A.; Hussein, M.M.; Malash, G.F. Potential of Using Green Adsorbent of Heavy Metal Removal from Aqueous Solutions: Adsorption Kinetics, Isotherm, Thermodynamic, Mechanism and Economic Analysis. Ecol. Eng. 2016, 91, 317–332. [Google Scholar] [CrossRef]
- FAO. World Reference Base for Soil Resources 2014. In International Soil Classification System for Naming Soils and Creating Legends for Soil Maps; FAO: Rome, Italy, 2014. [Google Scholar]
- Natural Resources Conservation Service Soils, U.S.D. of A. Soil Texture Calculator. Available online: https://www.nrcs.usda.gov/wps/portal/nrcs/detailfull/soils/research/guide/?cid=NRCS142P2_054167 (accessed on 18 August 2021).
- Ostrowska, A.; Gawliński, S.; Szczubiałka, Z. Methods of Analysis and Assessment of Soil and Plants Properties, 1st ed.; IOŚ Warszawa: Warszawa, Poland, 1991. [Google Scholar]
- Tibco. Statistica Data Analysis Software System; Tibco Software Inc.: Palo Alto, CA, USA, 2021. [Google Scholar]
- Microsoft. MS Excel® for Microsoft 365 MSO; Microsoft Corporation: Albuquerque, NM, USA, 2021. [Google Scholar]
- Minister of the Environment. Regulation of the Minister of the Environment of September 1, 2016 on the Method of Assessing Pollution of the Earth’s Surface; Journal of Laws of the Republic of Poland; Minister of the Environment: Warsaw, Poland, 2016. Available online: http://prawo.sejm.gov.pl/isap.nsf/download.xsp/WDU20160001395/O/D20161395.pdf (accessed on 15 May 2022).
- European Commission. Protection of the Environment, and in Particular of the Soil, When Sewage Sludge Is Used in Agriculture (86/278/EEC). Off. J. Eur. Communities 1986, 4, 6–12. [Google Scholar]
- Zhang, Y.; Zhang, H.; Zhang, Z.; Liu, C.; Sun, C.; Zhang, W.; Marhaba, T. PH Effect on Heavy Metal Release from a Polluted Sediment. J. Chem. 2018, 2018, 7597640. [Google Scholar] [CrossRef]
- Ali, H.; Khan, E.; Ilahi, I. Environmental Chemistry and Ecotoxicology of Hazardous Heavy Metals: Environmental Persistence, Toxicity, and Bioaccumulation. J. Chem. 2019, 2019, 6730305. [Google Scholar] [CrossRef] [Green Version]
- Vlcek, V.; Pohanka, M. Adsorption of Copper in Soil and Its Dependence on Physical and Chemical Properties. Acta Univ. Agric. Silvic. Mendel. Brun. 2018, 66, 219–224. [Google Scholar] [CrossRef] [Green Version]
- Khan, M.J.; Jones, D.L. Chemical and Organic Immobilization Treatments for Reducing Phytoavailability of Heavy Metals in Copper-Mine Tailings. J. Plant Nutr. Soil Sci. 2008, 171, 908–916. [Google Scholar] [CrossRef]
- Janoš, P.; Vávrová, J.; Herzogová, L.; Pilařová, V. Effects of Inorganic and Organic Amendments on the Mobility (Leachability) of Heavy Metals in Contaminated Soil: A Sequential Extraction Study. Geoderma 2010, 159, 335–341. [Google Scholar] [CrossRef]
- Zorpas, A.A.; Inglezakis, V.J.; Loizidou, M. Heavy Metals Fractionation before, during and after Composting of Sewage Sludge with Natural Zeolite. Waste Manag. 2008, 28, 2054–2060. [Google Scholar] [CrossRef]
- Ponizovsky, A.A.; Thakali, S.; Allen, H.E.; Di Toro, D.M.; Ackerman, A.J. Effect of Soil Properties on Copper Release in Soil Solutions at Low Moisture Content. Environ. Toxicol. Chem. 2006, 25, 671–682. [Google Scholar] [CrossRef]
- Kumpiene, J.; Lagerkvist, A.; Maurice, C. Stabilization of As, Cr, Cu, Pb and Zn in Soil Using Amendments—A Review. Waste Manag. 2008, 28, 215–225. [Google Scholar] [CrossRef]
- Gao, X.; Rodrigues, S.M.; Spielman-Sun, E.; Lopes, S.; Rodrigues, S.; Zhang, Y.; Avellan, A.; Duarte, R.M.B.O.; Duarte, A.; Casman, E.A.; et al. Effect of Soil Organic Matter, Soil PH, and Moisture Content on Solubility and Dissolution Rate of CuO NPs in Soil. Environ. Sci. Technol. 2019, 53, 4959–4967. [Google Scholar] [CrossRef]
Figure 1.
Properties of soil calculated with the PCA method. Vectors represent acidity, sorptive properties, content TOC and total-N, C:N ratio, and content of trace elements.
Figure 1.
Properties of soil calculated with the PCA method. Vectors represent acidity, sorptive properties, content TOC and total-N, C:N ratio, and content of trace elements.


Table 1.
pH of soil after black mustard (Brassica nigra L. Koch) harvest.
| Soil Pollution with Cu (mg Cu kg−1) | Without MNs | Limestone | Clay | Zeolite | Mean |
|---|---|---|---|---|---|
| Starting soil pH H2O = 7.07 pH H2O (−log10H+) | |||||
| 0 | 6.80 ± 0.07 e | 7.70 ± 0.06 j | 7.06 ± 0.01 g | 6.95 ± 0.04 f | 7.13 D |
| 200 | 6.39 ± 0.06 d | 7.43 ± 0.01 i | 6.36 ± 0.08 d | 6.34 ± 0.06 d | 6.63 C |
| 400 | 5.79 ± 0.08 bc | 7.29 ± 0.01 h | 5.74 ± 0.01 bc | 5.84 ± 0.02 c | 6.16 B |
| 600 | 5.54 ± 0.04 a | 6.85 ± 0.08 ef | 5.71 ± 0.01 b | 5.73 ± 0.05 bc | 5.96 A |
| Mean | 6.13 A | 7.32 C | 6.22 B | 6.21 B | 6.47 |
| r | −0.985 ** | −0.971 ** | −0.945 ** | −0.962 ** | −0.654 ** |
| LSD for: | Cu pollution: 0.053; MNs: 0.053; interaction: 0.108 | ||||
| Starting soil pH 1M KCl = 6.44 pH 1M KCl (−log10H+) | |||||
| 0 | 6.14 ± 0.01 g | 7.36 ± 0.09 l | 6.58 ± 0.04 j | 6.44 ± 0.07 i | 6.63 D |
| 200 | 5.64 ± 0.03 e | 7.27 ± 0.01 l | 5.73 ± 0.04 ef | 5.80 ± 0.07 f | 6.11 C |
| 400 | 5.32 ± 0.07 cd | 6.77 ± 0.01 k | 5.30 ± 0.06 cd | 5.40 ± 0.06 d | 5.70 B |
| 600 | 5.09 ± 0.01 a | 6.31 ± 0.06 h | 5.18 ± 0.03 ab | 5.26 ± 0.03 bc | 5.46 A |
| Mean | 5.55 A | 6.93 C | 5.70 B | 5.73 B | 5.97 |
| r | −0.983 ** | −0.963 ** | −0.942 ** | −0.958 ** | −0.608 ** |
| LSD for: | Cu pollution: 0.052; MNs: 0.052; interaction: 0.105 | ||||
Values are mean ± standard deviation; r—correlation coefficient significant at ** p ≤ 0.01; means followed by different letters are significantly different by the LSDp≤0.05 test (uppercase regular—show differences between Cu pollution levels, uppercase italic—show differences between MNs, lowercase—show interaction Cu x MNs); n = 8.
Table 2.
Selected physicochemical properties of the soil after black mustard (Brassica nigra L. Koch) harvest.
Table 2.
Selected physicochemical properties of the soil after black mustard (Brassica nigra L. Koch) harvest.
| Soil Pollution with Cu (mg Cu kg−1) | Without MNs | Limestone | Clay | Zeolite | Mean |
|---|---|---|---|---|---|
| Starting soil 2.46 cmol(+) kg−1 Hydrolytic acidity (HAC) (cmol(+) kg−1) | |||||
| 0 | 2.68 ± 0.04 def | 1.32 ± 0.00 a | 2.18 ± 0.08 c | 2.20 ± 0.11 c | 2.09 A |
| 200 | 2.78 ± 0.14 ef | 1.78 ± 0.03 b | 2.64 ± 0.11 de | 2.88 ± 0.11 f | 2.52 B |
| 400 | 3.16 ± 0.23 g | 2.16 ± 0.06 c | 3.24 ± 0.11 gh | 3.12 ± 0.06 g | 2.92 C |
| 600 | 3.44 ± 0.06 hi | 2.48 ± 0.06 d | 3.52 ± 0.11 i | 3.34 ± 0.08 ghi | 3.20 D |
| Mean | 3.01 C | 1.94 A | 2.90 B | 2.89 B | 2.68 |
| r | 0.934 ** | 0.994 ** | 0.981 ** | 0.945 ** | 0.674 ** |
| LSD for: | Cu pollution: 0.108; MNs: 0.108; interaction: 0.215 | ||||
| Starting soil 6.57 cmol(+) kg−1 Total exchangeable bases (TEB) (cmol(+) kg−1) | |||||
| 0 | 6.17 ± 0.13 e | 9.22 ± 0.45 h | 7.85 ± 0.47 fg | 5.96 ± 0.11 de | 7.30 C |
| 200 | 5.24 ± 0.25 cd | 8.51 ± 0.38 g | 3.55 ± 0.24 b | 5.72 ± 0.28 de | 5.76 B |
| 400 | 7.51 ± 0.16 f | 7.79 ± 0.18 fg | 1.60 ± 0.48 a | 4.98 ± 0.20 c | 5.47 B |
| 600 | 4.07 ± 0.38 b | 6.43 ± 0.41 e | 3.58 ± 0.48 b | 6.28 ± 0.14 e | 5.09 A |
| Mean | 5.75 B | 7.99 C | 4.15 A | 5.74 B | 5.93 |
| r | −0.354 ns | −0.955 ** | −0.716 * | 0.049 ns | −0.389 * |
| LSD for: | Cu pollution: 0.345; MNs: 0.345; interaction: 0.690 | ||||
| Starting soil 9.03 cmol(+) kg−1 Cation exchange capacity (CEC) (cmol(+) kg−1) | |||||
| 0 | 8.85 ± 0.09 fg | 10.54 ± 0.45 i | 10.03 ± 0.55 hi | 8.16 ± 0.00 defg | 9.39 B |
| 200 | 8.02 ± 0.11 de | 10.29 ± 0.35 hi | 6.19 ± 0.35 b | 8.60 ± 0.40 efg | 8.28 A |
| 400 | 10.67 ± 0.07 i | 9.95 ± 0.24 hi | 4.84 ± 0.59 a | 8.10 ± 0.14 def | 8.39 A |
| 600 | 7.51 ± 0.33 cd | 8.91 ± 0.35 g | 7.10 ± 0.37 c | 9.62 ± 0.06 h | 8.29 A |
| Mean | 8.76 B | 9.92 C | 7.04 A | 8.62 B | 8.59 |
| r | −0.125 ns | −0.872 ** | −0.586 ns | 0.692 ns | −0.224 ns |
| LSD for: | Cu pollution: 0.349; MNs: 0.349; interaction: 0.700 | ||||
| Starting soil 72.75% Base saturation (BS) (%) | |||||
| 0 | 69.75 ± 0.71 h | 87.46 ± 0.54 j | 78.26 ± 0.35 i | 73.04 ± 1.39 h | 77.13 C |
| 200 | 65.32 ± 2.25 e | 82.69 ± 0.87 i | 57.33 ± 0.61 cd | 66.51 ± 0.23 ef | 67.96 B |
| 400 | 70.39 ± 1.92 fg | 78.29 ± 0.04 i | 32.69 ± 5.92 a | 61.47 ± 1.37 de | 60.71 A |
| 600 | 54.14 ± 2.74 bc | 72.13 ± 1.74 g | 50.31 ± 4.17 b | 65.28 ± 1.09 e | 60.46A |
| Mean | 69.40 B | 80.14 C | 54.65 A | 66.57 B | 66.57 |
| r | −0.700 | −0.989 ** | −0.734 * | −0.746 * | −0.485 ** |
| LSD for: | Cu pollution: 2.362; MNs: 2.362; interaction: 4.725 | ||||
| Starting soil 0.89 μS cm−1 Electrolytic conductivity (EC) (μS cm−1) | |||||
| 0 | 0.94 ± 0.05 a | 1.09 ± 0.01 a | 1.09 ± 0.02 a | 0.93 ± 0.03 a | 1.01 A |
| 200 | 1.00 ± 0.01 a | 2.21 ± 0.00 b | 2.29 ± 0.04 b | 2.10 ± 0.13 b | 1.90 B |
| 400 | 4.73 ± 0.08 e | 3.85 ± 0.11 c | 4.44 ± 0.01 d | 4.21 ± 0.21 d | 4.31 C |
| 600 | 4.79 ± 0.00 e | 5.72 ± 0.10 f | 4.83 ± 0.04 e | 4.70 ± 0.34 e | 5.01 D |
| Mean | 2.86 A | 3.22 C | 3.16 C | 2.99 B | 3.06 |
| r | 0.902 ** | 0.994 ** | 0.971 ** | 0.972 ** | 0.951 ** |
| LSD for: | Cu pollution: 0.122; MNs: 0.121; interaction: 0.243 | ||||
Values are mean ± standard deviation; r—correlation coefficient significant at ** p ≤ 0.01, * p ≤ 0.05; means followed by different letters are significantly different by the LSDp≤0.05 test (uppercase regular—show differences between Cu pollution levels, uppercase italic—show differences between MNs, lowercase—show interaction Cu × MNs); n = 8.
Table 3.
Total organic carbon, total nitrogen content, and C/N ratio of the soil after black mustard (Brassica nigra L. Koch) harvest.
Table 3.
Total organic carbon, total nitrogen content, and C/N ratio of the soil after black mustard (Brassica nigra L. Koch) harvest.
| Soil Pollution with Cu (mg Cu kg−1) | Without MNs | Limestone | Clay | Zeolite | Mean |
|---|---|---|---|---|---|
| Starting soil 4.79 g kg−1 Total organic carbon content (TOC) (g kg−1) | |||||
| 0 | 5.05 ± 0.21 bc | 4.50 ± 0.21 ab | 4.68 ± 0.11 abc | 5.70 ± 0.21 d | 4.98 A |
| 200 | 4.50 ± 0.21 ab | 4.85 ± 0.07 abc | 5.08 ± 0.25 bc | 5.25 ± 0.42 cd | 4.92 A |
| 400 | 4.35 ± 0.42 a | 4.88 ± 0.18 abc | 4.60 ± 0.35 ab | 4.95 ± 0.00 abc | 4.69 A |
| 600 | 5.23 ± 0.04 cd | 4.95 ± 0.42 abc | 5.10 ± 0.21 bc | 4.50 ± 0.21 ab | 4.94 A |
| Mean | 4.78 A | 4.79 A | 4.86 A | 5.10 A | 4.88 |
| r | 0.102 ns | 0.614 ns | 0.313 ns | −0.919 ** | −0.097 ns |
| LSD for: | Cu pollution: ns; MNs: ns; interaction: 0.542 | ||||
| Starting soil 0.58 g kg−1 Total nitrogen content (Ntot) (g kg−1) | |||||
| 0 | 0.50 ± 0.04 bcde | 0.55 ± 0.01 abc | 0.56 ± 0.02 abcd | 0.54 ± 0.05 ab | 0.54 AB |
| 200 | 0.53 ± 0.02 a | 0.53 ± 0.01 a | 0.57 ± 0.01 abcd | 0.53 ± 0.00 a | 0.54 A |
| 400 | 0.60 ± 0.01 cdef | 0.53 ± 0.03 a | 0.62 ± 0.01 ef | 0.54 ± 0.01 ab | 0.57 BC |
| 600 | 0.55 ± 0.02 ab | 0.61 ± 0.01 def | 0.63 ± 0.02 f | 0.56 ± 0.02 abcd | 0.59 C |
| Mean | 0.54 A | 0.55 A | 0.60 B | 0.54 A | 0.56 |
| r | 0.613 ns | 0.496 ns | 0.886 ** | 0.358 ns | 0.499 ** |
| LSD for: | Cu pollution: 0.021; MNs: 0.021; interaction: 0.042 | ||||
| Starting soil 8.26 C:N ratio | |||||
| 0 | 8.69 ± 0.22 abcd | 8.14 ± 0.24 abc | 8.35 ± 0.11 abc | 10.64 ± 1.37 e | 8.95 A |
| 200 | 8.46 ± 0.08 abcd | 9.16 ± 0.38 bcd | 8.96 ± 0.59 bcd | 9.87 ± 0.80 de | 9.11 A |
| 400 | 7.31 ± 0.59 a | 9.31 ± 0.86 bcde | 7.39 ± 0.68 a | 9.19 ± 0.17 bcd | 8.30 A |
| 600 | 9.57 ± 0.28 cde | 8.19 ± 0.80 abc | 8.09 ± 0.08 ab | 8.05 ± 0.66 ab | 8.48 A |
| Mean | 8.51 A | 8.70 A | 8.20 A | 9.43 B | 8.71 |
| r | 0.199 ns | 0.049 ns | −0.403 ns | −0.836 ** | −0.260 ns |
| LSD for: | Cu pollution: ns; MNs: 0.643; interaction: 1.286 | ||||
Values are mean ± standard deviation; r—correlation coefficient significant at ** p ≤ 0.01; ns—non-significant; means followed by different letters are significantly different by the LSDp≤0.05 test (uppercase regular—show differences between Cu pollution levels, uppercase italic—show differences between MNs, lowercase—show interaction Cu × MNs); n = 8
Table 4.
Cu, Zn, Cr, and Ni content in the soil after black mustard (Brassica nigra L. Koch) harvest.
Table 4.
Cu, Zn, Cr, and Ni content in the soil after black mustard (Brassica nigra L. Koch) harvest.
| Soil Pollution with Cu (mg Cu kg−1) | Without MNs | Limestone | Clay | Zeolite | Mean |
|---|---|---|---|---|---|
| Starting soil 18.21 mg Cu kg−1 Cu content (mg kg−1) | |||||
| 0 | 12.21 ± 0.30 a | 29.86 ± 3.05 a | 12.89 ± 2.79 a | 35.69 ± 6.95 a | 22.66 A |
| 200 | 160.77 ± 0.45 b | 170.24 ± 9.39 b | 151.76 ± 15.61 b | 179.92 ± 0.94 b | 165.67 B |
| 400 | 345.56 ± 0.72 c | 348.34 ± 27.51 c | 328.50 ± 16.72 c | 343.64 ± 22.73 c | 341.51 C |
| 600 | 553.25 ± 1.43 e | 482.92 ± 12.54 d | 506.44 ± 22.73 d | 538.03 ± 17.65 e | 520.16 D |
| Mean | 267.95 BC | 257.84 AB | 249.90 A | 274.32 C | 262.50 |
| r | 0.997 ** | 0.996 ** | 0.996 ** | 0.996 ** | 0.994 ** |
| LSD for: | Cu pollution: 14.375; MNs: 14.375; interaction: 28.750 | ||||
| Zn content (mg kg−1) | |||||
| 0 | 19.65 ± 0.17 a | 33.61 ± 0.29 gh | 31.33 ± 2.49 defg | 33.15 ± 2.56 fgh | 29.44 B |
| 200 | 29.44 ± 2.54 bcdefgh | 28.48 ± 3.45 bcde | 30.30 ± 2.20 cdefgh | 33.34 ± 0.71 gh | 30.39 B |
| 400 | 26.62 ± 0.33 bc | 27.04 ± 1.34 bcd | 29.21 ± 2.91 bcdefg | 25.55 ± 0.33 b | 27.10 A |
| 600 | 33.73 ± 1.54 h | 32.69 ± 1.04 efgh | 30.24 ± 1.21 cdefgh | 28.77 ± 1.49 bcdef | 31.36 B |
| Mean | 27.36 A | 30.45 B | 30.27 B | 30.20 B | 29.57 |
| r | 0.843 ** | −0.153 ns | −0.274 ns | −0.683 ns | 0.072 ns |
| LSD for: | Cu pollution: 1.952; MNs: 1.952; interaction: 3.904 | ||||
| Cd content (mg kg−1) | |||||
| 0 | 0.94 ± 0.23 ab | 0.81 ± 0.02 a | 0.97 ± 0.14 ab | 1.24 ± 0.15 bcde | 0.99 A |
| 200 | 0.81 ± 0.12 a | 1.15 ± 0.32 abcd | 1.26 ± 0.14 bcde | 1.45 ± 0.04 de | 1.17 BC |
| 400 | 1.17 ± 0.09 bcde | 1.50 ± 0.04 e | 1.34 ± 0.13 cde | 1.01 ± 0.11 abc | 1.25 C |
| 600 | 1.21 ± 0.12 bcde | 1.08 ± 0.06 abc | 0.92 ± 0.12 ab | 0.98 ± 0.15 ab | 1.05 AB |
| Mean | 1.03 A | 1.13 A | 1.12 A | 1.17 A | 1.12 |
| r | 0.677 ns | 0.472 ns | −0.036 ns | −0.652 ns | 0.126 ns |
| LSD for: | Cu pollution: ns; MNs: ns; interaction: 1.282 | ||||
| Cr content (mg kg−1) | |||||
| 0 | 14.65 ± 1.10 a | 17.54 ± 0.48 a | 19.22 ± 0.72 a | 10.17 ± 2.46 a | 15.39 A |
| 200 | 11.84 ± 2.79 a | 14.79 ± 1.46 a | 17.35 ± 3.10 a | 14.24 ± 1.30 a | 14.55 A |
| 400 | 8.77 ± 0.23 a | 17.45 ± 1.38 a | 14.31 ± 8.87 a | 8.18 ± 1.11 a | 12.18 A |
| 600 | 13.28 ± 0.36 a | 18.66 ± 1.55 a | 16.37 ± 2.90 a | 8.57 ± 0.37 a | 14.22 A |
| Mean | 12.14 A | 17.11 B | 16.81 B | 10.29 A | 14.09 |
| r | −0.329 ns | 0.397 ns | −0.331 ns | −0.462 ns | −0.163 ns |
| LSD for: | Cu pollution: ns; MNs: 2.931; interaction: n.s. | ||||
| Ni content (mg kg−1) | |||||
| 0 | 14.21 ± 2.83 a | 10.79 ± 1.50 a | 8.33 ± 0.27 a | 11.70 ± 2.74 a | 11.26 A |
| 200 | 18.39 ± 7.47 a | 10.13 ± 1.17 a | 7.77 ± 0.14 a | 10.02 ± 0.32 a | 11.58 A |
| 400 | 11.40 ± 0.59 a | 12.91 ± 3.55 a | 8.65 ± 2.09 a | 9.44 ± 1.28 a | 10.60 A |
| 600 | 12.14 ± 4.90 a | 13.04 ± 3.92 a | 10.17 ± 0.24 a | 9.45 ± 0.15 a | 11.20 A |
| Mean | 14.03 B | 11.72 AB | 8.73 A | 10.15 A | 11.16 |
| r | −0.344 ns | 0.451 ns | 0.614 ns | −0.578 ns | −0.039 ns |
| LSD for: | Cu pollution: ns; MNs: 3.064; interaction: ns | ||||
Values are mean ± standard deviation; r—correlation coefficient significant at ** p ≤ 0.01,; n.s.—non-significant; means followed by different letters are significantly different by the LSDp≤0.05 test (uppercase regular—show differences between Cu pollution levels, uppercase italic—show differences between MNs, lowercase—show interaction Cu × MNs); n = 8
Table 5.
Pb, Mn, and Fe content in the soil after black mustard (Brassica nigra L. Koch) harvest.
| Soil Pollution with Cu (mg Cu kg−1) | Without MNs | Limestone | Clay | Zeolite | Mean |
|---|---|---|---|---|---|
| Pb content (mg kg−1) | |||||
| 0 | 16.05 ± 2.35 a | 16.67 ± 1.18 a | 14.86 ± 2.95 a | 17.06 ± 2.5 a | 16.16 A |
| 200 | 13.92 ± 2.84 a | 17.82 ± 1.41 a | 13.78 ± 3.20 a | 15.14 ± 1.87 a | 15.16 A |
| 400 | 17.63 ± 0.05 a | 14.53 ± 0.29 a | 17.57 ± 0.05 a | 15.93 ± 1.87 a | 16.41 A |
| 600 | 13.91 ± 6.48 a | 16.37 ± 1.82 a | 14.48 ± 0.49 a | 13.65 ± 3.98 a | 14.60 A |
| Mean | 15.37 A | 16.34 A | 15.17 A | 15.44 A | 15.58 |
| r | −0.099 ns | −0.313 ns | 0.140 ns | −0.465 ns | −0.163 ns |
| LSD for: | Cu pollution: ns; MNs: ns; interaction: ns | ||||
| Mn content (mg kg−1) | |||||
| 0 | 220.34 ± 12.02 a | 232.97 ± 20.20 a | 239.52 ± 10.83 a | 229.97 ± 23.25 a | 230.70 A |
| 200 | 213.70 ± 7.16 a | 214.25 ± 12.58 a | 220.77 ± 2.07 a | 243.31 ± 47.13 a | 223.01 A |
| 400 | 221.31 ± 9.48 a | 228.87 ± 10.22 a | 214.53 ± 6.80 a | 226.30 ± 30.92 a | 222.75 A |
| 600 | 226.88 ± 23.22 a | 222.14 ± 6.22 a | 221.72 ± 13.84 a | 215.61 ± 0.05 a | 221.59 A |
| Mean | 220.56 A | 224.56 A | 224.13 A | 228.80 A | 224.51 |
| r | 0.273 ns | −0.169 ns | −0.582 ns | −0.283 ns | −0.196 ns |
| LSD for: | Cu pollution: ns; MNs: ns; interaction: ns | ||||
| Fe content (mg kg−1) | |||||
| 0 | 6829 ± 649 a | 7041 ± 430 a | 7664 ± 105 a | 6699 ± 1168 a | 7058 AB |
| 200 | 6625 ± 886 a | 7148 ± 690 a | 7987 ± 37 a | 7427 ± 403 a | 7297 B |
| 400 | 5866 ± 168 a | 7308 ± 78 a | 6432 ± 609 a | 6233 ± 322 a | 6460 A |
| 600 | 6400 ± 440 a | 7792 ± 285 a | 7513 ± 452 a | 5696 ± 537 a | 6851 AB |
| Mean | 6430 A | 7322 B | 7399 B | 6514 A | 6916 |
| r | −0.413 ns | 0.643 ns | −0.349 ns | −0.586 ns | −0.214 ns |
| LSD for: | Cu pollution: 573.66; MNs: 573.66; interaction: ns | ||||
Values are mean ± standard deviation; r—correlation coefficient n.s.—non-significant; means followed by different letters are significantly different by the LSDp≤0.05 test (uppercase regular—show differences between Cu pollution levels, uppercase italic—show differences between MNs, lowercase—show interaction Cu × MNs); n = 8.
Table 6.
Pearson’s simple correlation coefficients (r) between soil properties and trace metals content in the soil after black mustard (Brassica nigra L. Koch) harvest.
Table 6.
Pearson’s simple correlation coefficients (r) between soil properties and trace metals content in the soil after black mustard (Brassica nigra L. Koch) harvest.
| Properties | pH H2O | pH KCl | HAC | TEB | CEC | BS | EC | TOC | Ntot | C-N | Cu | Zn | Cd | Cr | Ni | Pb | Mn | Fe |
|---|---|---|---|---|---|---|---|---|---|---|---|---|---|---|---|---|---|---|
| pH H2O | 0.98 | −0.96 | 0.73 | 0.54 | 0.80 | −0.61 | 0.03 | −0.37 | 0.22 | −0.66 | 0.07 | −0.05 | 0.47 | 0.12 | 0.16 | 0.15 | 0.43 | |
| pH KCl | 0.98 | −0.97 | 0.76 | 0.57 | 0.81 | −0.54 | 0.00 | −0.37 | 0.20 | −0.61 | 0.10 | −0.04 | 0.45 | 0.04 | 0.22 | 0.17 | 0.39 | |
| HAC | −0.96 | −0.97 | −0.72 | −0.51 | −0.79 | 0.61 | 0.05 | 0.41 | −0.19 | 0.67 | −0.17 | 0.08 | −0.39 | −0.05 | −0.21 | −0.17 | −0.35 | |
| TEB | 0.73 | 0.76 | −0.72 | 0.96 | 0.96 | −0.33 | −0.25 | −0.42 | 0.04 | −0.36 | −0.03 | −0.15 | 0.14 | 0.10 | 0.15 | 0.17 | 0.06 | |
| CEC | 0.54 | 0.57 | −0.51 | 0.96 | 0.89 | −0.18 | −0.29 | −0.36 | −0.02 | −0.19 | −0.10 | −0.16 | 0.03 | 0.10 | 0.11 | 0.15 | −0.06 | |
| BS | 0.80 | 0.81 | −0.79 | 0.96 | 0.89 | −0.46 | −0.11 | −0.51 | 0.20 | −0.46 | 0.02 | −0.16 | 0.19 | 0.14 | 0.10 | 0.21 | 0.18 | |
| EC | −0.61 | −0.54 | 0.61 | −0.33 | −0.18 | −0.46 | −0.12 | 0.44 | −0.32 | 0.94 | 0.02 | 0.21 | −0.14 | −0.14 | −0.02 | −0.16 | −0.21 | |
| TOC | 0.03 | 0.00 | 0.05 | −0.25 | −0.29 | −0.11 | −0.12 | −0.17 | 0.83 | −0.09 | 0.16 | 0.26 | 0.00 | −0.03 | 0.01 | 0.03 | 0.24 | |
| Ntot | −0.37 | −0.37 | 0.41 | −0.42 | −0.36 | −0.51 | 0.44 | −0.17 | −0.69 | 0.32 | −0.09 | −0.11 | 0.19 | −0.17 | 0.13 | −0.11 | 0.13 | |
| C-N | 0.22 | 0.20 | −0.19 | 0.04 | −0.02 | 0.20 | −0.32 | 0.83 | −0.69 | −0.24 | 0.16 | 0.27 | −0.12 | 0.06 | −0.05 | 0.07 | 0.08 | |
| Cu | −0.66 | −0.61 | 0.67 | −0.36 | −0.19 | −0.46 | 0.94 | −0.09 | 0.32 | −0.24 | 0.09 | 0.12 | −0.18 | −0.05 | −0.18 | −0.18 | −0.25 | |
| Zn | 0.07 | 0.10 | −0.17 | −0.03 | −0.10 | 0.02 | 0.02 | 0.16 | −0.09 | 0.16 | 0.09 | 0.13 | 0.17 | −0.03 | 0.00 | 0.25 | 0.27 | |
| Cd | −0.05 | −0.04 | 0.08 | −0.15 | −0.16 | −0.16 | 0.21 | 0.26 | −0.11 | 0.27 | 0.12 | 0.13 | 0.13 | −0.21 | 0.02 | 0.25 | 0.21 | |
| Cr | 0.47 | 0.45 | −0.39 | 0.14 | 0.03 | 0.19 | −0.14 | 0.00 | 0.19 | −0.12 | −0.18 | 0.17 | 0.13 | −0.11 | −0.13 | 0.22 | 0.82 | |
| Ni | 0.12 | 0.04 | −0.05 | 0.10 | 0.10 | 0.14 | −0.14 | −0.03 | −0.17 | 0.06 | −0.05 | −0.03 | −0.21 | −0.11 | 0.07 | −0.09 | −0.16 | |
| Pb | 0.16 | 0.22 | −0.21 | 0.15 | 0.11 | 0.10 | −0.02 | 0.01 | 0.13 | −0.05 | −0.18 | 0.00 | 0.02 | −0.13 | 0.07 | −0.18 | −0.17 | |
| Mn | 0.15 | 0.17 | −0.17 | 0.17 | 0.15 | 0.21 | −0.16 | 0.03 | −0.11 | 0.07 | −0.18 | 0.25 | 0.25 | 0.22 | −0.09 | −0.18 | 0.33 | |
| Fe | 0.43 | 0.39 | −0.35 | 0.06 | −0.06 | 0.18 | −0.21 | 0.24 | 0.13 | 0.08 | −0.25 | 0.27 | 0.21 | 0.82 | −0.16 | −0.17 | 0.33 |
r—correlation coefficient significant at p ≤ 0.01— ![Minerals 12 00895 i001]() ; p ≤ 0.05—
; p ≤ 0.05— ![Minerals 12 00895 i002]() ; ns—
; ns— ![Minerals 12 00895 i003]() non-significant; n = 32.
non-significant; n = 32.
 ; p ≤ 0.05—
  ; ns—
; ns—  non-significant; n = 32.
Publisher’s Note: MDPI stays neutral with regard to jurisdictional claims in published maps and institutional affiliations. |
© 2022 by the authors. Licensee MDPI, Basel, Switzerland. This article is an open access article distributed under the terms and conditions of the Creative Commons Attribution (CC BY) license (https://creativecommons.org/licenses/by/4.0/).
Share and Cite
MDPI and ACS Style
Żołnowski, A.C.; Wyszkowski, M. Mineral Neutralizers as a Tool for Improving the Properties of Soil Contaminated with Copper. Minerals 2022, 12, 895. https://0-doi-org.brum.beds.ac.uk/10.3390/min12070895
AMA Style
Żołnowski AC, Wyszkowski M. Mineral Neutralizers as a Tool for Improving the Properties of Soil Contaminated with Copper. Minerals. 2022; 12(7):895. https://0-doi-org.brum.beds.ac.uk/10.3390/min12070895
Chicago/Turabian StyleŻołnowski, Andrzej Cezary, and Mirosław Wyszkowski. 2022. "Mineral Neutralizers as a Tool for Improving the Properties of Soil Contaminated with Copper" Minerals 12, no. 7: 895. https://0-doi-org.brum.beds.ac.uk/10.3390/min12070895
Note that from the first issue of 2016, this journal uses article numbers instead of page numbers. See further details here.