Article

Optimization of a Rare Earth and Aluminum Leaching Process from Weathered Crust Elution-Deposited Rare Earth Ore with Surfactant CTAB

1
Key Laboratory of Green Chemical Process of Ministry of Education, School of Xingfa Mining Engineering, Wuhan Institute of Technology, Wuhan 430073, China
2
School of Minerals Processing and Bioengineering, Central South University, Changsha 410083, China
*
Authors to whom correspondence should be addressed.
Submission received: 27 February 2024 / Revised: 15 March 2024 / Accepted: 17 March 2024 / Published: 20 March 2024
(This article belongs to the Section Mineral Processing and Extractive Metallurgy)

Abstract

:
Ammonium sulfate is typically employed as a leaching agent in the in situ leaching of weathered crust elution-deposited rare earth ore. However, it is associated with challenges such as low efficiency in mass transfer for rare earth (RE) leaching, high usage of the leaching agent, and prolonged leaching duration. To address the issues mentioned above, the surfactant cetyltrimethyl ammonium bromide (CTAB) was compounded with 2% ammonium sulfate to form a leaching agent in this paper. The effects of CTAB concentration, temperature, pH, and leaching agent flow rate on the rare earth (RE) and aluminum (Al) leaching mass transfer process from RE ore were investigated using chromatographic plate theory. The results revealed that CTAB addition improved the RE mass transfer process while moderately inhibiting the Al mass transfer efficiency. Increasing the temperature and pH of the leaching solution led to higher theoretical plate numbers for RE and Al leaching, lowered theoretical plate height (HETP), and enhanced leaching mass transfer efficiency. However, under high temperature and alkaline conditions, the mass transfer efficiency begins to decrease, indicating that high temperature and alkaline conditions are not conducive to the synergistic enhancement of RE and Al leaching by CTAB. Considering that clay minerals have good pH buffering properties, adjusting the pH of the leaching solution during rare earth ore leaching operations was deemed unnecessary. The optimal mass transfer conditions for leaching RE and Al were identified as 2% ammonium sulfate concentration, 0.00103 mol/L CTAB concentration, pH range of 5.2–5.5 for the leaching solution, 0.6 mL/min leaching solution flow rate, and room temperature. The rare earth leaching mass transfer effect could be enhanced during summer operations.

1. Introduction

Rare earth elements (REEs) are composed of scandium (Sc), yttrium (Y), and 15 lanthanide elements [1,2]. Rare earths are widely used in the metallurgical industry, luminescent materials, agriculture, and other fields because of their unique 4f-layer electronic structure and good optical, electrical, and magnetic properties [3,4]. Medium and heavy rare earths are more competitive in the market compared to light rare earths due to their scarcity in raw materials and wider utilization.
Rich in medium and heavy rare earths, weathered crust elution-deposited rare earth ore is primarily found in seven southern provinces of China [5,6]. Medium and heavy rare earth reserves make up over 80% of the global rare earth reserves and are valuable mineral resources in China [7,8,9]. Weathering-type rare earth ore is formed by weathering RE-containing granites or volcanic rocks for many years and clay minerals make up 40%–70% of its composition. REEs primarily bond to clay minerals through either hydration or hydroxyl hydration cations and it is difficult to enrich and recover rare earths by conventional physical methods. The scientific and technological workers have carried out long-term research and practice on RE ore, developed a method of extracting rare earths from clay minerals by ion exchange using electrolyte aqueous solution, and gradually developed three generation processes for leaching rare earths [10,11].
Currently, the third-generation rare earth leaching process being widely used is the in situ leaching process. This process involves injecting the leaching solution into the ore injection well, allowing it to diffuse into the ore body through seepage. Then, the RE ions adsorbed on the clay minerals are exchanged and leached from top to bottom [12]. When ammonium salt is utilized as the leaching agent [13,14], the ion exchange reaction equation is represented in Formula (1). The advantage of the in situ leaching process is that it no longer requires “mountain moving”, thereby protecting the mountain, improving the utilization rate of RE resources, and achieving efficient rare earth recovery [15,16].
[ Al 4 ( Si 4 O ) 10 ( OH ) 8 ] m · n RE 3 +   ( s ) + 3 n NH 4 +   ( a q ) [ Al 4 ( Si 4 O 10 ) ( OH ) 8 ] m · 3 n NH 4 +   ( s ) + n RE 3 +   ( aq )
Due to the different genesis of the deposits, the weathered crust elution-deposited rare earth ore bodies formed have different properties and the rare earth ores in some areas are characterized by thick weathered layers and poor permeability. This characteristic will reduce the effective seepage rate and RE mass transfer efficiency of the in situ leaching process, which will affect the utilization rate and revenue of RE resources. Therefore, exploring the seepage and mass transfer behavior of RE ore is crucial for advancing the rare earth industry, solving the seepage and mass transfer problems of the RE leaching process, and optimizing the in situ leaching process.
At present, ammonium salts are mainly utilized as leaching agents for extracting REEs, with ammonium sulfate being the most commonly applied in industry. Li et al. [17] also found that as the cation concentration of the leaching agent increased from 0 to 5%, there was a gradual decrease in the permeability coefficient of the leaching solution. This phenomenon occurs because as the concentration of cations in the solution increases, more rare earth ions are displaced, resulting in an accumulation of negative charges on the surface of mineral particles. This leads to the formation of a thicker water film and enhances the fluid retention effect. In addition to ammonium salts, rare earth workers have also studied the effects of magnesium and calcium salts on the seepage process. Liang et al. [18] found that magnesium sulfate and calcium chloride, as leaching solutions, can strongly compress the double layer of weathered crust elution-deposited rare earth ore particles after entering the ore body. This helps to prevent the migration of fine particles during leaching, decrease the likelihood of pore blockage, and enhance the permeability of the ore body.
Leaching aids have the characteristics of low usage and low environmental harm. In the rare earth leaching process, adding a certain amount of leaching aids to the leaching solution can improve the infiltration and RE mass transfer process and improve the effective infiltration rate and RE mass transfer efficiency. Tang et al. [19] found that the use of sesbania gum as a leaching aid in the leaching process of low-grade RE ore could greatly enhance the RE leaching rate. As an emulsifier, thickener, and stabilizer in food processing, sesbania gum is able to strengthen the penetration performance of the leaching solution and improve the RE leaching rate. Tian et al. [20] modified this by adding carboxymethyl to sesbania gum to reduce the composite agent viscosity and enhance the hydrophilicity and permeability of the composite agent. Compared with sesbania gum, modified sesbania glue has stronger leaching aid performance. Feng et al. [21] found that the equilibrium time of ammonium formate as a leaching aid compound with ammonium sulfate was 5.3 h shorter than that of ammonium sulfate.
A surfactant is a substance that can make the interfacial state of a solution system change significantly by adding a small amount. The solution has fixed hydrophilic and lipophilic groups that can be oriented in a specific direction on its surface. Surfactants have an amphiphilic molecular structure, featuring hydrophilic groups at one end and hydrophobic groups at the other end. Wu et al. [22] used surfactants as a percolation aid in the uranium heap leaching process, which improved the soluble leach permeability and the uranium leaching efficiency. Fang et al. [23] added surfactants in the bioleaching of arsenic-containing gold concentrates, which improved the arsenic leaching rate. Ai et al. [24] employed surfactants during the copper ore leaching process and observed that the inclusion of surfactants not only improved the permeability in column leaching significantly but also enhanced the copper leaching rate by 8.4%. Chen et al. [25] used cationic surfactant CTAB to assist in the leaching of manganese from low-grade rhodochrosite and the results showed that surfactant CTAB was beneficial for improving the manganese leaching rate and that the leaching rate could reach 99.07%. Liu et al. [26] used anionic surfactant SDS to promote the leaching of potassium in phosphorus and potassium-associated minerals. The addition of SDS would produce adsorption in ore cracks, allowing the acid-leaching solution to penetrate the interior of the mine and undergo chemical reactions inside the mine, thereby enhancing the potassium leaching rate. Thus, the utilization of cationic and anionic surfactants to assist in leaching has achieved good reinforcement effects in the leaching process.
Through preliminary exploration, it was found that surfactant CTAB had a better effect on RE leaching. Thus, the effect of CTAB and ammonium sulfate compounding on the leaching mass transfer process of RE and Al under different conditions was investigated. By analyzing the outflow curve of RE and Al and calculating with the chromatographic plate theory, the influence law of complex leaching of RE and Al with CTAB and (NH4)2SO4 under different conditions was obtained to enhance the leaching process by minimizing the use of leaching agent, improving its percolation rate, and reducing the leaching time. It provides a theoretical basis for the development of high-efficiency leaching agents and technologies for weathered crust elution-deposited rare earth ore and offers valuable insights for research on enhancing mass transfer through surfactant compound processes.

2. Materials and Methods

2.1. Materials

The weathered crust elution-deposited rare earth ore samples used in this study were from Jiangxi province, China. The mineral composition of the rare earth ore sample is shown in Table 1. Ammonium sulfate ((NH4)2SO4), cetyltrimethyl ammonium bromide (CTAB), ascorbic acid, sulfosalicylic acid, xylenol orange, ethylenediaminetetraacetic acid disodium, zinc oxide, hexamethylenetetramine, hydrochloric acid, and ammonium hydroxide were purchased from Sinopharm Chemical Reagent Co., Ltd., Shanghai, China, with analytical grade. A standard solution of zinc was purchased from the National Center of Analysis and Testing for Nonferrous Metals and Electronic Materials.

2.2. Column Leaching Experiment

A total of 250 g of dried RE ore sample was slowly and evenly packed into a glass column with a diameter of 45.0 mm. Several pieces of filter paper were placed on the surface of the ore sample. The glass column was then fixed to the iron frame and placed vertically. The peristaltic pump was used to send a certain amount of CTAB and 2% ammonium sulfate compound leaching liquid to the top of the glass column at a uniform speed. Then, a measuring cylinder was used to collect the leachate from the bottom of the glass column. The schematic diagram of the experimental apparatus is shown in Figure 1. When the leachate flowed out, the time was started, the leachate was collected at regular intervals, and the volume of the leachate was measured and analyzed for the content of rare earths and aluminum.

2.3. Analytical Methods

The content of RE in the leachate was determined by EDTA titration [21]. The appropriate amount of rare earth leachate was accurately transferred into the conical flask by pipette. Then, 25 mL of deionized water, 0.1 g of ascorbic acid, and 2 mL of sulfosalicylic acid solution were added to the sample in turn. Ascorbic acid and sulfosalicylic acid are mainly used to mask impurity ions such as iron and aluminum. Hydrochloric acid (volume ratio 1:1) or ammonia (volume ratio 1:1) was used to adjust the pH value of the solution to 5.0–5.5, then 2.5 mL hexamethylenetetramine buffer solution and 1–2 drops of 1 g/L xylenol orange indicator were added to the sample, and EDTA standard solution was used to titrate until the solution changed from purplish red to bright yellow, which was the titration endpoint, and the content of rare earths in it was analyzed. Excess concentrated EDTA standard solution was added quantitatively to the solution after titration of rare earth, then bathed in water at 90 °C for 10 min, then titrated with zinc standard solution until the solution changed from bright yellow to purple–red, and the content of aluminum was analyzed. The surface potential of the ore in contact with different solutions was determined by a Zeta potentiometer (Zetersizer Nano-ZS90, Malvern, UK). The viscosity of the solution was determined by using a Ubbelohde viscometer.

3. Results

3.1. Effect of the CTAB Concentration on the Leaching Process of RE and Al

In order to investigate the effect of leaching-aid agent on the rare earth leaching process, the leaching mass transfer process of RE and Al was discussed using a 2% (NH4)2SO4 solution compound with CTAB as a compound. The effects of CTAB concentration on the leaching process of RE and Al are presented in Figure 2.
From Figure 2, it can be observed that the concentrations of RE and Al in the leachate increase rapidly until reaching a peak and then drop rapidly to zero with the increase in the outflow of leachate. Compared with the single leaching agent of 2% ammonium sulfate, the RE leaching curve peaks at a higher concentration and has a narrower pattern when using the CTAB compound as the leaching agent. This suggests that adding CTAB can improve the RE mass transfer process. However, the peak concentration of the leaching curve of Al is lower and the peak shape is wider, which indicates that the addition of CTAB can weaken the Al mass transfer process, which is conducive to the inhibition of the impurity aluminum leaching. At the concentration of 0.00103 mol/L of CTAB, the RE leaching curve shows its highest peak concentration and narrowest peak shape, resulting in higher mass transfer efficiency compared to other concentrations. Additionally, the Al mass transfer efficiency significantly decreased at this concentration. When the concentration of CTAB increases from 0.00034 mol/L to 0.00103 mol/L, the peak concentration of rare earths increases, the peak shape of the leaching curve narrows, and the leaching mass transfer efficiency increases. As the CTAB concentration continues to increase, the peak concentration of RE gradually decreases, the peak shape of the leaching curve gradually widens, and the leaching mass transfer efficiency decreases. When the concentration of CTAB is 0.00103 mol/L, CTAB reduces the surface tension of the leaching solution and the leaching agent can better wet the clay mineral particles. The exchange reaction between NH4+ and RE3+ is more thorough and the leaching mass transfer process is strengthened. Therefore, in the subsequent optimization process research, 0.00103 mol/L is the optimal process condition for CTAB.
The chromatographic plate theory can be applied to analyze the leaching process of RE and Al. According to the dynamic distribution of the chromatographic outflow curve, the calculation formulas of the theoretical plate number and the theoretical plate height were derived as follows [27]:
n = 8 ln 2 × ( V R V 1 / 2 ) 2
HETP = L/n
where n represents the theoretical plate number; VR is the volume of the collected leachate, mL; V1/2 is the peak width at half height, mL; HETP is the theoretical plate height, cm; and L is the length of the packed ore in the glass column, cm.
The chromatographic plate theory is used to analyze the leaching curves of RE and Al in Figure 2. The leach HETP curves of RE and Al are displayed in Figure 3. The correlation parameters are listed in Table 2 and Table 3. Compared with the single use of ammonium sulfate, the theoretical plate number of rare earth leaching with compound leaching agent increases, the HETP decreases, and the mass transfer driving force increases, which indicated that the addition of CTAB could enhance the leaching mass transfer process of RE. However, the theoretical plate number of aluminum leaching with the compound leaching agent decreases, the HETP increases, and the mass transfer driving force decreases, which suggests that the presence of CTAB can inhibit the leaching mass transfer process of Al. From Figure 3 and Table 2 and Table 3, it can be seen that the HETP of the RE leaching process decreases first and then increases with the increase in CTAB concentration, so the RE mass transfer efficiency increases first and then decreases with the increase in CTAB concentration, which indicates that the reasonable addition of CTAB can effectively strengthen the mass transfer efficiency of RE. When the CTAB compound concentration is 0.00103 mol/L, the RE mass transfer efficiency is the highest, which can greatly improve the RE leaching efficiency. The Al mass transfer efficiency first decreases and then increases with the increase in CTAB compound concentration, indicating that reasonable addition of CTAB can effectively weaken the Al mass transfer efficiency.

3.2. Effect of the Leaching Temperature on the Leaching Process of RE and Al

Figure 4 illustrates the impact of the leaching temperature on the leaching process of RE and Al. From Figure 4a, it was found that as the leaching temperature rises, the RE peak concentration increases in a small range, the peak shape becomes narrower, and the mass transfer efficiency becomes higher. This is because the increase in leaching temperature causes a decrease in the viscosity of the leaching agent and the heat movement of ion exchange accelerates, thus the longitudinal diffusivity and exchangeability of the solution are enhanced, the tailing phenomenon is weakened, and the mass transfer effect is enhanced [28]. When the temperature is too high, the peak concentration suddenly decreases, the peak shape becomes wider, the tailing phenomenon is serious, and the mass transfer efficiency becomes lower. The highest concentration of RE occurred at a leaching temperature of 308.15 K, while the lowest concentration was observed at 318.15 K. It suggests that excessively high temperatures can impede the mass transfer of RE in the synergistic leaching process of the cationic surfactant CTAB compound system. Therefore, in the leaching process, it is important to choose a suitable temperature, such as in summer, which is more suitable for leaching operations to achieve higher leaching efficiency. Figure 4b shows a trend where the peak concentration of Al initially decreases before gradually increasing with the increase in leaching temperature. Additionally, the peak shape starts off narrower and then widens over time, suggesting an initial increase followed by a gradual decrease in Al mass transfer efficiency.
To further elaborate on the findings, the leaching curves of RE and Al at various leaching temperatures were analyzed using chromatographic plate theory. The correlation parameters can be found in Table 4 and Table 5. Figure 5 displays the leach HETP curves for RE and Al. It is evident that as the leaching temperature rises, the HETP of RE leaching initially decreases before increasing, while the mass transfer driving force follows a pattern of initial increase followed by a decrease and the mass transfer efficiency exhibits a similar trend of increasing firstly and then decreasing. When the leaching temperature is 298.15 K, the HETP of RE leaching is the lowest, the theoretical plate number is the largest, and the RE mass transfer efficiency is the highest. As the leaching temperature increases, the HETP of Al leaching initially decreases before eventually increasing, while the Al mass transfer efficiency initially increases before eventually decreasing. When the leaching temperature is 278.15 K and the HETP of aluminum leaching is the highest, the Al mass transfer efficiency is the lowest. Via comprehensive analysis, it can be seen that choosing to operate at higher temperatures in summer can effectively utilize CTAB synergistic leaching to improve the RE mass transfer efficiency, as well as greatly improve the mass transfer efficiency of CTAB in inhibiting Al on mineral surfaces, thereby effectively accelerating the RE leaching rate and inhibiting the impurity Al leaching.

3.3. Effect of pH on the Leaching Process of RE and Al

The effects of pH on the leaching process of RE and Al are presented in Figure 6. From Figure 6a, RE concentration gradually increases until it reaches a maximum and then decreases rapidly as the leachate volume increases. As the pH of the leaching agent gradually increases to 6, the RE peak concentration gradually increases, the peak shape becomes narrow, and the mass transfer efficiency becomes higher. At a pH of 6, the RE leaching curve exhibits the highest peak concentration, the narrowest peak shape, and the highest mass transfer efficiency. Conversely, at a pH of 2, the RE peak concentration is relatively low, suggesting that a low pH hinders the RE mass transfer process in the cationic surfactant CTAB composite system. However, at this time, the RE leaching curve peak shape is wider and the trailing phenomenon is serious, which is due to the fact that strong acid conditions will lead the adsorbed colloidal phase rare earth elements in the RE ores to partially dissolve, which leads to a certain degree of RE leaching process peak shape widening. As can be seen in Figure 6b, with the increase in leachate volume, the aluminum concentration gradually increases until it reaches the maximum and then rapidly decreases to the minimum. With the increase in pH, the Al peak concentration increases and then decreases and the peak shape becomes narrower and then wider, indicating that the Al mass transfer efficiency increases and then decreases. This may be due to the fact that CTAB acts on the surface of mineral particles, thereby inhibiting the leaching efficiency of aluminum. At a pH of 2, the peak width of the aluminum leaching curve is the widest and the peak concentration is higher, which is due to the strong acid conditions that will lead the adsorbed hydroxy-aluminum in the RE ores to partially dissolve, due to the adsorbed state of the hydroxy-aluminum in the mineral samples accounting for a large percentage and resulting in more dissolved content; at the same time, it will also produce a serious drag-out phenomenon and the impurity of the Al leaching rate is significantly increased. Therefore, the strong acid system is not recommended for leaching operations; otherwise, the increase in impurity aluminum content in the leach solution will lead to the subsequent removal of higher costs.
The leaching curves of RE and Al at various pH were analyzed by chromatographic plate theory. Correlation parameters were calculated and are listed in Table 6 and Table 7. Figure 7 illustrates the leach HETP curves of RE and Al. The results reveal that the HETP of RE leaching initially decreases and then increases with the pH of the compound leaching solution and the RE mass transfer efficiency follows a similar trend of increasing and then decreasing. When the pH of the leaching solution is 6, the theoretical plate height of RE leaching is the lowest and the RE mass transfer efficiency is the highest. The theoretical plate height of aluminum leaching decreases first and then increases with the increase in the pH of the compound leaching solution. At a pH of 6, the theoretical plate height of Al leaching is the lowest and the mass transfer efficiency is the highest. Because the pH value of the compound leaching agent solution is 5.2–5.5, the pH value can be selected not to be adjusted in the actual rare earth ore leaching operation.

3.4. Effect of the Flow Rate on the Leaching Process of RE and Al

The illustration in Figure 8 shows the effect of the flow rate on the leaching process of RE and Al. In Figure 8a, it is evident that with an increase in leachate volume, the leaching concentration of rare earths first reaches its maximum value and then rapidly decreases until it reaches zero. At a flow rate of 0.6 mL/min, the rare earths’ concentration reaches its maximum and the peak shape is the narrowest, indicating that the mass transfer driving force is large and the mass transfer efficiency is high at this time. While the leaching flow rate is below 0.6 mL/min, the leaching agent penetrates the mineral at a slower rate and NH4+ undergoes lateral diffusion, resulting in reverse adsorption, poor mass transfer efficiency, and a more serious tailing phenomenon. While the leaching flow rate exceeds 0.6 mL/min, NH4+ mainly diffuses longitudinally without sufficient ion exchange, leading to a reduced efficiency in mass transfer. The peak shape and peak concentration of RE in the leaching curve remain similar when the leaching solution flow rates are 0.8 mL/min and 1.2 mL/min, indicating that the mass transfer efficiency of RE remains consistent. In Figure 8b, it is evident that the leaching concentration of Al initially peaks and then sharply declines to zero with an increase in leachate volume. At a flow rate of 0.6 mL/min, the peak concentration of aluminum is the lowest, the peak shape is narrow, and the mass transfer efficiency is low.
The analysis of leaching curves for rare earths and aluminum at various flow rates was conducted using chromatographic plate theory. The calculated correlation parameters can be found in Table 8 and Table 9. Figure 9 displays the leach HETP curves for rare earths and aluminum. It illustrates that the HETP for rare earth leaching initially decreases, then rises, and finally decreases again as the flow rate of the compound leaching solution increases. Moreover, the mass transfer efficiency follows a pattern of increasing first and then decreasing. At a flow rate of 0.6 mL/min, the HETP of rare earth leaching is the lowest, the number of theoretical plates is the largest, and the RE mass transfer efficiency is the highest. The aluminum leaching’s theoretical plate height is observed to initially rise and then decrease as the flow rate of the leaching solution compound increases. The maximum theoretical plate height of aluminum leaching, accompanied by the minimum theoretical plate number and the lowest mass transfer efficiency of aluminum, occurs when the leaching solution flow rate is 1.0 mL/min. To optimize conditions, a flow rate of 0.6 mL/min was selected, resulting in the fastest RE mass transfer efficiency. This adjustment weakened the Al mass transfer process to a certain extent, which was conducive to strengthening the RE leaching and inhibiting the Al leaching.

3.5. Leaching Promoting Mechanism

3.5.1. Viscosity Analysis

Wu et al. [26] found that surfactants can reduce the viscosity of the leaching solution and improve the penetration efficiency of the leaching solution. Therefore, this paper studied the viscosity change in the leaching solution after adding CTAB. The viscosity of 2% ammonium sulfate, 2% ammonium sulfate and 0.00034 mol/L CTAB compound solution, 2% ammonium sulfate and 0.00103 mol/L CTAB compound solution, 2% ammonium sulfate and 0.00171 mol/L CTAB compound solution, and 2% ammonium sulfate and 0.00343 mol/L CTAB compound solution were determined by a Uchscher viscometer. The results are shown in Figure 10.
It can be seen from Figure 10 that the viscosity of the leaching solution can be reduced by adding a certain concentration of CTAB. But when the viscosity of CTAB exceeds the critical micelle concentration, the viscosity of the leaching solution increases, even higher than that of 2% ammonium sulfate solution, which is consistent with the result of the effect of CTAB compound concentration on the rare earth leaching process. That is, the addition of appropriate amount of CTAB can effectively reduce the viscosity of the leaching agent solution, accelerate the penetration speed of the leaching agent solution in the ore body, and effectively promote the mass transfer process of leaching.
According to Darcy’s sand permeability test, the permeability rate is [29]
K = C d 2 γ η
where K is permeability, md; C is a constant term, which depends on porosity and other factors; d is the ore particle size, mm; γ is the density of leaching solution, g/cm3; and η is the viscosity of the solution, mm2/s.
The C and d of the ore body are constant values and the permeability K is inversely proportional to the viscosity ŋ of the leach solution. Combined with the above viscosity test results, it shows that the surfactant can reduce the viscosity of the leaching solution to improve the permeability of the ore body and effectively improve the mass transfer efficiency of the rare earth leaching process.

3.5.2. Zeta Potential Analysis

Surfactant can change the surface potential of rare earth ore, so the surface Zeta potential of rare earth ore was measured in this paper. The raw rare earth ore and the different solutions were mixed and sonicated in an ultrasonic cleaner for 1 h to form a suspension, which was then allowed to stand for 15 min and their Zeta potentials were measured with a Zeta potential analyzer. The test results are shown in Figure 11.
From Figure 11, the surface Zeta potential of rare earth minerals is negative when the rare earth minerals are leached with water or ammonium sulfate, while the surface Zeta potential of rare earth minerals is positive when the cationic surfactant CTAB is added. The possible reason that the potential on the surface of rare earth minerals becomes positive is that the concentration of CTAB is excessive relative to the rare earth minerals, so the double layer adsorption is formed on the surface of rare earth minerals. CTAB acts on the mineral surface, increases the thickness of the diffusion electric double layer on the clay surface, reduces the Zeta potential, and reduces the negative electricity on the clay surface, thus inhibiting the expansion of clay minerals to a certain extent and strengthening the rare earth leaching process.

4. Conclusions

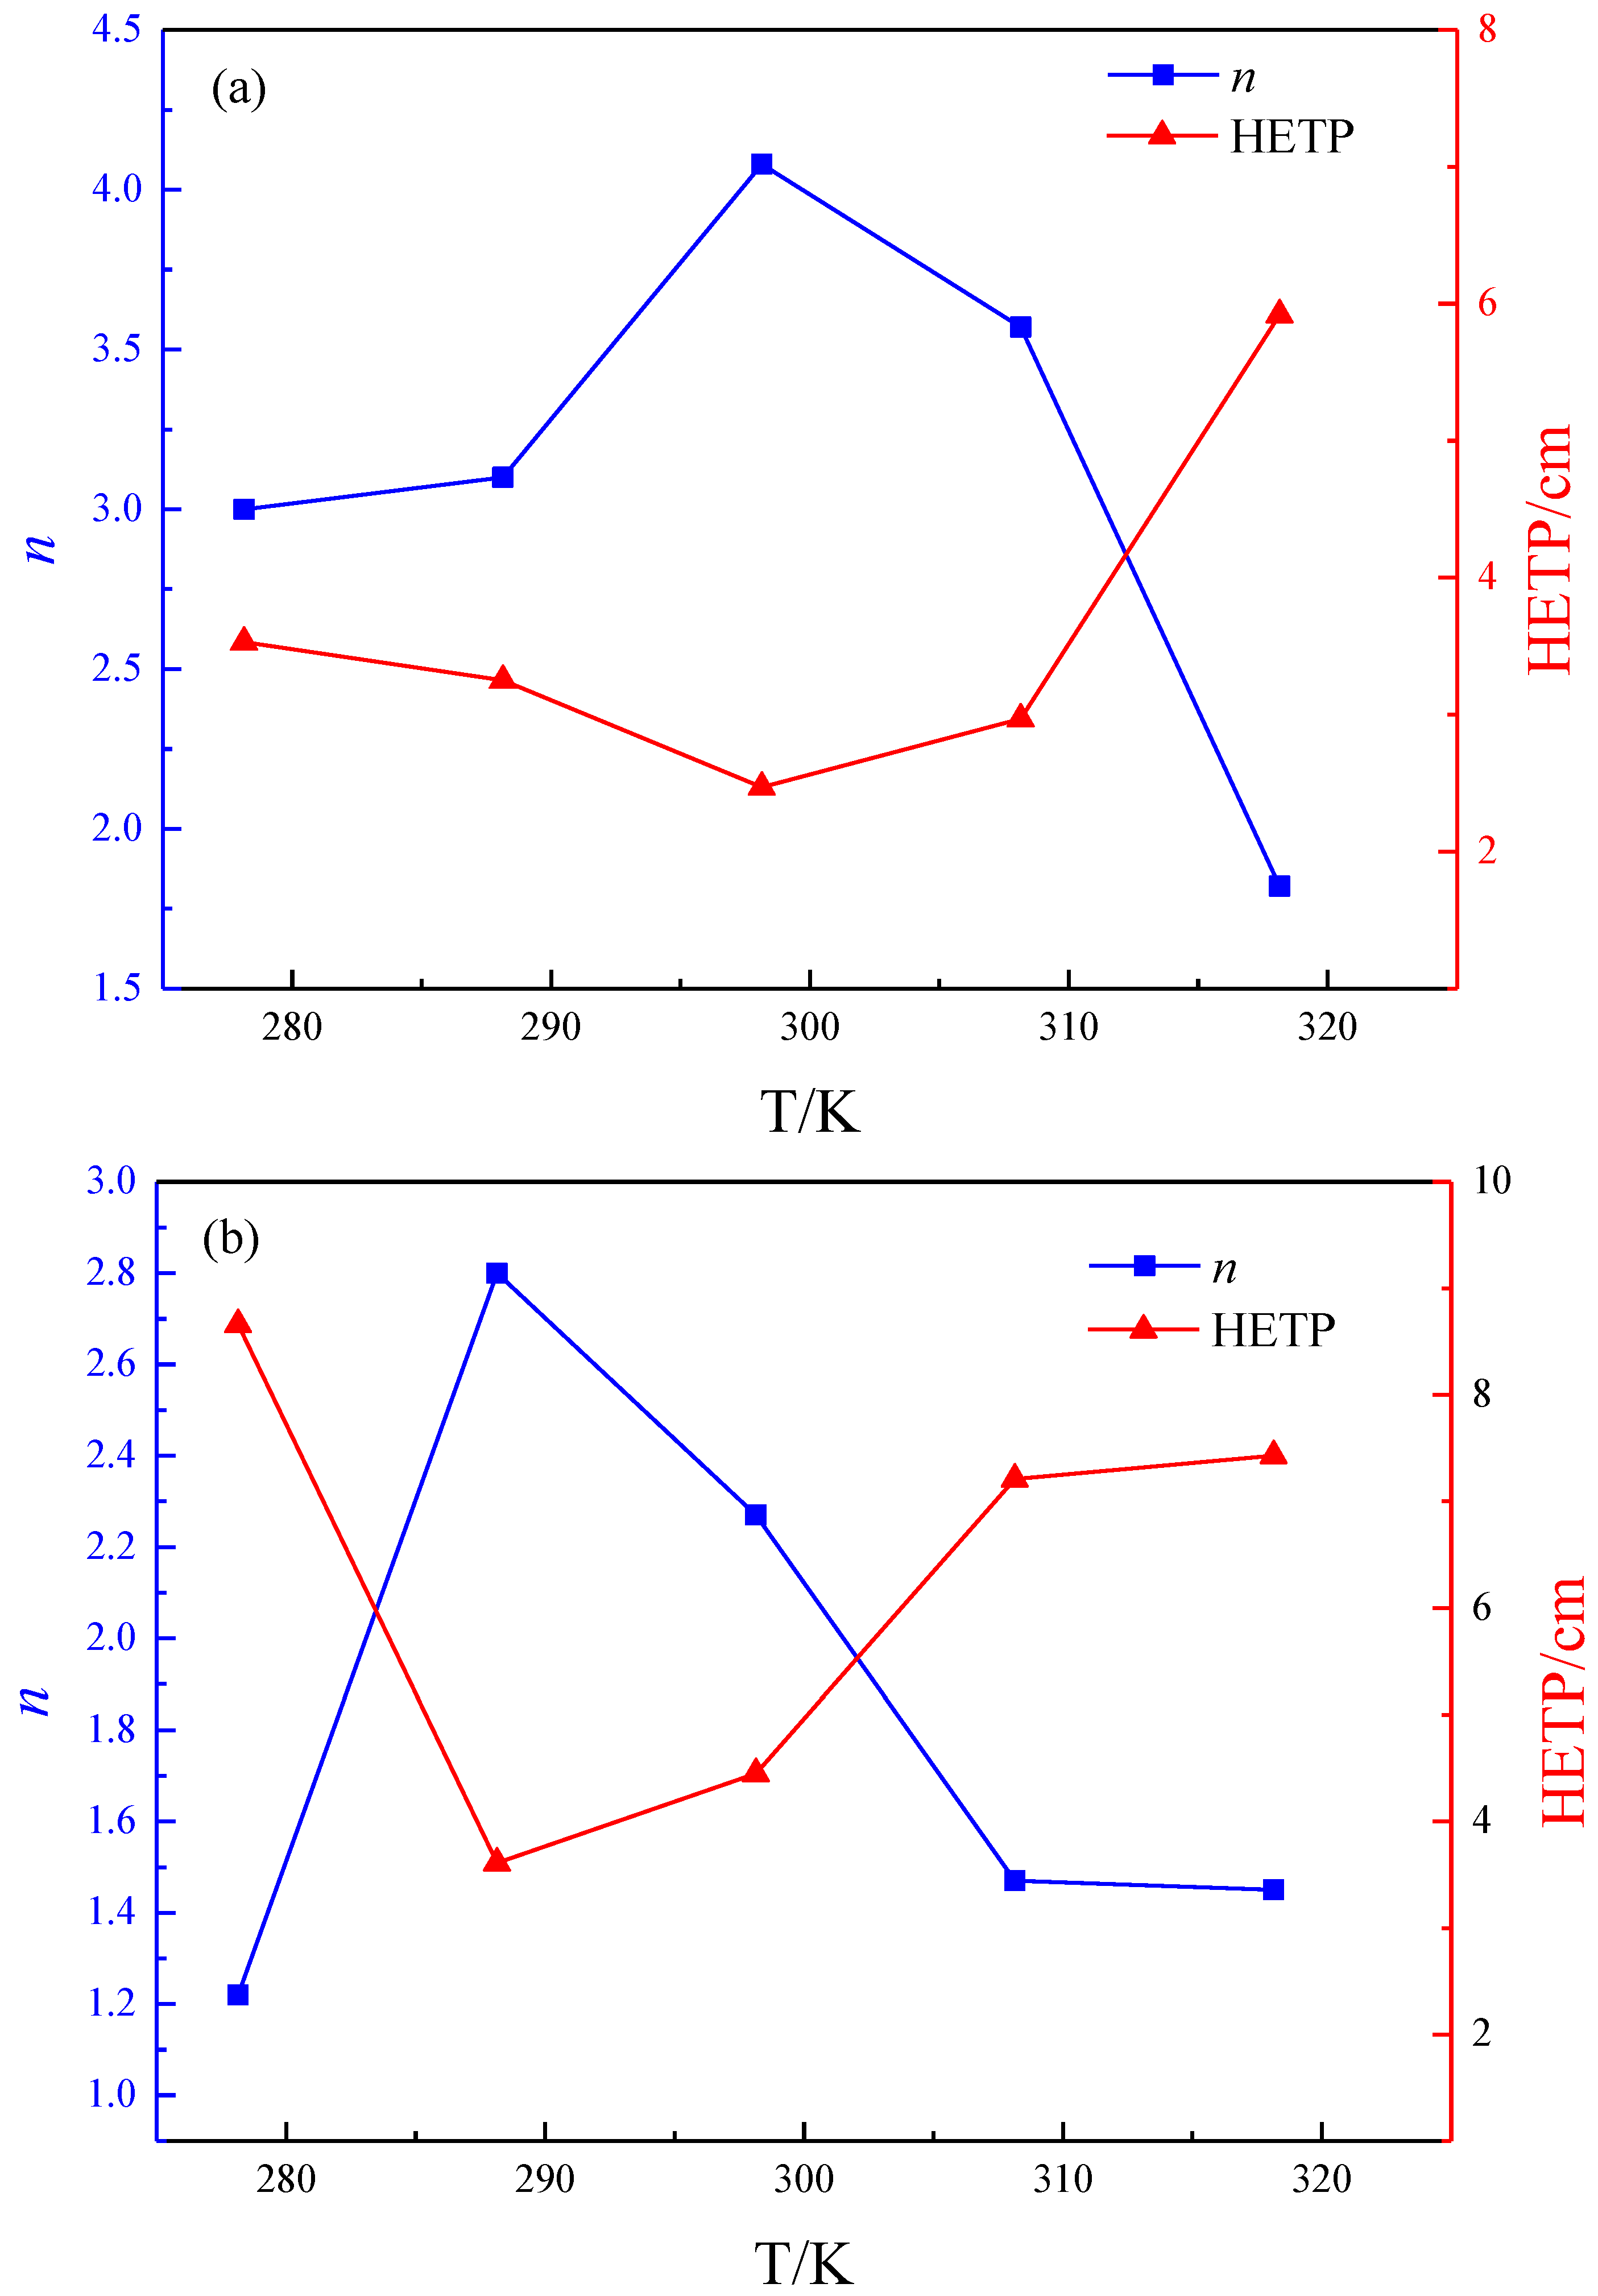
The addition of CTAB in ammonium sulfate leaching solution can effectively enhance the RE mass transfer process and inhibit the Al leaching. The optimal conditions are 0.00103 mol/L of the CTAB concentration, 0.6 mL/min of flow rate, pH 5.2–5.5 of the leaching solution, and room temperature. With the leaching temperature increases, the theoretical number plates for RE and Al leaching increases, resulting in a decrease in HETP, an increase in mass transfer driving force, and, ultimately, an improvement in mass transfer efficiency. Moreover, the RE mass transfer efficiency is higher than that of Al. When the temperature is too high, the HETP increases and the mass transfer efficiency decreases, indicating that summer is conducive to the leaching operation of weathered crust elution-deposited rare earth ore.
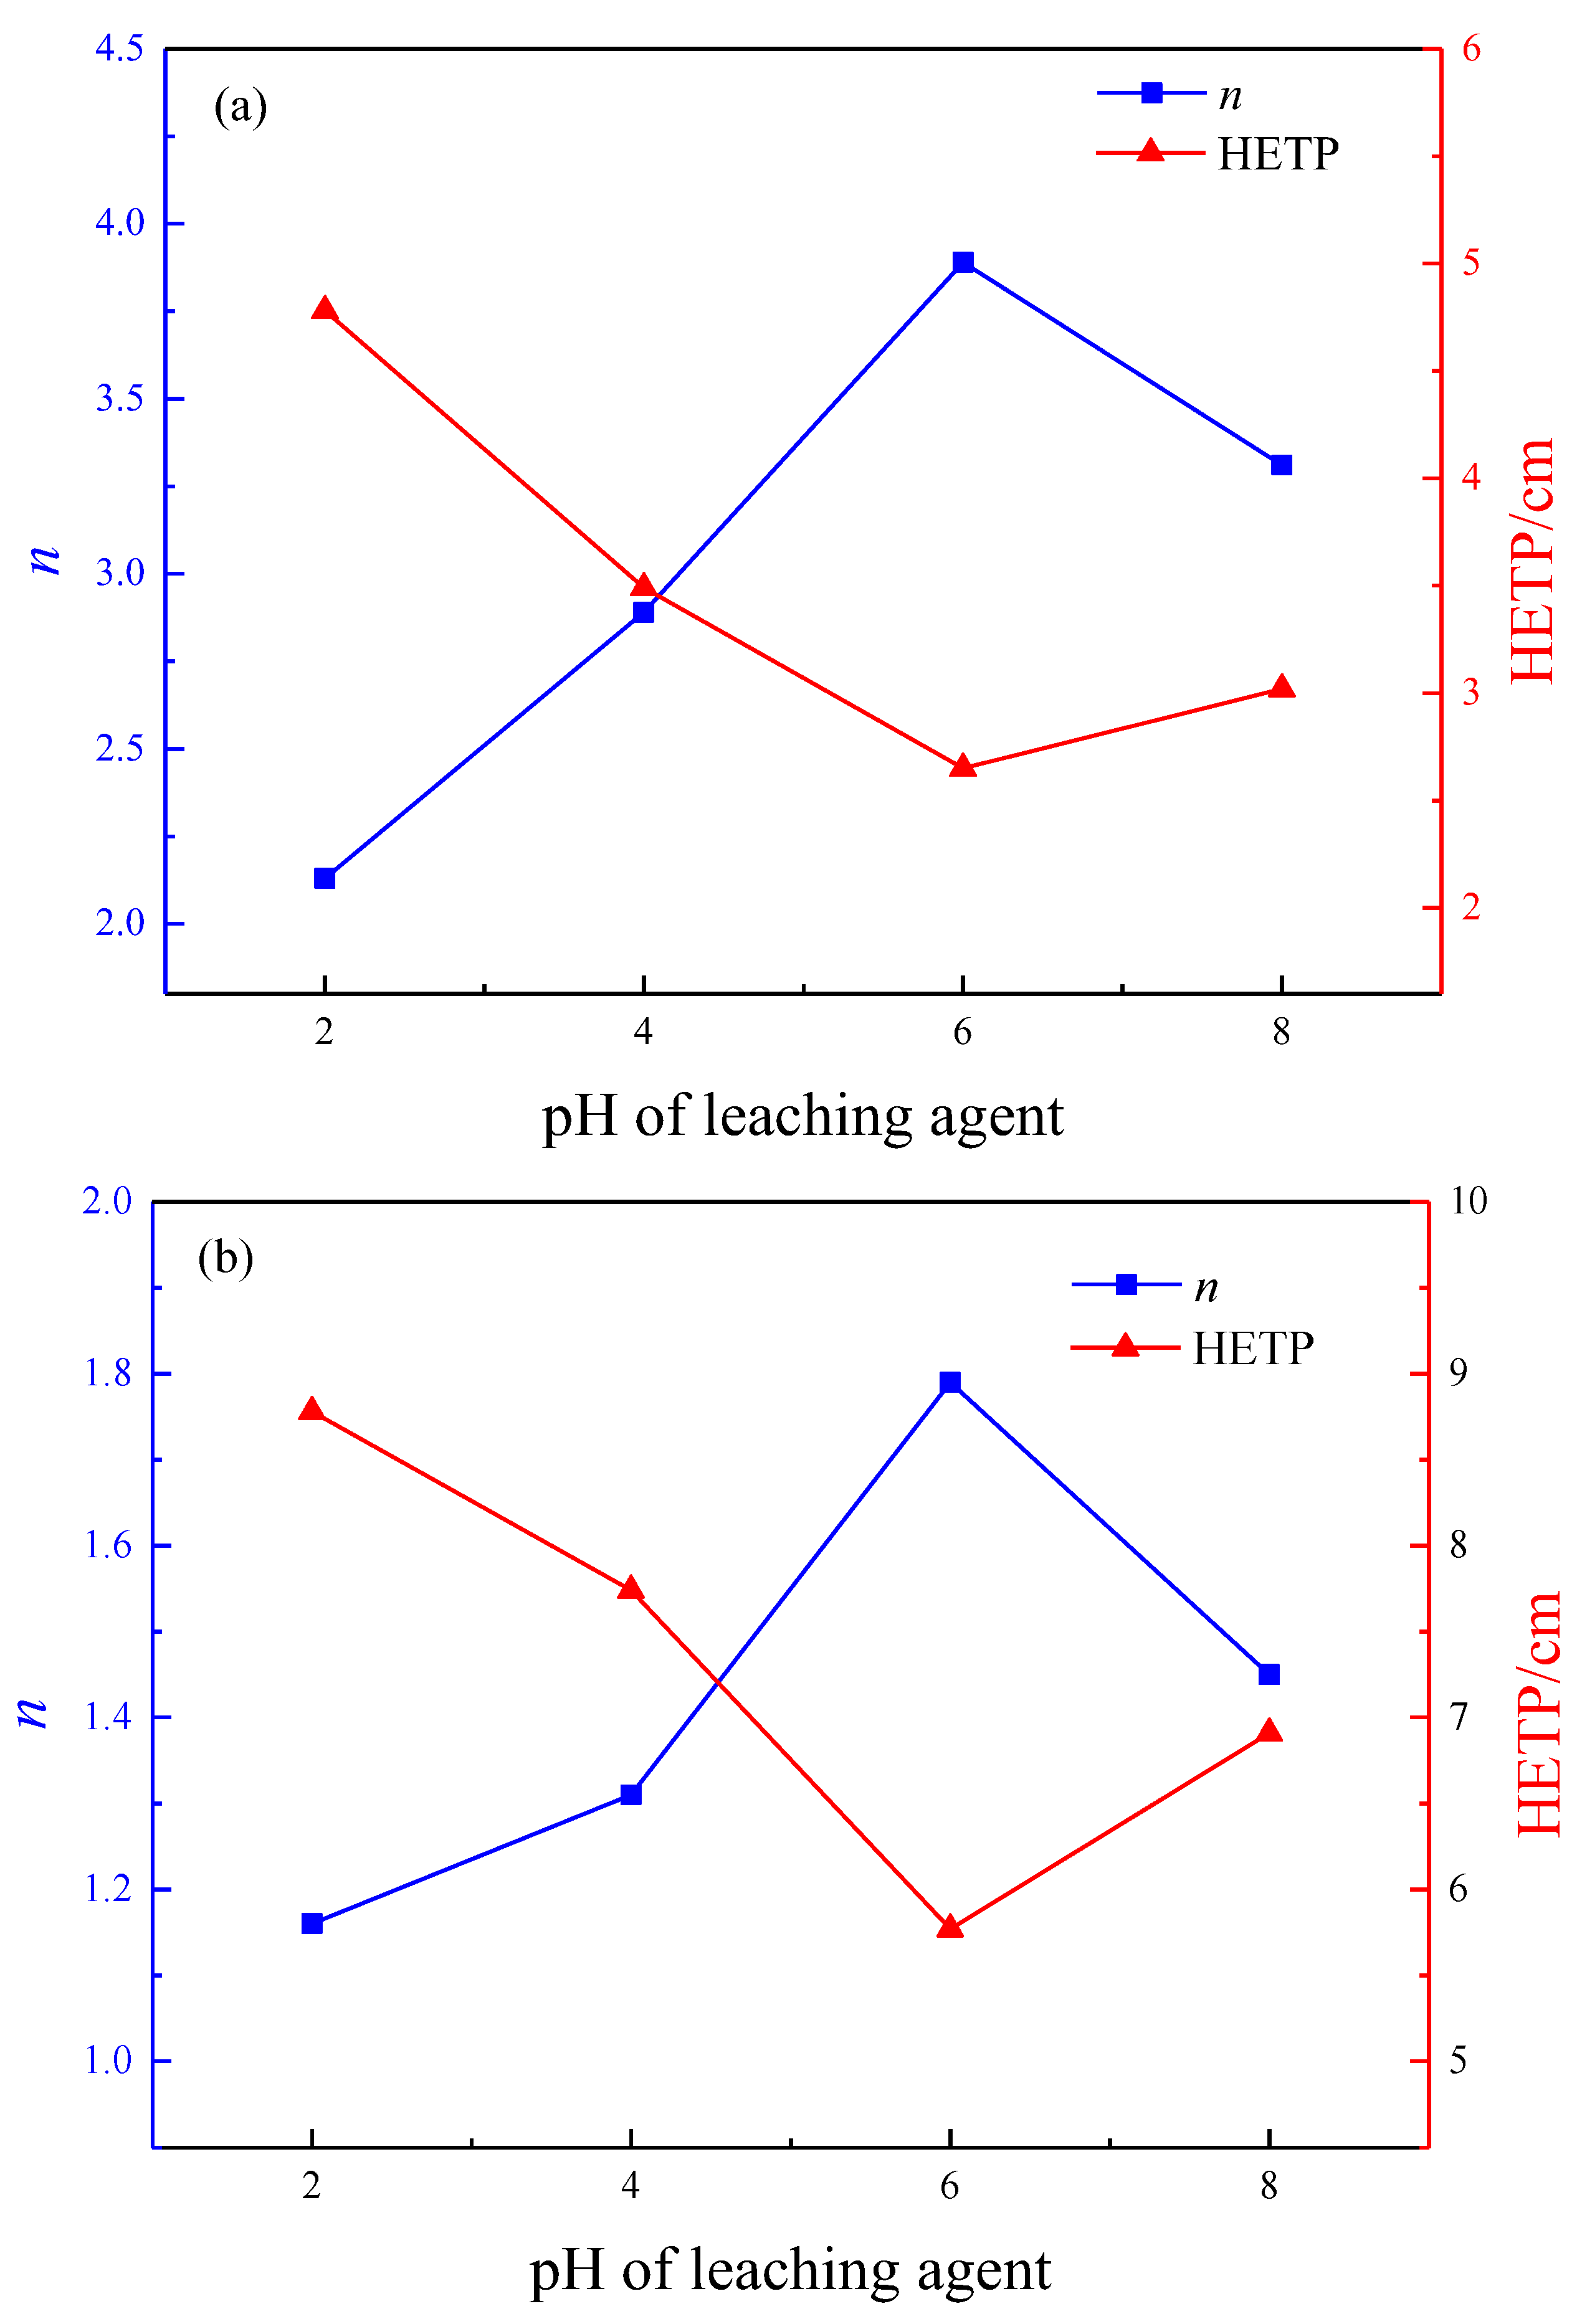
As the pH of the leaching solution increases, the theoretical number of plates for RE and Al leaching increases, while the HETP gradually decreases, leading to a higher mass transfer driving force and improved leaching mass transfer efficiency. Minimum HETP reached at pH 6. Due to the good pH buffering properties of clay minerals, there is no need to adjust the pH of the leaching solution in the leaching operation of rare earth ore. As the flow rate of the leaching solution increases, the theoretical number of RE plates increases and HETP decreases. The driving force for mass transfer in rare earth leaching is greater and the mass transfer efficiency is higher. As the HETP of aluminum increases, the efficiency of mass transfer decreases. Moreover, the efficiency of mass transfer for RE is greater than that of Al. When the optimal flow rate of the composite leaching agent is 0.6 mL/min, it has the highest RE mass transfer efficiency and inhibits Al leaching to a certain extent. This suggests that the compound leaching agent comprising ammonium sulfate and CTAB holds significant potential for practical utilization in extracting rare earth from weathered crust elution-deposited rare earth ore.

Author Contributions

Conceptualization, X.W. and J.F.; methodology, X.W.; software, X.W. and C.L.; validation, J.F.; formal analysis, X.W.; investigation, X.W.; resources, R.C.; data curation, X.W.; writing—original draft preparation, X.W.; writing—review and editing, X.W. and J.F.; visualization, F.Z.; supervision, J.F.; project administration, R.C.; funding acquisition, X.W. All authors have read and agreed to the published version of the manuscript.

Funding

This research was funded by the National Natural Science Foundation of China (No. 52204278) and the Natural Science Foundation of Wuhan Institute of Technology (No. K202265).

Data Availability Statement

Data are contained within the article.

Acknowledgments

Thanks for the great effort of the editors and reviewers.

Conflicts of Interest

The authors declare no conflicts of interest.

References

  1. Zeng, X.G.; Zeng, B.; Huang, L.J.H.; Zhong, L.; Li, X.D.; Huang, W.F. Adsorption of Y (III) on the interface of kaolinite-H2O: A DFT study. Minerals 2022, 12, 1128. [Google Scholar] [CrossRef]
  2. Feng, J.; Yu, J.; Huang, S.; Wu, X.; Zhou, F.; Xiao, C.; Xu, Y.; Chi, R. Effect of potassium chloride on leaching process of residual ammonium from weathered crust elution-deposited rare earth ore tailings. Miner. Eng. 2021, 163, 106800. [Google Scholar] [CrossRef]
  3. Zhou, B.; Li, Z.; Chen, C. Global potential of rare earth resources and rare earth demand from clean technologies. Minerals 2017, 7, 203. [Google Scholar] [CrossRef]
  4. Luo, X.P.; Zhang, Y.B.; Zhou, H.P.; He, K.Z.; Luo, C.G.; Liu, Z.S.; Tang, X.K. Review on the development and utilization of ionic rare earth ore. Minerals 2022, 12, 554. [Google Scholar] [CrossRef]
  5. Tian, J.; Tang, X.K.; Yin, J.Q.; Luo, X.P.; Rao, G.H. Process optimization on leaching of a lean weathered crust elution-deposited rare earth ores. Int. J. Miner. Process. 2013, 119, 83–88. [Google Scholar] [CrossRef]
  6. Ju, W.; Yang, J.H.; Yao, C.; Zhang, X.B.; Ye, Z.W.; Liu, D. Experimental study on the permeability of rare earths with different particle composition for a novel heap leaching technology. Appl. Sci. 2022, 12, 11368. [Google Scholar] [CrossRef]
  7. Binnemans, K.; Jones, P.; Blanpain, B.; Gerven, T.; Yang, Y.; Walton, A.; Buchert, M. Recycling of rare earths: A critical review. J. Clean. Prod. 2013, 51, 1–22. [Google Scholar] [CrossRef]
  8. Chen, Z. Global rare earth resources and scenarios for future rare earth industry. J. Rare Earths 2011, 29, 1–6. [Google Scholar] [CrossRef]
  9. Mancheri, N.; Sprecher, B.; Bailey, G.; Ge, J.; Tukker, A. Effect of Chinese policies on rare earth supply chain resilience. Resour. Conserv. Recy. 2019, 142, 101–112. [Google Scholar] [CrossRef]
  10. Huang, X.; Long, Z.; Li, H. Development of rare earth hydrometallurgy technology in China. J. Rare Earths 2005, 23, 1–4. [Google Scholar] [CrossRef]
  11. Zhou, L.B.; Yang, J.; Kang, S.J.; Wang, X.J.; Yu, H.D.; Wan, Y.H. Enhancing leaching efficiency of ion adsorption rare earths by ameliorating mass transfer effect of rare earth ions by applying an electric field. J. Rare Earths, 2023; in press. [Google Scholar] [CrossRef]
  12. He, Z.; Zhang, Z.; Yu, J.; Zhou, F.; Xu, Y.; Xu, Z.; Chen, Z.; Chi, R. Kinetics of column leaching of rare earth and aluminum from weathered crust elution-deposited rare earth ore with compound ammonium salt. Hydrometallurgy 2016, 163, 33–39. [Google Scholar] [CrossRef]
  13. Moldoveanu, G.A.; Papangelakis, V.G. Recovery of rare earth elements adsorbed on clay minerals: II. Leaching with ammonium sulfate. Hydrometallurgy 2013, 131, 158–166. [Google Scholar] [CrossRef]
  14. Yang, L.F.; Li, C.C.; Wang, D.S.; Li, F.Y.; Liu, Y.Z.; Zhou, X.Z.; Liu, M.B.; Wang, X.F.; Li, Y.X. Leaching ion adsorption rare earth by aluminum sulfate for increasing efficiency and lowering the environmental impact. J. Rare Earths 2019, 37, 429–436. [Google Scholar] [CrossRef]
  15. Chi, R.; Wang, D. Rare Earth Mineral Processing; Science Press: Beijing, China, 2014. [Google Scholar]
  16. Shi, Q.Y.; Zhao, Y.; Meng, X.Y.; Shen, L.; Qiu, G.Z.; Zhang, X.G.; Yu, H.; He, X.; He, H.J.; Zhao, H.B. Column leaching of ion adsorption rare earth ore at low ammonium concentration. J. Mater. Res. Technol. 2022, 19, 2135–2145. [Google Scholar] [CrossRef]
  17. Li, Y.; Fu, Y.; Chen, J. Analysis on the changes of permeability of rare earth and its causes under different content rations of ore. Min. Res. Dev. 2018, 38, 117–120. [Google Scholar]
  18. Liang, T. Study on the Permeability Characteristics of Ionic Rare Earth Ores and the Effects on Leaching. Master’s Thesis, Jiangxi University of Science and Technology, Ganzhou, China, 2019. [Google Scholar]
  19. Tang, X.; Tian, J.; Yin, J.; Luo, X. Research on aid-leaching rare earth from low-grade weathered crust elution-deposited rare earth ore with sesbania gum. Nonferr. Met. Sci. Eng. 2013, 4, 85–89. [Google Scholar]
  20. Tian, J.; Yin, J.; Tang, X.; Chen, J.; Luo, X.; Rao, G. Enhanced leaching process of a low-grade weathered crust elution-deposited rare earth ore with carboxymethyl sesbania gum. Hydrometallurgy 2013, 139, 124–131. [Google Scholar] [CrossRef]
  21. Feng, J.; Zhou, F.; Chi, R.; Liu, X.; Xu, Y.; Liu, Q. Effect of a novel compound on leaching process of weathered crust elution-deposited rare earth ore. Miner. Eng. 2018, 129, 63–70. [Google Scholar] [CrossRef]
  22. Wu, Y.; Meng, J.; Chen, M.; Fan, B.; Ju, M.; Zhang, J. Study on permeation-promoter application in heap leaching process of uranium ores. Uranium Min. Metall. 2007, 26, 72–78. [Google Scholar]
  23. Fang, F.; Zhong, H.; Jiang, F. Influence of surfactants on bioleaching of arsenic-containing gold concentrate. J. Cent. South Univ. 2014, 21, 3963–3969. [Google Scholar] [CrossRef]
  24. Ai, C.; Wu, A.; Wang, Y. Optimization and mechanism of surfactant accelerating leaching test. J. Cent. South. Univ. 2016, 23, 1032–1039. [Google Scholar] [CrossRef]
  25. Chen, M.; Mei, J.; Ye, H.; Yang, Y.; Li, J.; Du, D.; Chen, N. A study on acid leaching with low-grade manganese carbonate ore in CTAB. China’s Manganese Ind. 2016, 34, 81–85. [Google Scholar]
  26. Liu, C.; Ma, J.; Qin, Y.; Wu, Z.; Wang, C. Effect of surfactants on leaching of potassium from phosphorus-potassium associated ore. J. Wuhan Inst. Technol. 2017, 39, 536–540. [Google Scholar]
  27. Lee, W.; Tsai, G.; Tsao, G. Analysis of chromatography by plate theory. Sep. Technol. 1993, 3, 178–197. [Google Scholar] [CrossRef]
  28. Aydogan, S.; Ucar, G.; Canbazoglu, M. Dissolution kinetics of chalcopyrite in acidic potassium dichromate solution. Hydrometallurgy 2006, 81, 45–51. [Google Scholar] [CrossRef]
  29. Wu, A.; Ai, C.; Wang, Y.; Hu, K. Influence of surfactant on permeability of heap leaching of copper ore. J. Cent. South. Univ. (Sci. Technol.) 2014, 45, 895–901. [Google Scholar]
Figure 1. Schematic diagram of the experimental apparatus.
Minerals 14 00321 g001
Figure 2. Effect of the CTAB compound concentration on the leaching curves of (a) RE and (b) Al.
Minerals 14 00321 g002
Figure 3. Theoretical plate number and HETP at different CTAB compound concentrations: (a) RE and (b) Al.
Minerals 14 00321 g003aMinerals 14 00321 g003b
Figure 4. Effect of leaching temperature on the leaching curves of (a) RE and (b) Al.
Minerals 14 00321 g004
Figure 5. Theoretical plate number and HETP at different leaching temperatures: (a) RE and (b)Al.
Minerals 14 00321 g005
Figure 6. Effect of compound leaching agent pH on the leaching curves of (a) RE and (b) Al.
Minerals 14 00321 g006
Figure 7. Theoretical plate number and HETP at different pH values of leaching agent: (a) RE and (b) Al.
Minerals 14 00321 g007
Figure 8. Effect of leaching agent flow rate on the leaching curves of (a) RE and (b) Al.
Minerals 14 00321 g008
Figure 9. Theoretical plate number and HETP under different flow rates: (a) RE and (b)Al.
Minerals 14 00321 g009
Figure 10. Comparison of the viscosity of different extracts.
Minerals 14 00321 g010
Figure 11. Comparison of Zeta potentials.
Minerals 14 00321 g011
Table 1. Mineral composition.
Mineral TypesQuatzMetahalloysiteKaoliniteMuscoviteDolomiteMicaMicrocline
Composition ratio/%26.75.918.714.02.022.89.9
Table 2. Leach HETP and correlation coefficient of RE under different CTAB compound concentrations.
Concentration/(mol/L)L/cmVR/mLV1/2/mLnHETP/cm
010.3026.0742.782.065.00
0.0003410.3024.1832.753.023.41
0.0006910.6027.2336.213.143.38
0.0010310.1023.3327.194.082.47
0.0013710.5032.2946.242.703.88
0.0017110.1027.8540.232.663.80
0.0034310.2022.2135.332.194.65
Table 3. Leach HETP and correlation coefficient of Al under different CTAB compound concentrations.
Concentration/(mol/L)L/cmVR/mLV1/2/mLnHETP/cm
010.3021.5027.783.323.10
0.0003410.3017.9041.471.039.97
0.0006910.6016.5330.251.666.40
0.0010310.1019.2630.102.274.45
0.0013710.5020.7743.171.288.18
0.0017110.1021.2033.852.174.65
0.0034310.2023.2534.752.484.11
Table 4. Leach HETP and correlation coefficient of RE under different leaching temperatures.
Temperature/KL/cmVR/mLV1/2/mLnHETP/cm
278.1510.6017.8224.213.003.53
288.1510.1026.8835.923.103.25
298.1510.1023.3327.194.082.47
308.1510.6018.7623.393.572.97
318.1510.8018.3632.011.825.92
Table 5. Leach HETP and correlation coefficient of Al under different leaching temperatures.
Temperature/KL/cmVR/mLV1/2/mLnHETP/cm
278.1510.6012.9927.661.228.66
288.1510.1021.0229.592.803.61
298.1510.1019.2630.102.274.45
308.1510.6015.3729.851.477.21
318.1510.8011.3622.191.457.43
Table 6. Leach HETP and correlation coefficient of RE under different leaching agent pH values.
pHL/cmVR/mLV1/2/mLnHETP/cm
210.2027.9945.112.134.78
410.1022.0330.502.893.49
610.3022.9627.413.892.65
810.0036.3347.003.313.02
Table 7. Leach HETP and correlation coefficient of Al under different leaching agent pH values.
pHL/cmVR/mLV1/2/mLnHETP/cm
210.2022.3448.821.168.78
410.1017.1735.391.317.74
610.3019.0533.571.795.77
810.0021.8442.741.456.91
Table 8. Leach HETP and correlation coefficient of RE under different flow rates of leaching agent.
Flow Rate/(mL/min)L/cmVR/mLV1/2/mLnHETP/cm
0.410.6022.3989.540.3530.57
0.610.1023.3327.194.082.47
0.810.8020.0930.162.464.39
1.010.6029.8569.821.0110.46
1.210.8021.1638.901.646.58
Table 9. Leach HETP and correlation coefficient of Al under different flow rates of leaching agent.
Flow Rate/(mL/min)L/cmVR/mLV1/2/mLnHETP/cm
0.410.6016.9825.582.444.34
0.610.1019.2630.102.274.45
0.810.8017.1028.661.975.47
1.010.6021.7645.621.268.40
1.210.8018.3134.331.586.85
Disclaimer/Publisher’s Note: The statements, opinions and data contained in all publications are solely those of the individual author(s) and contributor(s) and not of MDPI and/or the editor(s). MDPI and/or the editor(s) disclaim responsibility for any injury to people or property resulting from any ideas, methods, instructions or products referred to in the content.

