Pore Structure and Fractal Characteristics of Niutitang Shale from China
by
Zhaodong Xi
1,2,3, 
Shuheng Tang
1,2,3,*,
Jing Wang
1,2,3,
Junjie Yi
4,
Yingying Guo
1,2,3 and
Kaifeng Wang
1,2,3 1
School of Energy Resource, China University of Geosciences (Beijing), Beijing 100083, China
2
Key Laboratory of Marine Reservoir Evolution and Hydrocarbon Enrichment Mechanism, Ministry of Education, Beijing 100083, China
3
Key Laboratory of Strategy Evaluation for Shale Gas, Ministry of Land and Resources, Beijing 100083, China
4
China Metallurgical Geology Bureau, Institute of Mineral Resources Research Beijing, Beijing 100083, China
*
Author to whom correspondence should be addressed.
Minerals 2018, 8(4), 163; https://0-doi-org.brum.beds.ac.uk/10.3390/min8040163
Submission received: 14 March 2018
/
Revised: 9 April 2018
/
Accepted: 12 April 2018
/
Published: 17 April 2018
Abstract
:A suite of shale samples from the Lower Cambrian Niutitang Formation in northwestern Hunan Province, China, were investigated to better understand the pore structure and fractal characteristics of marine shale. Organic geochemistry, mineralogy by X-ray diffraction, porosity, permeability, mercury intrusion and nitrogen adsorption and methane adsorption experiments were conducted for each sample. Fractal dimension D was obtained from the nitrogen adsorption data using the fractal Frenkel-Halsey-Hill (FHH) model. The relationships between total organic carbon (TOC) content, mineral compositions, pore structure parameters and fractal dimension are discussed, along with the contributions of fractal dimension to shale gas reservoir evaluation. Analysis of the results showed that Niutitang shale samples featured high TOC content (2.51% on average), high thermal maturity (3.0% on average), low permeability and complex pore structures, which are highly fractal. TOC content and mineral compositions are two major factors affecting pore structure but they have different impacts on the fractal dimension. Shale samples with higher TOC content had a larger specific surface area (SSA), pore volume (PV) and fractal dimension, which enhanced the heterogeneity of the pore structure. Quartz content had a relatively weak influence on shale pore structure, whereas SSA, PV and fractal dimension decreased with increasing clay mineral content. Shale with a higher clay content weakened pore structure heterogeneity. The permeability and Langmuir volume of methane adsorption were affected by fractal dimension. Shale samples with higher fractal dimension had higher adsorption capacity but lower permeability, which is favorable for shale gas adsorption but adverse to shale gas seepage and diffusion.
1. Introduction
Shale gas status can be divided into three categories: adsorbed gas, free gas and solution gas [1,2]. The strong heterogeneity of the characteristics and structure of shale porosity leads to different shale gas storage and transition mechanisms, which makes it difficult to predict the spatial distribution and availability of shale gas [3]. Shale is typically characterized as an intricate and heterogeneous porous media with complex pore systems, thanks to its wide-ranging pore size distribution (PSD), varied pore types and multiple pore geometries [4]. Therefore, the evaluation of shale pore structure is an interesting topic that is critical for shale gas exploration [5,6,7].
Many experimental methods, both qualitatively and quantitatively, have been used to characterize pores, such as scanning electron microscopy (SEM), focused ion beam-scanning electron microscopy (FIB-SEM), mercury intrusion, gas adsorption, small-angle or ultra-small angle neutron scattering and nuclear magnetic resonance (NMR). Among these methods, N2 Physisorption analysis is a convenient and effective way to investigate the pore characteristics of shale [8,9,10]. PSD, pore geometry, pore volume (PV) and specific surface area (SSA) can be analyzed based on N2 adsorption–desorption isotherms. Moreover, fractal analysis is an effective and widely-used method to quantitatively characterize heterogeneous pore structure in shale, which can also be applied based on N2 physisorption experiments.
Fractal characteristics of coals and shales have been studied extensively [11,12,13,14]. For example, Yao et al. studied the fractal characteristics of coals with different maturity and the relationships among coal constituents and coal rank and fractal dimensions were discussed [11,12]. Fractal dimensions of the pores in Longmaxi shale were obtained by Ji et al. and the relationships between shale constituents and pore structure parameters and fractal dimensions were investigated [14]. These fractal-related studies of shales and coals are helpful for understanding pore characteristics and evaluating natural gas accumulation in shales.
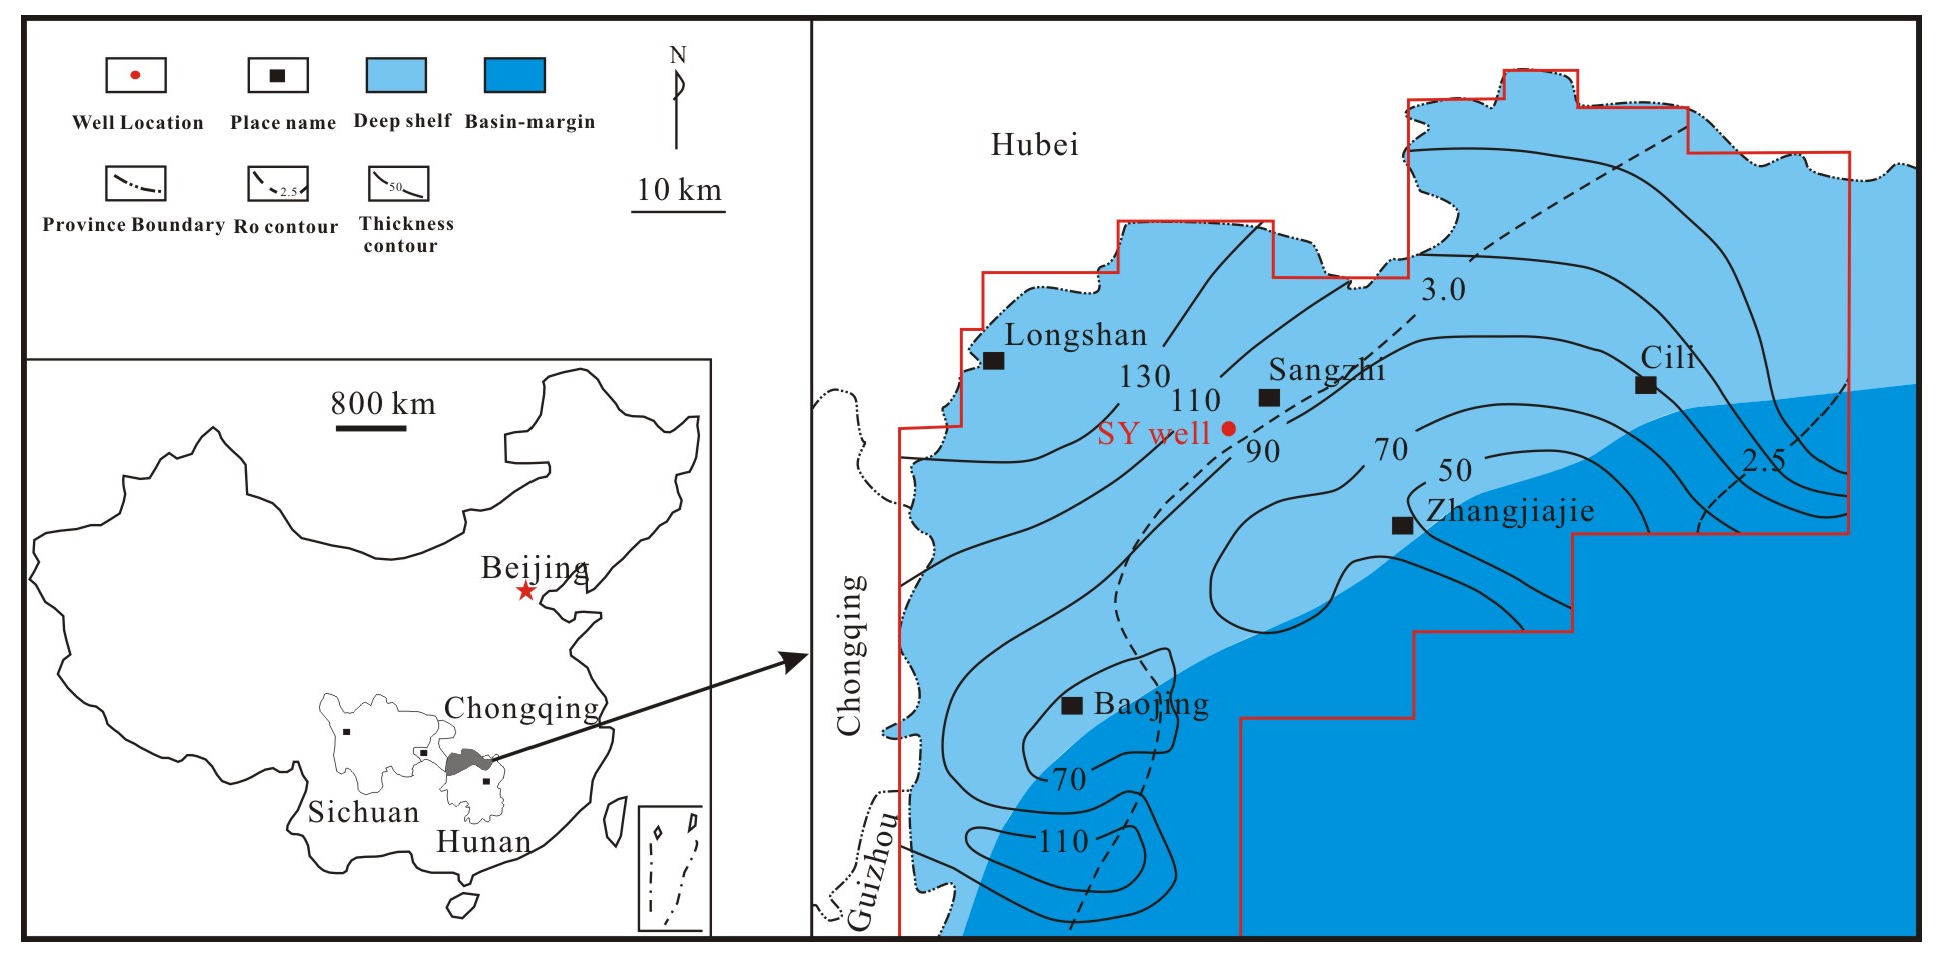
Following the success of marine gas shale in the Sichuan Basin, China [15,16,17], exploration and development of shale gas in nearby regions, such as Hunan Province to the northwest, has progressed remarkably in recent years [18,19,20,21]. Lower Cambrian Niutitang shale is widely distributed in the northwestern Hunan Province and was recently selected as the next main target for shale gas resource exploration and industrial development (Figure 1). It is typical marine sediment carbonaceous and black shale in the lower section and dark-grey silty shale in the upper section [22,23]. In recent years, many studies have been carried out on the lithofacies, geochemistry and mineralogy of the Niutitang Formation [21,24,25], although there is a lack of information on pore structure and fractal characteristics. Therefore, the aim of this study is to examine the pore structure and fractal characteristics of the Niutitang Formation from northwestern Hunan Province, China.
2. Samples and Methods
2.1. Samples
Well SY (Sangye) reaches a depth of 1136.84 m in the study area, revealing the Lower Cambrian Niutitang Formation between 987 m and 1082 m (Figure 1) and 10 shale samples from the Formation were collected from this well (Table 1). All samples were evaluated based on X-ray diffraction (XRD), total organic carbon (TOC) content, maceral compositions, rock pyrolysis, mercury intrusion, N2 physisorption, methane adsorption, helium porosity and pulse decay permeability tests.
2.2. Experimental Methods
TOC content was measured using a Leco CS230 carbon/sulfur analyzer (LECO Corporation, St. Joseph, MI, USA). The shale samples, each weighing about 1 g, were crushed to a powder at 100–200 mesh sizing and placed in a porous crucible with 5% hydrochloric acid for 2 h to remove carbonates. Then the samples were cleaned using distilled water. Afterwards, the samples were dried at 70 °C for 12 h before measuring TOC content.
Thermal maturity is commonly evaluated using vitrinite reflectance (Ro). Little vitrinite can be found in marine shale samples in general but solid bitumen reflectance (BRr) can take the place of vitrinite reflectance (VRr) based on the equation VRr = (BRr + 0.2443)/1.0495 [26]. Reflectance values were tested using random solid bitumen in non-polarized light under oil immersion and at least 20 readings were taken for each sample. Shale samples were crushed to approximately 100 mesh sizing and then a Rock-Eval 6 Instrument (OG2000V, Vinci Technologies SA, Nanterre, France) was tested for carrying out pyrolysis. Parameters including free oil or volatile hydrocarbon content (mg HC/g rock (S1)) and the remaining hydrocarbon generation potential (mg HC/g rock (S2)) were obtained. Kerogen isolation was performed for all samples and the isolated kerogen was used to determine the maceral composition. Details on the experimental process and interpretive guidelines can be found in reference [27].
The XRD experiment was performed using a ZJ207 Bruker D8 advance X-ray diffractometer (Bruker, Karlsruhe, Germany). The shale samples were crushed to less than 300 mesh sizing and mixed with ethanol, hand ground in a mortar and pestle and then smear-mounted on glass slides for XRD analysis. The X-ray diffractometer with a Cu X-ray tube was operated at 40 kV and 30 mA scanning from 2° to 70° at a step of 0.02° and the data were semi-quantified by Jade® 6.0 software (Jade Software, Christchurch, New Zealand).
The shale samples were prepared to have a height of 2.5 cm and a cylindrical shape with a diameter of 2.5 cm and then porosity measurements were conducted using an Ultrapore-200A Helium Porosimeter (Core Laboratories, Tulsa, OK, USA) at 25 °C and 0.07 MPa. Sample porosity was determined using bulk density in combination with skeletal density [28]. The permeability measurements were conducted using a pulse-decay permeameter (TEMCO PDP-200, Petrolabs, Beijing, China) with dry nitrogen as the medium.
Mercury intrusion was performed using a Quantachrome Poremaster (PM-33-13, Quantachrome, Boynton Beach, FL, USA). The samples were first crushed to less than 20 mesh sizing and weighed at 3–5 g, then they were dried at 110 °C for at least 24 h under a vacuum in an oven. The mercury injection pressure ranged from 0 to 215 MPa in this experiment, meaning that pores as small as 6 nm could be detected. A low-temperature N2 physisorption experiment was conducted on a Micromeritics ASAP 2020 surface area analyzer (Micromeritics Instrument, Norcross, GA, USA). The procedure involved using 3–5 g of a 60–80 mesh sample and then drying it at 110 °C for at least 5 h to remove adsorbed moisture and capillary water and then N2 adsorption/desorption isotherms were obtained at 77.35 K and less than 760 mmHg. The Multi-point Brunauer-Emmett-Teller (BET) model was applied to obtain the SSA and the Barrette-Joynere-Halenda (BJH) model was used for PV and PSD [29,30]. Micropore SSA and PV can be estimated using the t-plot method based on the N2 adsorption [31] and Wei et al. showed that the micropore SSA and PV from the t-plot and CO2 adsorption analysis are similar and linearly related [32].
Methane adsorption was conducted using a high-pressure gas sorption and desorption instrument from a HPVA Isotherm Measurement System. Samples weighing 100–150 g were crushed to 60–80 mesh sizing and three main procedures were followed: (1) leak testing; (2) void volume determination; and (3) methane adsorption. The experimental procedure is described in detail in the literature [33,34].
2.3. Fractal Theory
Mandelbrot first proposed fractal concepts and geometry for evaluating the complex shapes of objects found in nature [35] and the geometry of coal or shale pores is a typical example of such shapes. Many previous studies have used fractal theory to evaluate the pore heterogeneity of shale, coal, or sandstone [11,12,13,36,37,38,39]. Fractal dimension D is frequently used as a parameter to quantitatively characterize the heterogeneous pore structure of shale [40]. Fractal dimension D ranges from 2 to 3, where a fractal dimension D = 2 represents a regular and smooth surface and higher D values indicate more irregular or rougher surfaces, or inhomogeneous pore structure. Many methods, including the Langmuir model, thermodynamic method and the Frenkel-Halsey-Hill (FHH) model, are used to calculate fractal dimension [41,42,43]. Among these, the FHH model is widely used and has been shown to be the most effective method for describing the irregular geometric and structural properties of shale [44,45,46]. Fractal dimension D can be calculated independently via the FHH equation combined with N2 adsorption isotherm data and the detailed process to derive fractal dimension D is discussed in Qi et al. [47].
The FHH equation is:
In Equation (1), V (cm3/g) is the volume of adsorbed gas, P (MPa) is the equilibrium pressure, P0 (MPa) is the saturated vapor pressure, C is a characteristic constant and D is the fractal dimension.
3. Results
3.1. Organic Geochemistry
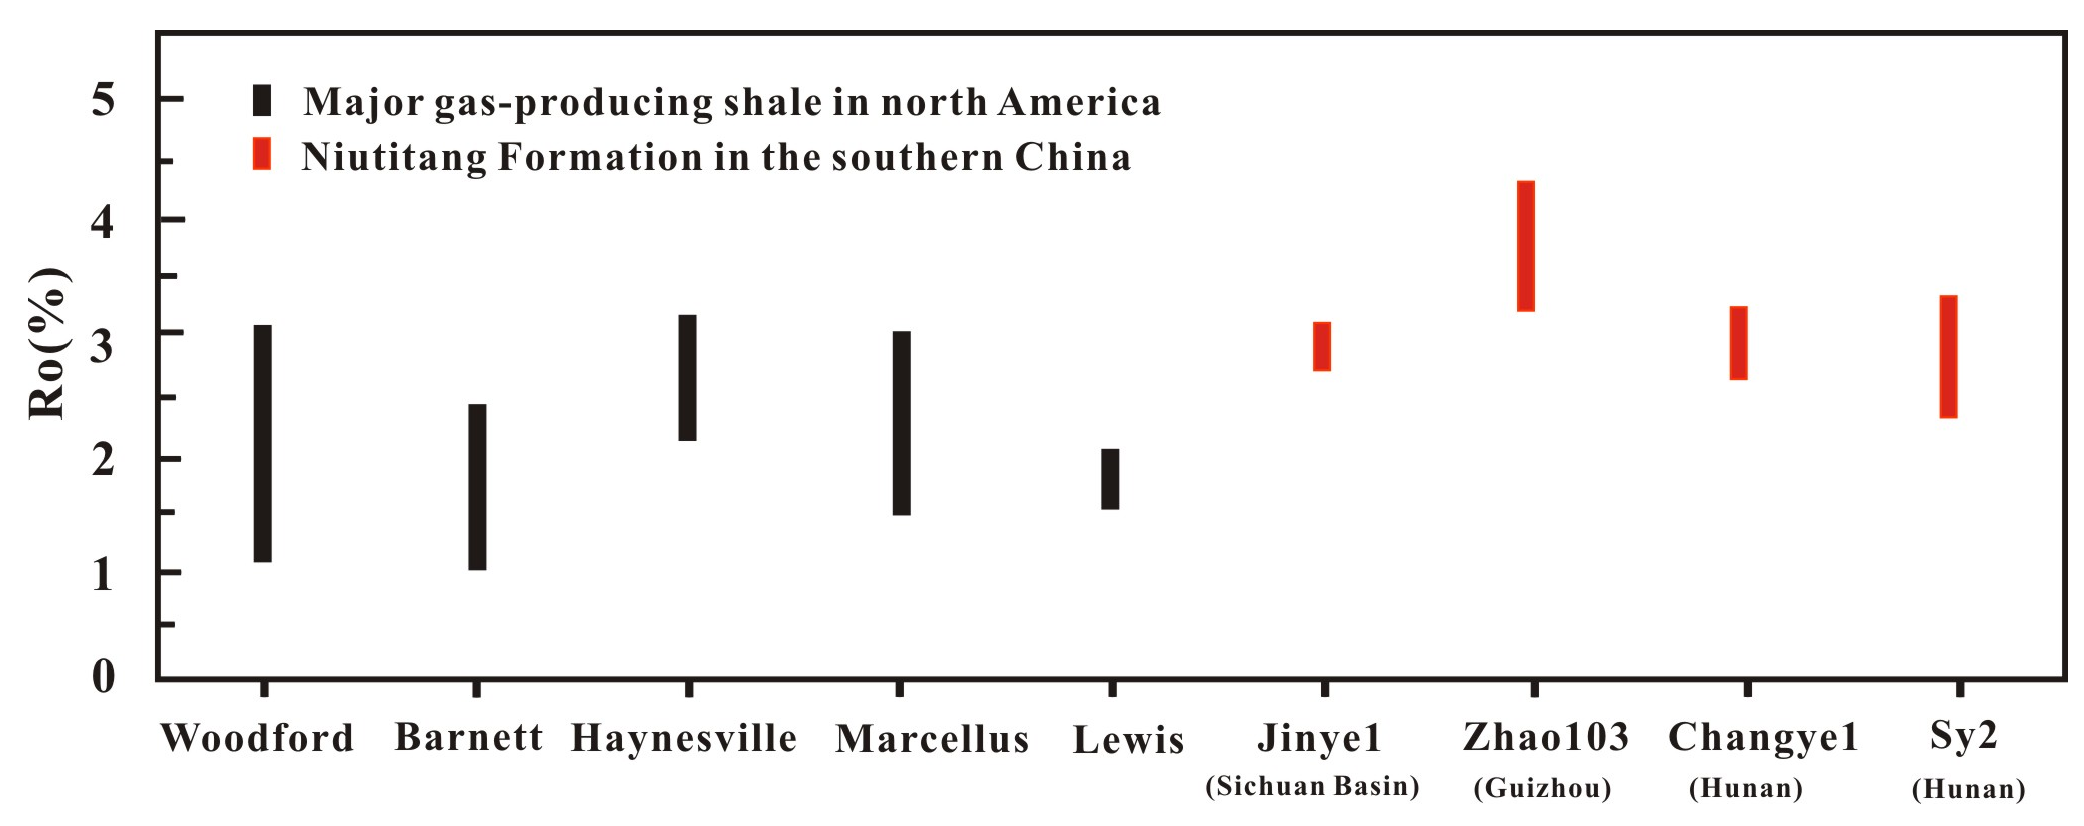
The TOC content is between 0.58% and 7.06%, with an average of 2.51%. The primary maceral of the OM (organic matter) is amorphous sapropel, with a mean value of 85.8%. Amorphous sapropel indicates that the shale contains mainly Type II1 kerogen, also supported by the results of the type index (TI) (Table 1). Ro values vary from 2.24% to 3.42%, with most values greater than 3%, indicating a high over-mature stage of hydrocarbon development. The Ro values of the Niutitang shale from a different region of southern China are similar, ranging between 2.0% and 4.5%, typically 2.5% to 3.5% (Figure 2); but the Ro values of the Niutitang Formation is obviously higher than that of typical shale gas plays from North America (Figure 2). The low hydrogen index (HI) and S2 values (Table 1) indicate that the shale has a poor hydrocarbon generation potential at present day, probably because of the high maturity [48].
3.2. Mineral Composition
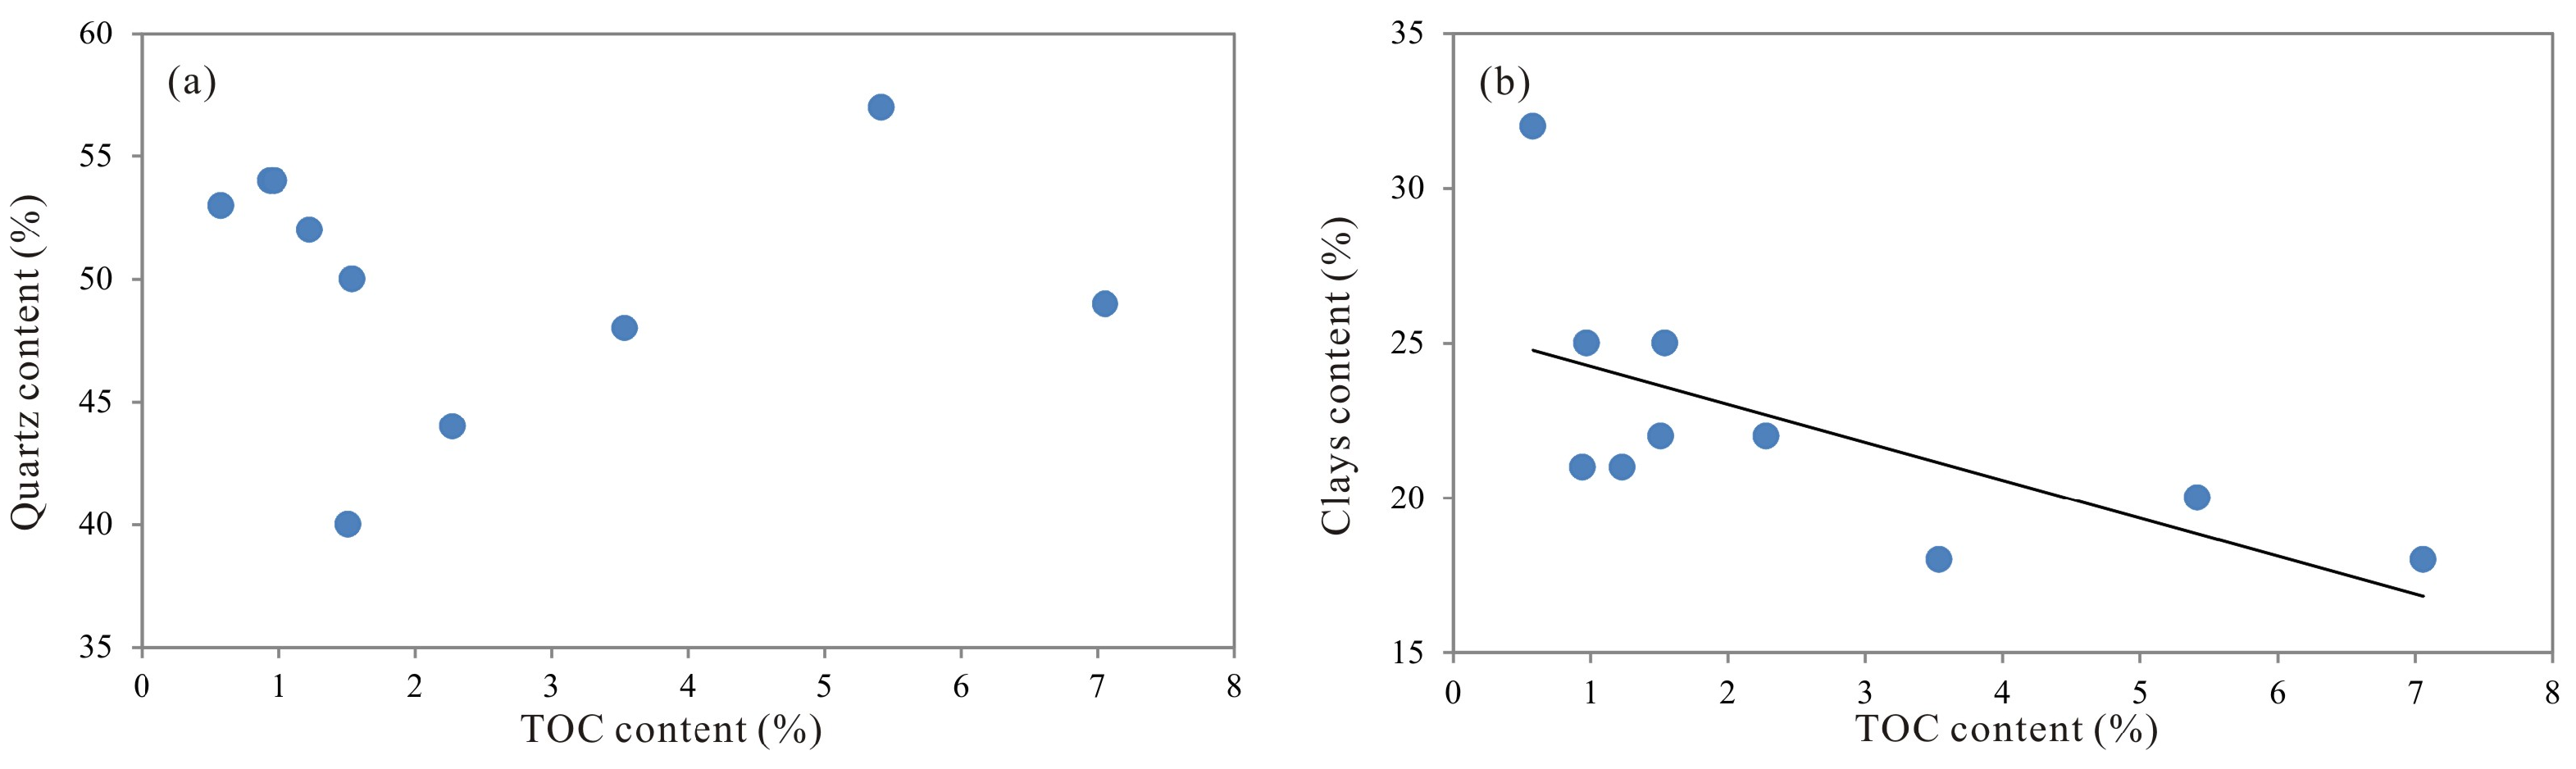
As shown in Table 2, mineral compositions of the shale samples are mainly quartz (50.1% average), followed by clay minerals (22.4% average) and feldspar (16.8% average). Illite, chlorite and illite-smectite mixed layers are the main clay components, accounting for more than 95% of the total clay minerals. As shown in Figure 3, the TOC content decreased with increasing clay content and had no clear correlation with quartz content, which differs from Niutitang and Longmaxi shale found in other areas of South China [9,19]. These different relationships may be due to the difference in their depositional environments. Quartz is thought to be positively correlated with TOC if the shale is biogenic in origin and negatively correlated with TOC if the origin is detrital [49]. Figure 3a shows that most of the quartz in the samples did not have a biogenic origin. The Niutitang Formation was deposited in relatively shallow water that was close to the shore [22], where it was relatively conducive to the input of terrigenous minerals and disadvantageous for OM preservation (Figure 3b).
3.3. Helium Porosity, Permeability and Methane Adsorption Results
Porosity in the Niutitang shale ranged from 1.53% to 4.06% with an average of 2.92% and the permeability varied between 0.33 μD and 0. 98 μD (Table 3). Nie et al. have suggested that lower limits of porosity and permeability for shale gas reservoir is 1% and 0.001 mD [50], respectively, indicating that the permeability value of the studied samples is quite low. Typical porosity of the samples is similar to the Niutitang shale of the Changye 1 well [23] but lower than the Longmaxi shale in the study area [19,20]. The results of the methane adsorption were shown in Table 3. The Langmuir volume of the samples varied from 0.13 m3/t and 2.59 m3/t, with an average of 1.35 m3/t.
3.4. Pore Structure Characterization through Mercury Intrusion
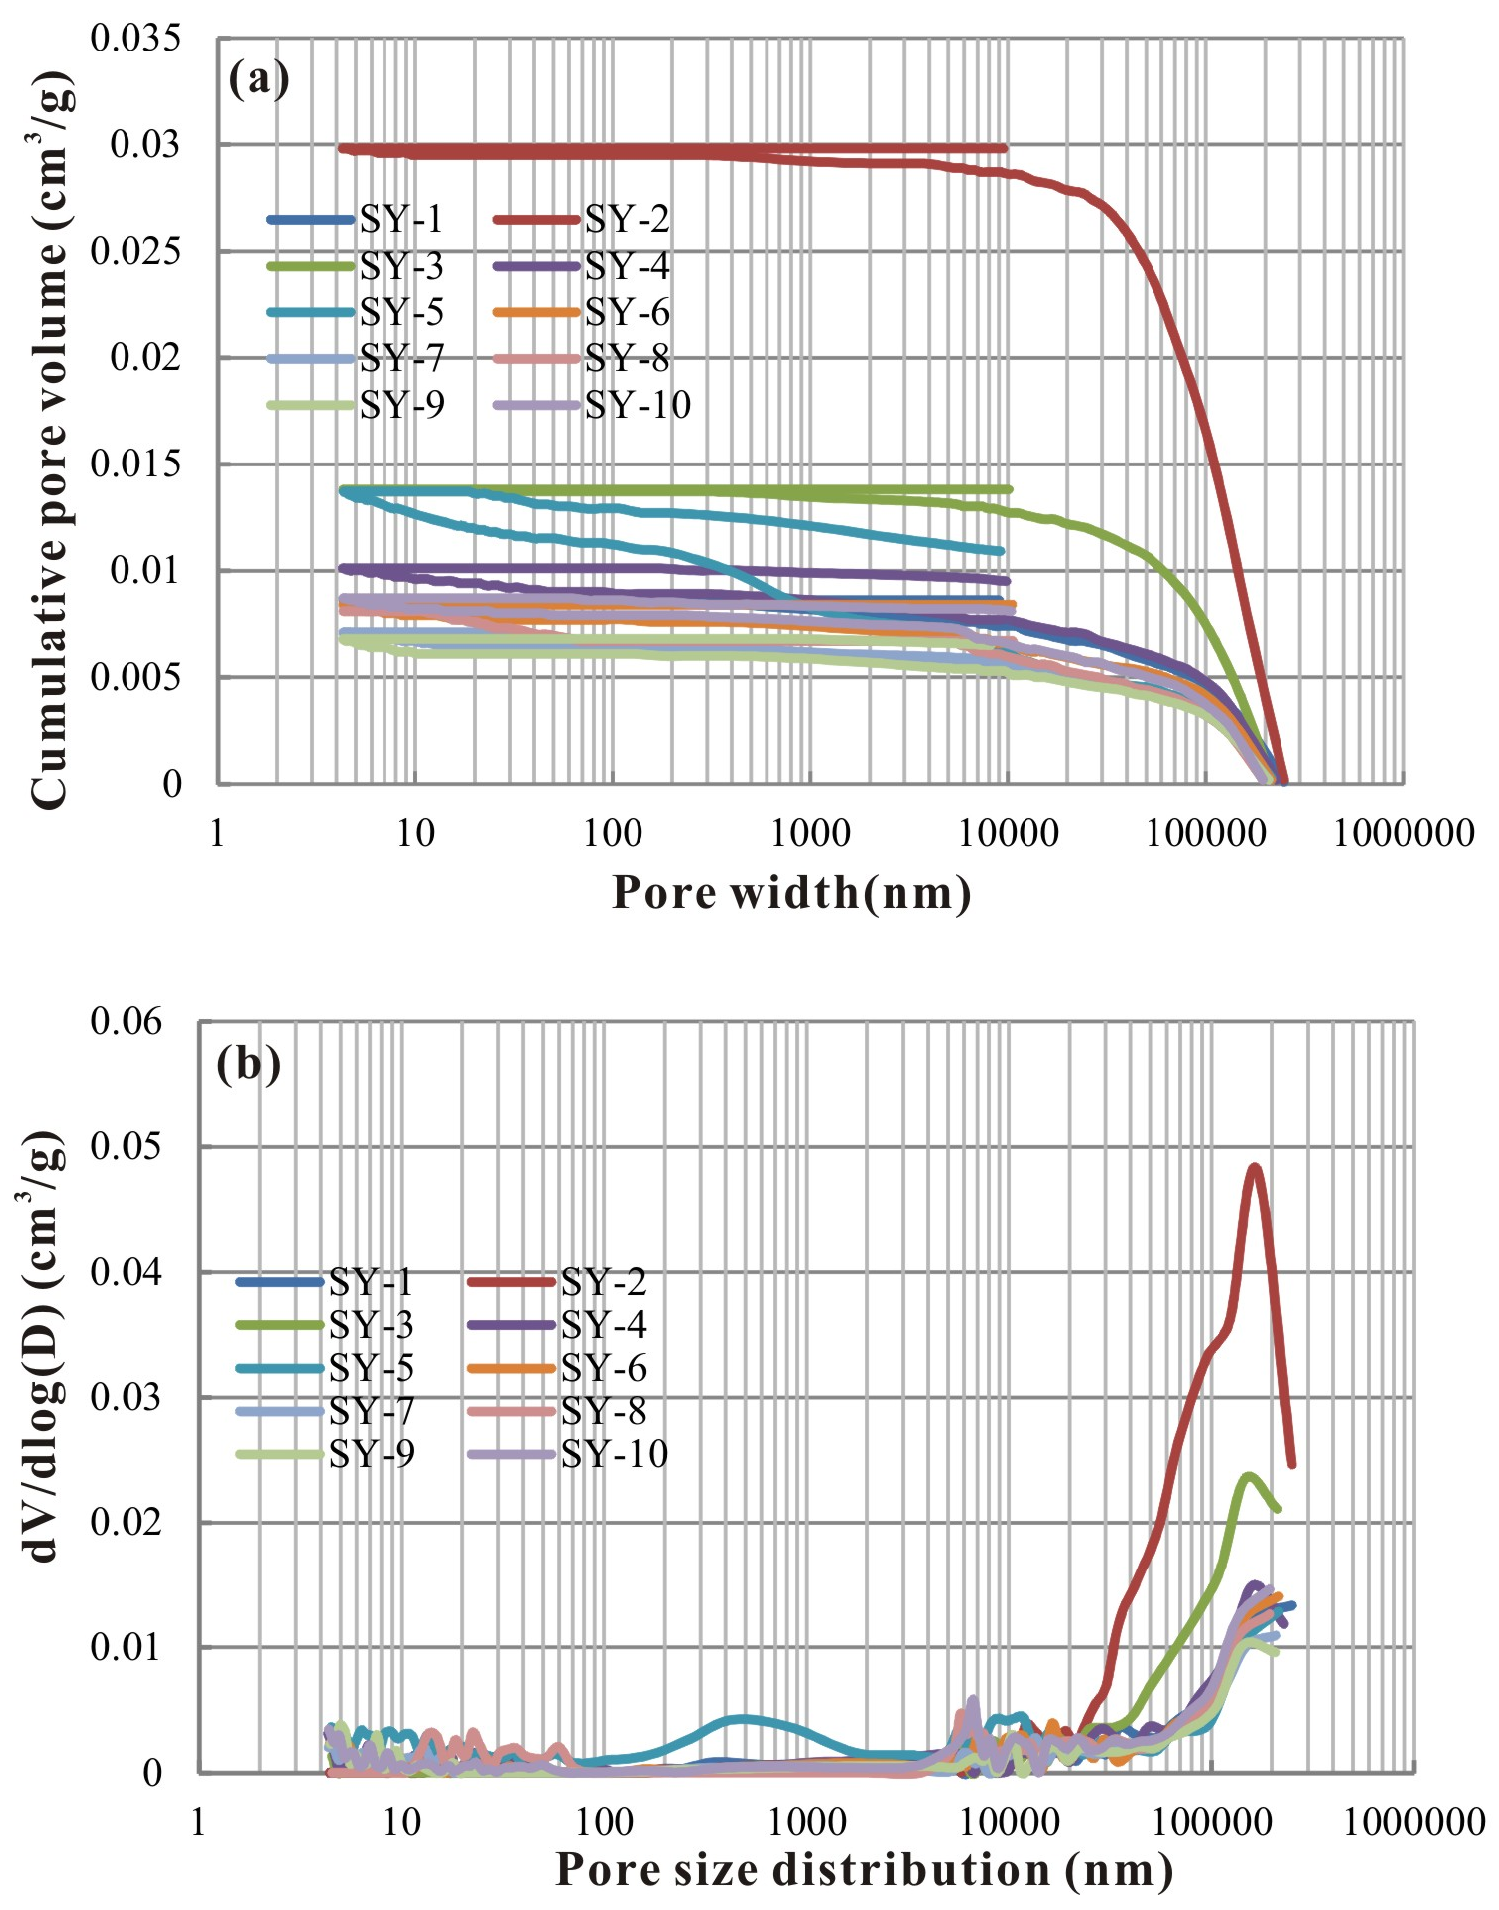
Mercury intrusion was conducted under pressures up to 215 MPa, which was primarily used to analyze PSD in the range of 6 nm–20 μm according to the Washburn equation [51]. The 10 samples had similar mercury intrusion curves, which were characterized by narrow hysteresis loops (Figure 4a). Figure 4a shows that a large amount of mercury invaded pores larger than 10 μm in the initial stage (especially for sample SY-2) and then only a small amount of mercury invaded pores between 50 nm–10 μm. Finally, the mercury injection curves had small increments of pores less than 10 nm in size, which could be observed in most samples. All samples had nearly flat mercury ejection curves, which indicated the existence of large amounts of mercury in the pore network after removal and poor connectivity between pores. Also, the pores were mostly ink-bottle-shaped in the samples, which is adverse for shale gas seepage and diffusion. The characterization of mercury injection-ejection curves is consistent with the PSD where pores with diameters greater than 10 μm are well developed in all samples, as shown in Figure 4b; however, pores with diameters between 50 nm and 10 μm are not extensively developed, except for sample SY-5 with a peak at 400–600 nm.
3.5. Pore Structure Characterization through Nitrogen Physisorption
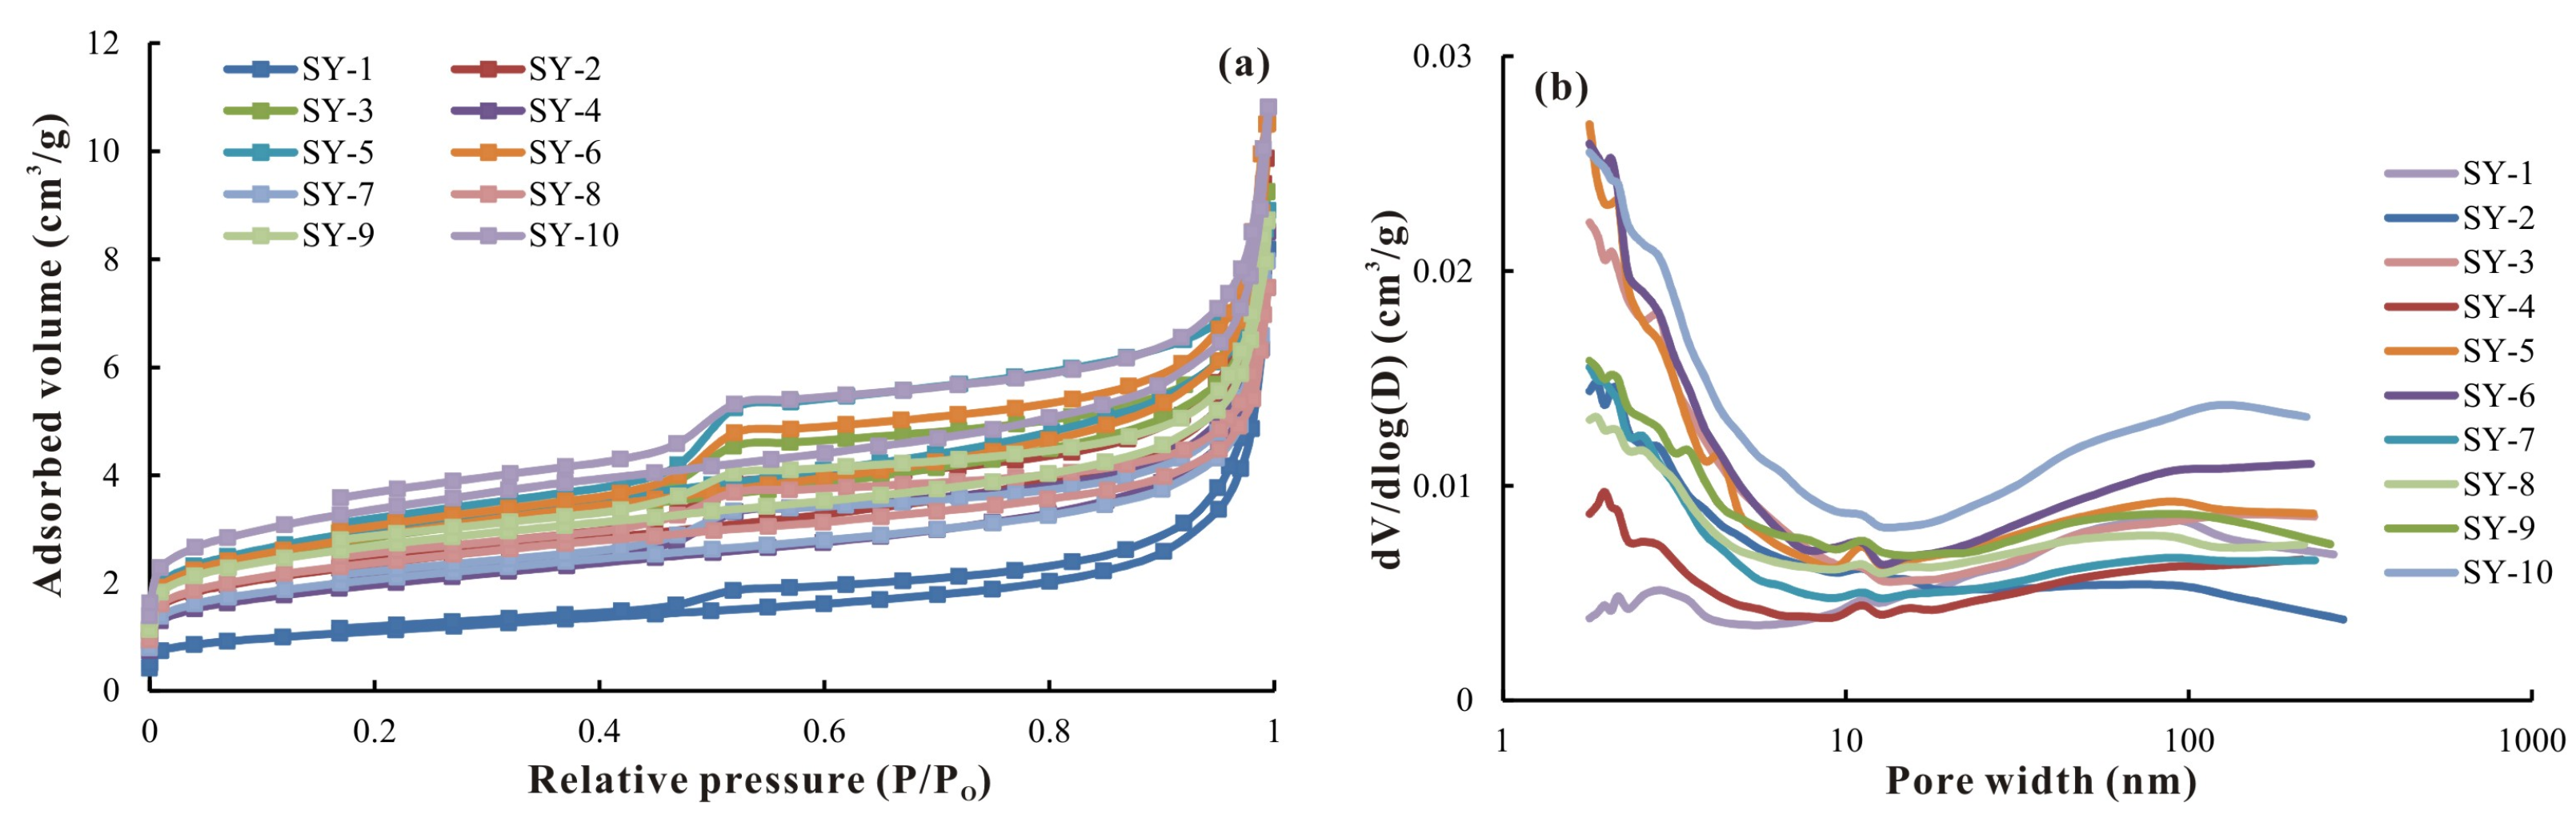
The BET SSA, BJH PV, PSD and average pore diameter were obtained using N2 physisorption. The SSA ranged from 3.82 m2/g to 11.76 m2/g, with a mean value of 8.58 m2/g, the PV varied from 0.012 cm3/g to 0.017 cm3/g, with an average of 0.014 cm3/g and average pore size generally was in the range of 5.77 nm–13.26 nm. The pore structure parameters differ remarkably from sample to sample, indicating complexity of pore shape and PSD, along with heterogeneity throughout the shale. Figure 5a showed that the N2 adsorption–desorption isotherms of the shale samples were characterized by a noticeable hysteresis loop, which was closed at P/P0 = 0–0.5.
Using the shape of the curve to describe pore shape [48,52], Type H2 hysteresis occurs in pores with a narrow pore throat and wide bodies (defined as inkbottle-shaped pores) and Type H3 hysteresis indicates slit-shaped or wedge-shaped pores according to International Union of Pure and Applied Chemistry (IUPAC) classification. The shape of hysteresis loops of the samples indicated that the shape is somewhere between Types H3 and H2, which may be related to a combination of different pore types. Pores with diameters of 2.0–5.0 nm were most developed in the samples that had a large contribution per unit of PV due to their high dV/dlog(D) value, followed by pores of 30–100 nm in size (Figure 5b).
3.6. Fractal Dimensions from N2 Physisorption
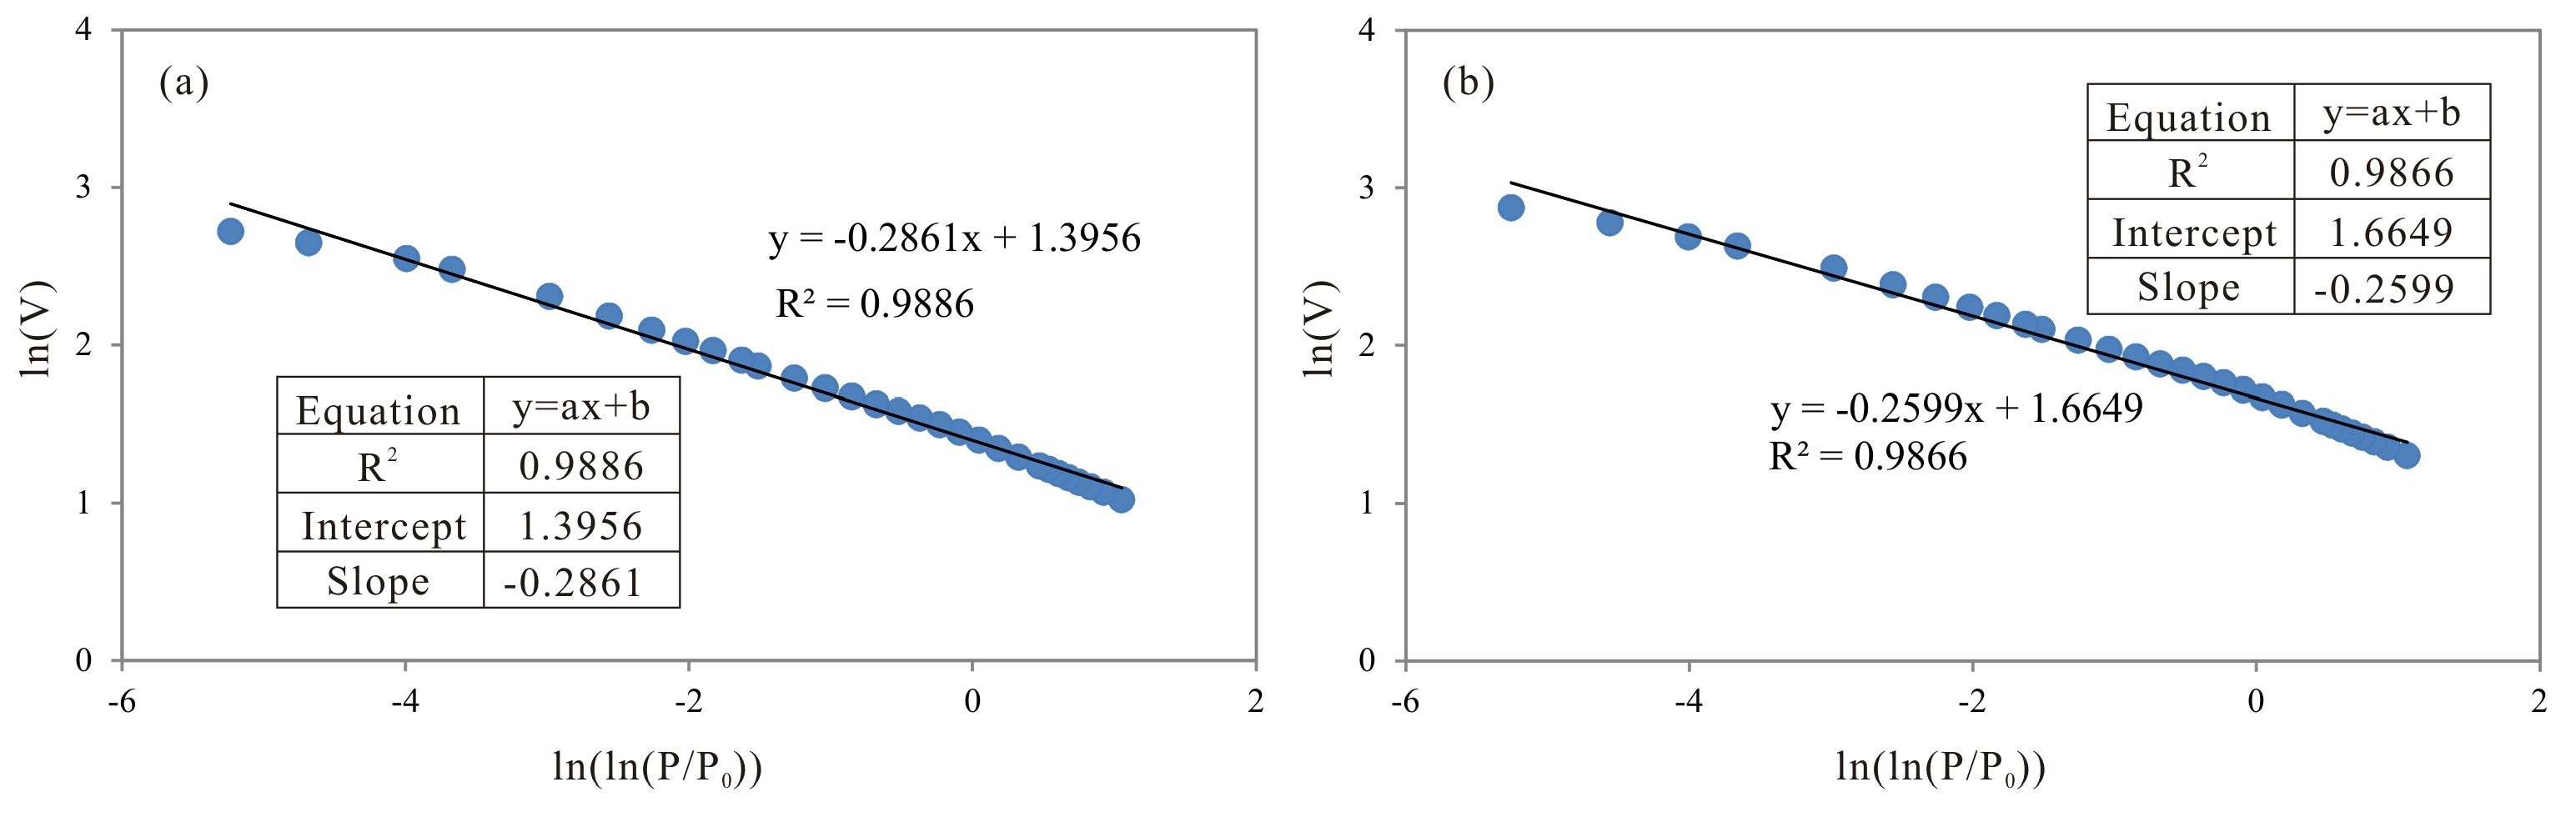
According to the fractal FHH model, the ln(ln(P0/P)) versus ln(V) plots of 10 Niutitang shale samples are illustrated in Figure 6. The two were linearly correlated, with good fitting correlation coefficients >0.98, indicating that the pores in the studied shale samples displayed excellent fractal characteristics.
The fractal dimension D was obtained via the FHH model (Table 4), ranging from 2.71 to 2.78, with an average of 2.76. Fractal dimensions calculated in this study are comparable to the Niutitang shale from the Sichuan Basin, with an average value of 2.73 [13] and the Longmaxi shale from western Hunan and Hubei Provinces, with an average value of 2.73 [19]. Compared with continental shale and marine-continental transitional shale, the fractal dimension of the marine shale is much higher, indicating that these marine shales have a more heterogeneous pore system. The fractal dimension of the continental shales or transitional shales is generally less than 2.70 [43,44,45,53].
4. Discussion
4.1. Effect of TOC Content on Pore Structure
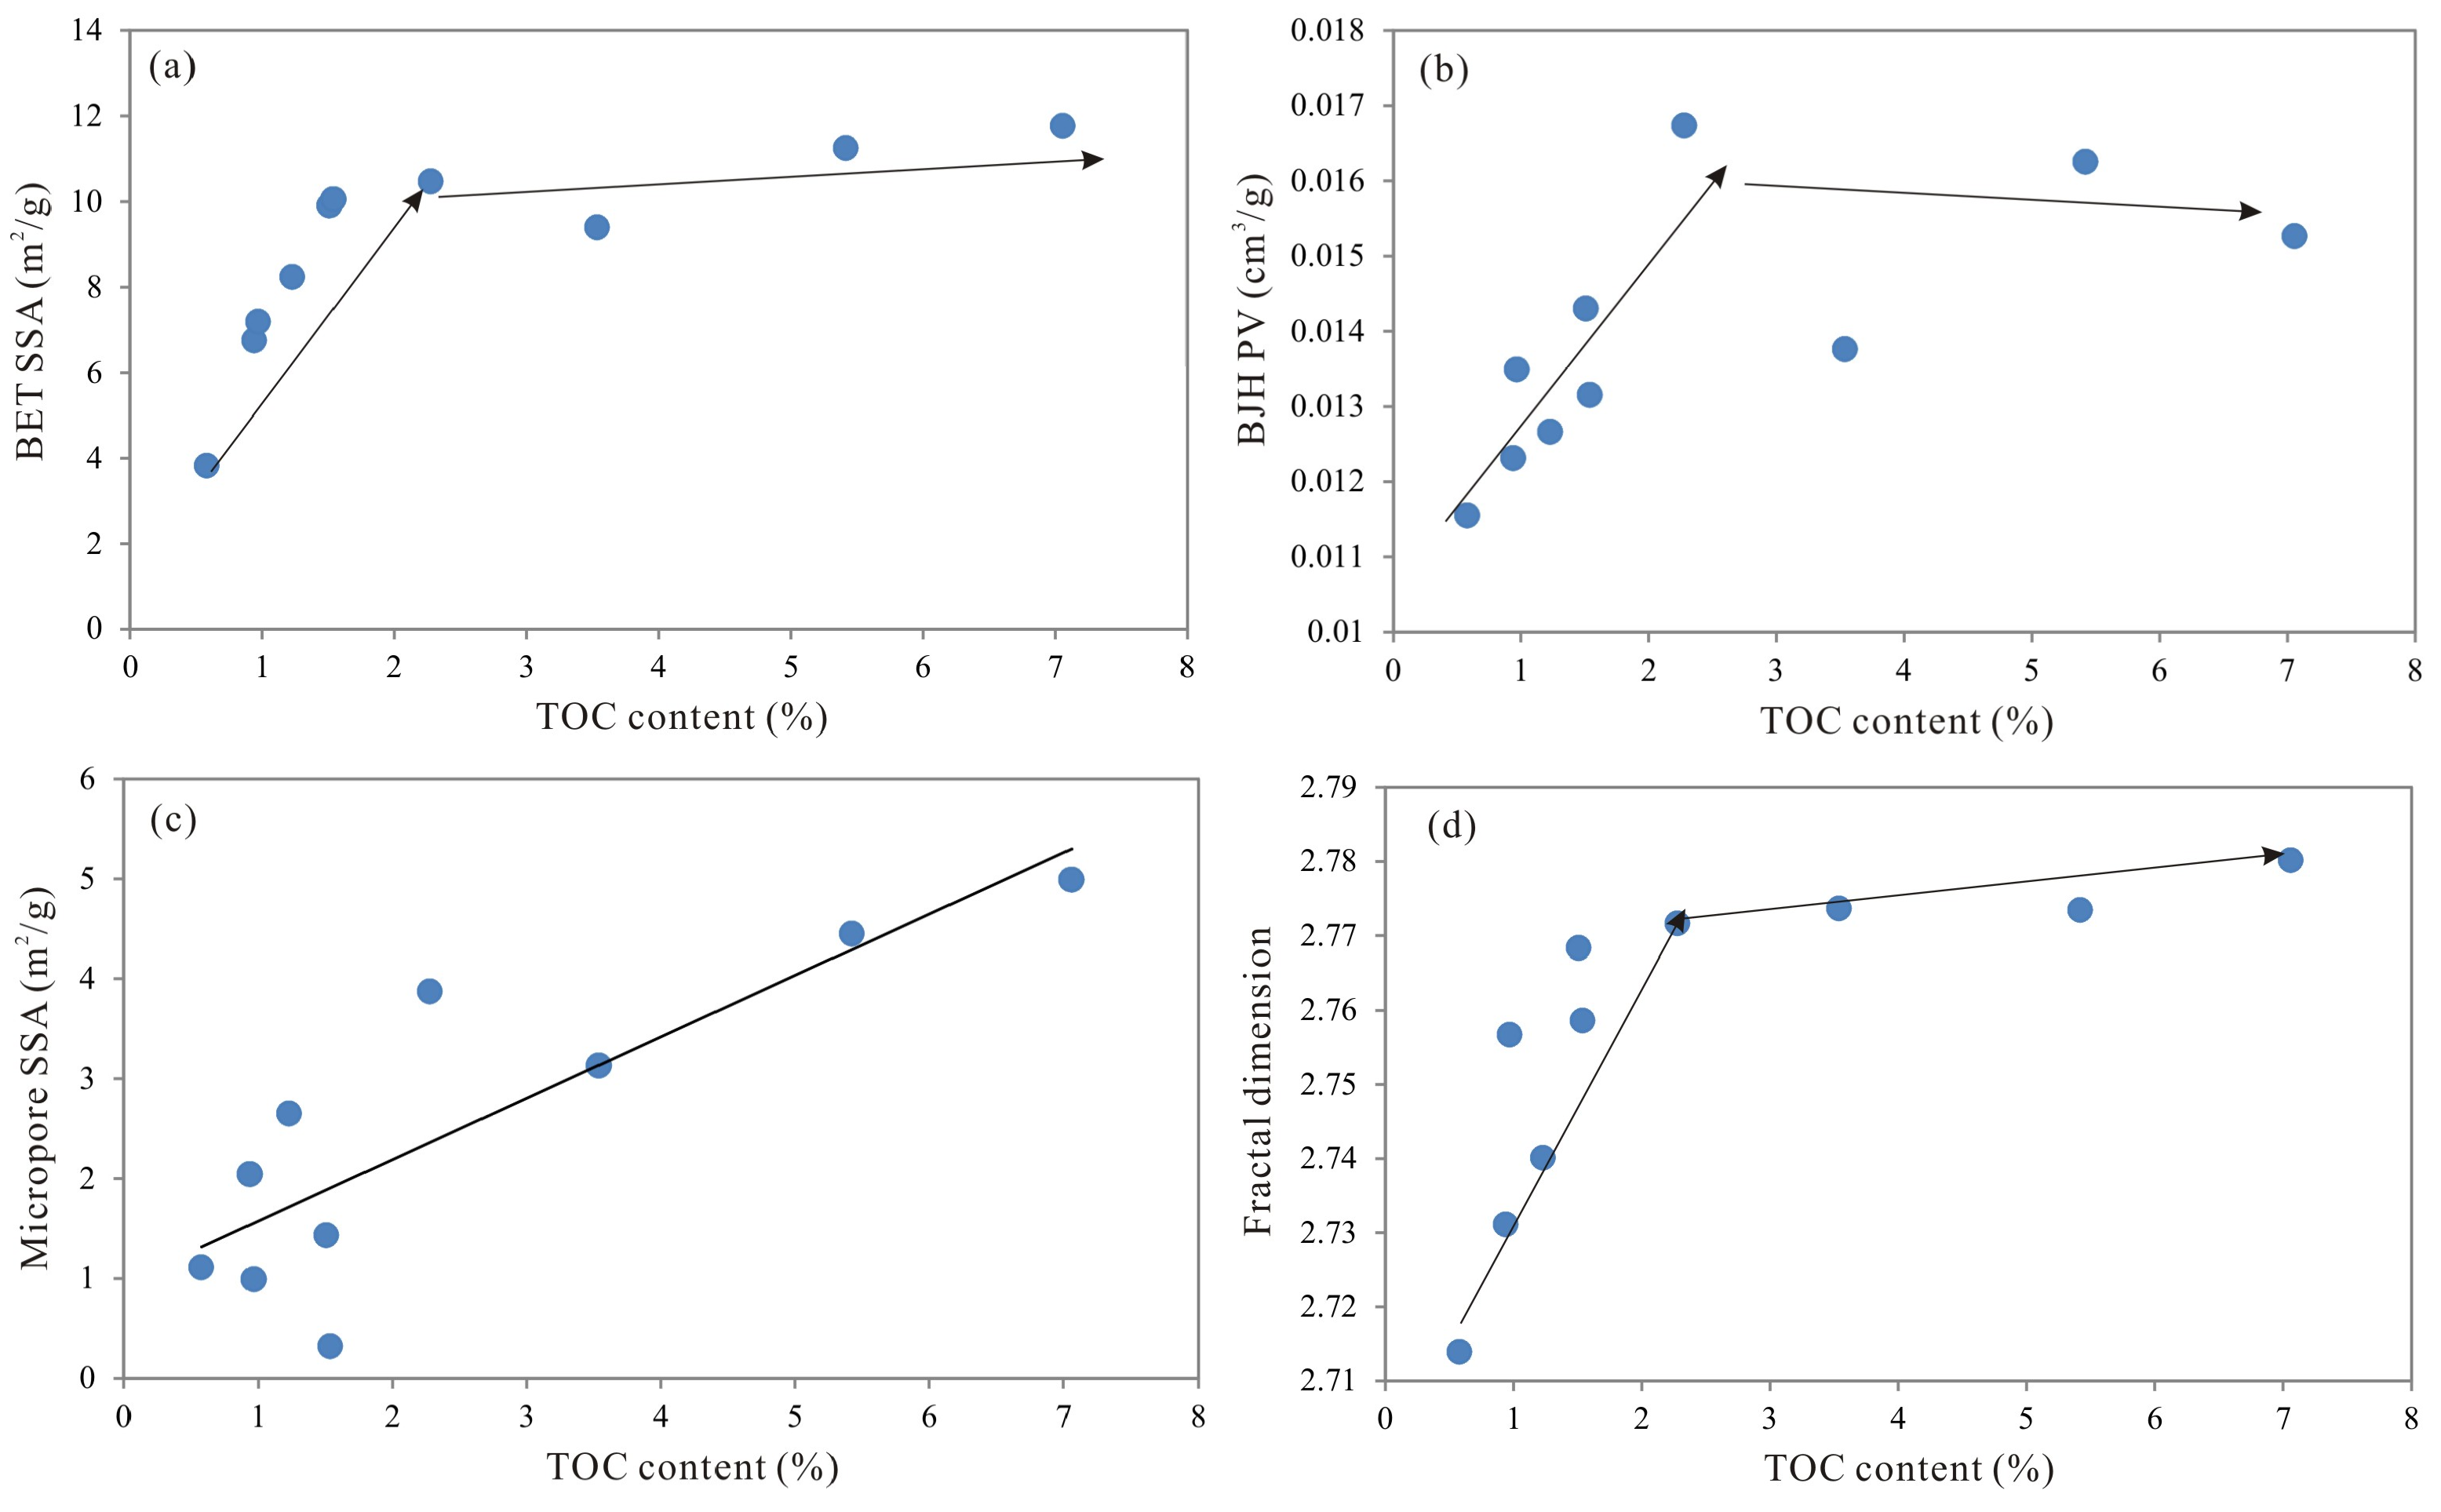
The relationships between TOC content and pore structure parameters are shown in Figure 7. A positive relationship was observed between TOC content and BET SSA and BJH PV (Figure 7a,b), which was consistent with several previous studies [9,54,55,56]. However, we note that correlations with BET SSA were stronger than they were with BJH PV. In general, there was a clear positive relationship between TOC content and micropore PV and SSA, as proposed by many studies, indicating that most of the OM pores were micropores [57,58]. The micropore SSA contribution to total SSA was more significant than the micropore PV contribution to total PV. As shown in Figure 7c, there was a clear positive relationship between TOC content and micropore SSA. Therefore, higher TOC resulted in the growth of the number of micropores, which mainly contributed to SSA. The increasing SSA and PV with increasing TOC content of the shale samples may have also directly contributed to the positive relationship between fractal dimension and TOC content (Figure 7d), which has also been observed in Longmaxi and Niutitang shale from southern China [13,19] and in continental shale from the Ordos Basin [58].
The higher TOC content indicated a more heterogeneous pore surface roughness and pore structural irregularity, consequently leading to larger fractal dimensions. But the fractal dimension D gradually stabilized when the TOC content became much higher (Figure 7d), which may suggest that the heterogeneity of the pores would probably have reached a maximum value when TOC content reached a certain concentration. In fact, the BET SSA and BJH PV also gradually stabilized when the TOC content became much higher (Figure 7a,b). Milliken et al. also found a similar variation tendency between TOC content and porosity when the TOC content is above 5.6% [59]. Wang et al. suggested that the excessive TOC content could decrease the brittleness and fracture density of the shale, which allow for easy compaction of the shale and minimal preservation of the pores [21,60]. Thus, perhaps the fractal dimensions will decrease with increasing TOC content when the TOC content exceeds a certain amount.
4.2. Effect of Mineral Composition on Pore Structure
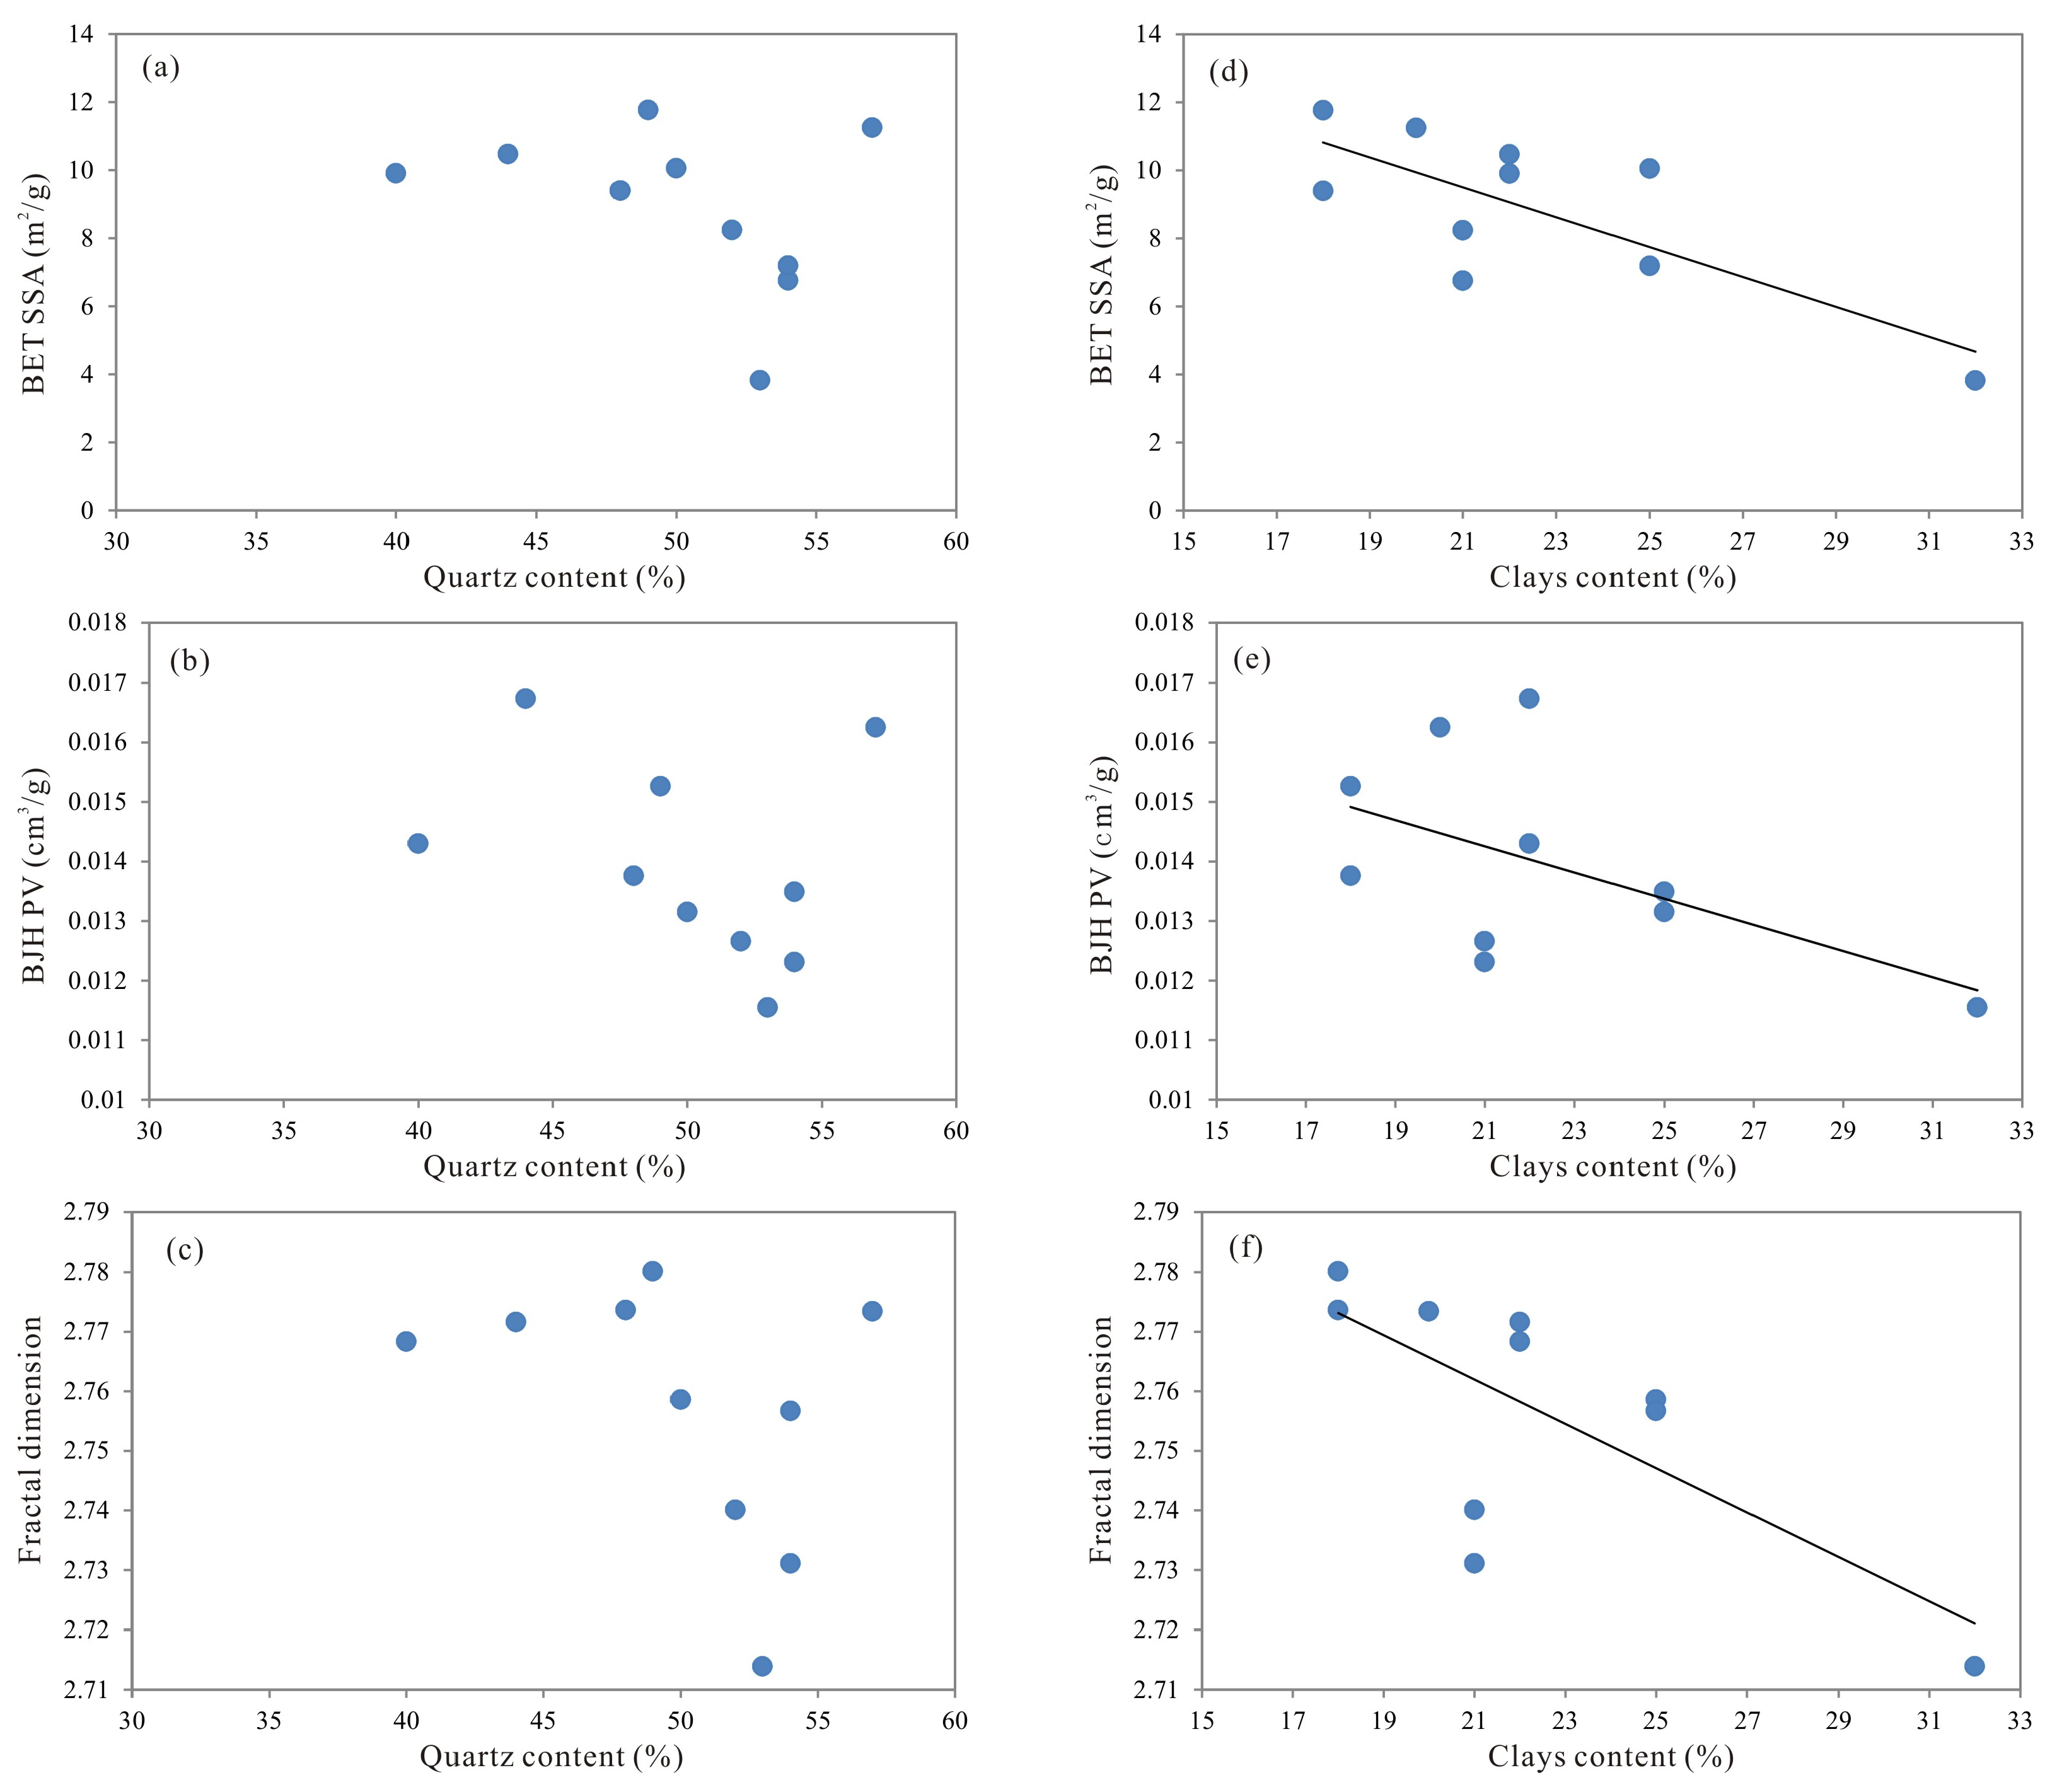
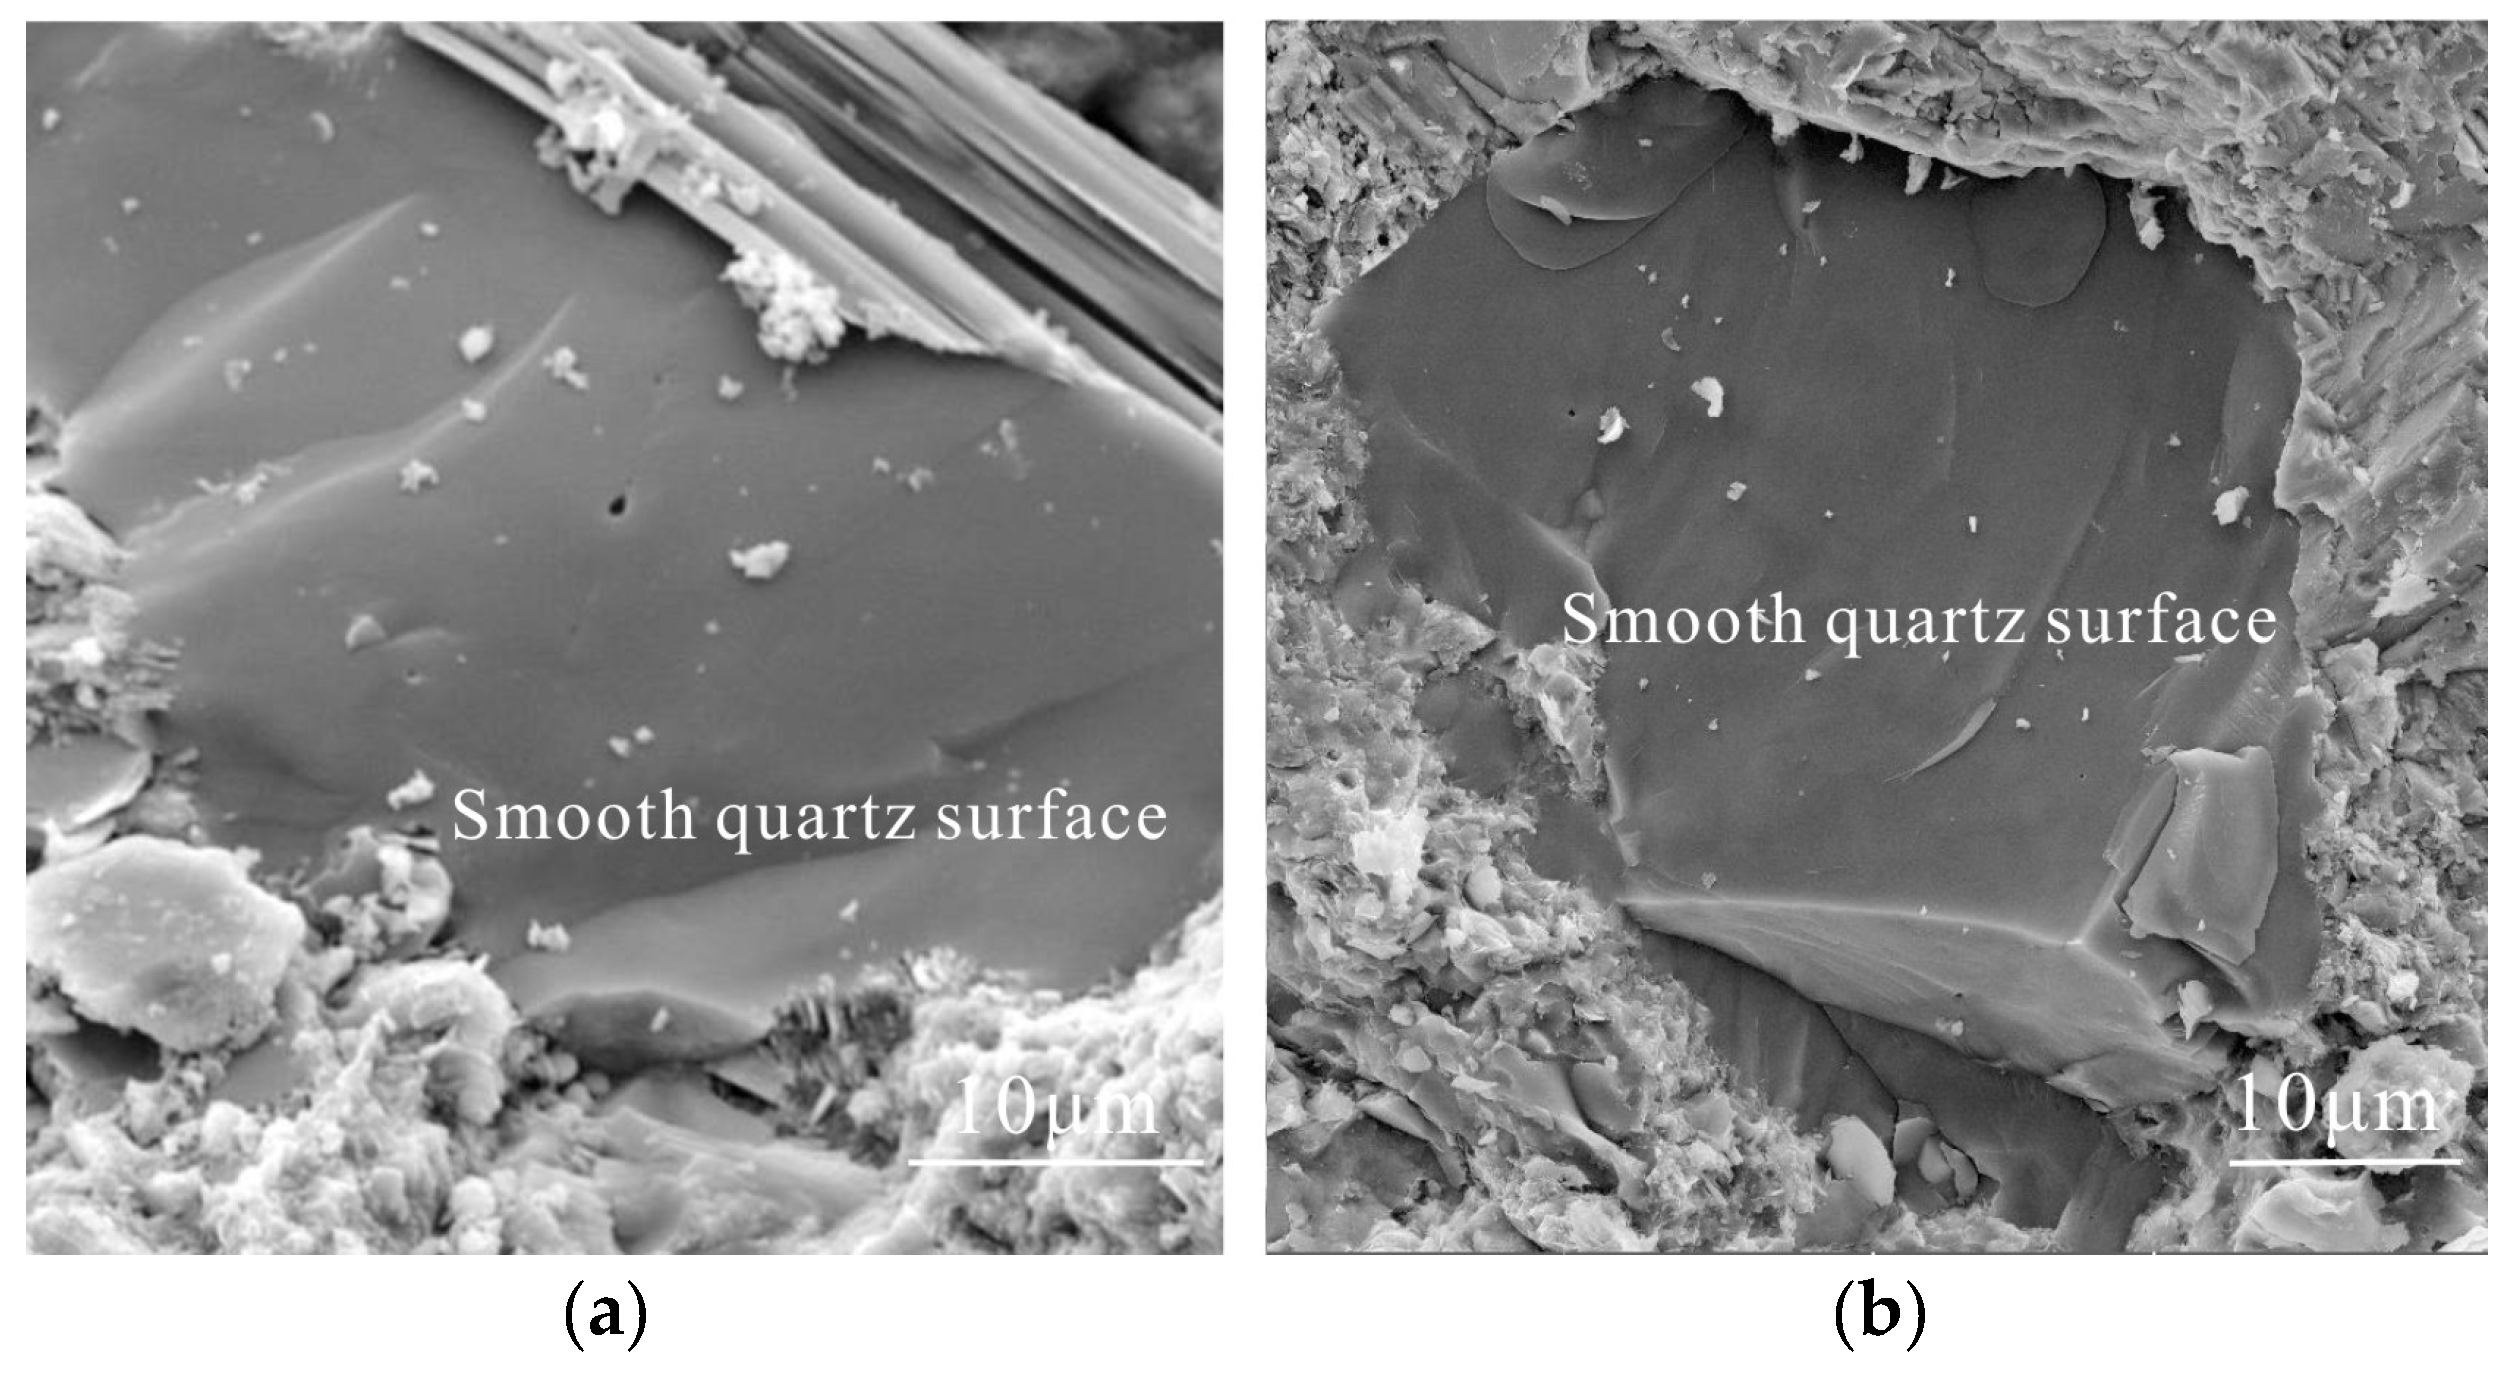
Quartz and clay were the primary minerals in the samples and their relationships with pore structure parameters are shown in Figure 8. There was no apparent relationship between quartz content and BET SSA or BJH PV, which differed from previous studies of Niutitang shale [14,19,28,58]. The distinct relationships between quartz content and PV and SSA may be due to the different origins of quartz. The biogenic quartz in marine shale typically contained a large number of pores and may work together with OM to change the pore structure in shale [14,19,61], whereas the quartz in marine-continental transitional shale or continental shale was mainly terrigenous and theoretically contributed little to the SSA and PV and had little influence on the pore structure [56]. Although the types of quartz were not examined for these samples, most of the quartz should not be biogenic according to Figure 3a. The SEM images also illustrate that the quartz had a smooth surface and contained fewer pores (such as dissolution pores) (Figure 9). As shown in Figure 8c, no obvious relationship can be observed between the quartz content and fractal dimension, indicating that quartz has little influence on the fractal dimension. The smooth quartz surface (Figure 9)—much smoother and more homogenous than the OM grains and clay minerals—may directly contribute to the correlations.
As for clay minerals, a slight negative relationship is observed in Figure 8d–f, indicating that SSA and PV decreased with increasing clay mineral content, which could weaken the heterogeneity of the pore structure. Higher clay content may allow the collapse of OM pores and interparticle pores [59,60], especially for Niutitang shale that has been deeply buried and has undergone immense compaction. In addition, in Section 3.2, the clay content had a negative relationship with TOC content, which in turn had a positive influence on pore structure. Therefore, the negative trend between clay minerals and TOC has, to a certain extent, contributed to the negative relationship between clay minerals and pore structure parameters. Furthermore, clay minerals contain more adsorbed water than OM and shale samples with a higher clay mineral content had more homogeneous pore systems due to pore filling by water molecules. This negative relationship between fractal dimension D and clay mineral content was also observed by Ji et al. [14]. Yao et al. proposed that coal with a higher water content has a lower fractal dimension [11].
4.3. Pore Structure Parameter Characteristics and Their Relationships with Fractal Dimension
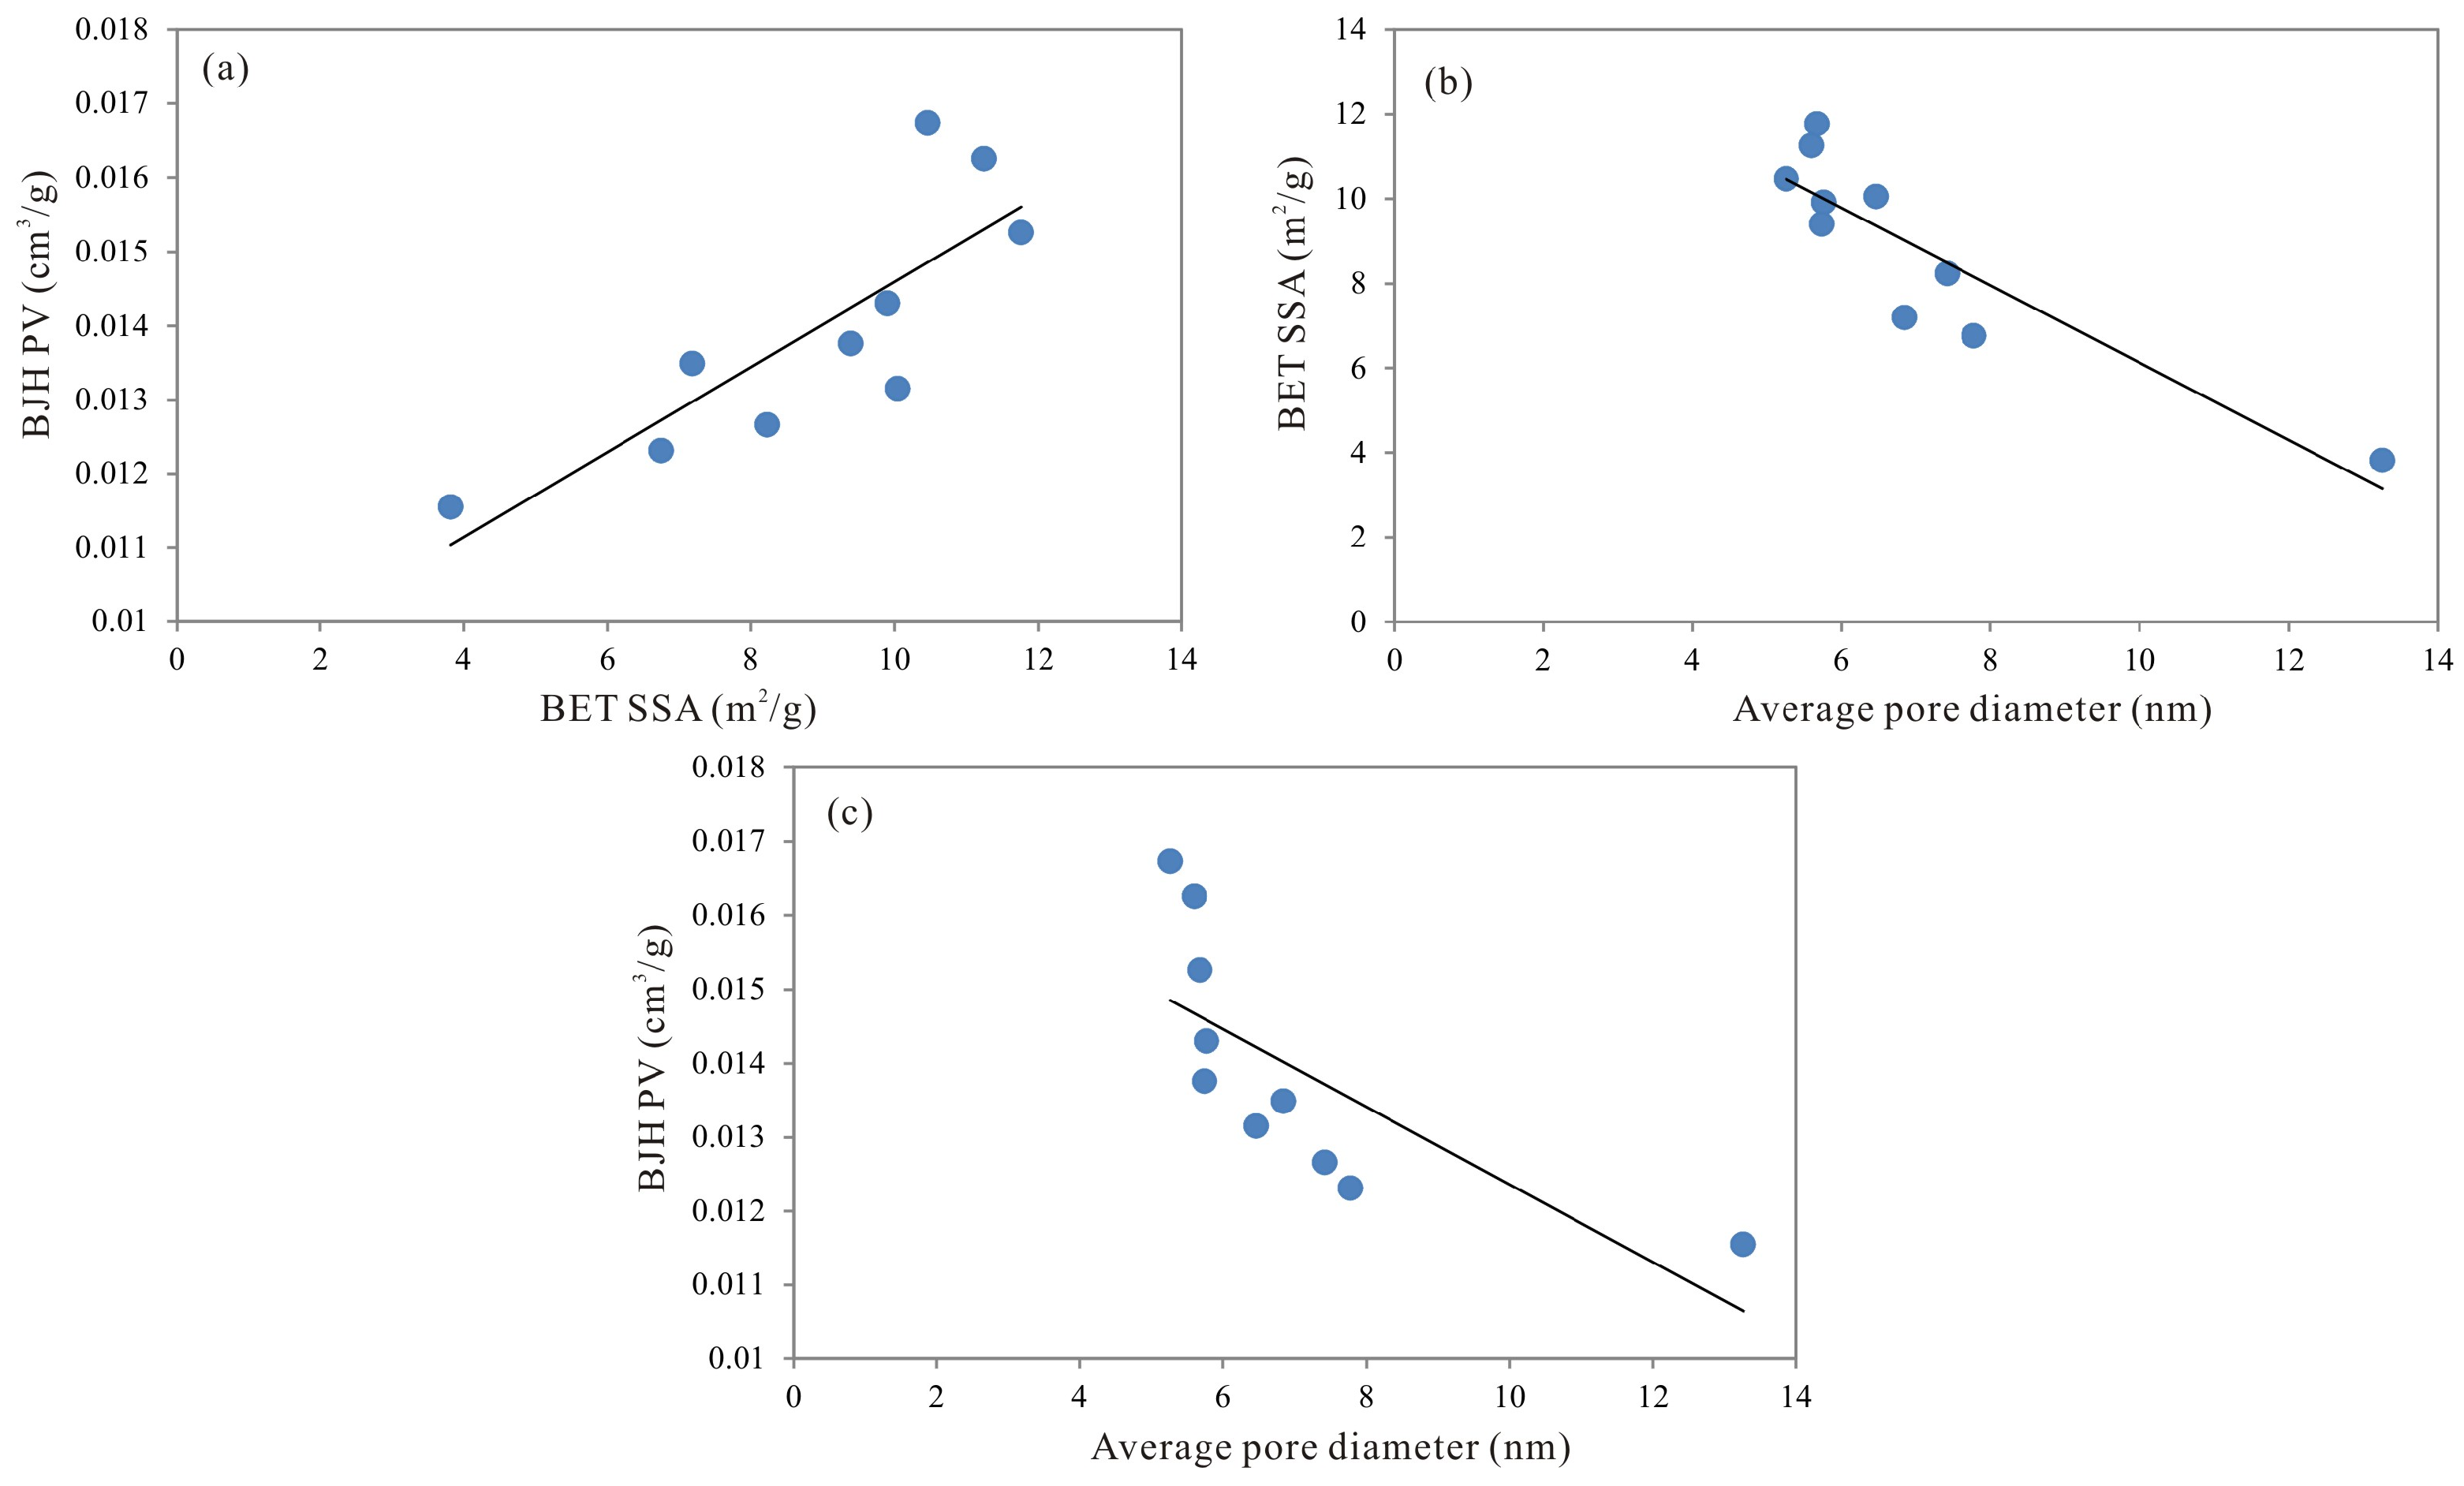
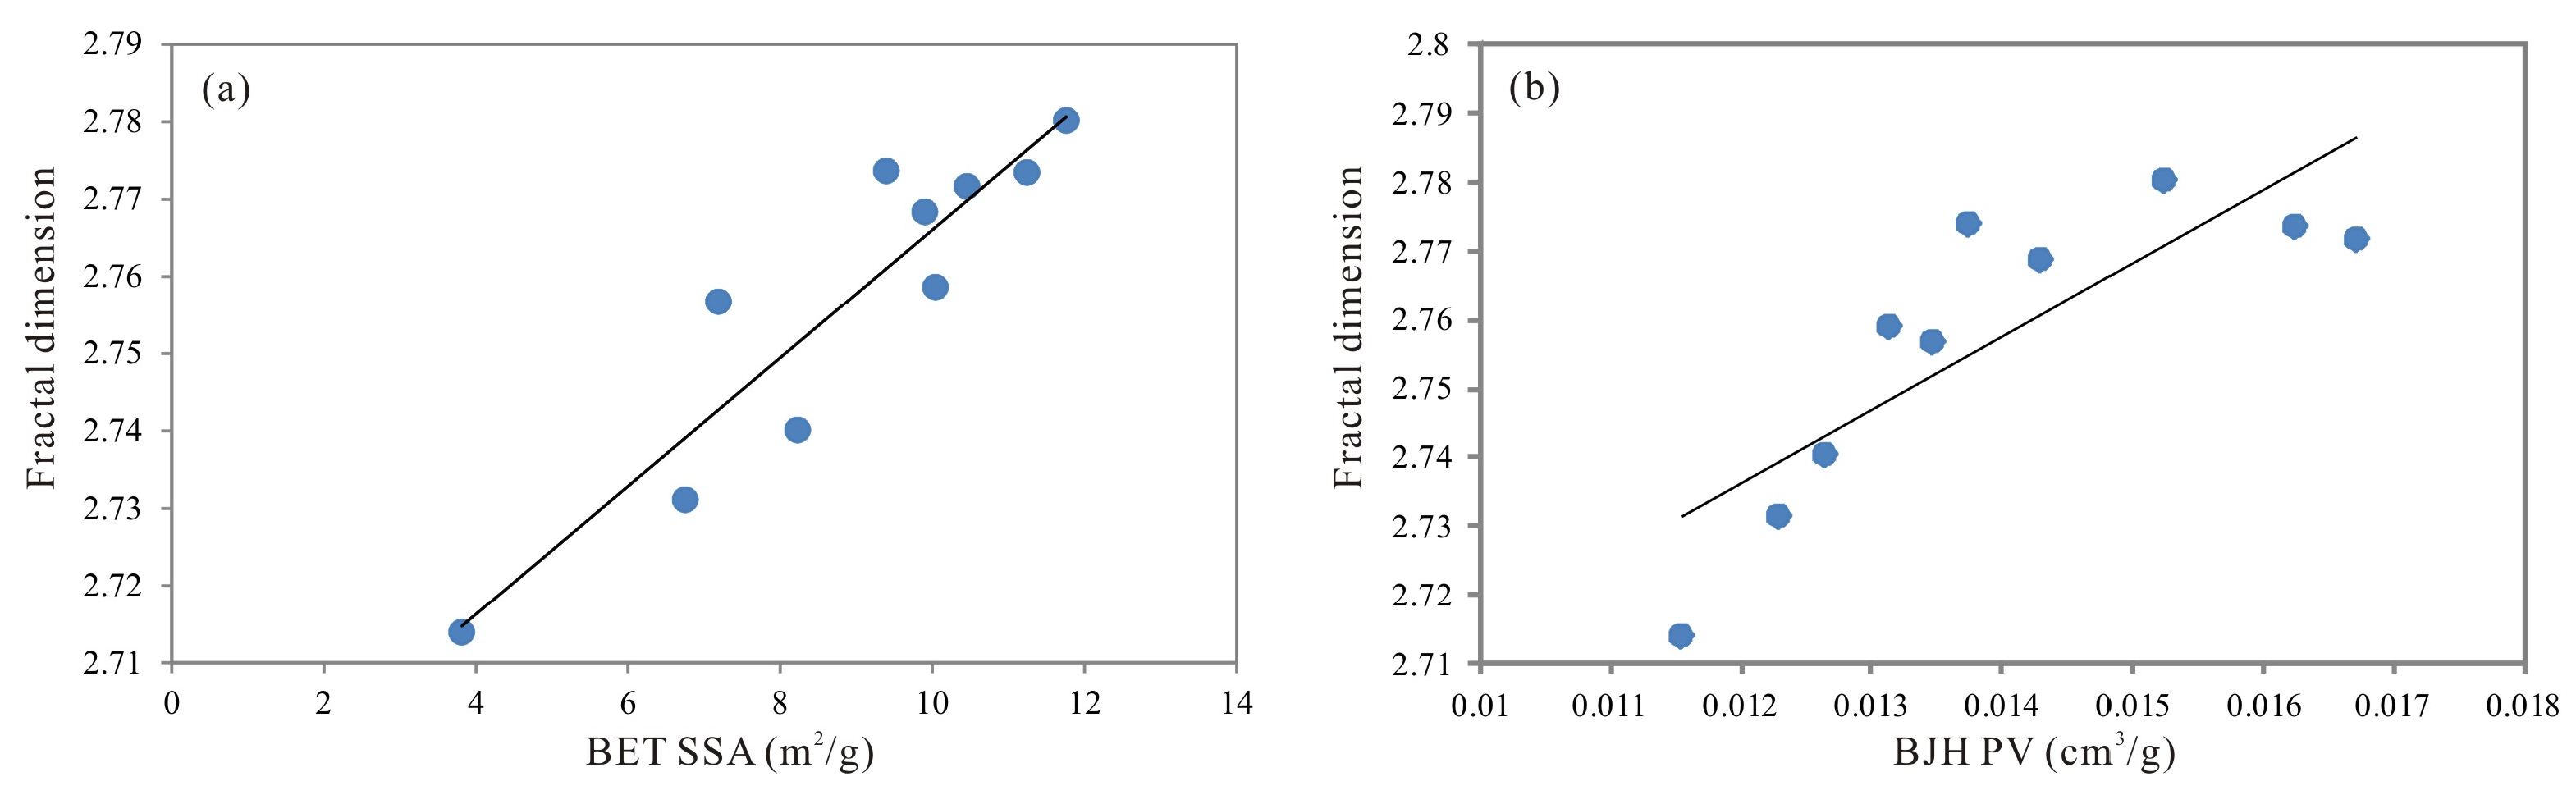
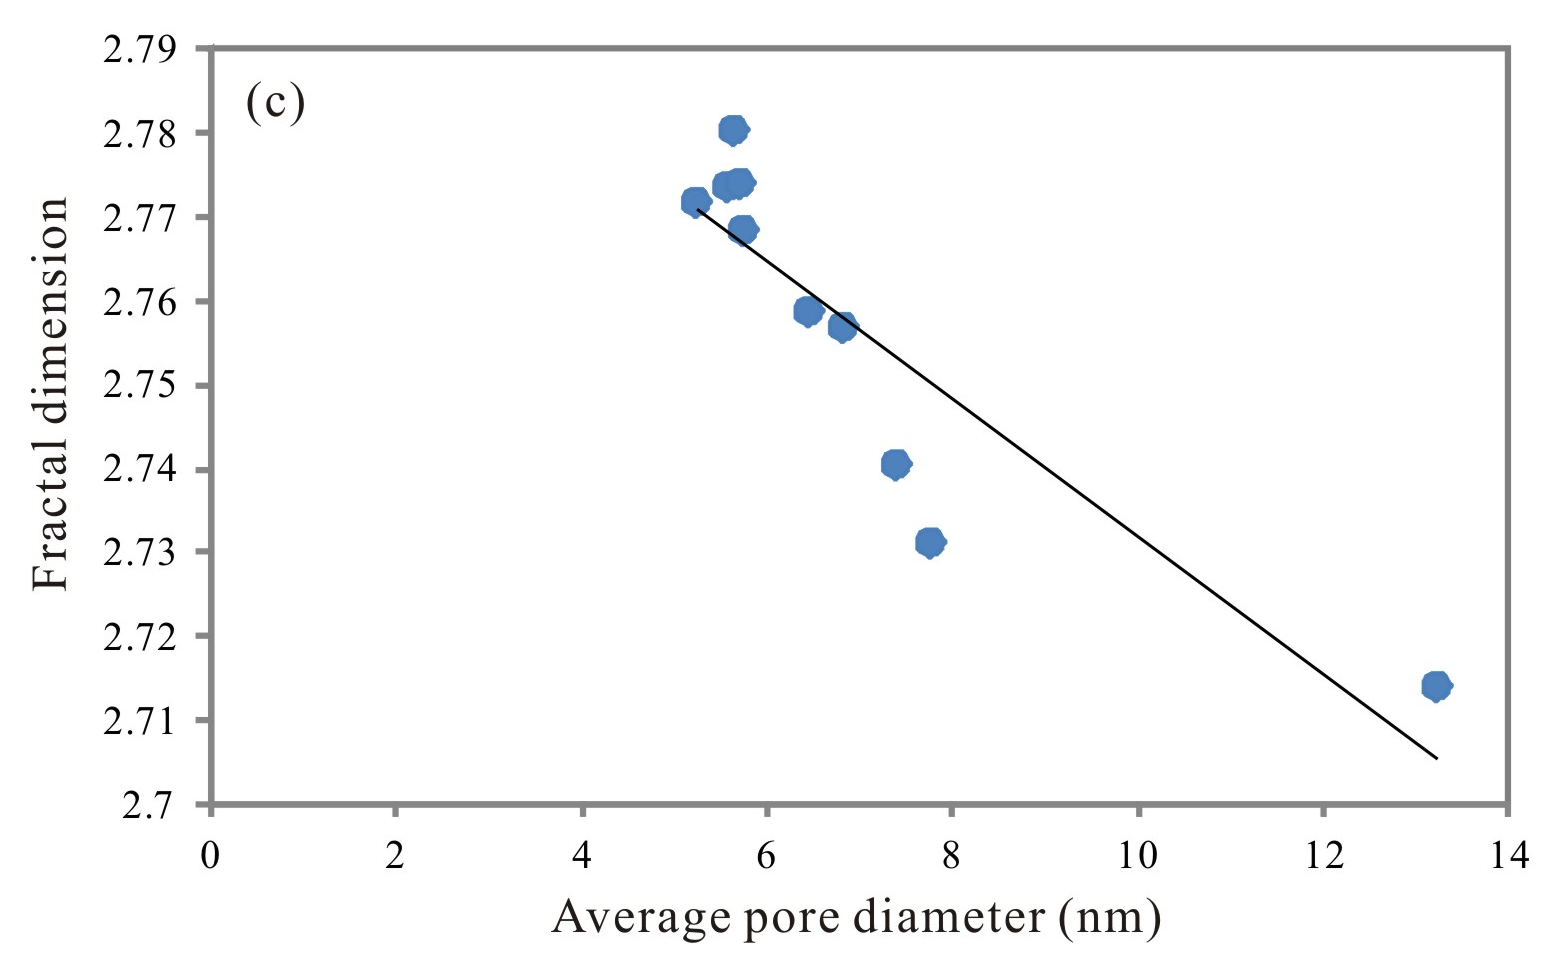
Figure 10a shows the relationships between the SSA and PV of the shale samples, indicating that PV increased with increasing SSA, which is consistent with previous studies [48,58]. The negative relationship between average pore diameter and PV and SSA (Figure 10b,c) showed that PV and SSA increased when the average pore diameter decreased. Shale samples with smaller average pore diameters indicated that the shale was comprised of many small pores or pores with small throats. This led to a more heterogeneous pore structure, irregular surfaces and higher fractal dimension values (Figure 11). Conversely, the fractal dimension can characterize the heterogeneity of pore structure, with a higher D value indicating a greater number of small pores or pore throats and a more heterogonous and complicated pore structure in the shale. These trends were consistent with many previous studies and rock types including coal [11], marine shale [14,57], continental shale [43] and marine-continental transitional shale [55].
4.4. Fractal Dimension Contributions to Shale Gas Reservoir Evaluation
4.4.1. Effect of Fractal Dimension on Permeability
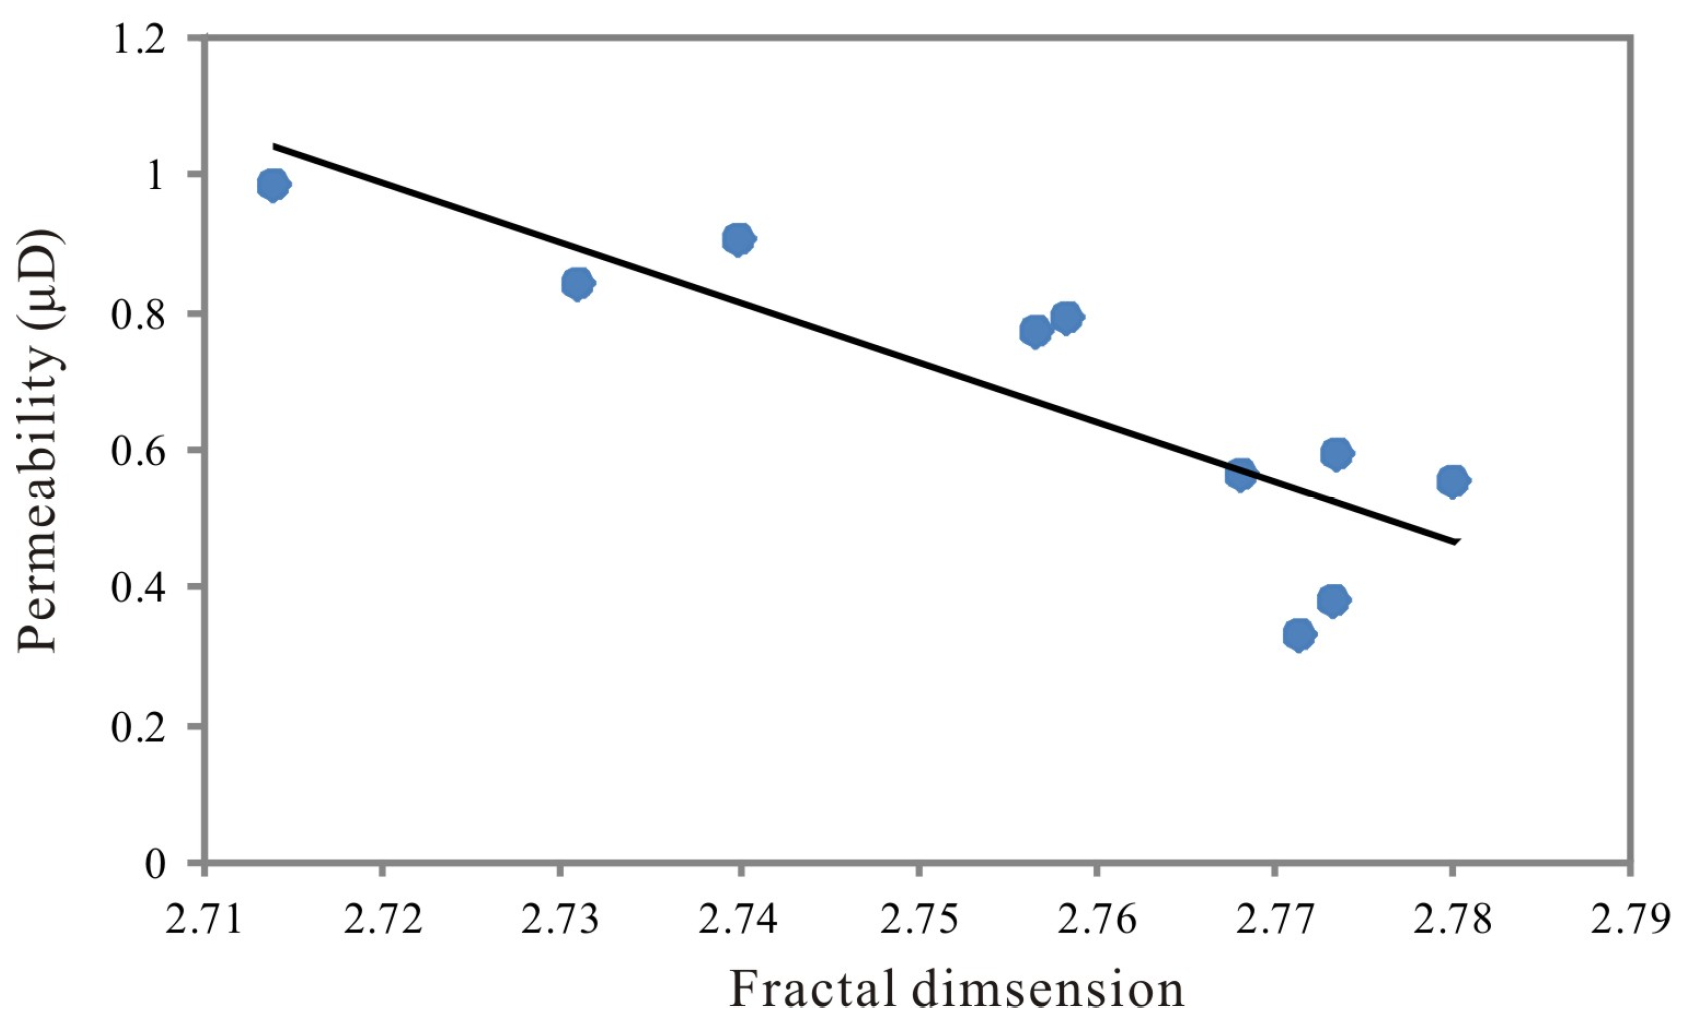
As shown in Figure 12, permeability had a negative relationship with fractal dimension. This showed that fractal dimension had a greater influence on the flow capacity of the shale. Higher D values indicate more small pores or pore throats and more heterogonous and complicated pore structure, which results in a low permeability. This inhibits gas flow through the shale. Yang et al. and Liu et al. also found that a higher fractal dimension D indicates a more complicated pore structure, leading to a decrease of permeability [13,58]. In addition, they suggested that pore shapes transform gradually from relatively regular (e.g., wedge-shaped) to complex (e.g., inkbottle-shaped) with an increase in the fractal dimension, which may be one of the reasons that shale with a higher fractal dimension value has lower permeability. For example, the sample with the lowest permeability value (0.33 μD; SY-5) has a hysteresis loop that can be characterized as almost a Type H2, while the sample with the largest permeability (0.981 μD; SY-1) has a hysteresis loop that can be characterized as a Type H3 (Figure 5). The inkbottle-shaped pores are more likely to be better developed in the sample SY-5, which would enhance pore structure complexity and results in a low permeability and a large fractal dimension D (Table 4).
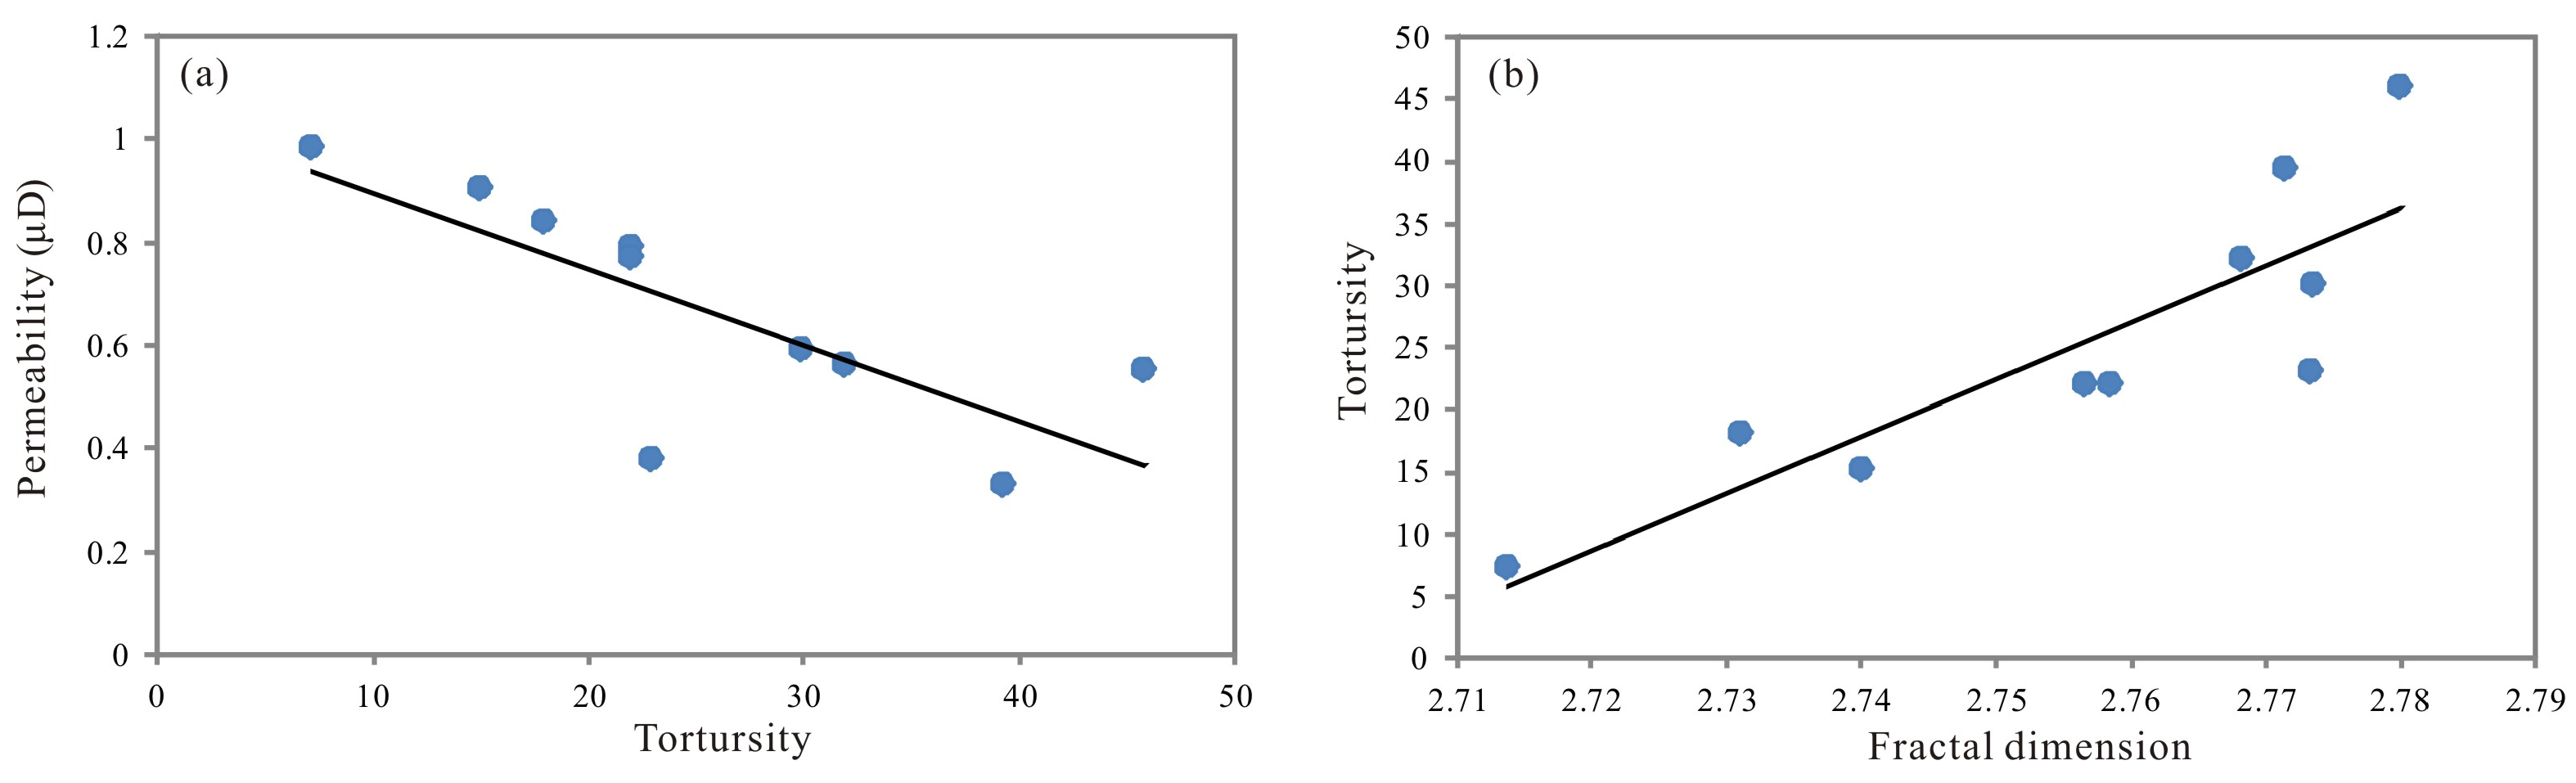
In addition, Chen et al. proposed that tortuosity (τ), which can be calculated through mercury intrusion, can be used to evaluate pore connectivity and permeability [62], with higher τ values indicating poor connectivity and low permeability (Figure 13a). As shown in Figure 13b, tortuosity (τ) had a positive relationship with the fractal dimension, indicating that shale with a higher fractal dimension D had poorer connectivity and lower permeability.
4.4.2. Effects of Fractal Dimension on the Adsorption Capacity of Shale
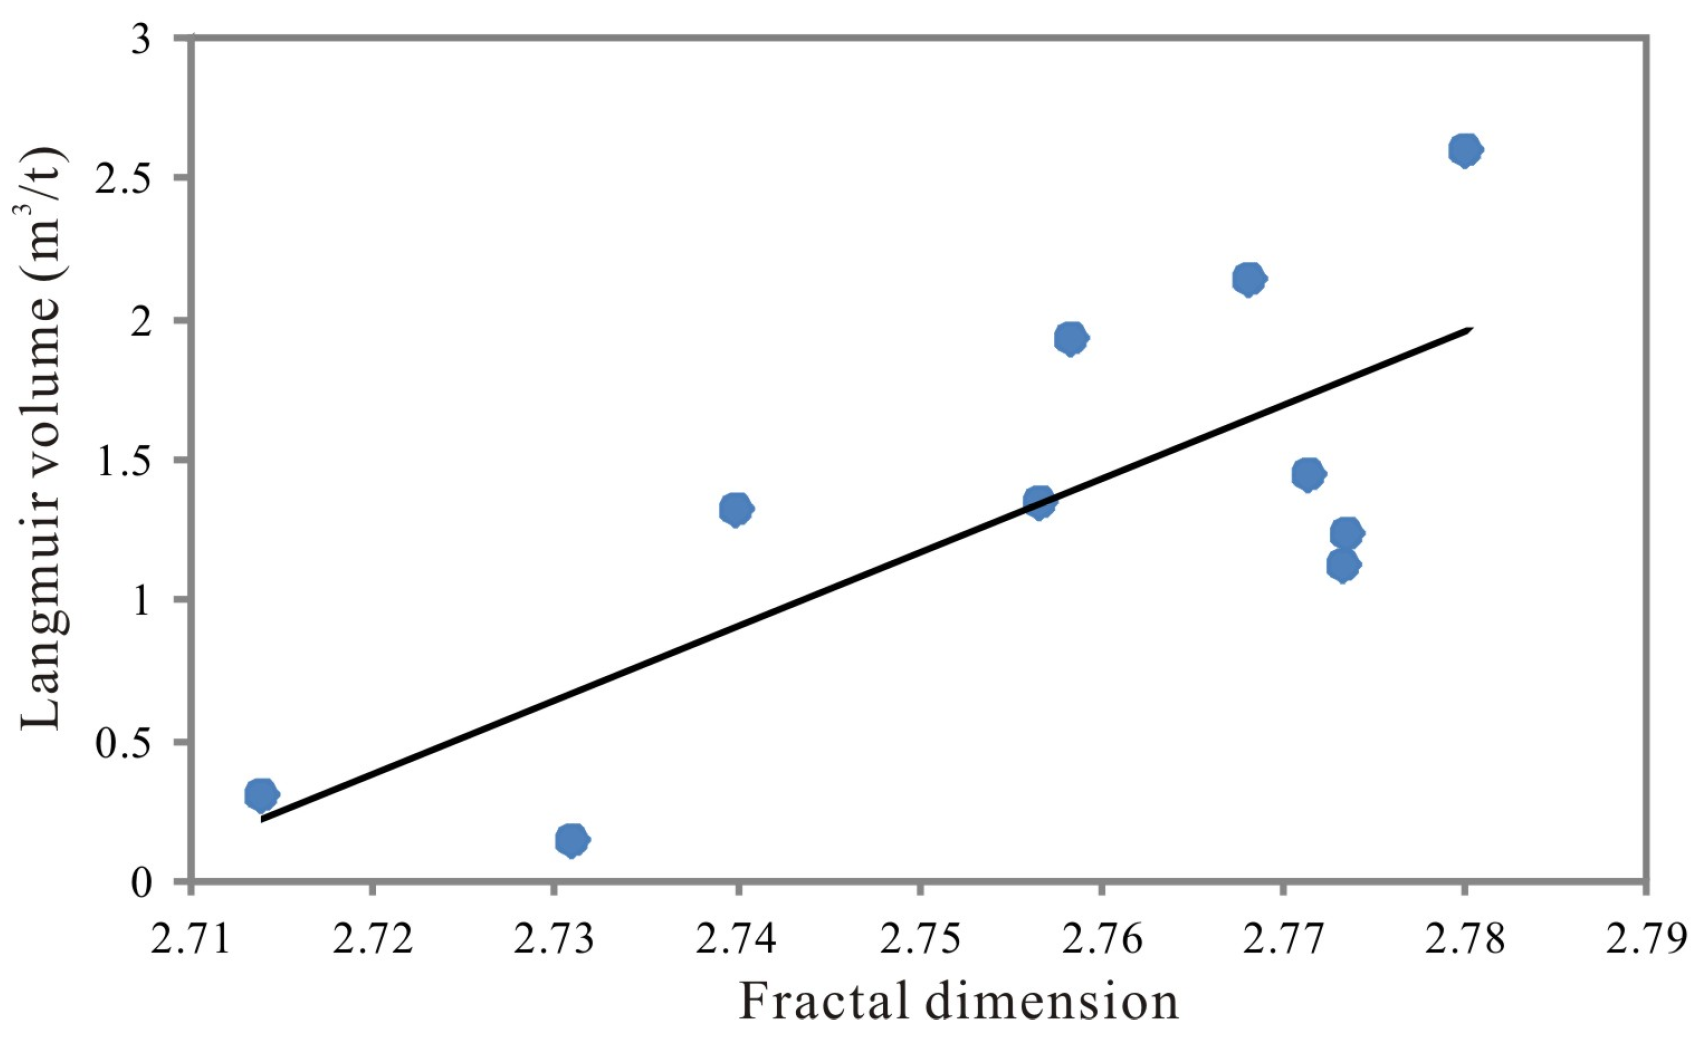
The Langmuir volumes of the shale samples had a positive relationship with fractal dimension (Figure 14), which was consistent with many previous studies of coal and shale [13,14,37,45]. The higher fractal dimension values represented a rough and irregular surface, which provided more adsorption sites and resulted in higher adsorption capacity. According to the results from this study, a higher fractal dimension D resulted in a smaller average pore diameter. Adsorption potential energy is related to the interaction forces between a solid surface and gas molecules and a smaller pore size indicates stronger adsorption potential energy, which results in a greater adsorption interaction between gas molecules and pore surface [63]. Therefore, a higher fractal dimension promotes the adsorption capacity of shale. It is favorable for gas accumulation.
To sum up, the heterogeneity of the pore structure greatly affects gas sorption and flow in shale. The fractal dimension can quantitatively evaluate a shale gas reservoir. The shale with a higher fractal dimension D would have greater adsorption capacity but lower permeability, which makes natural gas diffusion and percolation much more difficult but can provide more adsorption sites.
5. Conclusions
(1) The pore structure of Niutitang shale from the northwestern Hunan Province in China was highly fractal. Fractal dimension D was obtained based on the FHH model and ranged from 2.7139 to 2.7801, indicating that the shale samples had complicated and heterogeneous pore systems.
(2) TOC content was a controlling factor affecting the pore structure of Niutitang shale. The shale samples with higher TOC content had larger BET SSA and BJH PV, leading to a higher fractal dimension and enhanced heterogeneity of the pore structure. Note that pore structure parameters may decrease with increasing TOC content when the TOC content exceeds a certain amount.
(3) The impact of quartz on shale pore structure was found to be relatively weak because the quartz had a smooth surface and developed less pores, whereas SSA, PV and fractal dimension decreased with increasing clay mineral content. Shale with a higher clay mineral content may have more homogeneous pore systems.
(4) Fractal dimension was correlated with the Langmuir volume and permeability. Shale with a higher fractal dimension had greater Langmuir volume, which favors shale gas accumulation but also had lower permeability and pore connectivity.
Acknowledgments
This work was financially supported by the National Science and Technology Major Project of China (grant No. 2017ZX05035001-003). The authors also gratefully acknowledge the China National Administration of Coal Geology for sample support and their permission to publish the results of this study.
Author Contributions
Zhaodong Xi, Shuheng Tang, Jing Wang and Kaifeng Wang conceived and designed the experiments; Zhaodong Xi, Junjie Yi and Yingying Guo performed the experiments; Zhaodong Xi and Shuheng Tang wrote the paper.
Conflicts of Interest
The authors declare no conflict of interest.
References
- Curtis, J.B. Fractured shale-gas systems. AAPG Bull. 2002, 86, 1921–1938. [Google Scholar]
- Gasparik, M.; Bertier, P.; Gensterblum, Y.; Ghanizadeh, A.; Krooss, B.M.; Littke, R. Geological controls on the methane storage capacity in organic-rich shales. Int. J. Coal Geol. 2014, 123, 34–51. [Google Scholar] [CrossRef]
- Fu, H.J.; Wang, X.Z.; Zhang, L.X.; Gao, R.M.; Li, Z.T.; Xu, T.; Zhu, X.L.; Xu, W.; Li, Q. Investigation of the factors that control the development of pore structure in lacustrine shale: A case study of block X in the Ordos Basin, China. J. Nat. Gas Sci. Eng. 2015, 26, 1422–1432. [Google Scholar] [CrossRef]
- Bustin, R.M.; Bustin, A.M.M.; Cui, X.; Ross, D.J.K.; Murthy, P.V.S. Impact of shale properties on pore structure and storage characteristics. Presented at the Shale Gas Production Conference, Fort Worth, TX, USA, 16–18 November 2008. [Google Scholar]
- Loucks, R.G.; Reed, R.M.; Ruppel, S.C.; Jarvie, D.M. Morphology, genesis and distribution of nanometer–scale pores in siliceous mudstones of the Mississippian Barnett shale. J. Sediment. Res. 2009, 79, 848–861. [Google Scholar] [CrossRef]
- Loucks, R.G.; Reed, R.M.; Ruppel, S.C.; Hammes, U. Spectrum of pore types and networks in mudrocks and a descriptive classification for matrix-related mudrock pores. AAPG Bull. 2012, 96, 1071–1098. [Google Scholar] [CrossRef]
- Mastalerz, M.; Schimmelmann, A.; Drobniak, A.; Chen, Y.Y. Porosity of Devonian and Mississippian New Albany Shale across a maturation gradient: Insights from organic petrology, gas adsorption and mercury intrusion. AAPG Bull. 2013, 97, 1621–1643. [Google Scholar] [CrossRef]
- Clarkson, C.R.; Solano, N.; Bustin, R.; Bustin, A.; Chalmers, G.; He, L.; Melnichenko, Y.B.; Radlinski, A.; Blach, T.P. Pore structure characterization of North American shale gas reservoirs using USANS/SANS, gas adsorption and mercury intrusion. Fuel 2013, 103, 606–616. [Google Scholar] [CrossRef]
- Tian, H.; Pan, L.; Xiao, X.M.; Wilkins, R.W.T.; Meng, Z.P.; Huang, B.J. A preliminary study on the pore characterization of Lower Silurian black shales in the Chuandong Thrust Fold Belt, southwestern China using low pressure N2 adsorption and FE-SEM methods. Mar. Pet. Geol. 2013, 48, 8–19. [Google Scholar] [CrossRef]
- Wang, G.C.; Ju, Y.W. Organic shale micropore and mesopore structure characterization by ultra-low pressure N2 physisorption: Experimental procedure and interpretation model. J. Nat. Gas Sci. Eng. 2015, 27, 452–465. [Google Scholar] [CrossRef]
- Yao, Y.B.; Liu, D.; Tang, D.Z.; Tang, S.H.; Huang, W.H. Fractal characterization of adsorption-pores of coals from North China: An investigation on CH4 adsorption capacity of coals. Int. J. Coal Geol. 2008, 73, 27–42. [Google Scholar] [CrossRef]
- Yao, Y.B.; Liu, D.M.; Tang, D.Z.; Tang, S.H.; Huang, W.H.; Liu, Z.; Che, Y. Fractal characterization of seepage-pores of coals from China: An investigation on permeability of coals. Comput. Geosci. 2009, 35, 1159–1166. [Google Scholar] [CrossRef]
- Yang, F.; Ning, Z.F.; Liu, H. Fractal characteristics of shales from a shale gas reservoir in the Sichuan Basin, China. Fuel 2014, 115, 378–384. [Google Scholar] [CrossRef]
- Ji, W.M.; Song, Y.; Jiang, Z.X.; Meng, M.M; Liu, Q.X; Chen, L.; Wang, P.F; Gao, F.L; Huang, H.X. Fractal characteristics of nano-pores in the Lower Silurian Longmaxi shales from the Upper Yangtze Platform, south China. Mar. Petrol. Geol. 2016, 78, 88–98. [Google Scholar] [CrossRef]
- Guo, T.L.; Zhang, H.R. Formation and enrichment mode of Jiaoshiba shale gas field, Sichuan Basin. Petroleum Exploration and Development. Petrol. Exp. Dev. 2014, 41, 28–36. [Google Scholar]
- Zou, C.N.; Dong, D.Z.; Wang, Y.M.; Li, X.J.; Huang, J.L.; Wang, S.F.; Guan, Q.Z.; Zhang, C.C.; Wang, H.Y.; Liu, H.L.; et al. Shale gas in China: Characteristics, challenges and prospects(II). Petrol. Exp. Dev. 2015, 42, 753–767. [Google Scholar] [CrossRef]
- Zhao, W.Z.; Li, J.Z.; Yang, T.; Wang, S.F.; Huang, J.L. Geological difference and its significance of marine shale gases in South China. Petrol. Exp. Dev. 2016, 43, 547–559. [Google Scholar] [CrossRef]
- Wang, Y.; Zhu, Y.M.; Chen, S.B.; Li, W. Characteristics of the nanoscale pore structure in Northwestern Hunan Shale gas reservoirs using field emission scanning electron microscopy, high-pressure mercury intrusion and gas adsorption. Energy Fuel 2014, 28, 945–955. [Google Scholar] [CrossRef]
- Hu, J.G.; Tang, S.H.; Zhang, S.H. Investigation of pore structure and fractal characteristics of the Lower Silurian Longmaxi shales in western Hunan and Hubei Provinces in China. J. Nat. Gas Sci. Eng. 2016, 28, 522–535. [Google Scholar] [CrossRef]
- Wan, Y.; Tang, S.H.; Pan, Z.J. Evaluation of the shale gas potential of the lower Silurian Longmaxi Formation in northwest Hunan Province, China. Mar. Petrol. Geol. 2017, 79, 159–175. [Google Scholar] [CrossRef]
- Wang, R.Y.; Gu, Y.; Ding, W.L.; Gong, D.J.; Yin, S.; Wang, X.H.; Zhou, X.H.; Li, A.; Xiao, Z.K.; Cui, Z.X. Characteristics and dominant controlling factors of organic-rich marine shales with high thermal maturity: A case study of the Lower Cambrian Niutitang Formation in the Cen’gong block, southern China. J. Nat. Gas Sci. Eng. 2016, 33, 81–96. [Google Scholar] [CrossRef]
- Tang, S.H.; Fan, E.P.; Zhang, S.H.; Jiang, W. Reservior characteristics and gas-bearing capacity of the Lower Palaeozoic marine shales in Northwestern Hunan. Geo. Sci. Front. 2016, 23, 135–146. [Google Scholar]
- Lin, T.; Zhang, J.C.; Li, B.; Yang, S.; He, W.; Tang, X.; Ma, L.; Pei, S. Shale gas accumulation conditions and gas-bearing properties of the Lower Cambrian Niutitang Formation in Well Changye 1, northwestern Hunan. Acta Pet. Sin. 2014, 35, 839–846. [Google Scholar]
- Tan, J.Q.; Horsfield, B.; Fink, R.; Krooss, B.; Schulz, H.; Rybacki, E.; Zhang, J.C.; Boreham, C.J.; van Graas, G.; Tocher, B. Shale Gas Potential of the Major Marine Shale Formations in the Upper Yangtze Platform, South China, Part III: Mineralogical, Lithofacial, Petrophysical and Rock Mechanical Properties. Energy Fuels 2014, 28, 2322–2342. [Google Scholar] [CrossRef]
- Yang, X.Q.; Fan, T.L.; Wu, Y. Lithofacies and cyclicity of the Lower Cambrian Niutitang shale in the Mayang Basin of western Hunan, South China. J. Nat. Gas Sci. Eng. 2016, 28, 74–86. [Google Scholar] [CrossRef]
- Schoenherr, J.; Littke, R.; Urai, J.L.; Kukla, P.A.; Rawahi, Z. Polyphase thermal evolution in the Infra-Cambrian Ara group (South Oman Salt Basin) as deduced by maturity of solid reservoir bitumen. Org. Geochem. 2007, 38, 1293–1318. [Google Scholar] [CrossRef]
- Dang, W.; Zhang, J.C.; Tang, X.; Chen, Q.; Han, S.B.; Li, Z.M.; Du, X.R.; Wei, X.L.; Zhang, M.Q.; Liu, J.; et al. Shale gas potential of Lower Permian marine-continental transitional black shales in the Southern North China Basin, central China: Characterization of organic geochemistry. J. Nat. Gas Sci. Eng. 2016, 28, 639–650. [Google Scholar] [CrossRef]
- Chalmers, G.R.; Bustin, R.M.; Power, I.M. Characterization of gas shale pore systems by porosimetry, pycnometry, surface area and field emission scanning electron microscopy/transmission electron microscopy image analyses: Examples from the Barnett, Woodford, Haynesville, Marcellus and Doig units. AAPG Bull. 2012, 96, 1099–1119. [Google Scholar] [CrossRef]
- Barrett, E.P.; Joyner, L.G.; Halenda, P.P. The determination of pore volume and area distribution in porous substances. I. Computations from nitrogen isotherms. J. Am. Chem. Soc. 1951, 73, 373–380. [Google Scholar] [CrossRef]
- Brunauer, S.; Emmett, P.H.; Teller, E. Adsorption of gases in multimolecular layers. J. Am. Chem. Soc. 1938, 60, 309–319. [Google Scholar] [CrossRef]
- De Boer, J.H.; Lippens, B.C.; Linsen, B.G.; Broekhoff, J.C.P.; van den Heuvel, A.; Osinga, T.J. The t-curve of multimolecular N2-adsorption. J. Colloid Interf. Sci. 1963, 21, 405–414. [Google Scholar] [CrossRef]
- Wei, M.M.; Zhang, L.; Xiong, Y.Q.; Li, J.H.; Peng, P.A. Nanopore structure characterization for organic-rich shale using the non-local-density functional theory by a combination of N2 and CO2 adsorption. Microporous Mesoporous Mater. 2016, 227, 88–94. [Google Scholar] [CrossRef]
- Zhang, T.W.; Ellis, G.S.; Rupple, S.C.; Milliken, K.; Yang, R. Effect of organic matter type and thermal maturity on methane adsorption in shale-gas systems. Org. Geochem. 2012, 47, 120–131. [Google Scholar] [CrossRef]
- Tian, H.; Li, T.F.; Zhang, T.W.; Xiao, X.M. Characterization of methane adsorption on overmature Lower Silurian–Upper Ordovician shales in Sichuan Basin, southwest China: Experimental results and geological implications. Int. J. Coal Geol. 2016, 156, 36–49. [Google Scholar] [CrossRef]
- Mandelbrot, B.B. Les Objects Fractals: Forme, Hasard et Dimension; Flammarion: Paris, France, 1984. [Google Scholar]
- Pape, H.; Clauser, C.; Iffland, J. Permeability prediction based on fractal porespace geometry. Geophysics 1999, 64, 1447–1460. [Google Scholar] [CrossRef]
- Cai, Y.D.; Liu, D.M.; Pan, Z.J.; Yao, Y.B.; Li, J.; Qiu, Y. Pore structure and its impact on CH4 adsorption capacity and flow capability of bituminous and subbituminous coals from Northeast China. Fuel 2013, 103, 258–268. [Google Scholar] [CrossRef]
- Tang, X.L; Jiang, Z.X.; Li, Z.; Gao, Z.Y.; Bai, Y.Q.; Zhao, S.; Feng, J. The effect of the variation in material composition on the heterogeneous pore structure of high-maturity shale of the Silurian Longmaxi formation in the southeastern Sichuan Basin, China. J. Nat. Gas Sci. Eng. 2015, 23, 464–473. [Google Scholar] [CrossRef]
- Li, A.; Ding, W.L.; He, J.H.; Dai, P.; Yin, S.; Xie, F. Investigation of pore structure and fractal characteristics of organicrich shale reservoirs: A case study of Lower Cambrian Qiongzhusi formation in Malong block of eastern Yunnan Province, South China. Mar. Pet. Geol. 2016, 70, 46–57. [Google Scholar] [CrossRef]
- Pfeifer, P.; Avnir, D. Chemistry in noninteger dimensions between 2 and 3, I: Fractal theory of heterogeneous surface. J. Chem. Phys. 1983, 79, 3558–3565. [Google Scholar] [CrossRef]
- Avnir, D.; Jaroniec, M. An isotherm equation for adsorption on fractal surfaces of heterogeneous porous materials. Langmuir 1989, 5, 1431–1433. [Google Scholar] [CrossRef]
- Jaroniec, M. Evaluation of the fractal dimension from a single adsorption isotherm. Langmuir 1995, 11, 2316–2317. [Google Scholar] [CrossRef]
- Wang, M.; Xue, H.T.; Tian, S.; Wilkins, R.; Wang, Z. Fractal characteristics of Upper Cretaceous lacustrine shale from the Songliao Basin, NE China. Mar. Petrol. Geol. 2015, 67, 144–153. [Google Scholar] [CrossRef]
- Bu, H.J.; Ju, Y.W.; Tan, J.Q.; Wang, G.C.; Li, X.S. Fractal characteristics of pores in non-marine shales from the Huainan coalfield, eastern China. J. Nat. Gas Sci. Eng. 2015, 24, 166–177. [Google Scholar] [CrossRef]
- Jiang, F.J.; Chen, D.; Chen, J.; Li, Q.W.; Liu, Y.; Shao, X.H.; Hu, T.; Dai, J.X. Fractal Analysis of Shale Pore Structure of Continental Gas Shale Reservoir in the Ordos Basin, NW China. Energy Fuels 2016, 30, 4676–4689. [Google Scholar] [CrossRef]
- Sun, M.D.; Yu, B.S.; Hu, Q.H.; Chen, S.; Xia, W.; Ye, R.C. Nanoscale pore characteristics of the Lower Cambrian Niutitang Formation Shale: A case study from Well Yuke#1 in the Southeast of Chongqing, China. Int. J. Coal Geol. 2016, 154–155, 16–29. [Google Scholar]
- Qi, H.; Ma, J.; Wong, P. Adsorption isotherms of fractal surfaces. Colloids Surf. 2002, A206, 401–407. [Google Scholar] [CrossRef]
- Yang, R.; Hao, F.; He, S.; He, C.C.; Guo, X.S.; Yi, J.Z.; Hu, H.Y.; Zhang, S.W.; Hu, Q.H. Experimental investigations on the geometry and connectivity of pore space in organic-rich Wufeng and Longmaxi shales. Mar. Pet. Geol. 2017, 84, 225–242. [Google Scholar] [CrossRef]
- Bustin, R.M.; Bustin, A.; Ross, D. Shale gas opportunities and challenges. Search Discov. Articles 2009, 40382, 20–23. [Google Scholar]
- Nie, H.S.; Tang, X.; Bian, R. Controlling factors for shale gas accumulation and prediction of potential development area in shale gas reservoir of South China. Acta Pet. Sin. 2009, 30, 484–490. [Google Scholar]
- Washburn, E.W. Note on a method of determining the distribution of pore sizes in a porous material. Proc. Natl. Acad. Sci. USA 1921, 7, 115–116. [Google Scholar] [CrossRef] [PubMed]
- Jiao, K.; Yao, S.P.; Liu, C.; Gao, Y.Q.; Wu, H.; Li, M.C.; Tang, Z.Y. The characterization and quantitative analysis of nanopores in unconventional gas reservoirs utilizing FESEM-FIB and image processing: An example from the lower Silurian Longmaxi Shale, upper Yangtze region, China. Int. J. Coal Geol. 2014, 128, 1–11. [Google Scholar] [CrossRef]
- Cao, T.T.; Song, Z.G.; Wang, X.B.; Xia, J. Characterization of pore structure and fractal dimension of Paleozoic shales from the northeastern Sichuan Basin, China. J. Nat. Gas Sci. Eng. 2016, 35, 882–895. [Google Scholar] [CrossRef]
- Xi, Z.D.; Tang, S.H.; Zhang, S.H.; Sun, K. Pore structure characteristics of marine–continental transitional shale: A case study in the Qinshui Basin, China. Energy Fuels. 2017, 31, 7854–7866. [Google Scholar] [CrossRef]
- Xi, Z.D.; Tang, S.H.; Zhang, S.H.; Li, J. Nano-Scale Pore Structure of Marine-Continental Transitional Shale from Liulin Area, the Eastern Margin of Ordos Basin, China. J. Nanosci. Nanotechnol. 2017, 17, 6109–6123. [Google Scholar] [CrossRef]
- Yang, C.; Zhang, J.C.; Wang, X.Z.; Tang, X.; Chen, Y.C.; Jiang, L.L.; Gong, X. Nanoscale pore structure and fractal characteristics of a marine-continental transitional shale: A case study from the lower Permian Shanxi Shale in the southeastern Ordos Basin, China. Mar. Pet. Geol. 2017, 88, 54–68. [Google Scholar] [CrossRef]
- Xiong, J.; Liu, X.J.; Liang, L.X. An Investigation of Fractal Characteristics of Marine Shales in the Southern China from Nitrogen Adsorption Data. J. Chem. 2015, 2015, 1–12. [Google Scholar] [CrossRef]
- Liu, X.J.; Xiong, J.; Liang, L.X. Investigation of pore structure and fractal characteristics of organic-rich Yanchang formation shale in central China by nitrogen adsorption/desorption analysis. J. Nat. Gas Sci. Eng. 2015, 22, 62–72. [Google Scholar] [CrossRef]
- Milliken, K.L.; Rudnicki, M.; Awwiller, D.N.; Zhang, T.W. Organic matter-hosted pore system, marcellus formation (Devonian), Pennsylvania. AAPG Bull. 2013, 97, 177–200. [Google Scholar] [CrossRef]
- Fishman, N.S.; Hackley, P.C.; Lowers, H.A.; Hill, R.J.; Egenhoff, S.O.; Eberl, D.D.; Blum, A.E. The nature of porosity in organic-rich mudstones of the Upper Jurassic Kimmeridge Clay Formation, North Sea, offshore United Kingdom. Int. J. Coal Geol. 2012, 103, 32–50. [Google Scholar] [CrossRef]
- Chen, J.; Xiao, X. Evolution of nanoporosity in organic-rich shales during thermal maturation. Fuel 2014, 129, 173–181. [Google Scholar] [CrossRef]
- Chen, J.; Jiang, F.J.; Hu, T.; Wang, Z.F.; Xu, Z.Y.; Peng, J.W.; Chen, D.; Li, L.L. Experimental investigation of the characteristics of organic matter pores in Chang 7 member lacustrine shale from the Ordos Basin due to organic matter evolution induced by hydrous pyrolysis. J. Nat. Gas Sci. Eng. 2016, 35, 412–424. [Google Scholar] [CrossRef]
- Gregg, S.J.; Sing, K.S.W. Adsorption, Surface Area and Porosity; Academic Press: New York, NY, USA, 1982. [Google Scholar]
Figure 1.
Location of the study area in northwestern Hunan Province, China.

Figure 2.
Thermal maturity of shale gas plays from North America and southern China.

Figure 3.
Relationships between total organic carbon (TOC) content and quartz content (a) and clay content (b).
Figure 3.
Relationships between total organic carbon (TOC) content and quartz content (a) and clay content (b).

Figure 4.
(a) The relationships between mercury injection/ejection and pore width, and (b) the pore size distribution of the shale samples using mercury injection data and the Washburn equation.
Figure 4.
(a) The relationships between mercury injection/ejection and pore width, and (b) the pore size distribution of the shale samples using mercury injection data and the Washburn equation.

Figure 5.
(a) Low-temperature N2 adsorption–desorption isotherms for the shale samples and (b) pore size distribution derived from isotherm N2 adsorption branches using the BJH model.
Figure 5.
(a) Low-temperature N2 adsorption–desorption isotherms for the shale samples and (b) pore size distribution derived from isotherm N2 adsorption branches using the BJH model.

Figure 6.
Plots of ln(V) vs. ln(ln(P0/P)) reconstructed from the N2 adsorption isotherms of two typical shale samples: (a) Sample SY-1 and (b) Sample SY-2.
Figure 6.
Plots of ln(V) vs. ln(ln(P0/P)) reconstructed from the N2 adsorption isotherms of two typical shale samples: (a) Sample SY-1 and (b) Sample SY-2.

Figure 7.
Effect of TOC content on pore structure parameters in Niutitang shale: (a) Brunauer-Emmett-Teller specific surface area (BET SSA); (b) Barrette-Joynere-Halenda pore volume (BJH PV); (c) Micropore SSA (obtained using the t-plot method based on N2 adsorption); (d) Fractal dimension.
Figure 7.
Effect of TOC content on pore structure parameters in Niutitang shale: (a) Brunauer-Emmett-Teller specific surface area (BET SSA); (b) Barrette-Joynere-Halenda pore volume (BJH PV); (c) Micropore SSA (obtained using the t-plot method based on N2 adsorption); (d) Fractal dimension.

Figure 8.
Effect of clay minerals and quartz content on pore structure parameters (BET SSA, BJH PV and fractal dimension) in the shale samples. (a) Relationship between quartz content and BET SSA; (b) Relationship between quartz content and BJH PV; (c) Relationship between quartz content and fractal dimension; (d) Relationship between clays content and BET SSA; (e) Relationship between clays content and BJH PV; (f) Relationship between clays content and fractal dimension.

Figure 9.
Scanning electron microscopy (SEM) images of Niutitang shale samples in the study area: (a) quartz contained fewer pores and has smooth surfaces, sample 4, and (b) quartz has smooth surfaces and no pores can be observed, sample 4.
Figure 9.
Scanning electron microscopy (SEM) images of Niutitang shale samples in the study area: (a) quartz contained fewer pores and has smooth surfaces, sample 4, and (b) quartz has smooth surfaces and no pores can be observed, sample 4.

Figure 10.
(a) Relationship between SSA and PV and (b) relationships between average pore diameter and PV, (c) SSA.
Figure 10.
(a) Relationship between SSA and PV and (b) relationships between average pore diameter and PV, (c) SSA.

Figure 11.
Relationships between fractal dimension and SSA (a), PV (b) and average pore diameter (c).
Figure 11.
Relationships between fractal dimension and SSA (a), PV (b) and average pore diameter (c).


Figure 12.
The relationship between fractal dimension and permeability.

Figure 13.
Relationship between tortuosity and permeability (a) and the relationship between fractal dimension and tortuosity (b).
Figure 13.
Relationship between tortuosity and permeability (a) and the relationship between fractal dimension and tortuosity (b).

Figure 14.
Relationship between fractal dimension and Langmuir volume.


Table 1.
Geochemical data and the calculated results of hydrocarbon generative potential.
| Unit | Sample ID | Depth (m) | TOC (%) | Ro (%) | S1 (mg/g) | S2 (mg/g) | Sapropelinite (%) | Inertinite (%) | TI | OM Type | HI (mg HC/gTOC) |
|---|---|---|---|---|---|---|---|---|---|---|---|
| Niutitang Formation | SY-1 | 1009.6 | 0.58 | 2.87 | 0.01 | 0.30 | 88 | 12 | 76 | II1 | 5.1 |
| SY-2 | 1017.6 | 1.23 | 2.79 | 0.00 | 0.06 | 82 | 18 | 64 | II1 | 4.8 | |
| SY-3 | 1026.2 | 1.51 | 2.24 | 0.00 | 0.06 | 87 | 13 | 74 | II1 | 3.9 | |
| SY-4 | 1027.7 | 0.94 | 3.14 | 0.00 | 0.08 | 84 | 16 | 68 | II1 | 8.5 | |
| SY-5 | 1031 | 2.28 | 2.88 | 0.03 | 0.073 | 89 | 11 | 78 | II1 | 3.2 | |
| SY-6 | 1046.4 | 1.54 | 3.01 | 0.00 | 0.07 | 85 | 15 | 70 | II1 | 4.5 | |
| SY-7 | 1062.3 | 0.97 | 3.22 | 0.00 | 0.02 | 87 | 13 | 74 | II1 | 2.1 | |
| SY-8 | 1069.7 | 5.42 | 3.15 | 0.01 | 0.33 | 88 | 12 | 76 | II1 | 6.2 | |
| SY-9 | 1077.3 | 3.54 | 3.42 | 0.00 | 0.07 | 84 | 16 | 68 | II1 | 1.9 | |
| SY-10 | 1081.2 | 7.06 | 3.34 | 0.10 | 0.38 | 84 | 16 | 68 | II1 | 5.3 |
Note: HI = hydrogen index (S2 × 100/TOC) (mg HC/g TOC); TI = type index, TI = 100 × %sapropelinite + 50 × %liptinite + (−75) × %virtrinite + (−100) × %inertinite and TI > 80, < 80–40, < 40–0 and < 0 indicate Type I, Type II1, Type II2 and Type III, respectively.
Table 2.
Mineralogical composition of the shale samples.
| Sample ID | Mineral Composition | Clay | |||||
|---|---|---|---|---|---|---|---|
| Quartz | Feldspar | Calcite | Clay | Illite | Illite/Smectite | Chlorite | |
| SY-1 | 53 | 14 | / | 32 | 40 | 39 | 21 |
| SY-2 | 52 | 24 | / | 21 | 44 | 32 | 24 |
| SY-3 | 40 | 23 | 11 | 22 | 31 | 48 | 21 |
| SY-4 | 54 | 19 | 4 | 21 | 31 | 36 | 33 |
| SY-5 | 44 | 16 | 3 | 22 | 52 | 33 | 15 |
| SY-6 | 50 | 19 | / | 25 | 34 | 44 | 22 |
| SY-7 | 54 | 17 | / | 25 | 33 | 37 | 30 |
| SY-8 | 57 | 14 | 5 | 20 | 36 | 40 | 24 |
| SY-9 | 48 | 8 | 9 | 18 | 62 | 33 | 5 |
| SY-10 | 49 | 8 | 9 | 18 | 75 | 21 | 4 |
Note: “/” = Not detected.
Table 3.
Porosity, permeability and methane adsorption results for the shale samples.
| Sample ID | Porosity (%) | Permeability (μD) | Langmuir Volume (m3/t) | Langmuir Pressure (MPa) |
|---|---|---|---|---|
| SY-1 | 4.06 | 0.98 | 0.30 | 1.49 |
| SY-2 | 3.60 | 0.90 | 1.32 | 4.02 |
| SY-3 | 2.98 | 0.56 | 2.13 | 3.83 |
| SY-4 | 3.48 | 0.84 | 0.13 | 0.39 |
| SY-5 | 2.65 | 0.33 | 1.44 | 0.60 |
| SY-6 | 3.71 | 0.79 | 1.92 | 9.52 |
| SY-7 | 1.69 | 0.77 | 1.34 | 0.82 |
| SY-8 | 1.53 | 0.38 | 1.12 | 3.17 |
| SY-9 | 3.22 | 0.59 | 1.23 | 3.55 |
| SY-10 | 2.28 | 0.55 | 2.59 | 5.19 |
Table 4.
Fractal dimensions of pores obtained from N2 physisorption of the shale samples.
| Sample ID | Fitting Equation | Fractal Dimension D | Fitting Coefficient |
|---|---|---|---|
| SY-1 | y = −0.2861x + 1.3956 | 2.7139 | 0.9886 |
| SY-2 | y = −0.2599x + 1.6649 | 2.7401 | 0.9866 |
| SY-3 | y = −0.2317x + 1.3863 | 2.7683 | 0.989 |
| SY-4 | y = −0.2689x + 1.9827 | 2.7311 | 0.9842 |
| SY-5 | y = −0.2284x + 1.7546 | 2.7716 | 0.9886 |
| SY-6 | y = −0.2414x + 1.7136 | 2.7586 | 0.9881 |
| SY-7 | y = −0.2433x + 1.1076 | 2.7567 | 0.9915 |
| SY-8 | y = −0.2266x + 1.2799 | 2.7734 | 0.9953 |
| SY-9 | y = −0.2264x + 1.5696 | 2.7736 | 0.9837 |
| SY-10 | y = −0.2199x + 1.7932 | 2.7139 | 0.9835 |
© 2018 by the authors. Licensee MDPI, Basel, Switzerland. This article is an open access article distributed under the terms and conditions of the Creative Commons Attribution (CC BY) license (http://creativecommons.org/licenses/by/4.0/).
Share and Cite
MDPI and ACS Style
Xi, Z.; Tang, S.; Wang, J.; Yi, J.; Guo, Y.; Wang, K. Pore Structure and Fractal Characteristics of Niutitang Shale from China. Minerals 2018, 8, 163. https://0-doi-org.brum.beds.ac.uk/10.3390/min8040163
AMA Style
Xi Z, Tang S, Wang J, Yi J, Guo Y, Wang K. Pore Structure and Fractal Characteristics of Niutitang Shale from China. Minerals. 2018; 8(4):163. https://0-doi-org.brum.beds.ac.uk/10.3390/min8040163
Chicago/Turabian StyleXi, Zhaodong, Shuheng Tang, Jing Wang, Junjie Yi, Yingying Guo, and Kaifeng Wang. 2018. "Pore Structure and Fractal Characteristics of Niutitang Shale from China" Minerals 8, no. 4: 163. https://0-doi-org.brum.beds.ac.uk/10.3390/min8040163
Note that from the first issue of 2016, this journal uses article numbers instead of page numbers. See further details here.