Property and Microstructure of Waterborne Self-Setting Geopolymer Coating: Optimization Effect of SiO2/Na2O Molar Ratio

Abstract
:1. Introduction
2. Materials and Methods
2.1. Materials
2.2. Test Methods
- fp is the penetration resistance, MPa;
- Np is the static pressure force at 25 mm depth of geopolymer;
- Ap is the area of test needle, 20 mm2.
3. Results
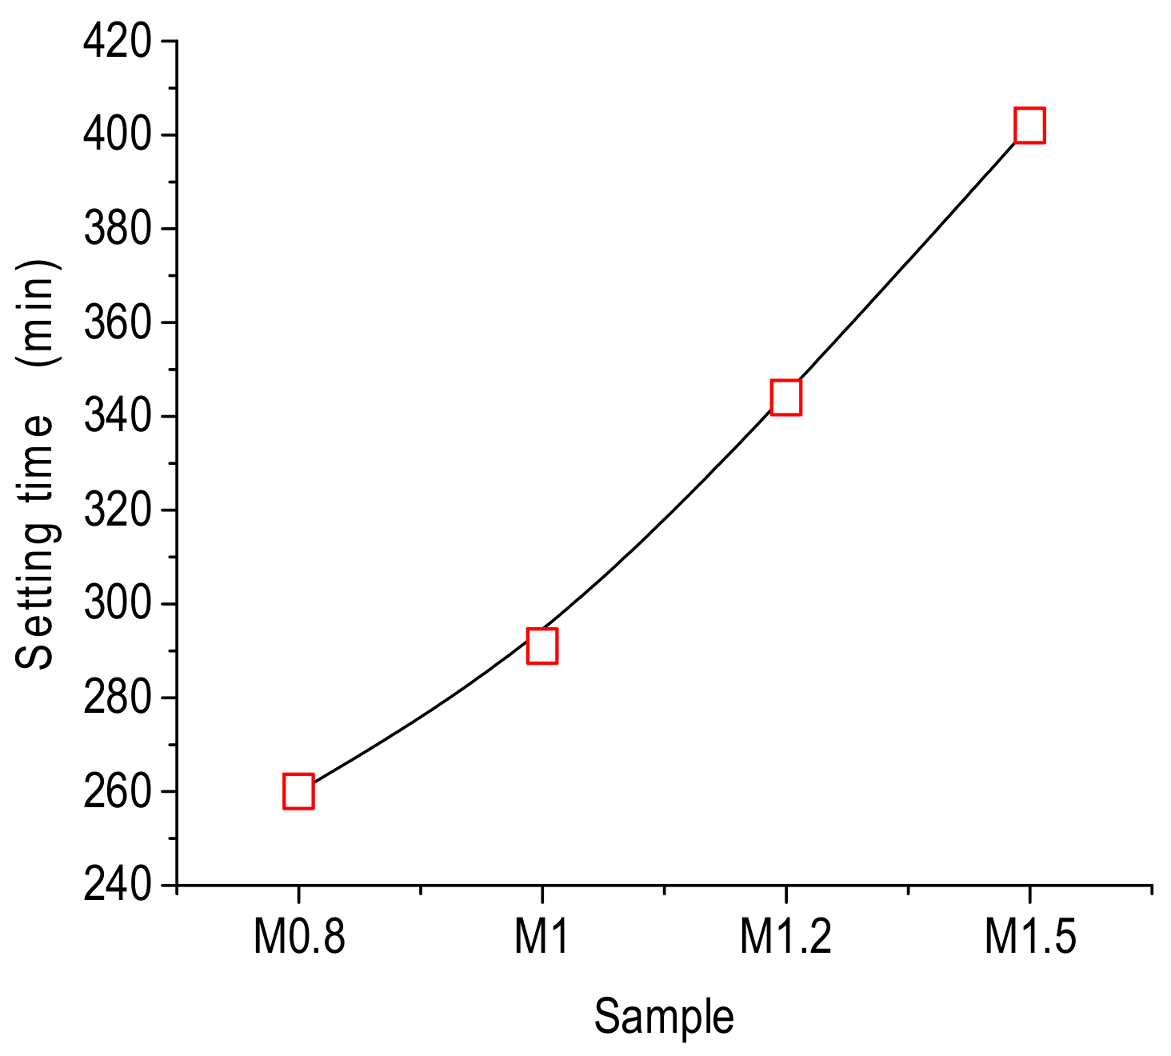
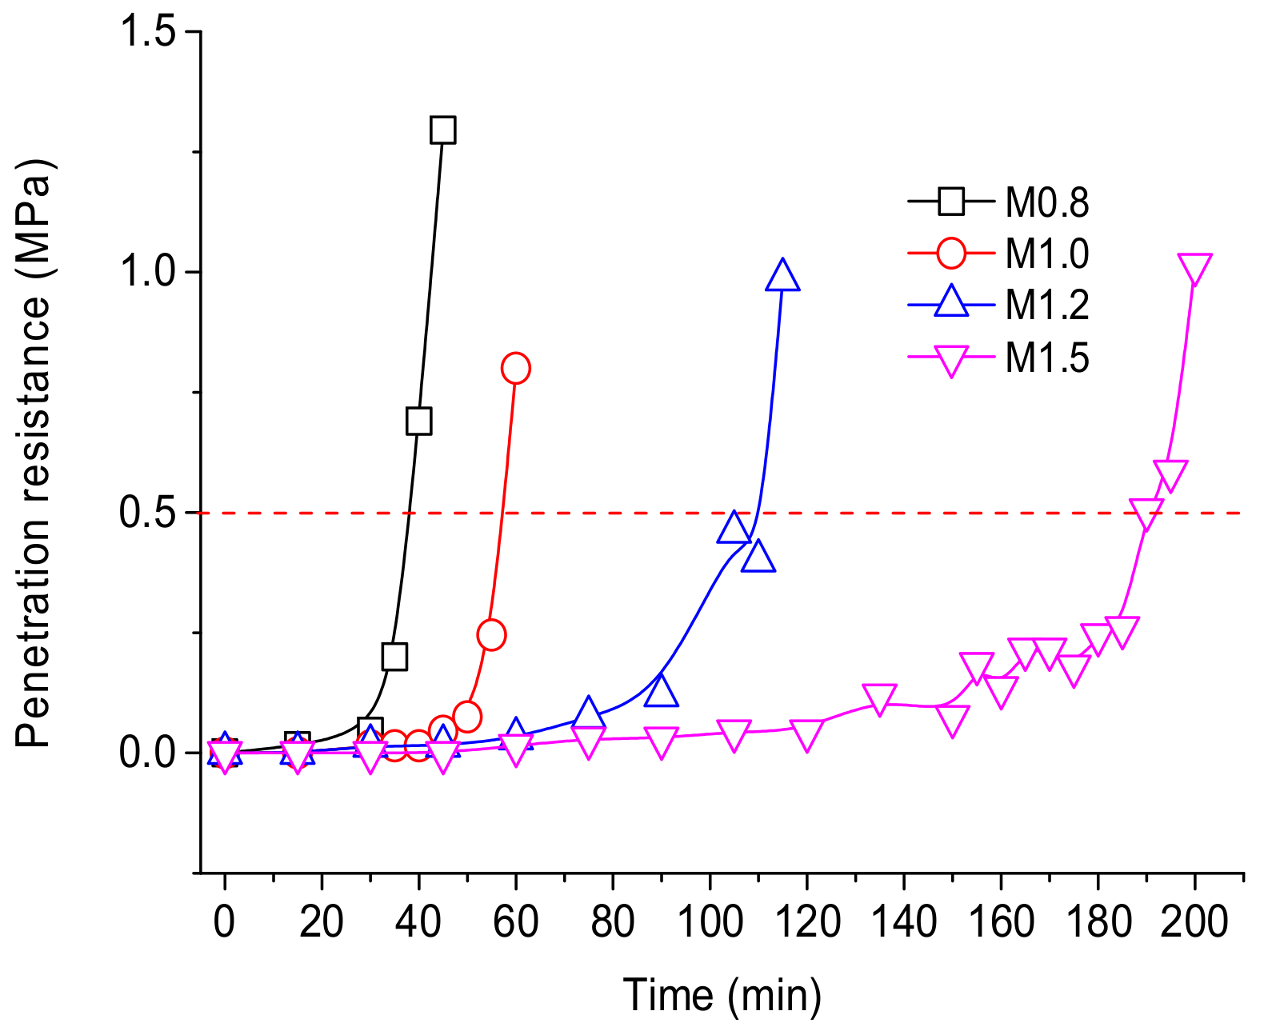
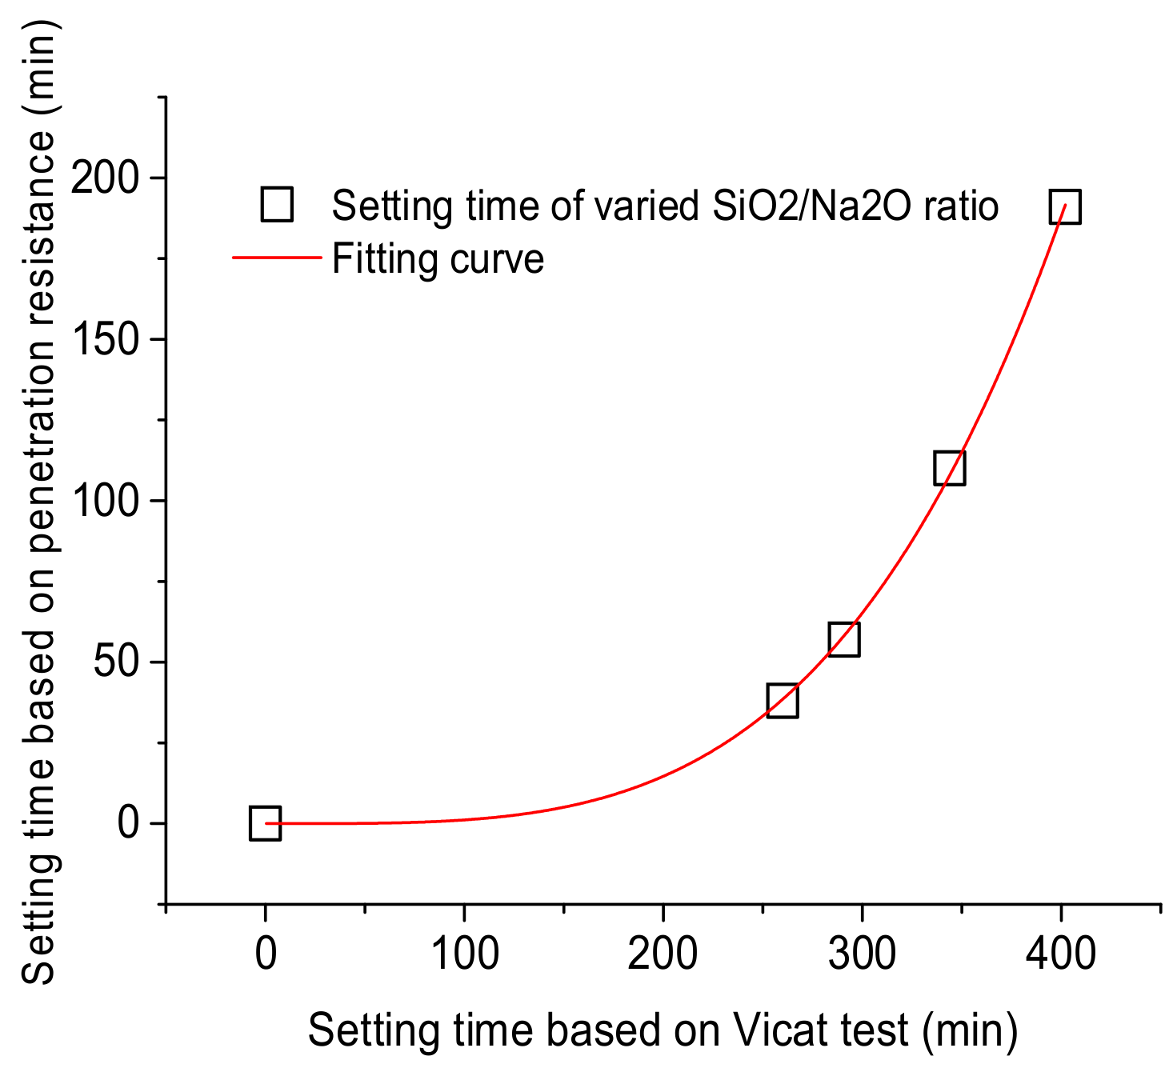
3.1. Setting Time
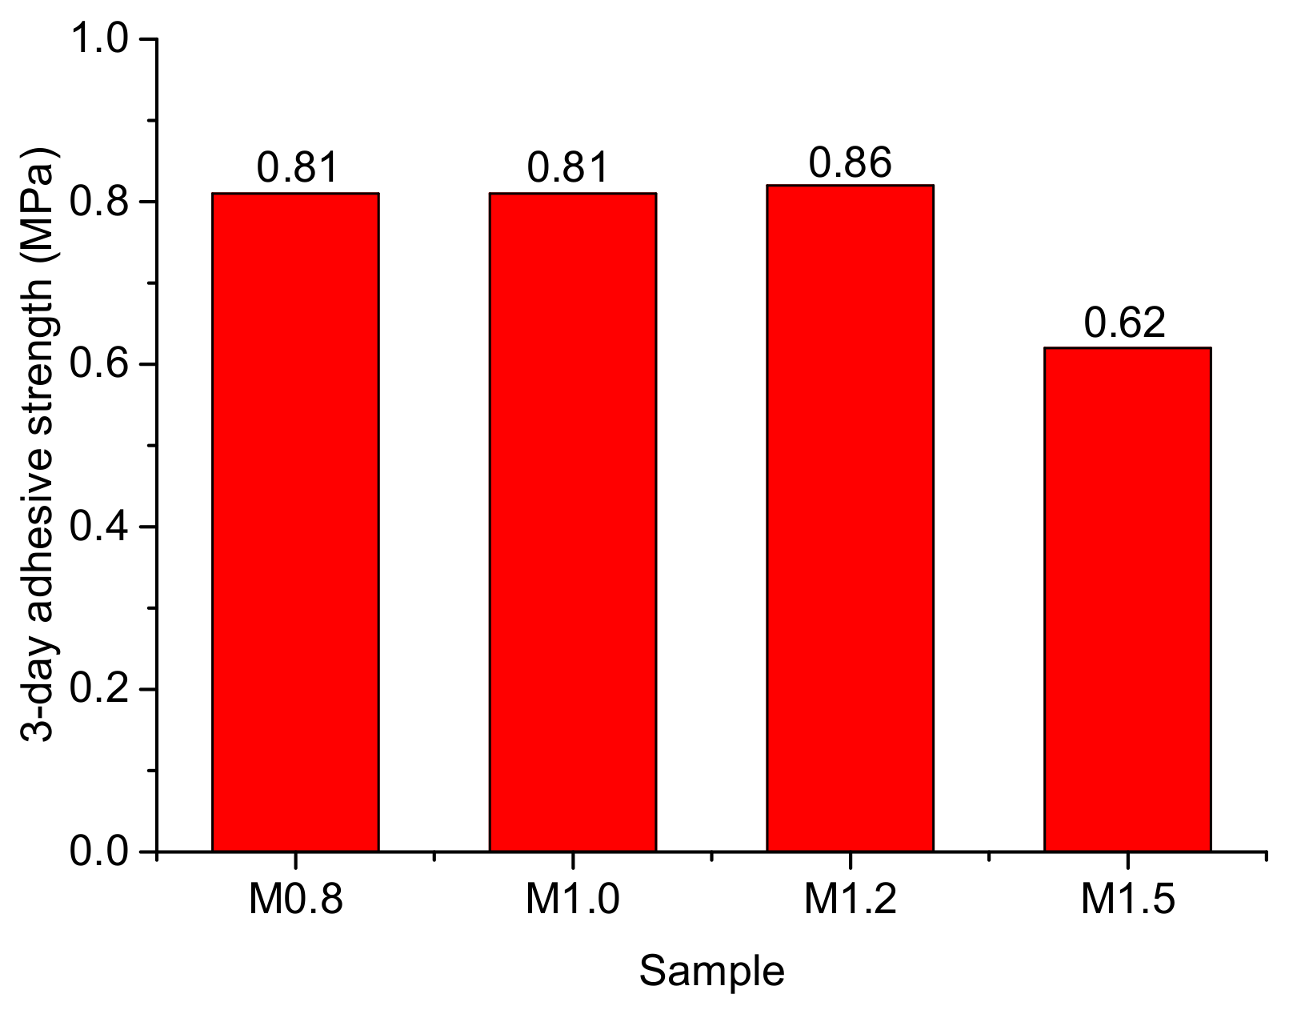
3.2. Adhesive Strength
3.3. Shrinkage Deformation
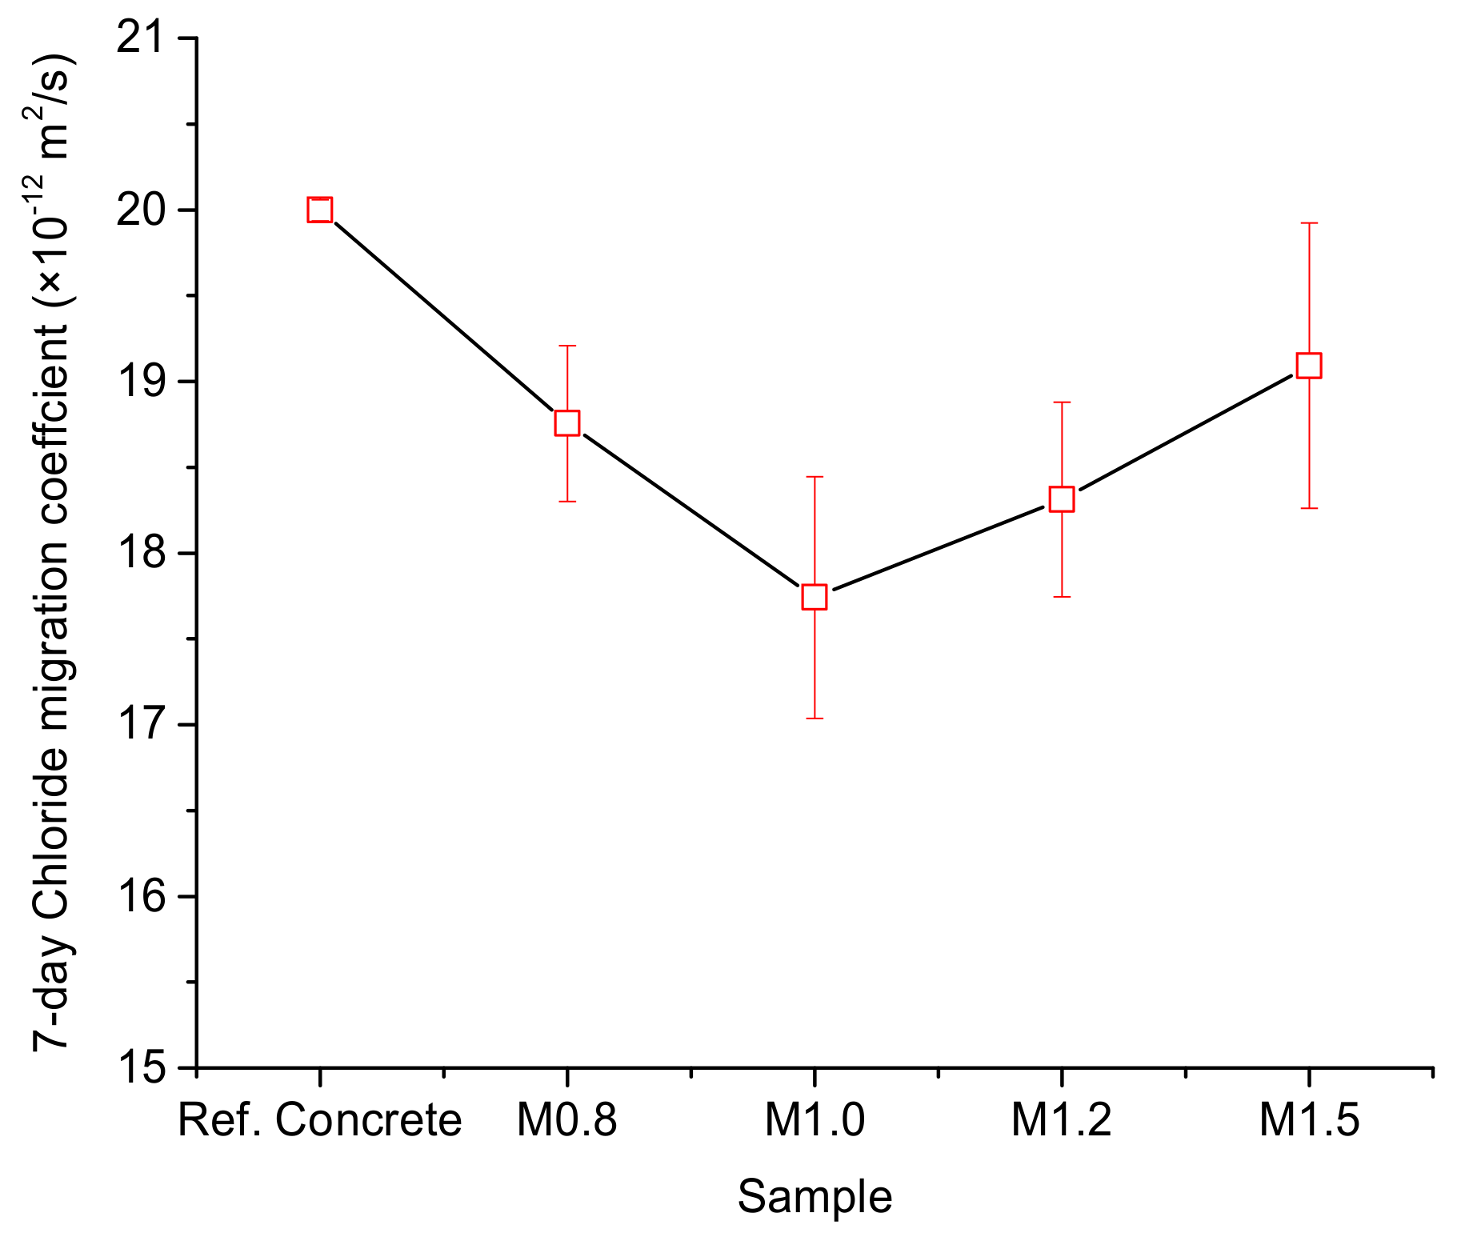
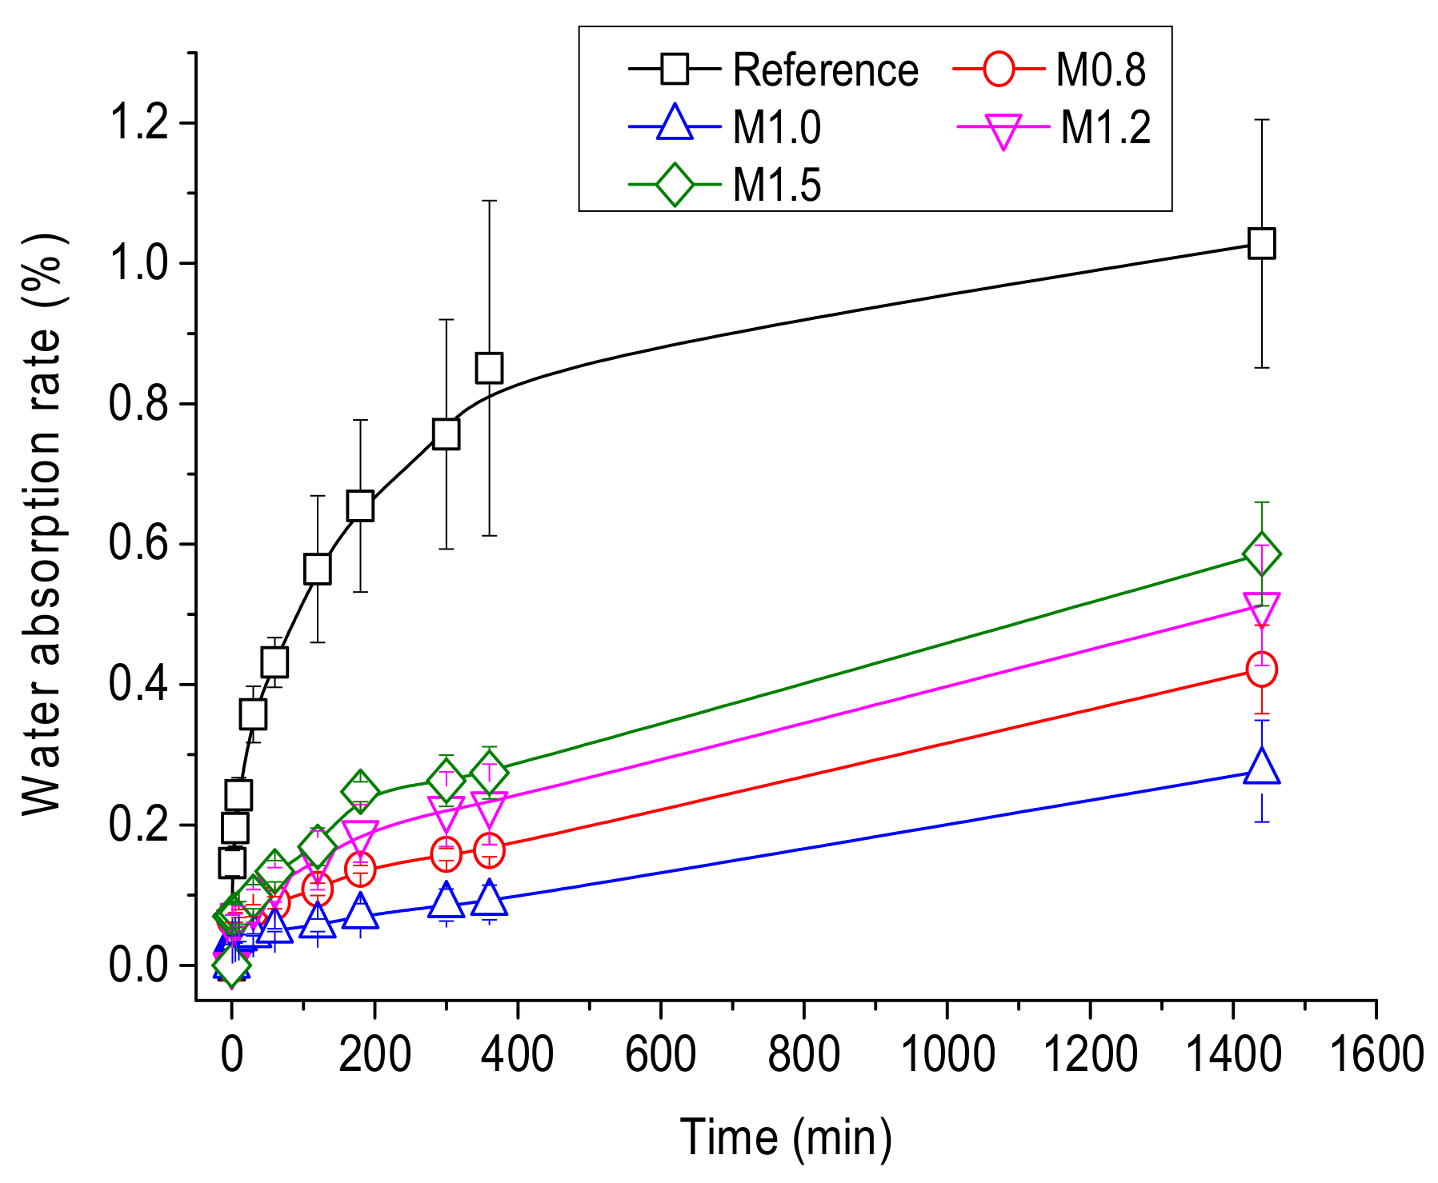
3.4. Permeability
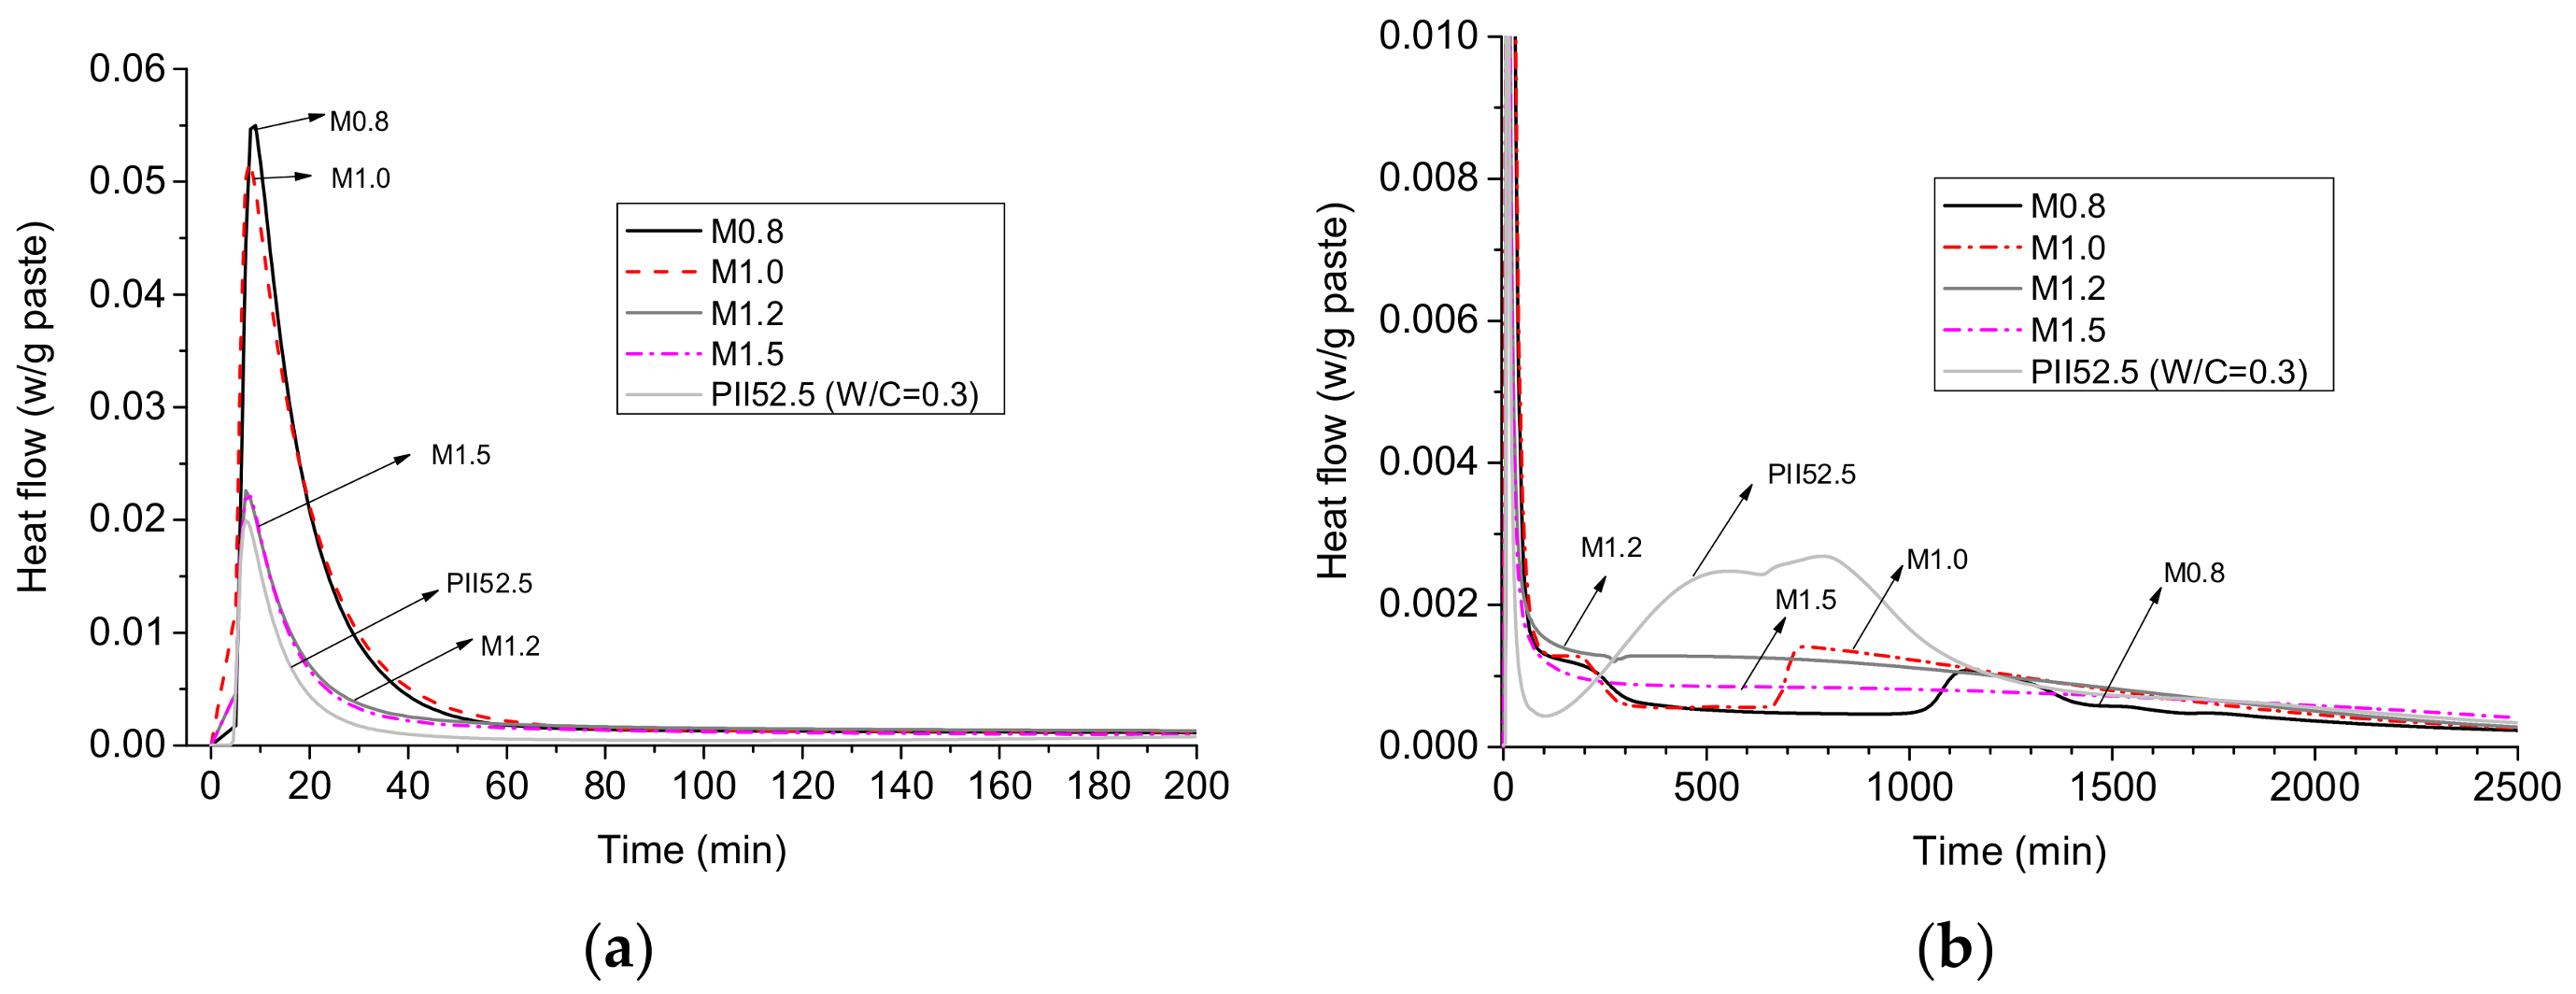
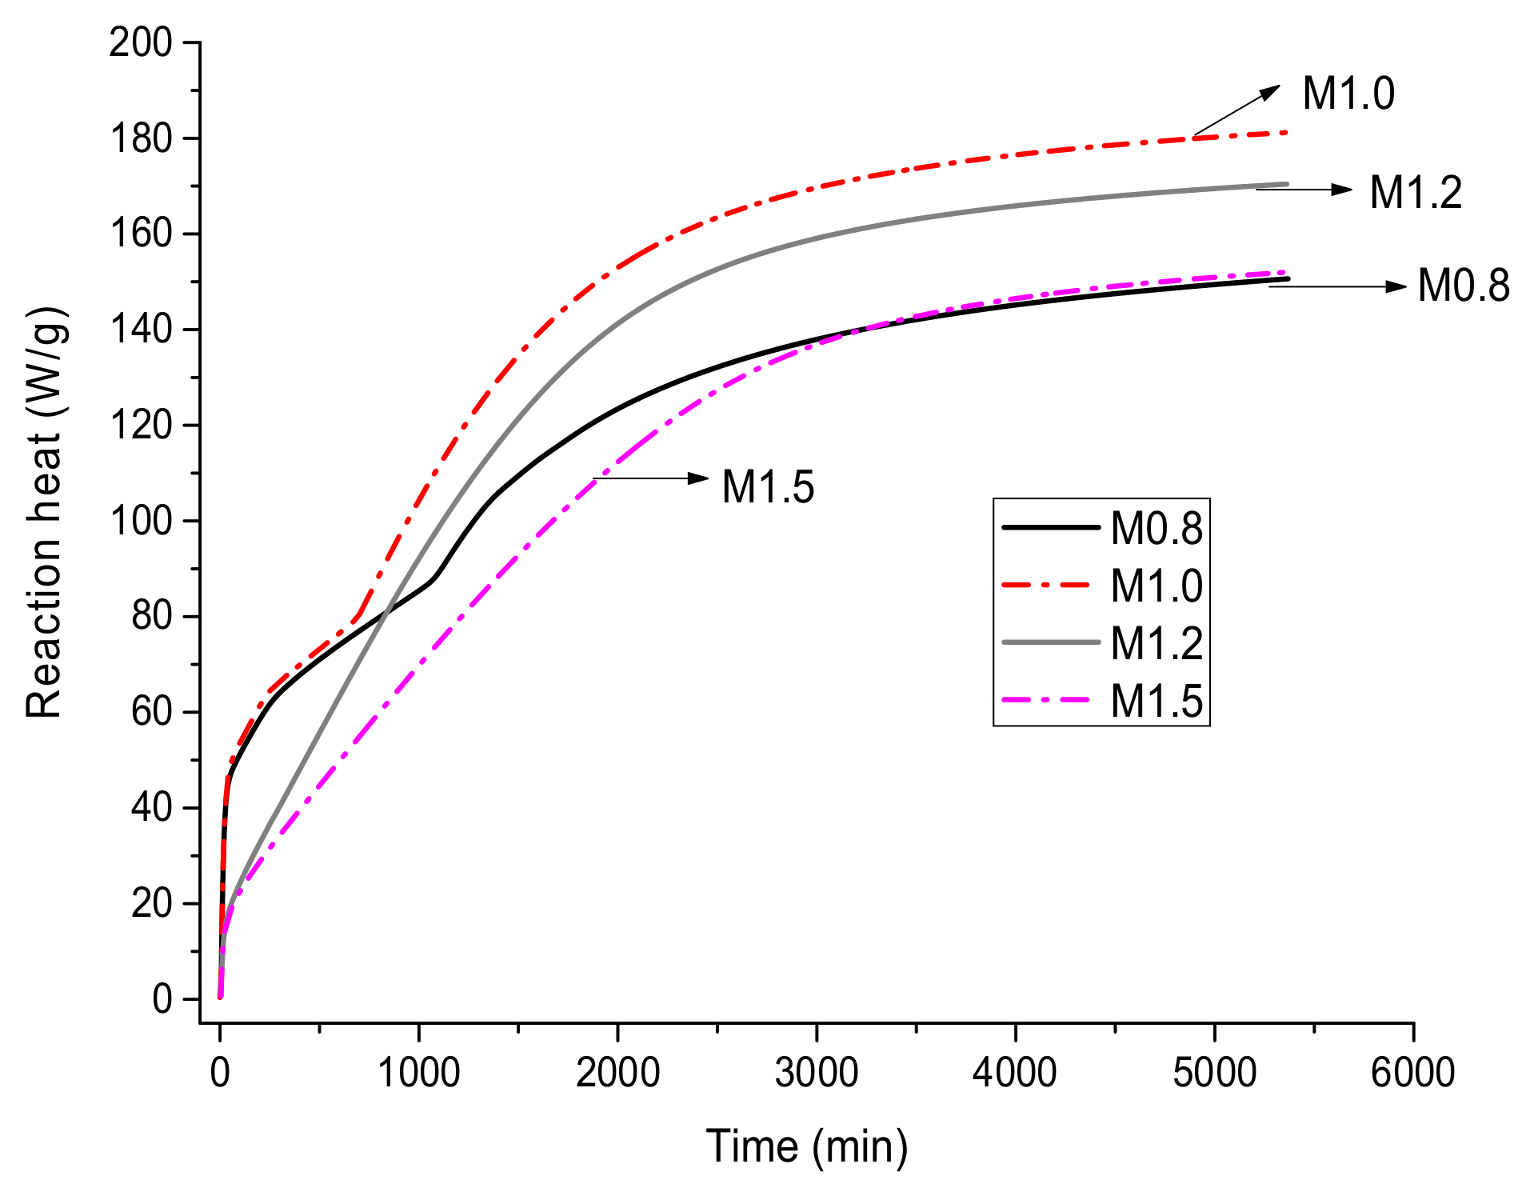
3.5. Exothermal Rate
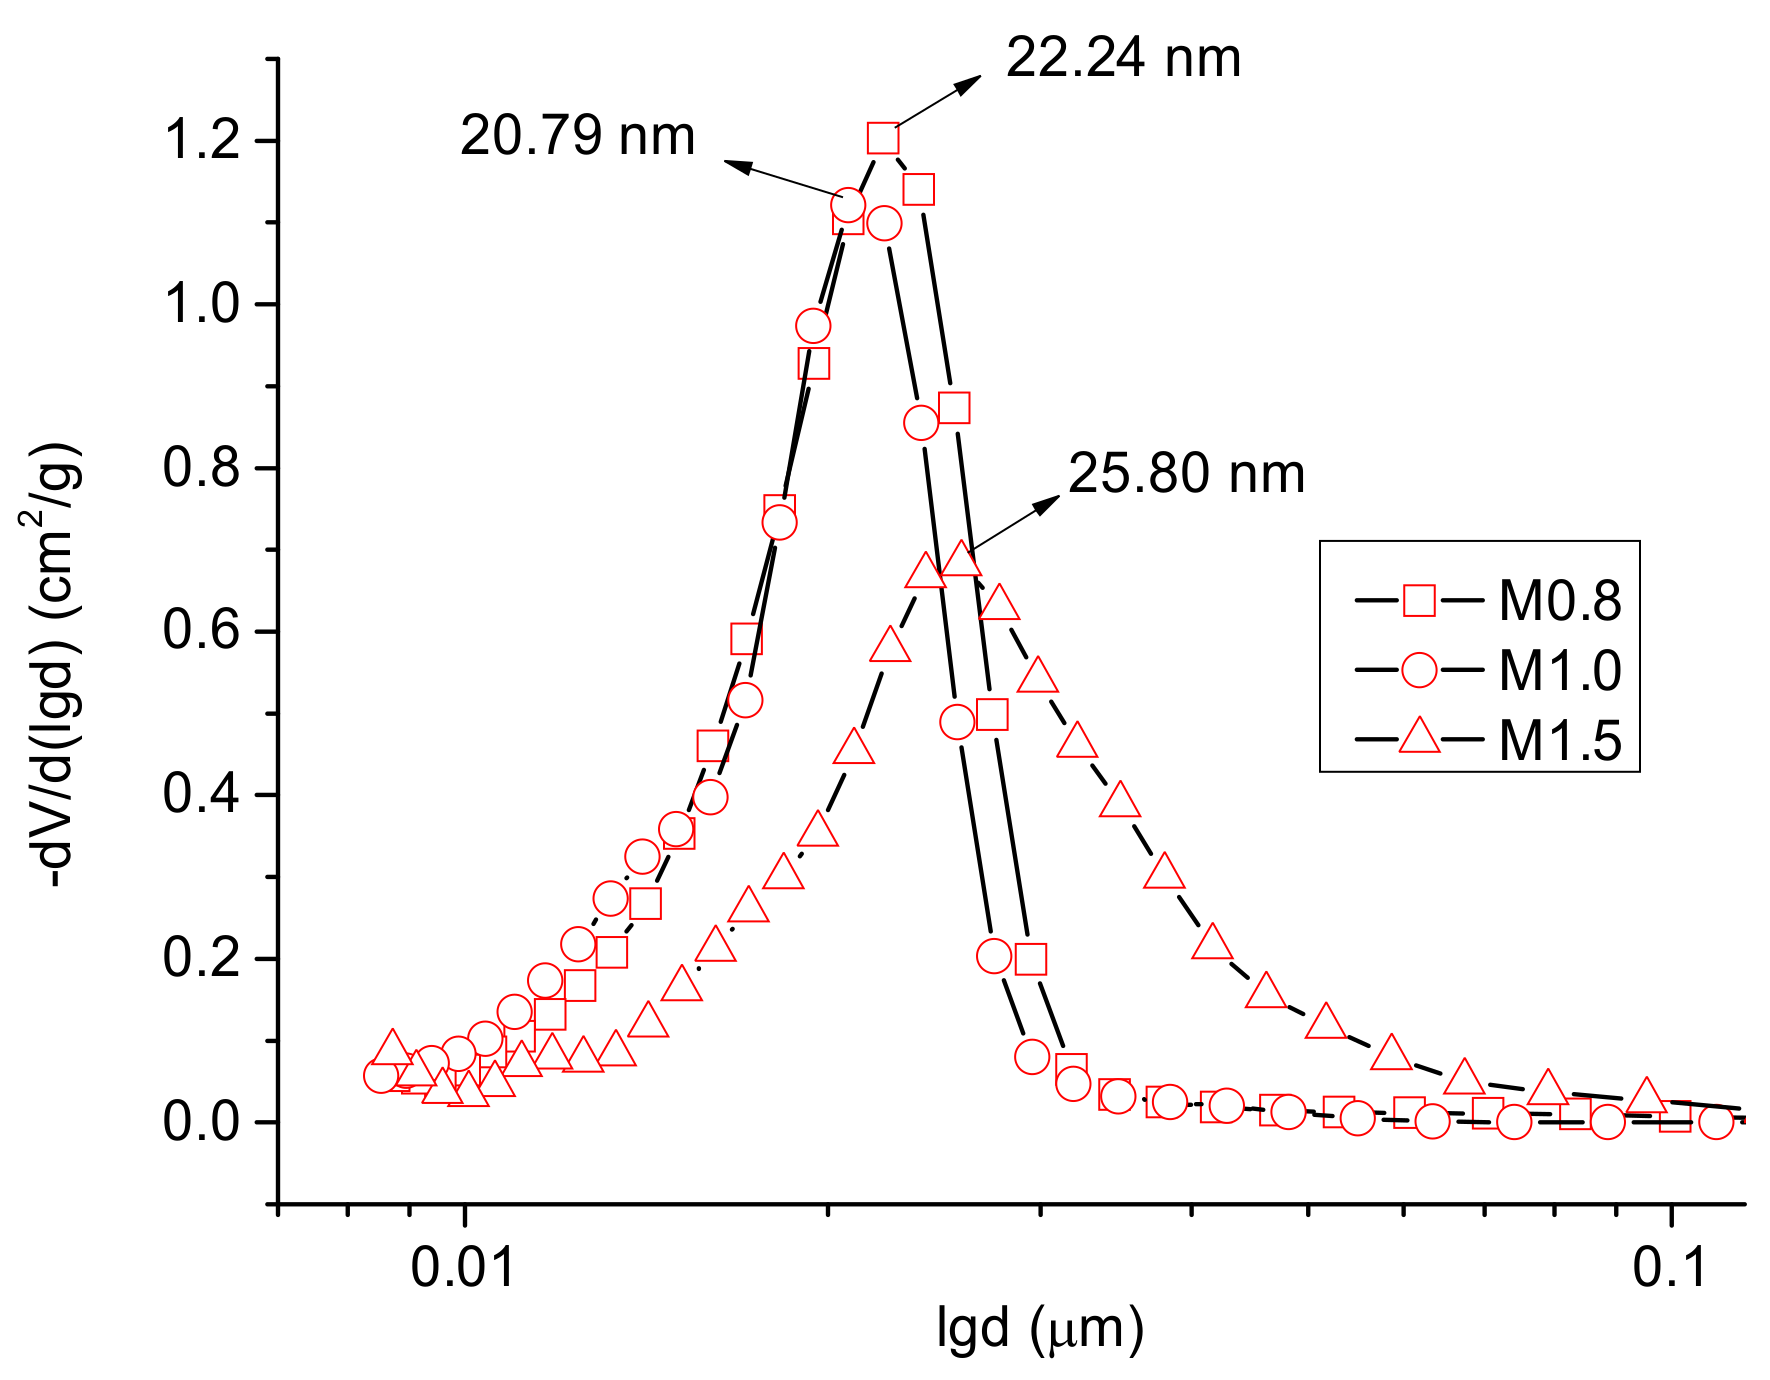
3.6. Pore Structure
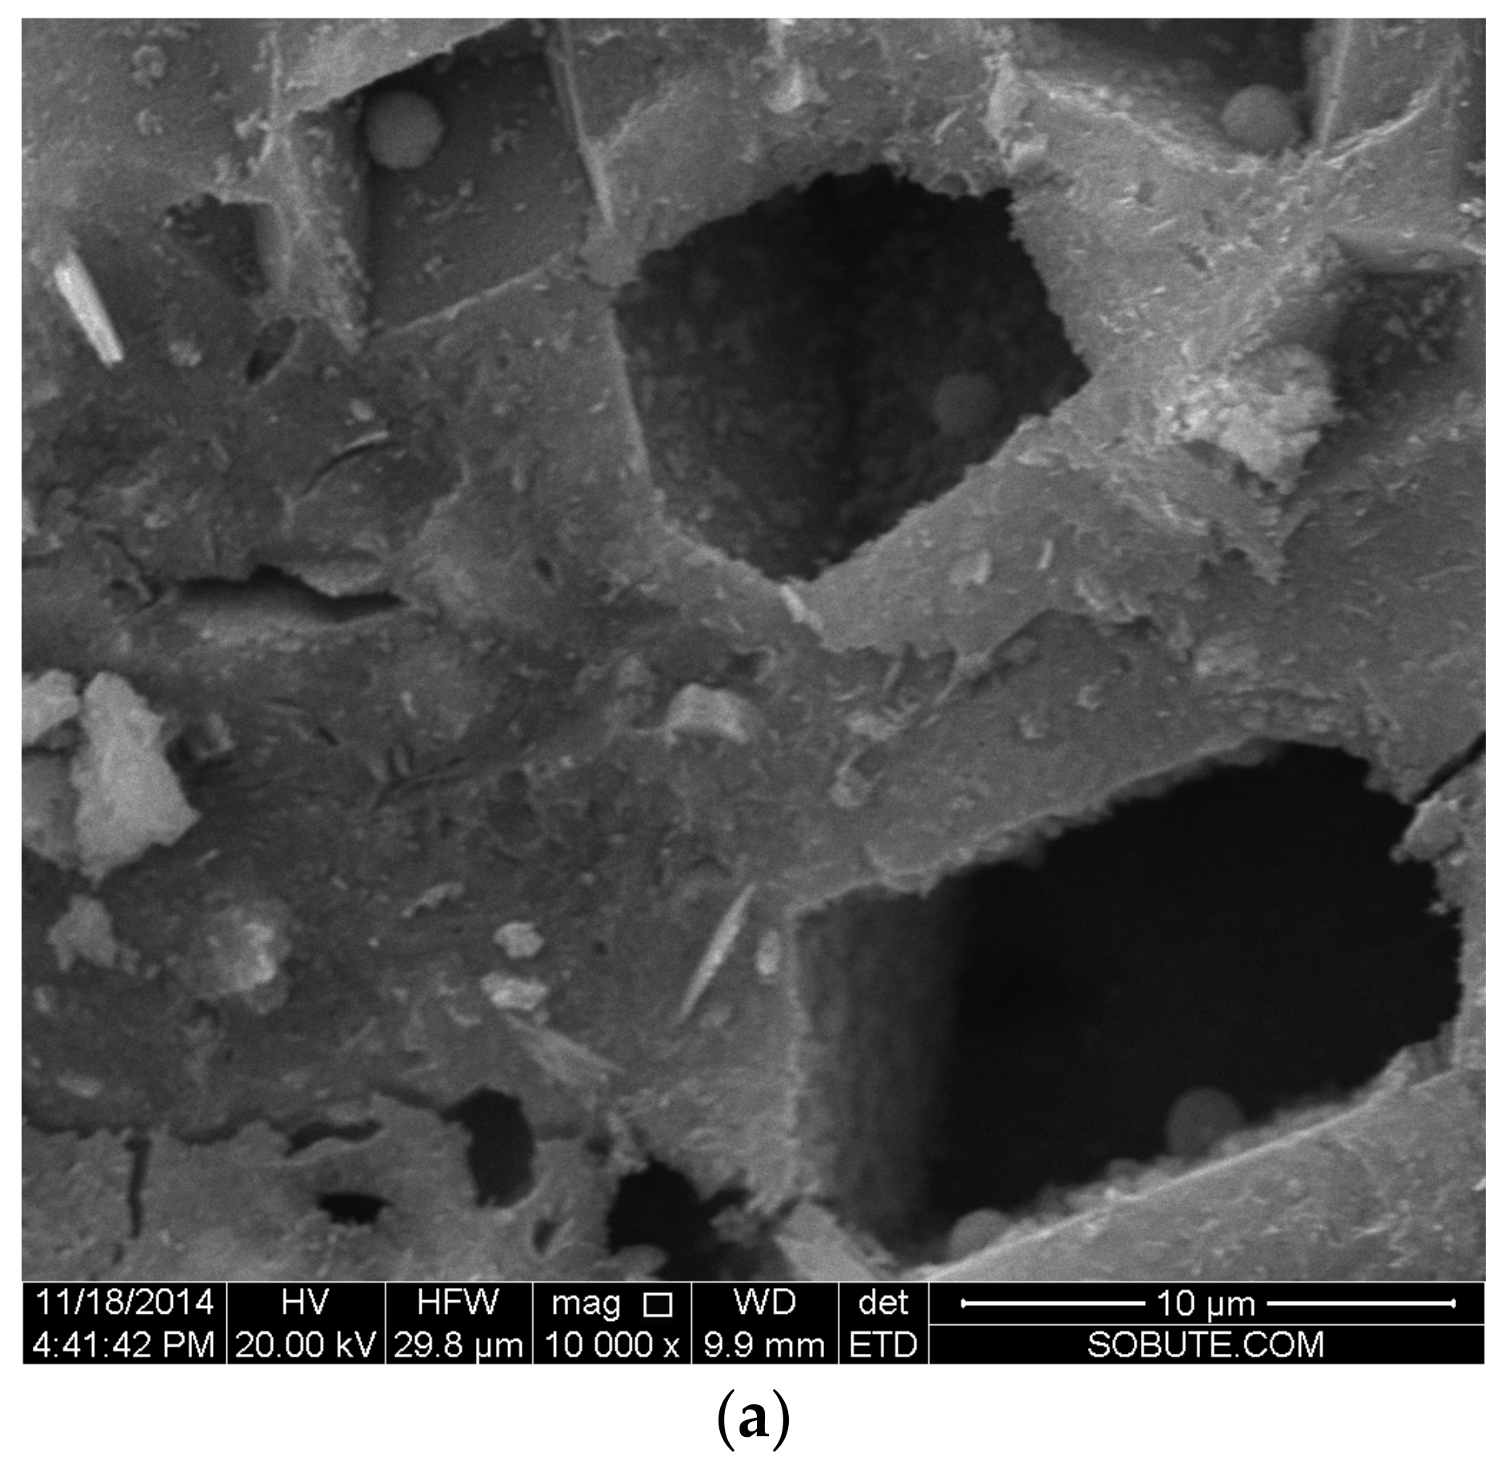
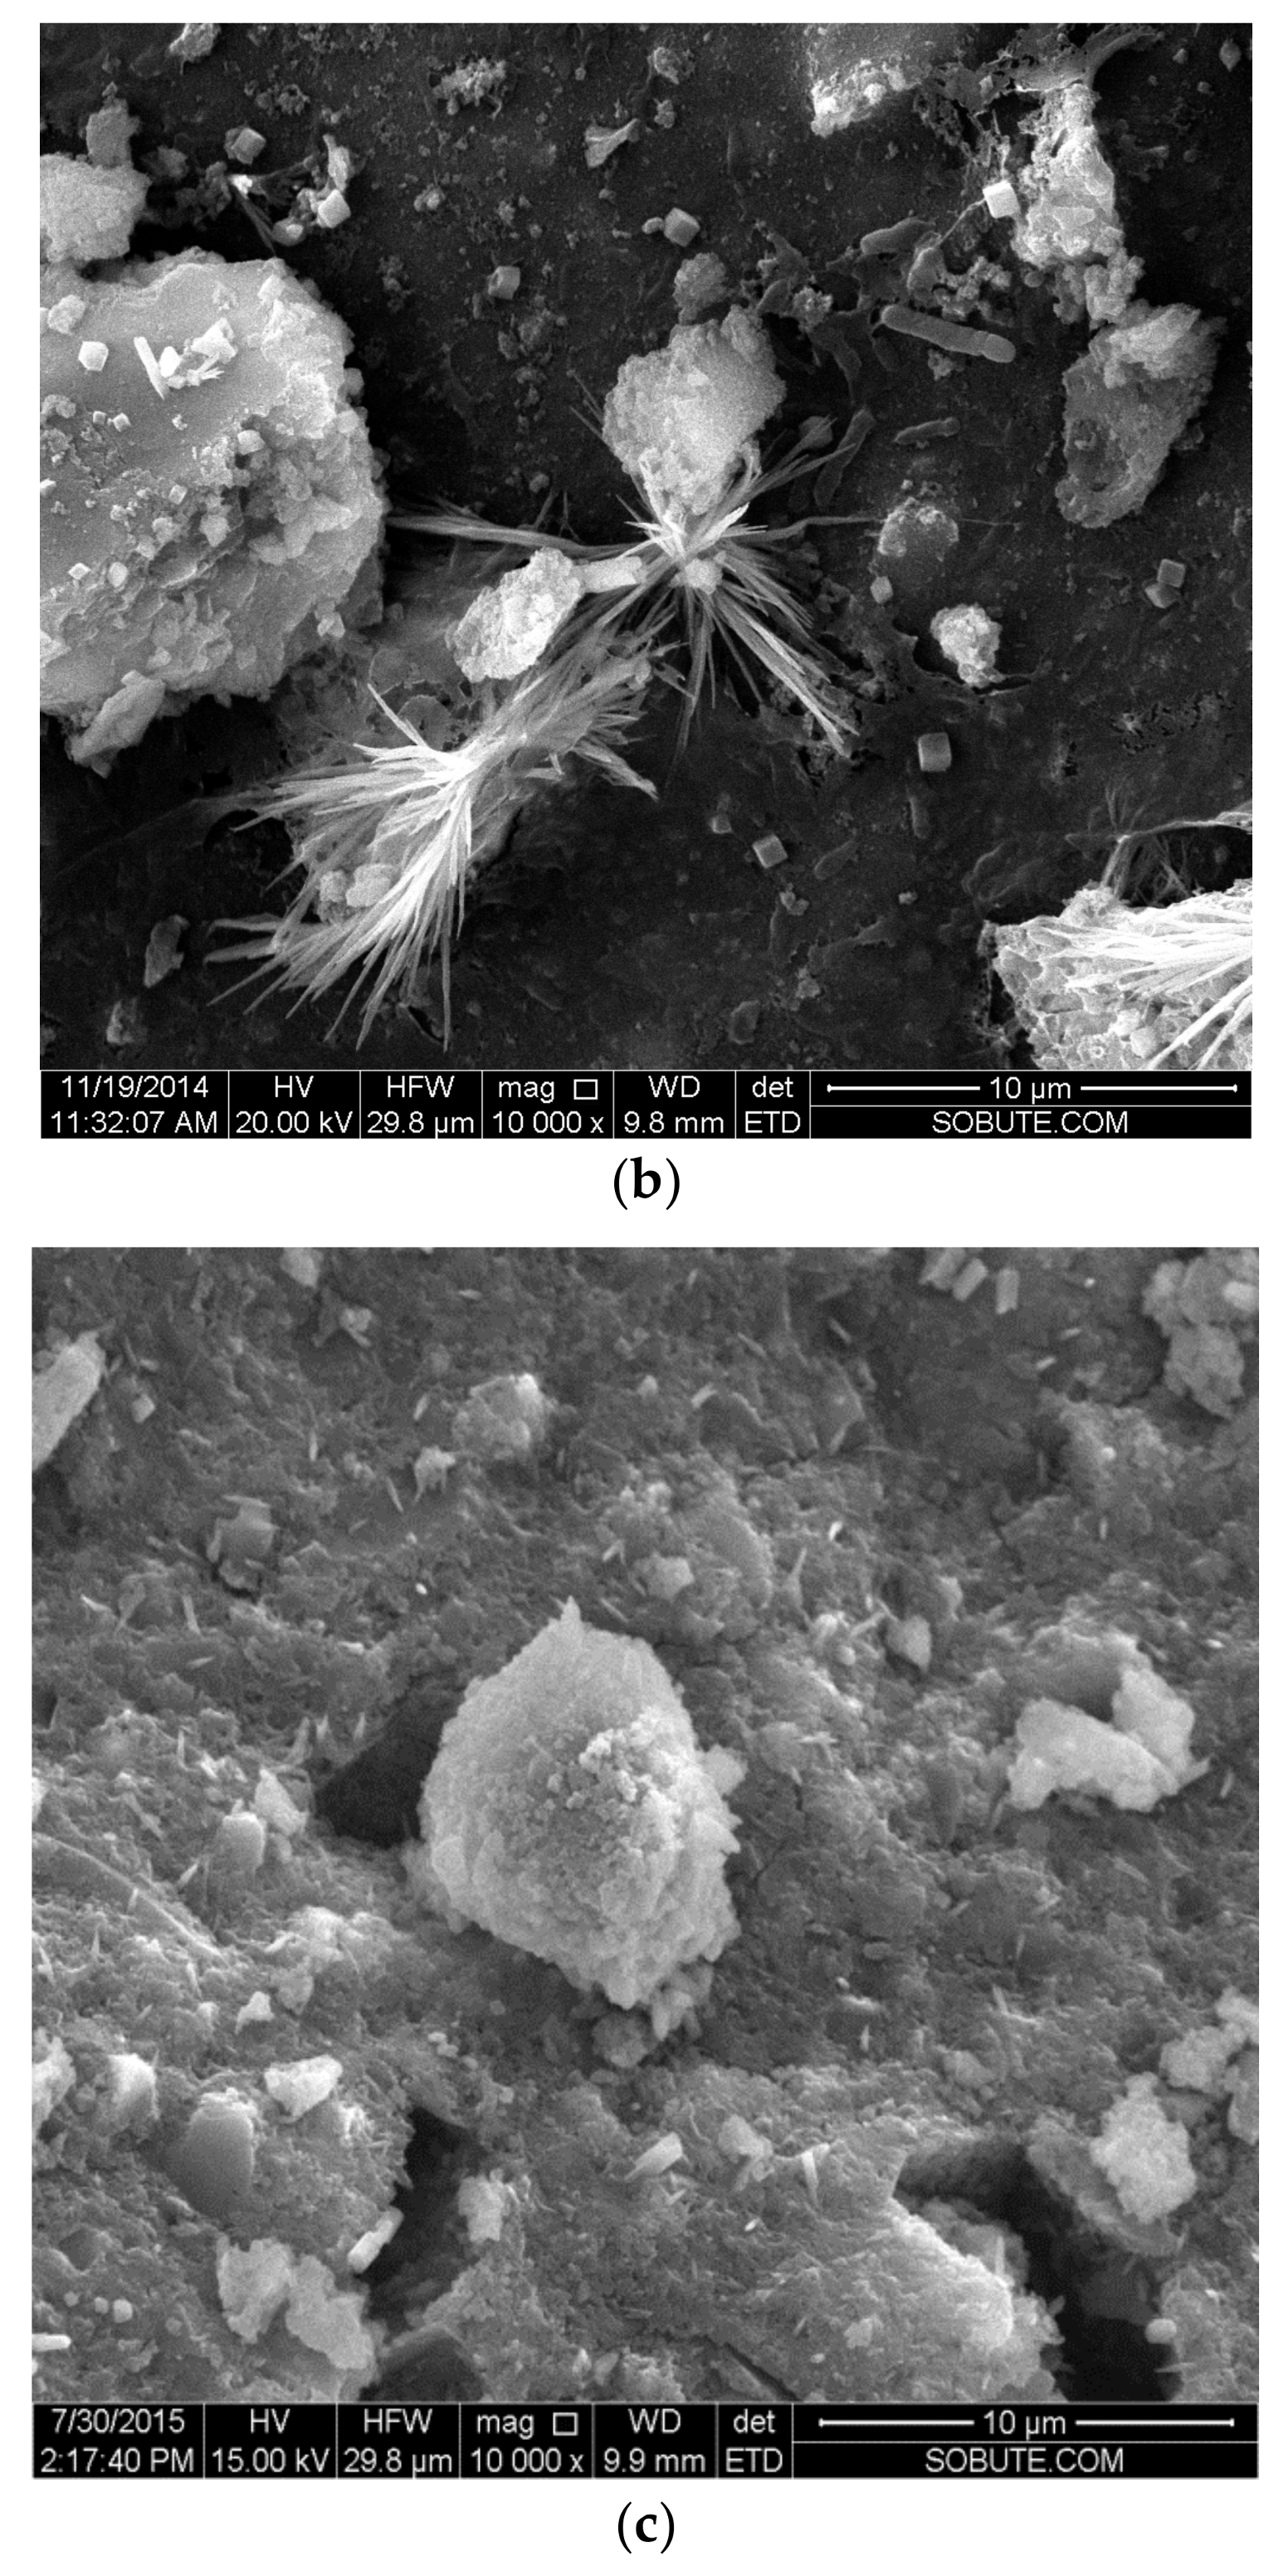
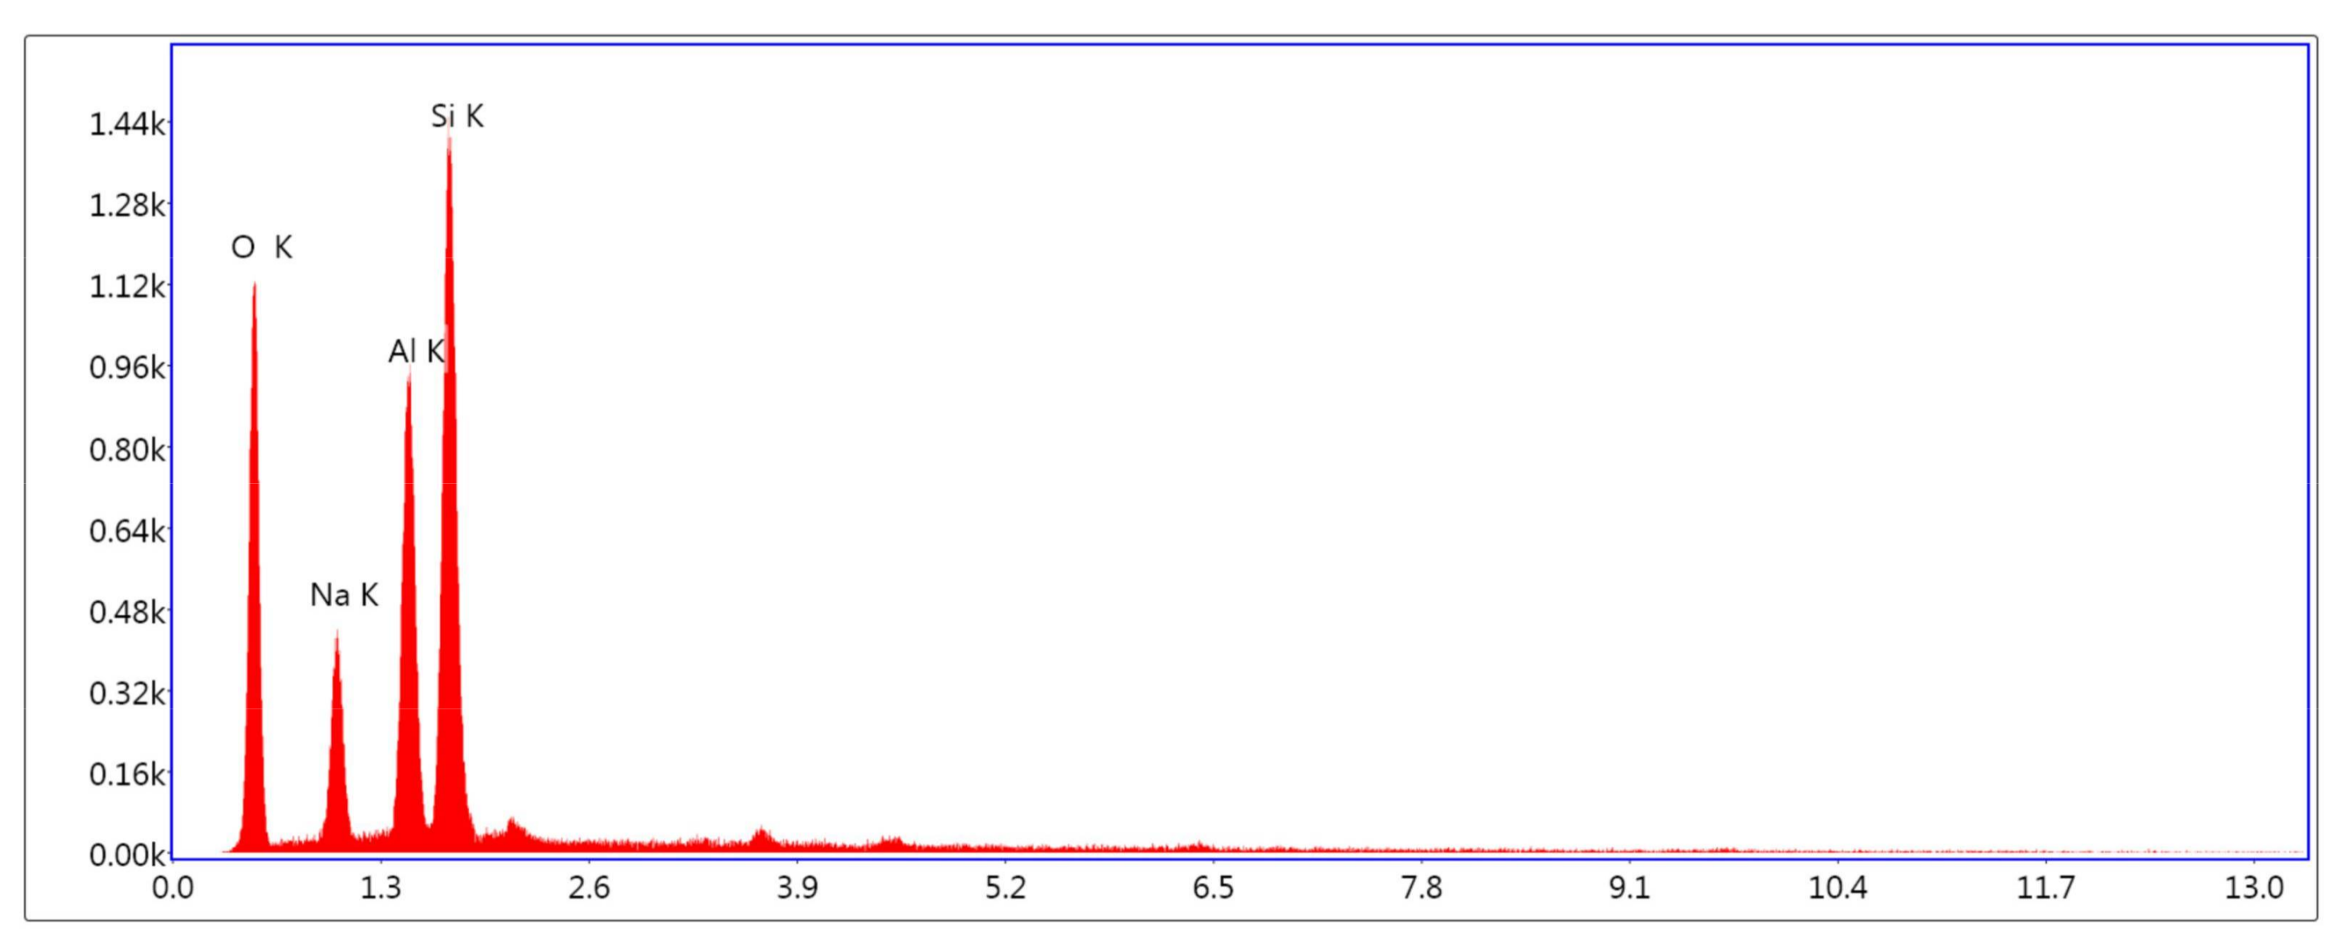
3.7. SEM
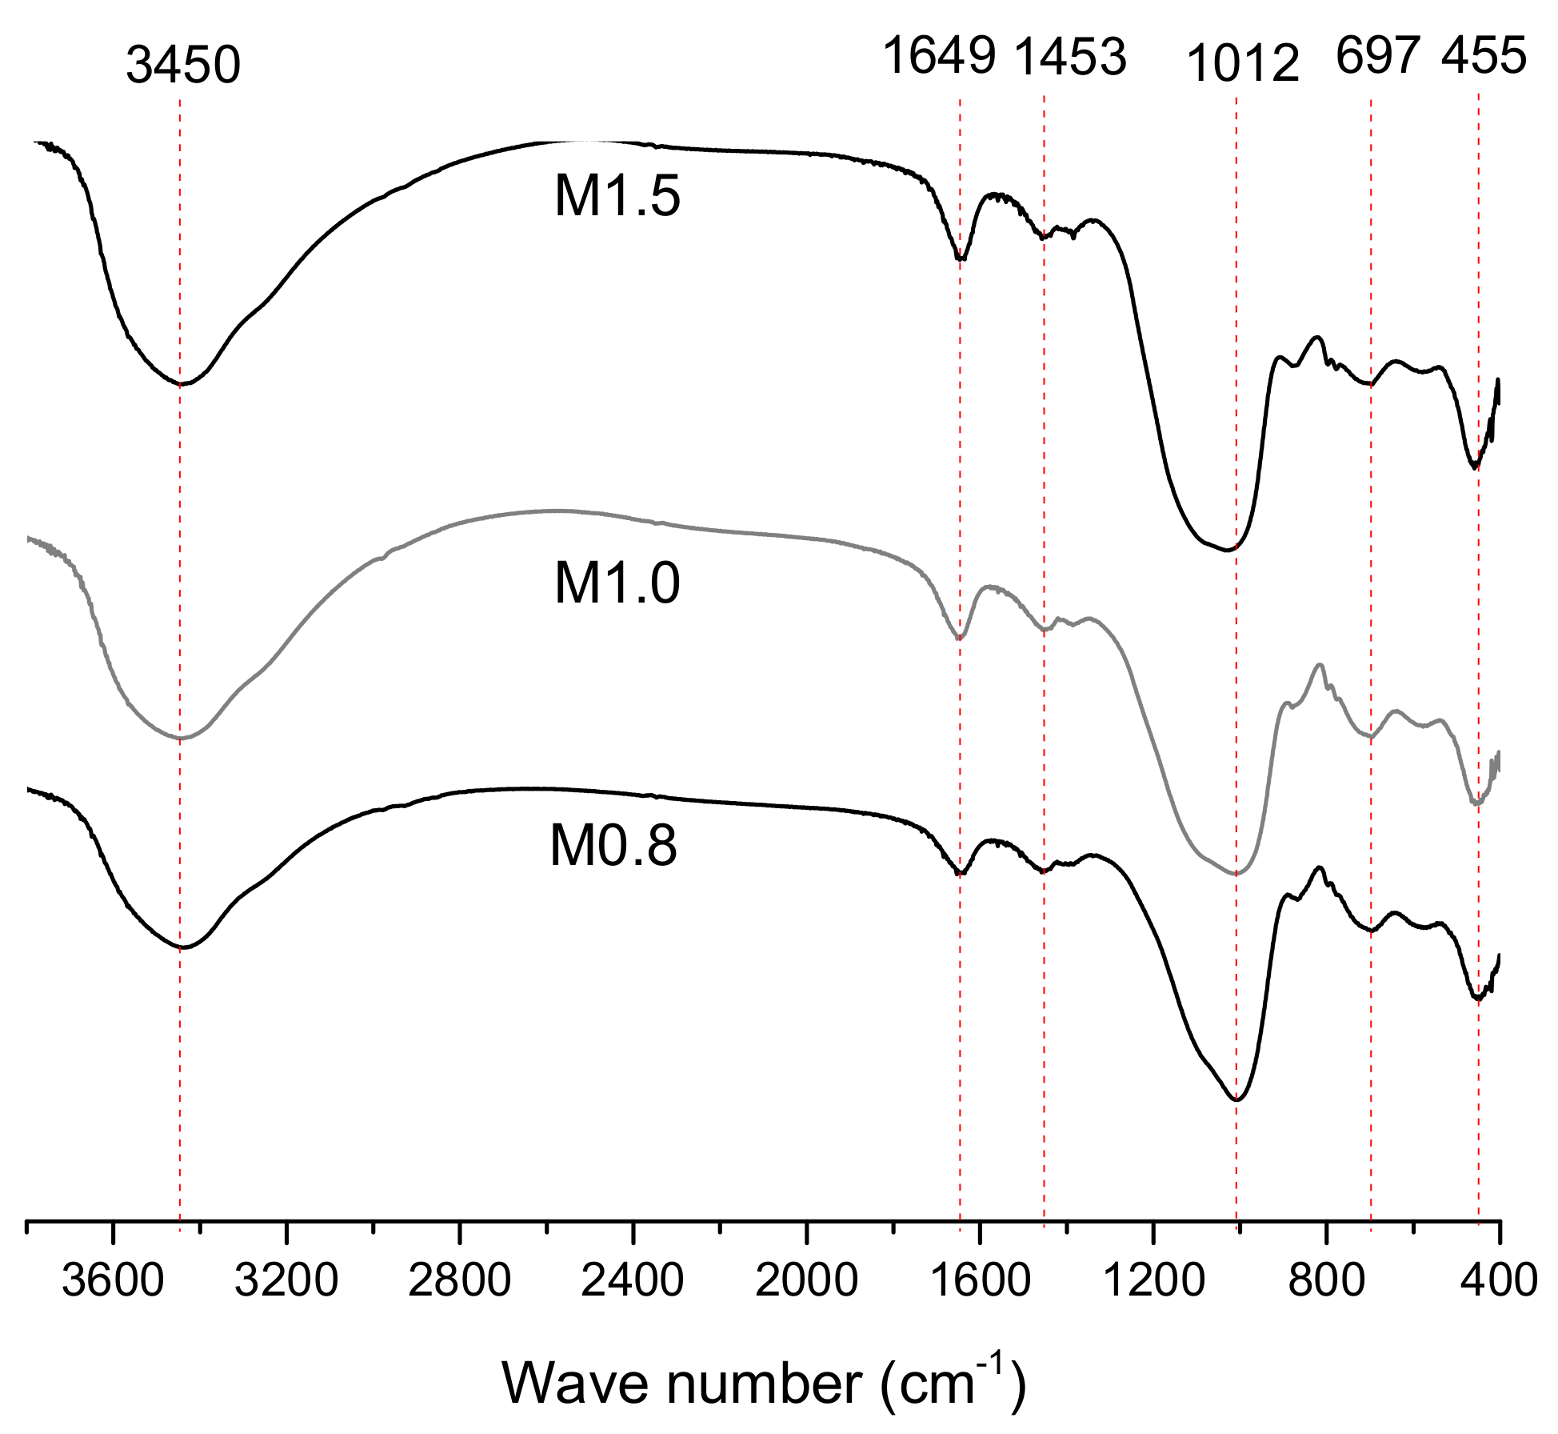
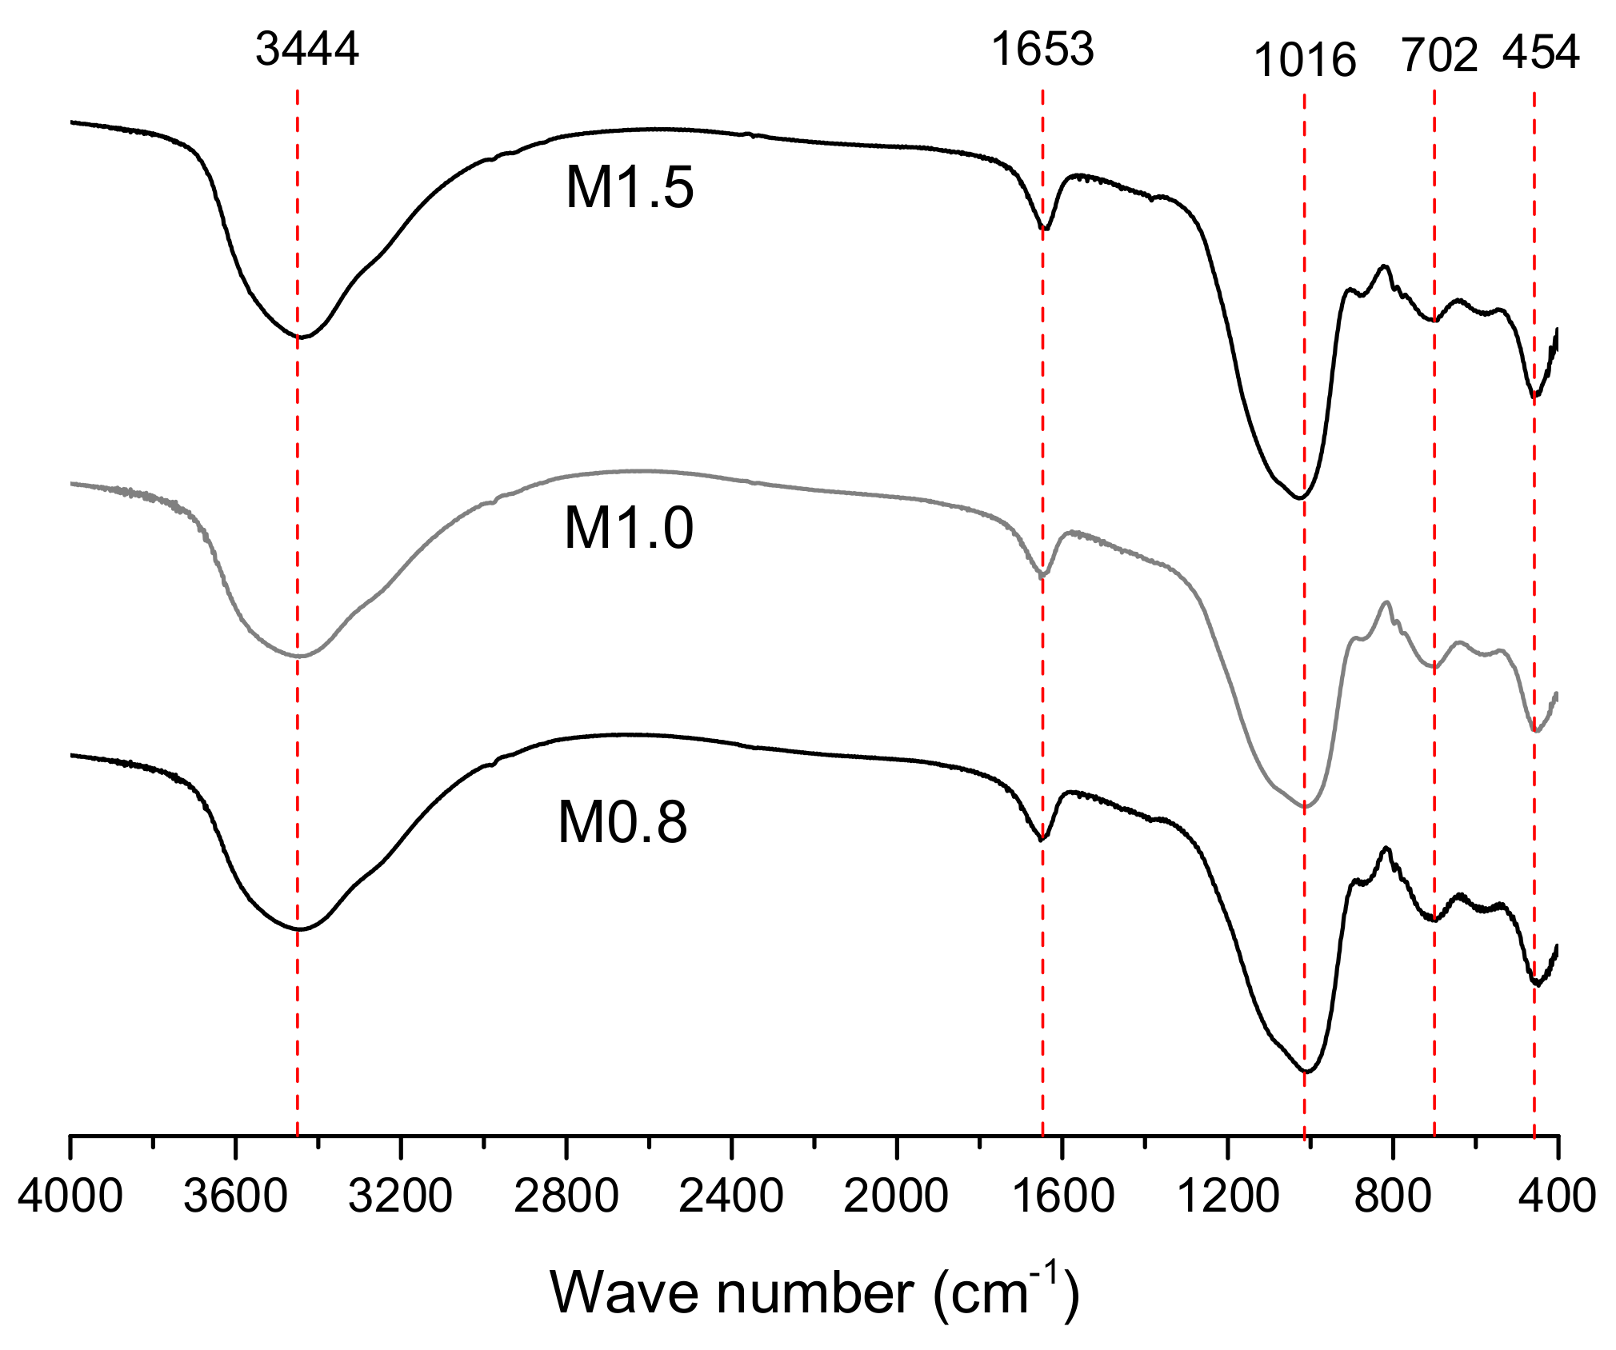
3.8. FTIR Analysis
4. Discussion
5. Conclusions
- (1)
- The setting time of metakaolin-based geopolymer coating increased when the SiO2/Na2O ratio increased from 0.8 to 1.5, as revealed from the penetration resistance test. The significant decrease of exothermal rate of alkali-activated metakaolin at the early age of 60 min also proves the role of setting delay when the SiO2/Na2O ratio increases.
- (2)
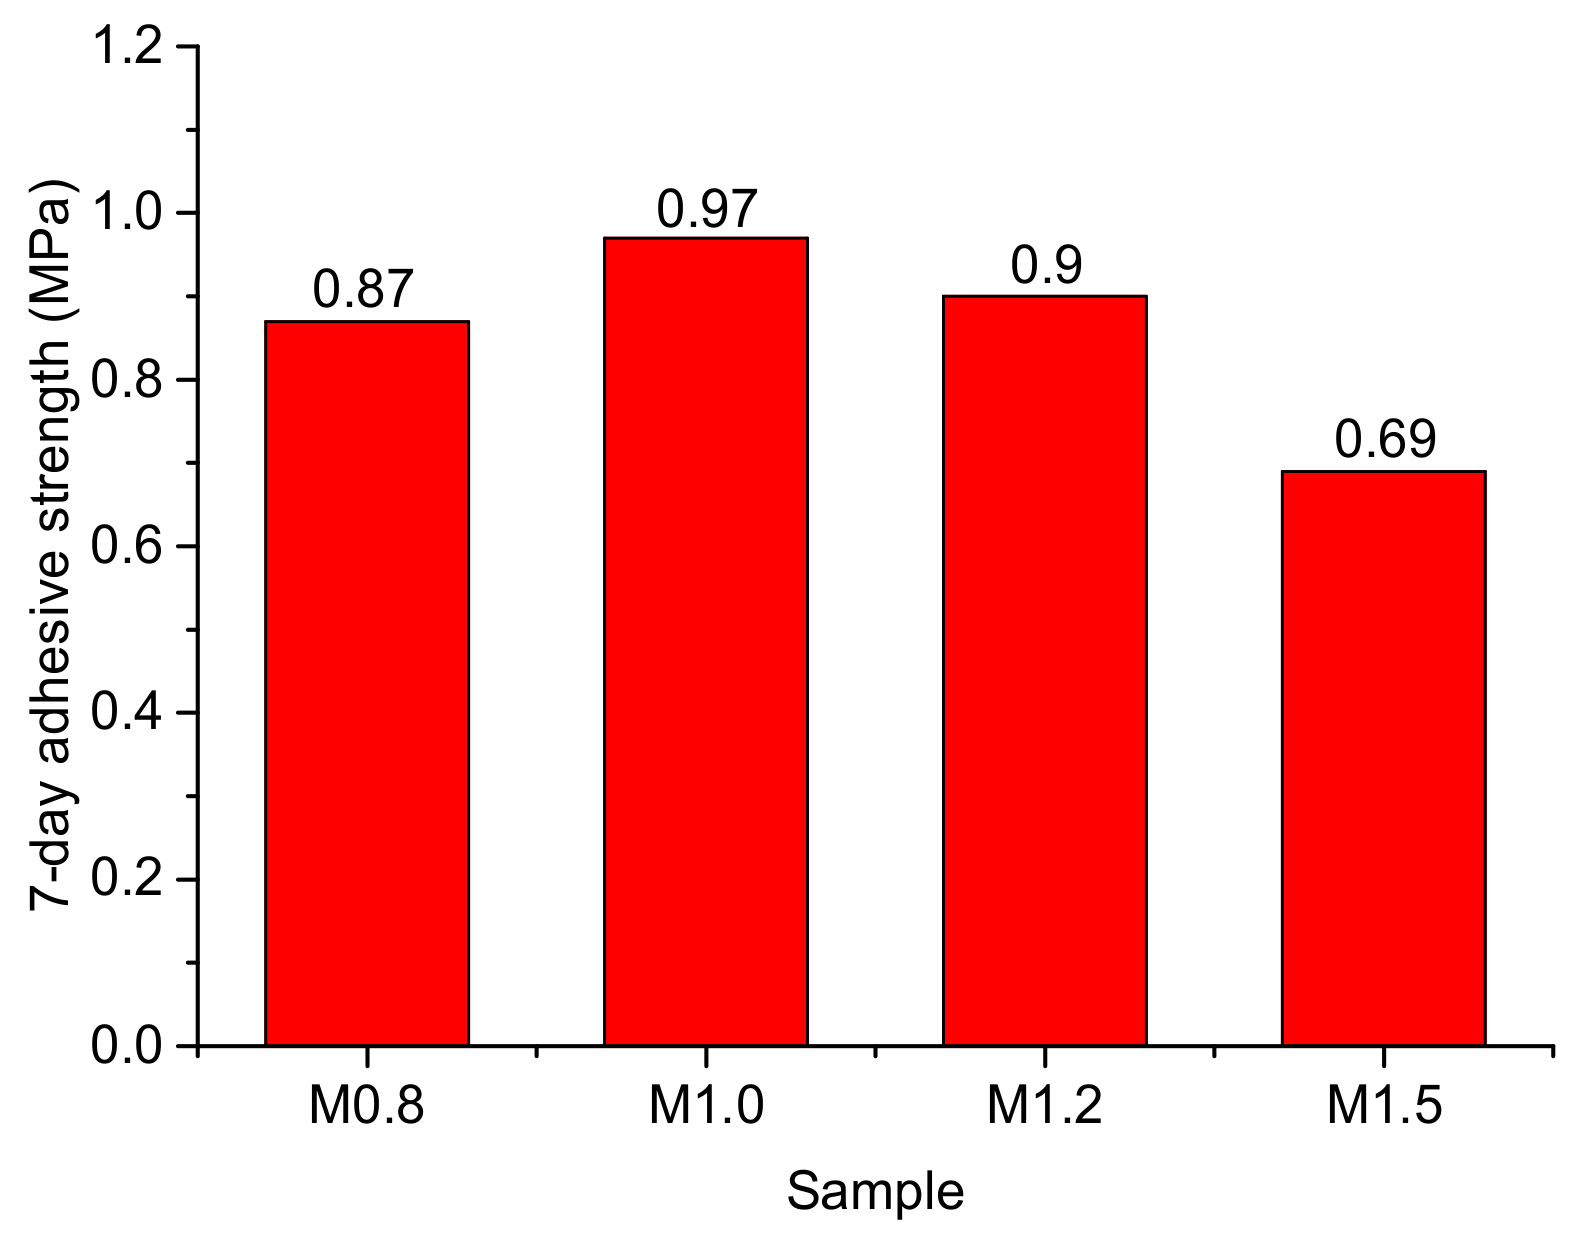
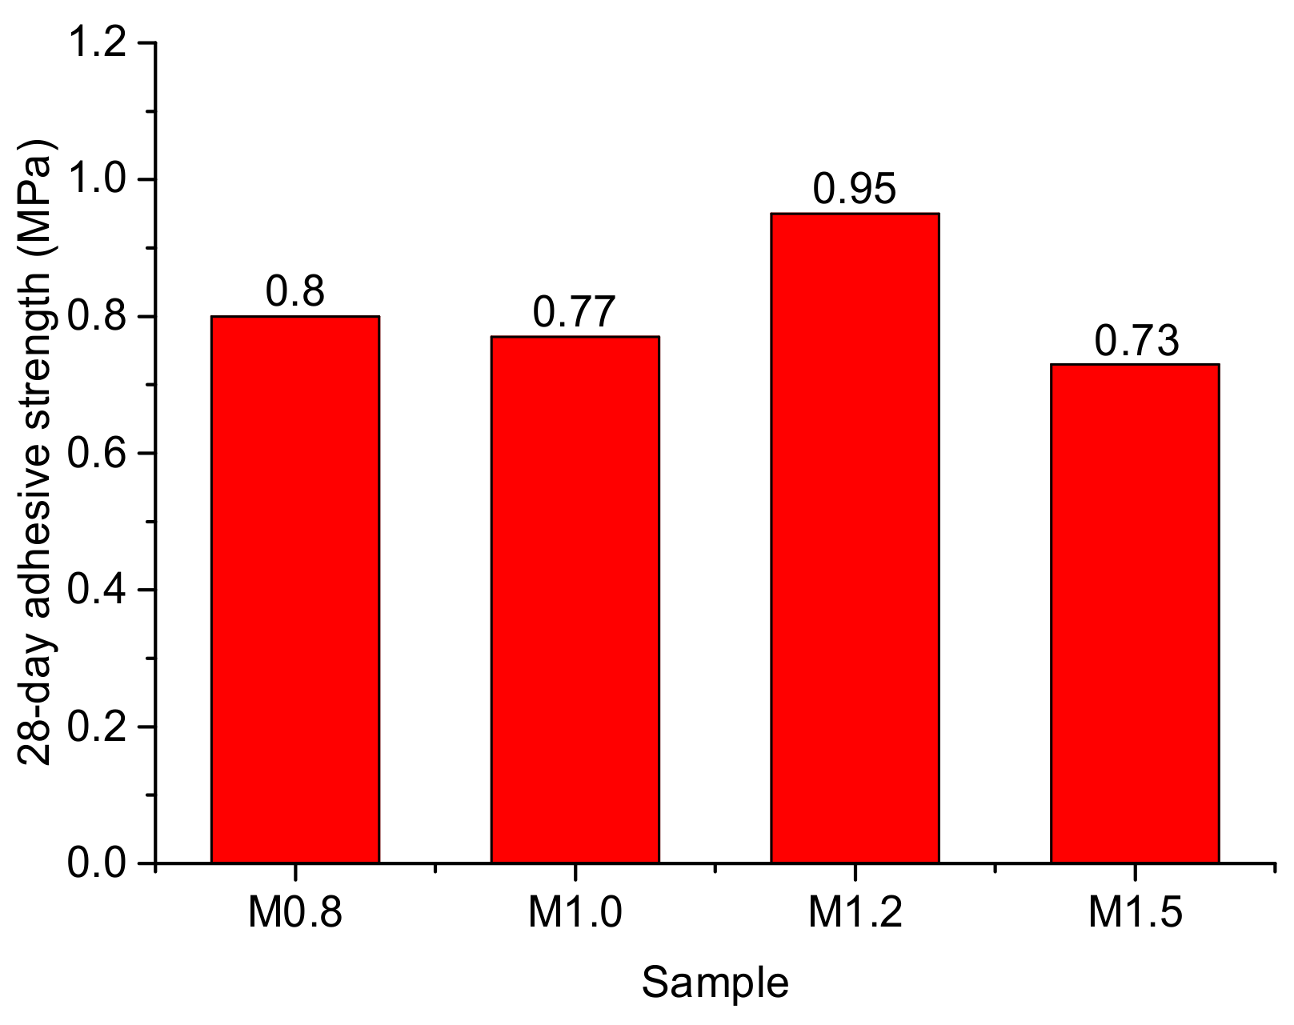
- The optimal SiO2/Na2O ratio can assure a good result for the adhesive strength and permeability. The experimental results indicated that the geopolymer coating prepared by the SiO2/Na2O ratio of 1.0 displayed a novel resistance to water uptake and chloride transport. When the ratio was higher than the optimal value, microstructural defects developed in the geopolymer decreased the strength and increased the permeability in that poor flowability resulted from viscous paste.
- (3)
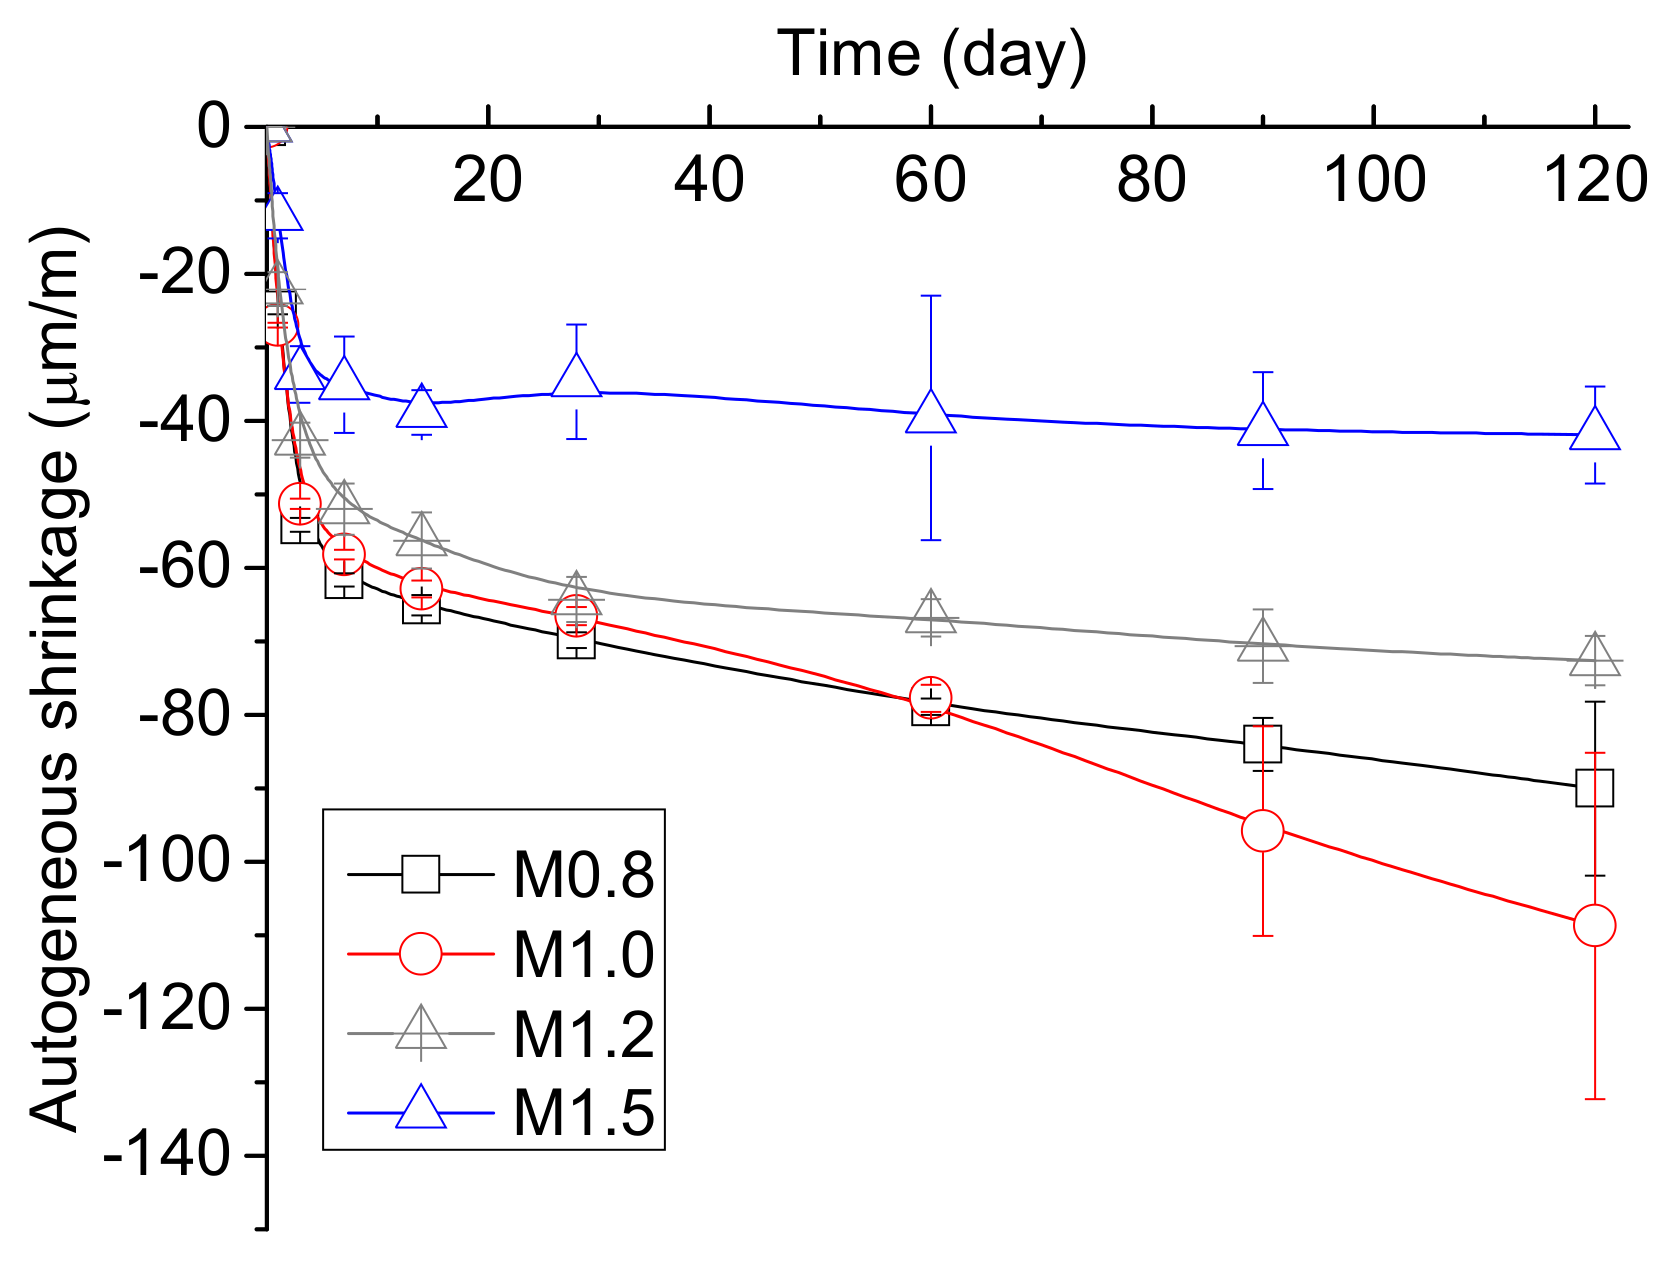
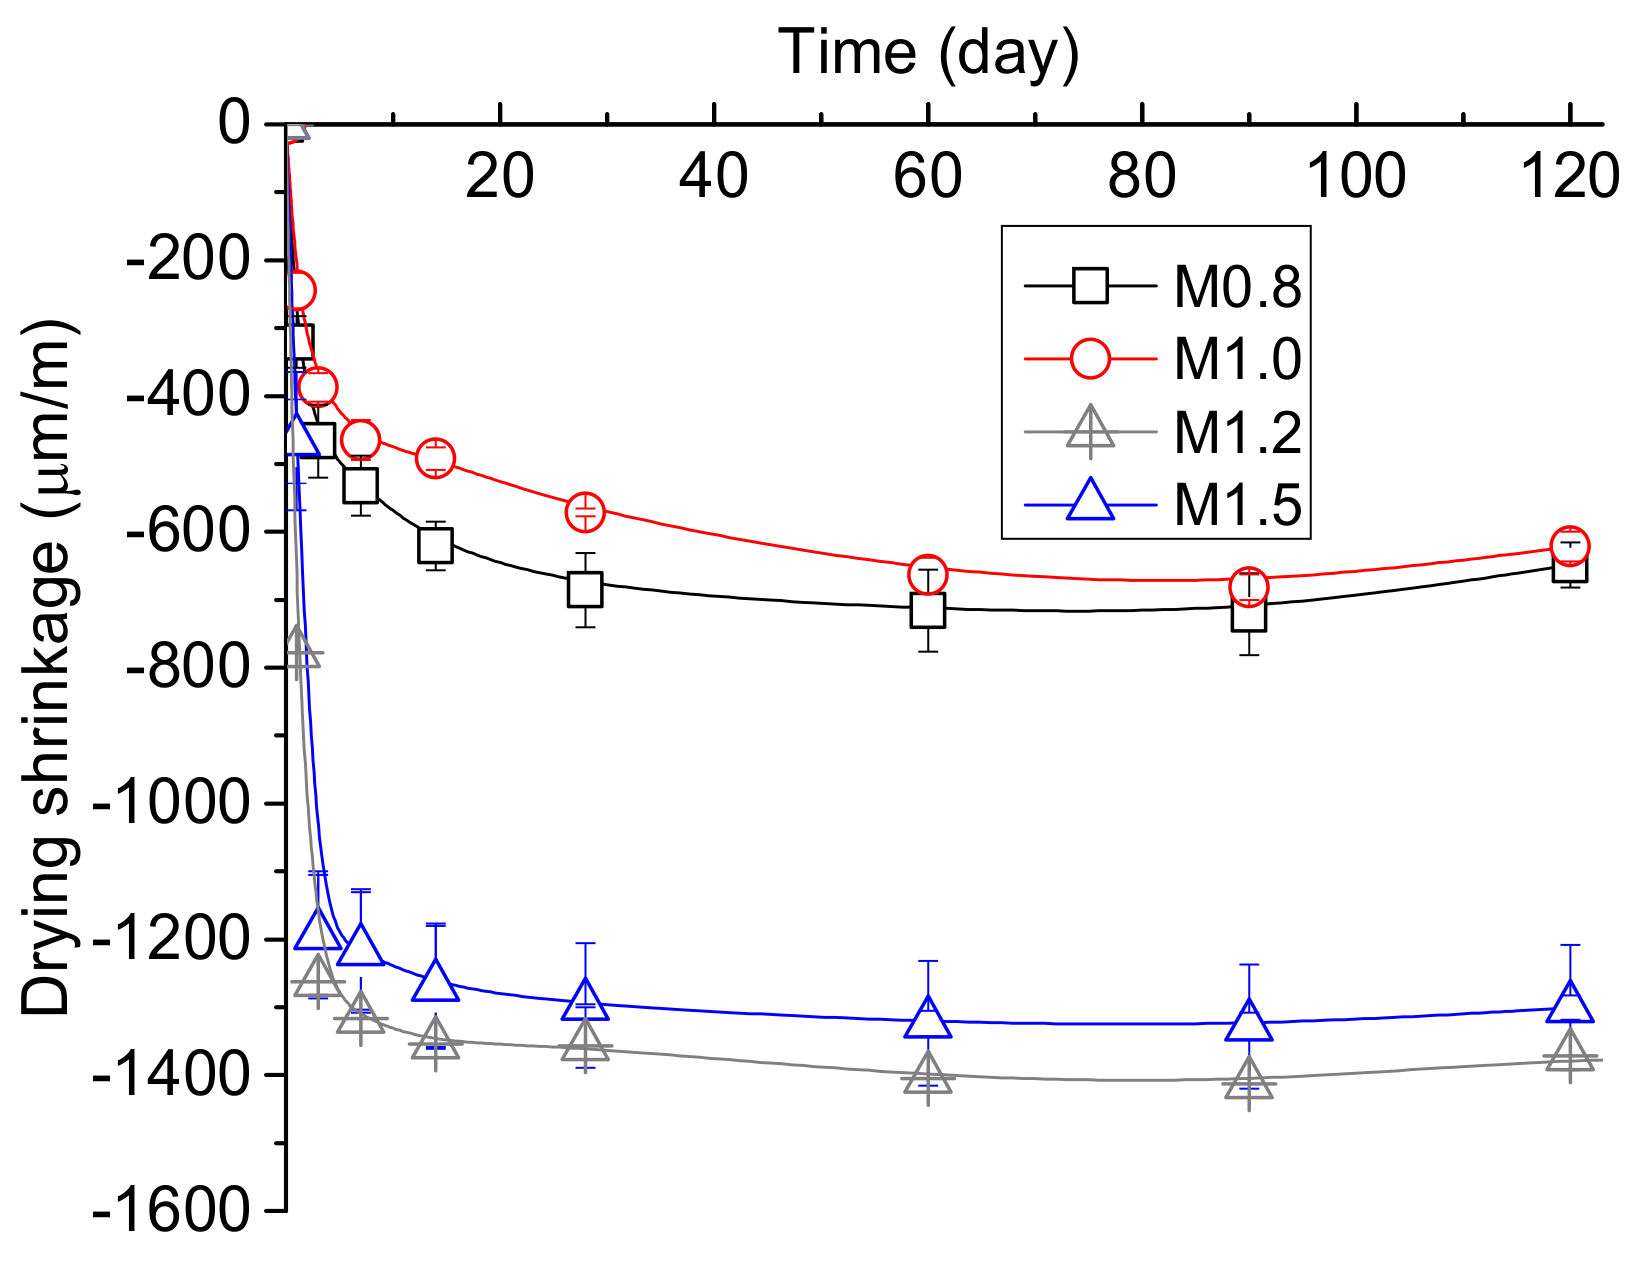
- The autogenous shrinkage at 120 days suggested that a ratio of 1.0 displayed a higher value than the ratios of 0.8 and 1.5. Corresponding to the autogenous shrinkage, the geopolymer sample with an optimal ratio of 1.0 exhibited a lower value of drying shrinkage than the other samples.
- (4)
- The geopolymer coating with the ratio of 1.0, exhibited a refined pore size distribution and decreased porosity. Results of Fourier Transform Infrared Spectroscopy (FTIR) implied that increase of the ratio contributed to geopolymerization. Besides, geopolymer prepared by the ratio of 1.0 was likely to produce more heterogeneous geopolymer due to a greater silicate structural reorganization.
Acknowledgments
Author Contributions
Conflicts of Interest
References
- Brito, M.; Case, E.; Kriven, W.M.; Salem, J.; Zhu, D. Corrosion Protection Assessment of Concrete Reinforcing Bars with a Geopolymer Coating. In Developments in Porous, Biological and Geopolymer Ceramics: Ceramic Engineering and Science Proceedings; Wiley: Hoboken, NJ, USA, 2009. [Google Scholar]
- Temuujin, J.; Minjigmaa, A.; Rickard, W.; Lee, M.; Williams, I.; van Riessen, A. Preparation of metakaolin based geopolymer coatings on metal substrates as thermal barriers. Appl. Clay Sci. 2009, 46, 265–270. [Google Scholar] [CrossRef]
- Zhang, Z.; Yao, X.; Wang, H. Potential application of geopolymers as protection coatings for marine concrete III. Field experiment. Appl. Clay Sci. 2010, 49, 491–496. [Google Scholar] [CrossRef]
- Temuujin, J.; Minjigmaa, A.; Rickard, W.; Lee, M.; Williams, I.; van Riessen, A. Fly ash based geopolymer thin coatings on metal substrates and its thermal evaluation. J. Hazard. Mater. 2010, 180, 748–752. [Google Scholar] [CrossRef] [PubMed]
- Khan, M.I.; Azizli, K.; Sufian, S.; Man, Z. Sodium silicate-free geopolymers as coating materials: Effects of Na/Al and water/solid ratios on adhesion strength. Ceram. Int. 2014, 41, 2794–2805. [Google Scholar] [CrossRef]
- Vidal, L.; Joussein, E.; Absi, J.; Rossignol, S. Coating of unreactive and reactive surfaces by aluminosilicate binder. Ceram. Int. 2016, 43, 1819–1829. [Google Scholar] [CrossRef]
- Aguirre-Guerrero, A.M.; Robayo-Salazar, R.A.; Gutiérrez, R.M.D. A novel geopolymer application: Coatings to protect reinforced concrete against corrosion. Appl. Clay Sci. 2017, 135, 437–446. [Google Scholar] [CrossRef]
- Davidovits, J. Geopolymers. J. Therm. Anal. 1991, 37, 1633–1656. [Google Scholar] [CrossRef]
- Duxson, P.; Provis, J.L.; Lukey, G.C.; Mallicoat, S.W.; Kriven, W.M.; van Deventer, J.S.J. Understanding the relationship between geopolymer composition, microstructure and mechanical properties. Colloid Surf. A 2005, 269, 47–58. [Google Scholar] [CrossRef]
- Duxson, P.; Fernández-Jiménez, A.; Provis, J.L.; Lukey, G.C.; Palomo, A.; van Deventer, J.S.J. Geopolymer technology: The current state of the art. J. Mater. Sci. 2007, 42, 2917–2933. [Google Scholar] [CrossRef]
- Fernández-Jiménez, A.; Palomo, A.; Criado, M. Microstructure development of alkali-activated fly ash cement: A descriptive model. Cem. Concr. Res. 2005, 35, 1204–1209. [Google Scholar] [CrossRef]
- Park, S.M.; Jang, J.G.; Lee, N.K.; Lee, H.K. Physicochemical properties of binder gel in alkali-activated fly ash/slag exposed to high temperatures. Cem. Concr. Res. 2016, 89, 72–79. [Google Scholar] [CrossRef]
- Park, S.M.; Jang, J.G.; Chae, S.A.; Lee, H.K. An NMR spectroscopic investigation of aluminosilicate gel in alkali-activated fly ash in a CO2-rich environment. Materials 2016, 9, 308. [Google Scholar] [CrossRef] [PubMed]
- Nord Test. NT Build 492, Chloride Migration Coefficient from Non-Steady State Migration Experiments. UDC 691.32/691.53/691.54, November 1999. [Google Scholar]
- Chinese Construction Industry Standard. JGJ/T 70–2009, Standard for Test Method of Performance on Building Mortar; China Architecture & Building Press: Beijing, China, 2009. (In Chinese) [Google Scholar]
- Ma, Y.; Ye, G. The shrinkage of alkali activated fly ash. Cem. Concr. Res. 2015, 68, 75–82. [Google Scholar] [CrossRef]
- Gao, K.; Lin, K.L; Wang, D.Y.; Hwang, C.L.; Shiu, H.S.; Chang, Y.M.; Cheng, T.W. Effects SiO2/Na2O molar ratio on mechanical properties and the microstructure of nano-SiO2, metakaolin-based geopolymers. Constr. Build. Mater. 2014, 53, 503–510. [Google Scholar] [CrossRef]
- Liew, Y.M.; Kamarudin, H.; Bakri, A.M.M.A.; Bnhussain, M.; Luqman, M.; Khairul Nizar, I.; Ruzaidi, C.M.; Heah, C.Y. Optimization of solids-to-liquid and alkali activator ratios of calcined kaolin geopolymeric powder. Constr. Build. Mater. 2012, 37, 440–451. [Google Scholar] [CrossRef]
- Provis, J.L. Modeling the Formation of Geopolymers. Ph.D. Thesis, Department of Chemical and Biomolecular Engineering, The University of Melbourne, Melbourne, Australia, 2006. [Google Scholar]
- Provis, J.L.; van Deventer, J.S.J. Geopolymerisation kinetics. 2. Reaction kinetic modelling. Chem. Eng. Sci. 2007, 62, 2318–2329. [Google Scholar] [CrossRef]
- Andini, S.; Cioffi, R.; Colangelo, F.; Grieco, T.; Montagnaro, F.; Santoro, L. Coal fly ash as raw material for the manufacture of geopolymer-based products. Waste Manag. 2008, 28, 416–423. [Google Scholar] [CrossRef] [PubMed]
- Chindaprasirt, P.; Chai, J.; Chalee, W.; Rattanasak, U. Comparative study on the characteristics of fly ash and bottom ash geopolymers. Waste Manag. 2009, 29, 539–543. [Google Scholar] [CrossRef] [PubMed]
- Bernal, S.A.; Provis, J.L.; Rose, V.; De Gutierrez, R.M. Evolution of binder structure in sodium silicate-activated slag-metakaolin blends. Cem. Concr. Compos. 2011, 33, 46–54. [Google Scholar] [CrossRef]
- Lee, W.K.W.; van Deventer, J.S.J. Structural reorganization of class F fly ash in alkaline silicate solutions. Colloids Surf. A 2002, 211, 49–66. [Google Scholar] [CrossRef]
- Zhang, Z.H.; Yao, X.; Zhu, H.J. Role of water in the synthesis of calcined kaolin based geopolymer. Appl. Clay Sci. 2009, 43, 218–223. [Google Scholar] [CrossRef]
- Heah, C.Y.; Kamarudin, H.; Mustafa Al Bakri, A.M.; Bnhussain, M.; Luqman, M.; Khairul Nizar, I.; Ruzaidi, C.M.; Liew, Y.M. Study on solids-to-liquid and alkaline activator ratios on kaolinbased geopolymers. Constr. Build. Mater. 2012, 35, 912–922. [Google Scholar] [CrossRef]
- Criado, M.; Fernández-Jiménez, A.; Palomo, A. Alkali activation of fly ash: Effect of the SiO2/Na2O ratio: Part I: FTIR study. Microporous Mesoporous Mater. 2007, 106, 180–191. [Google Scholar] [CrossRef]
- Fernández-Jiménez, A.; Palomo, A.; Sobrados, I.; Sanz, J. The role played by the reactive alumina content in the alkaline activation of fly ashes. Microporous Mesoporous Mater. 2006, 91, 111–119. [Google Scholar] [CrossRef]
- Tashima, M.M.; Akasaki, J.L.; Castaldelli, V.N.; Soriano, L.; Monzó, J.; Payá, J.; Borrachero, M.V. New geopolymeric binder based on fluid catalytic cracking catalyst residue (FCC). Mater. Lett. 2012, 80, 50–52. [Google Scholar] [CrossRef]
- Lampris, C.; Lupo, R.; Cheeseman, C.R. Geopolymerisation of silt generated from construction and demolition waste washing plants. Waste Manag. 2009, 29, 368–373. [Google Scholar] [CrossRef] [PubMed]
- Wu, H.C.; Sun, P. New building materials from fly ash-based lightweight inorganic polymer. Constr. Build. Mater. 2007, 21, 211–217. [Google Scholar] [CrossRef]
- Pelisser, F.; Guerrino, E.L.; Menger, M.; Labrincha, J.A. Micromechanical characterization of metakaolin-based geopolymers. Constr. Build. Mater. 2013, 49, 547–553. [Google Scholar] [CrossRef]


| SiO2 | Al2O3 | Fe2O3 | CaO | MgO | K2O | Na2O | SO3 | LOI |
|---|---|---|---|---|---|---|---|---|
| 60.85 | 34.51 | 0.95 | 0.5 | 0.39 | 0.19 | 0.34 | 1.82 | 0.88 |
| Sample | Metakaolin/g | Na2SiO3 Solution/g | NaOH Solution/g | SiO2/Na2O Ratio | Water/Solid Ratio |
|---|---|---|---|---|---|
| M0.8 | 1000 | 722 | 577 | 0.8 | 0.8 |
| M1.0 | 1000 | 850 | 467 | 1.0 | |
| M1.2 | 1000 | 978 | 357 | 1.2 | |
| M1.5 | 1000 | 1129 | 226 | 1.5 |
| Sample No. | Pore Size Distribution by Volume Ratio (%) | Porosity (%) | ||||
|---|---|---|---|---|---|---|
| <10 nm | <20 nm | <30 nm | <50 nm | >50 nm | ||
| M0.8-28 days | 1.27 | 33.91 | 90.59 | 93.28 | 6.72 | 40.03 |
| M1.0-28 days | 2.09 | 47.61 | 94.77 | 97.43 | 2.57 | 31.09 |
| M1.5-28 days | 1.70 | 20.96 | 60.94 | 88.15 | 11.85 | 30.97 |
© 2018 by the authors. Licensee MDPI, Basel, Switzerland. This article is an open access article distributed under the terms and conditions of the Creative Commons Attribution (CC BY) license (http://creativecommons.org/licenses/by/4.0/).
Share and Cite
Mu, S.; Liu, J.; Liu, J.; Wang, Y.; Shi, L.; Jiang, Q. Property and Microstructure of Waterborne Self-Setting Geopolymer Coating: Optimization Effect of SiO2/Na2O Molar Ratio. Minerals 2018, 8, 162. https://0-doi-org.brum.beds.ac.uk/10.3390/min8040162
Mu S, Liu J, Liu J, Wang Y, Shi L, Jiang Q. Property and Microstructure of Waterborne Self-Setting Geopolymer Coating: Optimization Effect of SiO2/Na2O Molar Ratio. Minerals. 2018; 8(4):162. https://0-doi-org.brum.beds.ac.uk/10.3390/min8040162
Chicago/Turabian StyleMu, Song, Jianzhong Liu, Jiaping Liu, Yaocheng Wang, Liang Shi, and Qian Jiang. 2018. "Property and Microstructure of Waterborne Self-Setting Geopolymer Coating: Optimization Effect of SiO2/Na2O Molar Ratio" Minerals 8, no. 4: 162. https://0-doi-org.brum.beds.ac.uk/10.3390/min8040162