
A Two-Stage Closed-Loop Supply Chain Pricing Decision: Cross-Channel Recycling and Channel Preference

1
School of Business Administration, Huaqiao University, Quanzhou 362018, China
2
School of Business, Li Ming Vocational University, Quanzhou 362018, China
*
Author to whom correspondence should be addressed.
Axioms 2021, 10(2), 120; https://0-doi-org.brum.beds.ac.uk/10.3390/axioms10020120
Submission received: 25 April 2021
/
Revised: 5 June 2021
/
Accepted: 9 June 2021
/
Published: 15 June 2021
Abstract
:This paper focuses on the pricing problem of a two-stage closed-loop supply chain (CLSC) considering the cross-channel recycling and channel preference based on a single manufacturer and a single traditional retailer. The pricing decision problem raises from the manufacturer’s direct sales and the retailer’s retailing including recycling. Managers need to focus on intelligible management considering consumer channel preferences, cross-channel recovery and pricing strategies. According to game theory, centralized and decentralized CLSC decision models are used to provide an efficient solution to managers for the pricing problem. The centralized model consists of differential and uniform pricing strategy and the decentralized model consists of manufacturer-led Stackelberg, retailer-led Stackelberg and Nash equilibrium game, respectively. The impact of cross-channel recycling rate and channel preference on pricing and profitability in a two-stage CLSC system is explained elaborately in this study. The results show that cross-channel recovery rates and consumer channel preferences have a direct significant impact on pricing strategies including profit allocation decisions in CLSC. It demonstrated that different channel preferences leading to different pricing strategies and decision for manufacturers and retailers choices. Manufacturer’s pricing decreases when channel preferences are constant and cross-channel recovery rates increase. Retailer’s pricing remains stable as the cross-channel recovery rate has less affected on it. Furthermore, if the cross-channel recovery rates increase, then the manufacturers pricing decreases and retailers pricing increases. This information will be a helpful guideline for the manager to select suitable pricing strategies based on the company scenario.
1. Introduction
Based on technological advancement and consumer demand, new products are being introduced to the market at a faster rate; similarly, at the same time producing more products need to be recycled [1,2]. Used and discarded products have potential resource value and environmental risks [3]. Followed by the sustainable development goal, several industries are trying to reduce their environmental impact by incorporating safe environmental concerns in the supply chain operations, such as green innovation, green manufacturing, reusing and recycling [4,5,6,7]. Smart manufacturing plays a vital role to create an environment-friendly supply chain [8,9].
The supply chain system is a complex process that requires efficient coordination and smart design from the involved players [10,11,12,13,14,15]. The process of adopting efficient solutions in the CLSC is time consuming and can lead to several problems that demotivated managers from continuing their efforts to implement smart solutions. Furthermore, the CLSC enhances the level of complexities by the remanufacturing process [16,17,18]. The modern circular economy, day by day, replacing the “take, make, consume, and throw away” concept with CLSC by combining numerous processes, including maintenance, repair, refurbishing, remanufacturing, reusing and recycling, which is a worldwide hot research topic for both industry and academia [19,20,21,22]. Several countries already started recycling second-hand and waste products, but the current state of that development is not optimistic. In this case, all aspects of the recycling system still need to further improve. Due to the rapid development of e-commerce, the traditional retail industry has been impacted. To enhance their competitiveness, many companies started to improve customer service and satisfaction [23,24]. Therefore, providing more convenient recycling services has become the first choice of companies.
In a dual-channel CLSC system, traditional retail channels co-exist with direct online sales by manufacturers, where consumer’s choice of recycling channels may not necessarily coincide with their purchase channels [25,26,27,28,29,30]. The current new retail era emphasises the combination of online and offline recycling channels to accomplished collaboration between retailers and manufacturers [31,32,33,34,35]. It helps to achieve cross-channel recycling, which improves consumer loyalty and satisfaction, as well as achieve efficient operation of CLSC recycling [36,37,38,39]. Under the traditional recycling model for both online and offline sale, the intact second-hand products can be sold through retailers into the second-hand market and used products can be recycled through manufacturers for reprocessing and reuse.
Cross-channel recycling can provide more choices to consumers for recycling channels, which satisfyies different consumers’ willingness to recycle. As rational economic agents, some consumers choose to purchase through channels that may not be the same as the recycling service channels. Therefore, adaptively based on consumers preference will be helpful for the maximum benefit [40].
In the dual-channel, the CLSC structure has no direct sales between the manufacturer and the retailer. A large number of studies analysed this type of structure and conducted in-depth research on price [41,42], service [43,44] and product availability [45] competition under dual channels. Most of these studies are based on a decentralised or centralised dual oligopoly CLSC system, where every decision-maker tries to find out their maximum own profit [46].
An efficient pricing strategy will be helpful to increase profits for a better market share of the industry. Thus, the industry pays high attention to the pricing strategy to cover static or dynamic pricing. In dynamic pricing, once the product demand and the other factors are disclosed then making pricing decisions, which lead to the best pricing policy for players for dynamic and uncertain market [47]. Dynamic pricing strategy is considered an influential model to provide higher benefits. This is internationally recognized among experienced firms due to rapid product updates and e-commerce development. The benefit of dynamic pricing reported in the traditional supply chain as well [48,49]. However, dynamic pricing application and its influences on the CLSC is still unknown which include new products and remanufactured goods.
For a dual-channel supply chain, the manufacturers and the retailers try to set products price under different competition models, which is a key focus in supply chain management. In summary, existing two-stage CLSC study are more likely to research pricing strategies and different recycling channel strategies. However, a research gap found in the use of cross channel recycling and channel preference together on CLSC for pricing and profitability, which is very important for the managers.
Specifically, this research addresses the following research questions:
- (1).
- What is the impact of cross-channel recycling rate on pricing and profitability in a two-stage CLSC system?
- (2).
- What is the impact of channel preference on pricing and profitability in a two-stage CLSC system?
This paper aims at finding the answers to the aforementioned research questions, according to centralized and decentralized CLSC decision considering the cross-channel recycling and channel preference based on a single manufacturer and a single traditional retailer.
The article is organized as follows: In Section 2, the literature review is discussed. Section 3 contains the model description and basic assumptions. Section 4 provides the detail of model analysis. Section 5 explains the simulation numerical analysis with an example. Finally, Section 6 gives the conclusion and suggestions that are drawn for future work.
2. Literature Review
In this section, the detailed literature review related to this research has been explained. According to the literature review on recycling and pricing decisions, a CLSC is explored. This literature review will be a helpful guide to find out the research gap, which may fulfil by this research.
In terms of dual-channel pricing decisions based on the Bertrand game and the Stackelberg game, the article [50] analysed efficient pricing decisions by comparing dynamic and static dual-channel supply chain pricing models. These models are mostly based on the relevant factors that influence supply chain decisions such as price [51] and service [52]. Apart from that, further enhancement of this research is conducted in [53] to express the investigated price-setting strategy of a dual-channel supply chain in the context of disrupted market demand. In article [8], the advantages and disadvantages of direct sales channels are investigated compared to the optimal pricing decision under the dual and single-channel supply chains, which demonstrated a basis for pricing decisions. Article [54] studied pricing decisions and coordination in a CLSC with mixed channels by assuming that supply chain participants are fully rational and found profit maximization as their decision goal. However, this study finding did not consider the behavioural characteristics of the participants and ignored the influence of the behavioural tendencies of node members on pricing decisions.
Article [55] studied the construction of a dual-channel supply chain decision model under simultaneous cost and demand perturbations, which consider as an optimal pricing equilibrium solution. The price-setting strategies and profit allocation problems under various decisions for different product recovery models in a two-tier CLSC composed of manufacturers and distribution retailers are analysed in [56]. The pricing strategies of CLSCs under government subsidy support for their sales and recycling channels to settle the different government subsidy coefficients, which have different degrees of influence on the profit allocation and price setting strategies in the supply chain are explained in [57,58].
In terms of competition in recycling channels, the article [59] consider the difference in recycling costs between recyclers and manufacturers. They find out how the government can implement effective control over product recycling to make it cheaper when recyclers and manufacturers are separately responsible for recycling. The article [60] studied product recycling from a consumer perspective and modelled the CLSC considering recycling-sensitive and price-sensitive customer behaviour. Article [61] constructed a two-stage CLSC model based on a product recycling performance perspective. In this model, manufacturers carry out product manufacturing and sales operations, but recyclers are responsible for product recycling. Zhang [62] constructed a three-stage CLSC model by using the principal-agent theory to construct a recycling incentive contract model from remanufacturers to recyclers. Article [63] allocated the positive sales revenue and the negative recycling revenue to maximise the profits for both manufacturers and retailers in the CLSC system, thus achieving a win–win situation. Jiang Shiying [64] constructed a two-level green supply chain model for manufacturers and retailers based on different power structures to analysed the pricing strategies. This model produce green decisions of supply chain by considering four different power structures. Meng [65] used recycling risk as a perspective to compare the CLSC decision-making options of manufacturers own recycling and third-party recycling. Huang [66] studied the choice of vertical cooperative recycling model in a CLSC by constructing a supply chain game model with cost-sharing and task-sharing among manufacturers. Table 1 represents the summarized information of the previous relevant studies.
In summary, existing two-stage CLSC are more likely to study pricing strategies and different recycling channel strategies; however, very limited research exists to examining cross channel recycling. Considering the existence of cross-channel recycling, in reality, this study extends the existing supply chain channel recycling choice problem. Therefore, this paper designs a cross channel recycling CLSC structure model constructed by a single manufacturer and a single traditional retailer by consumer channel preferences and uses both centralised and decentralised decision-making models to analyse the CLSC decision-making study.
3. Model Description and Basic Assumptions
In this paper, CLSC is designed based on a single manufacturer and a single traditional retailer.
Figure 1 showed a two-stage CLSC structure by considering single manufacturing with a selling supply chain and a single recycling reverse supply chain. In the first stage of the forward supply chain structure for the consumer market, mainly/two channels co-exist. The first one is the traditional retail channel where the manufacturer sells the product to the retailer at a wholesale price. After that, the retailer sells the product to the consumer at a retail price . The second one is the online direct channel where the manufacturer sells the product to the consumer at a price .
In the second stage of the reverse supply chain structure for the recycling market, mainly two types of recycling channels exist. Firstly, the manufacturer-recycling channel recycles the used products and makes a profit through remanufacturing. Secondly, the retailer-recycling channel recycles second-hand products and makes a profit through the second-hand trading market. In the manufacturer recycling channel, per unit recycle cost is . Similarly, in the retailer recycling channel, per unit recycle cost is . After recycled by the retailer the product transfer to manufacturers at a price . A proportion of consumers also dispose of second-hand products as waste, i.e., the manufacturer recycles across channels at a per-unit recycling cost . Conversely, some used products cannot be recycled using the retailer channel because of the mismatch between the value of used products and intact products. Table 2 explained the description of terms and the parameter notation used in this paper.
As the retailer and the manufacturer recycling channel handle products differently, so their recycling profits are also captured differently. The disposal value of intact products sold on the secondary market being and the profit from recycling and remanufacturing of waste products being . In addition, intact products recycled across channels through the manufacturer’s recycling channel at a price of . However, their value after recycling and disposal is the same as the value of the retailer’s recycling channel, which is valued at , where the condition is satisfied as . The cost of recycling disposal for the recycling channel is .
The symbol and denote total product sales in the retailer’s physical shop and the manufacturer’s online shop, respectively. From a market size perspective, shops will no longer sell products once the total consumer demand has been fulfilled. The parameter α indicates the maximum potential market demand. Here, assume is the consumer preference for the retailer channel and for the retailer’s base sales volume. Similarly, the assumption is the manufacturer’s channel preference and manufacturer follow . The parameters and measure the price elasticity of demand concerning its price and cross-price sensitivity, respectively. In addition, assuming that and satisfy which means that the quantity demanded of a product is more sensitive to changes its own channel price compare to changes in the price of products in other channels [79].
The recycling rate is assumed to be , where the recycling rate of intact products in the retailer recycling channel is . The recycling rate of used products in the manufacturer-recycling channel is and the recycling rate of intact products recycled using the manufacturer cross-channel is ε. These are satisfied the following condition as . The number of intact products recycled by retailers is , the number of used products recycled by manufacturers is and the number of intact products recycled by manufacturers across channels is .
In this paper, we constructed a two-stage dual-channel CLSC structure and analyse the impact of channel preference and cross-channel recovery rate on the price and profit of the CLSC using centralised and decentralised decision-making. The centralised decision-making is divided into two types, such as differential pricing strategy and uniform pricing strategy, which seek to maximise the total profit of the CLSC from the supply chain as a whole. Similarly, the decentralised decision-making consists of three models such as the manufacturer-led Stackelberg game, the retailer-led Stackelberg game and the Nash equilibrium game. In the manufacturer-led Stackelberg game, the manufacturer first determines its direct sales price and then the physical retailer announces its selling price. In the retailer-dominated Stackelberg game, the retailer’s physical shop first announces its selling price and the manufacturer then determines its direct selling price. In the Nash equilibrium game, both channels are equally powerful in terms of price determination, so the manufacturer and the retailer set their price strategies simultaneously.
4. Model Analysis
4.1. Centralized Decision Model
In a centralised decision-making model, the manufacturer and retailer determine the optimal profit for the CLSC [80,81,82]. Both parties cooperate instead of competing to determine the optimal pricing to maximise the total CLSC profit . They determine the retailer’s retail price and the manufacturer’s direct sales price .
The total profit function for the CLSC in the centralised decision-making model is expressed in Equation (1). The centralised decision-making consists of differential pricing strategy and uniform pricing strategy, which are described below.
4.1.1. Differential Pricing Strategies
Centralised decision-making is the result of manufacturers and retailers seeking a win–win partnership [83,84,85]. However, different entities have different costs and their profit varies. In this case, differential pricing strategies are chosen to reduce the uneven distribution profits, which help to maximise overall profits. Differential pricing is the best strategy for allocating the highest price to the channel with the highest operating costs. It requires consideration of price-sensitive consumer behaviour, where the pricing strategy should be proportional to consumer preferences and the services offers. Therefore, this section applies differential pricing strategies to investigate the impact of consumer preferences and recovery rates on pricing policies in a dual-channel CLSC.
Proposition 1.
Under a differential pricing strategy in CLSC, the total profitis a strictly concave function concerningand.
The optimal price for the retailer expressed as which is calculated by Equation (2). Similarly, the optimal price for the manufacturer’s direct sales expressed as , which calculated by Equation (3).
Here, .
Proof.
By solving for the Hesse matrix, we get Equation (4).
From Equation (7), it follows that , , so the total CLSC of profit is a strictly concave function on and . Since > 0, as a result, > consistent with the hypothesis. By using Equations (5) and (6) we can solve Equations (2) and (3) as follow.
By following Proposition 1, the optimal equilibrium cannot be solved, when has infinite converges to , or when the recovery rates of the different channels are severely imbalanced. In addition, the recovery rates of different channels affect the decision choice of a two-stage CLSC.
The effect of different consumer channel preferences on the equilibrium price is greater due to and . Here, is a convex function of consumer preference and retailer’s pricing increases as increases. Conversely, is a concave function of consumer channel preferences, the manufacturer’s pricing decreases as increases. This suggests that the magnitude of change in manufacturer and retailer pricing depends on magnitude.
Based on , it is clear that if the magnitude changes then channel preference is the same. Moreover, manufacturer and retailer pricing fluctuations are also the same. □
Corollary 1.
Under a centralized differential pricing strategy,exists.
4.1.2. Uniform Pricing Strategy
Under centralised decision-making, differential pricing strategies can easily lead to conflicts between channels due to differences in pricing [86]. Therefore, two-stage CLSC under centralised decision making will require for uniform pricing strategy on a per-volume basis [33,87], where exists . In this section, further analysing on the impact of consumer channel preferences as well as recovery rates for pricing policies have been explained.
Proposition 2.
Under a uniform pricing strategy in CLSC, the total profit π is a strictly concave function concerning.
The optimal uniform pricing price is expressed by Equation (8).
Here, .
Proof.
Since , therefore, , . Solve the first and second-order derivatives of the price concerning the total profit of the CLSC as below.
So the total CLSC profit π is a strictly concave function concerning . Let the first-order derivative for solving .
Proposition 2 shows that . Here, consumer channel preferences do not affect the uniform pricing strategy of a CLSC. However, the change in uniform pricing are mainly related to the recovery rates of different channels. □
Corollary 2.
Under a uniform pricing strategy, consumer channel preference has no impact on the total profitability of the CLSC. The uniform price is related to the magnitude of and recovery rate across channels.
4.2. Decentralised Decision Model
In a centralised decision-making model, the CLSC is categorised by good cooperation and a willingness to share high operating costs, which unable to make optimal profits [86]. However, in reality, the supply chain follows both cooperative and competitive criteria. In a highly competitive environment, every company is driven by its principle for maximising its profits. In this circumstance, decentralised decision-making is a better fit with practical reality [88,89,90]. In addition, cross-channel recycling increases the choice of recycling channels available to consumers and enhances their product recycling experience.
The total profit of a CLSC under decentralised decision-making consists of two parts such as the total profit of the manufacturer and the total profit of the retailer.
The formula for the manufacturer’s total profit function is expressed by Equation (9).
The formula includes the following components: profit on sales in the direct sales channel, profit on wholesale and profit on recycled products in the three different recycling channels.
The formula for the retailer’s total profit function is expressed by Equation (10).
The formula consists of the following main components: the retailer’s profit on sales and the profit earned by the retailer from recycling products from the recycling channel.
4.2.1. Manufacturer-Led Stackelberg Game (MLSG)
With the advent of the new retail era, traditional retailers are facing various challenges. Due to cost control factors, manufacturers have a huge advantage in selling online over retailers and manufacturers are often in a dominant position to influence retailer’s price setting in the CLSC. Mainly the manufacturers determined the direct sales price in the MLSG [91,92,93]. In this case, of MLSG the retailer only able to set its retail price after the manufacturer’s direct price has been set.
Proposition 3.
In the MLSG, the optimal equilibrium solutions for the manufacturer’s wholesale price , the direct selling price and the retailer’s price , respectively.
The term , and formulas have been expressed by Equations (11)–(13), respectively.
Here, and .
Proof.
By solving the Hesse matrix, it follows Equation (14).
Since and . So the retailer’s profit is a strictly concave function of the retailer’s price . , where ·. Substituting the total manufacturer-led CLSC profit for solving the first-order derivative and second-order derivative of the manufacturer’s wholesale price and direct sales price concerning the total CLSC as per Equations (15) and (16).
Since then hypothesis is satisfied.
Here, , , , . The is a strictly concave function on and . Combining Equations (14) and (15) and making their derivatives equal to 0 is given as below.
Here, and substitute as .
It follows from Proposition 3 that as below.
The manufacturer-led optimal price is an increasing function of consumer channel preference . The manufacturer’s wholesale price increasing as channel preference increases. The manufacturer’s direct price is a decreasing function of consumer channel preference . The retailer’s retail price increasing as channel preference increases. □
Corollary 3.
In a manufacturer-led pricing model, the retailer’s pricing strategy for retail prices is the same as the manufacturer’s pricing strategy for direct sales prices.
When, then there is.
4.2.2. Retailer-Led Stackelberg Game (RLSG)
Due to the asymmetry of information, retailers are able to respond more quickly to consumer demand in some sectors. As a result, they hold the led of the sales channel in a CLSC and stay in a dominant position to bargain with manufacturers [94,95]. In an RLSG, the retailer can adjust its retail prices according to market demand in order to maximise profits. In this case, the manufacturer needs to follow the retailer’s price movements to determine its own wholesale prices and online shop direct prices .
Proposition 4.
In the RLSG, the optimal equilibrium solutions for the manufacturer’s wholesale price , the direct selling price and the retailer’s price , respectively.
The term , and calculating formulas have been expressed by Equations (17)–(19), respectively.
Here, , and .
Proof.
From the proposition, we know that, if the retailer’s expected profit is , then the retailer’s pricing will be This is obtained by substituting the manufacturer’s profit .
The first-order derivative of the manufacturer’s wholesale price and direct sales price for the manufacturer’s total profit as Equations (20) and (21).
Combining the Equations (17) and (18) and making their derivatives zero respectively as below.
Solving , need substituting , for the total retailer profit, the first-order derivative of the total retailer profit with and based on the expected profit. such that , gives . Because , therefore, . Where , and .
According to Proposition 4, the optimal equilibrium solution under retailer dominance is analysed and found the consumer channel preferences , and .
It follows the manufacturer’s wholesale price as an increasing function regarding consumer preferences . The manufacturer’s wholesale price increases as channel preferences increase. The manufacturer’s direct sales price is a decreasing function of preference regarding consumer channels. The manufacturer’s direct sales price decreases as channel preferences increase. The retailer’s price is an increasing function of preference regarding consumer channels and the retailer’s retail price increases as channel preferences increase. The retailer’s price is an increasing function of the consumer channel preference, where the retailer’s retail price increasing as the channel preference increases. □
Corollary 4.
In an RLSG model, the retailer’s retail price is the same as the manufacturer’s direct sales price when the pricing strategy , then exists.
4.2.3. Nash Equilibrium Game Pricing (NG)
In the CLSC of the Nash equilibrium game (NG), the manufacturer and the retailer has the same strength and no one is in the absolute leading position for . So, in NG the decisions of both parties depend on each other’s behaviour [96,97,98].
Proposition 5.
Under NG pricing, the optimal equilibrium solutions provided for the manufacturer’s wholesale price, the direct selling priceand the retailer’s price, respectively.
The term , and calculating formulas have been expressed by Equations (22)–(24), respectively.
Proof.
From the proposition, . Here, substitute the total manufacturer’s profit for the first-order derivative of the total manufacturer’s profit with based on the manufacturer’s wholesale price and the direct sales price . The first-order derivative of the retailer’s total profit concerning retailer’s price as follows.
The system of Equations (25)–(27) are combined to write for solving Equations (22)–(24), respectively.
From Proposition 5, it follows that the optimal price under the NG analysed by consumption channel preference, , , .
The manufacturer’s wholesale price is a decreasing function of consumption channel preference, where the manufacturer’s wholesale price decreasing and the channel preference increasing. The manufacturer’s direct sales price is a decreasing function of consumption channel preference, where the manufacturer’s direct sales price decreasing and channel preference increasing. The retailer’s price is an increasing function of consumption channel preference, where the retailer’s retail price increasing and the channel preference increasing. □
Corollary 5.
In the NG pricing model, the retailer’s retail price is the same as the manufacturer’s direct sales price. Whenexists.
Here,.
5. Numerical Analysis
In this section, numerical simulations performed to find out the influence of respective parameters. As the CLSC involving more complex recycling, so the merits of the decisions differ based on different scenarios. This paper uses numerical examples to see the differences in benefits based on different model decisions. In this CLSC, both the manufacturer and the retailer are rational decision-makers and making decisions based on their own best interests. To simplify the model, for analysis and to consider the scientific nature of the study, a certain type of digital products is selected as the object of study. The market is assumed to be a certain region where the recycling value is high to easily protect the environment.
Table 3 showed the simulation parameters values. Here, and the profitability of cross-channel recycling is much lower than that of normal recycling of second-hand sales.
5.1. Comparison of Total Supply Chain Profits under Different Decision Models
Different channel recovery rates and consumption preferences have an impact on the overall profitability of the CLSC. The trend of total profitability in CLSC varies by channel recovery rate and consumption preference under different decision models.
Figure 2a,b represent the total profit of CLSC under centralised decision using differential and uniform pricing strategy, respectively. Under differential pricing strategy, the CLSC has the lowest costs and higher profits; however, in reality, it is difficult to achieve under centralised decision-making. The uniform pricing deviates from the principle of market competition under a centralised decision-making strategy. It is not conducive to some extent to retailer autonomy and motivation. Therefore, this approach rarely adopts in supply chains.
It is reported from Figure 2a,b that when the value of remains the same, the total profit increases with cross-channel . This indicates that the increase in cross-channel recycling rate is conducive to reducing supply chain costs and improving recycling channels. The total profit is increasing in differential pricing, which is affected by channel preferences rising. When channel preference value in the middle, the total profit of the CLSC is relatively low. However, when the channel preference value at high or low, the profit of the CLSC is relatively high. In contrast, total profit under uniform pricing is not affected by channel preference , as there is no price elasticity and no cross-price sensitivity.
Figure 3a–c show the trends in total profits in the CLSC under the MLSG, the RLSG and the NG, respectively, under decentralised decision-making.
As per Figure 3a, in the MLSG model, when the value remain constant, the total profit decreases as the cross-channel recycling rate increases, which indicates that the raise of increases recycling costs and has a negative impact on total supply chain profit. When the channel preference is lower and remain constant, then more consumers prefer the manufacturer’s online channel, which leads to total profit higher in the supply chain. Due to this scenario, the manufacturer is in a dominant position and its sales channels form a monopoly by the absence of competition in the market. As a result, overall product selling prices increase which maximizing total profits but consumers are often at a disadvantage situation.
As per Figure 3b, in the RLSG model, when remain constant, the total profit increases as the cross-channel recovery rate increases, which suggests that a raise in helps to reduce the supply chain costs. When remain constant and channel preference value is at an intermediate, then the total profit of the CLSC is relatively low. However, when channel preference value at a high or low, then the profit of the CLSC is relatively high. This suggests that the total profit of CLSC is relatively higher when consumers prefer to buy from the retailer’s physical shop or the manufacturer’s online shop.
As per Figure 3c, in the NG model, the total profit of the CLSC is maximised when both cross-channel recovery rates and channel preferences are either higher or lower. If the consumers prefer to buy the product via the manufacturer’s online channel then the total profit became higher due to the lower cross-channel recovery rate. Similarly, when consumer prefers to buy the product via the retailer’s channel then the total profit became higher due to higher cross-channel recovery rate. Here, both the manufacturer and the retailer are in an equal leading position for pricing decision making. In this model, both the manufacturer and the retailer prefer to sell more products using their consumer channel in terms of profit gain. This approach reduces recycling costs, and therefore, increase in their profit as well as overall profit.
5.2. Comparison of Pricing under Different Decision-Making Models
There are different pricing strategies under different decision-making models in the supply chain. Both higher and lower cross-channel recovery rates and channel preference influence the pricing strategies choices.
The comparison of pricing in the centralised decision-making model is shown in Figure 4. Here, low consumption channel preference expressed by Figure 4a and high consumption channel preference expressed by Figure 4b. Under differential pricing, manufacturer pricing decreases with higher or lower for flat However, whether channel consumption preferences are high or low, the retailer pricing is less affected by under differential pricing.
As per Figure 4a, in low consumption channel preference, the magnitude of pricing varies, when is low then and when is high then . In the high consumption channel preference as expressed Figure 4b, there found regardless of whether is high or low. Under the centralised decision-making, it is reported that the cross-channel recovery rate increases lead the consumer to a favourable position in the CLSC to reduce product pricing.
In the decentralised decision model, as shown in Figure 5a, whether the channel consumption preferences are high or low, under manufacturer-led, retailer-led and Nash equilibrium the retailer pricing , and all increase as cross-channel recovery rate increases, at a specific point <. Conversely as shown in Figure 5b, under manufacturer-led, retailer-led and Nash equilibrium the manufacturer pricing , and all decrease as cross-channel recovery rate increases, at a specific point < .
Retailer and manufacturer pricing is highest in Nash equilibrium under decentralised decision-making. Similarly, retailer and manufacturer pricing are lowest under manufacturer-led and retailer-led decentralised decision-making. Regardless of channel preference is high or low, both manufacturer-led and retailer-led, retailer pricing is higher than manufacturer pricing with and . Under Nash equilibrium decision, when channel preference is low, manufacturer pricing is higher than retailer pricing as . Similarly, when channel preference is high, retailer retail pricing is higher than manufacturer pricing as .
5.3. Comparison of Profits under Different Decision-Making Models
The profitability of the supply chain varies across different decision models. Both the level of channel preference and the cross-channel recovery rates influence profitability. In centralised decision-making, the result is a win–win partnership between manufacturers and retailers. The profits allocated according to their costs, neither profitability affects the decision-making choices. In contrast, under decentralised decision-making, has a stronger autonomy to choose and the tendency of profitability leads to choose the decision model that is most beneficial to them.
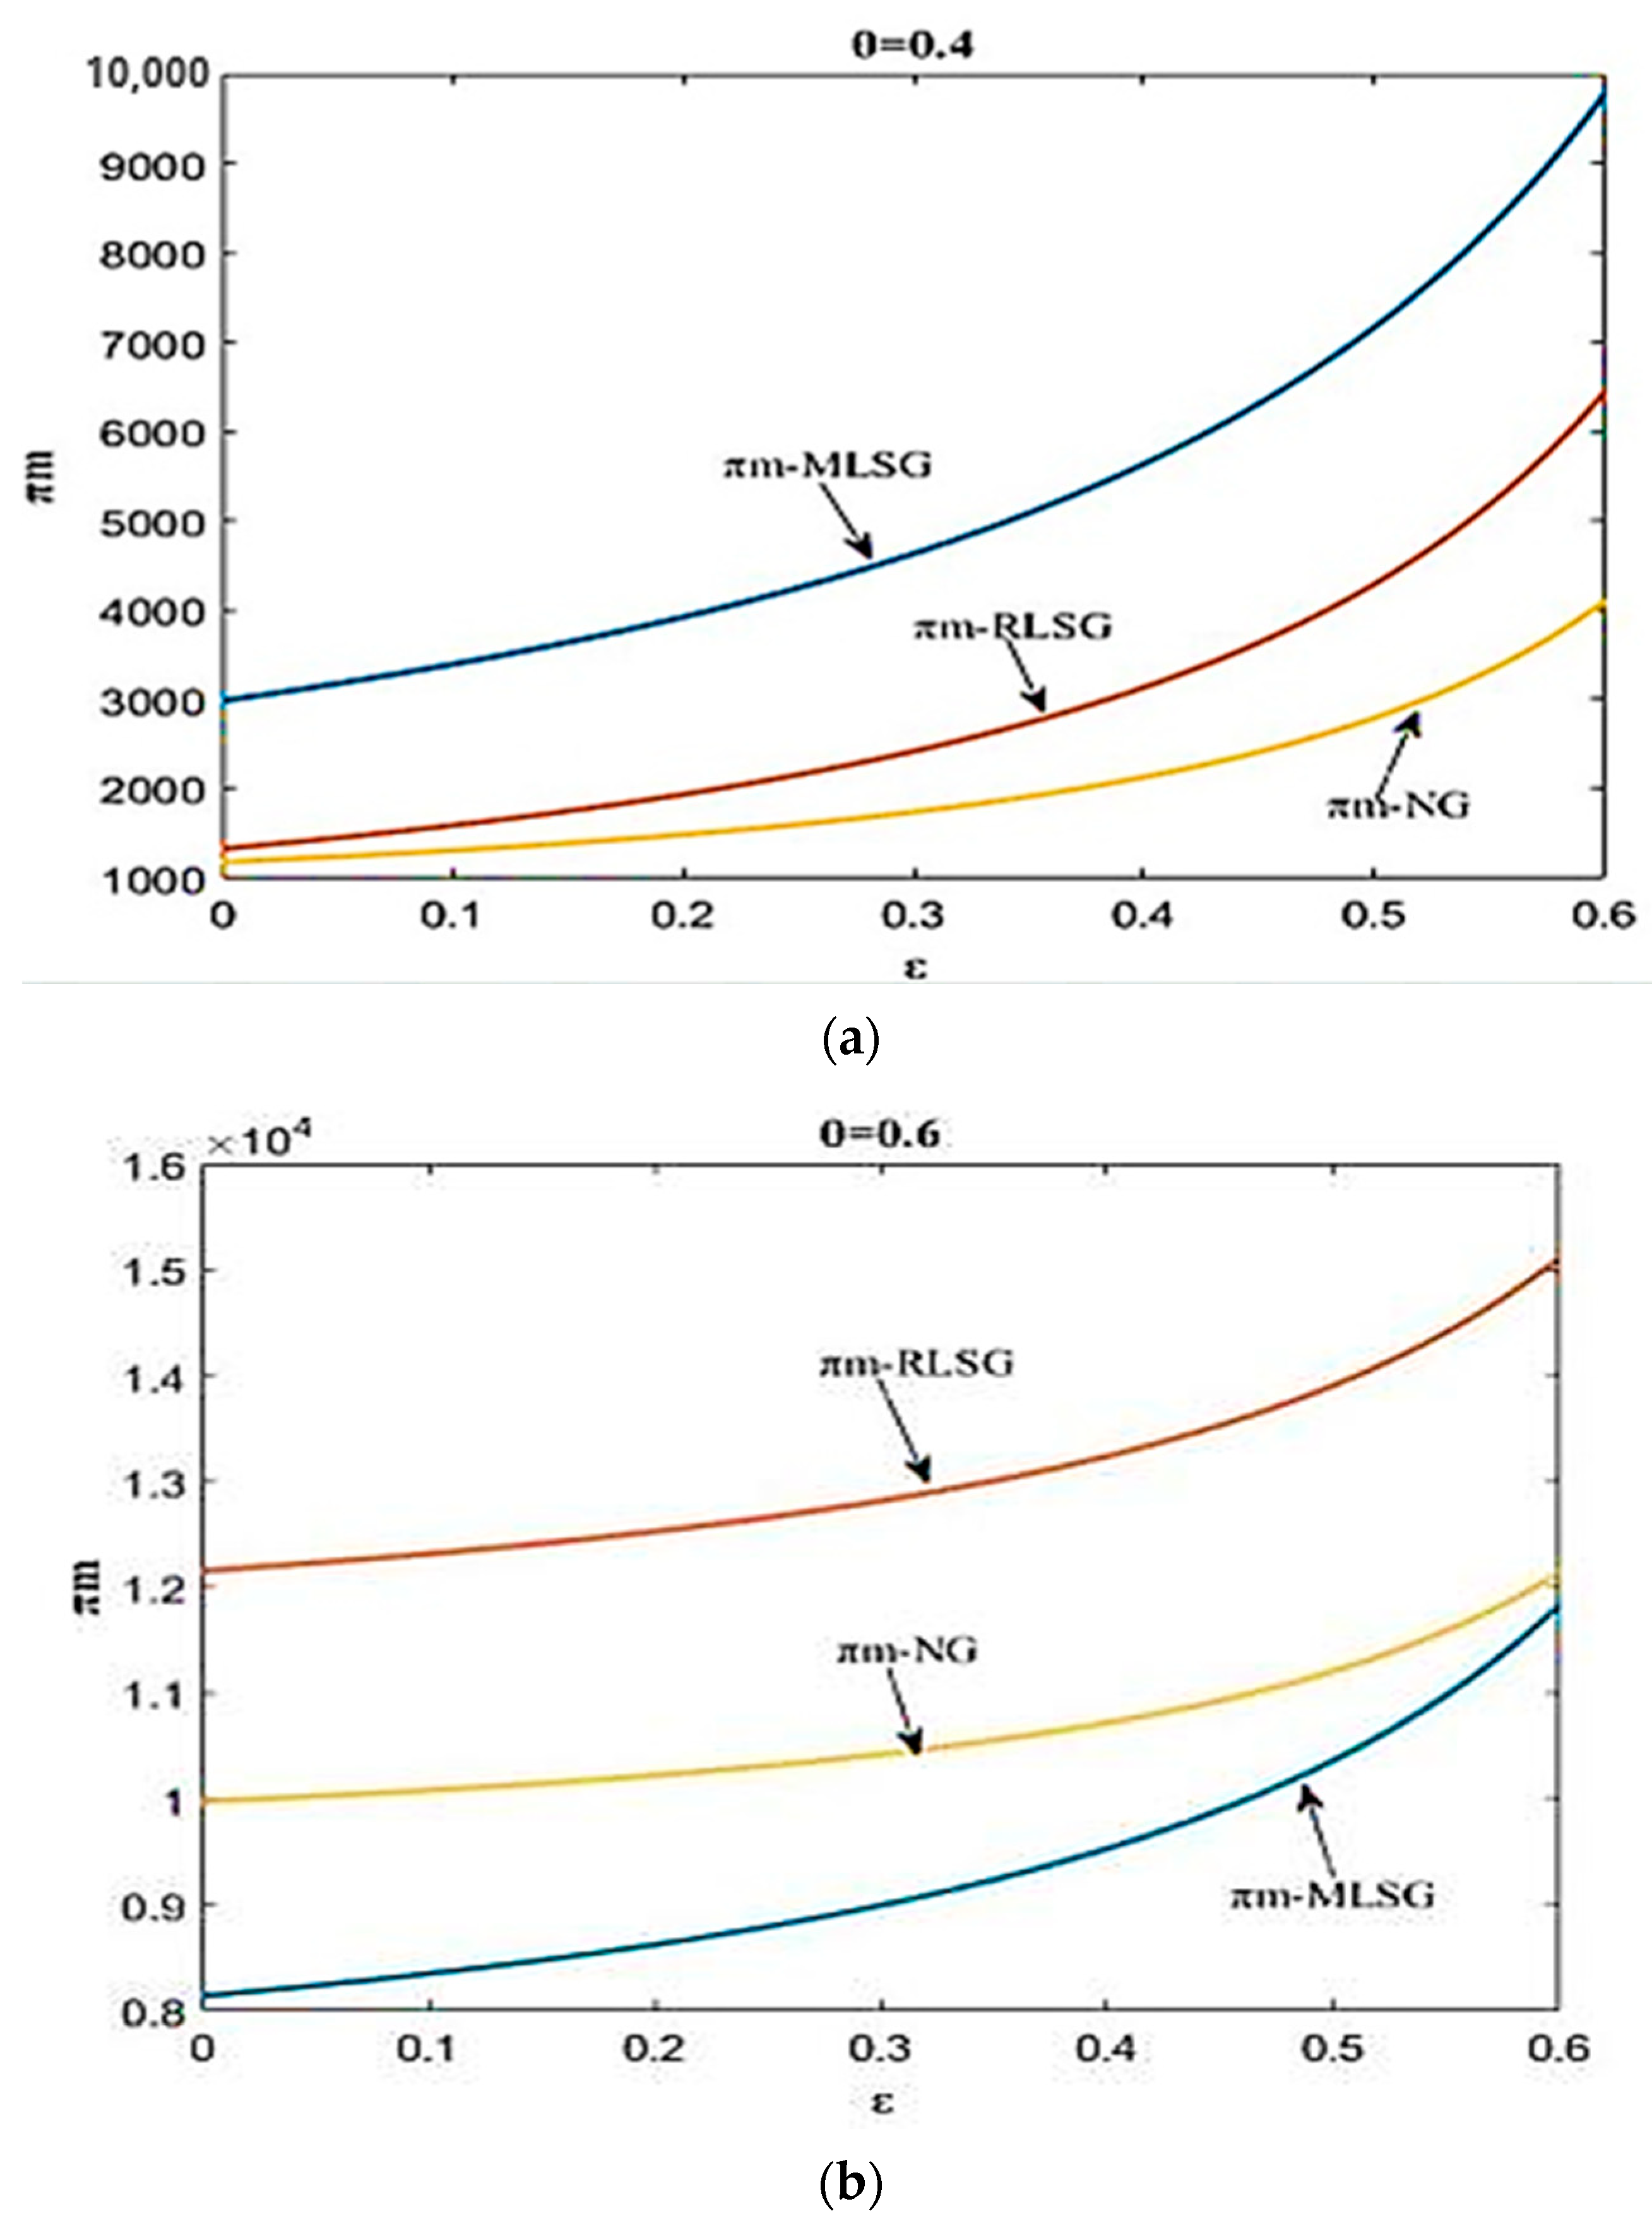
For the manufacturer pricing decision options, in the low consumption channel preference showed in Figure 6a. The manufacturer’s profit size is preferred in the manufacturer-led model followed by the retailer-led model and then Nash equilibrium model as > . In the high consumption channel preference model shown in Figure 6b. The manufacturer’s profit size is preferred in the retailer-led model followed by the Nash equilibrium model and then the manufacturer-led model as .
As shown in Figure 6, the manufacturer’s profitability increases with the increase of the cross-channel recovery rate, which indicates that the manufacturer wants to increase the profitability by further increasing the cross-channel recovery rate in different decision modes. At the same time, when the channel preference is low, the manufacturer will dominate by itself to obtain more profit. However, when the channel preference is high, the manufacturer prefers retailer domination to reduce the cost of sales through its distribution system. The benefits can be gained by reducing the cost of sales through their distribution system.
For the retailer pricing decision options, whether the consumer channel preference is high or low, the size of the retailer’s profit is preferred the manufacturer-led model followed by the retailer-led model and then the Nash equilibrium model as . Moreover, this rule is the same for all decision models as per Figure 7a,b. As shown in Figure 7, the retailer’s preference for the manufacturer-led model increases the retailer’s profit as the cross-channel recycling rate increases. This is suggesting that the retailer also wants the manufacturer to dominate the supply chain decision to reduce the cost of recycling by increasing the cross-channel recycling rate , thereby generating a profit spillover through the scale effect of manufacturer recycling.
6. Conclusions and Future Work
This paper analyses the pricing and profitability of CLSCs through centralised and decentralised decision-making approaches. This study evaluated the impact of cross-channel recovery rates and consumer channel preferences to analyses retailer and manufacturer decision choices. Five types of decisions models such as differential pricing, uniform pricing, manufacturer-led, retailer-led and Nash equilibrium are used in this CLSC. The numerical examples show that the decision choices of retailers and manufacturers in CLSCs are not always the same across different decision models. The results of the analysis show that the impact of consumer channel preferences and cross-channel recovery rates on the CLSC varies across the different decision models. The main findings of the study are.
- (1).
- Under centralised decision-making, the total profit of the CLSC under differential pricing is higher than that under uniform pricing. Channel preference and cross-channel recovery rates have a greater impact on the pricing decisions of manufacturers and retailers. Under the differential pricing strategy, regardless of the channel preference, the manufacturer’s pricing decreases if the cross-channel recovery rate increases. However, when the retailer’s pricing is less affected by the cross-channel recovery rate then pricing remains at a stable level. The product pricing and the influence of consumer channel preference are weaker in uniform pricing. Moreover, product pricing decreases if the cross-channel recovery rate is low. As a result, price elasticity and cross-price sensitivity do not exist under a uniform pricing strategy.
- (2).
- Under decentralised decision-making, the trend of the total profit of the supply chain varies under different decision-making models. Here, cross-channel recovery rate and channel preference have a significant impact on the total profit. When the channel consumption preference is constant, the retailer’s pricing increases if the cross-channel recovery rate increase. The manufacturer’s pricing decreases if the cross-channel recovery rate increase. Firstly, retailer and manufacturer pricing are highest in Nash equilibrium. Secondly, retailer and manufacturer pricing are mid-level under retailer dominance. However, retailer and manufacturer pricing are lowest under manufacturer dominance. In addition, under low channel preference, manufacturers and retailers prefer to have the manufacturer dominate the decision. Similarly, under high channel preference, both manufacturers and retailers prefer to have others dominate model to achieve greater profitability for themselves.
The above analysis shows that the decision model chosen by the CLSC has a significant impact on profitability and pricing by channel preferences and different cross-channel recovery rates. Therefore, retailers and manufacturers need to choose the best decision model according to their actual situation. They also need to continue improving the optimisation conditions to enhance their competitiveness to gain greater profitability.
In the future, this CLSC can be further expanded to a competitive multi-channel CLSC with multiple manufacturers and multiple retailers. Moreover, a third-party recycling agency can be introduced to study the decision-making problem of a dual-channel CLSC with uncertain market demand through the design of a mixed recycling channel. This type of in-depth study on the supply chain decision-making problem will be created stronger theoretical and practical significance.
Author Contributions
Conceptualization, W.P. and M.L.; methodology, W.P.; software, W.P.; validation, W.P. and M.L.; formal analysis, W.P.; investigation, M.L.; resources, M.L.; data curation, W.P.; writing—original draft preparation, W.P.; writing—review and editing, W.P. and M.L.; visualization, M.L.; supervision, W.P.; project administration, W.P.; funding acquisition, W.P. All authors have read and agreed to the published version of the manuscript.
Funding
This research received no funding.
Institutional Review Board Statement
Not applicable.
Informed Consent Statement
Not applicable.
Data Availability Statement
Not applicable.
Acknowledgments
The author would like to thank the authors for the reference materials.
Conflicts of Interest
The authors declare no conflict of interest.
Nomenclature
| CLSC | Closed-Loop Supply Chain |
| MLSG | Manufacturer-Led Stackelberg Game |
| RLSG | Retailer-Led Stackelberg Game |
| NG | Nash Equilibrium Game Pricing |
References
- Yenipazarli, A. Managing new and remanufactured products to mitigate environmental damage under emissions regulation. Eur. J. Oper. Res. 2016, 249, 117–130. [Google Scholar] [CrossRef]
- Grewal, D.; Hulland, J.; Kopalle, P.K.; Karahanna, E. The future of technology and marketing: A multidisciplinary perspective. J. Acad. Mark. Sci. 2020, 48, 1–8. [Google Scholar] [CrossRef] [Green Version]
- He, P.; Wang, Z.; Shi, V.; Liao, Y. The direct and cross effects in a supply chain with consumers sensitive to both carbon emissions and delivery time. Eur. J. Oper. Res. 2021, 292, 172–183. [Google Scholar] [CrossRef]
- Tseng, M.-L.; Islam, S.; Karia, N.; Fauzi, F.A.; Afrin, S. A literature review on green supply chain management: Trends and future challenges. Resour. Conserv. Recycl. 2019, 141, 145–162. [Google Scholar] [CrossRef]
- Zhang, H.; Xu, H.; Pu, X. A Cross-Channel Return Policy in a Green Dual-Channel Supply Chain Considering Spillover Effect. Sustainablity 2020, 12, 2171. [Google Scholar] [CrossRef] [Green Version]
- Murata, K. Analyzing Environmental Continuous Improvement for Sustainable Supply Chain Management: Focusing on Its Performance and Information Disclosure. Sustainablity 2016, 8, 1256. [Google Scholar] [CrossRef] [Green Version]
- Li, J.; Hu, Z.; Shi, V.; Wang, Q. Manufacturer’s encroachment strategy with substitutable green products. Int. J. Prod. Econ. 2021, 235, 108102. [Google Scholar] [CrossRef]
- Li, B.; Zhu, M.; Jiang, Y.; Li, Z. Pricing policies of a competitive dual-channel green supply chain. J. Clean. Prod. 2016, 112, 2029–2042. [Google Scholar] [CrossRef]
- Marak, Z.R.; Pillai, D. Factors, Outcome, and the Solutions of Supply Chain Finance: Review and the Future Directions. J. Risk Financ. Manag. 2018, 12, 3. [Google Scholar] [CrossRef] [Green Version]
- Levalle, R.R. Supply Networks BT—Resilience by Teaming in Supply Chains and Networks; Springer: Cham, Switzerland, 2018; pp. 5–17. [Google Scholar]
- Dotoli, M.; Fanti, M.P.; Meloni, C.; Zhou, M. Design and optimization of integrated E-supply chain for agile and environmentally conscious manufacturing. IEEE Trans. Syst. Man. Cybern. Part A Syst. Hum. 2005, 36, 62–75. [Google Scholar] [CrossRef]
- Dotoli, M.; Fanti, M.P.; Meloni, C.; Zhou, M. A multi-level approach for network design of integrated supply chains. Int. J. Prod. Res. 2005, 43, 4267–4287. [Google Scholar] [CrossRef]
- Murata, K.; Wakabayashi, K.; Watanabe, A. Study on and Instrument to Assess Knowledge Supply Chain Systems Using Advanced Kaizen Activity in SMEs. Supply Chain Forum Int. J. 2014, 15, 20–32. [Google Scholar] [CrossRef]
- Ying, K.-C.; Pourhejazy, P.; Cheng, C.-Y.; Syu, R.-S. Supply chain-oriented permutation flowshop scheduling considering flexible assembly and setup times. Int. J. Prod. Res. 2020, 58, 1–24. [Google Scholar] [CrossRef]
- Shi, M.; Yu, W. Market Reactions to Supply Chain Management Excellence. J. Risk Financ. Manag. 2018, 11, 62. [Google Scholar] [CrossRef] [Green Version]
- Meng, L.; Qiang, Q.; Huang, Z.; Zhang, B.; Yang, Y. Optimal Pricing Strategy and Government Consumption Subsidy Policy in Closed-Loop Supply Chain with Third-Party Remanufacturer. Sustainability 2020, 12, 2411. [Google Scholar] [CrossRef] [Green Version]
- Guo, L.; Dai, Y.; Lien, D. The effects of China’s split-share reform on firms’ capital structure choice. Appl. Econ. 2016, 48, 2530–2549. [Google Scholar] [CrossRef]
- Ullah, M.; Asghar, I.; Zahid, M.; Omair, M.; AlArjani, A.; Sarkar, B. Ramification of remanufacturing in a sustainable three-echelon closed-loop supply chain management for returnable products. J. Clean. Prod. 2021, 290, 125609. [Google Scholar] [CrossRef]
- Zhang, Z.; Zhang, Q.; Liu, Z.; Zheng, X. Static and Dynamic Pricing Strategies in a Closed-Loop Supply Chain with Reference Quality Effects. Sustainability 2018, 10, 157. [Google Scholar] [CrossRef] [Green Version]
- Ghisellini, P.; Cialani, C.; Ulgiati, S. A Review on Circular Economy: The Expected Transition to a Balanced Interplay of Environmental and Economic Systems. J. Clean. Prod. 2016, 114, 11–32. [Google Scholar] [CrossRef]
- Masi, D.; Day, S.; Godsell, J. Supply Chain Configurations in the Circular Economy: A Systematic Literature Review. Sustainability 2017, 9, 1602. [Google Scholar] [CrossRef] [Green Version]
- Pourhejazy, P.; Kwon, O.K.; Chang, Y.-T.; Park, H. Evaluating Resiliency of Supply Chain Network: A Data Envelopment Analysis Approach. Sustainability 2017, 9, 255. [Google Scholar] [CrossRef] [Green Version]
- Zhang, J.; Farris, P.W.; Irvin, J.W.; Kushwaha, T.; Steenburgh, T.J.; Weitz, B.A. Crafting Integrated Multichannel Retailing Strategies. J. Interact. Mark. 2010, 24, 168–180. [Google Scholar] [CrossRef]
- Zahid, M.; Jehangir, M.; Shahzad, N. Towards Digital Economy: The Impact of Electronic Banking on Customer Satisfaction among the Pakistan Banking Industry. Int. J. E Entrep. Innov. 2012, 3, 34–46. [Google Scholar] [CrossRef] [Green Version]
- He, P.; He, Y.; Xu, H. Channel structure and pricing in a dual-channel closed-loop supply chain with government subsidy. Int. J. Prod. Econ. 2019, 213, 108–123. [Google Scholar] [CrossRef]
- Kaoud, E.; Abdel-Aal, M.; Sakaguchi, T.; Uchiyama, N. Design and Optimization of the Dual-Channel Closed Loop Supply Chain with E-Commerce. Sustainability 2020, 12, 10117. [Google Scholar] [CrossRef]
- Arshad, M.; Khalid, Q.S.; Lloret, J.; Leon, A. An Efficient Approach for Coordination of Dual-Channel Closed-Loop Supply Chain Management. Sustainability 2018, 10, 3433. [Google Scholar] [CrossRef] [Green Version]
- Zhang, X.; Li, Q.; Qi, G. Decision-Making of a Dual-Channel Closed-Loop Supply Chain in the Context Government Policy: A Dynamic Game Theory. Discret. Dyn. Nat. Soc. 2020, 2020, 1–19. [Google Scholar] [CrossRef]
- Huang, Y.; Wang, Z. Dual-Recycling Channel Decision in a Closed-Loop Supply Chain with Cost Disruptions. Sustainability 2017, 9, 2004. [Google Scholar] [CrossRef] [Green Version]
- Zhang, Z.-Z.; Wang, Z.-J.; Liu, L.-W. Retail Services and Pricing Decisions in a Closed-Loop Supply Chain with Remanufacturing. Sustainability 2015, 7, 2373–2396. [Google Scholar] [CrossRef] [Green Version]
- Miao, S.; Liu, D.; Ma, J. O2O Recycling Closed-Loop Supply Chain Modeling Based on Classification Process considering Environmental Index. Discret. Dyn. Nat. Soc. 2020, 2020, 1–15. [Google Scholar] [CrossRef]
- Jin, L.; Zheng, B.; Huang, S. Pricing and coordination in a reverse supply chain with online and offline recycling channels: A power perspective. J. Clean. Prod. 2021, 298, 126786. [Google Scholar] [CrossRef]
- Shekarian, E.; Flapper, S. Analyzing the Structure of Closed-Loop Supply Chains: A Game Theory Perspective. Sustainability 2021, 13, 1397. [Google Scholar] [CrossRef]
- Ijaz, M.F.; Rhee, J.; Jo, M. A Study on Customer’s Attitude in Digital Signage based Online Store. In Proceedings of the Korea Institute of Industrial Engineers 2017 Spring Conference, Yeosu, Korea, 24–26 April 2017. [Google Scholar]
- Ijaz, M.F.; Rhee, J. Constituents and Consequences of Online-Shopping in Sustainable E-Business: An Experimental Study of Online-Shopping Malls. Sustainability 2018, 10, 3756. [Google Scholar] [CrossRef] [Green Version]
- Molinillo, S.; Mercadé-Melé, P.; De Noronha, T. Cause-Related Marketing Influence on Consumer Loyalty in a Medium-Sized City. Sustainability 2020, 12, 3632. [Google Scholar] [CrossRef]
- Strenitzerová, M.; Gaňa, J. Customer Satisfaction and Loyalty as a Part of Customer-Based Corporate Sustainability in the Sector of Mobile Communications Services. Sustainability 2018, 10, 1657. [Google Scholar] [CrossRef] [Green Version]
- Pei, X.-L.; Guo, J.-N.; Wu, T.-J.; Zhou, W.-X.; Yeh, S.-P. Does the Effect of Customer Experience on Customer Satisfaction Create a Sustainable Competitive Advantage? A Comparative Study of Different Shopping Situations. Sustainability 2020, 12, 7436. [Google Scholar] [CrossRef]
- Hadi, N.U.; Aslam, N.; Gulzar, A. Sustainable Service Quality and Customer Loyalty: The Role of Customer Satisfaction and Switching Costs in the Pakistan Cellphone Industry. Sustainability 2019, 11, 2408. [Google Scholar] [CrossRef] [Green Version]
- Kucuk, S.U.; Maddux, R.C. The role of the Internet on free-riding: An exploratory study of the wallpaper industry. J. Retail. Consum. Serv. 2010, 17, 313–320. [Google Scholar] [CrossRef]
- David, A.; Adida, E. Competition and Coordination in a Two-Channel Supply Chain. Prod. Oper. Manag. 2015, 24, 1358–1370. [Google Scholar] [CrossRef] [Green Version]
- Ryan, J.K.; Sun, D.; Zhao, X. Coordinating a Supply Chain with a Manufacturer-Owned Online Channel: A Dual Channel Model Under Price Competition. IEEE Trans. Eng. Manag. 2012, 60, 247–259. [Google Scholar] [CrossRef] [Green Version]
- Dan, B.; Xu, G.; Liu, C. Pricing policies in a dual-channel supply chain with retail services. Int. J. Prod. Econ. 2012, 139, 312–320. [Google Scholar] [CrossRef]
- Pourhejazy, P.; Kwon, O.K. The New Generation of Operations Research Methods in Supply Chain Optimization: A Review. Sustainability 2016, 8, 1033. [Google Scholar] [CrossRef] [Green Version]
- Takahashi, K.; Aoi, T.; Hirotani, D.; Morikawa, K. Inventory control in a two-echelon dual-channel supply chain with setup of production and delivery. Int. J. Prod. Econ. 2011, 133, 403–415. [Google Scholar] [CrossRef]
- Chen, J.; Bell, P.C. The impact of customer returns on supply chain decisions under various channel interactions. Ann. Oper. Res. 2013, 206, 59–74. [Google Scholar] [CrossRef]
- Elmaghraby, W.; Keskinocak, P. Dynamic Pricing in the Presence of Inventory Considerations: Research Overview, Current Practices, and Future Directions. Manag. Sci. 2003, 49, 1287–1309. [Google Scholar] [CrossRef]
- Zhang, J.; Lei, L.; Zhang, S.; Song, L. Dynamic vs. static pricing in a supply chain with advertising. Comput. Ind. Eng. 2017, 109, 266–279. [Google Scholar] [CrossRef]
- Wu, S.; Liu, Q.; Zhang, R.Q. The Reference Effects on a Retailer’s Dynamic Pricing and Inventory Strategies with Strategic Consumers. Oper. Res. 2015, 63, 1320–1335. [Google Scholar] [CrossRef]
- Yang, L.; Ji, J.; Chen, K. Game Models on Optimal Strategies in a Tourism Dual-Channel Supply Chain. Discret. Dyn. Nat. Soc. 2016, 2016, 1–15. [Google Scholar] [CrossRef] [Green Version]
- Yao, D.-Q.; Liu, J.J. Competitive pricing of mixed retail and e-tail distribution channels. Omega 2005, 33, 235–247. [Google Scholar] [CrossRef]
- Dumrongsiri, A.; Fan, M.; Jain, A.; Moinzadeh, K. A supply chain model with direct and retail channels. Eur. J. Oper. Res. 2008, 187, 691–718. [Google Scholar] [CrossRef]
- Huang, S.; Yang, C.; Zhang, X. Pricing and production decisions in dual-channel supply chains with demand disruptions. Comput. Ind. Eng. 2012, 62, 70–83. [Google Scholar] [CrossRef]
- Song, L.; Yan, Y.; Yao, F. Closed-Loop Supply Chain Models Considering Government Subsidy and Corporate Social Responsibility Investment. Sustainability 2020, 12, 2045. [Google Scholar] [CrossRef] [Green Version]
- Li, B.; Huang, S.; Yang, C. Pricing and Production Quantity Decisions in a Supply Chain with Demand-Stimulating Service under Demand Disruptions. Int. J. Adv. Inf. Sci. Serv. Sci. 2012, 4, 183–192. [Google Scholar] [CrossRef]
- Su, J.; Li, C.; Zeng, Q.; Yang, J.; Zhang, J. A Green Closed-Loop Supply Chain Coordination Mechanism Based on Third-Party Recycling. Sustainability 2019, 11, 5335. [Google Scholar] [CrossRef] [Green Version]
- Heydari, J.; Govindan, K.; Jafari, A. Reverse and closed loop supply chain coordination by considering government role. Transp. Res. Part D Transp. Environ. 2017, 52, 379–398. [Google Scholar] [CrossRef]
- Whiteside, J.; Dani, S. Influence of Organisational Culture on Supply Chain Resilience: A Power and Situational Strength Conceptual Perspective. J. Risk Financ. Manag. 2020, 13, 147. [Google Scholar] [CrossRef]
- Esenduran, G.; Atasu, A.; Van Wassenhove, L.N. Valuable e-waste: Implications for extended producer responsibility. IISE Trans. 2019, 51, 382–396. [Google Scholar] [CrossRef]
- Chen, J.; Bell, P.C. The impact of customer returns on pricing and order decisions. Eur. J. Oper. Res. 2009, 195, 280–295. [Google Scholar] [CrossRef]
- Zhou, W.; Zheng, Y.; Huang, W. Competitive advantage of qualified WEEE recyclers through EPR legislation. Eur. J. Oper. Res. 2017, 257, 641–655. [Google Scholar] [CrossRef]
- Zhang, C.; Yu, J.H.; Li, Y.H. Design of recycling incentive contracts on closed-loop supply chains and optimization of government subsidized remanufacturing policies. China Manag. Sci. 2016, 24, 71–78. [Google Scholar]
- Xie, Y.Y.; Liang, P.J.; Li, L. Research on the strategy of revenue sharing contract mechanism under closed-loop supply chain. J. Manag. Eng. 2017, 2, 185–191. [Google Scholar]
- Jiang, S.; Li, S. Green supply chain game model and revenue sharing contract considering product greenness. China Manag. Sci. 2015, 23, 169–176. [Google Scholar]
- Meng, Y.; Huang, L.J.; Zhang, Z.Q.; Yang, B.Y. Research on closed-loop supply chain differential pricing decision based on recovery risk. Oper. Res. Manag. 2019, 28, 57–67. [Google Scholar]
- Huang, Y.; Nie, Z.S.; Zhao, J.J. Study on the cooperation model of product recycling in the closed-loop supply chain of remanufacturing. J. Manag. Eng. 2019, 33, 147–152. [Google Scholar]
- Liu, S.; Xu, Z. Stackelberg game models between two competitive retailers in fuzzy decision environment. Fuzzy Optim. Decis. Mak. 2013, 13, 33–48. [Google Scholar] [CrossRef]
- Alamdar, S.F.; Rabbani, M.; Heydari, J. Pricing, collection, and effort decisions with coordination contracts in a fuzzy, three-level closed-loop supply chain. Expert Syst. Appl. 2018, 104, 261–276. [Google Scholar] [CrossRef]
- Hafezalkotob, A. Modelling intervention policies of government in price-energy saving competition of green supply chains. Comput. Ind. Eng. 2018, 119, 247–261. [Google Scholar] [CrossRef]
- Fallah, H.; Eskandari, H.; Pishvaee, M.S. Competitive closed-loop supply chain network design under uncertainty. J. Manuf. Syst. 2015, 37, 649–661. [Google Scholar] [CrossRef]
- Wang, Y. Pricing and Warranty Decisions of Substitutable Products for a Fuzzy Two-Echelon Supply Chain. Discret. Dyn. Nat. Soc. 2017, 2017, 1–12. [Google Scholar] [CrossRef] [Green Version]
- Moradinasab, N.; Amin-Naseri, M.; Behbahani, T.J.; Jafarzadeh, H. Competition and cooperation between supply chains in multi-objective petroleum green supply chain: A game theoretic approach. J. Clean. Prod. 2018, 170, 818–841. [Google Scholar] [CrossRef]
- Hafezalkotob, A. Competition of two green and regular supply chains under environmental protection and revenue seeking policies of government. Comput. Ind. Eng. 2015, 82, 103–114. [Google Scholar] [CrossRef]
- Yang, D.; Xiao, T. Pricing and green level decisions of a green supply chain with governmental interventions under fuzzy uncertainties. J. Clean. Prod. 2017, 149, 1174–1187. [Google Scholar] [CrossRef]
- Sheu, J.-B.; Chen, Y.J. Impact of government financial intervention on competition among green supply chains. Int. J. Prod. Econ. 2012, 138, 201–213. [Google Scholar] [CrossRef]
- Reza-Gharehbagh, R.; Hafezalkotob, A.; Asian, S.; Makui, A.; Zhang, A.N. Peer-to-peer financing choice of SME entrepreneurs in the re-emergence of supply chain localization. Int. Trans. Oper. Res. 2019, 27, 2534–2558. [Google Scholar] [CrossRef]
- Zhao, J.; Wang, L. Pricing and retail service decisions in fuzzy uncertainty environments. Appl. Math. Comput. 2015, 250, 580–592. [Google Scholar] [CrossRef]
- Mahmoudi, R.; Rasti-Barzoki, M. Sustainable supply chains under government intervention with a real-world case study: An evolutionary game theoretic approach. Comput. Ind. Eng. 2018, 116, 130–143. [Google Scholar] [CrossRef]
- Zou, G.; Ye, Q.M. Pricing decisions in a two-way two-channel closed-loop supply chain considering equity concerns. J. Syst. Manag. 2018, 2. [Google Scholar]
- Beames, A.; Claassen, G.D.H.; Akkerman, R. Logistics in the Circular Economy: Challenges and Opportunities BT-Strategic Decision Making for Sustainable Management of Industrial Networks; Springer: Cham, Switzerland, 2021; pp. 1–14. [Google Scholar]
- Liu, Y.; Xia, Z.-J.; Shi, Q.-Q.; Xu, Q. Pricing and coordination of waste electrical and electronic equipment under third-party recycling in a closed-loop supply chain. Environ. Dev. Sustain. 2021, 1–18. [Google Scholar] [CrossRef]
- Stritch, J.; Bretschneider, S.; Darnall, N.; Hsueh, L.; Chen, Y. Sustainability Policy Objectives, Centralized Decision Making, and Efficiency in Public Procurement Processes in U.S. Local Governments. Sustainability 2020, 12, 6934. [Google Scholar] [CrossRef]
- Zhang, Y.; Chen, W. Optimal production and financing portfolio strategies for a capital-constrained closed-loop supply chain with OEM remanufacturing. J. Clean. Prod. 2021, 279, 123467. [Google Scholar] [CrossRef]
- Li, P.; Rao, C.; Goh, M.; Yang, Z. Pricing strategies and profit coordination under a double echelon green supply chain. J. Clean. Prod. 2021, 278, 123694. [Google Scholar] [CrossRef]
- Li, J.; Yi, L.; Shi, V.; Chen, X. Supplier encroachment strategy in the presence of retail strategic inventory: Centralization or decentralization? Omega 2021, 98, 102213. [Google Scholar] [CrossRef]
- Fu, Y.; Gu, B.; Xie, Y.; Ye, J.; Cao, B. Channel structure and differential pricing strategies in dual-channel e-retail considering e-platform business models. IMA J. Manag. Math. 2020, 32, 91–114. [Google Scholar] [CrossRef]
- Huang, H.; Xiong, Y.; Zhou, Y. A larger pie or a larger slice? Contract negotiation in a closed-loop supply chain with remanufacturing. Comput. Ind. Eng. 2020, 142, 106377. [Google Scholar] [CrossRef]
- Dong, J.; Jiang, L.; Lu, W.; Guo, Q. Closed-loop supply chain models with product remanufacturing under random demand. Optimization 2021, 70, 27–53. [Google Scholar] [CrossRef]
- Guo, H.; Liu, Z.; Hu, B.; Lin, H.; Shi, L.; Meng, C. Pricing and Coordination Mechanism of Supply Chain considering Product Recycling under Asymmetric Power. Math. Probl. Eng. 2021, 2021, 1–11. [Google Scholar] [CrossRef]
- Jian, J.; Li, B.; Zhang, N.; Su, J. Decision-making and coordination of green closed-loop supply chain with fairness concern. J. Clean. Prod. 2021, 298, 126779. [Google Scholar] [CrossRef]
- Rahimi, M.; Hafezalkotob, A.; Asian, S.; Martínez, L. Environmental Policy making in Supply Chains under Ambiguity and Competition: A Fuzzy Stackelberg Game Approach. Sustainability 2021, 13, 2367. [Google Scholar] [CrossRef]
- Li, G.; Wu, H.; Sethi, S.P.; Zhang, X. Contracting green product supply chains considering marketing efforts in the circular economy era. Int. J. Prod. Econ. 2021, 234, 108041. [Google Scholar] [CrossRef]
- Chen, X.; Li, B.; An, S.; Li, Y. Pricing decisions with different time sequences in a cross-border dual-channel supply chain. Int. Trans. Oper. Res. 2021, 28, 2518–2547. [Google Scholar] [CrossRef]
- Cao, Z.; Wang, Y.; Zhao, J.; Min, J. Store brand introduction and quantity decision under asymmetric cost information in a retailer-led supply chain. Comput. Ind. Eng. 2021, 152, 106995. [Google Scholar] [CrossRef]
- Fu, R.; Qiang, Q.; Ke, K.; Huang, Z. Closed-loop supply chain network with interaction of forward and reverse logistics. Sustain. Prod. Consum. 2021, 27, 737–752. [Google Scholar] [CrossRef]
- Gong, Y.; Chen, M.; Wang, Z.; Zhan, J. With or without deposit-refund system for a network platform-led electronic closed-loop supply chain. J. Clean. Prod. 2021, 281, 125356. [Google Scholar] [CrossRef]
- Bahel, E. Patent Nash equilibria in symmetric strictly competitive games. Econ. Lett. 2021, 199, 109733. [Google Scholar] [CrossRef]
- Sadana, U.; Reddy, P.V.; Zaccour, G. Nash equilibria in nonzero-sum differential games with impulse control. Eur. J. Oper. Res. 2021. [Google Scholar] [CrossRef]
Figure 1.
Two-stage CLSC structure considering cross-recycling channels.

Figure 2.
Total profit under (a) differential pricing and (b) uniform pricing.

Figure 3.
Total profit: (a) Manufacturer-led, (b) Retailer-led total profit and (c) Nash balanced.

Figure 4.
Comparison of pricing in a centralised decision-making model: (a) low consumption channel preference θ and (b) high consumption channel preference θ.
Figure 4.
Comparison of pricing in a centralised decision-making model: (a) low consumption channel preference θ and (b) high consumption channel preference θ.

Figure 5.
Comparison of pricing under decentralised decision-making models: (a) low consumption channel preference θ and (b) high consumption channel preference θ.
Figure 5.
Comparison of pricing under decentralised decision-making models: (a) low consumption channel preference θ and (b) high consumption channel preference θ.

Figure 6.
A decentralised decision model for the manufacturer pricing decision options: (a) Low consumption channel preference and (b) high consumption channel preference .
Figure 6.
A decentralised decision model for the manufacturer pricing decision options: (a) Low consumption channel preference and (b) high consumption channel preference .

Figure 7.
A decentralised decision model for retailer pricing decision options: (a) low consumption channel preference θ and (b) high consumption channel preference θ.
Figure 7.
A decentralised decision model for retailer pricing decision options: (a) low consumption channel preference θ and (b) high consumption channel preference θ.


Table 1.
Summary of previous studies.
| References | Variables | Theory | Intervention Policy |
|---|---|---|---|
| Liu et al. [67] | Manufacturing cost; demand | Stackelberg | Price |
| Alamdar et al. [68] | Sales dependent demand | Nash | Price |
| Hafezalkotob [69] | Policies; investment; financial benefits | Stackelberg | Social welfare |
| Fallah et al. [70] | Self-price and cross-price elasticity coefficients; demand; profits | Stackelberg | Price |
| Wang [71] | Consumer demand; manufacturing cost | Stackelberg | Warranty service |
| Moradinasab et al. [72] | Profits; environmental pollution | Stackelberg; Nash | Price |
| Hafezalkotob [73] | manufacturer cost; demand | Stackelberg | Price |
| Yang et al. [74] | Market scale; manufacturer profit; retailer profit; price elasticity; sensitivity coefficient of the product | Stackelberg | Price |
| Sheu et al. [75] | Wholesale-price; taxation | Nash | Price |
| Reza-Gharehbagh et al. [76] | lending-investment; debt financing; equity financing | Stackelberg | Price |
| Zhao et al. [77] | Customer demands; manufacturing cost; service cost coefficients | Stackelberg; Nash | Price |
| Mahmoudi et al. [78] | Profit; product targets | Stackelberg | Price |
Table 2.
Description of parameters.
| Symbols | Description |
|---|---|
| The recovery rate of intact products in the retailer recovery channel. | |
| The recycling rate of used products in manufacturers recycling channels. | |
| Manufacturer cross-channel recovery rates for intact product recovery. | |
| Demand for products from retailer and manufacturer channels, respectively. | |
| Total market demand, potential market demand from retailers, and potential market demand from manufacturers, respectively. | |
| Consumer preference for visiting a retailer’s physical shop. | |
| Channel ownership prices and cross-price sensitivity, respectively. | |
| Manufacturer’s wholesale price and retailer’s transfer price for the recycled product, respectively. | |
| Retailer’s retail prices and manufacturer’s direct sales prices, respectively. | |
| Manufacturing costs, the value of intact products sold on the secondary market, and profit from the recycling of discarded products, respectively. | |
| The cost of recycling disposal is Here, denoting the retailer-recycling channel, denoting the manufacturer-recycling channel, and denoting the manufacturer cross-channel recycling channel for intact products. | |
| Total CLSC profit, retailer brick-and-mortar profit, and manufacturer online shop profit, respectively. | |
| The convex function of consumer channel preference based on retailer’s pricing | |
| The concave function of consumer channel preferences based on manufacturer’s pricing | |
| Manufacturer’s wholesale price under Manufacturer-led Stackelberg game | |
| Manufacturer’s direct selling price under Manufacturer-led Stackelberg game | |
| Manufacturer’s retail price under Manufacturer-led Stackelberg game | |
| Manufacturer’s wholesale price under Retailer-led Stackelberg game | |
| Manufacturer’s the direct selling price under Retailer-led Stackelberg game | |
| Manufacturer’s the retail price under Retailer-led Stackelberg game | |
| Manufacturer’s wholesale price under Nash equilibrium game | |
| Manufacturer’s direct selling price under Nash equilibrium game | |
| Manufacturer’s retail price under Nash equilibrium game | |
| Manufacturer pricing under differential pricing | |
| Retailer pricing under differential pricing | |
| Retailer pricing under manufacturer-led | |
| Retailer pricing under retailer-led | |
| Retailer pricing under Nash equilibrium | |
| Manufacturer pricing under manufacturer-led | |
| Manufacturer pricing under retailer-led | |
| Manufacturer pricing under Nash equilibrium | |
| Manufacturer’s profit size under the manufacturer-led model | |
| Manufacturer’s profit size under the retailer-led model | |
| Manufacturer’s profit size under Nash equilibrium model |
Table 3.
Simulation parameters are assigned in the numerical study.
| Parameter | s | ||||||||||||
|---|---|---|---|---|---|---|---|---|---|---|---|---|---|
| Values | 1000 | 0.2 | 0.1 | (0.4, 0.6) | 10 | 5 | 8 | 20 | 15 | 10 | 2 | 4 | 2 |
Publisher’s Note: MDPI stays neutral with regard to jurisdictional claims in published maps and institutional affiliations. |
© 2021 by the authors. Licensee MDPI, Basel, Switzerland. This article is an open access article distributed under the terms and conditions of the Creative Commons Attribution (CC BY) license (https://creativecommons.org/licenses/by/4.0/).
Share and Cite
MDPI and ACS Style
Pan, W.; Lin, M. A Two-Stage Closed-Loop Supply Chain Pricing Decision: Cross-Channel Recycling and Channel Preference. Axioms 2021, 10, 120. https://0-doi-org.brum.beds.ac.uk/10.3390/axioms10020120
AMA Style
Pan W, Lin M. A Two-Stage Closed-Loop Supply Chain Pricing Decision: Cross-Channel Recycling and Channel Preference. Axioms. 2021; 10(2):120. https://0-doi-org.brum.beds.ac.uk/10.3390/axioms10020120
Chicago/Turabian StylePan, Wenjun, and Miao Lin. 2021. "A Two-Stage Closed-Loop Supply Chain Pricing Decision: Cross-Channel Recycling and Channel Preference" Axioms 10, no. 2: 120. https://0-doi-org.brum.beds.ac.uk/10.3390/axioms10020120
Note that from the first issue of 2016, this journal uses article numbers instead of page numbers. See further details here.