Article

Fuzzy Algorithm Applied to Factors Influencing Competitiveness: A Case Study of Brazil and Peru through Affinities Theory

by
Luciano Barcellos-Paula
1,2,*,
Aline Castro-Rezende
3 and
Daniela Fantoni Alvares
4
1
CENTRUM Cátolica Graduate Business School, Jirón Daniel Alomía Robles 125, Urbanización Los Álamos de Monterrico, Santiago de Surco, Lima 15023, Peru
2
Departamento Académico de Posgrado en Negocios, Pontificia Universidad Católica del Perú, Av. Universitaria 1801, San Miguel, Lima 15088, Peru
3
Faculty of Economics, CinTurs–Research Centre for Tourism, Sustainability and Well-Being, University of Algarve, 8005-139 Faro, Portugal
4
School of Business and Economics, University of the Azores, Centre of Applied Economics Studies of the Atlantic, 9501-180 Ponta Delgada, Portugal
*
Author to whom correspondence should be addressed.
Submission received: 11 October 2023 / Revised: 30 October 2023 / Accepted: 1 November 2023 / Published: 8 November 2023
(This article belongs to the Special Issue The Application of Fuzzy Decision-Making Theory and Method)

Abstract

:
Innovation plays a crucial role in the economy of nations worldwide. In Latin America, countries foster competitiveness through public and private incentives to support innovation. Moreover, entrepreneurship incentives seek to improve countries’ performance, although factors such as low business growth rates and informality can compromise it. Despite the efforts, there are several difficulties in achieving competitiveness, and few studies in developing countries. Therefore, the article explores the relationship between the factors that influence competitiveness, especially the role of innovation and entrepreneurship in Brazil and Peru. The research uses quantitative-qualitative methodology through modeling and simulation and a case study. The authors use the Affinities Theory to verify the relationship between the indicators that make up the competitiveness landscape and its most significant and attractive factors, adapting the methodology established by the International Institute for Management Development (IMD) World Competitiveness ranking. As a result, this algorithm allows us to know the relationships between five factors of economic attractiveness and four competitiveness indicators. As its main contributions, the study advances the frontier of knowledge about innovation and entrepreneurship, as few studies explore competitiveness in developing countries. Also, it offers a detailed explanation of the application of this algorithm, allowing researchers to reproduce this methodology in other scenarios. Practically, it might support policymakers in formulating development strategies and stimuli for business competitiveness. In addition, academic and business leaders can strengthen university-business collaboration with applied research in innovation and entrepreneurship. One limitation would be the number of countries participating in the research. The authors suggest future lines of research.

1. Introduction

Studies indicated a positive impact of entrepreneurship on economic development, innovation, and competitiveness [1,2]. At the same time, entrepreneurship has sparked the increasing interest of academics and policymakers and is becoming the government’s top priority [3], proof of this is the potent growth of policies to stimulate entrepreneurship [4]. Understanding how entrepreneurship and innovation affect competitiveness, and the factors that influence that relationship became fundamental to designing policies to stimulate economic and social growth. That is a relevant issue, especially the COVID-19 pandemic, which negatively affected early-stage entrepreneurship activity [5] and reduced household income in 2021, strongly affecting people and businesses in lower-income economies [6]. Indeed, specialists recommend is to support entrepreneurship activity to recover the economy [6].
Researchers [7] stated that Latin American (LA) countries and companies seek to increase innovation and entrepreneurship but face challenges and barriers. Policies and practices in the public and private sectors need to be improved to increase innovation. Alternatively, the authors suggested increasing business research and university-business partnerships, which is the first research gap. Moreover, academics [8] state that “… countries represent developing economies that have in common a high rate of entrepreneurship but entrepreneurial ventures with poor growth potential” [8].
This paper contextualises the scenario of innovation and entrepreneurship in LA, focusing on Brazil and Peru to guide development policies and stimulate the company’s competitiveness. The primary motivation is to shed light on how these economies encourage companies to become more competitive while indicating that there are still gaps.
In fact, the case study demonstrated that both countries’ economies depend on raw materials exports, lacking technological exports. The region’s great challenge is diversifying exports and increasing innovation. Along with that, the constraints of structural conditions affect business decisions and innovative behaviour. That is reflected in the Global Innovation Index (GII) ranking for 2022, where Brazil occupied the 54th position and Peru the 65th among 132 economies. Although the country’s governments have been providing subsidies since 2006 in innovation, the invested resources still need to be improved. Also, there is a need for more effective instruments to stimulate innovation, such as laws and incentive policies. In addition, both countries have the highest level of initial entrepreneurship worldwide, according to the Global Entrepreneurship Monitor (GEM). However, the entrepreneurship activities in Brazil and Peru, likely LA, occur more markedly because of necessity than opportunity. Concerning competitiveness levels, LA still needs to improve compared to other regions. According to the IMD World Competitiveness (IMD WC) ranking of 2022, Peru occupies 54th place and gained four positions from the previous year. That is the second position in the region, behind Chile (45th) and followed by Mexico in 55th, Colombia in 57th, and Brazil in 59th. On the contrary, Brazil lost two positions. Although the countries may have different economic sizes, their performance on competitiveness might be related to other factors. The choice of these countries for the investigation has the objective of showing different facts and finding solutions adapted and scalable to countries with similar characteristics. On the other hand, complexity and uncertainty will likely increase because the speed of change has skyrocketed, and the interdependencies between countries, sectors, companies, and people are increasing [9].
Given this necessity to improve the country’s performance and cope with uncertainty, the decision-makers need to know what factors could overcome challenges and improve competitiveness. The body of knowledge suggests that the competitiveness of a country depends on its ability to promote and keep an environment of competitiveness for Enterprises [10]. The IMD WC ranking postulates that private and public enterprises are crucial in generating wealth and contributing to the country’s competitiveness. In turn, innovation and entrepreneurship are essential to developing enterprises’ competitiveness [11,12], impacting the country’s economy [13]. In this sense, we assume that innovation and entrepreneurship reflect in the economic attractiveness factors, which are related to competitiveness, both on enterprise and country levels. Considering this interdependence, the study intends to verify the relationship between the main indicators configuring the competitiveness landscape and its most significant and attractive factors, adapting the methodology established by IMD WC ranking [10]. Thus, this study attempts to answer the following Research Question (RQ):
RQ1: How are economic attractiveness factors related to the country’s competitiveness?
Therefore, the hypothesis of the study is proposed:
H1. 
There are affinity relationships between economic attractiveness factors and competitiveness.
Under uncertainty, applying an algorithm based on Fuzzy Logic [14] reduces risks and facilitates decision-making [15] since the mathematics of uncertainty accurately considers the intersection of objectives and constraints within a multistage process in which human subjectivity influences the decision [16]. Moreover, the fuzzy approach allows modeling imprecision, uncertainty, or lack of information [17]. For these reasons, the authors use the Affinities Theory [18] to determine the relationships between economic attractiveness factors and competitiveness indicators. Affinities are those homogeneous groupings at certain levels, structured orderly, which link elements of two sets of different natures, related by the essence of the phenomena they represent [18].
The proposed algorithm is particularly suitable for this type of research, unlike other correlational data analyses, such as, for example, Pearson’s [19] or Spearman’s [20] coefficients. In a broad sense, correlation is a measure of association between variables. However, it does not guarantee that the relationship between two variables is causal and unsuitable for concordance analysis [21]. On the other hand, the Affinities Theory allows for a broad exploration of the notion of relationship, its links, and causality based on the concept of incidence [22], which can be strengthened or weakened by varying the intensity of relationships [23]. The membership function expresses intensity, and variation is explained by max-min composition [18]. In addition, the algorithm supports combining uncertainty management models, such as Moore’s Families and Galois lattices, and classical quantitative analysis for data processing [24]. Both elements can help decision-making since they allow forming groups and displaying them holistically according to current affinities [24], whether indicators of economic attractiveness or competitiveness. In summary, the Affinities Theory allows the analysis of the possibility of establishing causal relationships from similarities rather than measuring statistical correlations.
In this context, the article aims to explore the relationship between the multiple factors that influence competitiveness, especially the role of innovation and entrepreneurship in Brazil and Peru, from the perspective of development programs and highlight policies aimed at improving the quality and impact of entrepreneurship.
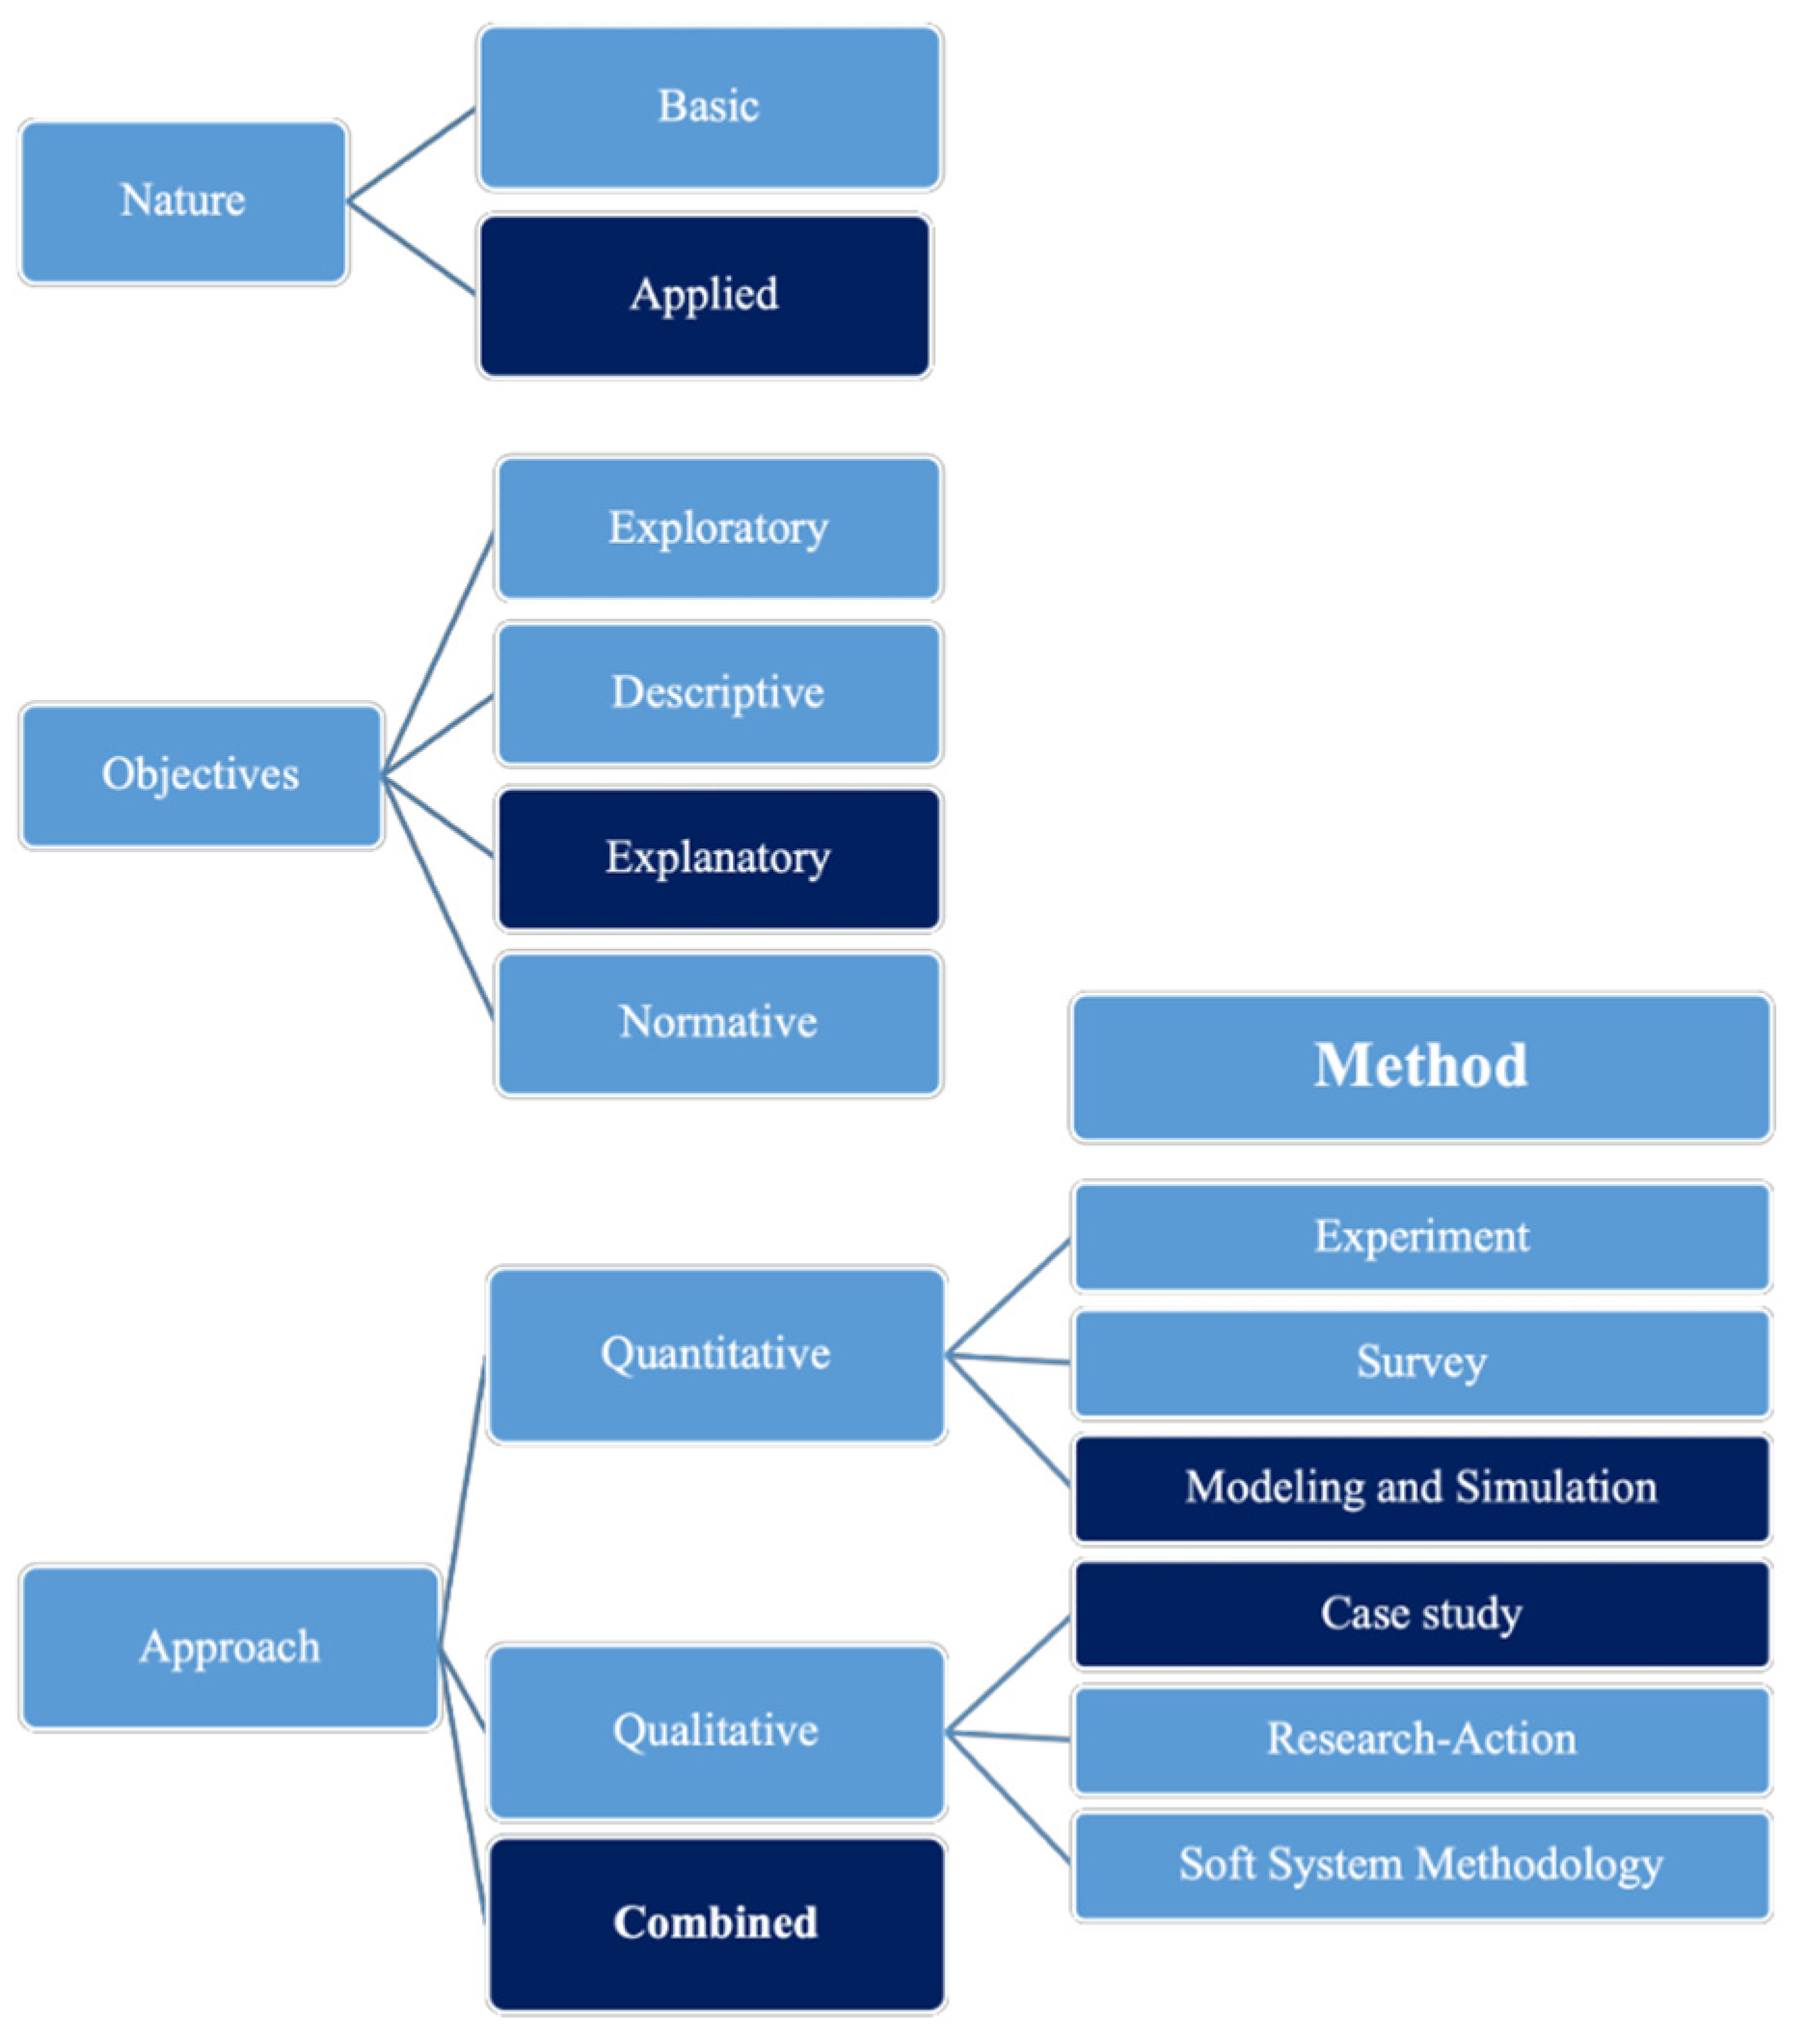
Understanding how innovation, entrepreneurship, and finally economic attractiveness factors impact competitiveness can contribute to developing management strategies to foster economic development in Brazil and Peru. Accordingly, the authors carry out applied research with an explanatory objective, a combined approach (quantitative-qualitative) through Modeling and Simulation (M and S), and a case study [25]. Figure 1 shows the research classification.
As its main contributions, at a practical level, the study warns about the importance of public power in promoting and consolidating innovation and entrepreneurship in these territories. This study advances the frontier of knowledge at a theoretical level since few studies address competitiveness in developing countries. This research is novel because the authors suggest an alternative methodology to understand the relationships and affinities that impact competitiveness. As a limitation the case study of only two Latin American countries. Future research can focus on comparative studies with other countries. The manuscript is organized as follows: Section 2 presents a theoretical framework. Section 3 details the methodology. Section 4 shows the algorithm’s application. Section 5 includes a discussion of the results, and Section 6 the conclusion.

2. Theoretical Framework

This section presents a theoretical framework and is organized into six parts. The first presents a literature review on entrepreneurship and innovation. The second part describes an overview of Brazil and Peru. The third part shows the IMD WC ranking. The fourth part explains the GEM. The fifth part explains the evaluation of innovation policies. Finally, the last part shows a literature review on fuzzy algorithms.

2.1. Entrepreneurship and Innovation

As academics [26] reported, a trend in international business and management research is to consider institutions not only as taken-for-granted constraints that need to be accommodated. But also, the outcomes of the agency, and the purposive action by individuals, firms, coalitions, and other actors. Recent developments from cognate fields–particularly institutional entrepreneurship and institutional work–offer a theoretical foundation for further insights into the nexus of institutions, agency, and co-evolution. In fact, authors [11] demonstrated that the greater the individuals’ perceived quality of public institutions, the higher the levels of entrepreneurship, innovation, and competitiveness.
Research on entrepreneurship and innovation are related terms, and the latter is a fundamental attribute of entrepreneurship [27]. In that sense, innovations must be present in all types and sizes of enterprises and all areas of the enterprise [28]. Innovation can occur in any economic sector and is essential for a country’s productivity growth [29]. That may be related to processes, products, services, organizations, or marketing. It can be categorized into: (i) disruptive/radical innovation (generates creative destruction of existing products, causing profound changes in the market and society). Furthermore, (ii) incremental innovation (improvements that increase the good/service, whether through adaptation or an open network that connects several stakeholders in an incremental or radical innovation process) [30].
When thinking about entrepreneurship [31] and innovation [32], it is essential to consider competitiveness. We emphasize Porter’s statement in this sense: national prosperity is not inherited, but the product of human creative effort [13]. It is not something that emanates from the natural endowments, from the labour force, interest rates, or the value of money, as classical economists insisted [13]. The competitiveness of a country depends on its industry’s ability to innovate and improve [13]. Researchers affirm that competitiveness positively impacts a country’s economy [33]. For other academics [12], innovations increase competitive advantages by stimulating the learning processes.
In Brazil and Peru, studies on innovation and entrepreneurship are increasingly important [34]. Academics [35] confirmed that entrepreneurial intentions are antecedents of entrepreneurial behaviour related to the creation of ventures in LA. For instance, other researchers [36] found that Peruvian companies involved in open innovation reported higher sales growth and were more confident using double-loop learning. The same authors noted that engaging in open innovation can improve business performance. Moreover, studying mining innovation and its stakeholders in Latin America, another author [37] indicated that suppliers who usually push innovation in the sector are affected by negative aspects such as the lack of research and training centres and a weak institutional landscape [37].
Another line of the study shows the importance of the instruments and agents of public policies to set the conditions that can facilitate innovation in micro and small enterprises in Brazil [38]. However, business groups’ affiliation can be an exciting solution that facilitates the development of entrepreneurial ventures in emerging markets [39].
For other academics [40], innovation in small Brazilian textile companies demonstrated the correlation between innovation stimulus, facilitating factors, and support mechanisms. In addition, the same study indicated a concern with the cost and time involved in developing innovative projects [40]. On the other hand, researchers [41] identified the effects of organizational and marketing innovations on market performance, using data from companies in fast-growing emerging economies in South America (Colombia, Peru, and Chile). They stated that innovation is vital for companies that generate rare, valuable, inimitable, and non-replaceable goods and services and lead to superior performance [41]. Organizational innovations influence market performance more than marketing innovations and confirm the importance of innovative performance as an intermediary between organizational innovation and market performance [42]. In addition, the same study highlights the importance of a good environment to foster business efficiency [42].
It is essential to highlight the role of incubators in economic development, including in academic institutions. The main goal of an incubator is to increase the likelihood of survival and growth of new firms [43], supporting entrepreneurs starting a business who are generally unaware of their resource constraints and unwilling to engage in the sponsorship process [44]. The rate of the firm’s survival and its growth is a proxy for assessing incubators’ performance [45]. Moreover, customization strategies are the factor that influences incubates survival and growth, according to a recent study with 166 Brazilian incubators [45]. In other words, they are an essential part of the business ecosystem.
Researchers discuss the critical behavioural pattern in management in innovation processes, learning, interaction with other actors, and the divergence in focus and disconnected actions among the incubator, government, companies, and university [46]. Some of the roles and tasks of each of these critical actors partially meet the needs of companies. For instance, economic investment is one of the most relevant factors directly impacting innovation.
Brazil experimented with a drawback in available investments in Research and Development (R&D), achieving around 1.21% of the Gross Domestic Product (GDP) in 2019 [47]. On the other hand, there is a space to increase R&D among companies since business spending reached about half of total R&D; in 2017, the Organization for Economic Cooperation and Development (OECD) economies, businesses were the primary source of R&D expenditure, with an average contribution of 62% [48].
Another factor constraining investment in innovation is the structural conditions that affect business decisions and innovative behaviour, known as Brazilian cost [48]. That results from insufficient infrastructure, a complex taxation system (with high taxation and compliance costs), high entry barriers and insolvency costs, and limited access to finance, especially for smaller enterprises. In addition, the low quality of education and limited skills of the working population are other factors that limit innovation [48]. Indeed, a study confirmed that institutional quality, financial stability, small government, and perceived start-up skills are the most important predictors of productive entrepreneurship, contributing to economic growth [49].

2.2. Overview of Brazil and Peru

In 2021, Brazil registered 213.32 million inhabitants, considered the fifth most populated country globally, while Peru presented 33.15 million inhabitants, and in the same ranking is the 26th country in the number of inhabitants [10]. Concerning the economy, in 2021, Brazil registered a GDP of US$1609.0 billion, which positions the country as the 12th largest economy in the world, with a GDP Purchasing Power Parity (PPP) per capita of US$16,107 (55th). Peru reached a GDP of US$224.7 billion, which positions it in the 44th world economy, with a GDP (PPP) per capita of US$14,164 (57th). In 2021, the Peruvian economy reached 13.3% of GDP growth, while Brazil’s economy experienced a 4.6% increase in GDP in 2021 [10].
At present, LA continues to have a few technological exports. Peruvian high-tech exports reached US$172.740 million, while Brazil, has reached US$5.94 billion [50]. According to another researcher [51], it is fundamental to analyse the profile of products and services offered by a country to measure the economy’s technological level. So, to improve countries’ performance, it is no longer possible to rely solely on efficiency and cost reduction for economic success: innovation, flexibility, and adaptation to change are becoming the key factors. The main priorities for the immediate revival of the economy after the COVID-19 pandemic are expanding public investment in R&D and encouraging venture capital and private sector R&D [52].
In common, both countries share records of exports of raw materials, making the economy dependent on commodities prices in the international market. For the Economic Commission for Latin America and the Caribbean (ECLAC), the region’s greatest structural challenge is diversifying the export pattern and reducing dependence on raw materials [53], which is the second research gap.
In addition, humanity experiences intense and frequent changes caused by COVID-19, which increases uncertainty and complexity in decision-making [54]. The pandemic also intensified countries’ structural problems, and economic recovery from a crisis has become a priority [55].
The authors decided to select Brazil and Peru for three main reasons. First, although they have different socioeconomic realities, the objective is to show different facts and find solutions adapted and scalable to countries with similar characteristics. The second reason is that the two countries have been in the OECD accession process since 25 January 2022 [56], and this research can contribute to competitiveness and achieving this objective. Finally, researchers have an academic interest in deepening studies on the two countries.

2.3. Competitiveness Ranking

The IMD WC Yearbook 2022 sheds light on the subject. In this ranking, 63 economies are classified concerning their competitiveness levels: these countries’ ability to generate prosperity in their nation by using all available resources and skills of their economy. The measurement was made through four pillars and 20 indicators [10]. Table 1 details these pillars.
According to the ranking report, LA still performs poorly compared to other regions. Chile has the highest level of competitiveness, occupies the first position in LA, and is ranked 45th. In second place is Peru, which now occupies 54th place, followed by Mexico in 55th, Colombia in 57th, and Brazil in 59th. Analyzing the countries in the study, Brazil lost two positions, and Peru gained four. Table 2 shows the overall position in the four pillars for both countries.
In the case of Brazil, the results show improvements in two of the four pillars. The country moved up three places in economic performance and one in government efficiency. However, it fell three places in business efficiency and one in infrastructure. Table 3 provides a summary of the results of Brazil.
In the case of Peru, the results show improvements in two of the four pillars. The country moved up to twenty positions in economic performance and one in infrastructure. However, it fell four places in government efficiency and maintained the same position in business efficiency. Table 4 provides a summary of the results of Peru.

2.4. Global Entrepreneurship Monitor

The GEM, one of the world’s most significant studies on entrepreneurship, has developed databases and studies in the last 23 years. According to a GEM study and based on a World Economic Forum (WEF) classification, countries are categorized into three major groups. Table 5 shows the WEF classification.
As stated by this study [57], Brazil and Peru are in group 2. Entrepreneurship in these countries occurs more markedly because they have few job opportunities and low GDP per capita, leading the population to venture into entrepreneurship [57].
Nowadays, the primary motivation that drives people to start a business in the low-income economy is to make a difference in the world. Perhaps this population, from countries with income level C, such as Brazil and Peru, suffers from the effects of global challenges, such as the pandemic, climate change, loss of biodiversity, and pollution [6]. Level C encompasses the economies with a GDP per capita of less than $20,000. In contrast, young people are induced by the scarcity of jobs.
The primary indicator in this study is the Total early-stage Entrepreneurial Activity (TEA) Rate. Brazil reached 21.0 (% of adults aged 18–64) in 2021, in the seventh ranking, dropping from 23.4% in 2020. Another relevant data from the study indicates that 60.9% of the TEA considered it more difficult to start a business in 2021 than the previous year. Although that is the average in similar economies, 45.1% of entrepreneurs consider that they see an opportunity but do not start a business for fear it might fall. In contrast, this percentage is lower in Germany, for example, achieving 37.9% [6]. The report [6] indicates several constraints that limit entrepreneurship performance in Brazil, such as policies that reduce productivity and competitiveness. That is probably related to the low rate of formal labour force recruitment because of the high cost of tax burdens to formalize employees.
The last data available about Peru in the GEM Report is 2018 [57]. At that moment, the TEA of Peru was 22.4%, one of the highest among the GEM countries. The factors that may stimulate it are a social environment favouring entrepreneurship and the confidence of individuals’ skills to begin a business. Despite these positive aspects, some disadvantages have been identified, including the fact that most companies are unable to stay in business beyond the initial business phase. Because of that, the companies could not generate enough economic impact. The recommendation was to strengthen the entrepreneurial ecosystem to improve this condition [58].

2.5. Evaluation of Innovation Policies

Brazil and Peru have provided economic subsidies for business innovation since 2006, according to the World Trade Organization (WTO) rules. Even so, the invested resources still need to be improved, and the effectiveness of the incentive policies is restricted due to the applicant’s lack of knowledge or positive results, which is the third research gap. The scarcity of resources invested in innovation is a reality in LA. For instance, in 2017 (the latest year of available data), Peru invested 0.12% of its GDP in innovation, science, and technology. In the same period, Brazil invests 1.26% of its GDP in R&D activities in Brazil. Nevertheless, the average of the OECD countries was 2.34% of GDP in 2017 [47]. Recently, the COVID-19 pandemic significantly impacted low-income economies and disturbed the business environment. Experts indicate governments’ incapacity (or unwillingness) to provide extended support for the pandemic-affecting people and businesses [6].
Another problem is the need for more effective instruments to stimulate innovation, such as laws and incentive policies. According to the National Association of Research and Development of Innovative Companies of Brazil, “these instruments did not have the power to encourage innovation in companies and sectors traditionally reluctant to this type of effort. Nor were they able to leverage innovation in companies that were already innovative. To a large extent, the government’s stimulus replaced the investments that these companies might already have made rather than multiplying them. The challenge is not to increase companies’ R&D spending but to mobilize segments that invest little” [59]. Finally, another barrier is the low participation of firms in innovation investments, which can be related to the lack of knowledge of policies to encourage innovation. In Brazil, even though the “Law of Good” is already almost fifteen years old, the demand for tax reductions granted to companies that invest in Research, Development, and Innovation is still low. According to a survey conducted by the Ministry of Science, Technology, and Innovation, only 991 companies benefited from the tax incentives granted by the Federal Government. This number represents less than 1% of companies included in the national universe (600,000, which refers only to industry and services, to investment in R&D, according to data provided by IBGE) [60].
Finally, the research consolidates the analysis of the investments in innovation in the two countries, presenting the situation of Brazil and Peru in the GII. The GII was launched in 2007 and co-published by Cornell University, INSEAD, and the World Intellectual Property Organization (WIPO). In the 15th edition, the index evaluates 132 countries/economies and analysed seven pillars and 81 indicators. It ranks worldwide countries and economies through innovation measures, environments, and outputs. Table 6 shows a summary.
According to the study [61], Brazil’s Innovation inputs are lower than last year but higher than in 2020. As for innovation outputs, this position is higher than in 2021 and 2020. Concerning GDP, Brazil’s performance is above expectations for its level of development. The study also indicated that Brazil has the best performance in business sophistication, and its weakest performance is in Institutions; it reveals a weakness in the sub-pillar Business environment and policies for doing business [61]. In the same study [61], Peru Innovation input results were the same as last year but higher than in 2020. As for innovation outputs, this position is higher than in 2021 and 2020. Concerning GDP, Peru’s performance is above expectations for its level of development. Also, the study indicated that Peru has the best performance in Market sophistication, and its weakest performance is in Knowledge and technology outputs. It exhibits weaknesses in the sub-pillar Knowledge diffusion, production and export complexity indicators, and Information and Communication Technology (ICT) services exports [61].
The significant performance of Brazil and Peru is relevant for the innovation status of these two countries since six economies of the region have decreased in performance, accomplishing less than expected for their level of development, suggesting a possible innovation performance stagnation within the region [61].

2.6. Fuzzy Algorithms

Fuzzy Logic [14] was born to guide decision models that reduce uncertainty and facilitate decision-making. Fuzzy Set Theory is a mathematical theory in multivalent logic [14]. It constitutes the starting point of a mathematical theory currently expanding in all scientific disciplines and constructed with all the rigor allowed by the treatment of subjectivity and uncertainty. Zadeh (1965) defined multivalent sets as “Fuzzy” whose elements belong to them in different degrees to mark the difference between this concept and the then universally accepted binary logic. In 1968, he created Fuzzy Logic [62].
Initially, Fuzzy Set Theory was applied in the field of Formal Sciences, but in the last 45 years, several researchers have published many articles and studies with applications in different fields [63,64,65,66]. Over time, Fuzzy Logic models have proven to be effective in addressing the new needs of society, such as the management of the pandemic caused by COVID-19 [16] and the climate crisis [67].
In this sense, Fuzzy Logic had to evolve, and Zadeh presented in 1975 the Type-2 Fuzzy Set (T2FS) [68]. The T2FS would be more recommended than the Type-1 Fuzzy Sets to address a problem with a high level of data imprecision, such as, for example, perceptions [69]. Another study reinforces that T2FS offers more degrees of freedom in fuzzy logic systems [70]. According to other authors [71], the T2FS is a generalization of the standard fuzzy set in which the membership value for each member of the set is itself a fuzzy set. As a result, T2FS started to be used in several areas of knowledge, such as medicine [70,72], computational complexity, and hardware [69].
Another significant milestone was the introduction in 1986 of the Intuitionistic Fuzzy Set (IFS) “as a generalization of the notion of fuzzy set” [73]. Continuing to advance the frontier of knowledge, in 1991, Zadeh proposed “Soft Computing”, a hybrid of methodologies including Fuzzy Logic, neural networks, evolutionary algorithms, and probabilistic reasoning [74]. Sukhveer Singh and Garg, in 2017, published the Type-2 Intuitionistic Fuzzy Set (T2IFS) [71], which consists of a family of distance measures based on Hamming, Euclid, and Hausdorff metrics and presents a group decision-making method for ranking alternatives [71]. According to other researchers [75], T2IFS is a new extension of T2FS. The fuzzy preference of decision-makers towards their decisions under different parameters can be expressed [75].
According to [76], using Fuzzy Logic helps the decision-maker in uncertain environments, as he can evaluate the information available through Fuzzy sets and Fuzzy systems. As indicated in other studies [67,77], decisions in the real world take place in uncertain environments where the consequences of actions are not accurately known. An application of Fuzzy Logic precisely considers the intersection of objectives and constraints within a multi-stage process in which human subjectivity influences the decision [78].
In this context, Affinities Theory [18] is defined as an object of study in this paper. Similar studies used this methodology to analyze regions and countries. In the first example, researchers sought to find affinities between regions of Colombia through the analysis of economic activities and location to be more competitive [24]. In the second example, the Affinities Theory provided a broad overview of the economic situation of regions in the Russian Federation and Ukraine and critical guidelines for decision-making [79]. Furthermore, researchers applied this tool to assess suppliers with sustainable practices [80] and sports management [81]. In another study [82], the model was used to establish the level of relationship between different stakeholders and to obtain the corresponding affinities [82]. As a drawback, this algorithm depends on the quality of the information received [67], and to overcome this problem, the authors will use data from official sources [10] to perform the calculations.

3. Methodology

The Affinities Theory [18] is a fuzzy algorithm based on the existence of three aspects. First, the homogeneity of each grouping is linked to the level chosen. Depending on the requirement of each characteristic, a higher or lower level will be assigned to define the threshold beyond which homogeneity exists. The second expresses the need for the elements of each of the sets to be linked to each other by specific rules. The third demands constructing a constitutive structure of a particular order susceptible to allowing the subsequent decision. The purpose of the grouping, on the one hand, and the type and strength of the relationship between the elements of one set and another, on the other, unequivocally determine all possible groupings. To establish the affinity relationships, the Moore Family Model is applied, which allows for obtaining appropriate groupings. The presentation of these groupings employing reticular structures highlights the affinities and facilitates decision-making.
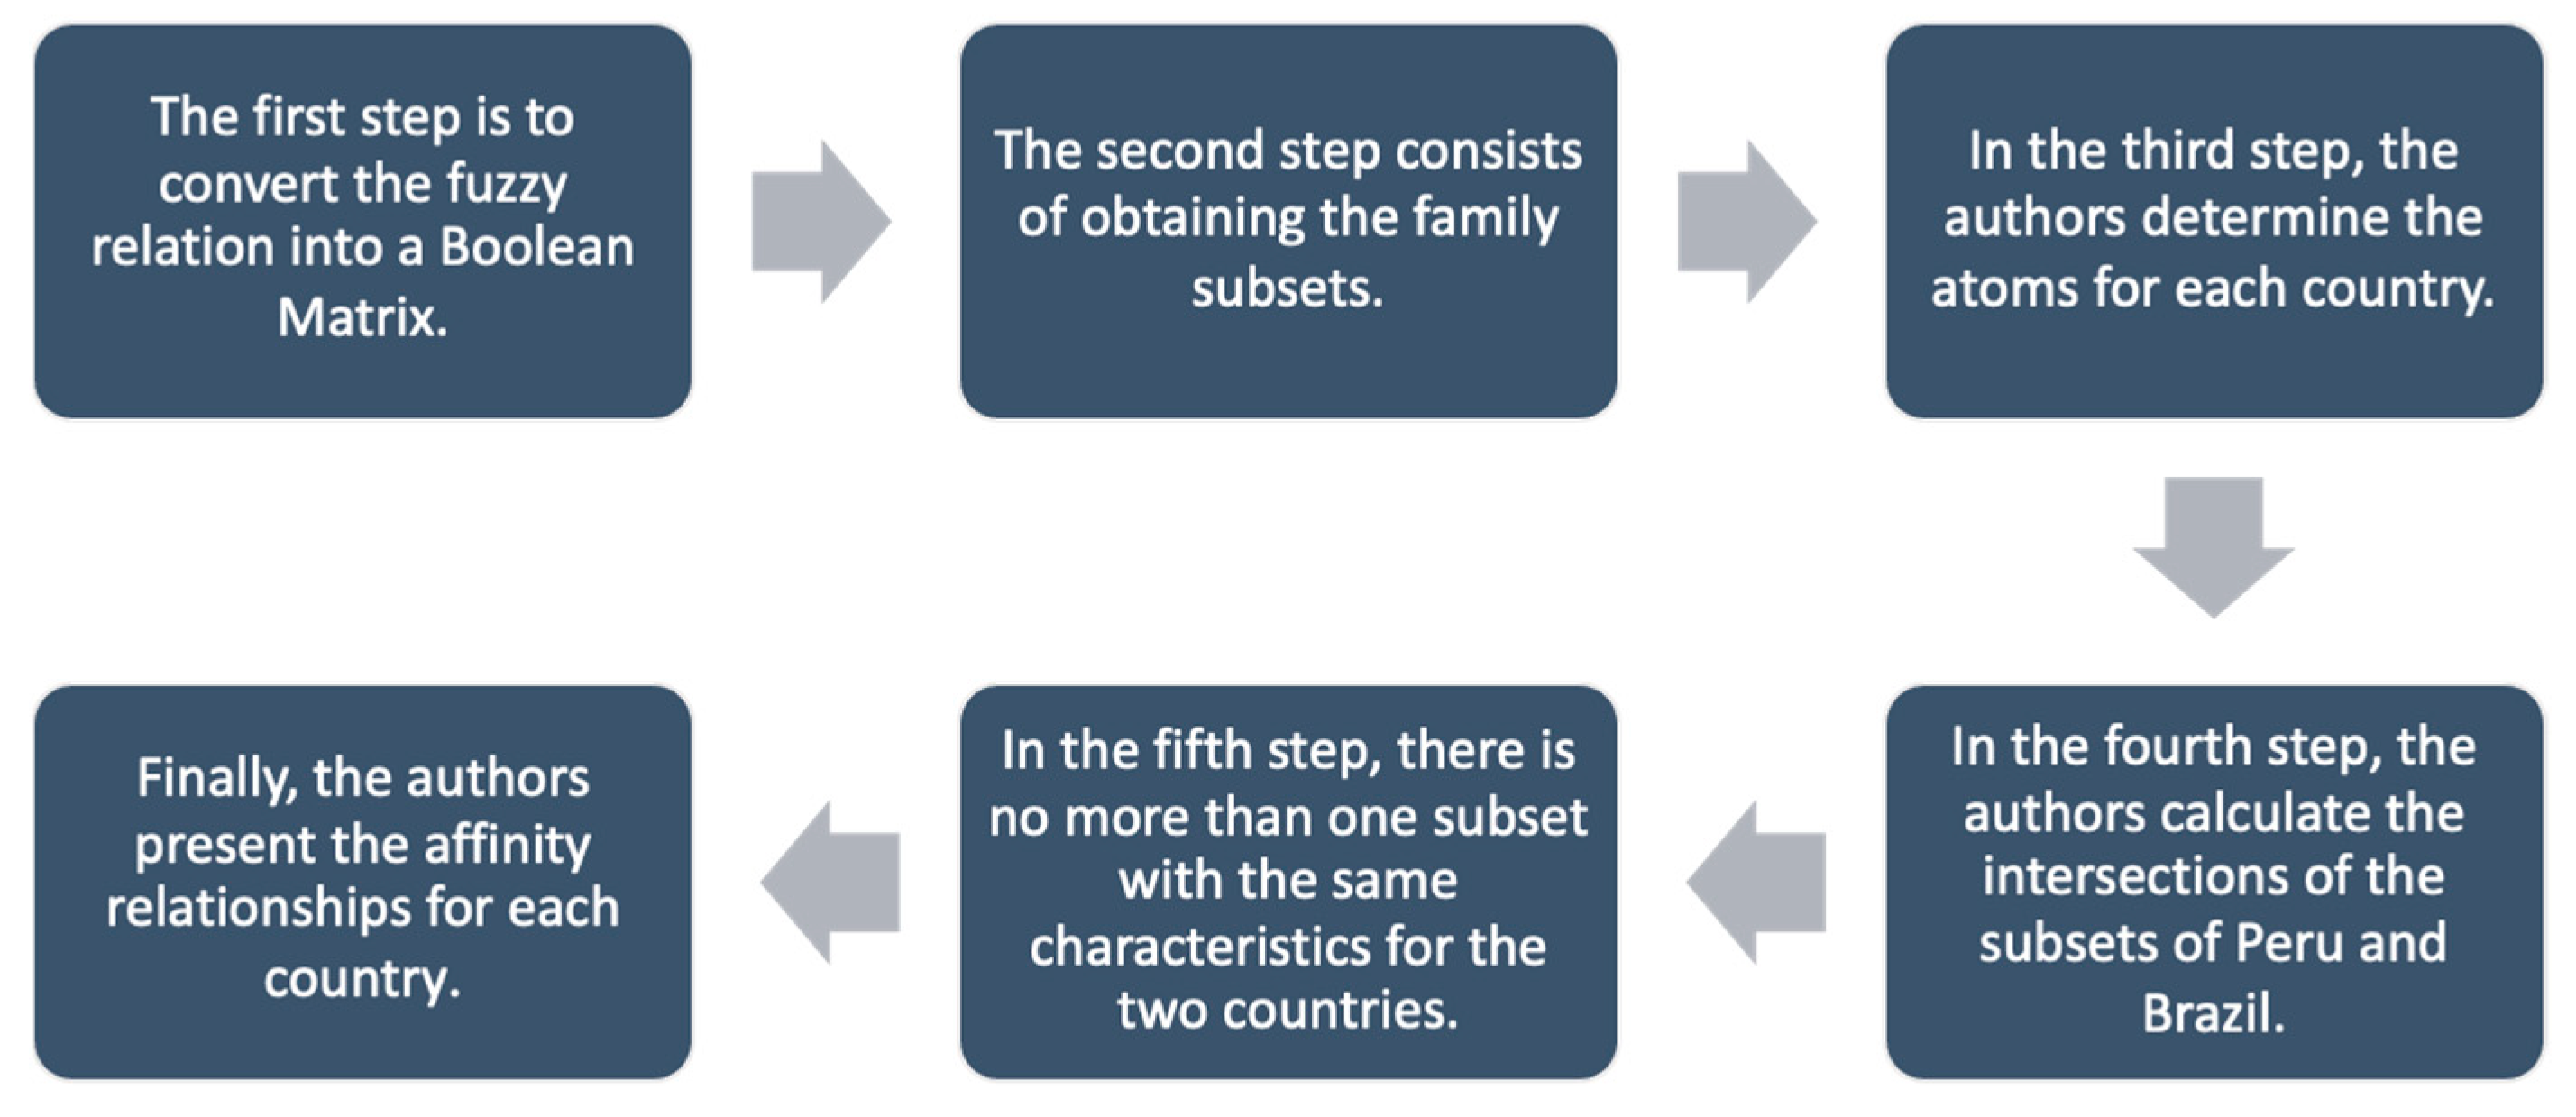
Researchers must follow a six-stages process to obtain affinities. Figure 2 shows the flowchart used in this research.
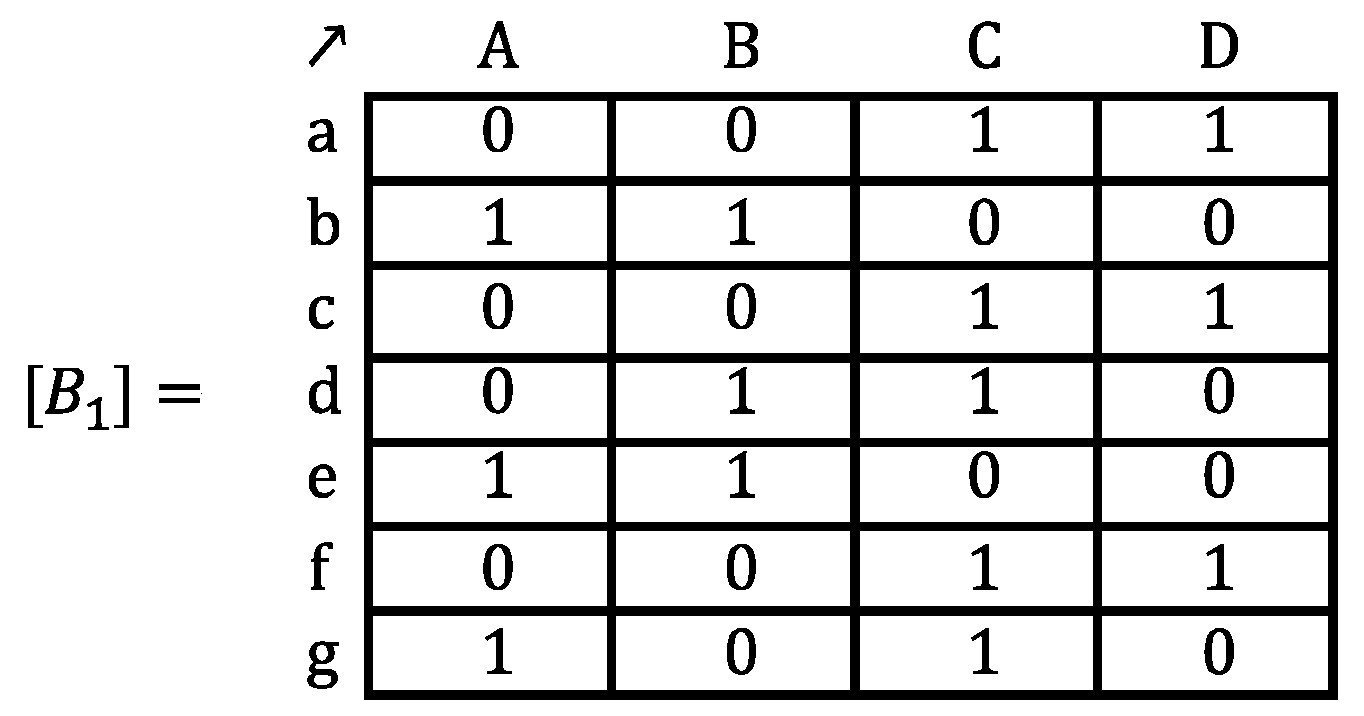
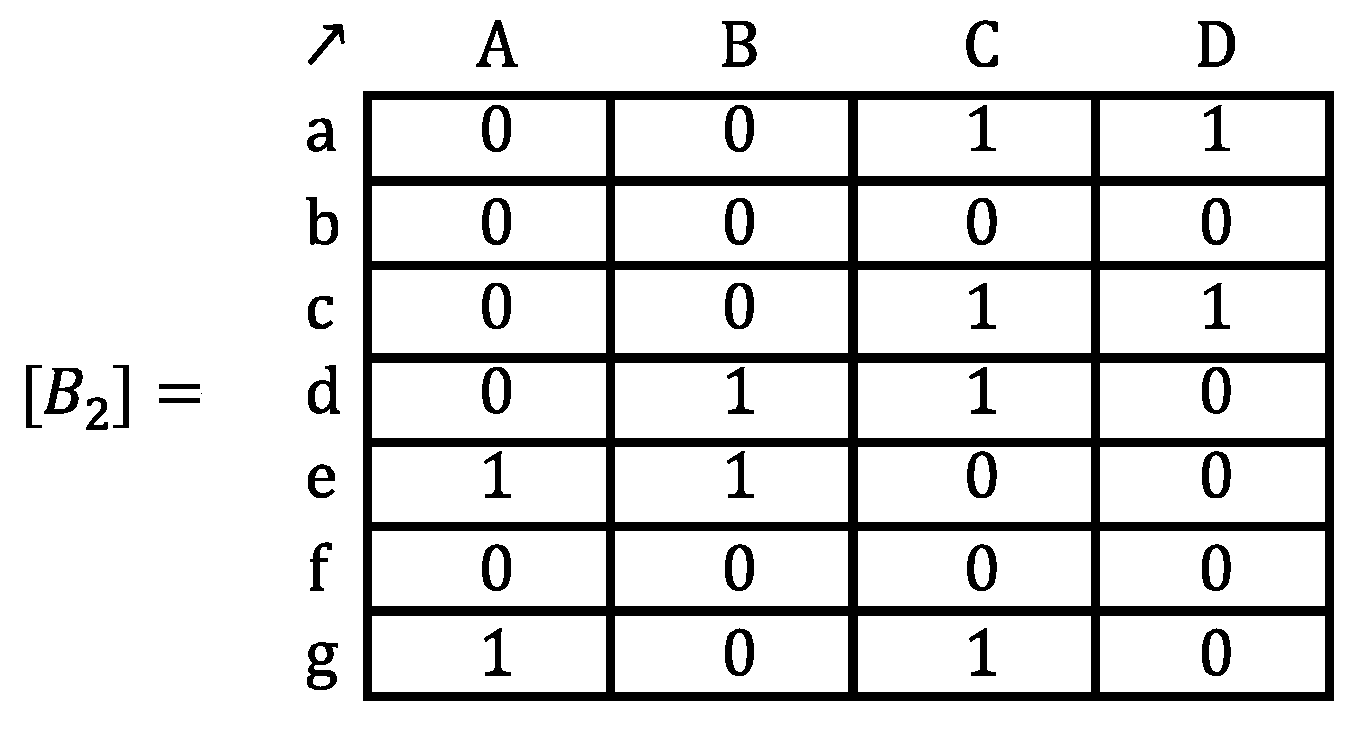
The first stage establishes a Boolean matrix B   of fuzzy relatedness of the sets E 1 and E 2 , cut at some appropriate levels. The second stage lies in obtaining the family of subsets of objects, each of which gathers those with the same characteristics. The third stage presents the corresponding clan from the non-empty mini-terms or atoms. The fourth stage details, for each of the elements of the clan, the calculations of the intersections of the subsets of characteristics possessed by the components of the respective elements of the clan. The fifth stage chooses the corresponding clan element with the largest number of components when more than one feature subset is repeated due to intersection. Finally, the sixth stage presents the meeting of the clan elements with the maximum number of repeated feature subsets forming the affinities. Next, the Fuzzy Logic algorithm is presented in more detail.
The process starts from the knowledge of some fuzzy subsets that define an object Ρ j ,   j = 1 ,   2 ,   m , through some characteristics or elements   C i ,   i = 1 ,   2 ,   n , as it is conducted in the field of similarity relations. The sets are: E 1 = { P j   / j = 1 , 2 , m } and E 2 = { C i   / i = 1 , 2 , n } , and the corresponding fuzzy subsets:
C 1 C 2 C 3 C n
P ˜ j μ 1 ( j ) μ 2 ( j ) μ 3 ( j ) μ n ( j )                      (1)
,   0 μ i j 1 , i = 1 , 2 , n .   j = 1 , 2 , m . These fuzzy subsets can be put together to form a fuzzy relation R ~ , such as:
C 1 C 2 C 3 C n
P 1 μ 1 ( 1 ) μ 2 ( 1 ) μ 3 ( 1 ) μ n ( 1 )
P 2 μ 1 ( 2 ) μ 2 ( 2 ) μ 3 ( 2 ) μ n ( 2 )                  (2)
R ~ =
P m μ 1 ( m ) μ 2 ( m ) μ 3 ( m ) μ n ( m )
where we have noted, 0 μ i j 1 .
To establish the minimum degree from which homogeneity exists for each element   C i ,   i = 1 ,   2 ,   n , of the set E2 a limit or threshold θ i is determined. Therefore, the values of the μ i ( j ) ,   i = 1 ,   2 , n ; j = 1 ,   2 ,   m , which satisfy μ i j θ i will be assigned in a new matrix B , values for their elements β i ( j ) equal to 1, while when μ i j < θ i , will be made β i ( j ) equal to zero. In this way, the θ i , i = 1 ,   2 ,   , n constitute the thresholds above which the desired homogeneity exists for each element of the set E2. The same could be conducted based on set E1, if the nature of the problem is so required.
Here appears the first of the generalizing aspects concerning the schemes based on obtaining distances, since now the resulting Boolean matrix B carries different levels of the values of the characteristic membership function μ i j , for each C i ,   i = 1 ,   2 ,   n . In short, one has:
C 1 C 2 C 3 C n
P 1 β 1 ( 1 ) β 2 ( 1 ) β 3 ( 1 ) β n ( 1 )
P 2 β 1 ( 2 ) β 2 ( 2 ) β 3 ( 2 ) β n ( 2 )                   (3)
B =
P m β 1 ( m ) β 2 ( m ) β 3 ( m ) β n ( m )
where evidently β i ( j ) = { 0,1 } . The matrix B is the starting point for finding the affinity relations at the chosen θ i levels.
The concept of a power set is considered next. Given a finite set E 1 , we designate as its power set, Π E 1 , the one formed by all the possible combinations of its elements taken from 1 by 1, from 2 by 2, …, m by m, if m is its cardinal. In this way, the set obtained is given by:
E 1 = a , b , c , , m ,
and set of all its parts or power set is given by:
Π E 1 = , a ,   b ,   c ,   m ,   a b ,   a c ,   b c , , m m ,   E 1 .
We now define a Moore family. Let Π E 1 ,   Ϝ E 1 , which, therefore: Ϝ E 1 Π E 1 , if Ϝ E 1 verifies:
(1) E 1 Ϝ E 1
(2) The intersection of the number of parts of Π E 1 that belongs Ϝ E 1 , belongs to Ϝ E 1 . It is written:
( A Ϝ E 1 , B Ϝ E 1 ) ( A B Ϝ E 1 ) ,
therefore Ϝ E 1 is a “Moore’s family”.
From a Moore’s family closing can be constructed. Moore’s Closure is a functional application, in which all elements of the subset A E 1 are made to correspond with a M A , such as:
M A = F F A ( E 1 ) F ,
where F A E 1 represents the subset of the elements of F A E 1 that contains A and F all elements of F A E 1 . Note that mathematically to make a Moore closing must be satisfied by the properties of: Extensivity: A Π E 1 : A M A ; Idempotency: A Π E 1 : M M A = M A ; Isotony: A , B Π E 1 : A B M A M B . Given the matrix form, its analysis normally takes place through the 𝛼−𝑐𝑢𝑡𝑠 (different levels). Thus, a fuzzy relation R   ~ on being broken down by any system gives rise to a determined number of Boolean matrices.
From the fuzzy relationship R   ~ , which is represented in a Boolean matrix B with a threshold = n are obtained right connection B +   and left connection   B .
The connection to the right, B + , the subset elements of   E 1   such that for every A Π E 1 , the 𝐵+ are the successors of all elements belonging to A .
  x A :   B + A = y E 1 / ( y , x ) B ,
where B + = E 1 .
From its definition, the following expression is given:
  x A Π ( E 1 ) :   B + A = x A B + x .
The connection to the left, B , the subset elements of E 1 such that for every A Π E 1 , the B are the successors of all elements belonging to 𝐴.
  x A :   B A = y E 1 / ( y , x ) B ,
where B = E 1 .
From its definition, the following expression is given:
  x A Π ( E 1 ) :   B A = x A B x .
Due B + and B come from a fuzzy relationship R ~ , the closures of Moore Π ( E 1 ) are given by:
M ( 1 ) = B B + , M 2 = B + B ,
where + is the max-min composition.
The closure subsets Π ( E 1 ) come from closure M ( 1 ) and M ( 2 ) are given by:
Γ E , M 1 = A Π ( E 1 ) B + A ,
Γ E , M 2 = A Π ( E 1 ) B A ,
 therefore:
A Π ( E 1 ) B + A = A , B , C , , M , A B , A C ,   B C , , M M , E 1 ,
A Π ( E 1 ) B A = ,   a , b , c , , m , a b , a c ,   b c , , m m , E 1 .
In this phase of the process one and the same group of elements of the set E 1 can include groups of different elements corresponding to   E 2 . This occurs if there is always a grouping of elements of E 2 that includes the remainder. Therefore, it is necessary to obtain B . In B the phenomenon occurs for the same group of elements of E 2 there are several different elements of E 1 . In fact, there is a group of elements of E 1   that includes the remainder.
From fuzzy relationship R ~ E 1 x E 2 is considered as the starting point to the rectangular relationship. With a connection to the right and to the left, it is obtained Moore’s closing M ( 1 ) = B B + and M ( 2 ) = B + B . In order to the family of closed elements corresponding to the Moore closing M ( 1 ) and M ( 2 ) are given by:
Γ E 2 , M 1 = A , B , C , , M , A B , A C , B C , , M M , E 1
Γ E 1 , M 2 = , a , b , c , , m , a b , a c , b c , , m m , E 1
The families of closed elements Γ E 2 , M 1 and Γ E 1 , M 2 are associated by the same cardinal:
c a r . Γ E 2 , M 1 = c a r . Γ E 1 , M 2
Note that these families constitute isomorphic lattices.
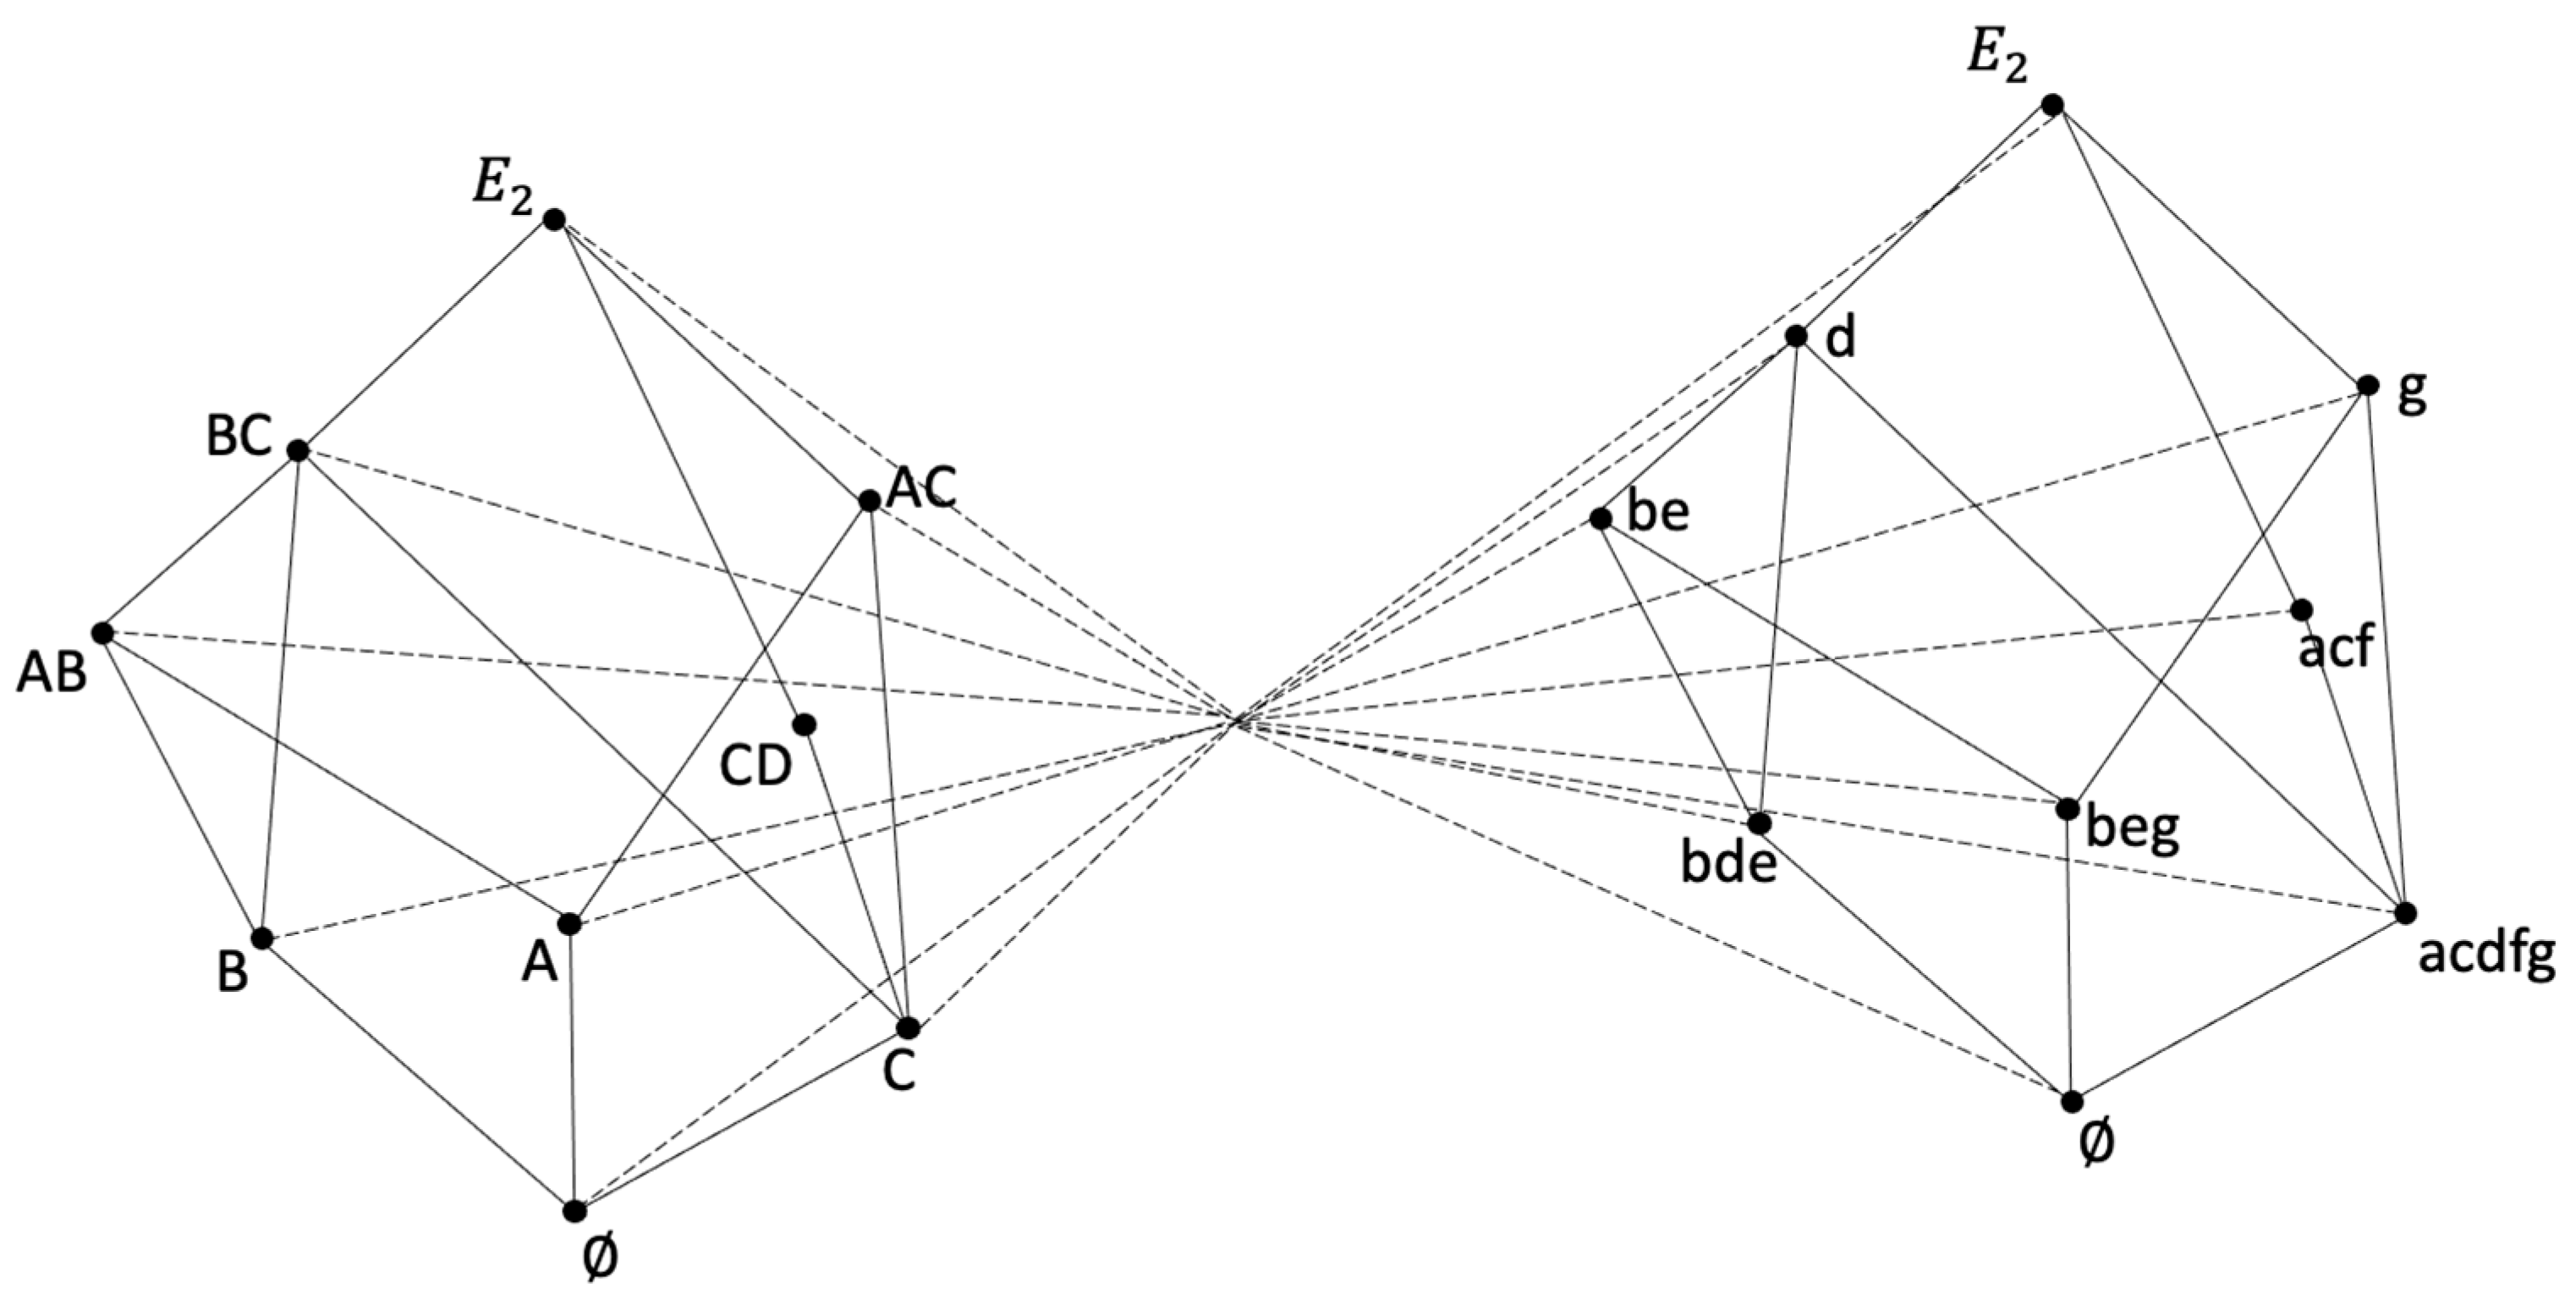
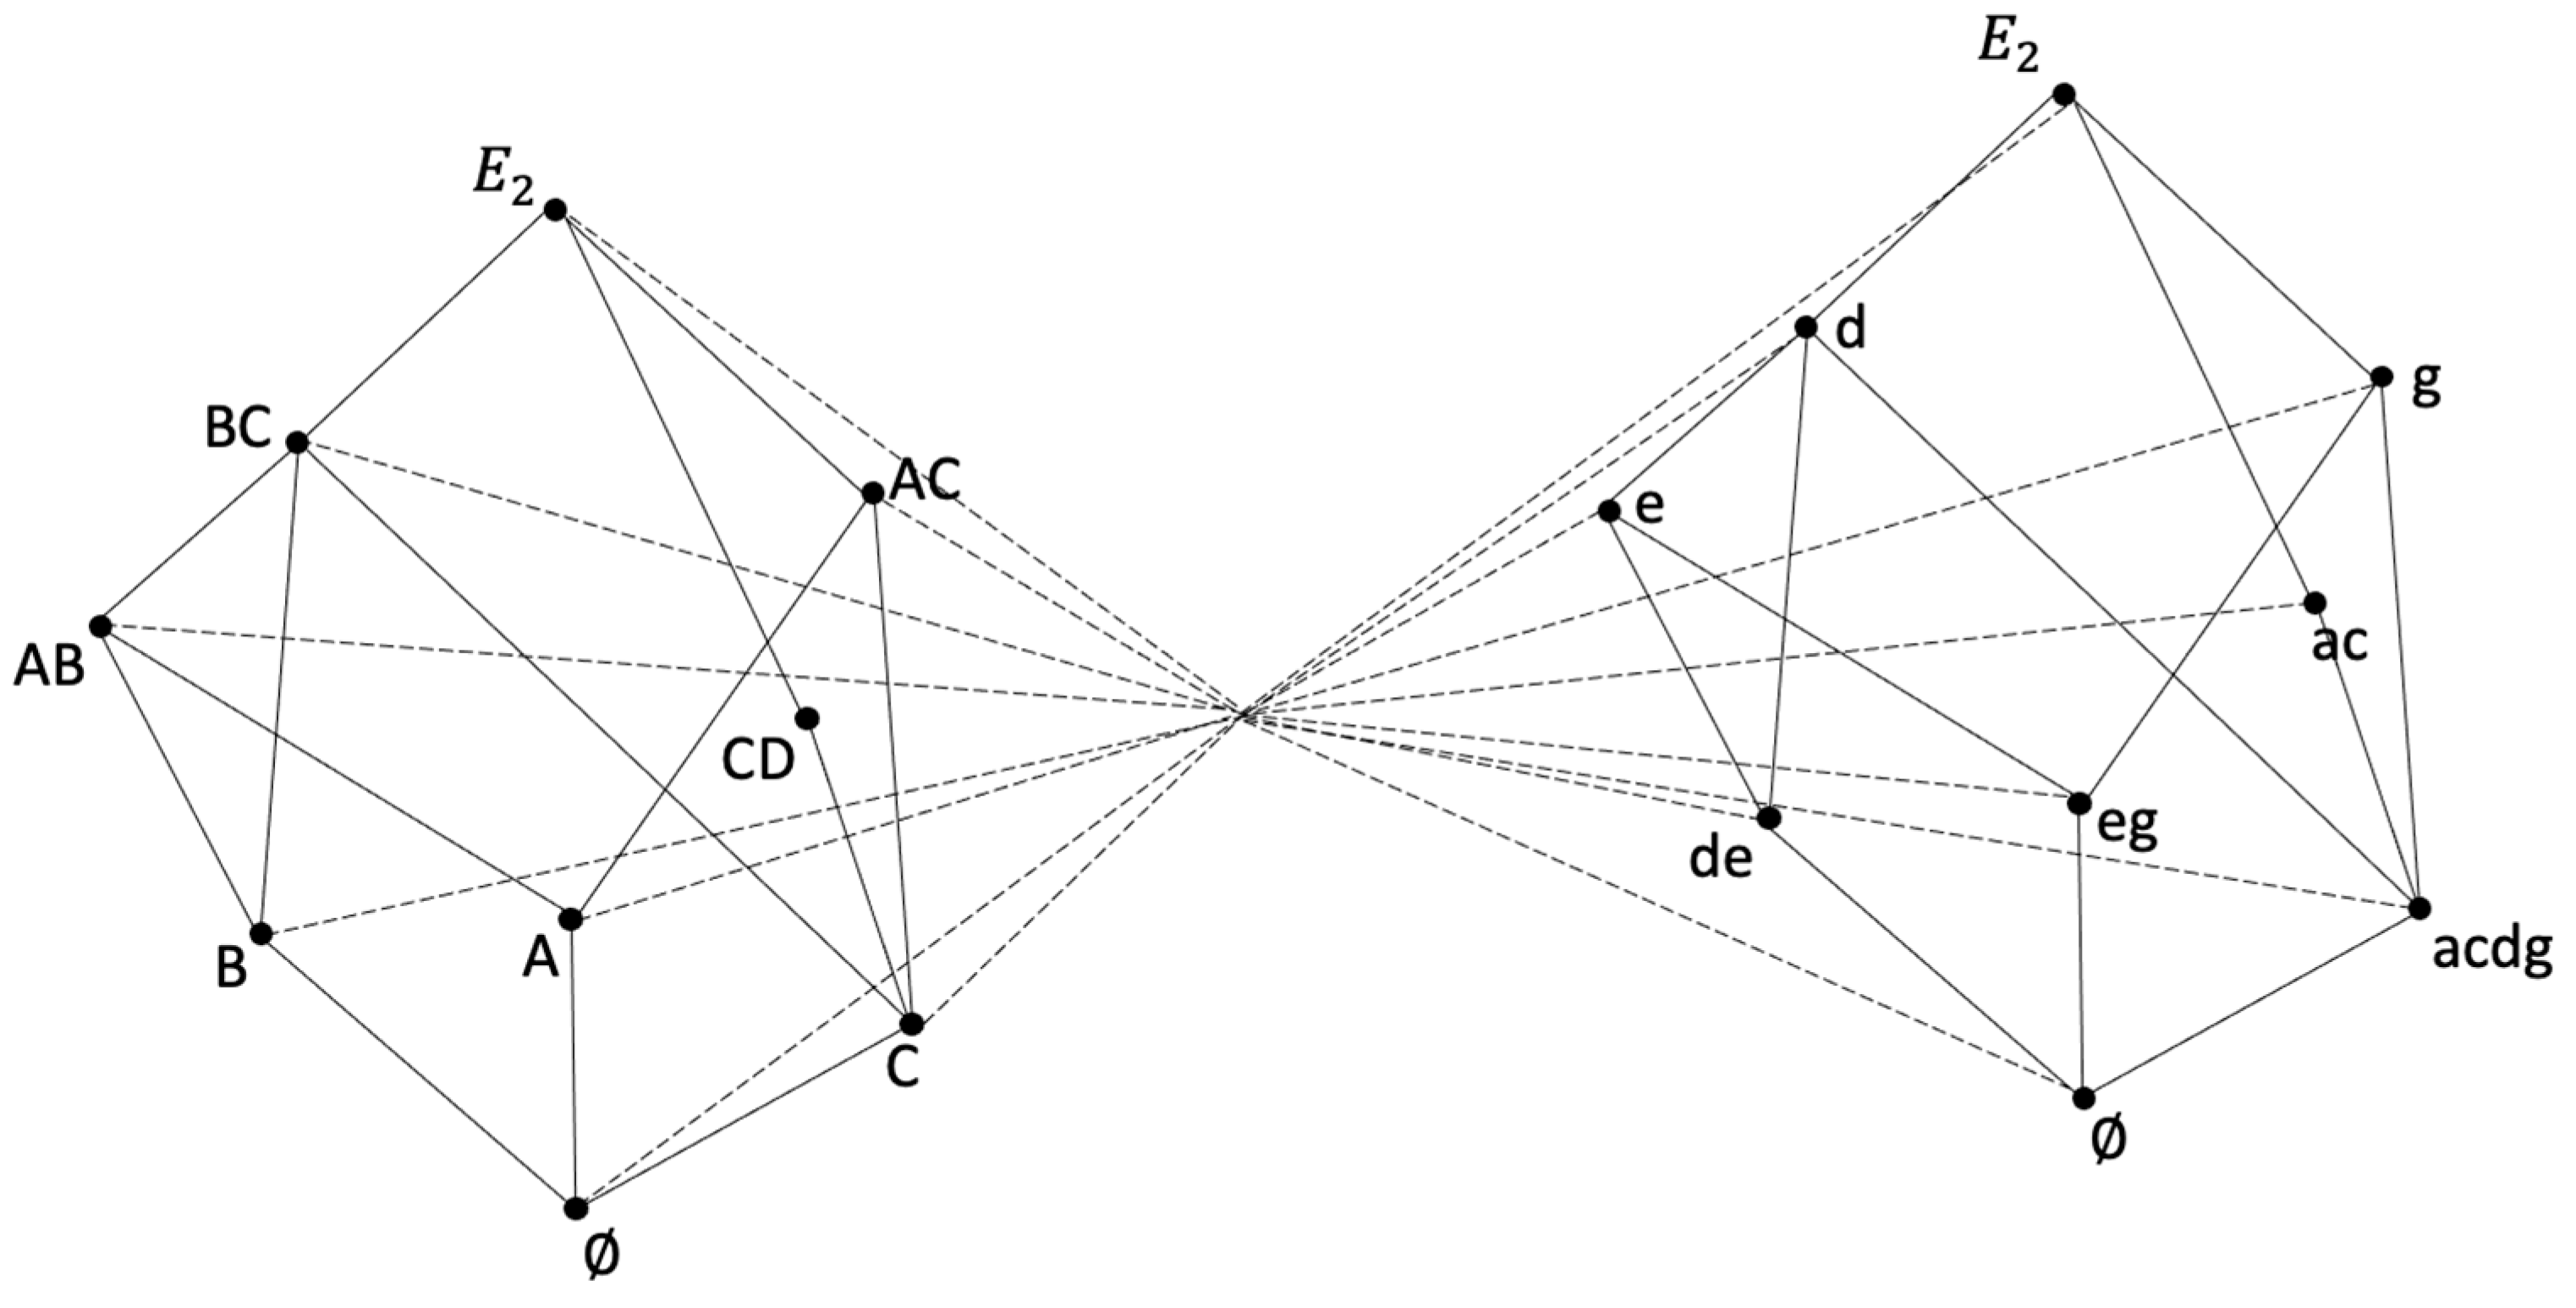
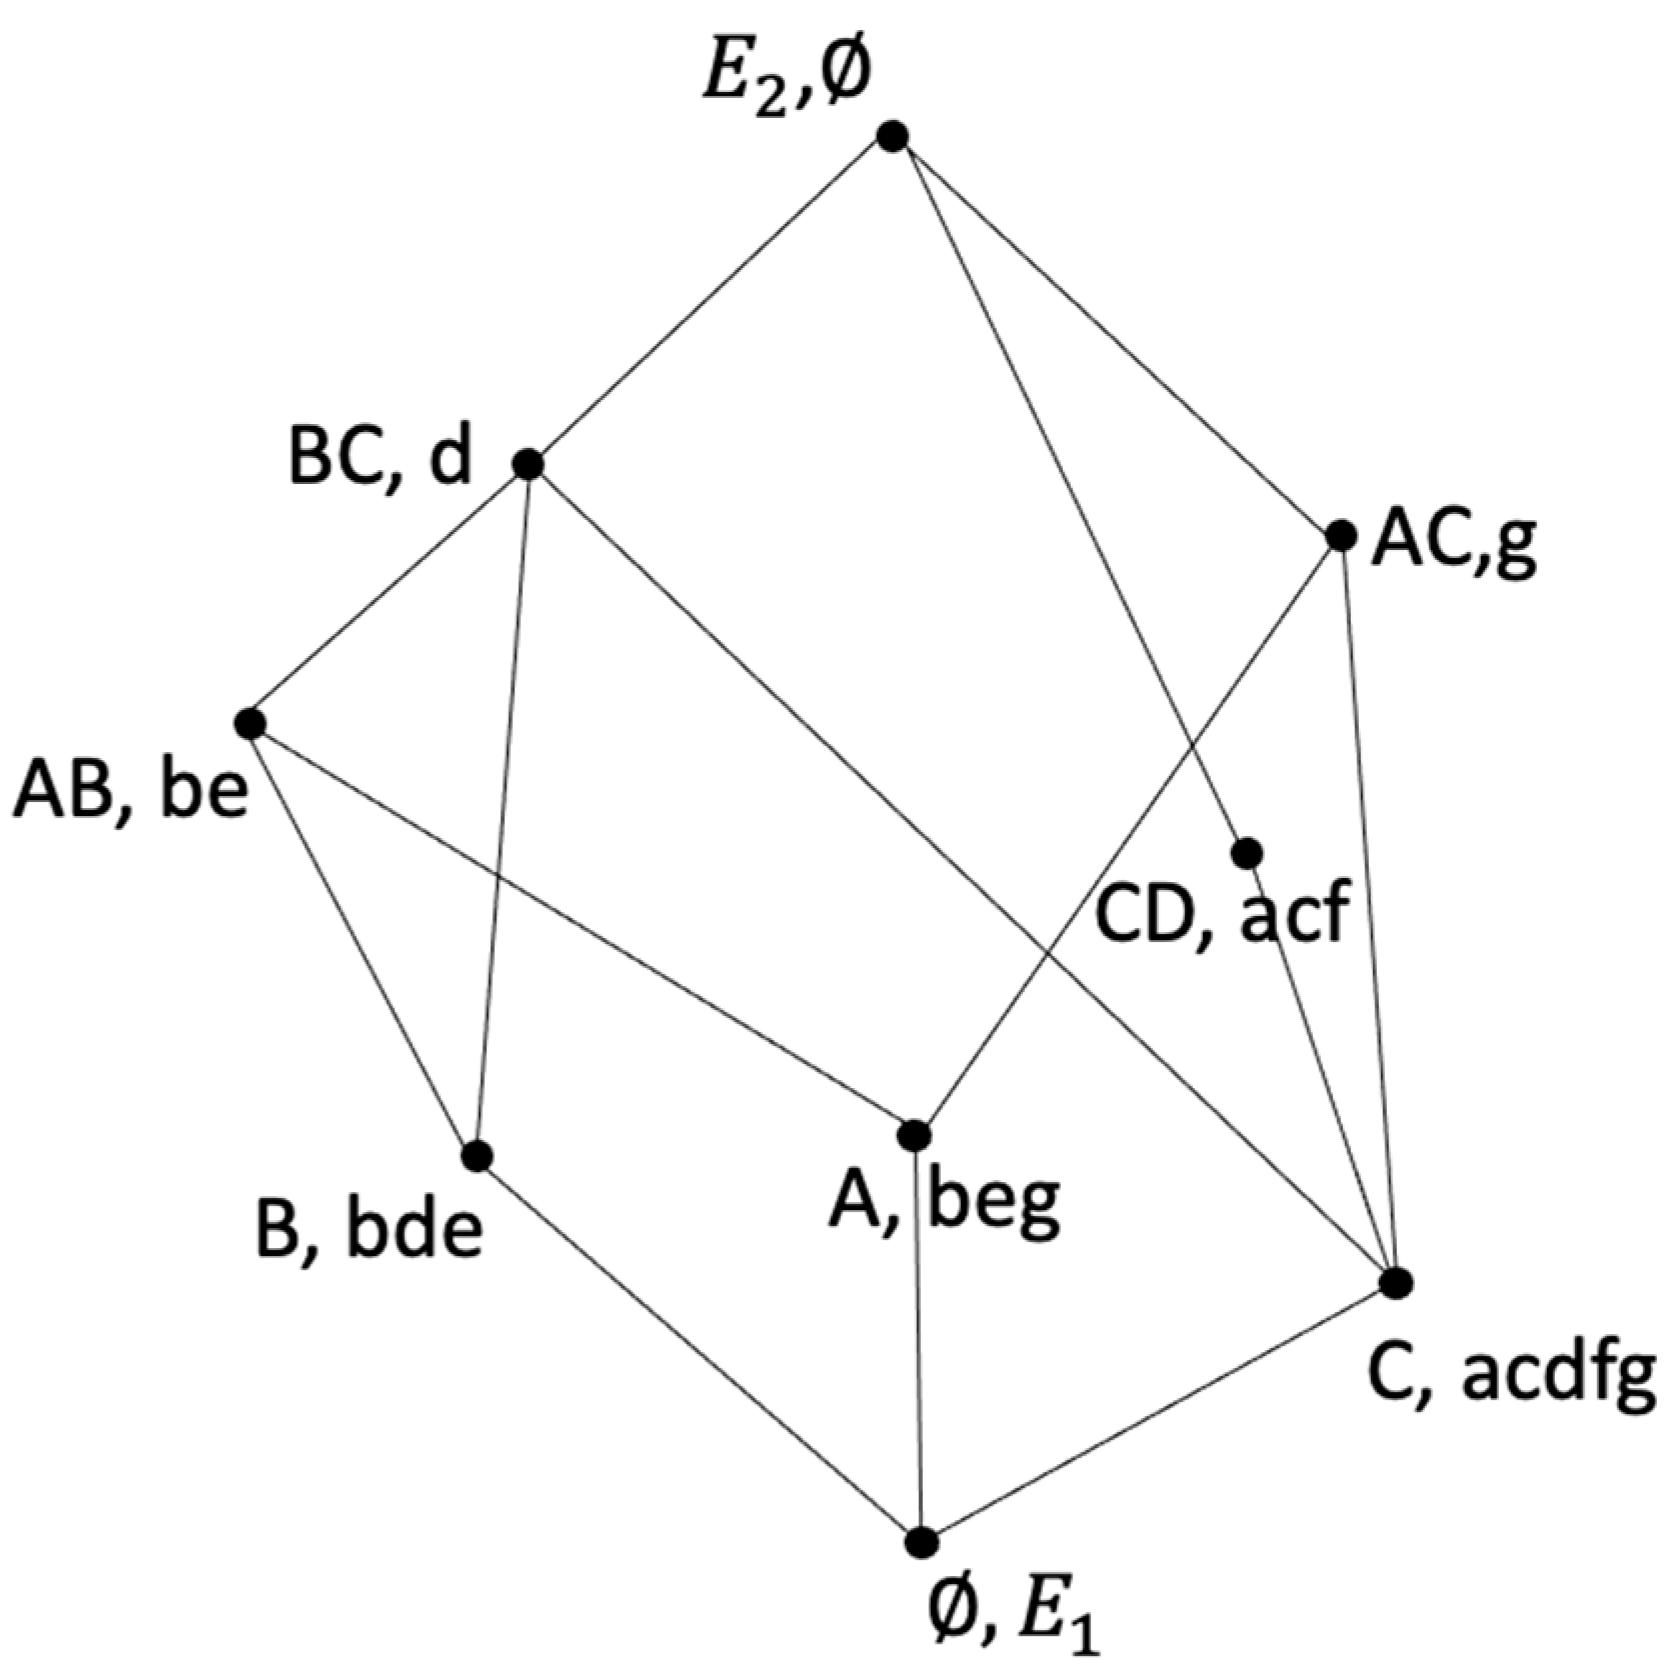
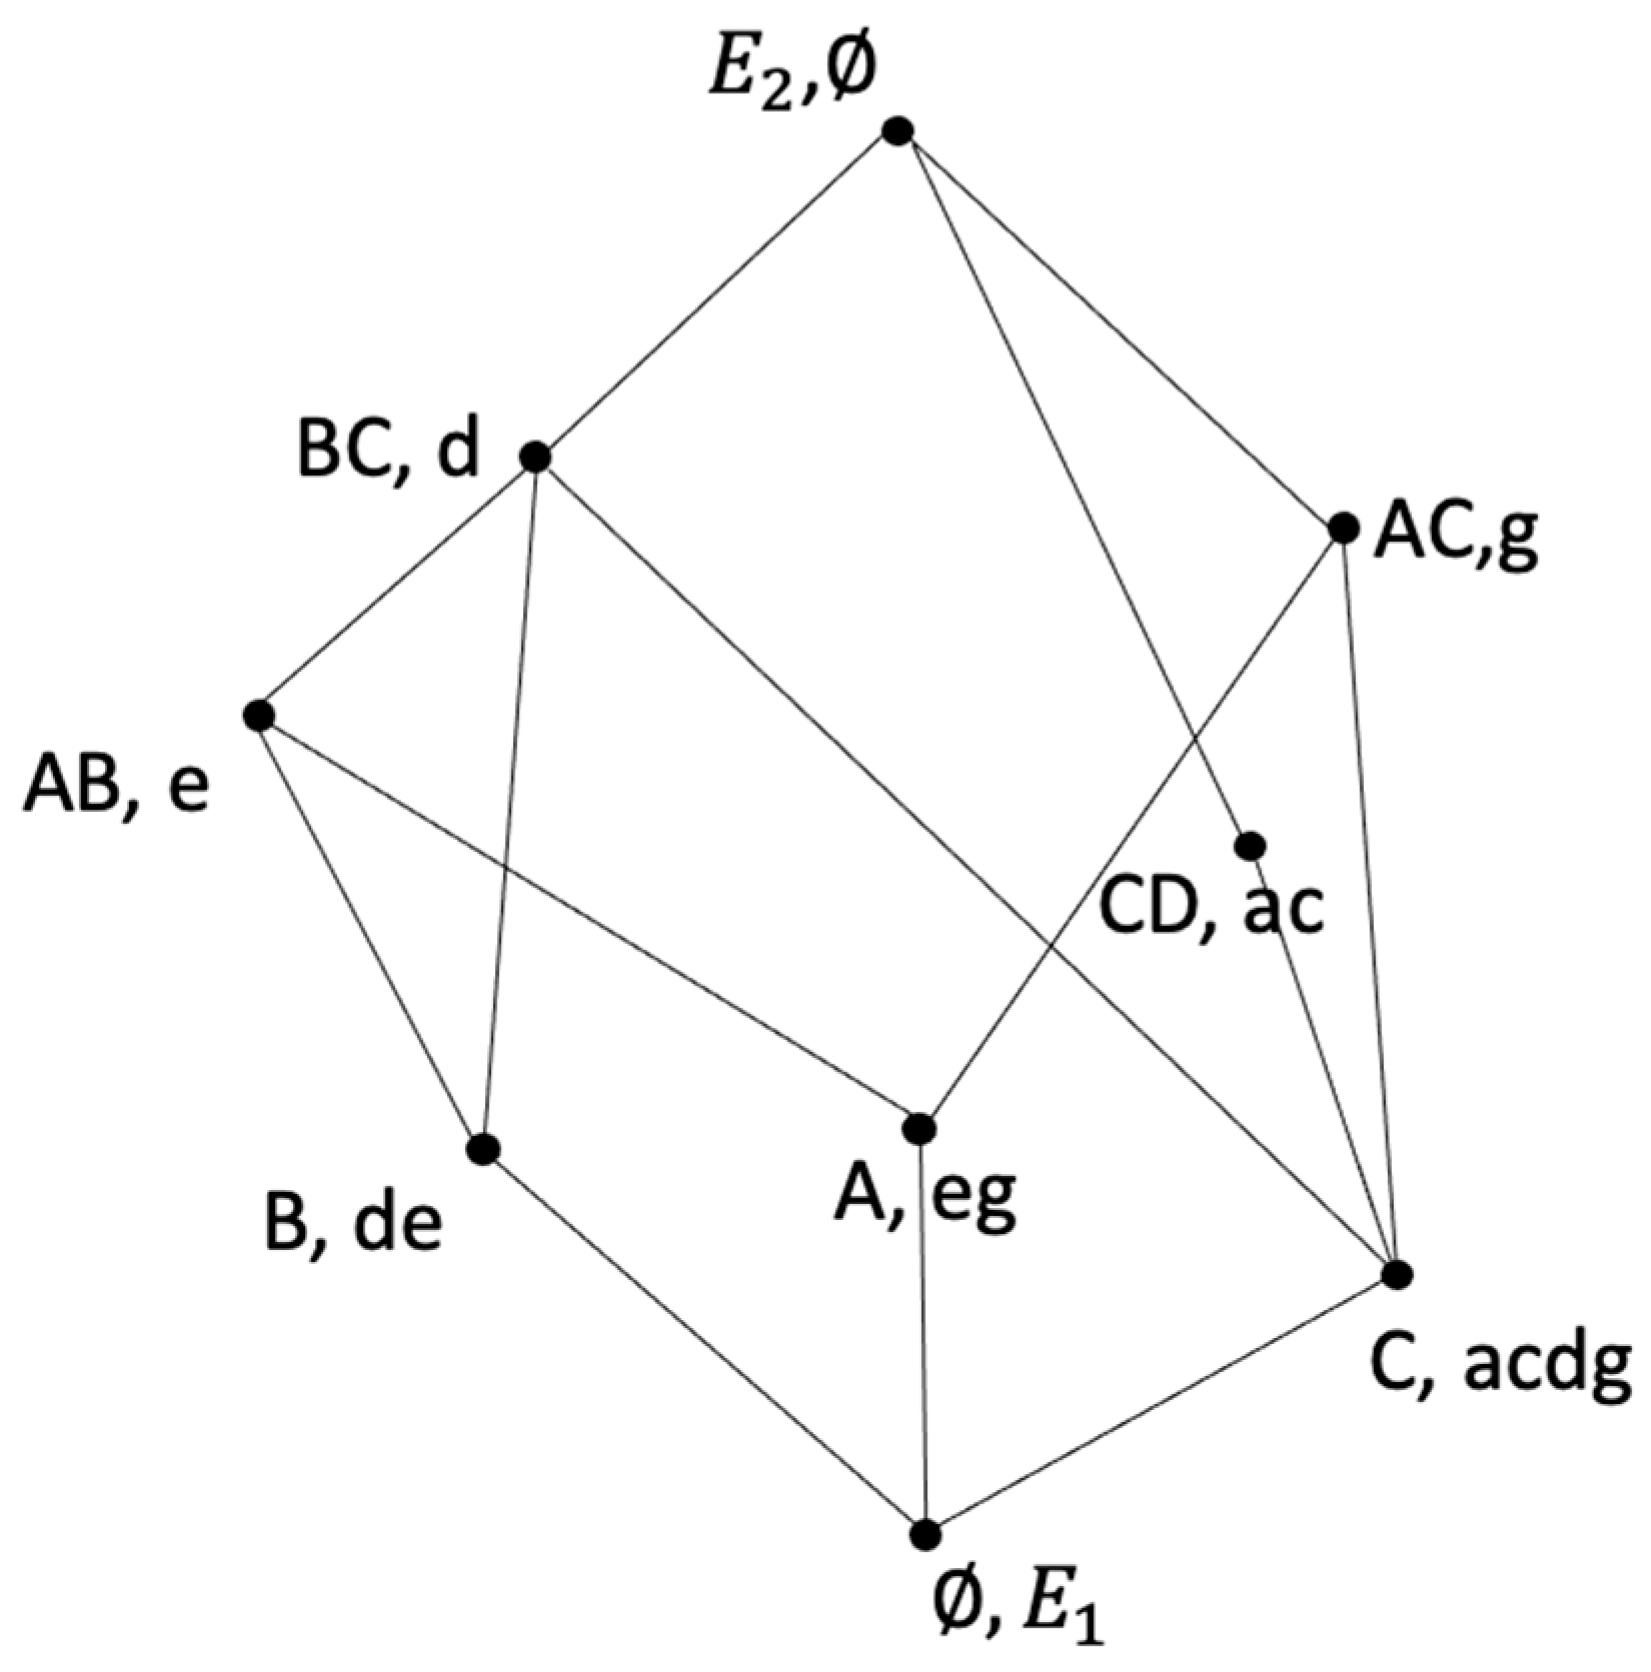
Finally, for formal purposes, the relation E 1 ,   the Galois lattice can be constructed. Having found the related groupings, it is established an order and structure of the single lattice. To each vertex of the single lattice, both the grouped elements are attached. Assembling the single lattice uses a Galois lattice.
A Galois lattice is an algebraic structure that allows the making of clusters by affinities. Being Π ( E 1 ) and Π ( E 2 ) the power set of E 1 and E 2 are established the ordered relationship [18] given by:
Firstly:
  X , X Π E 1 ,   Y , Y Π E 2 ( X , Y X , Y ) ( X X , Y Y )
Secondly:
  X , X Π E 1 ,   Y , Y Π E 2 ( X , Y X , Y ) ( X X , Y Y )
The following section presents the algorithm’s application considering the attractiveness factors of the Peruvian and Brazilian economies and competitiveness indicators.

4. Algorithm’s Application and the Results

This section presents the variables, the data source, the algorithm’s application, and the results.

4.1. Variables

The authors defined the variables of the model based on the literature review. Firstly, the model contemplates seven key indicators of attractiveness [10]. These variables determine E 1 = a , b , c , d , e , f , g . Table 7 presents these variables.
Secondly, the model includes the four competitiveness indicators [10]. These variables determine E 2 = A , B , C , D . Table 8 shows these variables.

4.2. Data Source

The authors used data from the Executive Opinion Survey [10], which reveals the attraction factors of the Peruvian and Brazilian economies. This survey conducted by IMD contemplates a list of 15 indicators, and the authors chose seven indicators based on the literature review. This selection criterion considers the indicators with high, medium, and low valuations. That allowed the analysis of critical indicators independent of the position in the IMD list.
The survey results are in percentages, and to homogenize the data and apply the algorithm these values were converted to the endecadary scale [83] with 11 values of [0, 1]. Thus, a value closer to 1 expresses higher attractiveness, and a value closer to 0 shows lower attractiveness. The authors relate the attractiveness and competitiveness indicators based on the literature review. The following subsection details the algorithm’s application.

4.3. The Algorithm’s Application

The algorithm’s application follows the Affinity Theory [18]. According to a literature review, the authors establish a relationship between the executives’ assessment of the economy’s attractiveness (E1) and the competitiveness indicators (E2). Figure 3 shows Peru’s fuzzy relationship R ~ 1 , and Figure 4 displays Brazil’s fuzzy relationship R ~ 2 .
The first step is to convert the fuzzy relation into a Boolean Matrix. Based on [10], the authors set the alpha threshold at which there is some affinity relationship. For this reason, the research considers α 0.07 as the minimum acceptable value to establish an affinity relationship. Figure 5 shows Peru’s Boolean Matrix B 1 , and Figure 6 displays Brazil’s Boolean Matrix B 2 .
The second step consists of obtaining the family subsets, being A1 (Peru) and A2 (Brazil):
A 1 A = b ,   e , g ,   A 1 B = b , d , e , A 1 C = a , c , d , f , g ,   A 1 D = a , c , f A 2 A = e , g ,   A 2 B = d , e , A 2 C = a , c , d , g ,   A 2 D = a , c
Below is the F clan family, being F1 (Peru) and F2 (Brazil):
F 1 = { b ,   e , g , b , d , e , a , c , d , f , g , a , c , f } . F 2 = { e , g , d , e , a , c , d , g , a , c } .
Subsequently, the family is the clan A1 (Peru) and A2 (Brazil):
A 1 A = b ,   e , g ,   A 1 B = b , d , e , A 1 C = a , c , d , f , g ,   A 1 D = a , c , f A ¯ 1 A = a , c , d , f , A ¯ 1 B = a , c , f , g , A ¯ 1 C = b , e , A ¯ 1 D = b , d , e , g
A 2 A = e , g ,   A 2 B = d , e , A 2 C = a , c , d , g ,   A 2 D = a , c A ¯ 2 A = a , b , c , d , f , A ¯ 2 B = a , b , c , f , g , A ¯ 2 C = b , e , f , A ¯ 2 D = b , d , e , f , g
In the third step, the authors determine the atoms for each country. Table 9 shows the results.
The following clan is present, being K1 (Peru) and K2 (Brazil):
K 1 = , d , g , b , e , d , g , a , c , f , b , d , e , b , e , g , a , c , d , f , a , c , f , g , a , b , c , e , f , E 1 K 2 = , d , e , g , a , c , d , e , d , g , e , g , a , c , d , a , c , e , a , c , g , E 1
In the fourth step, the authors calculate the intersections of the subsets of Peru:
A , B , C , D d B , C g A , C b , e A , B A , B = A , B d , g B , C A , C = C a , c , f C , D C , D C , D = C , D b , d , e B , C B , C A , B = B b , e , g A , B A , B A , C = A a , c , d , f C , D C , D B , C C , D = C a , c , f , g C , D C , D C , D A , C = C a , b , c , e , f C , D A , B C , D A , B A , C =
Following, the authors calculate the intersections of the subsets of Brazil:
A , B , C , D d B , C g A , C e A , B = A , B d , g B , C A , C = C a , c C , D C , D = C , D d , e B , C A , B = B e , g A , B A , C = A a , c , e C , D C , D A , B = a , c , g C , D C , D A , C = C
In the fifth step, there is no more than one subset with the same characteristics for the two countries, Peru and Brazil.
Finally, the authors present the affinity relationships for each country since there is no more than one subset with the same characteristics. Table 10 displays the results.
Another alternative [79] to perform the calculations from the Boolean Matrix would be to establish the right connection B + and the left connection B   ,   being B 1 ( P e r u ) and B 2 ( B r a z i l ) .
    B 1 + = E 2 , B + a = C , D , B + b = A , B , B + c = C , D , , B + a , b = , B + a , c = C , D , , B + b , d , e = B ,   , B + a , b , c , d , e , f , g =
B 1 = E 1 , B A = b , e , g , B B = b , d , e , ,   B A , B = b , e , B A , C = g , , B A , B , C = ,   , B A , B , C , D =
    B 2 + = E 2 , B + a = C , D , B + b = , B + c = C , D , , B + a , b = , B + a , c = C , D , , B + a , c , d = C ,   , B + a , b , c , d , e , f , g =
B 2 = E 1 , B A = e , g , B B = d , e , ,   B A , B = e , B A , C = g , , B A , B , C = ,   , B A , B , C , D =
Then, Moore’s closures such as M ( 1 ) = B B + and M ( 2 ) = B + B are obtained.
In the next step the families of closed sets relative to Moore’s closures M ( 1 ) and M ( 2 ) are formed, being f 1 ( P e r u ) and f 2 ( B r a z i l ) .
f 1 E , M ( 1 ) = { , C , B , A , C , D , A , B , B , C , A , C , E 2 } f 1 E , M ( 2 ) = { , g , d , b , e , a , c , f , b , e , g , b , d , e , a , c , d , f , g , E 1 }
f 2 E , M ( 1 ) = { , C , B , A , C , D , A , B , B , C , A , C , E 2 } f 2 E , M ( 2 ) = { , g , d , e , a , c , e , g , d , e , a , c , d , g , E 1 }

4.4. Results of the Application of the Affinities Theory

The results show an ordered structure that allows a holistic analysis of the affinity relationships between the variables through the Isomorphic and Galois lattices.
First, the families of closed sets representing the isomorphic lattices are associated with each other. In this way, it is possible to analyze, on the one hand, all the possible relationships of affinities between the competitiveness indicators on the left. On the other hand, all the relationships of affinities between the factors of economic attractiveness are on the right. Figure 7 shows Peru’s Isomorphic lattices, and Figure 8 displays Brazil’s Isomorphic lattices.
Second, obtaining the Galois lattice completes the algorithm and graphically shows the affinities between the critical factors of the economy’s attractiveness and the competitiveness indicators. Figure 9 shows the result for Peru, and Figure 10 presents the result for Brazil.
Analyzing from the bottom of the grid, the results show the number of competitiveness indicators increases in each group as we move up, and the number of economic attractiveness factors decreases. Thus, the first vertex indicates that if we wanted to form a group with all the factors of economic attractiveness, there are no competitiveness indicators. However, we are willing to consider a single competitiveness indicator (C); there are five economic attractiveness factors (a, c, d, f, g) for the Peruvian case (Figure 9) and four items (a, c, d, g) for the Brazilian case (Figure 10).
From another perspective, analyzing from the top downwards, it is verified that the upper vertex of the lattice expresses that when all the competitiveness indicators are required, there are no factors of economic attractiveness. However, if some of them are left out, attractiveness factors appear to be reduced, such as, for example, the affinity between BC and (d) and the affinity between AC and (g) for both countries. Thus, policy and decision-makers can prioritize actions to increase competitiveness based on affinity relationships. In sum, the outcomes provide a valuable tool in decision-making to identify elements that can contribute to competitiveness, taking as criteria the factors of the attractiveness of the economy and competitiveness indicators. The following section analyzes the main results of this research.

5. Discussion

First, in an orderly and systematic manner, the Galois Lattices presents not only all the existing affinities of the economic attractiveness variables, listing the competitiveness indicators each homogeneous group has but also interrelating them through a coherent structure, answering research question RQ1 and confirming the hypothesis H1.
Second, the results show that, in both countries, the business-friendly environment (d) has a relationship of affinities with the government efficiency (B) and business efficiency (C) indicators. In this case, policymakers should act to develop business frameworks favorable to entrepreneurs [6] and improve innovation incentive policies [3,59] since the quality of public institutions influences entrepreneurship, innovation, and competitiveness [11]. These measures could improve the business-friendly environment (d) and contribute to the competitiveness indicator (B). Another suggestion would be to increase business research and university-business partnerships [7,46,84] since institutions that stimulate business entrepreneurship and sustainable development are essential for innovation and business structuring. These strategies would contribute to the business environment and the competitiveness indicator (C).
Third, access to financing (g) has a relationship of affinities with the indicators of economic performance (A) and business efficiency (C). In Brazil and Peru, it is necessary to increase investment [52] so that both countries go from being economies driven by efficiency to economies driven by innovation. Furthermore, innovation is the way to ensure greater participation of Small and Medium Enterprises (SMEs) in the national economy [8] and improve performance in the market [42]. These strategies could improve access to financing (g) and contribute to competitiveness indicators A and C.
Fourth, the results also reveal that attractiveness factors (b and f) are present only in the Peruvian case. In this case, government competence (b) has an affinity with indicators A and B, and policymakers should create more favorable business conditions with policies and laws that stimulate business development and combat bureaucracy, which is one of the biggest obstacles for entrepreneurs [39]. Furthermore, public and private incentives for innovation would be essential to increase competitiveness and strengthen Latin American start-ups [38,85]. These actions can improve the government’s competence (b) and contribute to competitiveness indicators A and B. On the other hand, a high educational level (f) is associated with indicators C and D. As a recommendation, the country should improve the skills of individuals and support business growth [58].
Fifth, this research has some limitations. First, this case study has limited regarding the number of countries analyzed, in this case, two, and the amount of information processed. In addition, the countries selected are from LA, which may offer the same challenges and restrictions of the region, limiting the overall view of the subject. The second limitation refers to the number of attractiveness factors used in the model since this study employs the most representative regarding the strongest, intermediate, and weakest factors. Using all fifteen factors of IMD methodology can help shed more light on the understanding of competitiveness. The third limitation concerns the type of model applied. The Affinity Theory presents advantages, but other Fuzzy Logic algorithms can deepen the data analyses, such as Bonferroni Averages with distance and fitness coefficient measures in group theory [86]. In this case, the BON-OWAAC and BON-OWAIMAM operators allow continuous aggregations, multiple comparisons between each argument, and distance measures in the same formulation according to the ordered position of each argument. In addition, Moore families and Galois lattices gather parameters according to their affinities [86]. Another suggestion would be to apply the Forgotten Effects Theory [16] since this method reveals forgotten elements or effects that are not readily observable with other methodologies, allowing for predicting and acting more effectively on the causes, thus minimizing the effects [16].
Finally, some scientists may suggest performing a Sensitivity Analysis (SA) to show the robustness of the proposed method. By definition, SA means a process in which one or several factors of a problem are modified to evaluate their effects on some result or quantity of interest [87]. Despite the importance of this type of analysis, researchers revealed the inappropriate use of SA [88] and that 42% of publications with SA need to comply with the elementary requirement of adequately exploring the space of input factors [89]. Therefore, the authors [87] recommend first knowing the need to run the SA for a given problem and how the SA is expected to respond to this question. Likewise, it is necessary to design the SA experiment to address that underlying question [87]. In this direction, the variables used in the proposed model result from a literature review, as well as the alpha threshold used. Likewise, the entries come from real data from an applied study [10]. The main objective was to know the relationships of affinities between the factors of economic attractiveness and indicators of competitiveness, with scientific support and not assumptions. Likewise, the proposed model is validated in other research [24,79] and follows the recommendations to ensure confidence in the M and S process [90]. For these reasons, the authors consider not applying to perform an SA, modify variables, and make assumptions about the input values.

6. Conclusions

This research analyzed how innovation and entrepreneurship influence competitiveness in Brazil and Peru, revealing central policies to improve entrepreneurship’s quality and impact. A literature review allowed for identifying knowledge gaps and understanding the landscape in both countries in these topics. In addition, the authors applied a Fuzzy Logic algorithm to identify the affinity relationships between the attractiveness factors of the economies and the competitiveness indicators.
As practical implications, the study might support policymakers in formulating development strategies and stimuli for business competitiveness. In this sense, the relationships of affinities allowed for the identification of points of convergence between the two countries, information that can help in planning public policies for regional development. In addition, the manuscript alerted the importance of promoting innovation and entrepreneurship. Also, the authors suggested increasing public investment in R&D and encouraging private sector R&D. On the other hand, academic and business leaders may strengthen university-business collaboration with applied research in innovation and entrepreneurship.
As theoretical implications, the research expanded the frontier of knowledge about innovation and entrepreneurship. Surprisingly, few studies explore competitiveness in developing countries. The Affinities Theory demonstrated that it could facilitate decision-making by establishing the level of relationship between the variables and obtaining the corresponding affinities. The Galois lattices revealed in a structured way the affinities between the different variables in terms of their degrees of compliance. Also, the step-by-step explanation given by the authors allows the audience to understand how it works methodology. So, this paper could help researchers in the application of this algorithm. Additionally, the study was novel in comparing the two countries in these lines of research and contributing to science by reducing the gaps identified. Future research can compare different countries at different levels of development to verify how attractiveness factors are related to competitive factors.

Author Contributions

Conceptualization, A.C.-R. and L.B.-P.; methodology, L.B.-P.; validation, L.B.-P., D.F.A. and A.C.-R.; formal analysis, D.F.A.; investigation, A.C.-R.; resources, L.B.-P.; writing—original draft preparation, L.B.-P.; writing—review and editing, A.C.-R.; visualization, L.B.-P.; supervision, D.F.A.; project administration, A.C.-R. All authors have read and agreed to the published version of the manuscript.

Funding

This research received no external funding.

Data Availability Statement

All data are included in the article.

Acknowledgments

The authors wish to thank the Royal Academy of Economic and Financial Sciences, Spain, and CENTRUM Católica Graduate Business School, Peru. Research supported by Red Sistemas Inteligentes y Expertos Modelos Computacionales Iberoamericanos (SIEMCI), project number 522RT0130 in Programa Iberoamericano de Ciencia y Tecnología para el Desarrollo (CYTED).

Conflicts of Interest

The authors declare no conflict of interest.

Abbreviation

AbbreviationNomenclature
BON-OWAAC Bonferroni means-Ordered Weighted Averaging Adequacy Coefficient
BON-OWAIMAM Bonferroni means-Ordered Weighted Averaging Index of Maximum and Minimum
COVID-19 Coronavirus Disease 2019
ECLACEconomic Commission for Latin America and the Caribbean
GDPGross Domestic Product
GEMGlobal Entrepreneurship Monitor
GIIGlobal Innovation Index
H1 Hypothesis 1
IBGE Brazilian Institute of Geography and Statistics
ICTInformation and Communication Technology
IFS Intuitionistic Fuzzy Set
IMDInternational Institute for Management Development
IMD WC International Institute for Management Development World Competitiveness
LA Latin America
OECDOrganization for Economic Cooperation and Development
R&D Research and Development
RQResearch Question
SASensitivity Analysis
SMEsSmall and Medium Enterprises
T2FSType-2 Fuzzy Set
T2IFSType-2 Intuitionistic Fuzzy Set
TEATotal early-stage Entrepreneurial Activity Rate
WEFWorld Economic Forum
WIPOWorld Intellectual Property Organization
WTO World Trade Organization

References

  1. Franco, M. Entrepreneurship, Competitiveness and Innovation. Sustainability 2020, 12, 6576. [Google Scholar] [CrossRef]
  2. Sanyang, S.E.; Huang, W.-C. Entrepreneurship and economic development: The EMPRETEC showcase. Int. Entrep. Manag. J. 2010, 6, 317–329. [Google Scholar] [CrossRef]
  3. Malchow-Møller, N.; Schjerning, B.; Sørensen, A. Entrepreneurship, job creation and wage growth. Small Bus. Econ. 2011, 36, 15–32. [Google Scholar] [CrossRef]
  4. Nowiński, W.; Haddoud, M.Y.; Lančarič, D.; Egerová, D.; Czeglédi, C. The impact of entrepreneurship education, entrepreneurial self-efficacy and gender on entrepreneurial intentions of university students in the Visegrad countries. Stud. High. Educ. 2019, 44, 361–379. [Google Scholar] [CrossRef]
  5. Kang, P.; Guo, L.; Lu, Z.; Zhu, L. Evaluation of the early-stage entrepreneurship activity in the United States during the COVID-19 pandemic. Front. Public Health 2022, 10, 972203. [Google Scholar] [CrossRef]
  6. GEM. Global Entrepreneurship Monitor 2021/2022 Global Report Opportunity Amid Disruption; GEM: London, UK, 2022; ISBN 978-1-9160178-9-4. [Google Scholar]
  7. Olavarrieta, S.; Villena, M.G. Innovation and business research in Latin America: An overview. J. Bus. Res. 2014, 67, 489–497. [Google Scholar] [CrossRef]
  8. Puente, R.; González Espitia, C.G.; Cervilla, M.A. Necessity entrepreneurship in Latin America: It’s not that simple. Entrep. Reg. Dev. 2019, 31, 953–983. [Google Scholar] [CrossRef]
  9. Fainé, I. XXII Congreso Directivos CEDE—Hacia un Nuevo Liderazgo Empresarial. Available online: https://www.congresodirectivos.com/isidro-faine-reivindica-el-papel-de-las-personas-en-un-momento-en-que-la-inteligencia-artificial-irrumpe-con-una-fuerza-arrolladora/ (accessed on 30 October 2023).
  10. IMD. IMD WORLD COMPETITIVENESS BOOKLET 2022; Bris, A., Caballero, J., Cabolis, C., Pistis, M., Eds.; IMD—International Institute for Management Development: Lausanne, Switzerland, 2022; ISBN 978-2-940485-52-9. [Google Scholar]
  11. Veiga, P.M.; Teixeira, S.J.; Figueiredo, R.; Fernandes, C.I. Entrepreneurship, innovation and competitiveness: A public institution love triangle. Socioecon. Plan. Sci. 2020, 72, 100863. [Google Scholar] [CrossRef]
  12. Zahra, S.A.; George, G. Absorptive capacity: A review, reconceptualization, and extension. Acad. Manag. Rev. 2002, 27, 185–203. [Google Scholar] [CrossRef]
  13. Porter, M.E. Competição: Estratégias Competitivas Essenciais; Gulf Professional Publishing: Houston, TX, USA, 1999; ISBN 9788535204476. [Google Scholar]
  14. Zadeh, L.A. Fuzzy sets. Inf. Control 1965, 8, 338–353. [Google Scholar] [CrossRef]
  15. de Paula, L.B.; Gil-Lafuente, A.M.; Alvares, D.F. A contribution of fuzzy logic to sustainable tourism through a case analysis in Brazil. J. Intell. Fuzzy Syst. 2021, 40, 1851–1864. [Google Scholar] [CrossRef]
  16. Barcellos-Paula, L.; Gil-Lafuente, A.M.; Castro-Rezende, A. Socio-Economic and Health Management of Pandemics Based on Forgotten Effects Theory. Cybern. Syst. 2023, 54, 239–265. [Google Scholar] [CrossRef]
  17. Tariq, H.; Ali, Y.; Khan, A.U.; Petrillo, A.; De Felice, F. Sustainable production of diapers and their potential outputs for the Pakistani market in the circular economy perspective. Sci. Total Environ. 2021, 769, 145084. [Google Scholar] [CrossRef]
  18. Gil-Aluja, J. Elements for a Theory of Decision in Uncertainty; Applied Optimization; Springer US: Boston, MA, USA, 1999; Volume 32, ISBN 978-1-4419-4817-5. [Google Scholar]
  19. Lee Rodgers, J.; Nicewander, W.A. Thirteen Ways to Look at the Correlation Coefficient. Am. Stat. 1988, 42, 59–66. [Google Scholar] [CrossRef]
  20. Mukaka, M.M. Statistics corner: A guide to appropriate use of correlation coefficient in medical research. Malawi Med. J. 2012, 24, 69–71. [Google Scholar] [PubMed]
  21. Schober, P.; Boer, C.; Schwarte, L.A. Correlation Coefficients: Appropriate Use and Interpretation. Anesth. Analg. 2018, 126, 1763–1768. [Google Scholar] [CrossRef]
  22. Kaufmann, A. Theory of expertons and fuzzy logic. Fuzzy Sets Syst. 1988, 28, 295–304. [Google Scholar] [CrossRef]
  23. Blanco-Mesa, F.; Gil-Lafuente, A.M.; Merigó, J.M. Subjective stakeholder dynamics relationships treatment: A methodological approach using fuzzy decision-making. Comput. Math. Organ. Theory 2018, 24, 441–472. [Google Scholar] [CrossRef]
  24. Blanco-Mesa, F.; Gil-Lafuente, A.M. Towards a competitiveness in the economic activity in Colombia: Using Moore’s families and galois lattices in clustering. Econ. Comput. Econ. Cybern. Stud. Res. 2017, 51, 231–250. [Google Scholar]
  25. Will, M.; Bertrand, J.; Fransoo, J.C. Operations management research methodologies using quantitative modeling. Int. J. Oper. Prod. Manag. 2002, 22, 241–264. [Google Scholar] [CrossRef]
  26. McGaughey, S.L.; Kumaraswamy, A.; Liesch, P.W. Institutions, entrepreneurship and co-evolution in international business. J. World Bus. 2016, 51, 871–881. [Google Scholar] [CrossRef]
  27. Schumpeter, J.A. The Theory of Economic Development; Routledge: London, UK, 2017; ISBN 9781315135564. [Google Scholar]
  28. Chiavenato, I. Empreendedorismo: Dando Asas ao Espírito Empreendedor, 4th ed.; Editora Manole: Barueri, Brazil, 2012; ISBN 978-8520432778. [Google Scholar]
  29. OECD/Eurostat. Oslo Manual 2018: Guidelines for Collecting, Reporting and Using Data on Innovation, 4th ed.; The Measurement of Scientific, Technological and Innovation Activities; OECD: Paris, France, 2018. [Google Scholar]
  30. Tidd, J.; Bessant, J. Managing Innovation Integrating Technological, Market and Organizational Change, 6th ed.; Wiley: Hoboken, NJ, USA, 2018. [Google Scholar]
  31. Williams, C.; Lee, S.H. Entrepreneurial contexts and knowledge coordination within the multinational corporation. J. World Bus. 2011, 46, 253–264. [Google Scholar] [CrossRef]
  32. Husted, K.; Vintergaard, C. Stimulating innovation through corporate venture bases. J. World Bus. 2004, 39, 296–306. [Google Scholar] [CrossRef]
  33. Charles, V.; Zegarra, L.F. Measuring regional competitiveness through Data Envelopment Analysis: A Peruvian case. Expert Syst. Appl. 2014, 41, 5371–5381. [Google Scholar] [CrossRef]
  34. Ketelhöhn, N.; Ogliastri, E. Introduction: Innovation in Latin America. Acad. Rev. Latinoam. Adm. 2013, 26, 12–32. [Google Scholar] [CrossRef]
  35. Guzmán-Alfonso, C.; Guzmán-Cuevas, J. Entrepreneurial intention models as applied to Latin America. J. Organ. Chang. Manag. 2012, 25, 721–735. [Google Scholar] [CrossRef]
  36. Chaston, I.; Scott, G.J. Entrepreneurship and open innovation in an emerging economy. Manag. Decis. 2012, 50, 1161–1177. [Google Scholar] [CrossRef]
  37. Calzada Olvera, B. Innovation in mining: What are the challenges and opportunities along the value chain for Latin American suppliers? Miner. Econ. 2022, 35, 35–51. [Google Scholar] [CrossRef]
  38. Barboza, R.A.B.; Fonseca, S.A.; de Freitas Ramalheiro, G.C. O papel das políticas públicas para potencializar a inovação em pequenas empresas de base tradicional. REGE Rev. Gestão 2017, 24, 58–71. [Google Scholar] [CrossRef]
  39. Mingo, S. Entrepreneurial ventures, institutional voids, and business group affiliation: The case of two Brazilian start-ups, 2002–2009. Acad. Rev. Latinoam. Adm. 2013, 26, 61–76. [Google Scholar] [CrossRef]
  40. Gomes, G.; Majocchi, A.; Alegre, J.; Carmona, L.J.D.M. The influence of innovation stimulus, facilitating factors and support mechanisms on innovation performance in Brazilian small textile firms. Int. J. Entrep. Innov. Manag. 2020, 24, 393. [Google Scholar] [CrossRef]
  41. Brenes, E.R.; Camacho, A.R.; Ciravegna, L.; Pichardo, C.A. Strategy and innovation in emerging economies after the end of the commodity boom—Insights from Latin America. J. Bus. Res. 2016, 69, 4363–4367. [Google Scholar] [CrossRef]
  42. Pino, C.; Felzensztein, C.; Zwerg-Villegas, A.M.; Arias-Bolzmann, L. Non-technological innovations: Market performance of exporting firms in South America. J. Bus. Res. 2016, 69, 4385–4393. [Google Scholar] [CrossRef]
  43. Kakabadse, N.; Karatas-Ozkan, M.; Theodorakopoulos, N.; McGowan, C.; Nicolopoulou, K. Business Incubator Managers’ Perceptions of their Role and Performance Success: Role Demands, Constraints, and Choices. Eur. Manag. Rev. 2020, 17, 485–498. [Google Scholar] [CrossRef]
  44. Vanderstraeten, J.; van Witteloostuijn, A.; Matthyssens, P. Organizational sponsorship and service co-development: A contingency view on service co-development directiveness of business incubators. Technovation 2020, 98, 102154. [Google Scholar] [CrossRef]
  45. Vanderstraeten, J.; van Witteloostuijn, A.; Matthyssens, P.; Andreassi, T. Being flexible through customization—The impact of incubator focus and customization strategies on incubatee survival and growth. J. Eng. Technol. Manag. 2016, 41, 45–64. [Google Scholar] [CrossRef]
  46. Soares Silva, A.L.; da Cruz, C.A.; de Aragao Gomes, I.M.; Almeida Paixao, A.E. Best University Incubation Programs in Latin America. Rev. Tecnol. E Soc. 2017, 13, 85–102. [Google Scholar]
  47. World Bank Research and Development Expenditure (% of GDP). Available online: https://data.worldbank.org/indicator/gb.xpd.rsdv.gd.zs?end=2018&start=2018&view=map&year=2017 (accessed on 11 February 2022).
  48. OECD. OECD Reviews of Digital Transformation: Going Digital in Brazil; OECD Reviews of Digital Transformation; OECD: Paris, France, 2020; ISBN 9789264710788. [Google Scholar]
  49. Bosma, N.; Content, J.; Sanders, M.; Stam, E. Institutions, entrepreneurship, and economic growth in Europe. Small Bus. Econ. 2018, 51, 483–499. [Google Scholar] [CrossRef]
  50. World Bank High-Technology Exports (Current US$). Available online: https://data.worldbank.org/indicator/TX.VAL.TECH.CD?end=2018&start=2018&view=map&year=2020 (accessed on 11 February 2022).
  51. Calmanovici, C.E. A inovação, a competitividade e a projeção mundial das empresas brasileiras. Rev. USP 2011, 89, 190–203. [Google Scholar] [CrossRef]
  52. Schwaba, K.; Zahidi, S. The Global Competitiveness Report; World Economic Forum: Geneva, Switzerland, 2020; ISBN 978-2-940631-17-9. [Google Scholar]
  53. Bárcena, A. Panorama de América Latina y El Caribe; CEPAL: Lima, Peru, 2015. [Google Scholar]
  54. Barcellos-Paula, L.; Gil-Lafuente, A.; Castro-Rezende, A. Los efectos olvidados de la pandemia del COVID 19 sobre en el envejecimiento de la población. Cuad. Del CIMBAGE 2021, 2, 1–17. [Google Scholar]
  55. Temenggung, D.; Saputro, A.; Rinaldi, R.; Pane, D. Managing Recovery and Seizing Reform Opportunities. Bull. Indones. Econ. Stud. 2021, 57, 1–28. [Google Scholar] [CrossRef]
  56. OECD. OECD Takes First Step in Accession Discussions with Argentina, Brazil, Bulgaria, Croatia, Peru and Romania; OECD: Paris, France, 2020. [Google Scholar]
  57. GEM. Global Entrepreneurship Monitor, Global Report 2017/2018; GEM: London, UK, 2018; ISBN 978-1-939242-10-5. [Google Scholar]
  58. GEM. Global Entrepreneurship Monitor, Global Report 2018/2019; Bosna, N., Kelley, D., Eds.; GEM: London, UK, 2019; ISBN 978-1-9160178-0-1. [Google Scholar]
  59. Marques, F. Múltiplos Elos da Cadeia de Inovação. Available online: https://revistapesquisa.fapesp.br/multiplos-elos-da-cadeia-de-inovacao/ (accessed on 11 March 2022).
  60. Garbelotti, T. Benefícios da “Lei do Bem” não são Aproveitados. Estadão. 2018; Available online: https://www.fateczl.edu.br/engetec/engetec_2018/ENGETEC_2018_paper_79.pdf (accessed on 31 October 2023).
  61. WIPO. Global Innovation Index 2022: What Is the Future of Innovation-Driven Growth? World Intellectual Property Organization: Geneva, Switzerland, 2022. [Google Scholar]
  62. Rubín, C. Legado de Lotfi Zadeh. Cuad. Del CIMBAGE 2018, 1, 1–12. [Google Scholar]
  63. Yager, R.R. Families of OWA operators. Fuzzy Sets Syst. 1993, 59, 125–148. [Google Scholar] [CrossRef]
  64. Pedrycz, W. Why triangular membership functions? Fuzzy Sets Syst. 1994, 64, 21–30. [Google Scholar] [CrossRef]
  65. XU, Z. Intuitionistic preference relations and their application in group decision making☆. Inf. Sci. 2007, 177, 2363–2379. [Google Scholar] [CrossRef]
  66. Gil Lafuente, A.M.; Barcellos Paula, L. Algorithms applied in the sustainable management of human resources. Fuzzy Econ. Rev. 2010, 15, 39. [Google Scholar] [CrossRef]
  67. Barcellos-Paula, L.; Gil-Lafuente, A.M.; Castro-Rezende, A. Algorithm Applied to SDG13: A Case Study of Ibero-American Countries. Mathematics 2023, 11, 313. [Google Scholar] [CrossRef]
  68. Zadeh, L.A. The concept of a linguistic variable and its application to approximate reasoning—I. Inf. Sci. 1975, 8, 199–249. [Google Scholar] [CrossRef]
  69. John, R.; Coupland, S. Type-2 Fuzzy Logic: A Historical View. IEEE Comput. Intell. Mag. 2007, 2, 57–62. [Google Scholar] [CrossRef]
  70. Fazel Zarandi, M.H.; Zarinbal, M.; Izadi, M. Systematic image processing for diagnosing brain tumors: A Type-II fuzzy expert system approach. Appl. Soft Comput. J. 2011, 11, 285–294. [Google Scholar] [CrossRef]
  71. Singh, S.; Garg, H. Distance measures between type-2 intuitionistic fuzzy sets and their application to multicriteria decision-making process. Appl. Intell. 2017, 46, 788–799. [Google Scholar] [CrossRef]
  72. Fazel Zarandi, M.H.; Soltanzadeh, S.; Mohammadi, A.; Castillo, O. Designing a general type-2 fuzzy expert system for diagnosis of depression. Appl. Soft Comput. 2019, 80, 329–341. [Google Scholar] [CrossRef]
  73. Atanassov, K.T. Intuitionistic fuzzy sets. Fuzzy Sets Syst. 1986, 20, 87–96. [Google Scholar] [CrossRef]
  74. Barcellos de Paula, L.; Gil-Lafuente, A.M.; Rezende, A.D.C. Sustainable Management of the Supply Chain Based on Fuzzy Logic. Cybern. Syst. 2021, 52, 579–600. [Google Scholar] [CrossRef]
  75. Karmakar, S.; Seikh, M.R.; Castillo, O. Type-2 intuitionistic fuzzy matrix games based on a new distance measure: Application to biogas-plant implementation problem. Appl. Soft Comput. 2021, 106, 107357. [Google Scholar] [CrossRef]
  76. Blanco-Mesa, F.; Merigo Lindahl, J.M.; Gil-Lafuente, A.M. A Bibliometric Analysis of Fuzzy Decision Making Research. In Proceedings of the 2016 Annual Conference of the North American Fuzzy Information Processing Society (NAFIPS), El Paso, TX, USA, 31 October–4 November 2016. [Google Scholar]
  77. Bellman, R.E.; Zadeh, L.A. Decision-Making in a Fuzzy Environment. Manag. Sci. 1970, 17, B-141–B-164. [Google Scholar] [CrossRef]
  78. Barcellos-Paula, L.; de La Vega, I.; Gil-Lafuente, A.M. Bibliometric review of research on decision models in uncertainty, 1990–2020. Int. J. Intell. Syst. 2022, 37, 7300–7333. [Google Scholar] [CrossRef]
  79. Gil-Lafuente, A.; Klimova, A. Approximation to the theory of affinities to manage the problems of the grouping process. Comput. Sci. Inf. Syst. 2014, 11, 779–796. [Google Scholar] [CrossRef]
  80. Barcellos de Paula, L.; Gil-Lafuente, A.M. Estrategias para compras sostenibles desde la logica difusa y la teoria de los grupos de interés. Cuadenos del CIMBAGE 2020, 1, 22. [Google Scholar]
  81. Gil-Aluja, J.; Gil-Lafuente, A.M. Affinity in the Selection of a Player. In Optimal Strategies in Sports Economics and Management; Springer: Berlin/Heidelberg, Germany, 2010; pp. 1–14. [Google Scholar]
  82. de Paula, L.B. Modelos de Gestión Aplicados a la Sostenibilidad Empresarial. Ph.D. Thesis, Universitat de Barcelona, Barcelona, Spain, 2011. [Google Scholar]
  83. Kaufmann, A.; Gil Aluja, J. Introducción de la Teoría de los Subconjuntos Borrosos a la Gestión de las Empresas; Milladoiro: Santiago de Compostela, Spain, 1986; ISBN 9788439876304. [Google Scholar]
  84. Iacono, A.; Nagano, M.S. Innova tion management in technology-based enter prises: Evidences in an enter prise incubator in Brazil. Interciencia 2014, 39, 296–306. [Google Scholar]
  85. Farinha, L.; Ferreira, J.J.M.; Nunes, S. Linking innovation and entrepreneurship to economic growth. Compet. Rev. Int. Bus. J. 2018, 28, 451–475. [Google Scholar] [CrossRef]
  86. Blanco-Mesa, F.; Merigó, J.M.; Kacprzyk, J. Bonferroni means with distance measures and the adequacy coefficient in entrepreneurial group theory. Knowl.-Based Syst. 2016, 111, 217–227. [Google Scholar] [CrossRef]
  87. Razavi, S.; Jakeman, A.; Saltelli, A.; Prieur, C.; Iooss, B.; Borgonovo, E.; Plischke, E.; Lo Piano, S.; Iwanaga, T.; Becker, W.; et al. The Future of Sensitivity Analysis: An essential discipline for systems modeling and policy support. Environ. Model. Softw. 2021, 137, 104954. [Google Scholar] [CrossRef]
  88. Saltelli, A.; D’Hombres, B. Sensitivity analysis didn’t help. A practitioner’s critique of the Stern review. Glob. Environ. Chang. 2010, 20, 298–302. [Google Scholar] [CrossRef]
  89. Saltelli, A.; Aleksankina, K.; Becker, W.; Fennell, P.; Ferretti, F.; Holst, N.; Li, S.; Wu, Q. Why so many published sensitivity analyses are false: A systematic review of sensitivity analysis practices. Environ. Model. Softw. 2019, 114, 29–39. [Google Scholar] [CrossRef]
  90. Harper, A.; Mustafee, N.; Yearworth, M. Facets of trust in simulation studies. Eur. J. Oper. Res. 2021, 289, 197–213. [Google Scholar] [CrossRef]
Figure 1. Research classification. Own elaboration based on [25].
Axioms 12 01038 g001
Figure 2. Process to obtain affinities. Own elaboration based on [18].
Axioms 12 01038 g002
Figure 3. Peru’s Fuzzy Relationship. Source: Own elaboration based on [10].
Axioms 12 01038 g003
Figure 4. Brazil’s Fuzzy Relationship. Source: Own elaboration based on [10].
Axioms 12 01038 g004
Figure 5. Peru’s Boolean Matrix.
Axioms 12 01038 g005
Figure 6. Brazil’s Boolean Matrix.
Axioms 12 01038 g006
Figure 7. Isomorphic lattices of Peru.
Axioms 12 01038 g007
Figure 8. Isomorphic lattices of Brazil.
Axioms 12 01038 g008
Figure 9. Galois lattice of Peru.
Axioms 12 01038 g009
Figure 10. Galois lattice of Brazil.
Axioms 12 01038 g010
Table 1. Four pillars of competitiveness.
PillarsIndicators
Economic PerformanceDomestic Economy; International Trade; International Investment; Employment; Prices.
Government EfficiencyPublic Finance; Tax Policy; Institutional Framework; Business Legislation; Societal Framework.
Business EfficiencyProductivity & Efficiency; Labor Market; Finance; Management Practices; Attitudes and Values.
InfrastructureBasic Infrastructure; Technological Infrastructure; Scientific Infrastructure; Health and Environment; Education.
Source: Own elaboration based on [10].
Table 2. Competitiveness Indicators.
Overall and FactorsBrazilPeru
202020212022202020212022
Overall565759525854
Economic Performance565148516040
Government Efficiency616261404852
Business Efficiency474952505353
Infrastructure535253606059
Source: Own elaboration based on [10].
Table 3. Summary of the results of Brazil.
SummaryComments
ProgressThe improvements are justified by some progress in public sector regulation and simplification of procedures, but infrastructure needs to catch up to the needs of the productive sector.
ChallengesThe challenge would be to encourage more significant incentives for investment in infrastructure and technological development. In addition, the country should focus on preserving the population’s purchasing power and creating inclusive jobs.
RecommendationsBrazil should improve the quality of the education system and labour productivity, mitigate growing fiscal pressures, and ensure political and economic stability during an election year.
Source: Own elaboration based on [10].
Table 4. Summary of the results of Peru.
SummaryComments
ProgressThe improvement in the economic area would be the rebound effect of the growth rates of the variables strongly affected by the pandemic.
ChallengesThe challenges would be eliminating corruption, strengthening public institutions, increasing regional productivity and competitiveness, and achieving a more efficient and effective health system.
RecommendationsPeru should focus on reducing poverty, increasing formal employment, and promoting an efficient and decentralized education system.
Source: Own elaboration based on [10].
Table 5. WEF classification.
GroupWorld Economic Forum Classification
G1Factor-driven countries. That are predominantly dependent on labour factors and natural resources
G2Efficiency-driven countries. They are classified by the advance of industrialisation and gains in scale, predominantly capital-intensive organisations
G3Innovation-driven countries. Knowledge-intensive enterprises and the expansion and modernisation of the service sector categorise them.
Source: Own elaboration based on [57].
Table 6. GII 2022 of Brazil and Peru.
CountriesGII 2022 RankOutput RankInput RankLatin America and the Caribbean
Brazil54th53rd58th2nd
Peru65th81st52nd6th
Source: Own elaboration based on [61].
Table 7. Indicators of attractiveness.
VariablesIndicators
aStrong R&D culture
bCompetency of government
cReliable infrastructure
dBusiness-friendly environment
eDynamism of the economy
fHigh educational level
gAccess to financing
Source: Own elaboration based on [10].
Table 8. Competitiveness Landscape.
VariablesIndicators
AEconomic Performance
BGovernment Efficiency
CBusiness Efficiency
DInfrastructure
Source: own elaboration based on [10].
Table 9. Atoms for each country.
PeruBrazil
A A A B A C A D = A A A B A C A D =
A A A B A C A ¯ D = A A A B A C A ¯ D =
A A A B A ¯ C A D = A A A B A ¯ C A D =
A A A ¯ B A C A D = A A A ¯ B A C A D =
A ¯ A A B A C A D = A ¯ A A B A C A D =
A A A B A ¯ C A ¯ D = b , e A A A B A ¯ C A ¯ D = e
A A A ¯ B A C A ¯ D = g A A A ¯ B A C A ¯ D = g
A ¯ A A B A C A ¯ D = d A ¯ A A B A C A ¯ D = d
A A A ¯ B A ¯ C A D = A A A ¯ B A ¯ C A D =
A ¯ A A B A ¯ C A D = A ¯ A A B A ¯ C A D =
A ¯ A A ¯ B A C A D = a , c , f A ¯ A A ¯ B A C A D = a , c
A A A ¯ B A ¯ C A ¯ D = A A A ¯ B A ¯ C A ¯ D =
A ¯ A A B A ¯ C A ¯ D = A ¯ A A B A ¯ C A ¯ D =
A ¯ A A ¯ B A C A ¯ D = A ¯ A A ¯ B A C A ¯ D =
A ¯ A A ¯ B A ¯ C A D = A ¯ A A ¯ B A ¯ C A D =
A ¯ A A ¯ B A ¯ C A ¯ D = A ¯ A A ¯ B A ¯ C A ¯ D =
Source: Own elaboration.
Table 10. Affinity relation for each country.
PeruBrazil
E 2 E 2
A , C g
B , C d
A , C g
B , C d
A , B b , e
C , D a , c , f
A , B e
C , D a , c
A b , e , g A e , g
B b , d , e B d , e
C a , c , d , f , g C a , c , d , g
E 1 E 1
Source: Own elaboration.
Disclaimer/Publisher’s Note: The statements, opinions and data contained in all publications are solely those of the individual author(s) and contributor(s) and not of MDPI and/or the editor(s). MDPI and/or the editor(s) disclaim responsibility for any injury to people or property resulting from any ideas, methods, instructions or products referred to in the content.

