

Application of Whale Optimization Algorithm Based FOPI Controllers for STATCOM and UPQC to Mitigate Harmonics and Voltage Instability in Modern Distribution Power Grids

 ,
,  , , ,
, , ,  , ,
, ,
Abstract
:1. Introduction
- A.
- Motivation and Background
- B.
- Literature Overview
- C.
- Contributions
- A new WOA-FOPIC-based robust control was developed for the STATCOM and UPQC to improve their dynamic response, stabilize the PCC bus voltage, and reject harmonics of the current and voltage at this bus.
- The proposed controller for the UPQC and STATCOM can risk mitigating unstable voltage and harmonics without the need for detector tools in the UPQC, which effectively reduces the UPQC cost with a less complex design.
- The proposed configurations can solve PQ problems such as voltage distortions and minimize harmonics of the current and voltage at the PCC to acceptable levels under regular and irregular conditions (S1, S2, and S3), thereby improving EPS reliability.
- The application of STATCOM and the UPQC overcomes 98% and 100% of the voltage fluctuation, respectively, during S1 and S2, and during S3 95% and 100% of the voltage fluctuation is overcome.
- The UPQC is superior to STATCOM in ensuring the system is more reliable, especially during short-circuit faults and compared with recently published works.
- Finally, it can be concluded that both C1 and C2 enable the high penetration scenarios of the WE source, NLs, and achieving FRT capability.
- D.
- Paper Organization
2. System Description
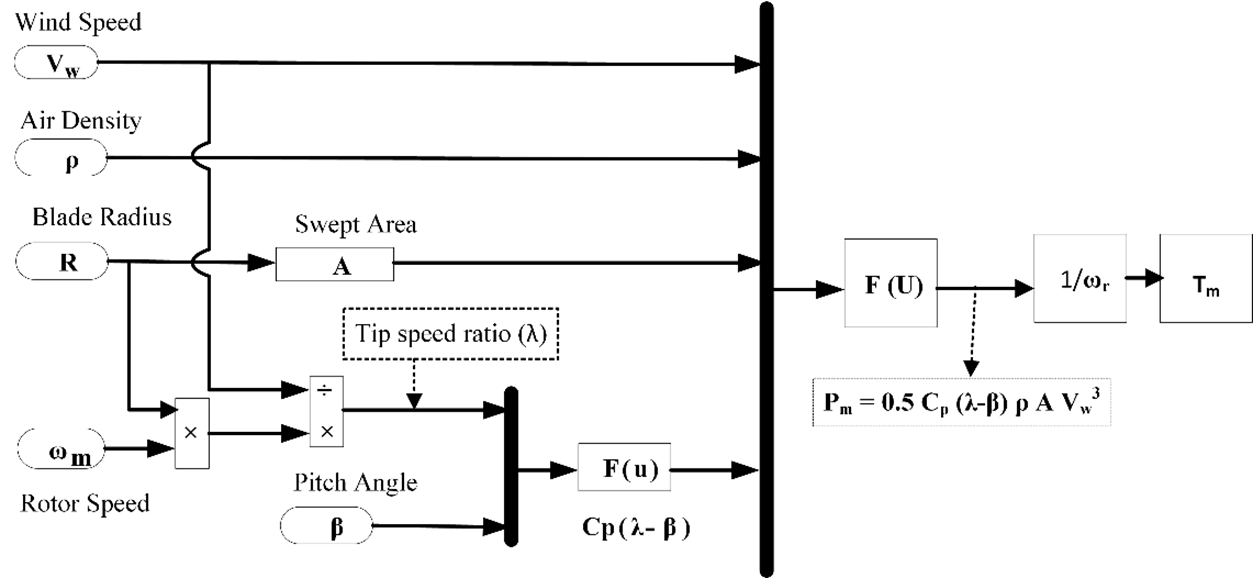
2.1. Modeling of WT
2.2. Modeling of SCIG
3. Modeling and Control of Proposed Developed Systems
3.1. Modeling and Control Structure of Investigated STATCOM System
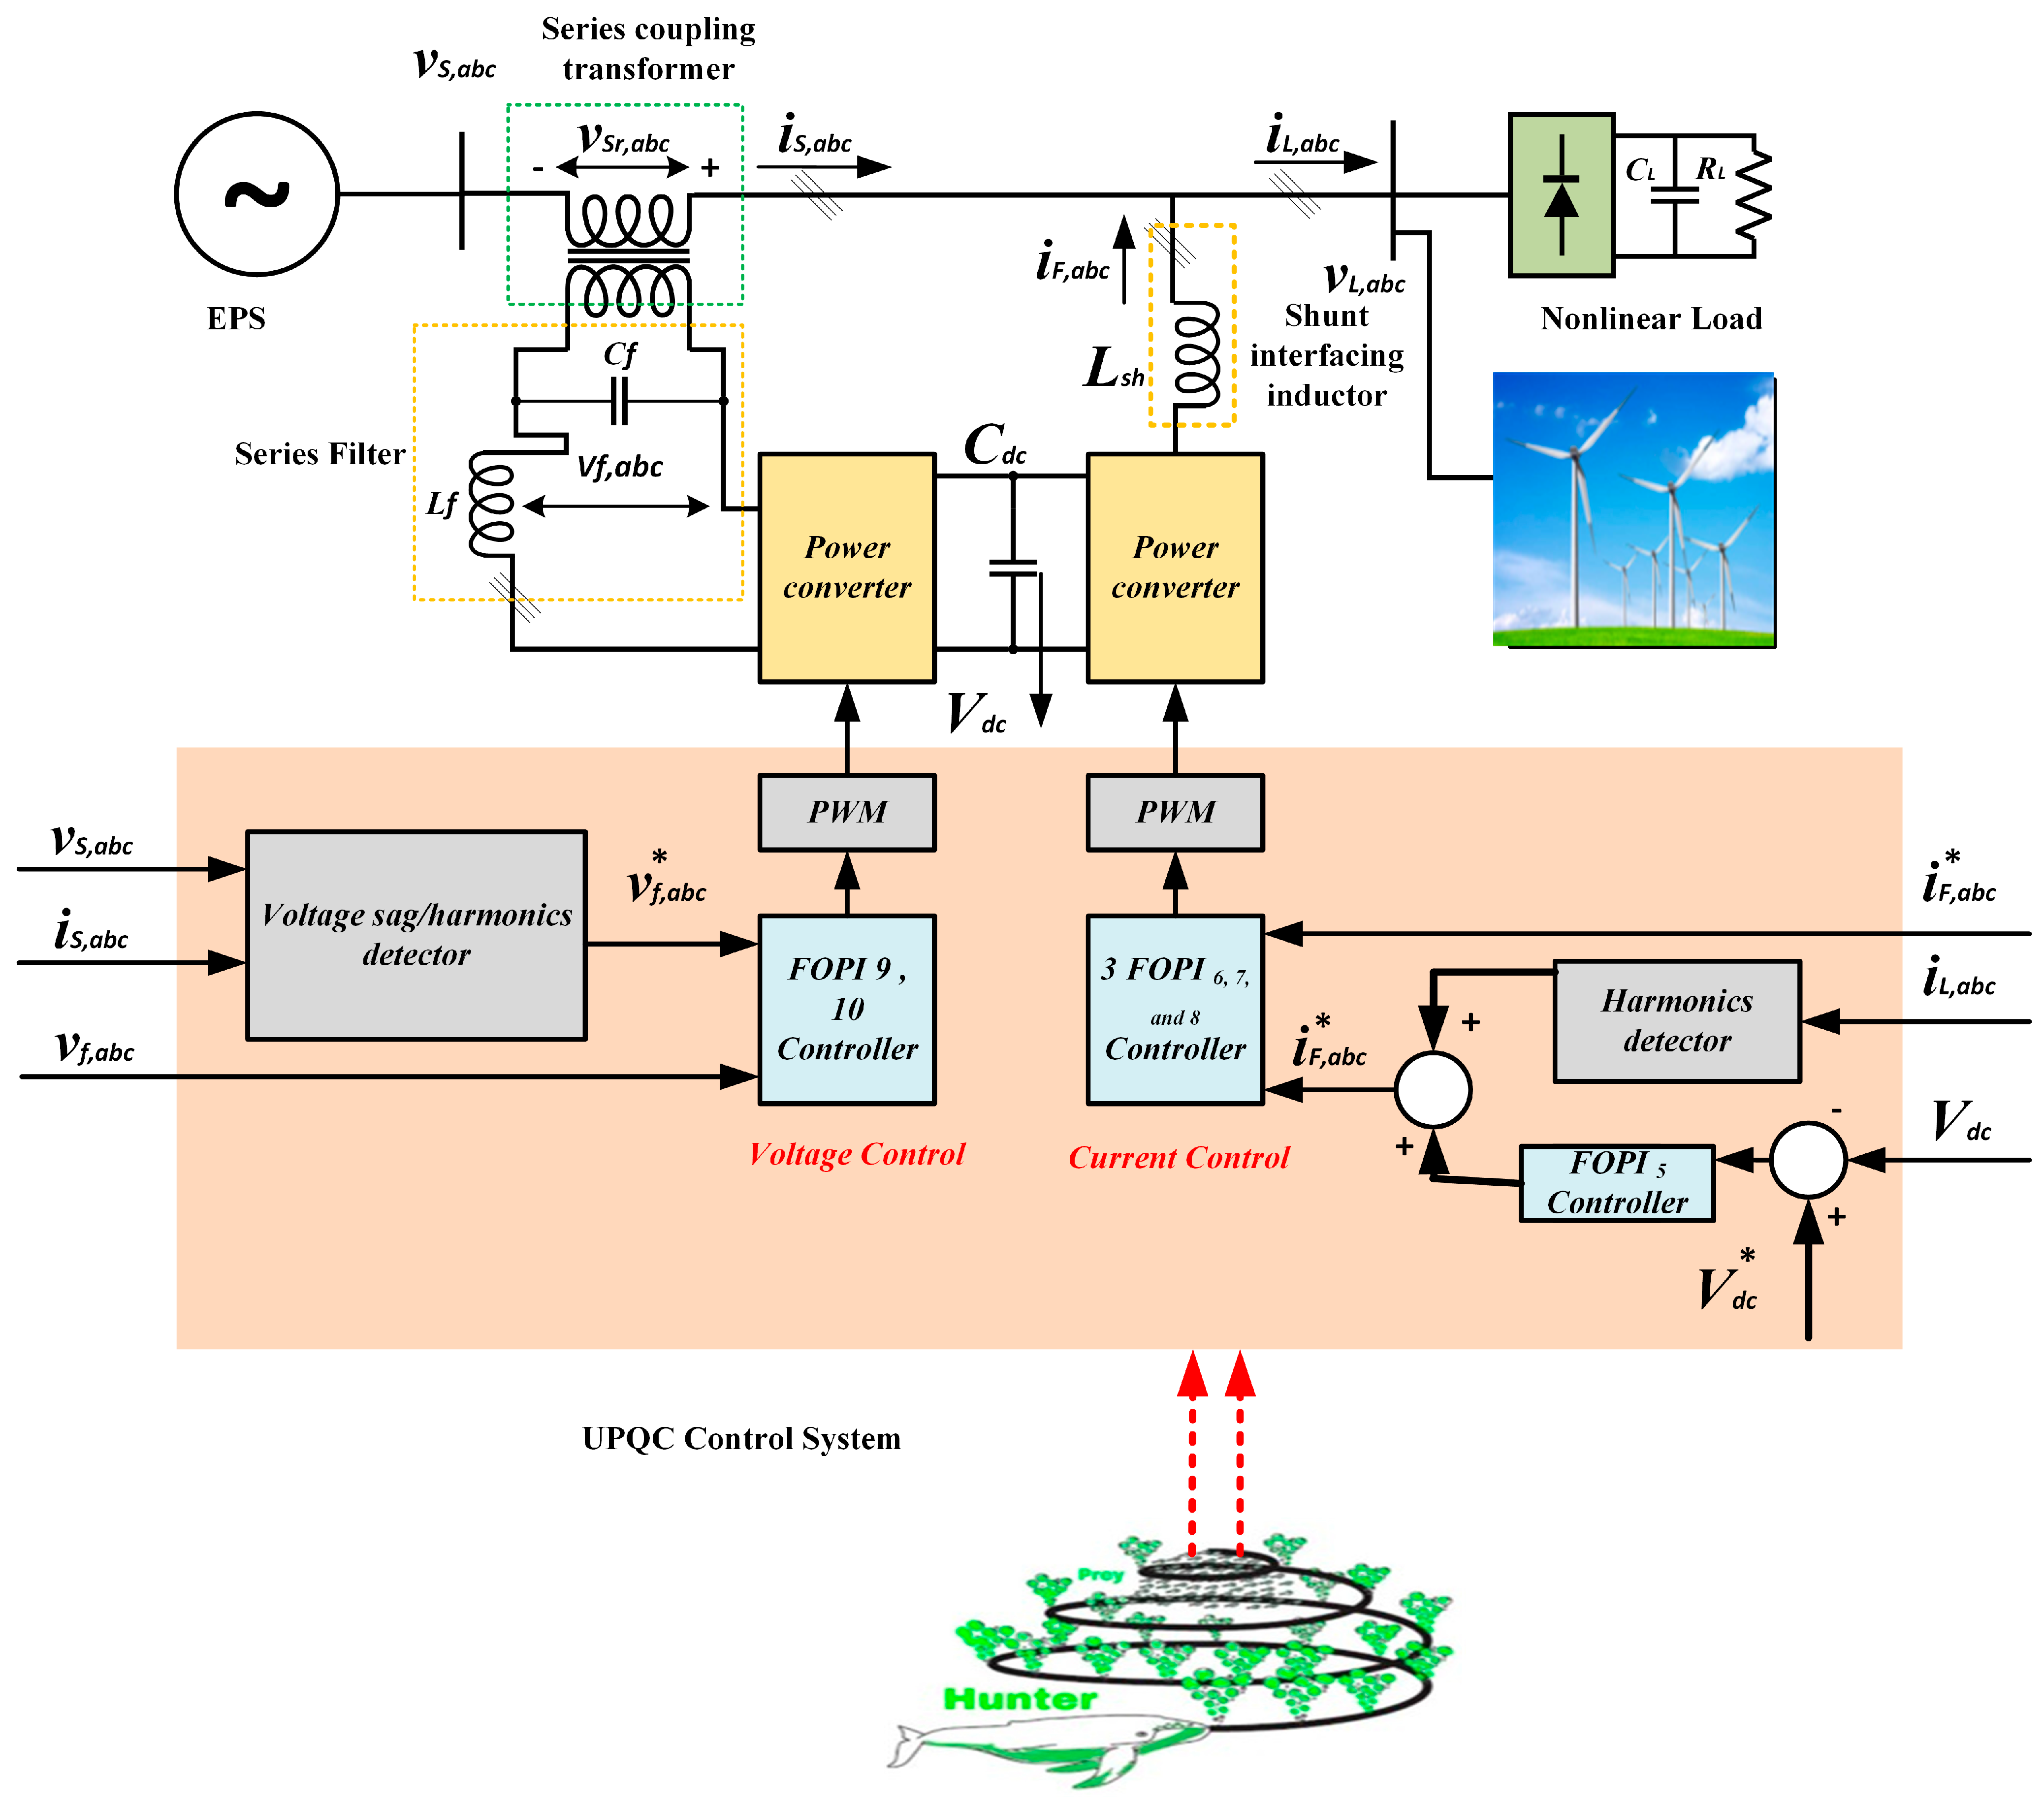
3.2. Modeling and Control Structure of Investigated UPQC System
3.3. A Comparison between STATCOM and UPQC Systems
4. Application of Proposed Control Strategy
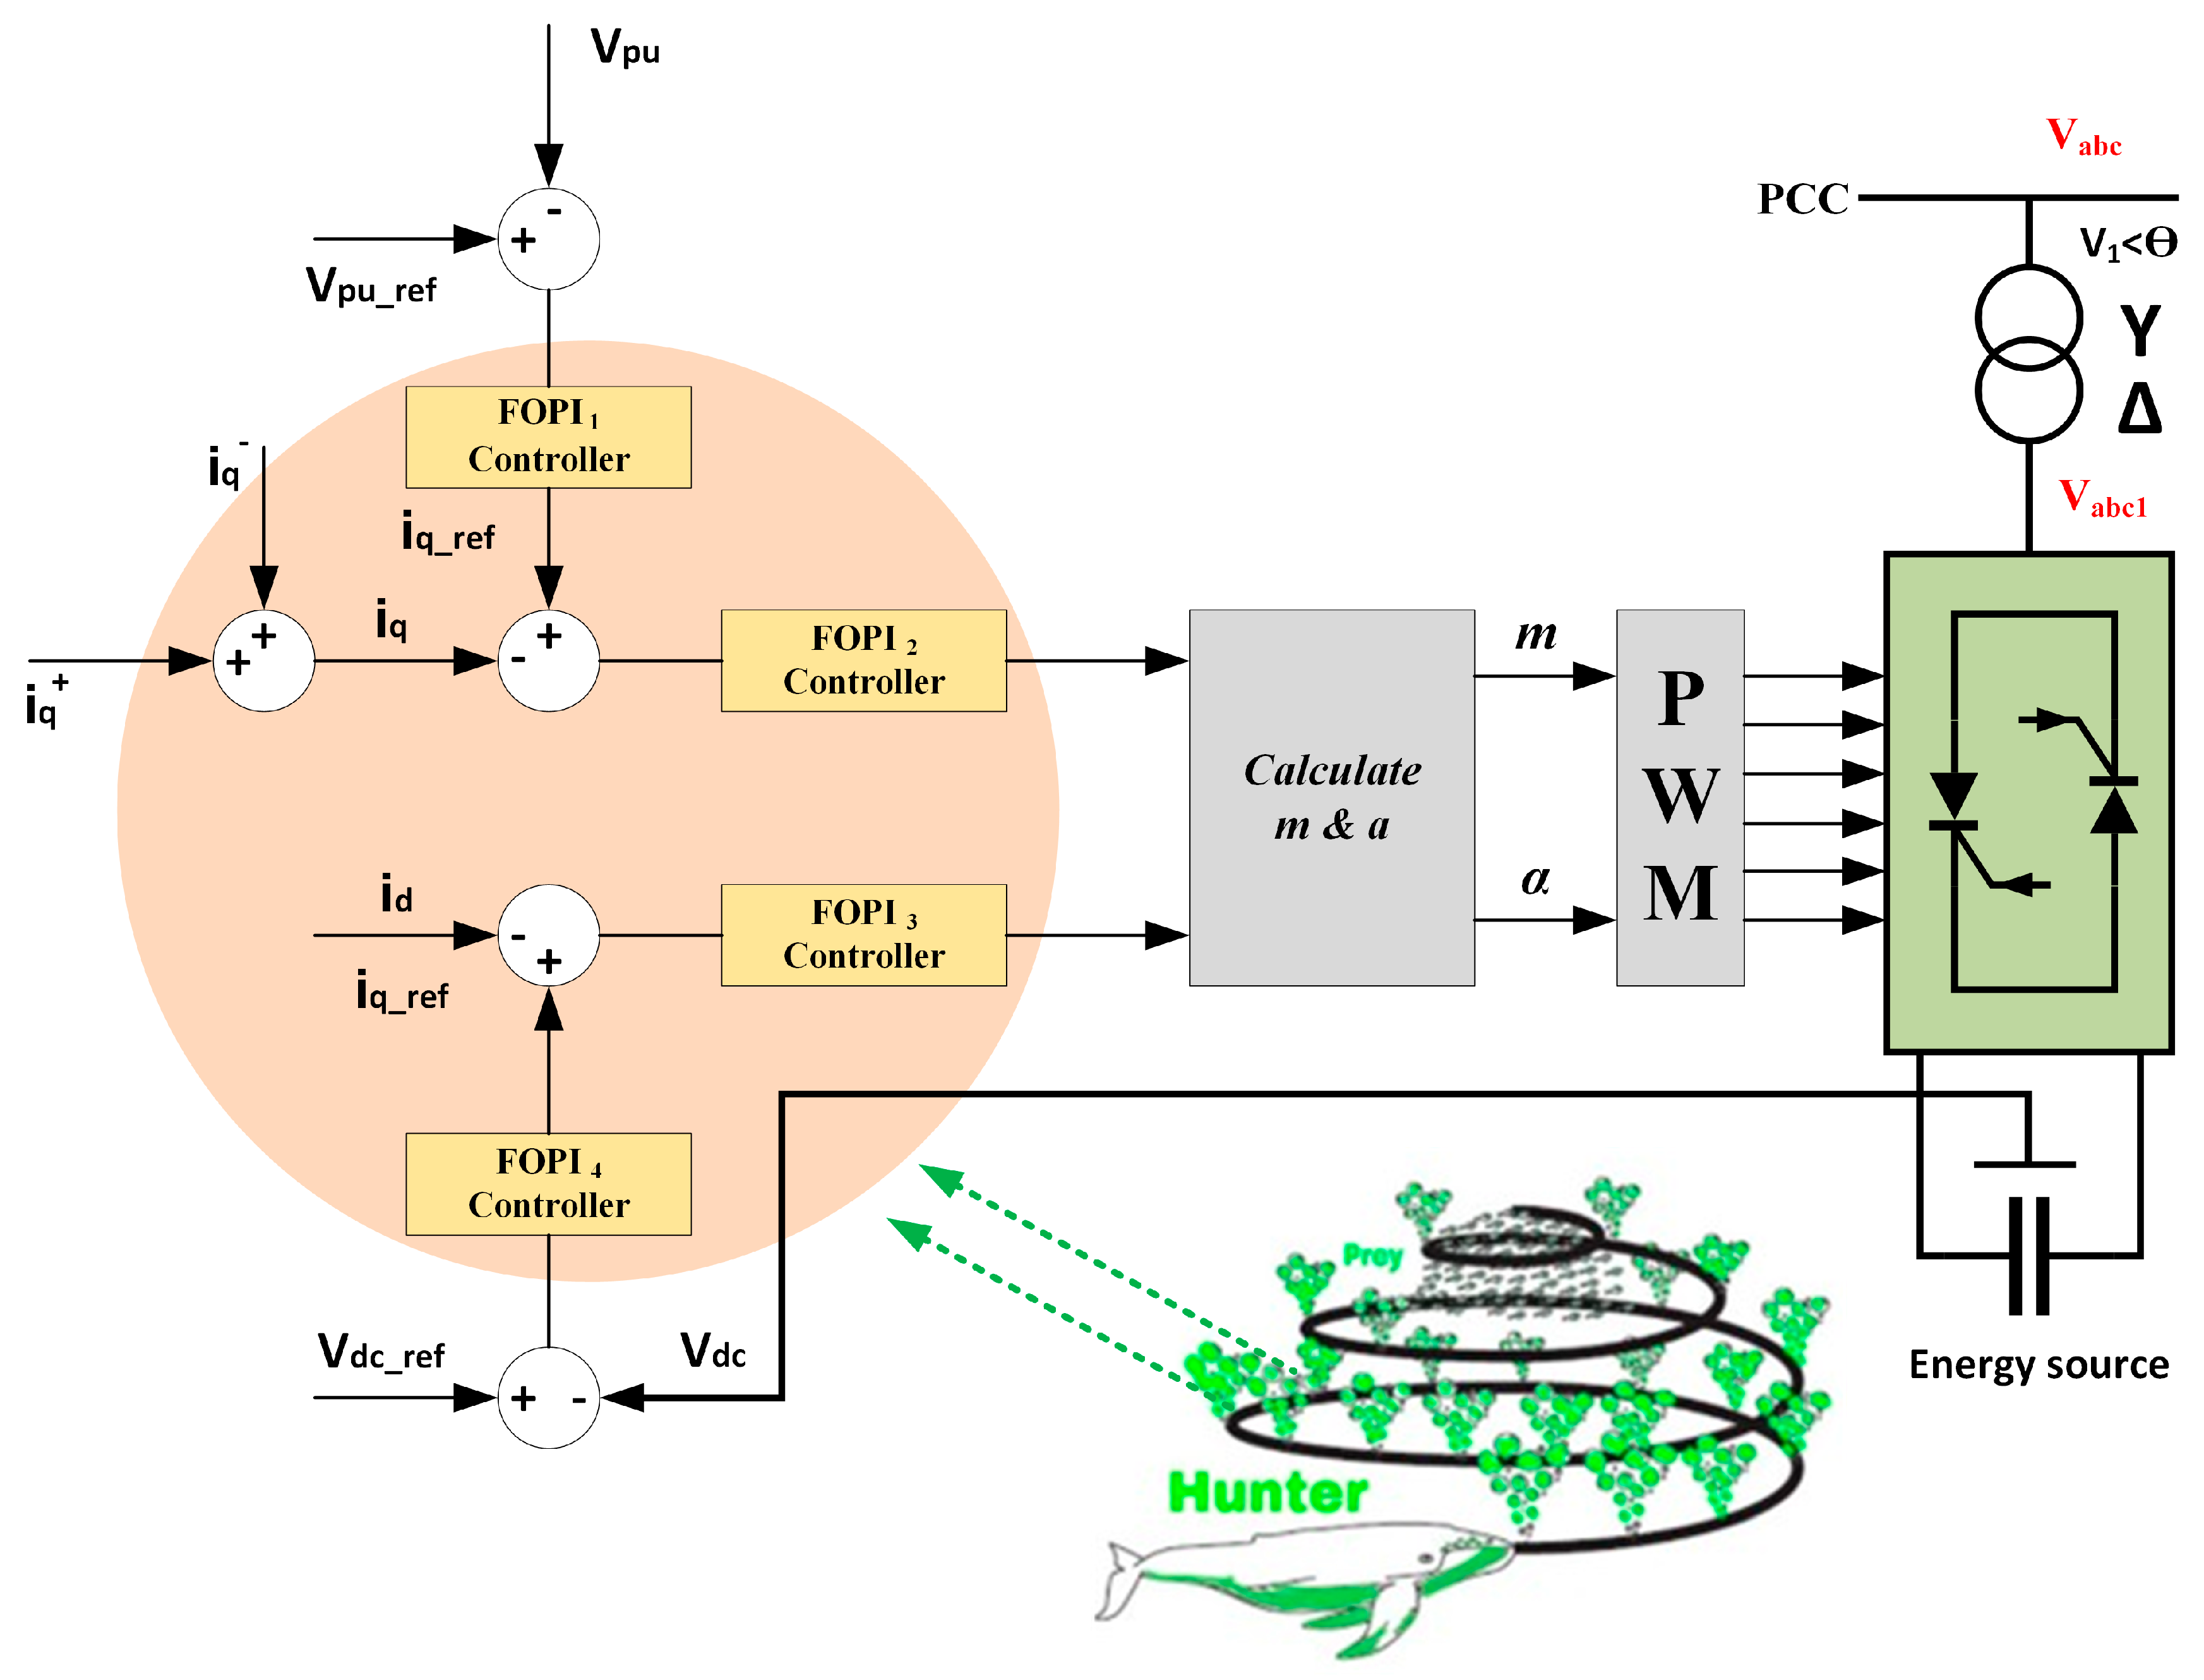
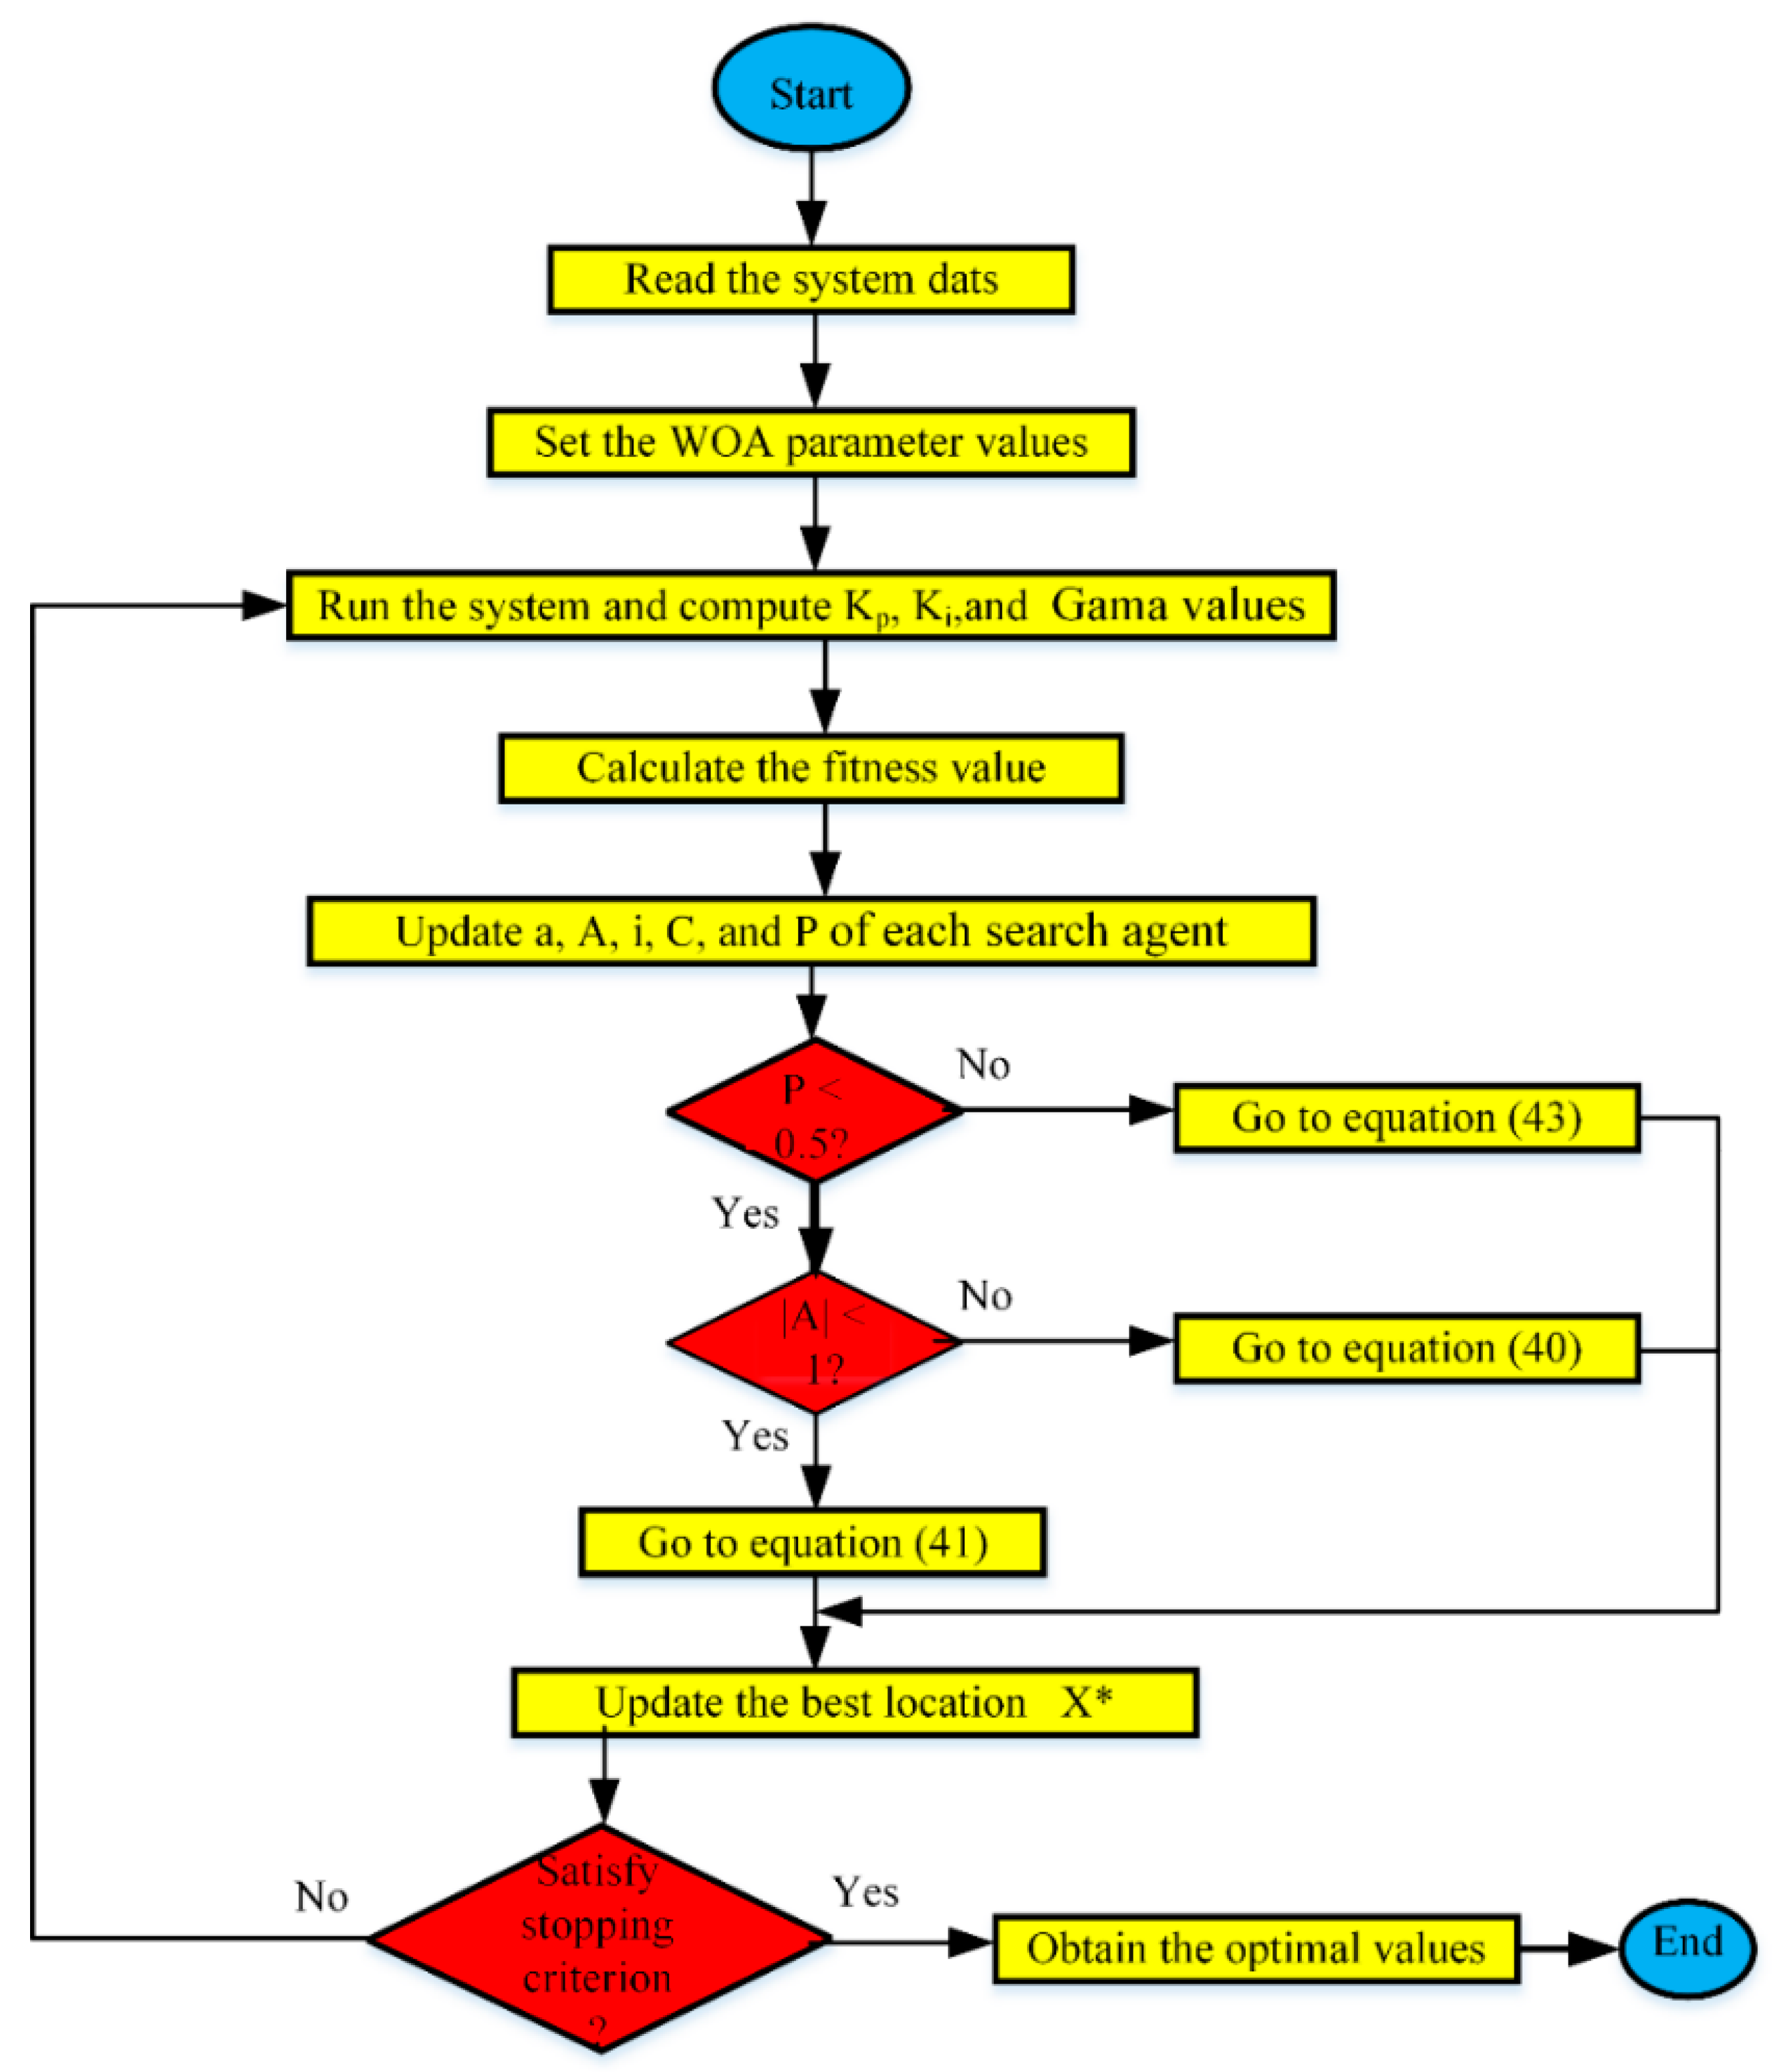
4.1. WOA Technique
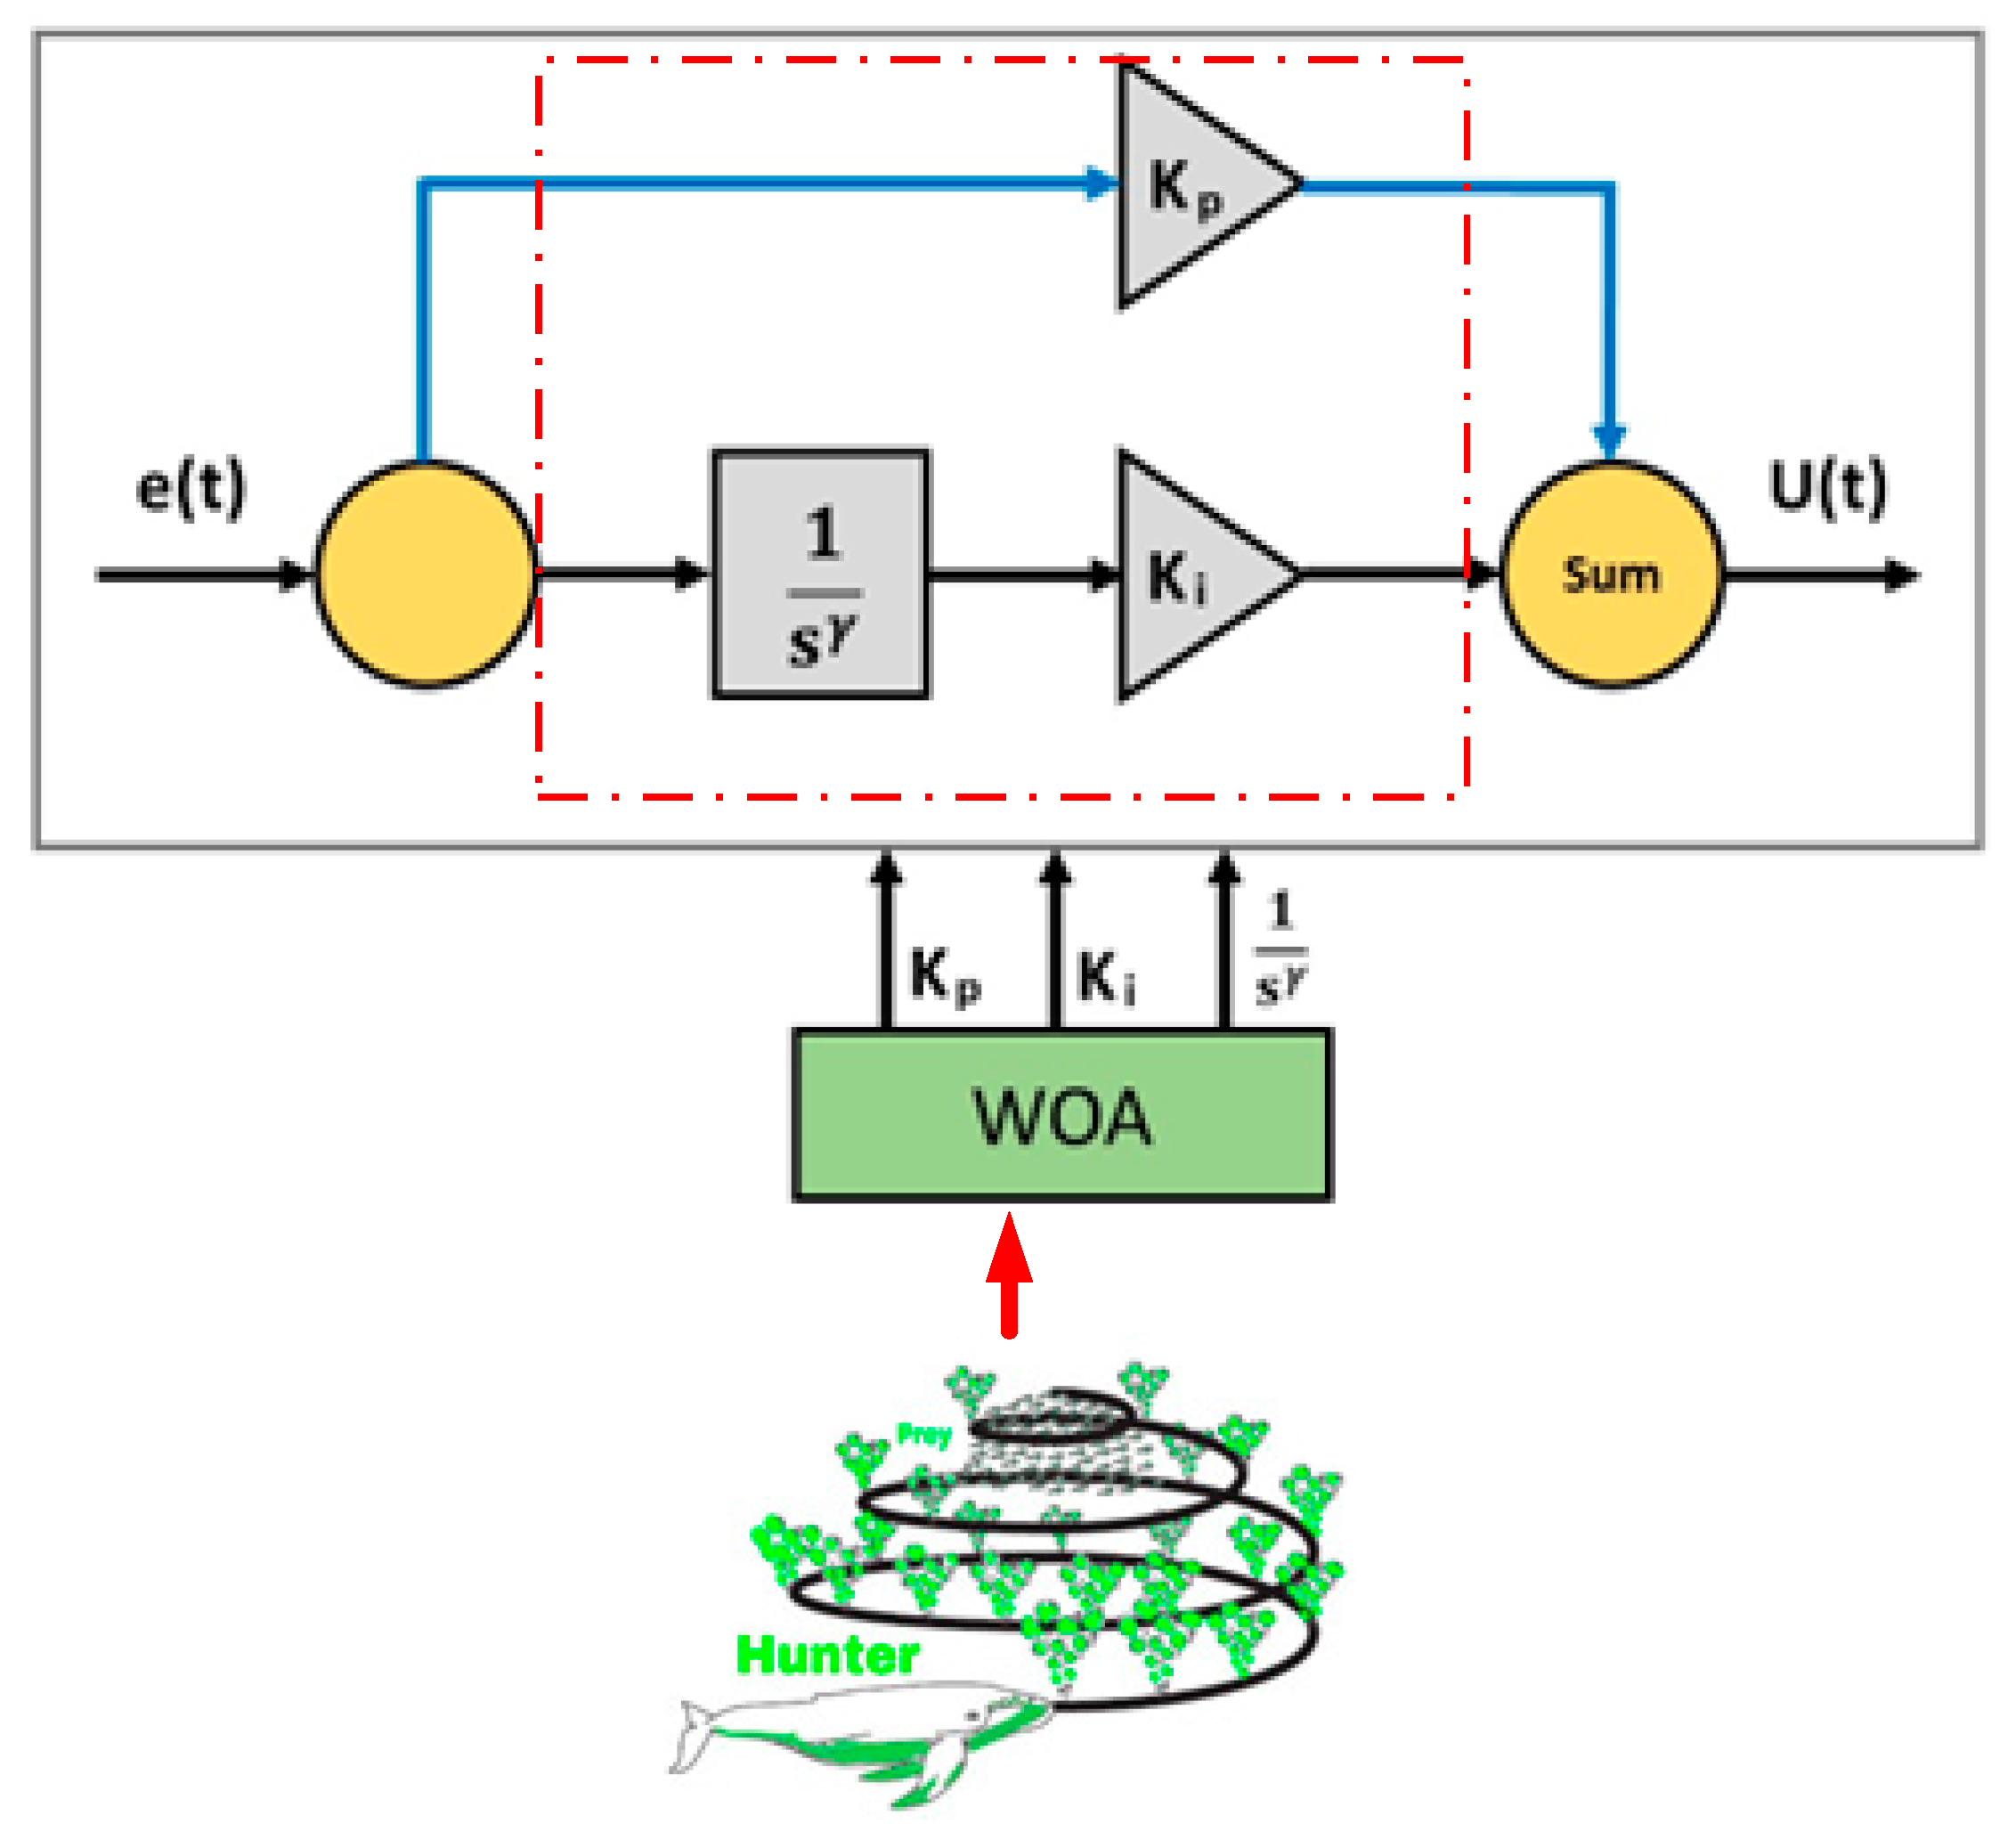
4.2. Application of FOPIC with WOA Technique
5. Simulated Results and Discussion
5.1. Application of the STATCOM
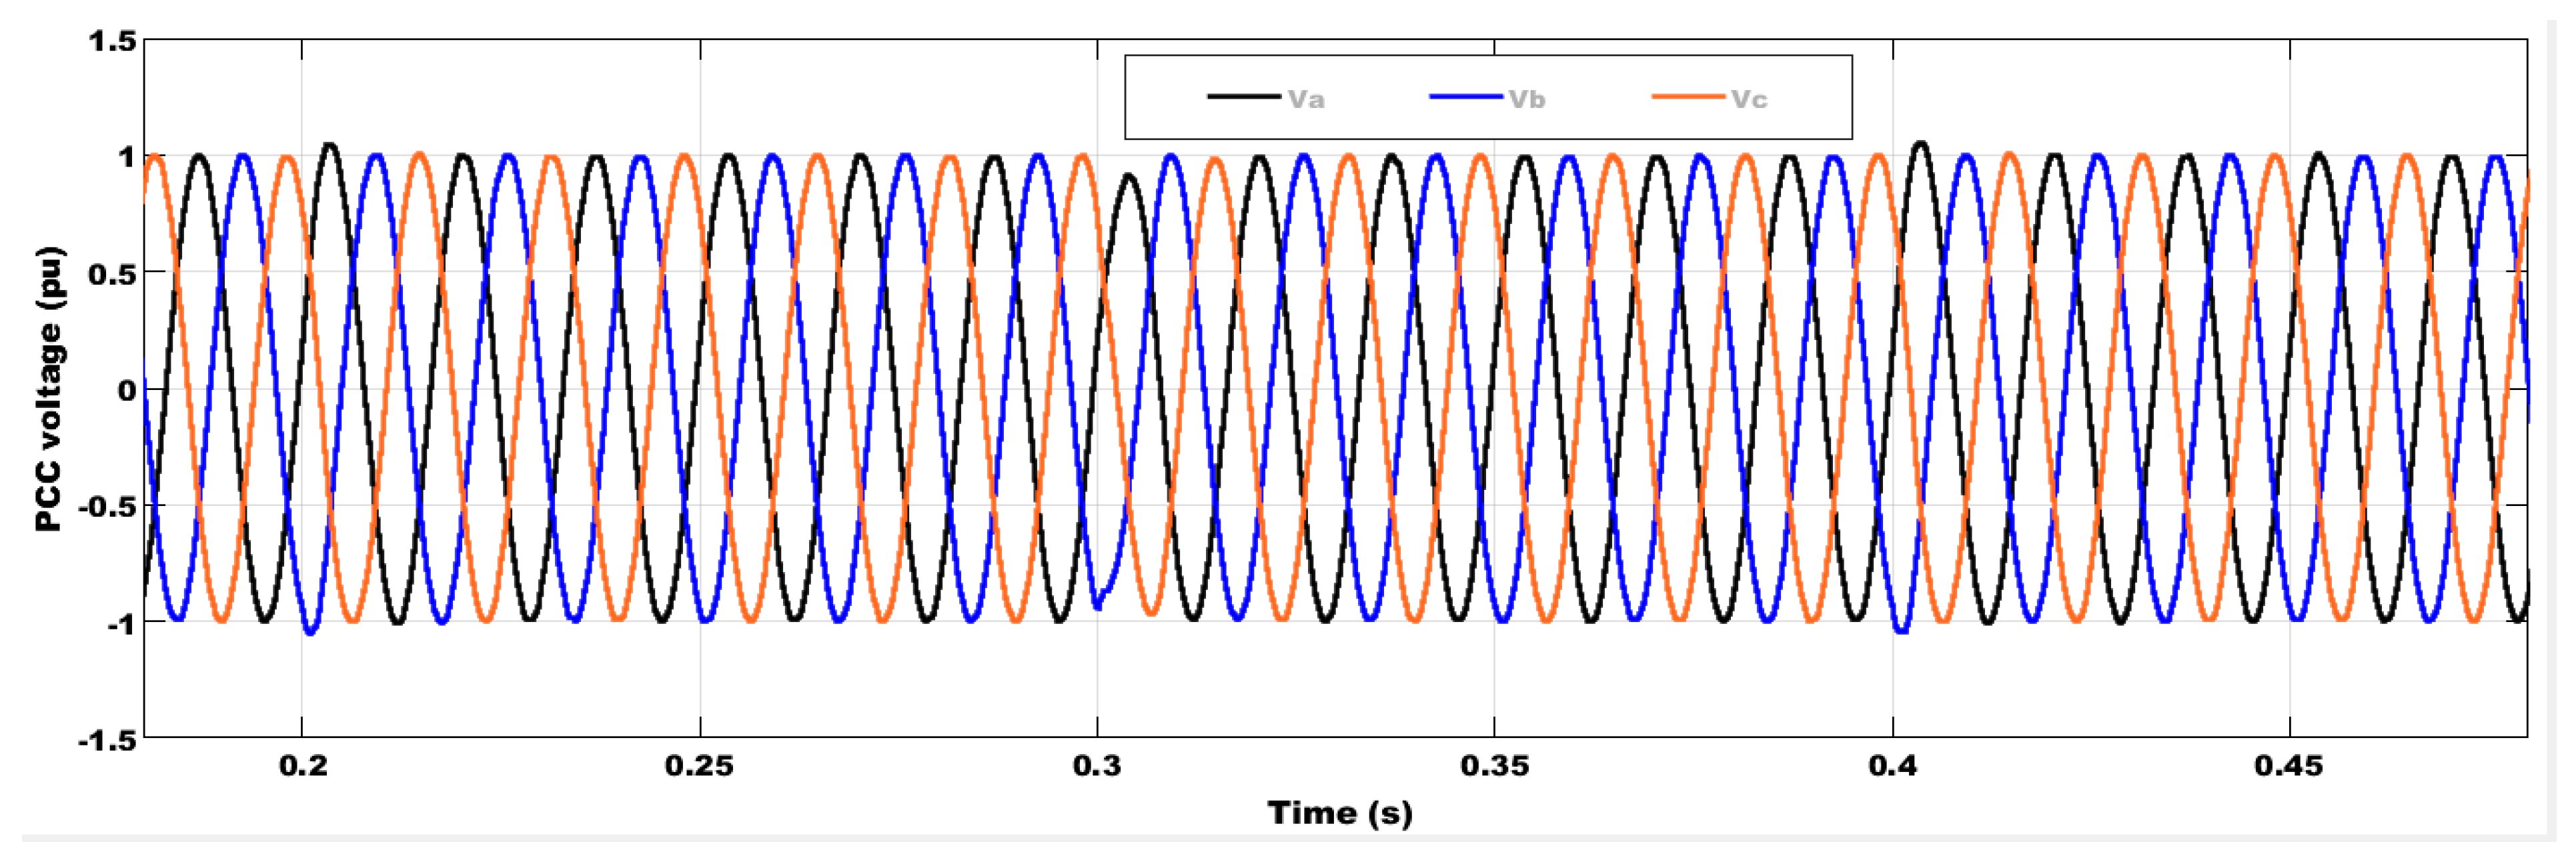
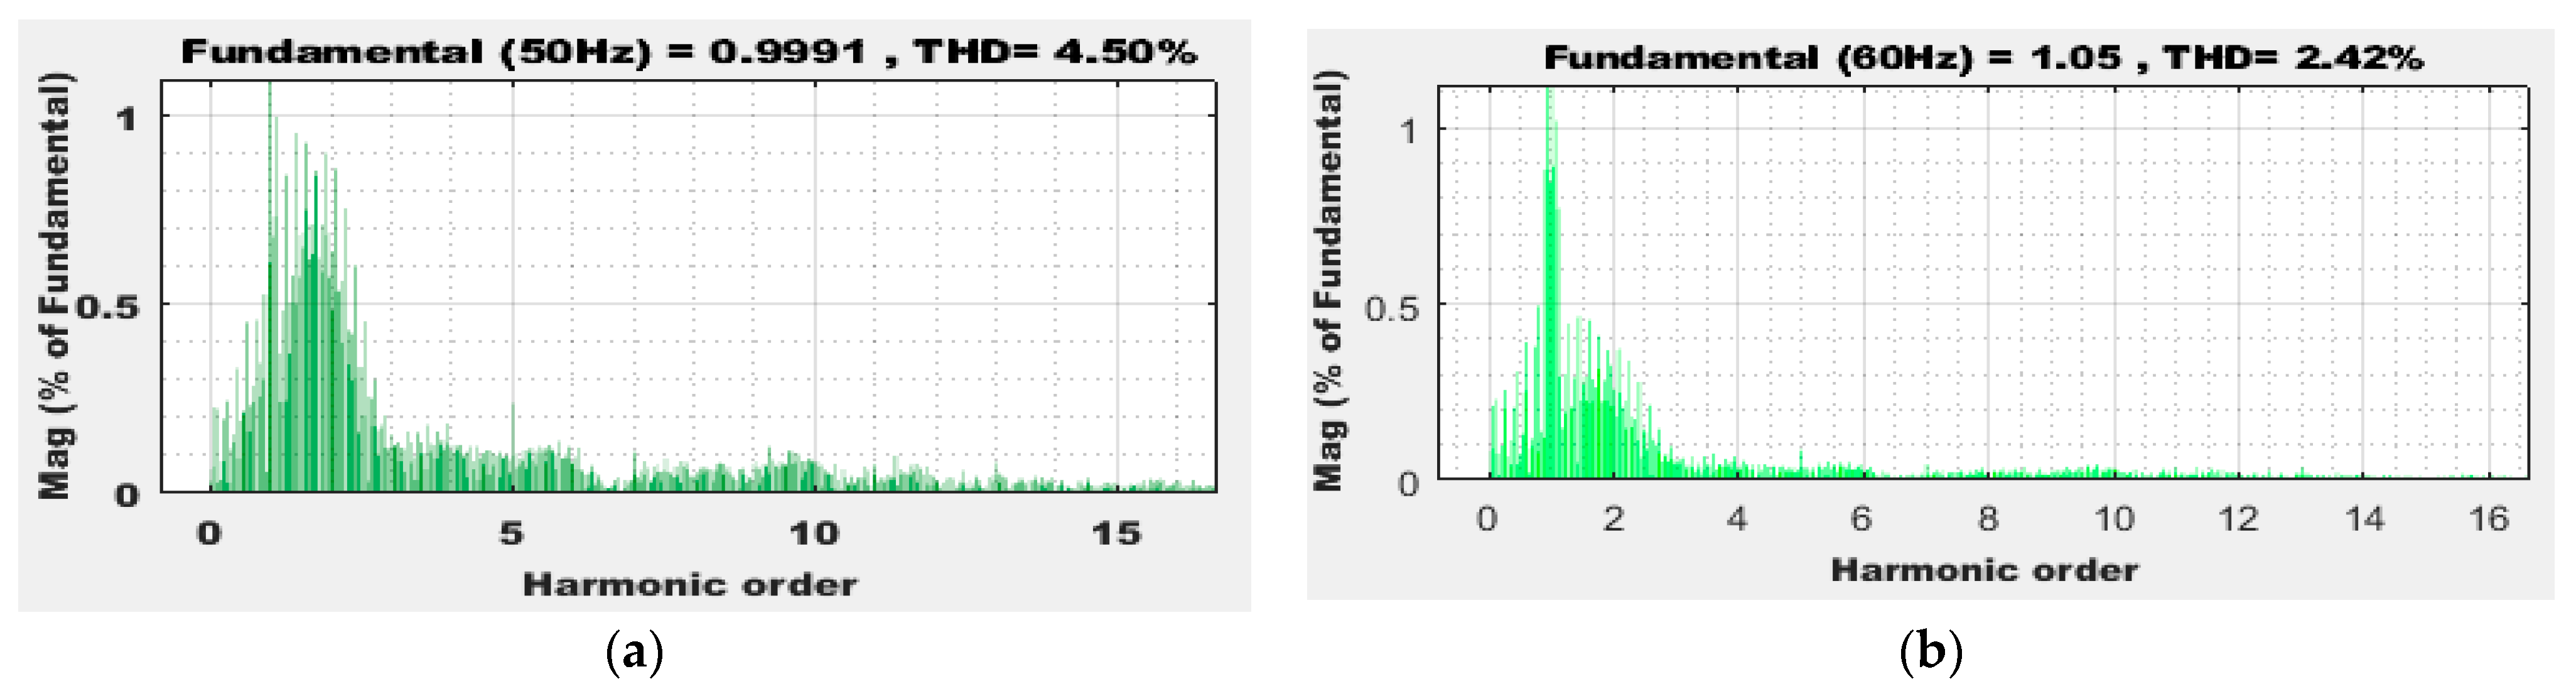
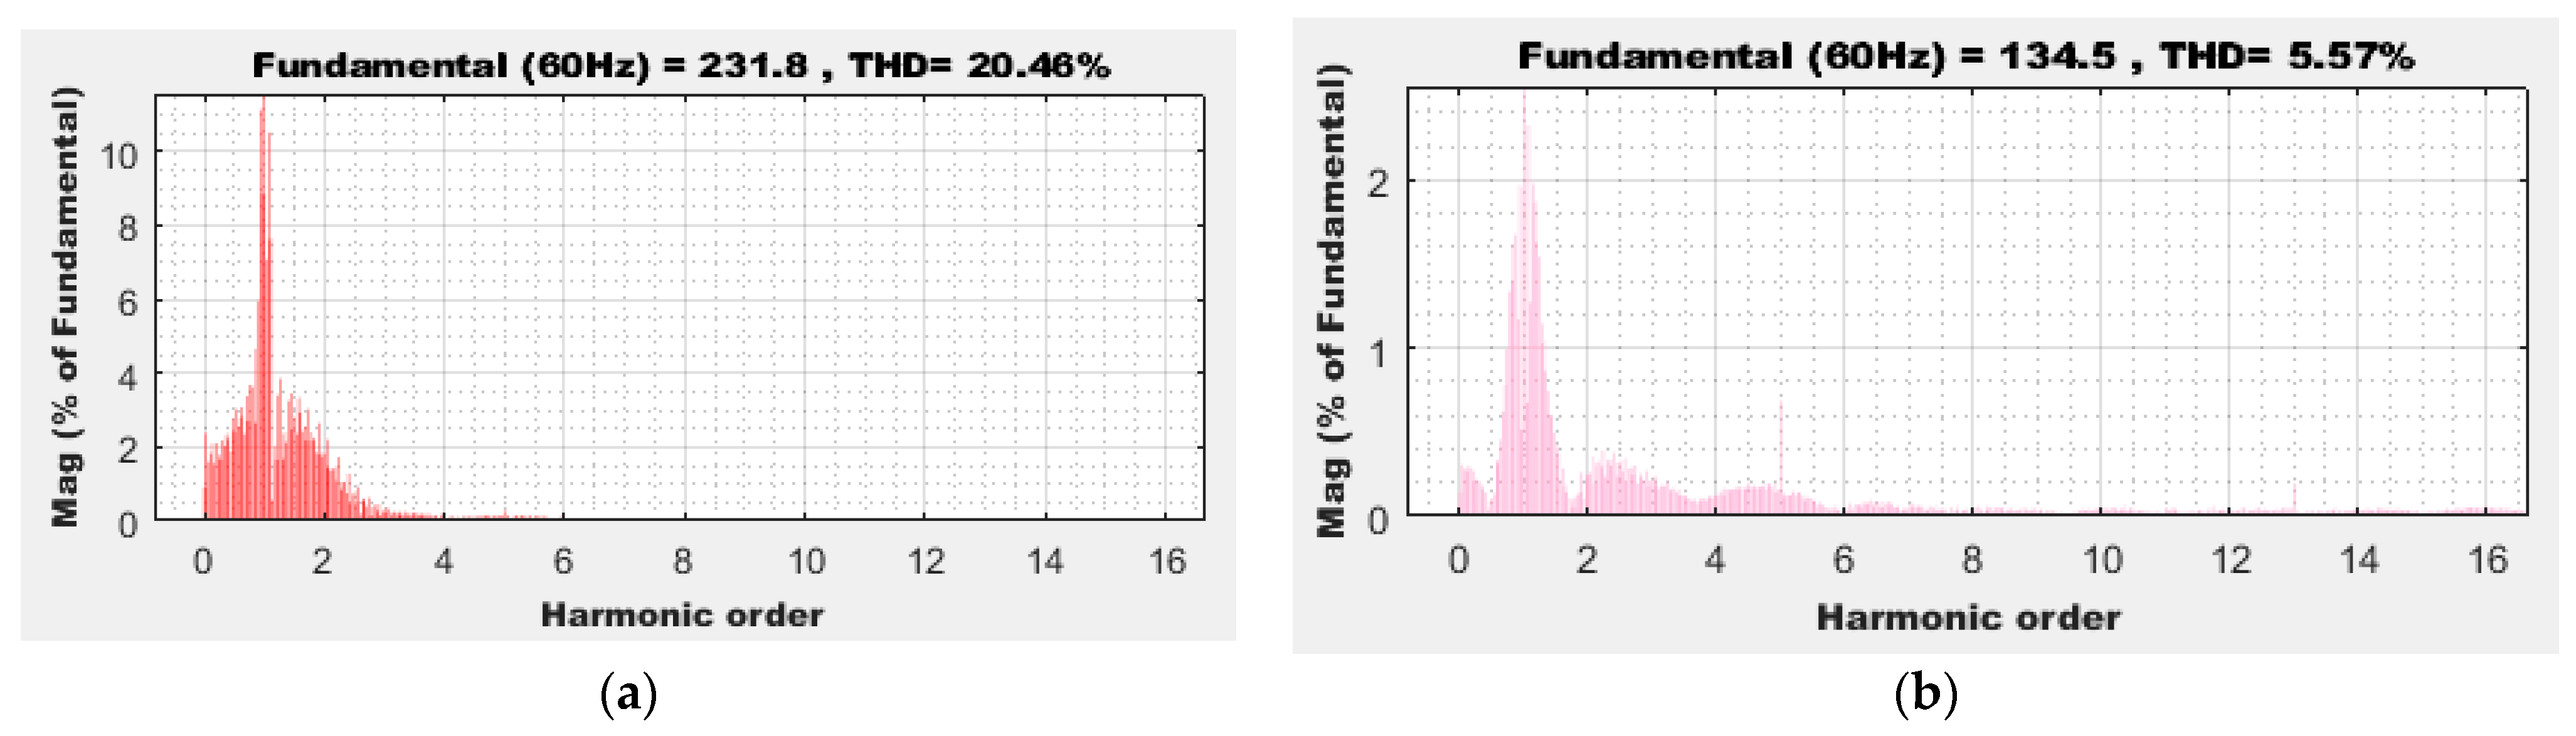
5.1.1. Scenario 1: Mitigation of Non-Linear Load (S1)
5.1.2. Scenario 2: Mitigation of 42% Penetration of Wind Energy (S2)
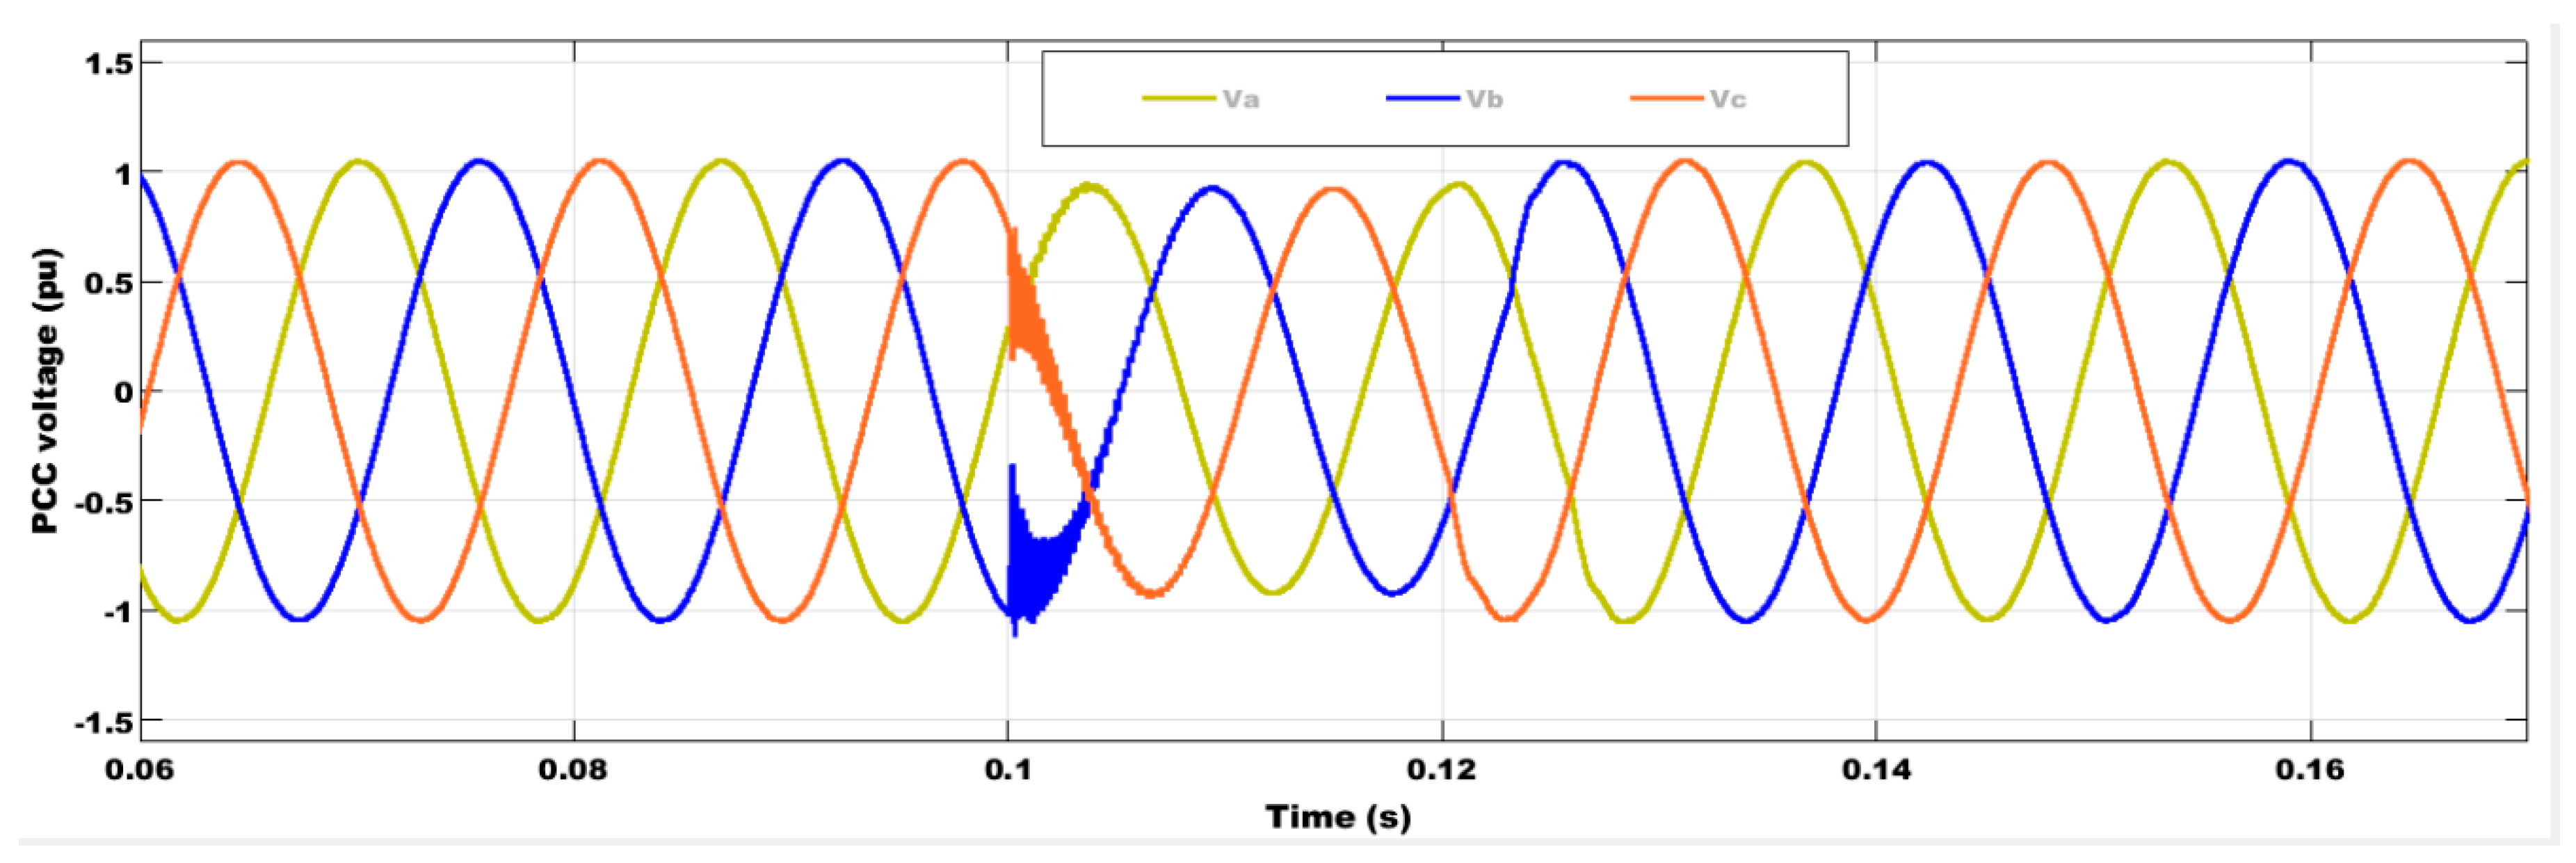
5.1.3. Scenario 3: Mitigation of Three-Phase to Ground Fault (S3)
5.2. Application of the UPQC
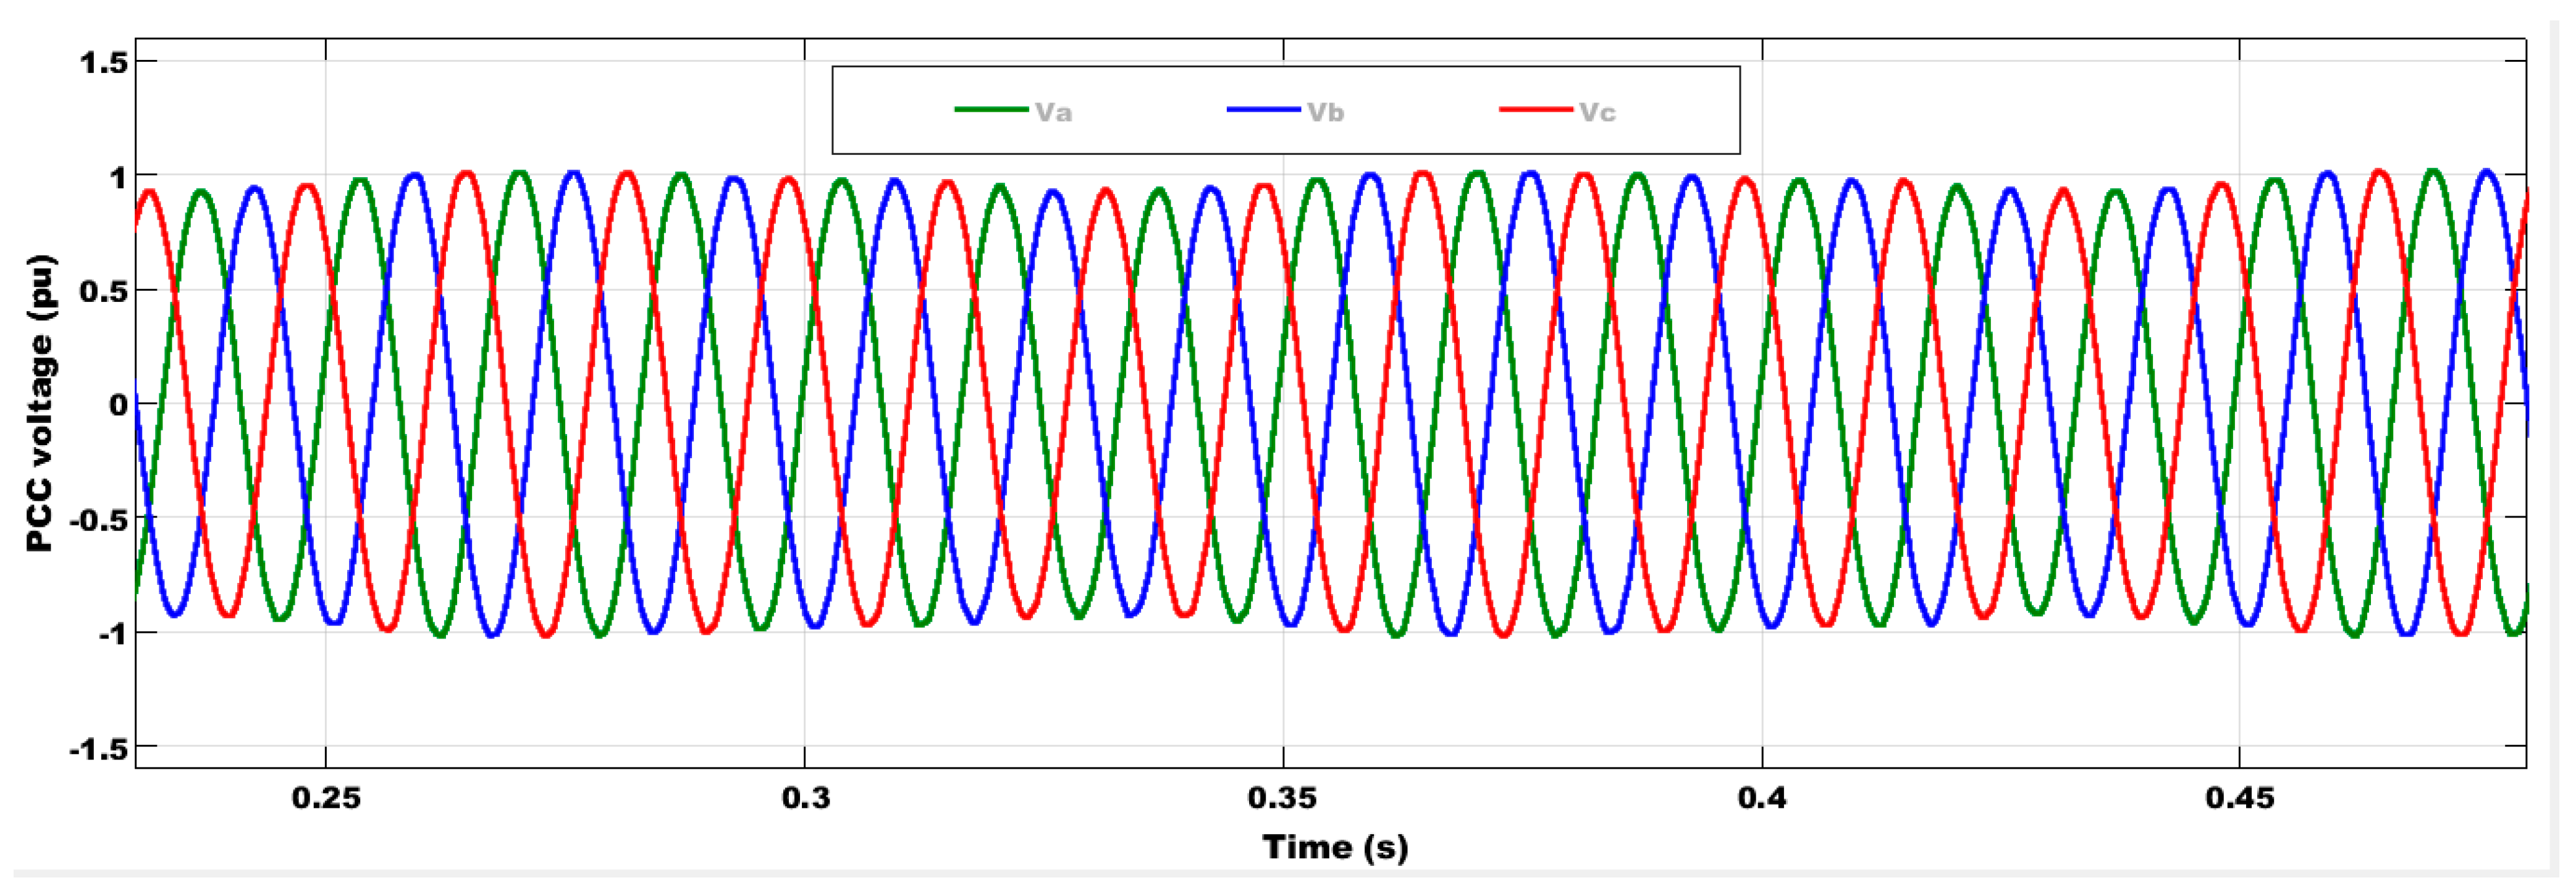
5.2.1. Scenario 1: Non-Linear Load (S1) Mitigation
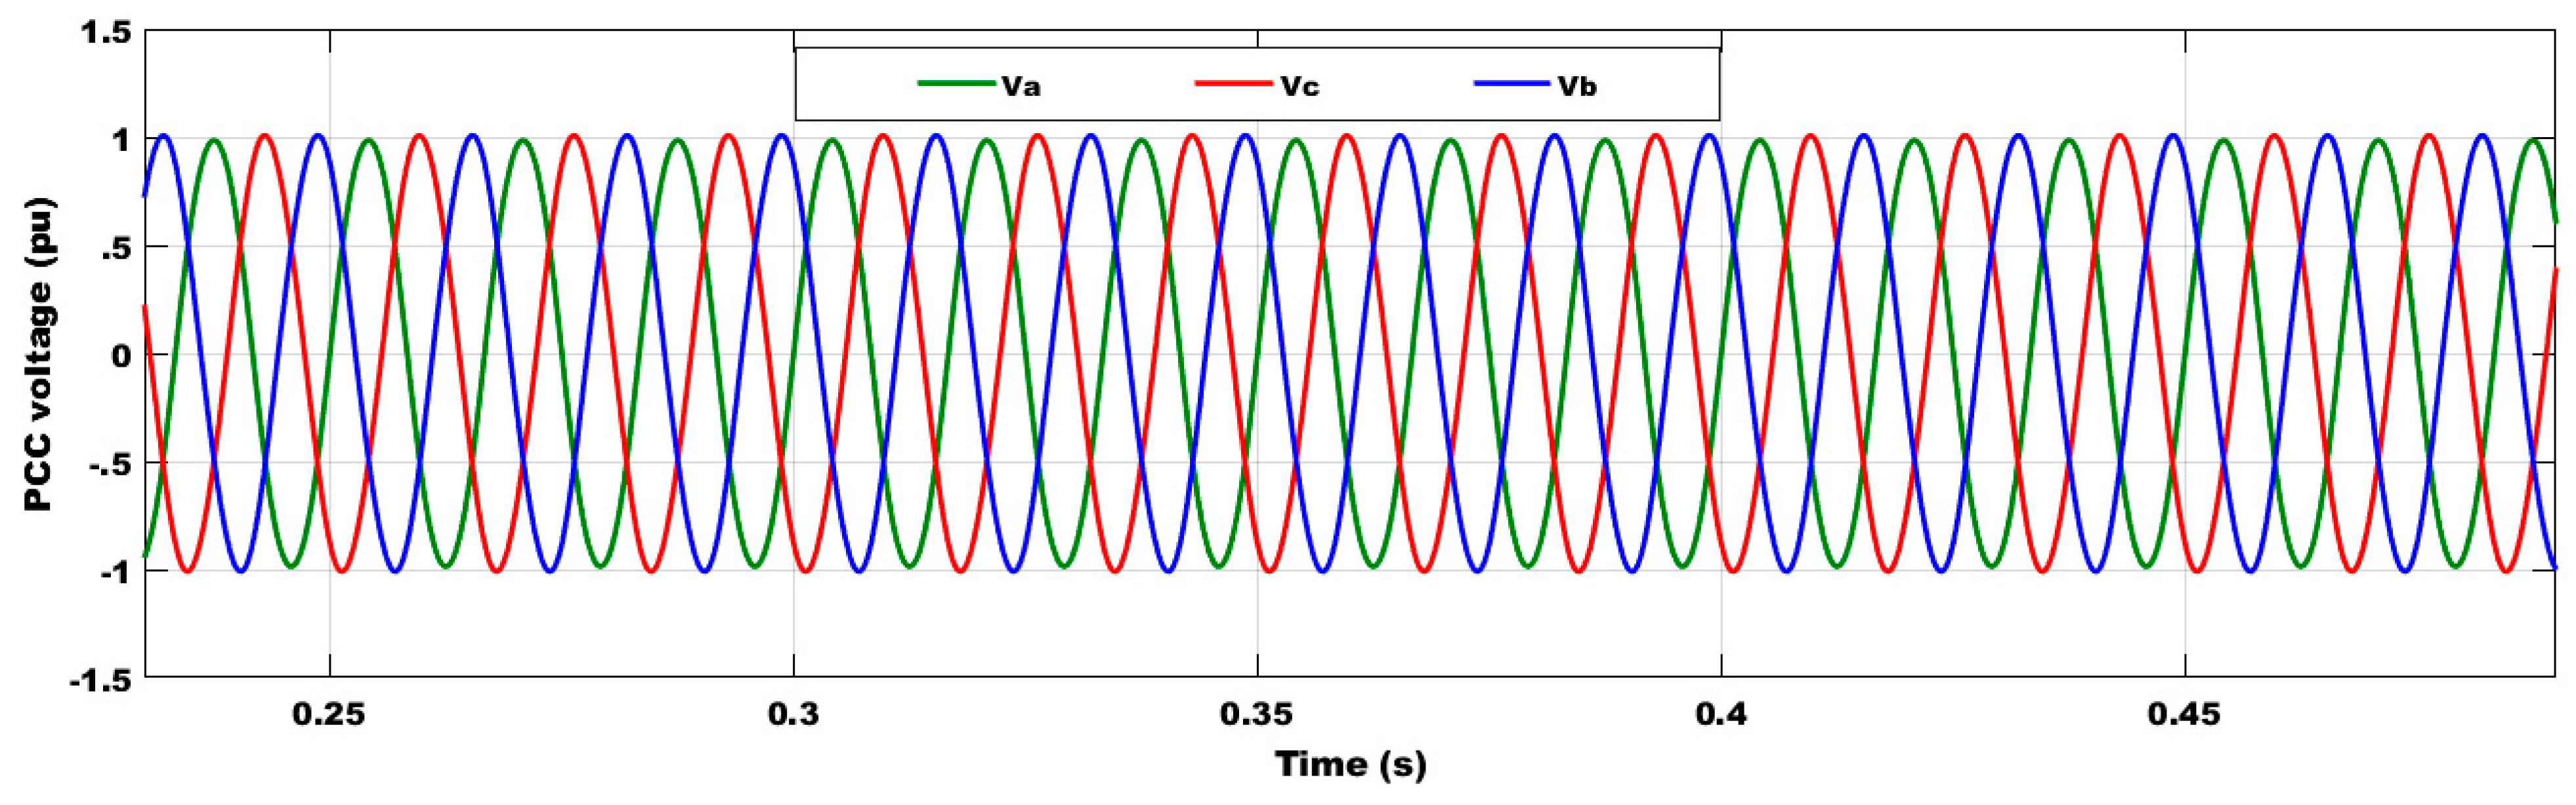
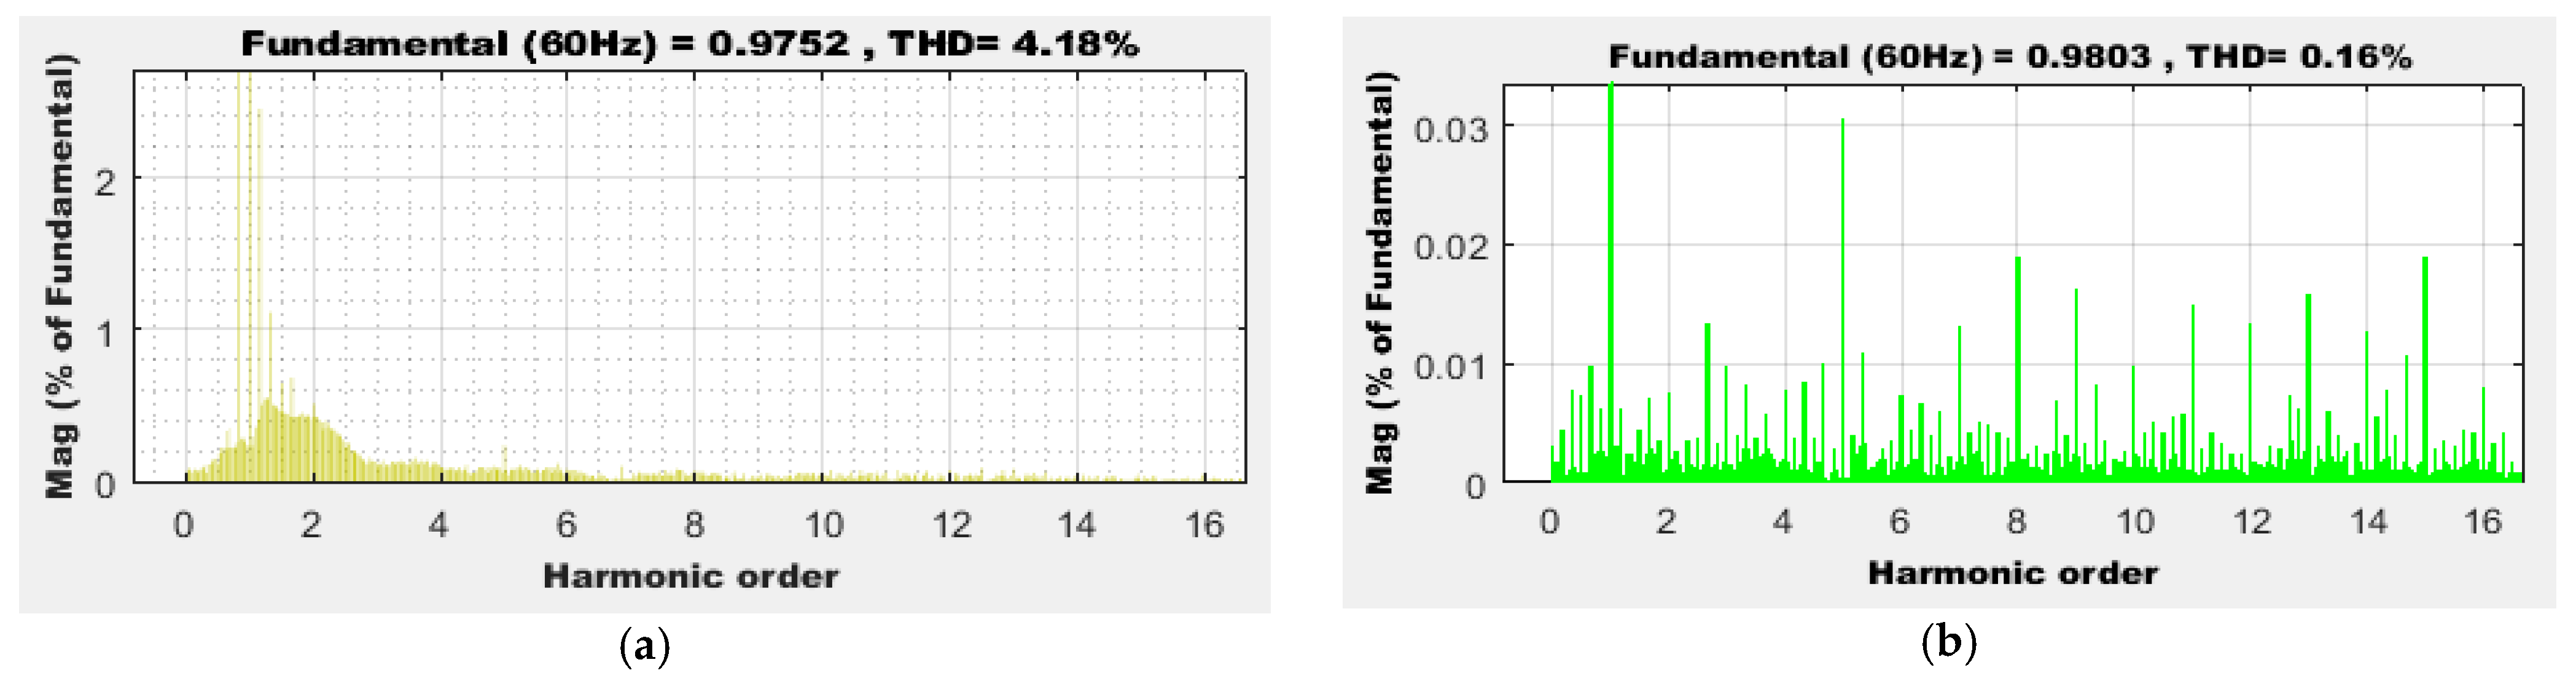
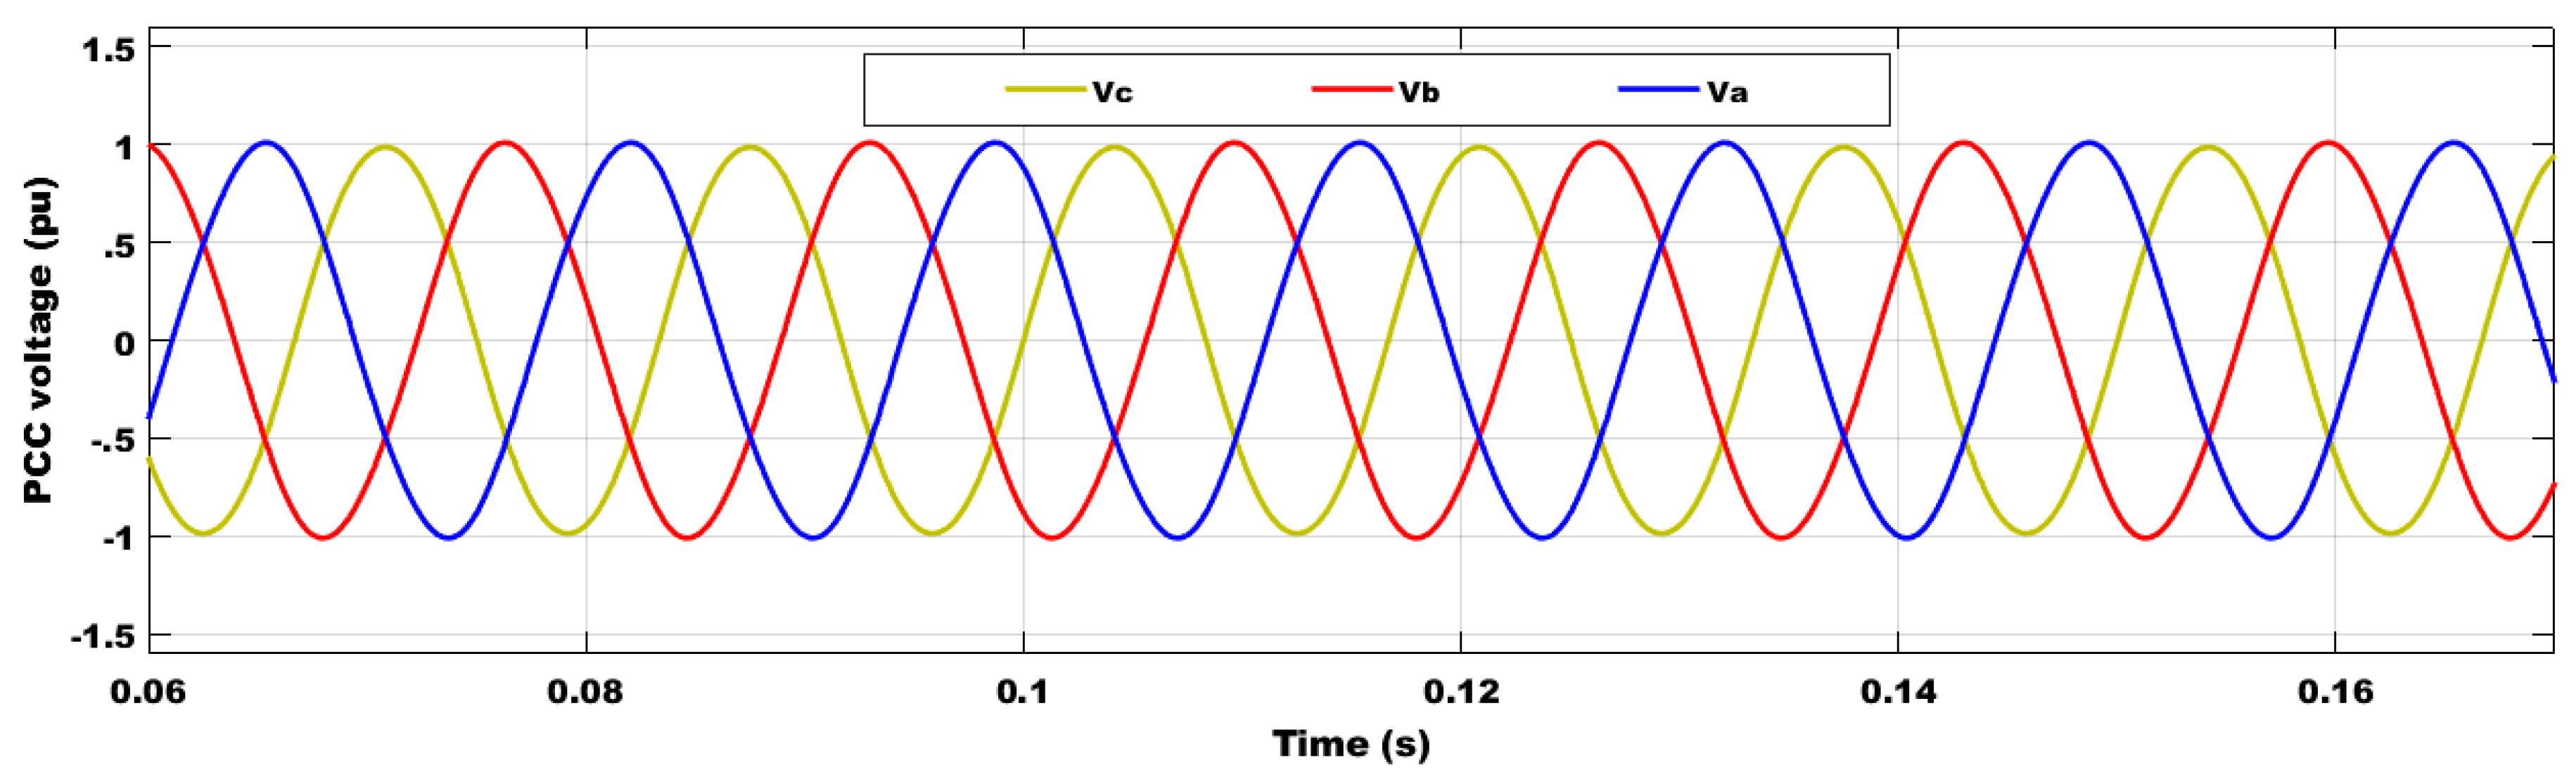
5.2.2. Scenario 2: 42% Penetration of Wind Energy (S2) Mitigation
5.2.3. Scenario 3: Three-Phase to Ground Fault (S3) Mitigation
6. Conclusions and Future Research Directions
- Comparing the wind generators under different penetration levels to show the best type for ensuring the studied system is more reliable with low THD.
- Applying new optimization methods to determine the optimal size of the integrated FACTS tools.
- Installing PV instead of a wind generator to show the best option for ensuring the studied system is more stable with low THD.
- Installing storage systems instead of FACTS in the studied system to show the best solution.
- Applying the developed FACTS tools to microgrids.
Author Contributions
Funding
Data Availability Statement
Acknowledgments
Conflicts of Interest
References
- Aljendy, R.; Nasyrov, R.R.; Abdelaziz, A.Y.; Diab, A.A.Z. Enhancement of Power Quality with Hybrid Distributed Generation and FACTS Device. IETE J. Res. 2019, 68, 2259–2270. [Google Scholar] [CrossRef]
- Mohamed, S.A.; Tolba, M.A.; Eisa, A.A.; El-Rifaie, A.M. Comprehensive Modeling and Control of Grid-Connected Hybrid Energy Sources Using MPPT Controller. Energies 2021, 14, 5142. [Google Scholar] [CrossRef]
- Reddy, C.R.; Goud, B.S.; Aymen, F.; Rao, G.S.; Bortoni, E.C. Power Quality Improvement in HRES Grid Connected System with FOPID Based Atom Search Optimization Technique. Energies 2021, 14, 5812. [Google Scholar] [CrossRef]
- Elmetwaly, A.H.; Younis, R.A.; Abdelsalam, A.A.; Omar, A.I.; Mahmoud, M.M.; Alsaif, F.; El-Shahat, A.; Saad, M.A. Modeling, Simulation, and Experimental Validation of a Novel MPPT for Hybrid Renewable Sources Integrated with UPQC: An Application of Jellyfish Search Optimizer. Sustainability 2023, 15, 5209. [Google Scholar] [CrossRef]
- Boudjemai, H.; Ardjoun, S.A.E.M.; Chafouk, H.; Denai, M.; Elbarbary, Z.M.S.; Omar, A.I.; Mahmoud, M.M. Application of a Novel Synergetic Control for Optimal Power Extraction of a Small-Scale Wind Generation System with Variable Loads and Wind Speeds. Symmetry 2023, 15, 369. [Google Scholar] [CrossRef]
- Singh, B.; Chandra, A.; Al-Haddad, K. Power Quality Problems and Mitigation Techniques; John Wiley and Sons: Hoboken, NJ, USA, 2015; Volume 9781118922. [Google Scholar] [CrossRef]
- Sankar, A.M.; Raju, T.D.; Kumar, M.V. DSP-based identification, classification and mitigation of power quality disturbances using UPQC. Int. J. Ambient. Energy 2020, 41, 41–49. [Google Scholar] [CrossRef]
- Li, B.-S.; Ge, Y.-M. Improving Power Quality by Smart Load. Energy Procedia 2012, 17, 813–817. [Google Scholar] [CrossRef] [Green Version]
- Mahmoud, M.M. Improved current control loops in wind side converter with the support of wild horse optimizer for enhancing the dynamic performance of PMSG-based wind generation system. Int. J. Model. Simul. 2022, 1–15. [Google Scholar] [CrossRef]
- Mahmoud, M.M.; Ratib, M.K.; Raglend, I.J.; Swaminathan, J.; Aly, M.M.; Abdel-Rahim, A.-M.M. Application of Grey Wolf Optimization for PMSG-Based WECS under Different Operating Conditions: Performance Assessment. In Proceedings of the 2021 Innovations in Power and Advanced Computing Technologies (i-PACT), Kuala Lumpur, Malaysia, 27–29 November 2021; pp. 1–7. [Google Scholar] [CrossRef]
- Monedero, I.; Leon, C.; García, A.; Elena, J.; Montañó, J.; Ropero, J. A real-time system for the generation and detection of electrical disturbances. In Series on Energy and Power Systems. In Proceedings of the IEEE PES Power Systems Conference and Exposition, New York, NY, USA, 10–13 October 2004; pp. 180–185. [Google Scholar] [CrossRef]
- Mahmoud, M.M.; Ratib, M.K.; Aly, M.M.; Abdel-Rahim, A.-M.M. Wind-driven permanent magnet synchronous generators connected to a power grid: Existing perspective and future aspects. Wind. Eng. 2021, 46, 189–199. [Google Scholar] [CrossRef]
- Mahmoud, M.M.; Atia, B.S.; Abdelaziz, A.Y.; Aldin, N.A.N. Dynamic Performance Assessment of PMSG and DFIG-Based WECS with the Support of Manta Ray Foraging Optimizer Considering MPPT, Pitch Control, and FRT Capability Issues. Processe 2022, 12, 2723. [Google Scholar]
- Mahmoud, M.M.; Aly, M.M.; Abdel-Rahim, A.-M.M. Enhancing the dynamic performance of a wind-driven PMSG implementing different optimization techniques. SN Appl. Sci. 2020, 2, 684. [Google Scholar] [CrossRef] [Green Version]
- Mahmoud, M.M.; Salama, H.S.; Aly, M.M.; Abdel-Rahim, A.-M.M. Design and implementation of FLC system for fault ride-through capability enhancement in PMSG-wind systems. Wind. Eng. 2021, 45, 1361–1373. [Google Scholar] [CrossRef]
- Devadason, J.; Moses, P.S.; Masoum, M.A.S. Stability Domain Analysis and Enhancement of Squirrel Cage Induction Generator Wind Turbines in Weak Grids. Energies 2021, 14, 4786. [Google Scholar] [CrossRef]
- Jamil, E.; Hameed, S.; Jamil, B. Qurratulain Power quality improvement of distribution system with photovoltaic and permanent magnet synchronous generator based renewable energy farm using static synchronous compensator. Sustain. Energy Technol. Assessments 2019, 35, 98–116. [Google Scholar] [CrossRef]
- Meral, M.E.; Çelik, D. DSOGI-PLL Based Power Control Method to Mitigate Control Errors Under Disturbances of Grid Connected Hybrid Renewable Power Systems. Adv. Electr. Electron. Eng. 2018, 16, 81–91. [Google Scholar] [CrossRef]
- Pang, M.; Shi, Y.; Wang, W.; Pang, S. Optimal sizing and control of hybrid energy storage system for wind power using hybrid Parallel PSO-GA algorithm. Energy Explor. Exploit. 2019, 37, 558–578. [Google Scholar] [CrossRef] [Green Version]
- Zarkani, M.K.; Tukkee, A.S.; Alali, M.J. Optimal placement of facts devices to reduce power system losses using evolutionary algorithm. Indones. J. Electr. Eng. Comput. Sci. 2021, 21, 1271–1278. [Google Scholar] [CrossRef]
- Mahmoud, M.M.; Atia, B.S.; Esmail, Y.M.; Bajaj, M.; Wapet, D.E.M.; Ratib, M.K.; Hossain, B.; AboRas, K.M.; Abdel-Rahim, A.-M.M. Evaluation and Comparison of Different Methods for Improving Fault Ride-Through Capability in Grid-Tied Permanent Magnet Synchronous Wind Generators. Int. Trans. Electr. Energy Syst. 2023, 2023, 7717070. [Google Scholar] [CrossRef]
- Mahmoud, M.M.; Esmail, Y.M.; Atia, B.S.; Kamel, O.M.; AboRas, K.M.; Bajaj, M.; Bukhari, S.S.H.; Wapet, D.E.M. Voltage Quality Enhancement of Low-Voltage Smart Distribution System Using Robust and Optimized DVR Controllers: Application of the Harris Hawks Algorithm. Int. Trans. Electr. Energy Syst. 2022, 2022, 4242996. [Google Scholar] [CrossRef]
- Mohod, S.W.; Aware, M.V. A STATCOM-Control Scheme for Grid Connected Wind Energy System for Power Quality Improvement. IEEE Syst. J. 2010, 4, 346–352. [Google Scholar] [CrossRef]
- Qi, J.; Zhao, W.; Bian, X. Comparative Study of SVC and STATCOM Reactive Power Compensation for Prosumer Microgrids With DFIG-Based Wind Farm Integration. IEEE Access 2020, 8, 209878–209885. [Google Scholar] [CrossRef]
- George, S.K.; Chacko, F.M. Comparison of different control strategies of STATCOM for power quality improvement of grid connected wind energy system. In Proceedings of the 2013 International Mutli Conference on Automation, Computing, Communication, Control and Compressed Sensing (iMac4s), Kottayam, India, 22–23 March 2013; pp. 650–655. [Google Scholar] [CrossRef]
- Mahmoud, M.M.; Salama, H.S.; Bajaj, M.; Aly, M.M.; Vokony, I.; Bukhari, S.S.H.; Wapet, D.E.M.; Abdel-Rahim, A.-M.M. Integration of Wind Systems with SVC and STATCOM during Various Events to Achieve FRT Capability and Voltage Stability: Towards the Reliability of Modern Power Systems. Int. J. Energy Res. 2023, 2023, 8738460. [Google Scholar] [CrossRef]
- Fayek, A.; Salimullah, S.M.; Hossain, S.; Hossain, R.; Shakib, S.H.; Anik, A.I.; Khan, M.H. STATCOM and PID Controller Based Stability Enhancement of a Grid Connected Wind Farm. In Proceedings of the 2019 International Conference on Energy and Power Engineering (ICEPE), Dhaka, Bangladesh, 14–16 March 2019; pp. 1–4. [Google Scholar] [CrossRef]
- Kamel, O.M.; Diab, A.A.Z.; Mahmoud, M.M.; Al-Sumaiti, A.S.; Sultan, H.M. Performance Enhancement of an Islanded Microgrid with the Support of Electrical Vehicle and STATCOM Systems. Energies 2023, 16, 1577. [Google Scholar] [CrossRef]
- Kulkarni, H.R.; Virulkar, V.B. Mitigation of flicker in a distribution-connected wind farm with STATCOM. In Proceedings of the 2017 International Conference on Energy, Communication, Data Analytics and Soft Computing, ICECDS, Chennai, India, 1–2 August 2018; pp. 2208–2212. [Google Scholar] [CrossRef]
- Sreenivasarao, D.; Agarwal, P.; Das, B. Performance enhancement of a reduced rating hybrid D-STATCOM for three-phase, four-wire system. Electr. Power Syst. Res. 2013, 97, 158–171. [Google Scholar] [CrossRef]
- Rezaeipour, R.; Kiani, B. Review of novel control techniques for STATCOM and its effects on a wind farm. In Proceedings of the 2009 International Conference on Sustainable Power Generation and Supply, Nanjing, China, 6–7 April 2009; pp. 1–5. [Google Scholar] [CrossRef]
- Madhusudan, R.; Rao, G.R. Modeling and simulation of a distribution STATCOM (D-STATCOM) for power quality problems-voltage sag and swell based on Sinusoidal Pulse Width Modulation (SPWM). In Proceedings of the IEEE-International Conference on Advances in Engineering, Science and Management, ICAESM-2012, Tamil Nadu, India, 30–31 March 2012; pp. 436–441. [Google Scholar]
- Paramanik, S.; Sarker, K.; Chatterjee, D.; Goswami, S. Smart Grid Power Quality Improvement Using Modified UPQC. In Proceedings of the 2019 Devices for Integrated Circuit (DevIC), Kalyani, India, 23–24 March 2019; pp. 356–360. [Google Scholar] [CrossRef]
- Khadkikar, V.; Chandra, A. A Novel Structure for Three-Phase Four-Wire Distribution System Utilizing Unified Power Quality Conditioner (UPQC). IEEE Trans. Ind. Appl. 2009, 45, 1897–1902. [Google Scholar] [CrossRef]
- Diab, M.; El-Habrouk, M.; Abdelhamid, T.H.; Deghedie, S. Survey of Active Power Filters Configurations. In Proceedings of the 2018 IEEE International Conference on System, Computation, Automation and Networking (ICSCA), Pondicherry, India, 6–7 July 2018; pp. 1–14. [Google Scholar] [CrossRef]
- Ye, J.; Gooi, H.B.; Wu, F. Optimal Design and Control Implementation of UPQC Based on Variable Phase Angle Control Method. IEEE Trans. Ind. Inform. 2018, 14, 3109–3123. [Google Scholar] [CrossRef]
- Gade, S.; Agrawal, R.; Munje, R. Recent Trends in Power Quality Improvement: Review of the Unified Power Quality Conditioner. ECTI Trans. Electr. Eng. Electron. Commun. 2021, 19, 268–288. [Google Scholar] [CrossRef]
- Khadkikar, V. Enhancing Electric Power Quality Using UPQC: A Comprehensive Overview. IEEE Trans. Power Electron. 2012, 27, 2284–2297. [Google Scholar] [CrossRef]
- Osaloni, O.O.; Saha, A.K. Voltage Dip/Swell Mitigation and Imaginary Power Compensation in Low Voltage Distribution Utilizing Improved Unified Power Quality Conditioner (I-UPQC). Int. J. Eng. Res. Afr. 2020, 49, 84–103. [Google Scholar] [CrossRef]
- Mahmoud, M.M.; Hemeida, A.M.; Senjy, T.; Ewais, A.M. Fault Ride-Through Capability Enhancement for Grid-Connected Permanent Magnet Synchronous Generator Driven by Wind Turbines. In Proceedings of the 2019 IEEE Conference on Power Electronics and Renewable Energy (CPERE), Aswan, Egypt, 23–25 October 2019; pp. 567–572. [Google Scholar] [CrossRef]
- Singh, K.; Mishra, S.; Kumar, M.N. A Review on Power Management and Power Quality for Islanded PV Microgrid in Smart Village. Indian J. Sci. Technol. 2017, 10, 1–4. [Google Scholar] [CrossRef]
- Ceaki, O.; Seritan, G.; Vatu, R.; Mancasi, M. Analysis of power quality improvement in smart grids. In Proceedings of the 2017 10th International Symposium on Advanced Topics in Electrical Engineering (ATEE), Bucharest, Romania, 23–25 March 2017; pp. 797–801. [Google Scholar] [CrossRef]
- Johnson, D.O. Issues of Power Quality in Electrical Systems. Int. J. Energy Power Eng. 2016, 5, 148. [Google Scholar] [CrossRef]
- Bagdadee, A.H.; Zhang, L. Power Quality improvement provide Digital Economy by the Smart Grid. IOP Conf. Series Mater. Sci. Eng. 2019, 561, 012097. [Google Scholar] [CrossRef] [Green Version]
- Jolhe, S.P.; Karalkar, M.D.; Dhomane, G.A. Smart grid and power quality (PQ) issues. In Proceedings of the 2016 Online International Conference on Green Engineering and Technologies (IC-GET), Coimbatore, India, 19 November 2016; pp. 1–3. [Google Scholar] [CrossRef]
- De-La-Rosa, J.-J.G.; Pérez-Donsión, M. Special Issue “Analysis for Power Quality Monitoring”. Energies 2020, 13, 514. [Google Scholar] [CrossRef] [Green Version]
- Sunil, T.P.; Loganathan, N. Power quality improvement of a grid-connected wind energy conversion system with har-monics reduction using FACTS device. In Proceedings of the IEEE-International Conference on Advances in Engineering, Science and Management, ICAESM-2012, Tamil Nadu, India, 30–31 March 2012; pp. 415–420. [Google Scholar]
- Devabalaji, K.; Ravi, K. Power quality improvement in wind farm connected to grid using STATCOM. In Proceedings of the 2014 International Conference on Advances in Electrical Engineering (ICAEE), Vellore, India, 9–11 January 2014; pp. 1–5. [Google Scholar] [CrossRef]
- Amita, A.; Sinha, A.K. Power Quality Comparison of Grid Connected wind Energy System with STATCOM and UPQC. In Proceedings of the 2018 International Conference on Intelligent Circuits and Systems (ICICS), Phagwara, India, 19–20 April 2018; pp. 355–360. [Google Scholar] [CrossRef]
- Mohammed, A.B.; Ariff, M.A.M.; Ramli, S.N. Power quality improvement using dynamic voltage restorer in electrical distribution system: An overview. Indones. J. Electr. Eng. Comput. Sci. 2019, 17, 86–93. [Google Scholar] [CrossRef]
- Jiao, W.; Chen, J.; Wu, Q.; Li, C.; Zhou, B.; Huang, S. Distributed Coordinated Voltage Control for Distribution Networks with DG and OLTC Based on MPC and Gradient Projection. IEEE Trans. Power Syst. 2022, 37, 680–690. [Google Scholar] [CrossRef]
- Jamil, E.; Qurratulain; Hameed, S. STATCOM-Based Voltage Regulation in Grid Integrated Wind Farm under Variable Loading Conditions. In Proceedings of the 2017 14th IEEE India Council International Conference (INDICON), Roorkee, India, 15–17 December 2018; pp. 1–6. [Google Scholar] [CrossRef]
- Varma, R.K.; Akbari, M. Simultaneous Fast Frequency Control and Power Oscillation Damping by Utilizing PV Solar System as PV-STATCOM. IEEE Trans. Sustain. Energy 2020, 11, 415–425. [Google Scholar] [CrossRef]
- Khadem, S.K.; Basu, M.; Conlon, M. Power Quality in Grid connected Renewable Energy Systems: Role of Custom Power Devices. Renew. Energy Power Qual. J. 2010, 1, 878–881. [Google Scholar] [CrossRef] [Green Version]
- Lakshmi, S.; Ganguly, S. A comparative study among UPQC models with and without real power injection to improve energy efficiency of radial distribution networks. Energy Syst. 2020, 11, 113–138. [Google Scholar] [CrossRef]
- Kesler, M.; Ozdemir, E. Synchronous-Reference-Frame-Based Control Method for UPQC Under Unbalanced and Distorted Load Conditions. IEEE Trans. Ind. Electron. 2011, 58, 3967–3975. [Google Scholar] [CrossRef]
- Trinh, Q.-N.; Lee, H.-H. Novel Control Strategy for a UPQC under Distorted Source and Nonlinear Load Conditions. J. Power Electron. 2013, 13, 161–169. [Google Scholar] [CrossRef] [Green Version]
- Lara, O.A.; Jenkins, N.; Ekanayake, J. Wind Energy Generation Systems: Modelling and Control; John Wiley & Sons: Hoboken, NJ, USA, 2009; Volume 54. [Google Scholar]
- Abdou, A.F.; Pota, H.R.; Abu-Siada, A.; Alharbi, Y.M. Application of STATCOM-HTS to improve DFIG performance and FRT during IGBT short circuit. In Proceedings of the 2014 Australasian Universities Power Engineering Conference (AUPEC), Perth, WA, Australia, 28 September–1 October 2014; pp. 1–5. [Google Scholar] [CrossRef]
- Mahmoud, M.M.; Ratib, M.K.; Aly, M.M.; Abdel–Rahim, A.-M.M. Application of Whale Optimization Technique for Evaluating the Performance of Wind-Driven PMSG Under Harsh Operating Events. Process. Integr. Optim. Sustain. 2022, 6, 447–470. [Google Scholar] [CrossRef]
- Baidar, L.; Rahmoun, A.; Lorenz, P.; Mihoubi, M. Whale Optimization Approach for Optimization Problem in Distributed Wireless Sensor Network. In Proceedings of the 9th International Conference on Information Systems and Technologies, Cairo, Egypt, 24–26 March 2019; p. 19. [Google Scholar] [CrossRef]
- Mirjalili, S.; Lewis, A. The Whale Optimization Algorithm. Adv. Eng. Softw. 2016, 95, 51–67. [Google Scholar] [CrossRef]
- Goud, B.S.; Reddy, C.R.; Rakesh, T.; Rajesh, N.; Reddy, B.N.; Aymen, F. Grid Integration of Renewable Energy Sources using GA Technique for Improving Power Quality. Int. J. Renew. Energy Res. 2021, 11, 1390–1402. [Google Scholar] [CrossRef]
- Kahla, S.; Bechouat, M.; Amieur, T.; Sedraoui, M.; Babes, B.; Hamouda, N. Maximum power extraction framework using robust fractional-order feedback linearization control and GM-CPSO for PMSG-based WECS. Wind. Eng. 2021, 45, 1040–1054. [Google Scholar] [CrossRef]
- George, T.; Ganesan, V. Design of fractional order PID controller for higher order time delay system using NOARBFN technique. Energy Syst. 2021, 1–32. [Google Scholar] [CrossRef]
- Kenjrawy, H.; Makdisie, C.; Houssamo, I.; Mohammed, N. New Modulation Technique in Smart Grid Interfaced Multilevel UPQC-PV Controlled via Fuzzy Logic Controller. Electronics 2022, 11, 919. [Google Scholar] [CrossRef]


| Technical Hitches | Period | Amplitude | |
|---|---|---|---|
| Harmonics | Steady-state | 0–20% | |
| Voltage | Dip | 0.5–30 cycle | 0.1 pu–0.9 pu |
| Swell | 0.5–30 cycle | 1.1 pu–1.9 pu | |
| Fluctuations | Discontinuous | 0.1–9% | |
| Under | >60 s | 0.8 pu–0.9 pu | |
| Over | >60 s | 1.1 pu–1.2 pu | |
| Interruption | 0.5 cycle–30 s | >0.1 pu | |
| Noise | Steady-state | 0–1% | |
| DC offset | Steady-state | 0–0.1% | |
| WT Generator | Control of Power | Inertia | FRT Capability | |
|---|---|---|---|---|
| Active (P) | Reactive (Q) | |||
| Conventional | ✓ | ✓ | ✓ | ✓ |
| PMSG | ✓ | ✓ | ✗ | ✓ |
| DFIG | ✓ | ✓ | ✗ | ✓ |
| FSIG (studied) | ✓ | ✗ | ✓ | ✓ |
| References | FACTS Type | Controller | Benefits | Limitations |
|---|---|---|---|---|
| [47] | STATCOM | Bang-Bang (BBC) |
|
|
| [48] | Hysteresis current |
|
| |
| [25] | Fuzzy logic (FLC) and BBC |
|
| |
| [23] | PI |
|
| |
| [49] | STATCOM and UPQC. | PI |
|
|
| [27] | STATCOM | PID |
|
|
| [50] | DVR | PI |
|
|
| [51] | STATCOM | Neuro and resonant control |
|
|
| [52] | PI |
|
| |
| [53] | PI |
|
| |
| [54] | PI |
|
| |
| [55] | Multi Converter UPQC | PI |
|
|
| [3] | UPQC | Atom search- FOPI |
|
|
| [56] | Synchronous reference frame |
|
| |
| [57] | PI-3 resonant |
|
| |
| Current work (Proposed) | STATCOM and UPQC | WOA-based FOPI |
| |
| Points | Investigated Tools | |
|---|---|---|
| STATCOM | UPQC (Proposed) | |
| Speed in time | (~2–4) ms | instantaneously |
| Cost (USD/kVAR) | 50–70 | 80–100 |
| connection | Shunt only | Shunt and series |
| Advantages |
|
|
| Disadvantages |
|
|
| Remarks |
|
|
| References | [23,25,29,30,59] | [1,7,36,49,55] |
| Tools | Controllers | WOA-Based FOPIC Gains | ||
|---|---|---|---|---|
| KP | KI | |||
| STATCOM | FOPIC1 | 0.0021 | 0.0731 | 0.7421 |
| FOPIC2 | 0.372 | 11.342 | 0.8798 | |
| FOPIC3 | 0.423 | 12.231 | 0.8678 | |
| FOPIC4 | 7.173 | 999.97 | 0.9137 | |
| UPQC | FOPIC5 | 7.8548 | 29.8490 | 0.8798 |
| FOPIC6 | 0.347 | 10.234 | 0.8441 | |
| FOPIC7 | 0.249 | 10.781 | 0.8237 | |
| FOPIC8 | 0.0019 | 0.1040 | 0.6320 | |
| FOPIC9 | 0.9441 | 147.810 | 0.9120 | |
| FOPIC10 | 0.0271 | 7.941 | 0.7810 | |
| Configurations | Studied Scenarios | Compensation of Q | ||
|---|---|---|---|---|
| S1 | S2 | S3 | ||
| C1 | ✓ | ✓ | ✓ | ✓ |
| C2 | ✓ | ✓ | ✓ | ✓ |
| C3 | ✓ | ✓ | ✓ | ✗ |
| Parameters | Value | Unit |
|---|---|---|
| Feeder base voltage | 25 | kV |
| Distributed transformer | 25\0.575 | kV |
| STATCOM base voltage | 25 | kV |
| Frequency | 50 | Hz |
| Load | 1.2 | MVA |
| STATCOM rating (R) | 700 | kVAR |
| WTR | 500 | kW |
| R wind speed | 7.8 | m\s |
| DC-capacitor | 4.84 | µF |
| Filter inductance | 6 | mH |
| Filter capacitance | 12 | µF |
| Studied Cases | Parameters | Without FACTS Magnitude | WOA-Based FOPIC of STATCOM | WOA-Based FOPIC of UPFC (Suggested) | ||
|---|---|---|---|---|---|---|
| Magnitude | Percent Reduction (%) | Magnitude | Percent Reduction (%) | |||
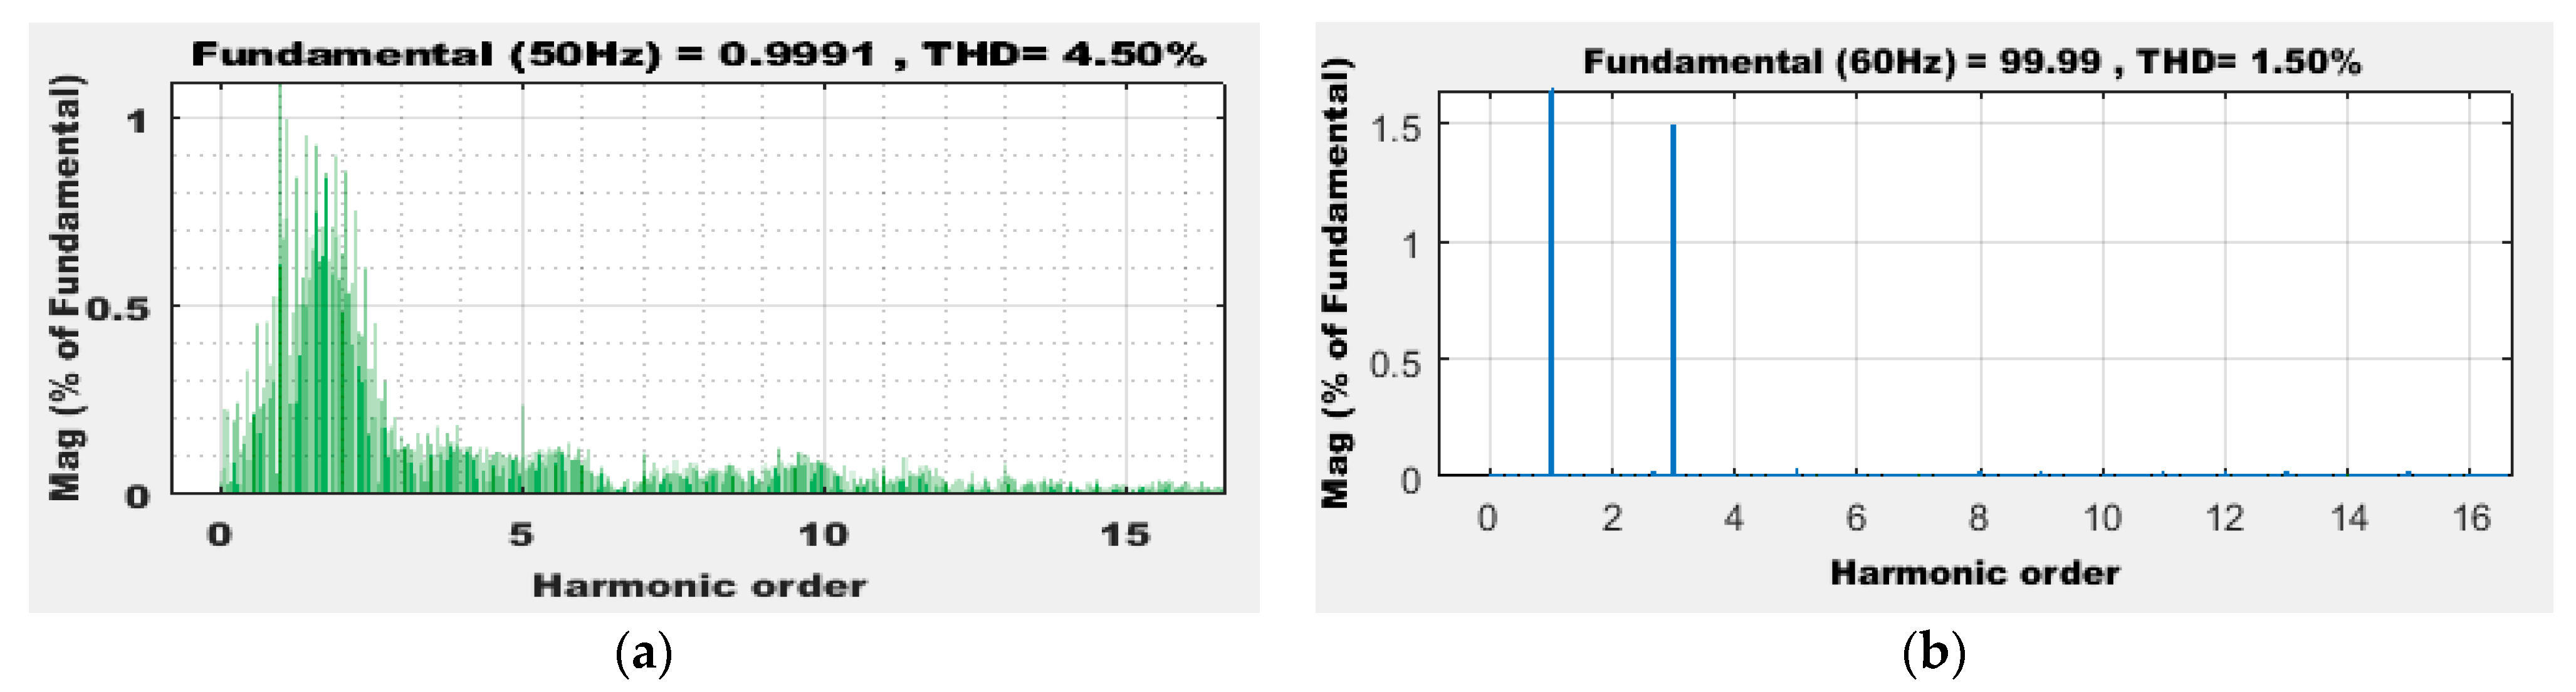
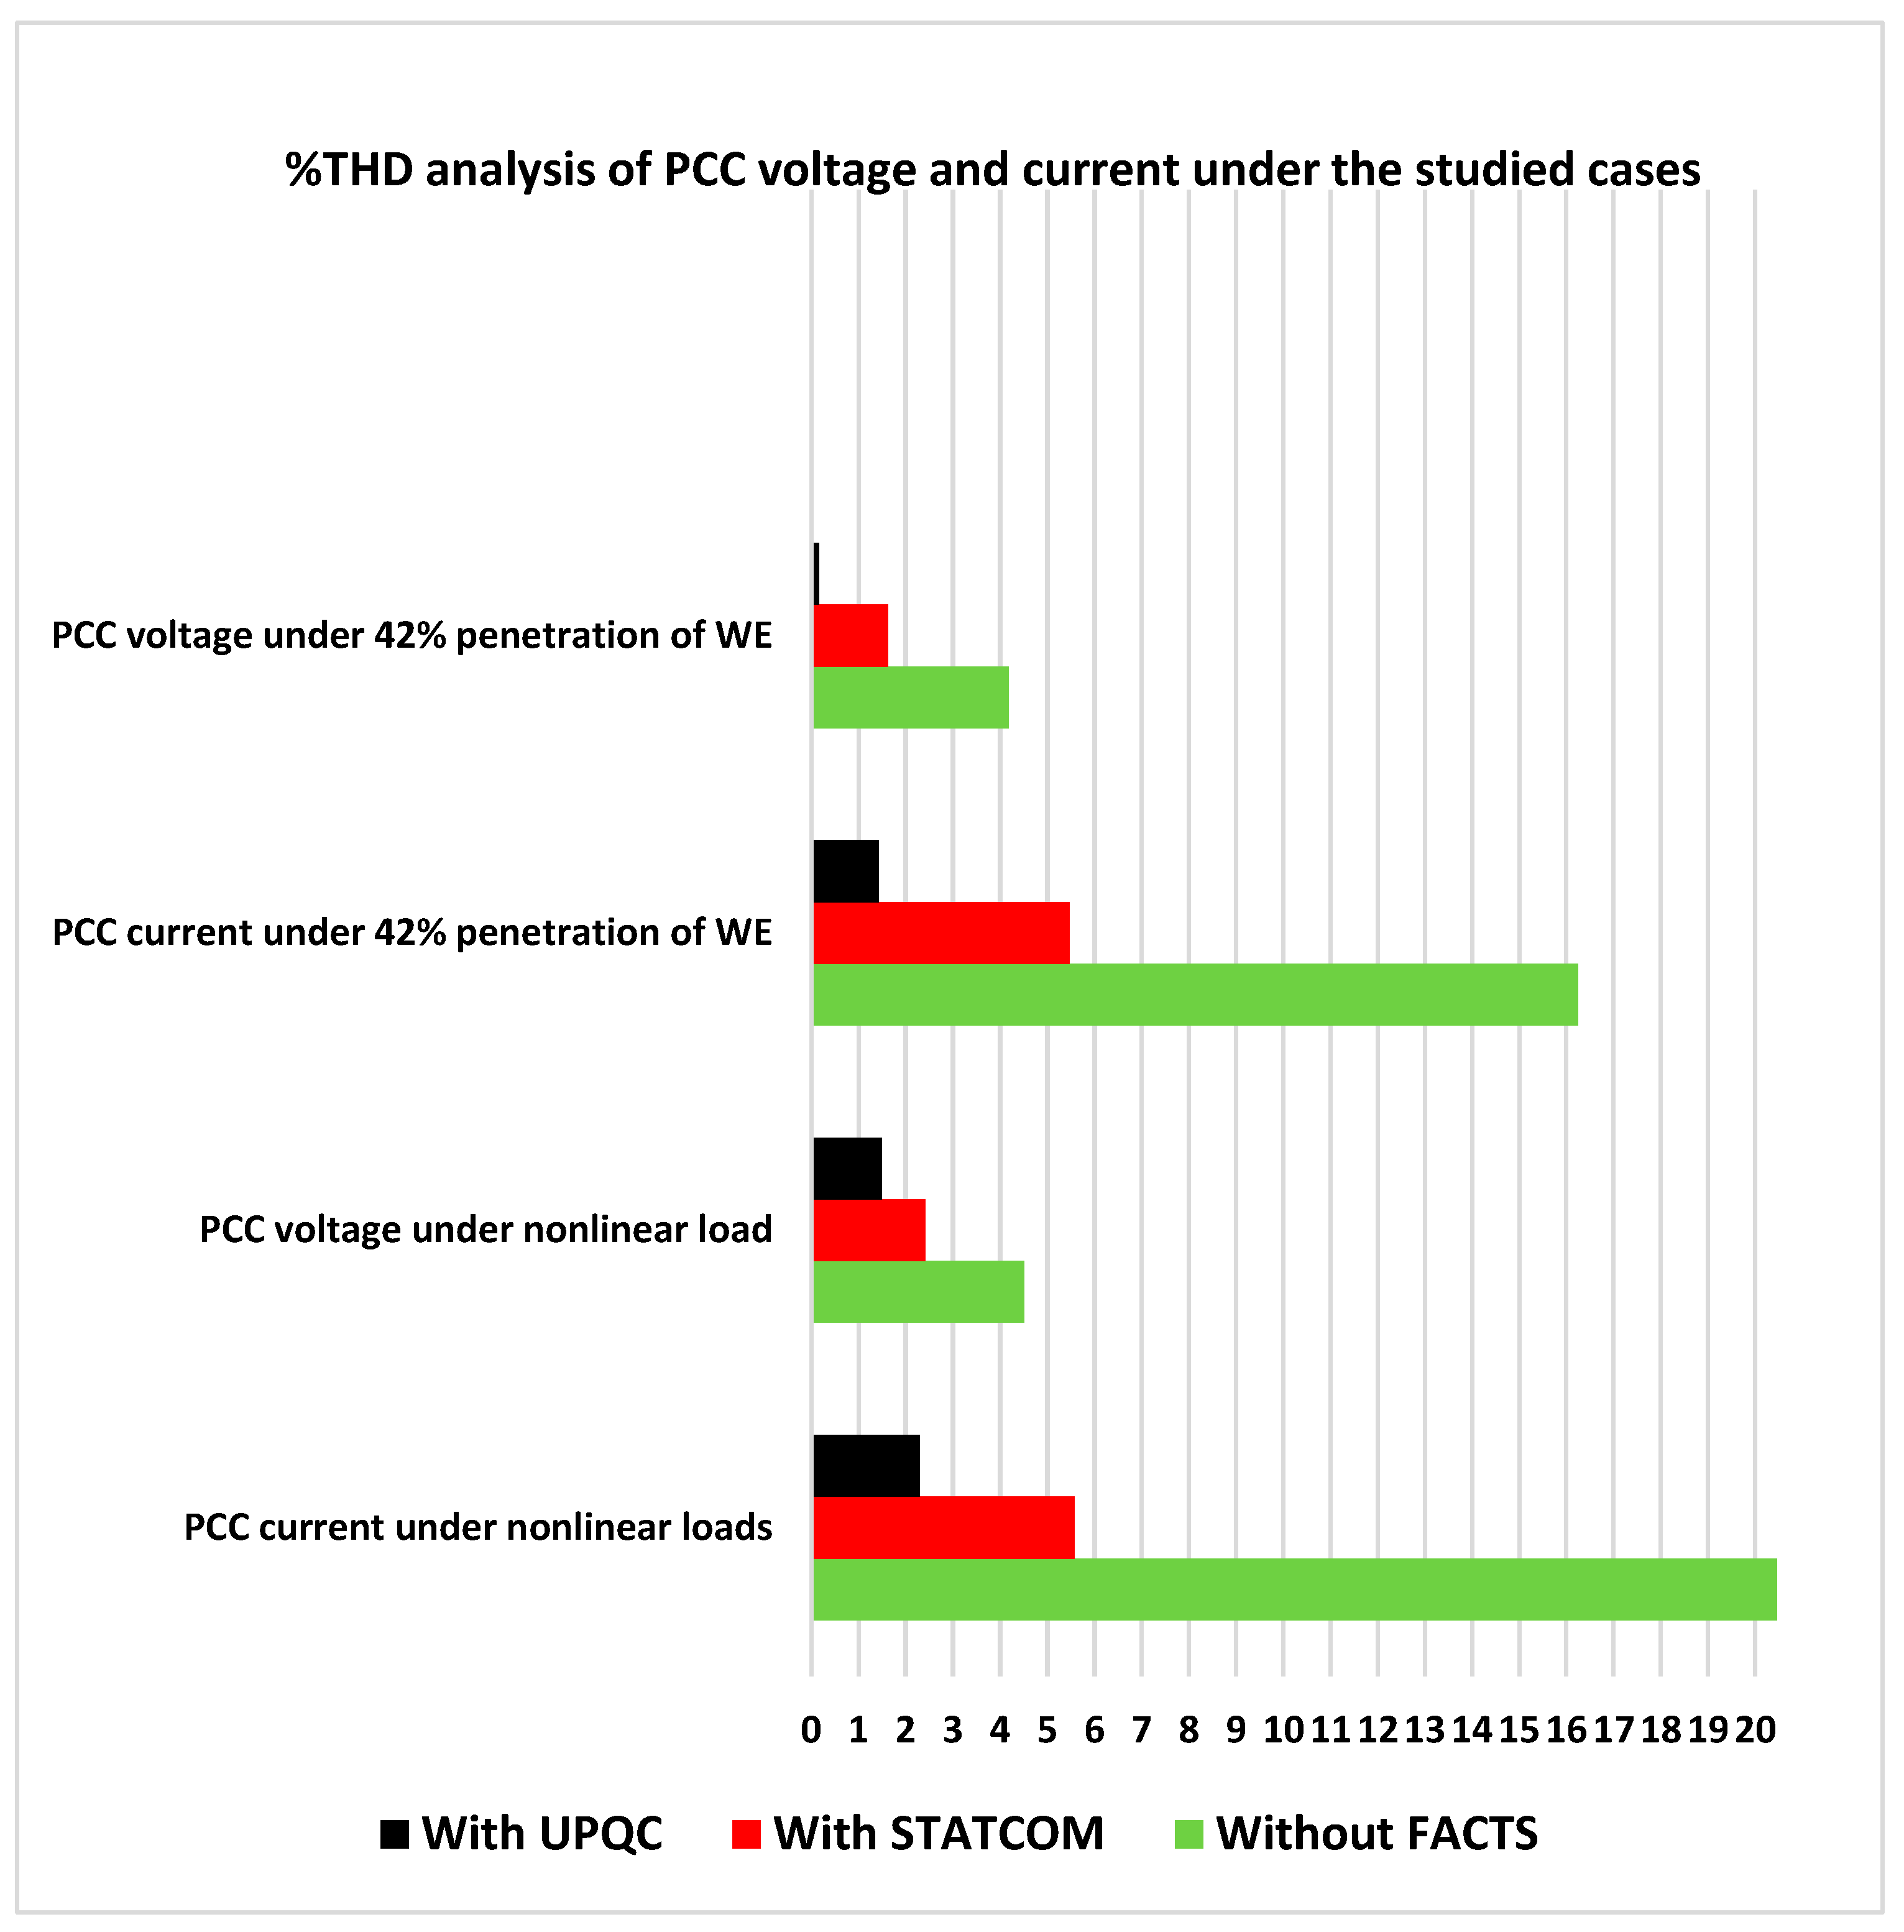
| THD in S1 (%) | Voltage | 4.5 | 2.42 | 46. 22 | 1.5 | 66.67 |
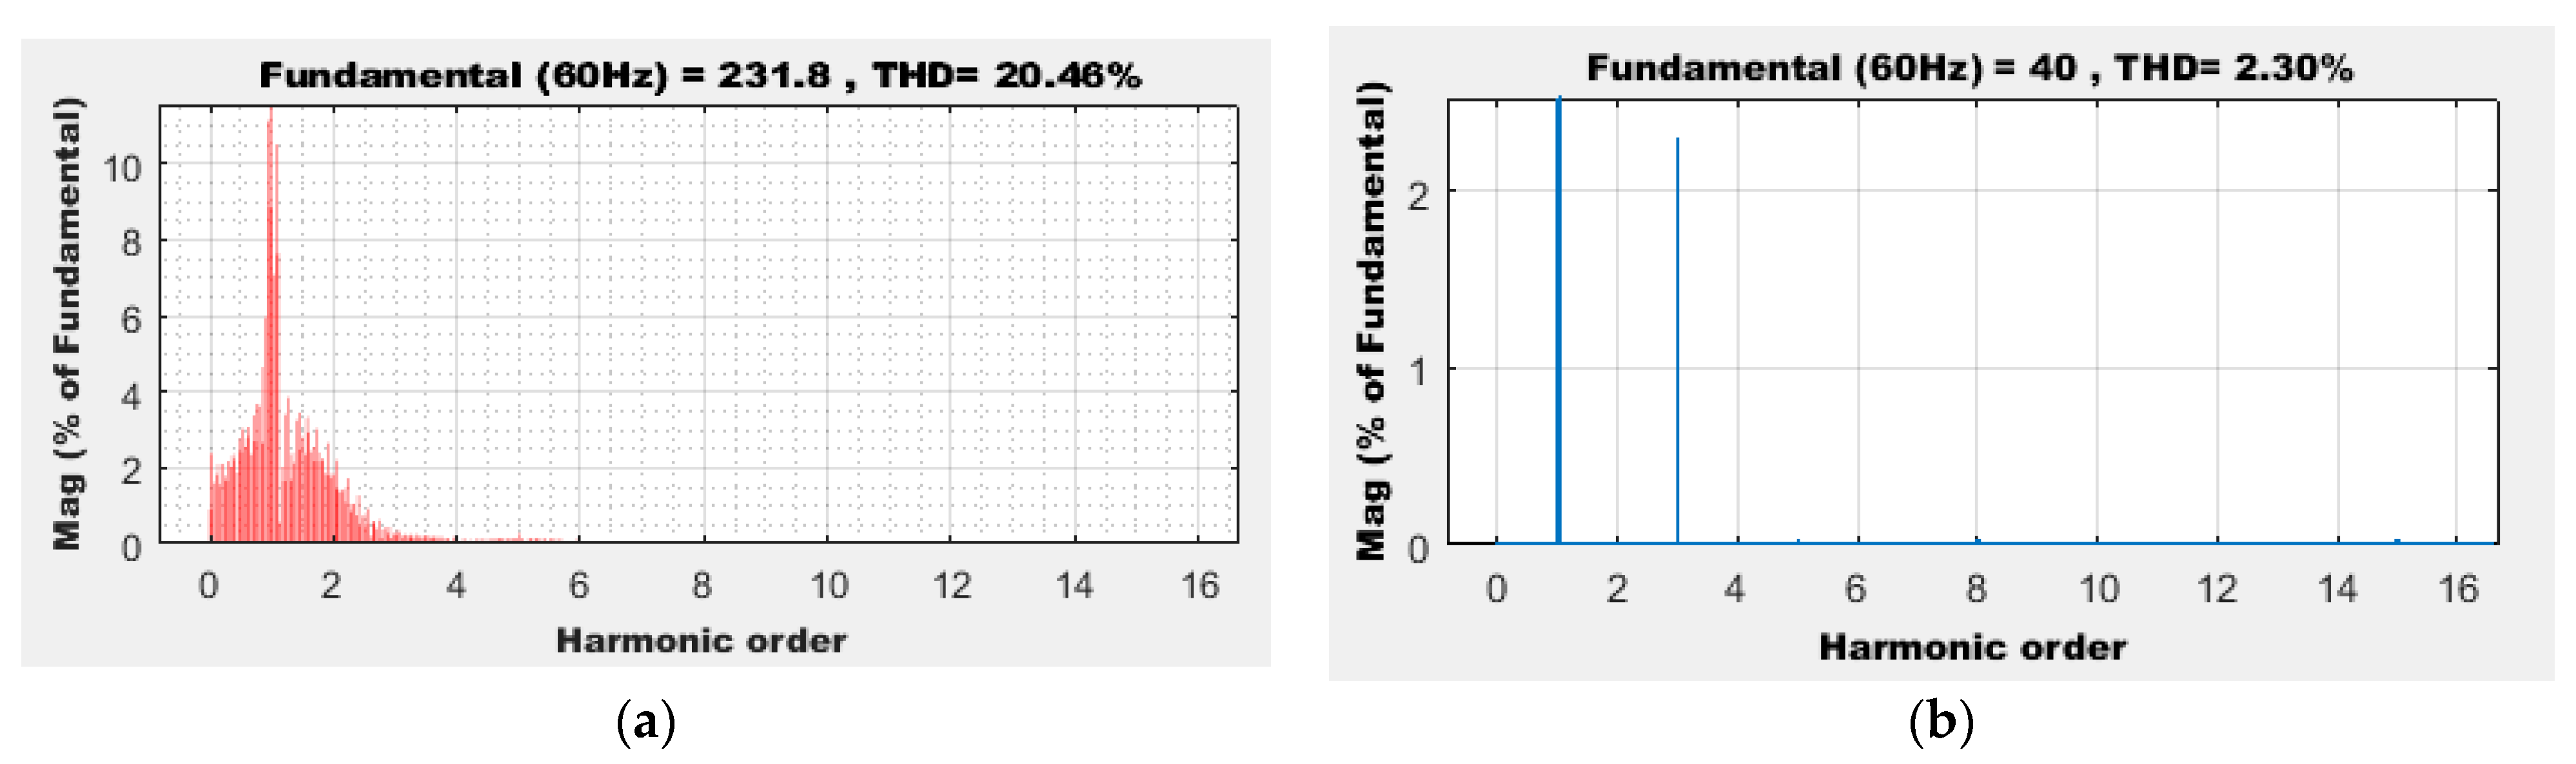
| Current | 20.46 | 5.57 | 72.78 | 2.3 | 88.76 | |
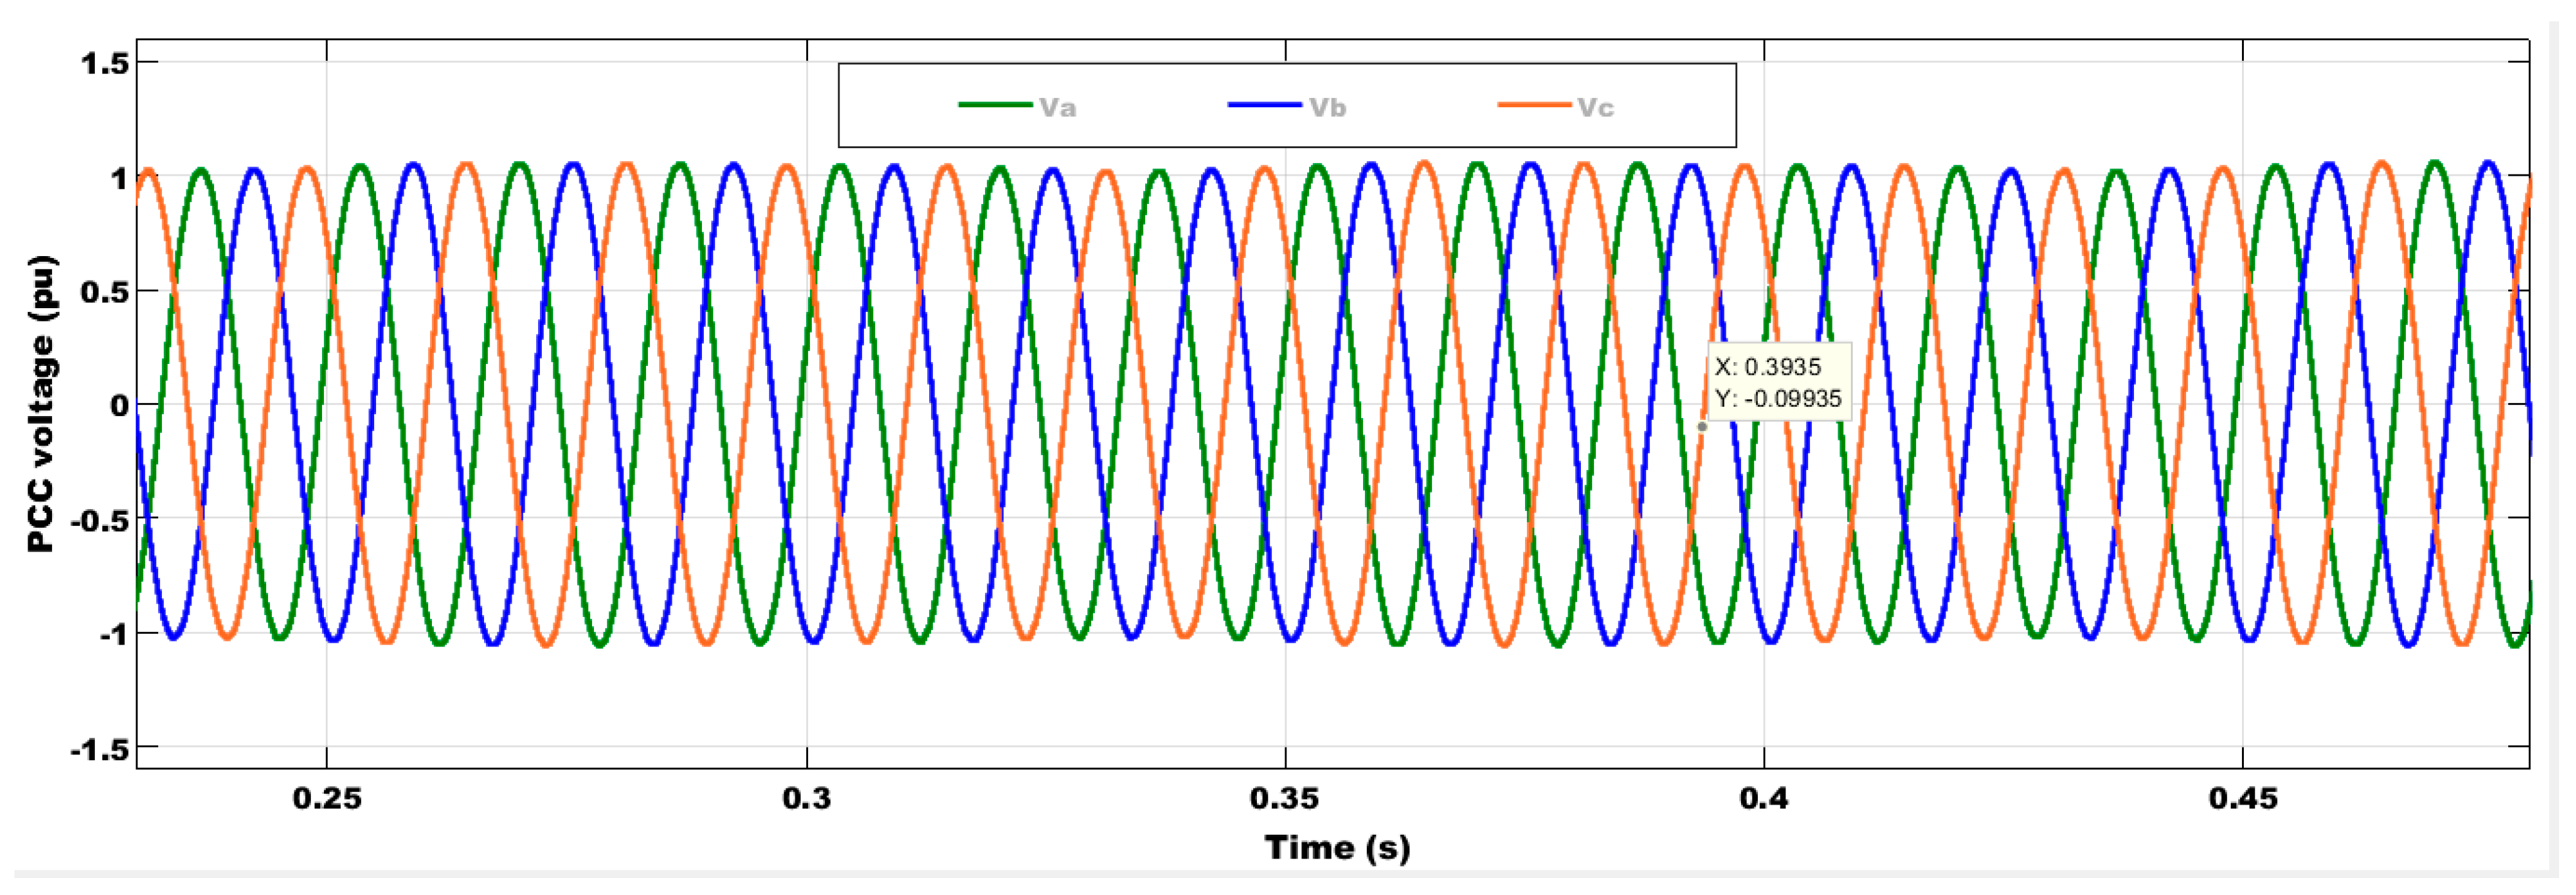
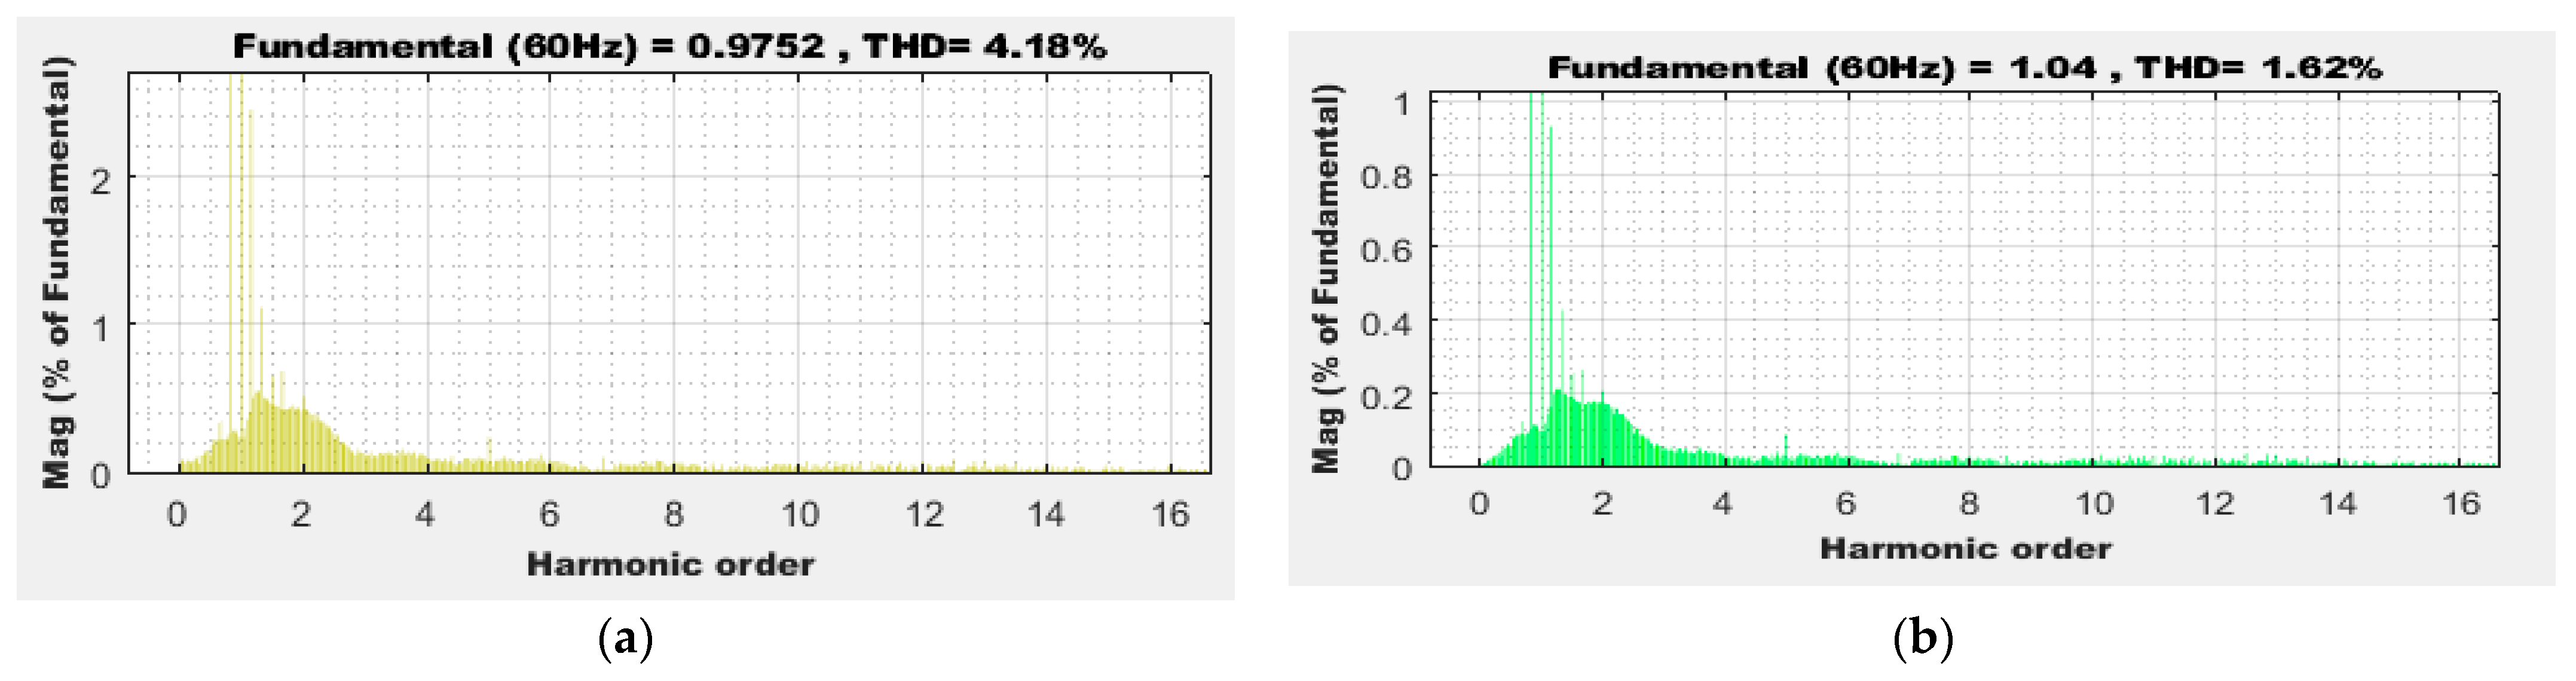
| THD in S2 (%) | Voltage | 4. 18 | 1. 62 | 61.24 | 0.16 | 96.17 |
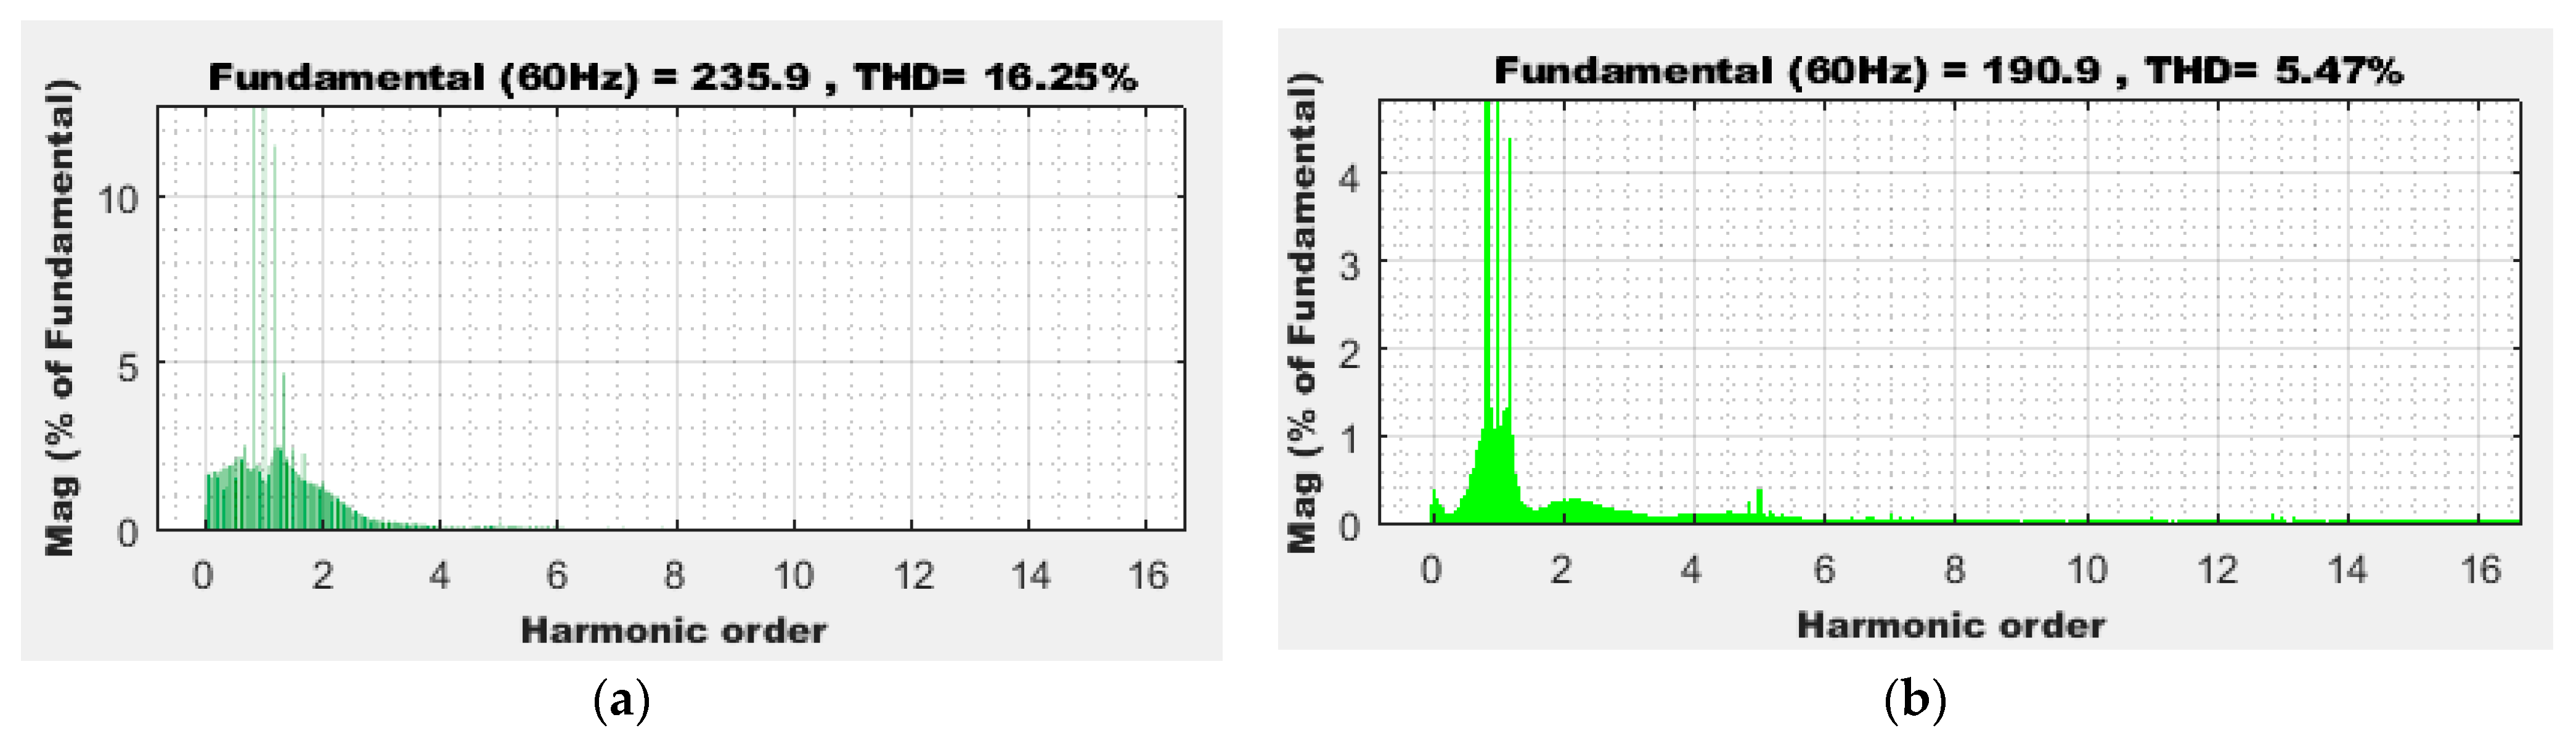
| Current | 16.25 | 5.47 | 66.34 | 1.43 | 91.2 | |
| Studied Scenarios | Voltage Variation Values under Presented Configurations (pu) | ||
|---|---|---|---|
| Without FACTS | WOA-Based FOPIC of STATCOM | WOA-Based FOPIC of UPQC (Proposed) | |
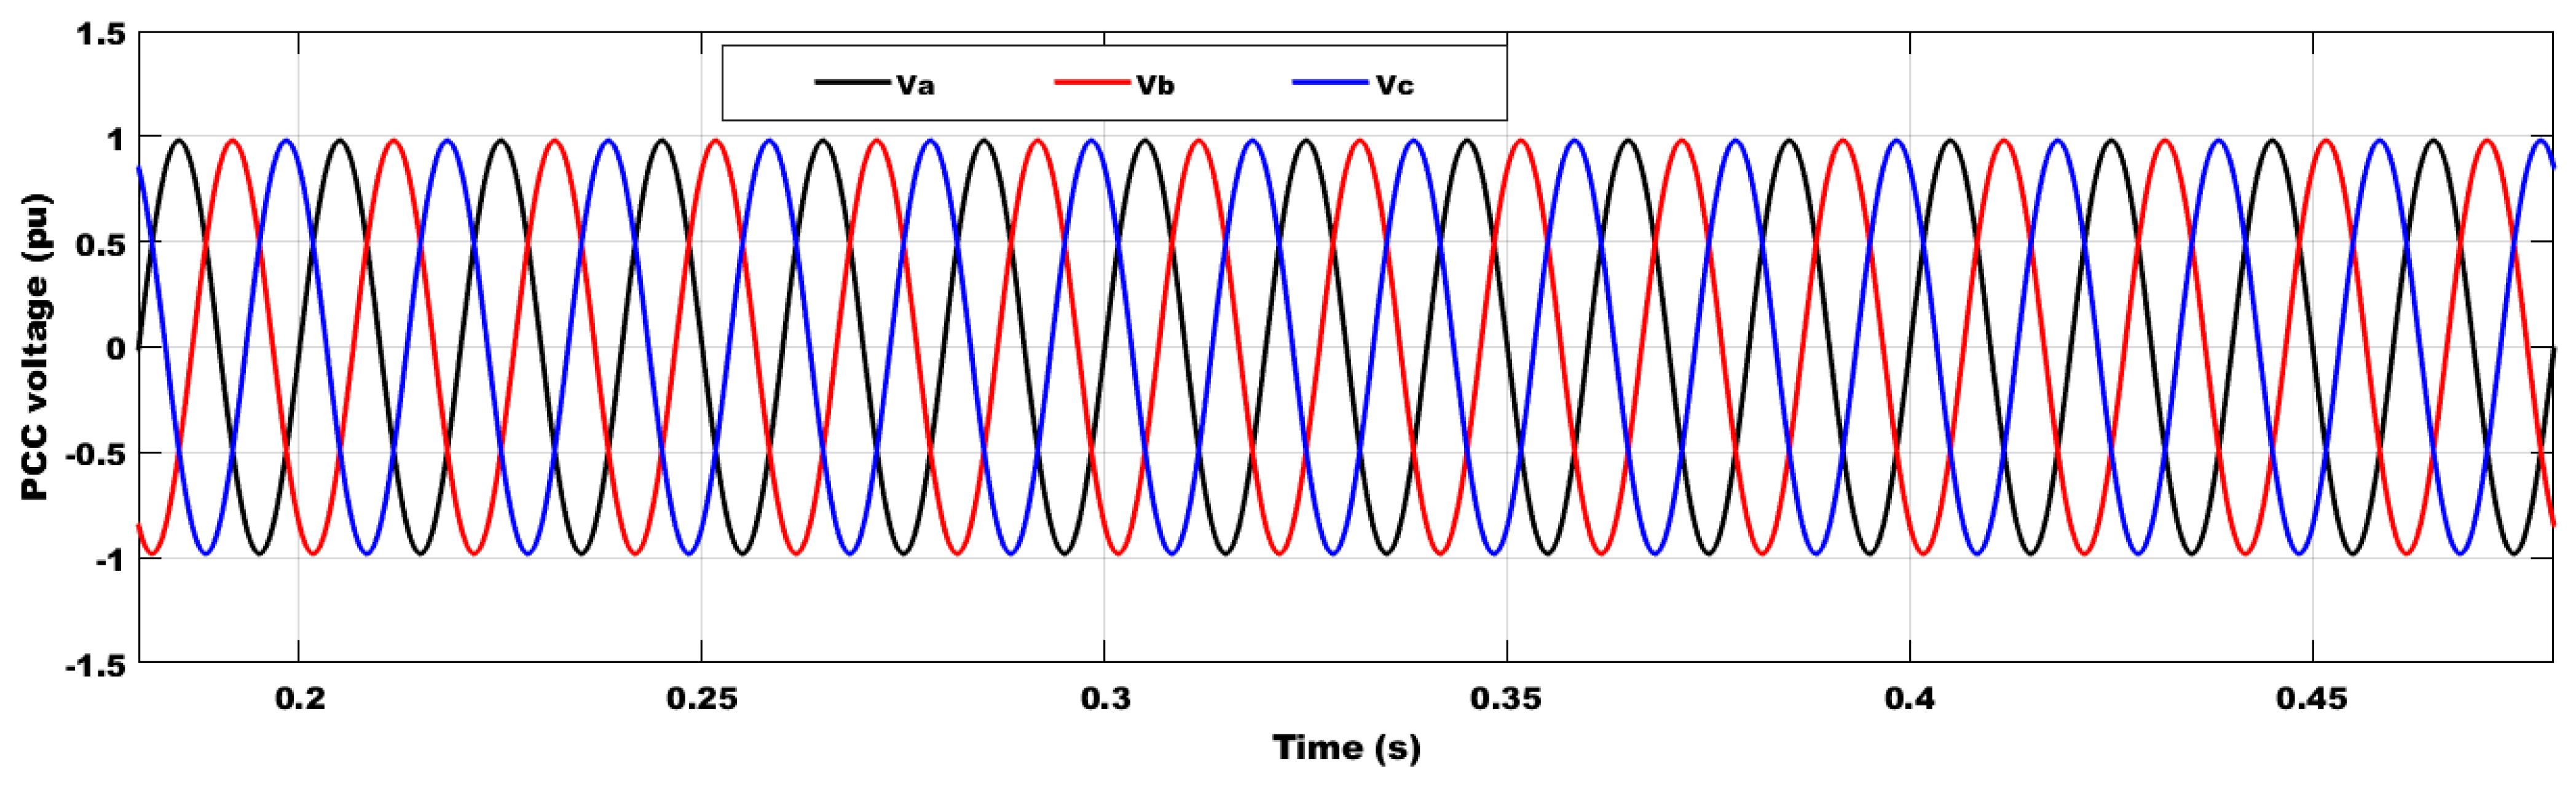
| Nonlinear loads | ≈0.989–1.089 | ≈1 | 1 |
| 42% penetration of WE | ≈0.939–1.019 | ≈1 | 1 |
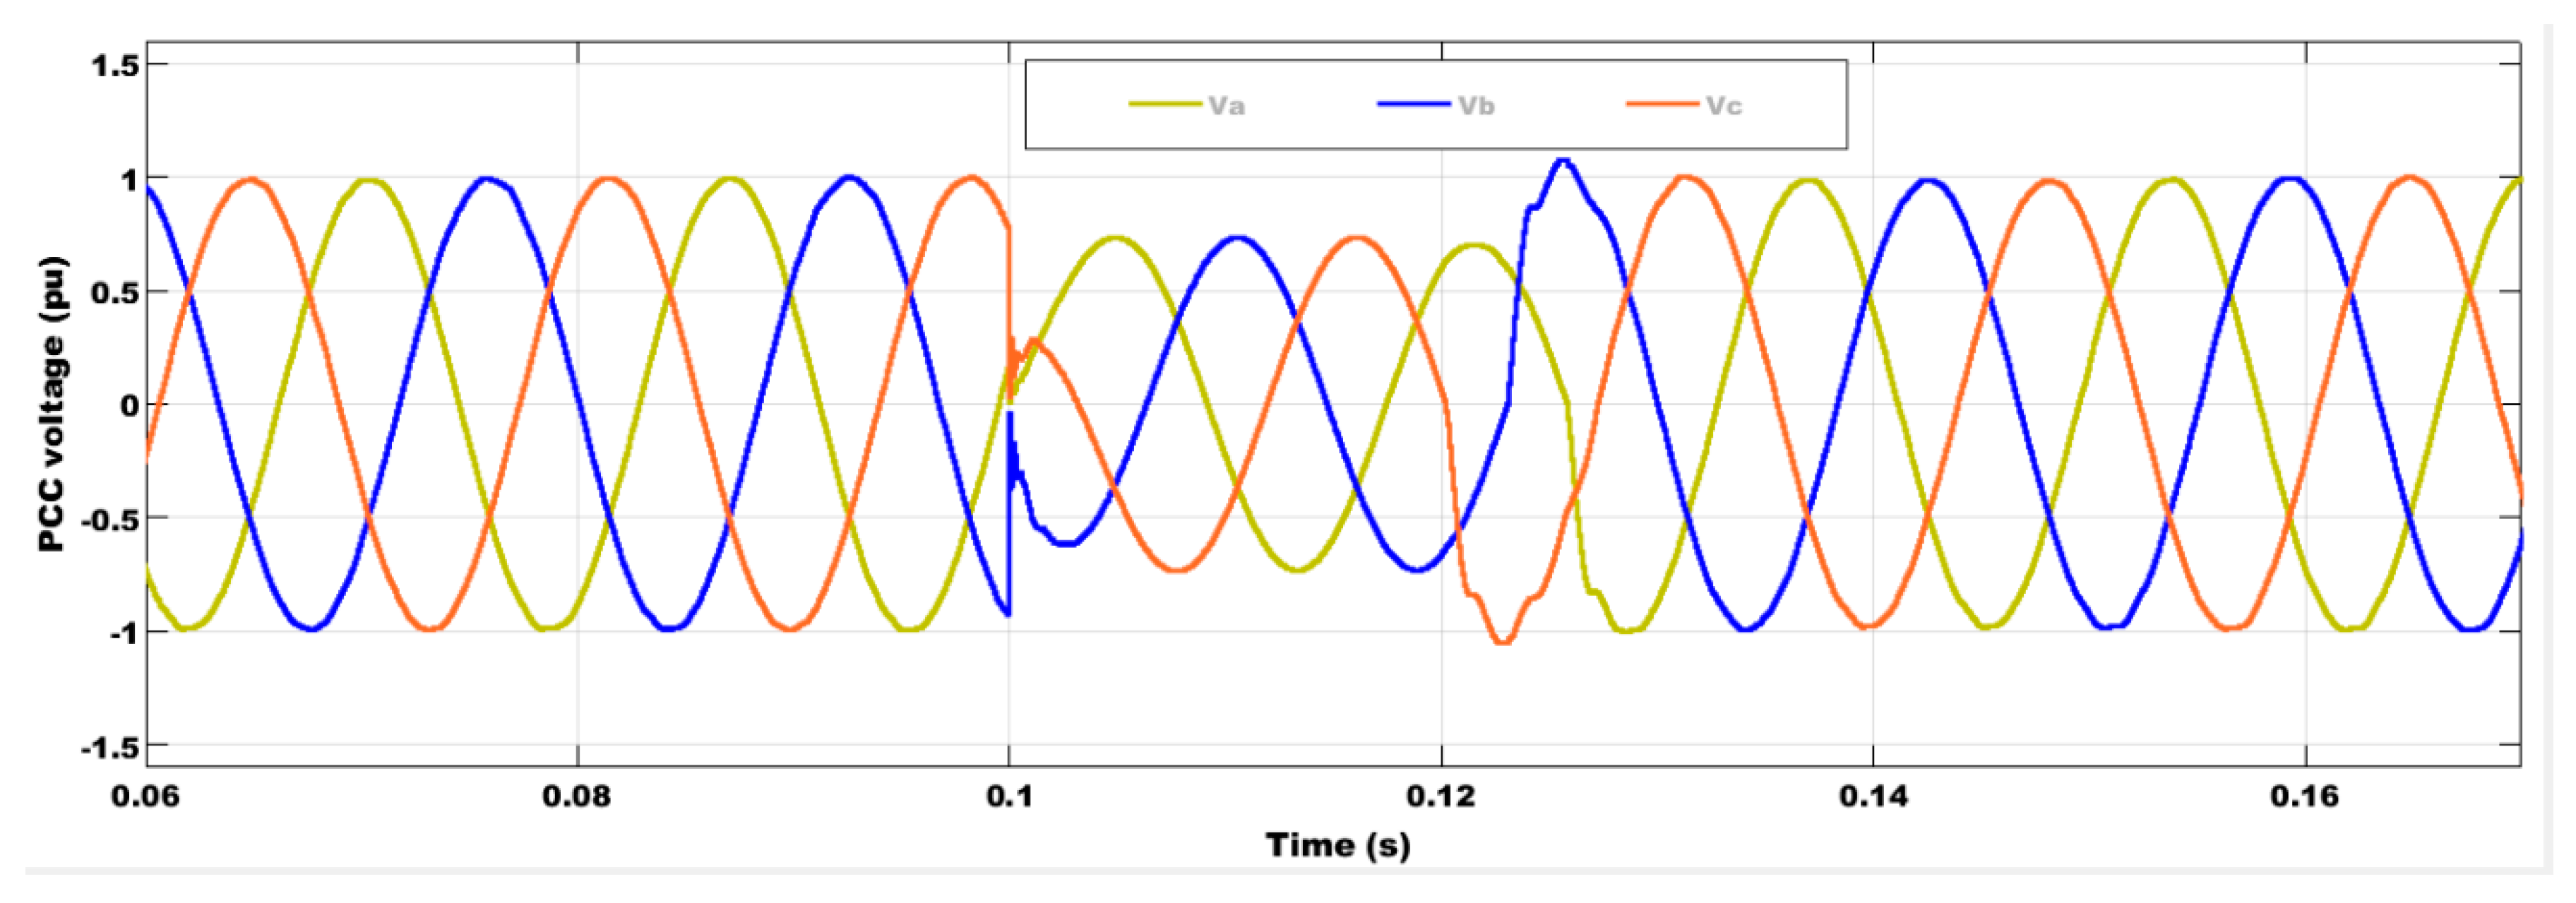
| Transient fault | ≈0.74 | ≈0.95 | ≈1 |
| Items | UPQC [66] | UPQC (Proposed) |
|---|---|---|
| Number of levels | 9 | 2 |
| Controller | Fuzzy logic controller | WOA-FOPIC |
| Connection | Between (PV + NL) and grid (380 V) | Between (WT + NL) and grid (25 kV) |
| Modulation method | Adaptive hysteresis band (ADB) | PWM |
| Researched point | Load voltage (380 V) | PCC bus (25 kV) |
| Scenarios | Voltage sag and swell only | NLs and 42% penetration of WE adverse impacts, besides three-phase fault. |
| Simplicity | ✗ | ✓ |
| Main benefits | FLC-based AHB reduces the THD, but FLC needs high experience. | Detectors are not required which lowers the system’s cost and complexity. |
| The obtained %THD is satisfied with IEEE standards. | ✓ | ✓ |
Disclaimer/Publisher’s Note: The statements, opinions and data contained in all publications are solely those of the individual author(s) and contributor(s) and not of MDPI and/or the editor(s). MDPI and/or the editor(s) disclaim responsibility for any injury to people or property resulting from any ideas, methods, instructions or products referred to in the content. |
© 2023 by the authors. Licensee MDPI, Basel, Switzerland. This article is an open access article distributed under the terms and conditions of the Creative Commons Attribution (CC BY) license (https://creativecommons.org/licenses/by/4.0/).
Share and Cite
Mahmoud, M.M.; Atia, B.S.; Esmail, Y.M.; Ardjoun, S.A.E.M.; Anwer, N.; Omar, A.I.; Alsaif, F.; Alsulamy, S.; Mohamed, S.A. Application of Whale Optimization Algorithm Based FOPI Controllers for STATCOM and UPQC to Mitigate Harmonics and Voltage Instability in Modern Distribution Power Grids. Axioms 2023, 12, 420. https://0-doi-org.brum.beds.ac.uk/10.3390/axioms12050420
Mahmoud MM, Atia BS, Esmail YM, Ardjoun SAEM, Anwer N, Omar AI, Alsaif F, Alsulamy S, Mohamed SA. Application of Whale Optimization Algorithm Based FOPI Controllers for STATCOM and UPQC to Mitigate Harmonics and Voltage Instability in Modern Distribution Power Grids. Axioms. 2023; 12(5):420. https://0-doi-org.brum.beds.ac.uk/10.3390/axioms12050420
Chicago/Turabian StyleMahmoud, Mohamed Metwally, Basiony Shehata Atia, Yahia M. Esmail, Sid Ahmed El Mehdi Ardjoun, Noha Anwer, Ahmed I. Omar, Faisal Alsaif, Sager Alsulamy, and Shazly A. Mohamed. 2023. "Application of Whale Optimization Algorithm Based FOPI Controllers for STATCOM and UPQC to Mitigate Harmonics and Voltage Instability in Modern Distribution Power Grids" Axioms 12, no. 5: 420. https://0-doi-org.brum.beds.ac.uk/10.3390/axioms12050420