

Uncovering the Impact of Local and Global Interests in Artists on Stock Prices of K-Pop Entertainment Companies: A SHAP-XGBoost Analysis

Department of Financial Mathematics, Gachon University, Seongnam 13120, Republic of Korea
*
Author to whom correspondence should be addressed.
Axioms 2023, 12(6), 538; https://0-doi-org.brum.beds.ac.uk/10.3390/axioms12060538
Submission received: 10 May 2023
/
Revised: 25 May 2023
/
Accepted: 25 May 2023
/
Published: 30 May 2023
(This article belongs to the Special Issue Mathematical and Computational Finance Analysis)
Abstract
:Stock price prediction is a significant area of research in finance that has been ongoing for a long time. Several mathematical models have been utilized in this field to predict stock prices. However, recently, machine learning techniques have demonstrated remarkable performance in stock price prediction. Moreover, XAI (explainable artificial intelligence) methodologies have been developed, which are models capable of interpreting the results of machine learning algorithms. This study utilizes machine learning to predict stock prices and uses XAI methodologies to investigate the factors that influence this prediction. Specifically, we investigated the relationship between the public’s interest in artists affiliated with four K-Pop entertainment companies (HYBE, SM, JYP, and YG). We used the Naver Keyword Trend and Google Trend index data for the companies and their representative artists to measure local and global interest. Furthermore, we employed the SHAP-XGBoost model to show how the local and global interest in each artist affects the companies’ stock prices. SHAP (SHapley Additive exPlanations) and XGBoost are models that show excellent results as XAI and machine learning methodologies, respectively. We found that SM, JYP, and YG are highly correlated, whereas HYBE is a major player in the industry. YG is influenced by variables from other companies, likely owing to HYBE being a major shareholder in YG’s subsidiary music distribution company. The influence of popular artists from each company was significant in predicting the companies’ stock prices. Additionally, the foreign ownership ratio of a company’s stocks affected the importance of Google Trend and Naver Trend indexes. For example, JYP and SM had relatively high foreign ownership ratios and were influenced more by Google Trend indexes, whereas HYBE and YG were influenced more by Naver Trend indexes. Finally, the trend indexes of artists in SM and HYBE had a positive correlation with stock prices, whereas those of YG and JYP had a negative correlation. This may be due to steady promotions and album releases from SM and HYBE artists, while YG and JYP suffered from negative publicity related to their artists and executives. Overall, this study suggests that public interest in K-Pop artists can have a significant impact on the financial performance of entertainment companies. Moreover, our approach offers valuable insights into the dynamics of the stock market, which makes it a promising technique for understanding and predicting the behavior of entertainment stocks.
Keywords:
stock price prediction; explainable artificial intelligence (XAI); extreme gradient boosting (XGBoost); SHapley Additive exPlanations (SHAP); SHAP-XGBoost model; K-Pop; Naver Keyword Trend; Google Trend indexMSC:
68Q32; 91G99; 91B991. Introduction
Measuring the interests of people is important in finance. For example, investors often base their investment decisions on their interests and preferences. By measuring people’s interests in various investment options, financial institutions can offer investment products that align with the interests of their clients. This can increase the likelihood of investors making informed investment decisions that meet their financial goals. Owing to the development of information technology (IT), measuring people’s interests is becoming increasingly important in various fields.
IT has reorganized the financial structures and societies that form the basis of industries. With the current internet-oriented culture, celebrities use social media and other online platforms to intensify their messages. Thus, they leverage digital media channels to significantly influence and interact with their fans and audiences. For instance, artists inform the public of their upcoming releases and the latest news, which immediately garners reactions in various fields, including financial investing (“How is digital media affecting the entertainment industry?”, https://startup.info/how-is-digital-media-affecting-the-entertainment-industry/, (accessed on 1 February 2023)).
Many studies have utilized social network service data to evaluate investor attention and its impact on several industries. Moussa et al. [1] gauged the impact of investor attention on stock market trading volume using the Google Search Volume Index (GSVI). Chen et al. [2] investigated the linkage between investor sentiment and the Chinese stock market. Lee et al. [3] examined whether investor attention observed as GSVI and locally specific factors influences exchanged traded fund (ETF) returns.
“Giving attention” to something implies that it has more value than any alternative thing, which is the basic concept of the Attention-Based Economy (ABM). The entertainment industry has attracted people to the virtual world, which requires continuous attention. Public concentration is significant in the entertainment industry because it is directly related to financial gains (“Innovation, entertainment and the quest for attention”, https://www.insighteurs.com/innovation-entertainment-attention/, (accessed on 1 February 2023)).
K-Pop culture and the music industry have become increasingly popular in many foreign nations through the Korean Wave, also known as Hallyu. The popularity of K-Pop is international, with some of its major markets being the United States, India, Brazil, Indonesia, Mexico, Germany, the UK, the Philippines, Japan, and France. According to estimates, the K-Pop industry earns approximately USD 10 billion for the country each year. In 2021, Spotify, a music streaming service, disclosed that the monthly average number of K-Pop streams worldwide reached over 7.97 billion per month. Moreover, #KpopTwitter beat its own record with 7.8 billion global Tweets in 2021, with the previous record being 6.7 billion Tweets in 2020 (“K-Pop is making billions for South Korea”, https://www.asiafundmanagers.com/gbr/kpop-and-economic-impact-on-south-korea/, (accessed on 1 February 2023)).
In this study, we investigate how public interest affects the Korean entertainment industry, as represented by K-Pop. This is based on the assumption that the public’s interest in artists belonging to a particular entertainment company affects the company’s financial factors. In addition, we examine the importance of local and global markets in the Korean entertainment industry by comparing the influence of domestic and foreign indicators on entertainment stock prices.
To this end, we selected four big K-Pop entertainment companies (HYBE, SM, JYP, and YG) and collected data on local and overseas interests in artists belonging to these companies. In addition, we employed local and overseas interests as search-volume-based indicators for individual artists of Naver and Google, named as Naver Keyword Trend and Google Trend index (or, Search Volume Index (SVI) from Google Trends is called the Google Trend index and examines people’s interests). Recently, several studies have considered Google search volume as a measure of public interest in finance (Bijl et al. [4], Swamy et al. [5], Swamy et al. [5], Costola et al. [6], Klein [7], and Koch and Dimpfl [8]).
Methodologically, we employ the eXtreme Gradient Boosting (XGBoost) algorithm and the SHapley Additive exPlanations (SHAP) models to analyze the importance of domestic and foreign indicators for predicting the stock prices of the four companies. The XGBoost model is a useful machine learning technique with several advantages, such as fast implementation (Han et al. [9]), high efficiency (Bhatnagar et al. [10]), and regularization (Bentéjac et al. [11]). The SHAP algorithm was introduced to overcome the black-box problem in machine learning models. Consequently, the SHAP method has been recently used to explain the predictions of machine learning models. Furthermore, it has a model-agnostic nature and provides interpretable feature-importance scores. In this study, we used a combination of the two models called SHAP-XGBoost. Several studies have used the SHAP-XGBoost algorithm to explain the importance of features in predictions (Nasiri et al. [12], Fatahi et al. [13], Yang et al. [14], and Zhang et al. [15]). We review these two methodologies in Section 3.
In addition to machine learning, traditional mathematical models have been used in stock price prediction research. For example, Rathnayaka et al. [16] aimed to develop a forecasting model using the Geometric Brownian Motion (GBM) approach to estimate share price indices for short-term investments in the Colombo Stock Exchange. Comparisons with the traditional ARIMA approach indicated that the newly proposed model was highly valuable for investors seeking to make informed investment decisions. Agustini et al. [17] also utilized GBM to perform various tasks such as computing returns and generating stock price predictions. The results of their research indicated that the GBM model was highly precise, as evidenced by a forecast MAPE (Mean Absolute Percentage Error) value of less than 20%. Recently, studies using fractional Brownian motion (FBM) have been reported. For instance, Liu and Huang [18] suggested a model combining GARCH and FBM for carbon option price forecasting in the context of carbon trading. The model was evaluated using daily closing prices of EUA option contracts, and the results demonstrate that it provided the closest fit to the actual prices compared to three other models. Hu et al. [19] introduced a stock prediction model that integrated mixed fractional Brownian motion (MFBM) and an improved fractional-order particle swarm optimization algorithm. The model adjusts parameters to incorporate both GBM and geometric fractional Brownian motion (GFBM). Through experiments and error analysis, it was proved that the proposed model outperformed GBM, GFBM, and MFBM models in stock price prediction, highlighting its accuracy and validity.
In contrast to traditional mathematical and statistical methods, machine learning models have been shown in multiple research studies to have better predictive accuracy (Kim et al. [20], Shin et al. [21], Grendas et al. [22], Chae and Choi [23]). As a result, we have chosen to use the SHAP-XGBoost algorithm to predict stock prices for K-Pop entertainment companies.
Our study contributes to the literature in three ways. First, the results of the research on the K-Pop industry contribute to the previous financial literature. Recently, interest in K-Pop has grown worldwide; accordingly, we provide an empirical analysis of companies related to the K-Pop industry. Second, we compare the influence of global and local public interest in the entertainment industry. To date, no studies have been conducted on the differences between the two. Third, to analyze the influence of factors on entertainment companies’ stock prices, we employ the SHAP-XGBoost algorithm. Accordingly, we analyze the extent to which each feature contributes to the entertainment companies’ stock prices and the most influential features. To the best of our knowledge, this is the first study to use the explainable artificial intelligence (XAI) methodology to predict the stock prices of entertainment companies.
The relationship between people’s interests and the price of financial assets has been the subject of extensive research. Several studies have explored the impact of interest measures on predicting financial asset prices (Barber and Odean [24], Da et al. [25], Li and Yu [26], Zhang et al. [27], Han et al. [28], Halousková et al. [29]). In addition, one common approach to measuring people’s interests is by analyzing the public’s search volume or frequency, often using platforms such as Google search volume. Numerous studies have reported findings on the relationship between the Google search volume data and financial asset prices (Bank et al. [30], Alexander Dietzel et al. [31], Liu et al. [32], Li et al. [33], Hu et al. [34], Huang et al. [35], Fan et al. [36]). Building on this body of literature, our study aims to investigate the relationship between measures of public interest and stock prices, with a particular focus on the entertainment industry. We posit that the measure of public interest in the entertainment industry, specifically K-Pop, can play a crucial role in predicting stock prices. K-Pop has experienced a significant surge in popularity, not only in the local (Korean) market but also in the global market. Therefore, it serves as a compelling subject of analysis for our study.
The remainder of this paper is organized as follows. In the following section, we briefly introduce the previous studies related to our study. In Section 3, we introduce the SHAP-XGBoost model. Section 4 describes the indicator data (Naver Trend and GSVI) and provides a preliminary statistical analysis of the stock prices of the four companies. Section 5 presents the results of the feature importance analysis. Finally, we provide the summary and concluding remarks in Section 6.
2. Literature Review
2.1. Social Network Service Data
Several studies have analyzed the relationship between stocks and GSVI. Moussa et al. [1] assessed how GSVI, which substitutes investor attention, affects stock market trading volume. Swamy et al. [5] detected that high quantiles of GSVI predict positive and significant returns in the ensuing three weeks, and GSVI operates as a valuable forecaster of both the direction and magnitude of excess returns. Chen et al. [2] studied the relationship between investor sentiment and stock market accrued volatility. This study suggests that the search volume index, which acts as a surrogate for investor attention, has good performance in the autogressive moving average model (ARMA). Lee et al. [3] investigated whether investor attention proxied by GSVI and native country-specific factors affects the quantile of ETF returns. El Ouadghiri et al. [37] examined the impact of US media concern about climate change and pollution on US stock indices using US GSVI for these two topics. Dharani et al. [38] investigated the connection between GSVI and stock returns in India and discovered that the search attention index (SAI) and excess stock returns have a positive correlation.
2.2. Entertainment Stock
Subsequently, these studies investigated the volatility of entertainment stocks. Joshi and Hanssens [39] inspected the impact of a single movie’s release on the investor assessment of the studio. They found that it indirectly influences the evaluation of the studio and raises the expectation of excess stock returns after release. Joshi [40] evaluated the difference between the weekly revenue of star and average movies from the same genre to study the financial effect of movie stars. This study found that the revenue of movies with a star has lower weekly volatility than that of the average movie. Ltaifa et al. [41] investigated the variation of the market risk of entertainment enterprises in the Vietnamese stock exchange market during two periods, which was two years after low inflation and financial crisis. Edwards Barros et al. [42] assessed the fluctuation of Nintendo’s stock price with the publicity of the launch of the game Pokémon Go!, the symbolic game of the Nintendo. Chen [43] examined the impact of COVID-19 on Disney’s stock price and returns and discovered that the epidemic negatively and significantly affected the volatility of Disney’s stock for a short period. Wu and Chen [44] researched whether media attention influences noneffective investment of A-share companies from the Chinese sports and entertainment industry. Their study suggests that media attention has a significantly negative effect on the overinvestment of assigned firms but not on the underinvestment. Hayduk III [45] analyzed the force of the host announcement of the 2018 PyeongChang Olympics on South Korea’s stock market and demonstrated that the statement had positive and influential power on cumulative abnormal returns (CAR) for 25 trading days after the announcement.
2.3. XAI
Yun et al. [46] adopted a hybrid GA-XGBoost prediction method for stock price direction forecasting and showed the significant and sound performance of feature engineering. In addition, they interpreted the results using the SHAP technique. Antwarg et al. [47] introduced a method that uses Kernel SHAP for explaining anomalies revealed by an autoencoder and explained the linkage between the features and their impact when reconstruction error is high. They also demonstrated its efficiency, as SHAP is significantly more robust than LIME. Weng et al. [48] investigated using XGBoost to study the effect of financial pressure in forecasting the volatility of health care stocks in China and the USA. They adopted SHapley Additive exPlanations to interpret the predictions of XGBoost, which demonstrated that the contribution of financial pressure is significantly stronger in China than in the USA. Lin and Bai [49] analyzed the connection among financial and non-financial indicators using the measurement data of 40 listed companies for feature selection with the XGBoost. They evaluated the effects of these indicators using the Shapley additive explanation value. Zou et al. [50] created a weighted XGBoost cost-sensitive model for predicting business failure and analyzed its interpretability, depicting the feature importance with a partial dependence plot (PDP).
3. Methods
3.1. Extreme Gradient Boosting (XGBoost)
Extreme Gradient Boosting (XGBoost) is an enhanced version of gradient boosting, which is a tree-based ensemble method. XGBoost overcomes the limitations of gradient boosting by addressing computational restrictions, handling regularization, allowing parallel training, and addressing missing data. Unlike gradient boosting, XGBoost uses a second-order Taylor expansion in its loss function and incorporates the learning results from previous iterations to weigh each sample during the current training phase (Nasiri et al. [12], Sairam et al. [51]). Numerous studies have demonstrated that the XGBoost method is a highly accurate and flexible AI predictor tool (Feng et al. [52], Nasiri et al. [12], Alsahaf et al. [53]). Compared with other conventional machine learning approaches, XGBoost offers a more extensive range of hyperparameters, making it better tuned and capable of achieving superior performance.
3.2. Shapley Value
The Shapley value, which originates from game theory, is a widely used method for fairly attributing the contributions of individual players and allocating the overall benefit (Shapley [54]). It is primarily employed in cooperative games in which players work together to form coalitions to maximize collective gain. This concept has been applied in various fields, such as data science, multi-agent systems, and machine learning (Bloch and Friedrich [55], Dong et al. [56], Rozemberczki and Sarkar [57]). The Shapley value is characterized by four fundamental properties, namely efficiency, symmetry, dummy, and additivity, that collectively ensure that the attribution of feature contributions is unbiased and unique. The efficiency property requires that the sum of the feature contributions add up to the total benefit, whereas symmetry states that features that contribute equally should have the same Shapley values. The dummy property requires that a feature with no marginal contribution to any model has a Shapley value of zero. Finally, additivity asserts that the solution is fair and unique when all four properties are satisfied, as established by Shapley [54] in his original work (Li [58]).
The Shapley value examines the weighted sum of the player’s marginal contributions in the cooperative game. When p players participate in a cooperative game, let S be a subset containing players (1), where is the number of elements in subset S. Suppose that is a contribution function of the ith player, which represents the value of coalition S and the total expected sum of profits obtained by the cooperation of the members of S. Except for the ith player, the set of variables is denoted by P. For example, is defined as follows:
where is the outcome of the game when a player in subset S participates.
Recently, the Shapley value has also been adopted to evaluate the contribution of each feature in interpretable machine learning. In XAI, features are considered players, and the prediction is the total benefit (Aas et al. [59]). Lundberg and Lee [60] introduced SHAP, which is a unified framework for explaining the predictions of complex models such as XGBoost. SHAP decomposes a black-box model into a simpler additive model (2). This is the same as LIME in representing the input data x as simplified data .
where , d is the number of simplified features. Here, denotes the Shapley value obtained from (1); is a constant when all the inputs are missing.
4. Data Description
We selected four entertainment companies (HYBE, SM, YG, and JYP) that have a significant impact on the K-Pop industry, and we collected their daily stock prices from 1 November 2020 to 31 December 2022. The selected companies have a strong presence in the Korean entertainment industry, either by creating groundbreaking changes or by starting their businesses during the emergence of the K-Pop industry in the late 1990s or the early 2000s.
From the four entertainment companies, we selected at least five representative artists based on their album sales on the Hanteo chart and their popularity as measured by their Instagram followers. Table 1 lists the representative artists selected from each enterprise. To measure the interest of investors in the chosen artists, we utilized Naver and Google Trend indexes during the same period, which were set to 100 on the day when a specific search term was most frequently searched during the sample period; the search volume was relatively represented on a scale of 0 to 100. In addition, we collected data during the same period on four stock market indexes (KOSPI, VKOSPI, S&P 500, and VIX) to examine the impact of domestic and US markets on the K-Pop industry.
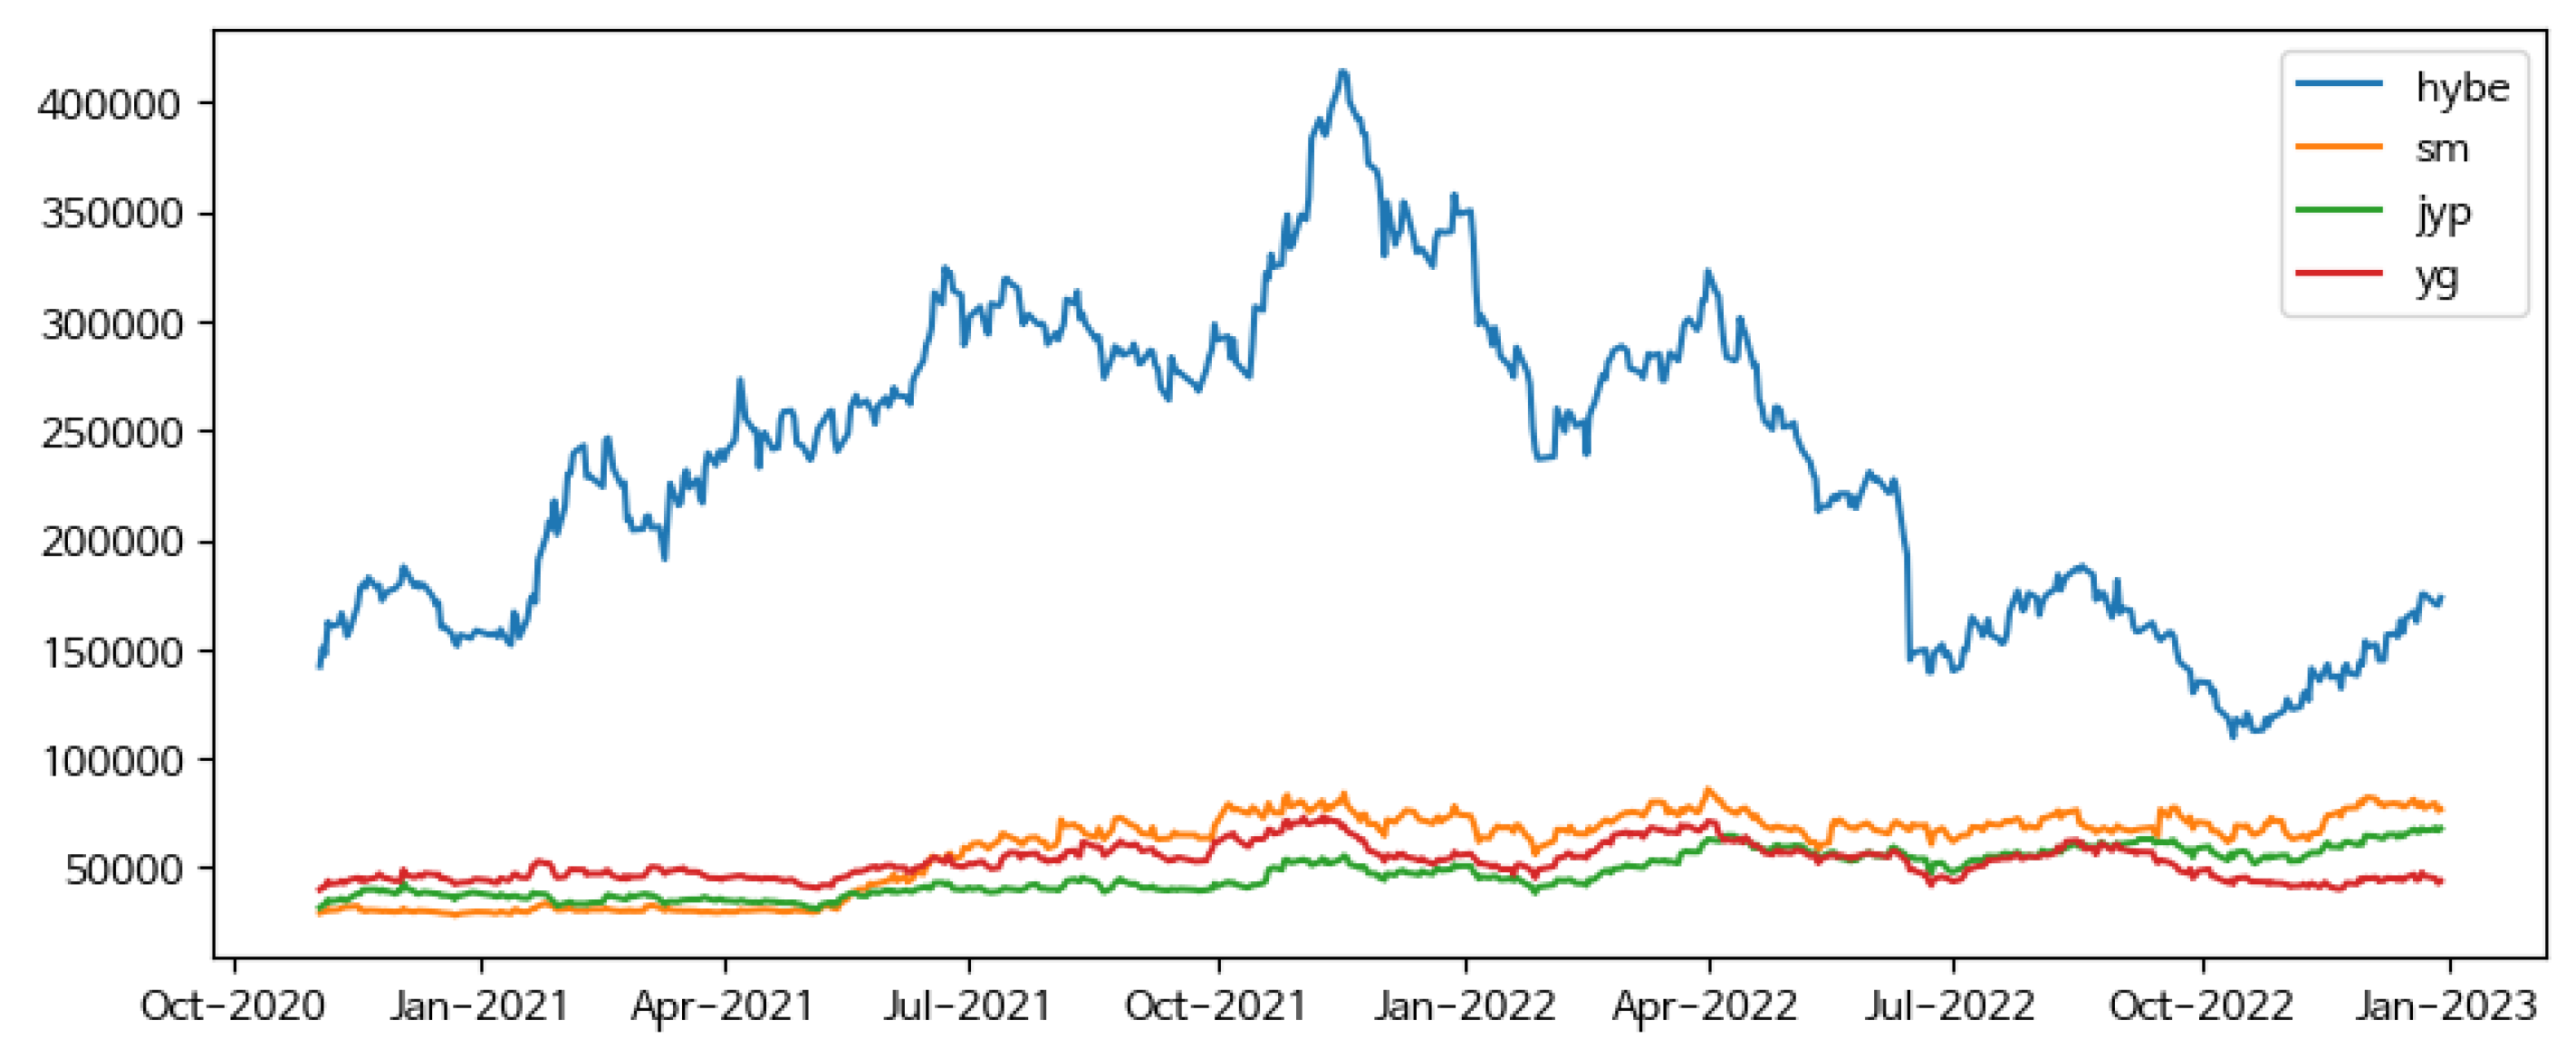
Table 2 displays the summary statistics of the stock prices of the four entertainment firms and four stock indexes (KOSPI, VKOSPI, S&P 500, and VIX). Among the entertainment companies’ stock prices, HYBE has the highest value, and its range is drastically different from the rest. The ranges of SM, YG, and JYP’s stock prices are similar; however, JYP’s stock price is the lowest. HYBE has a relatively large standard deviation, confirming that the data are divided into two clusters based on their distribution. On the other hand, YG has a significantly small standard deviation and high kurtosis, suggesting that the data are concentrated around the mean and have a sharp distribution. SM’s stock price has a negative skewness value, indicating a left-skewed distribution. Regarding the stock price index data, KOSPI has a negative skewness and the smallest kurtosis, indicating a left-skewed distribution with a thin tail. In fact, examining the data distribution confirms that the data are divided into three clusters. VKOSPI has a skewness of 1.08, indicating a right-skewed distribution. It also has the largest kurtosis among the stock price index data, suggesting a relatively thick tail distribution.
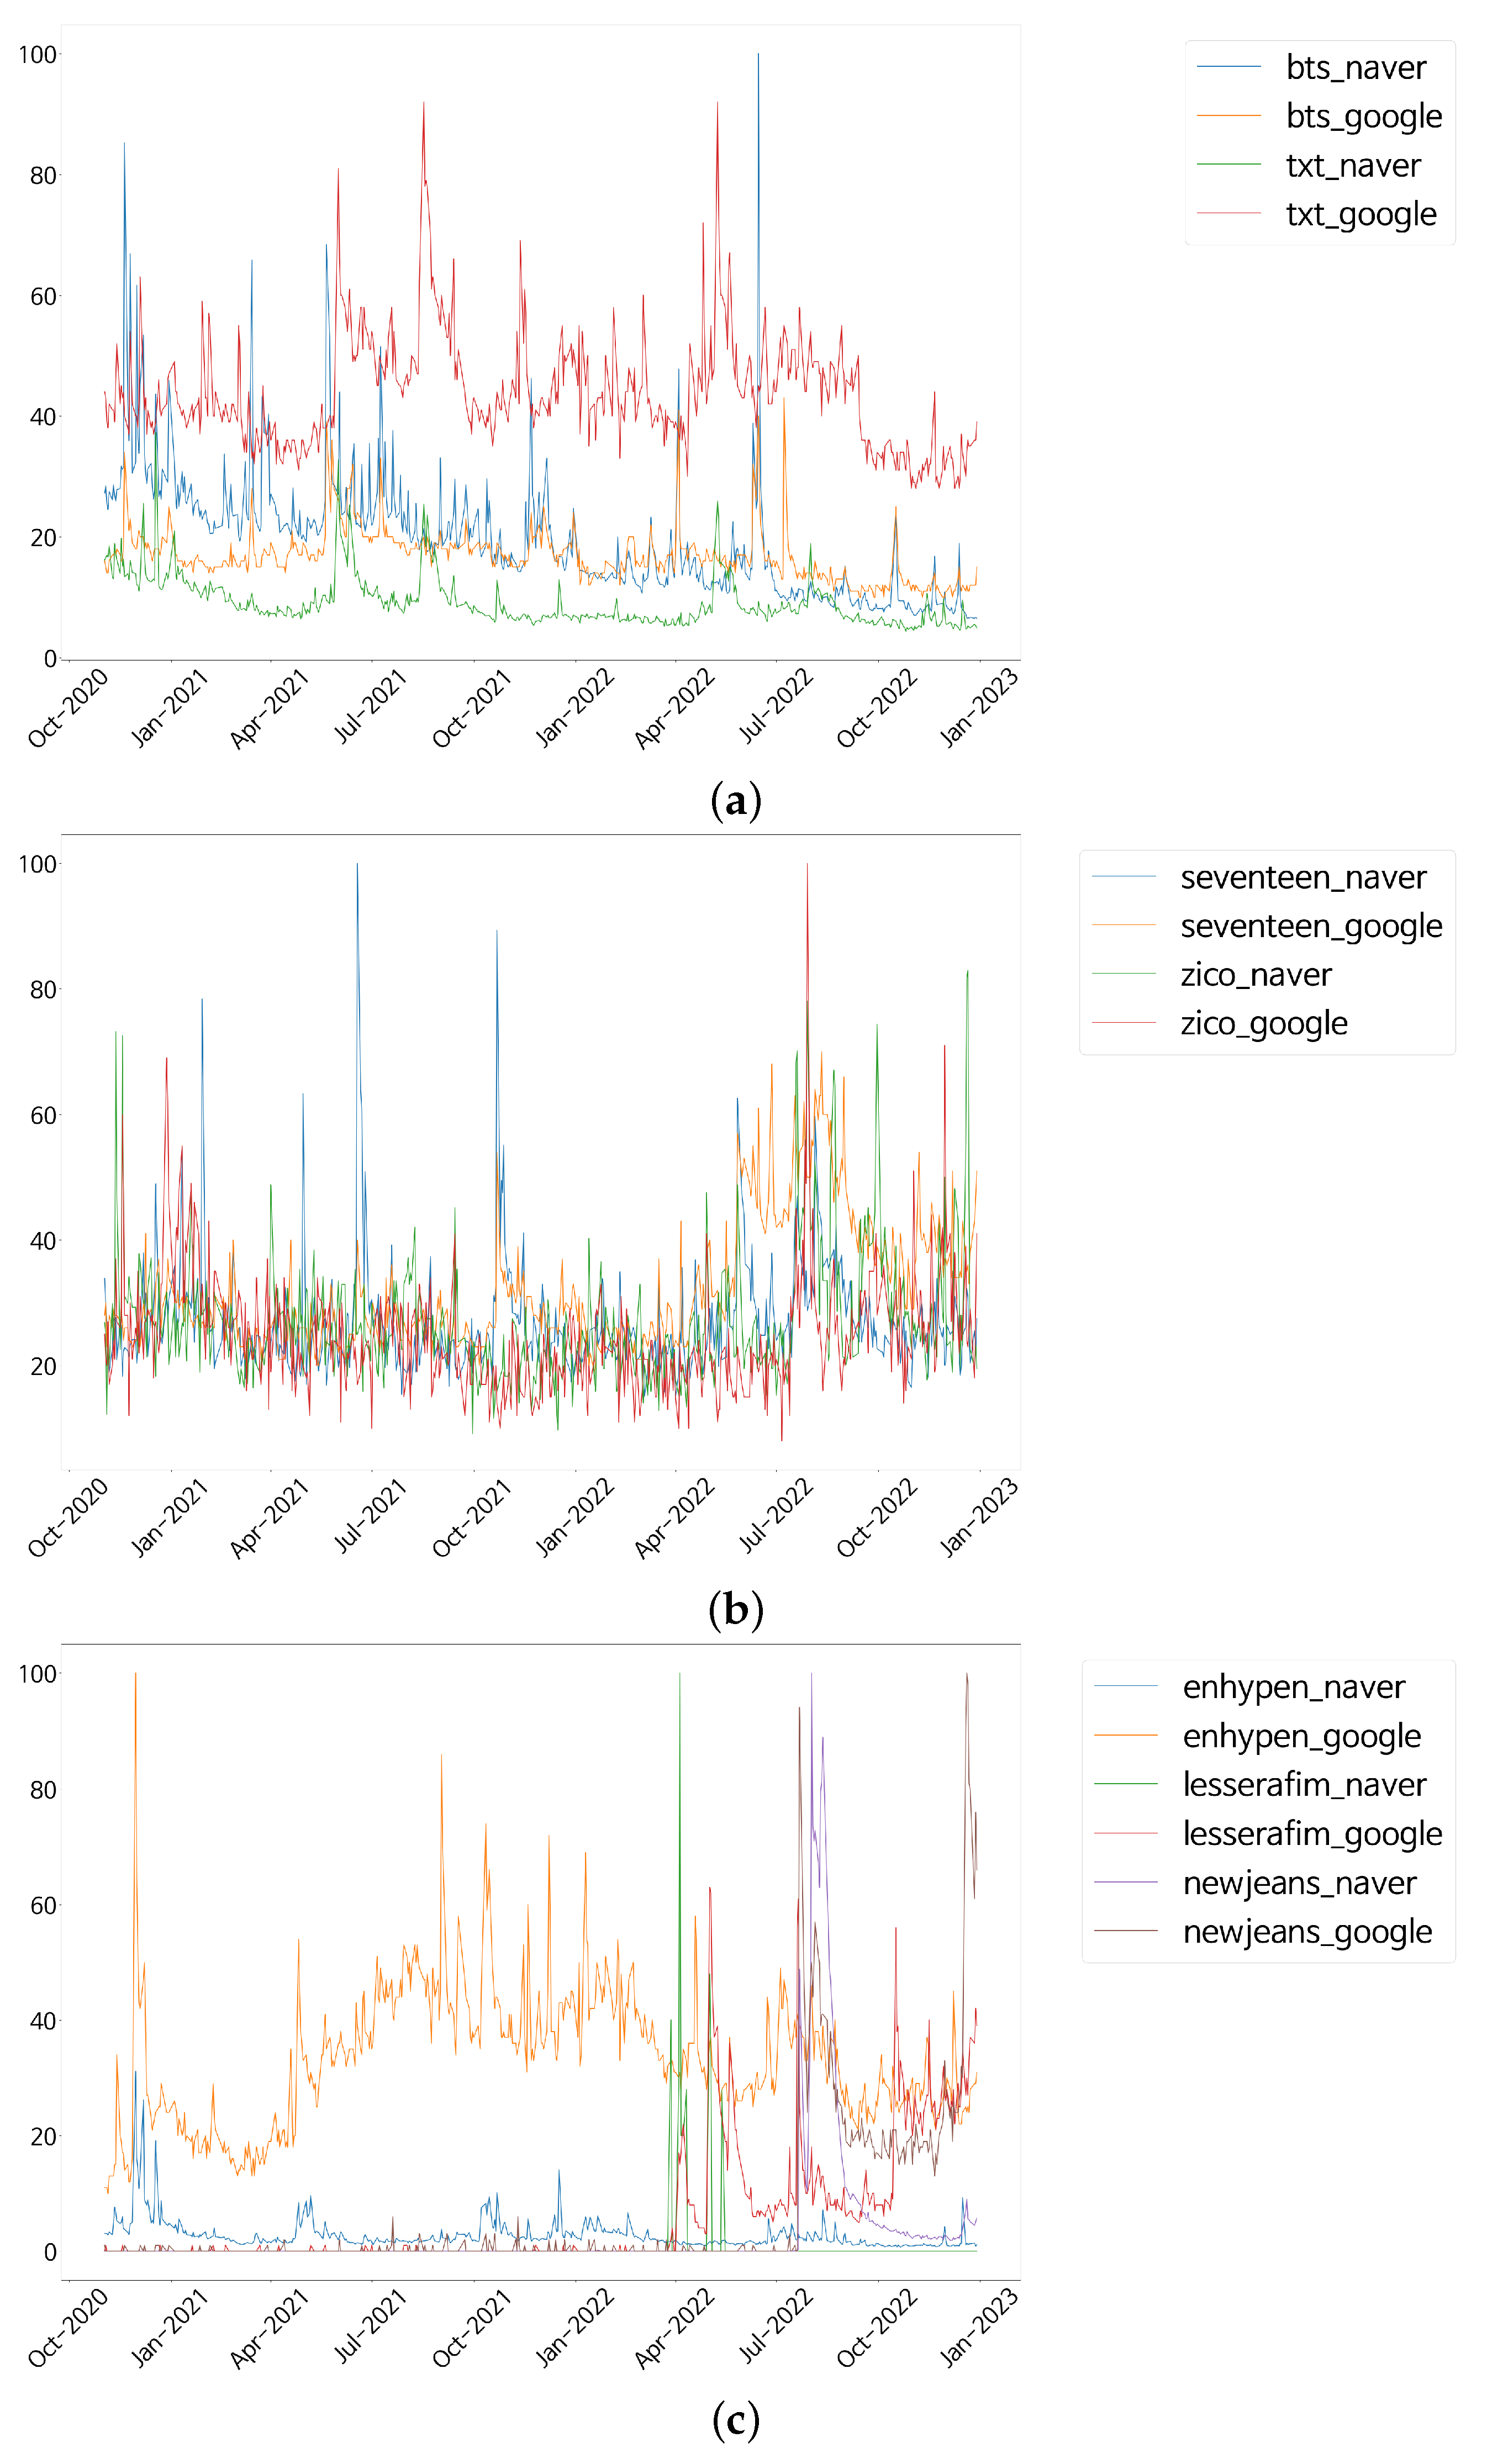
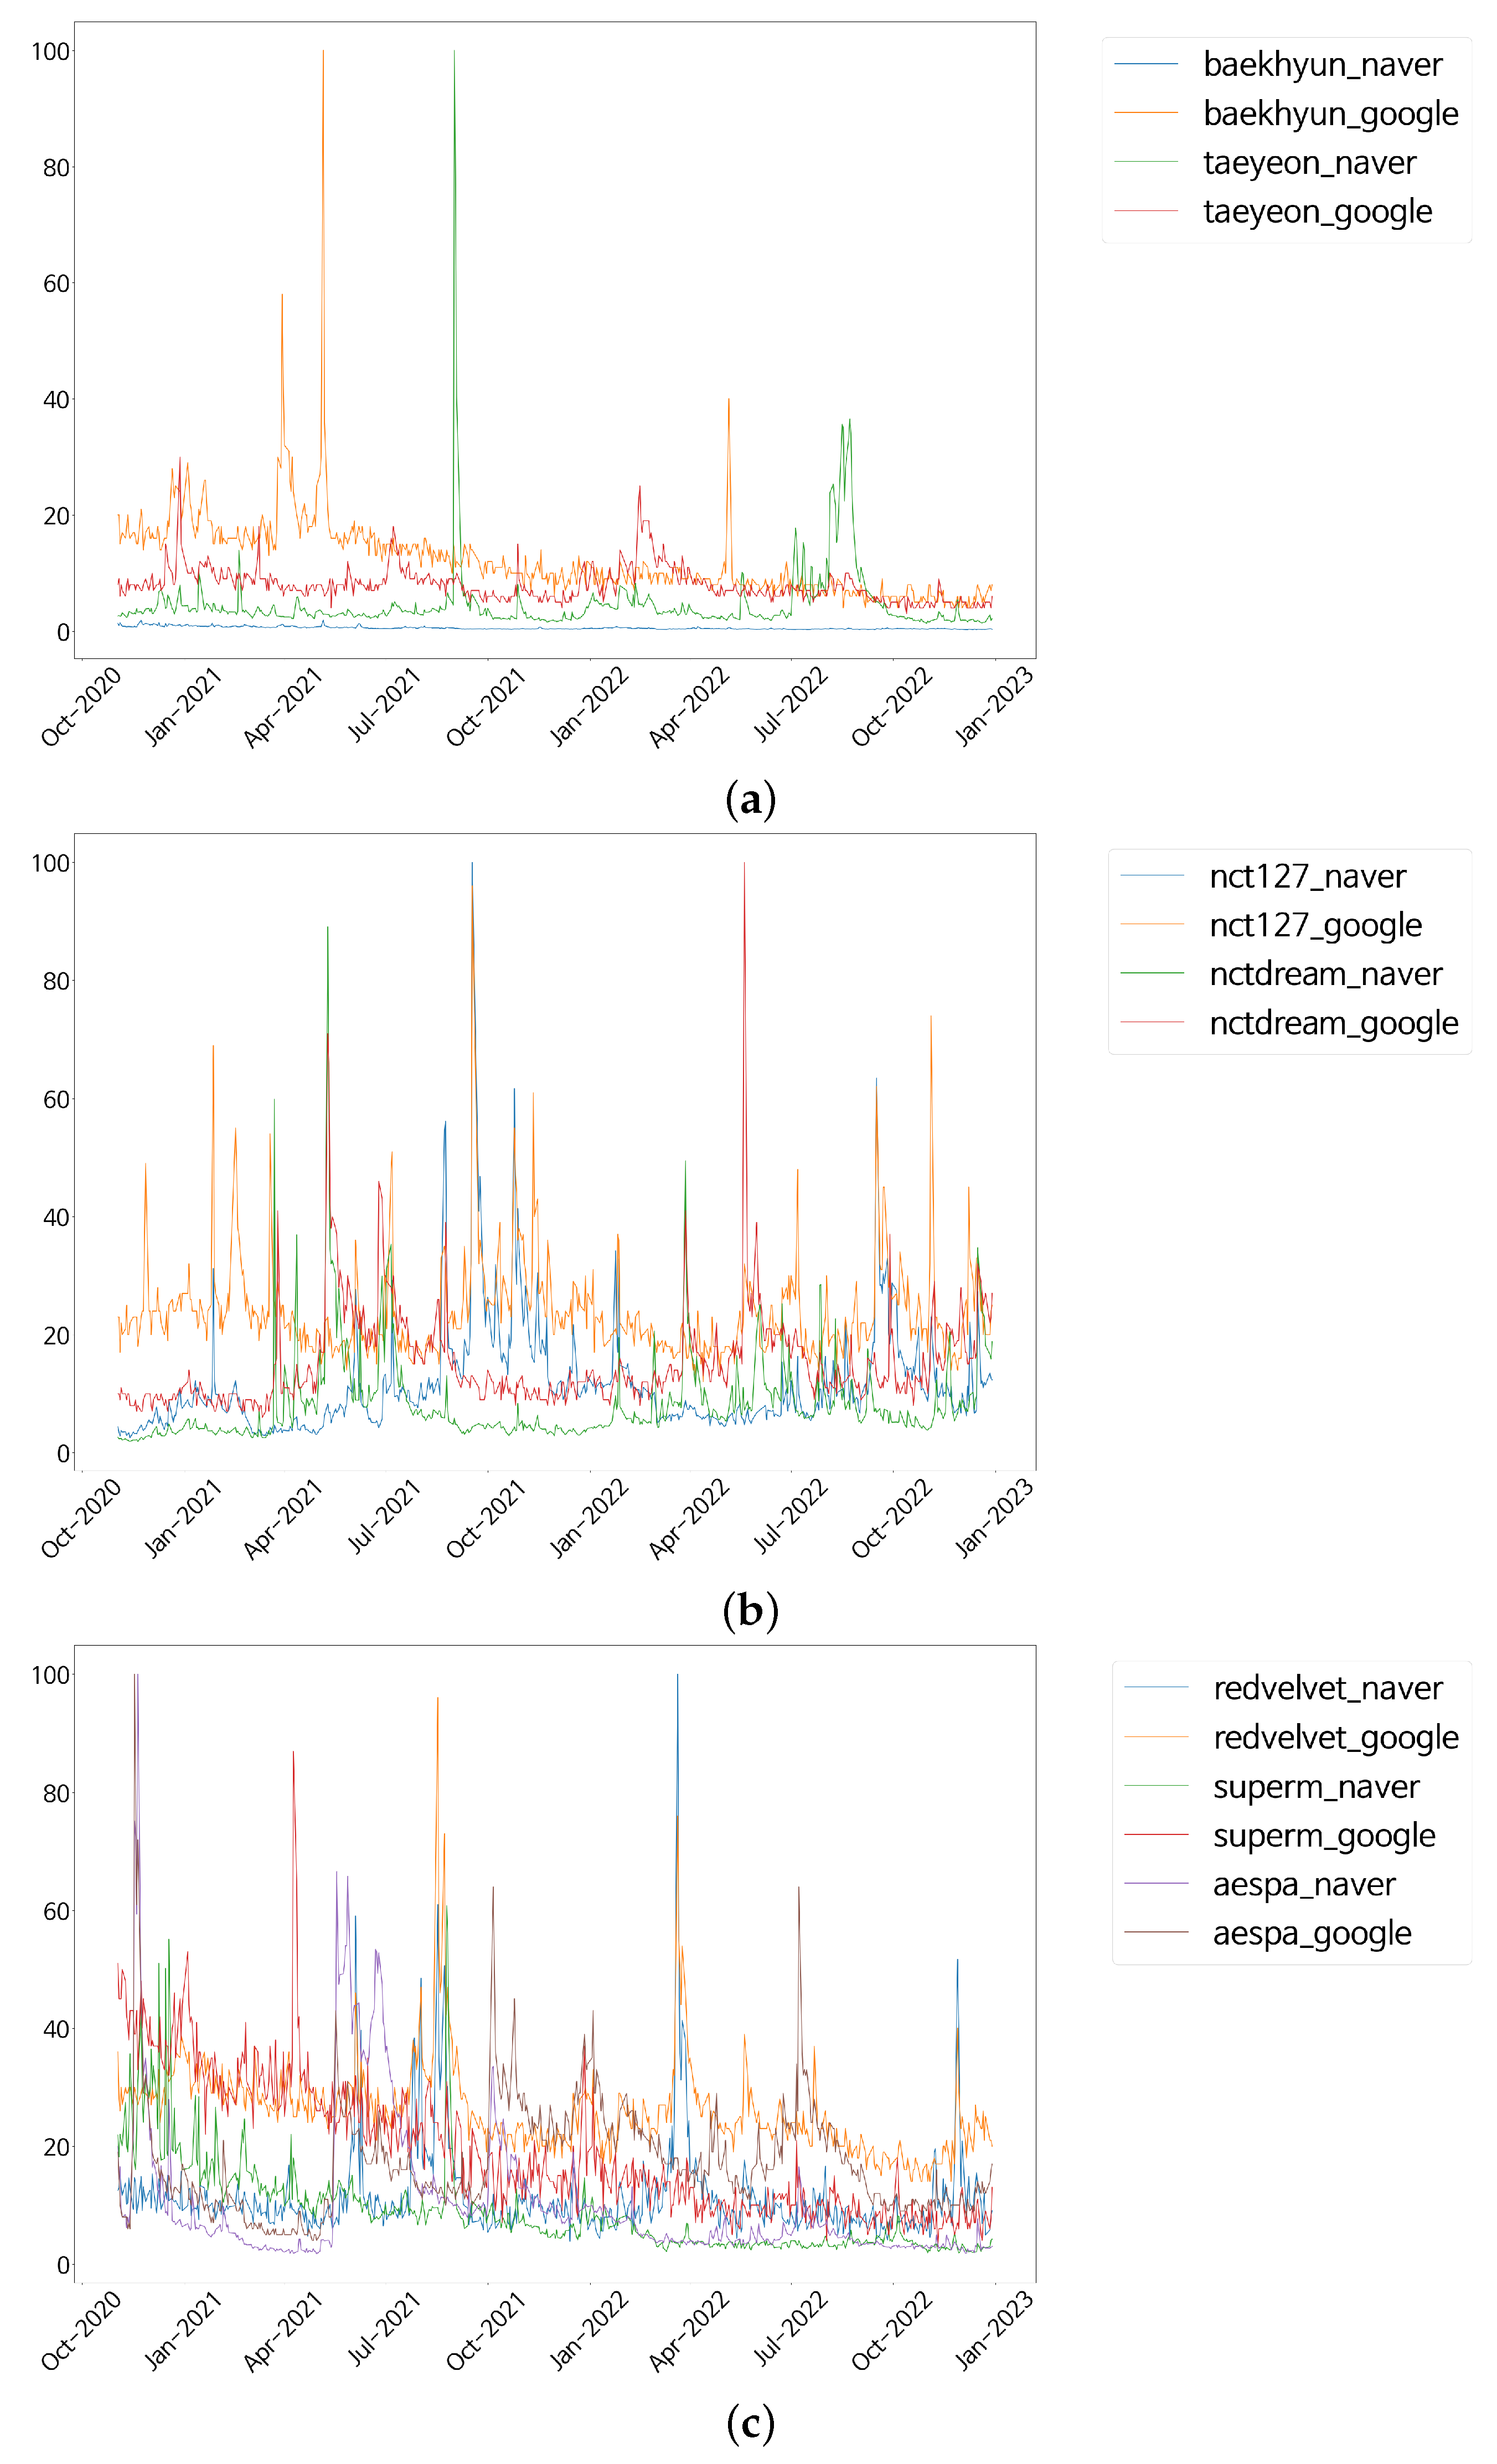
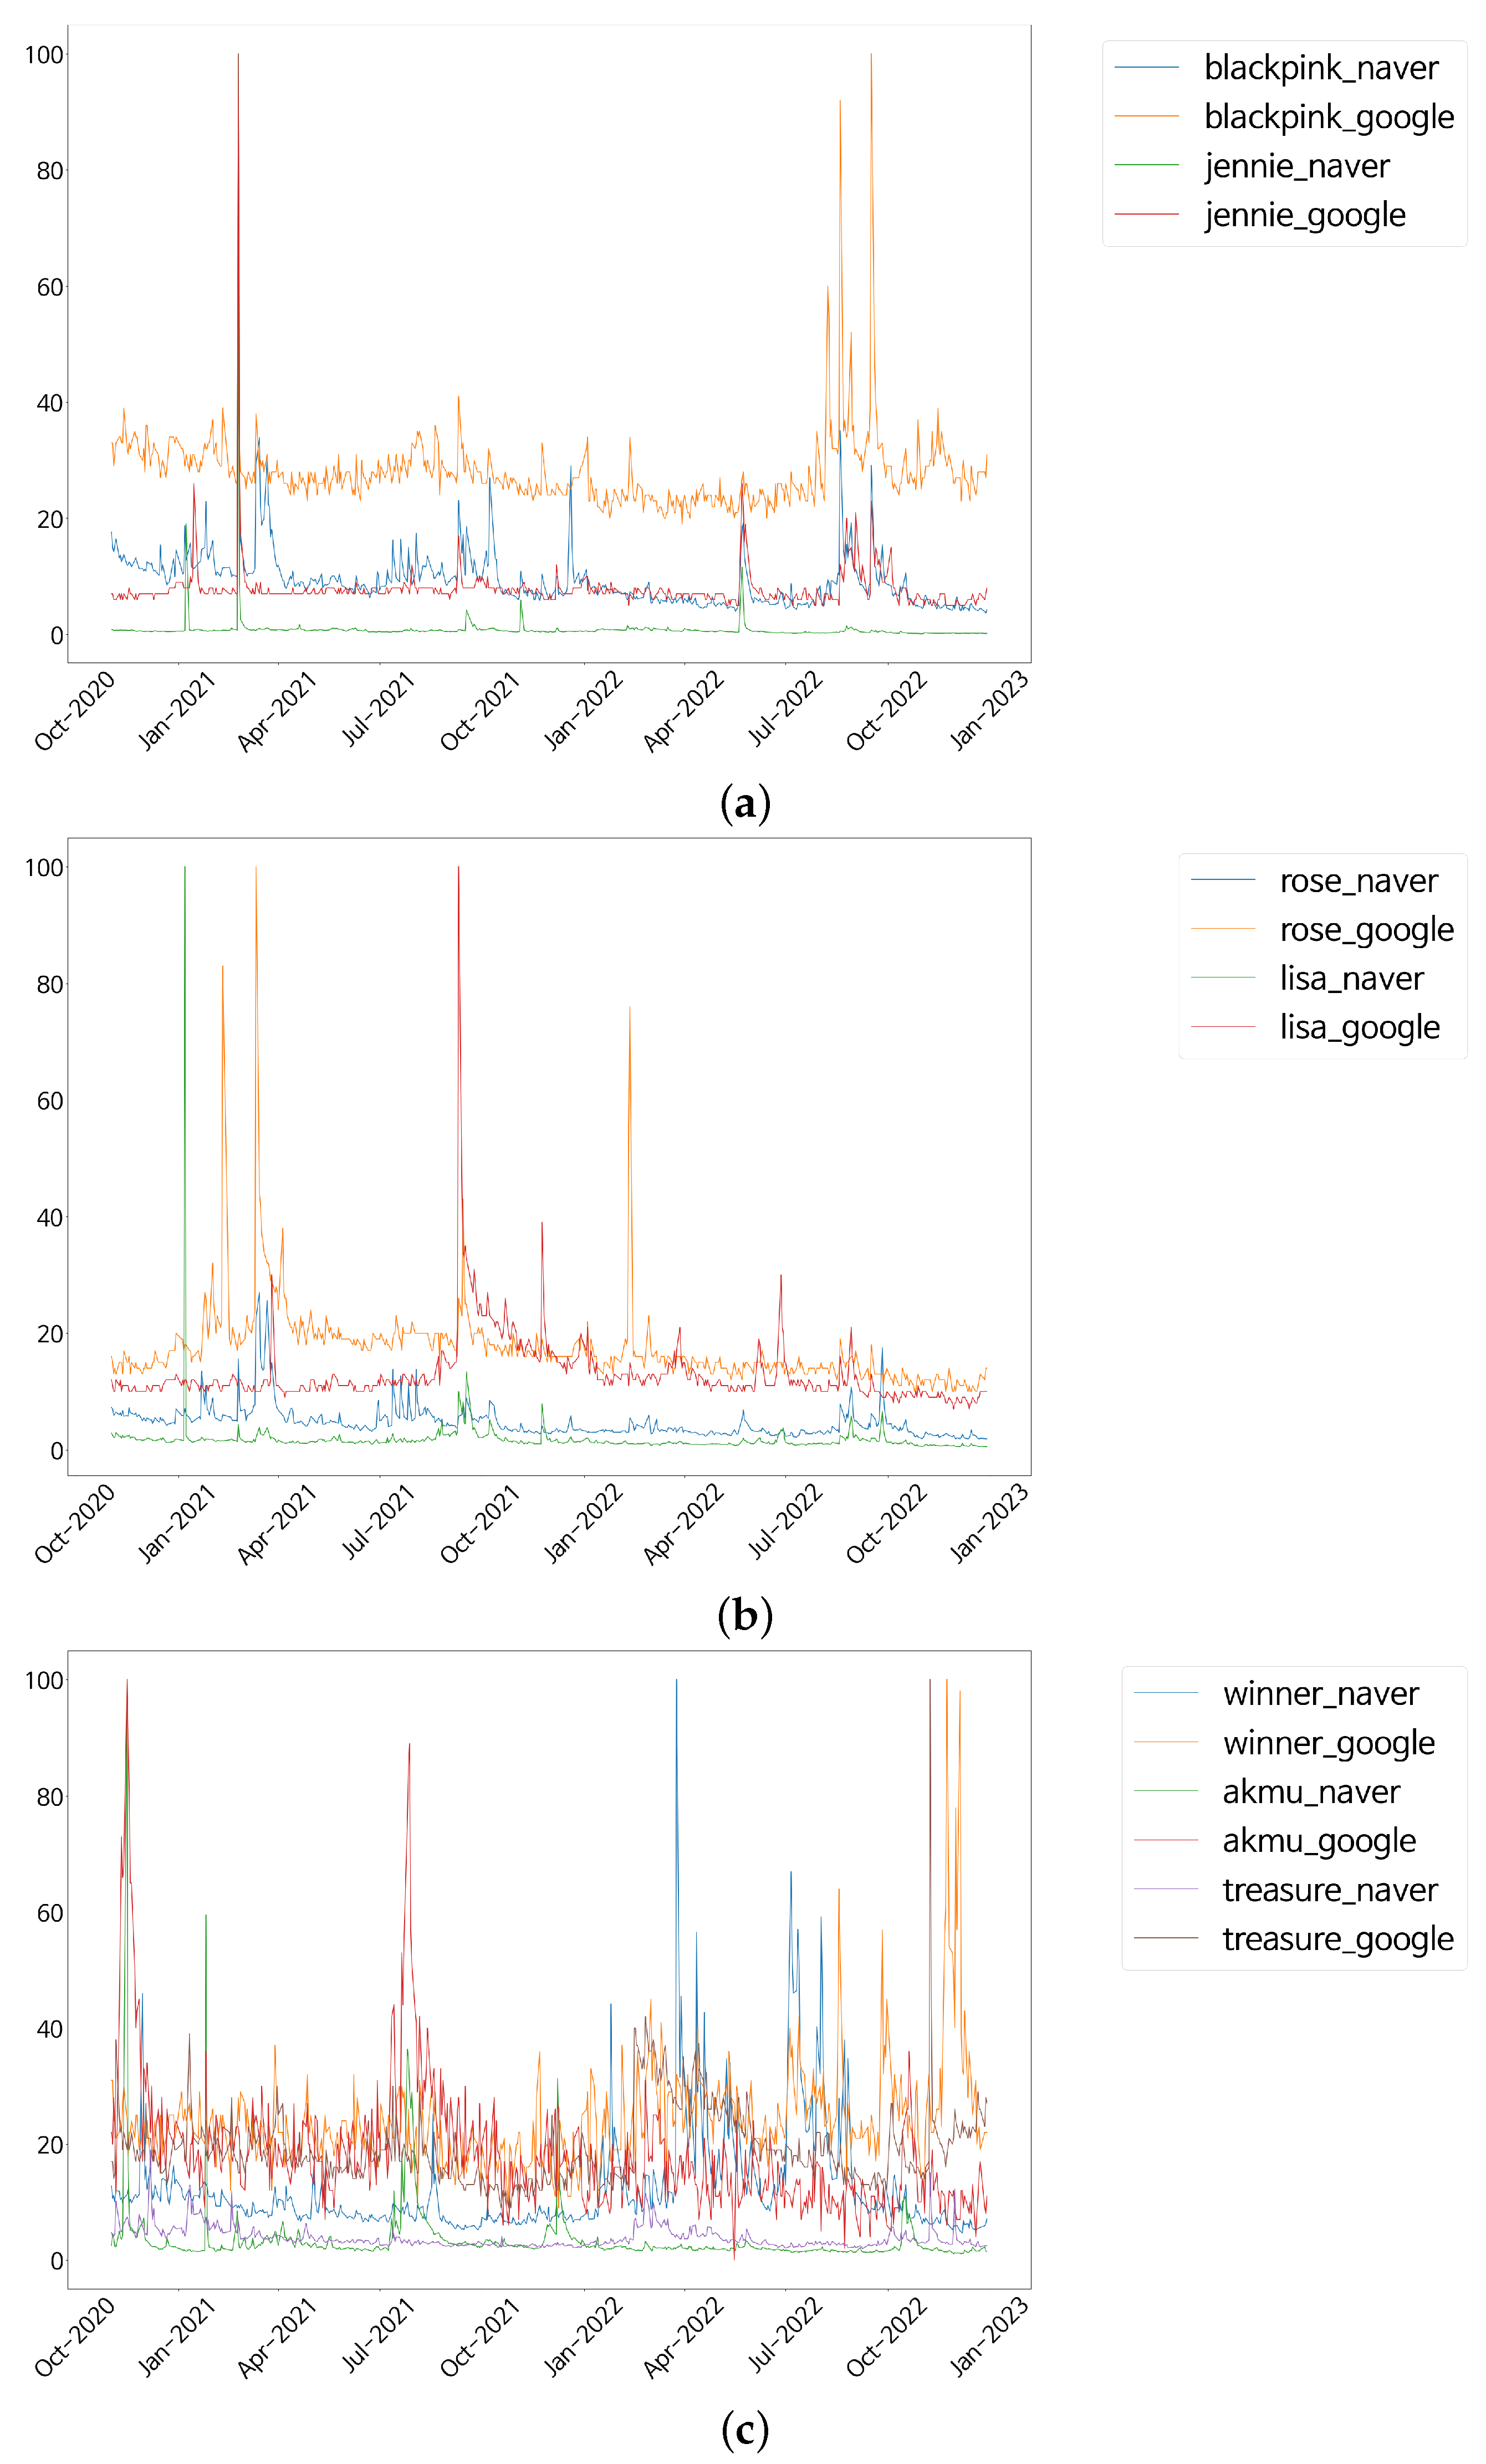
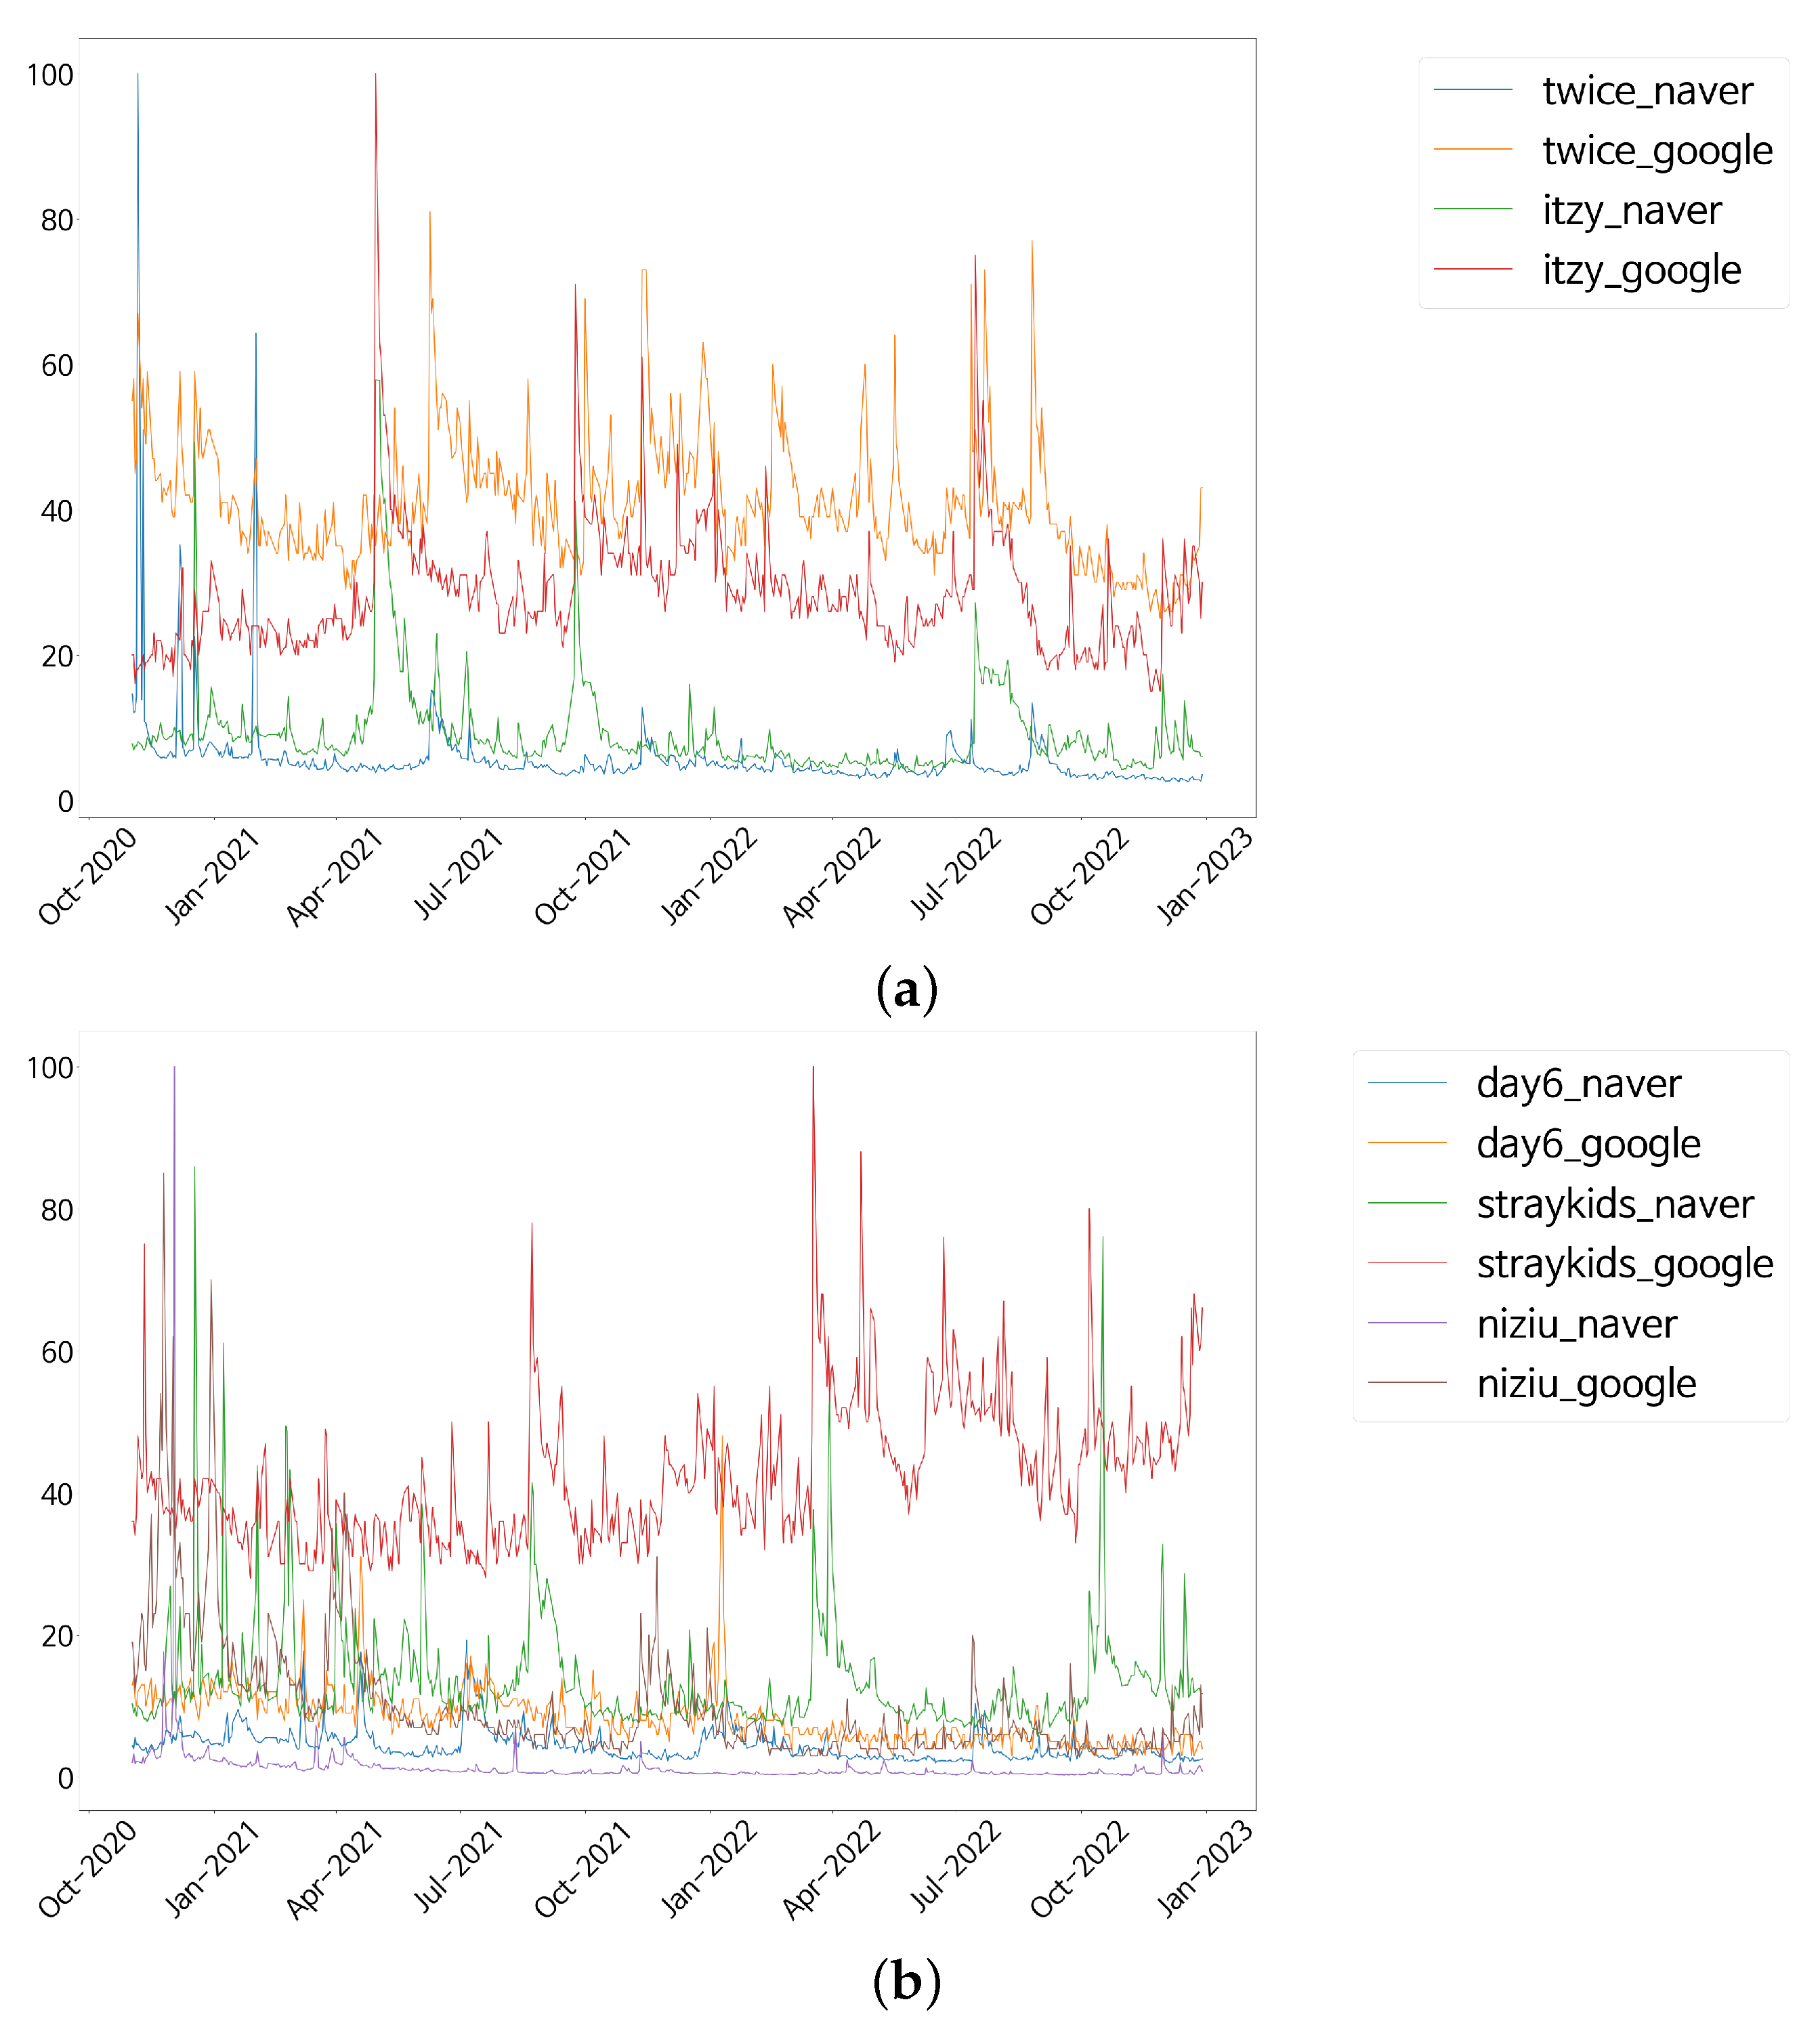
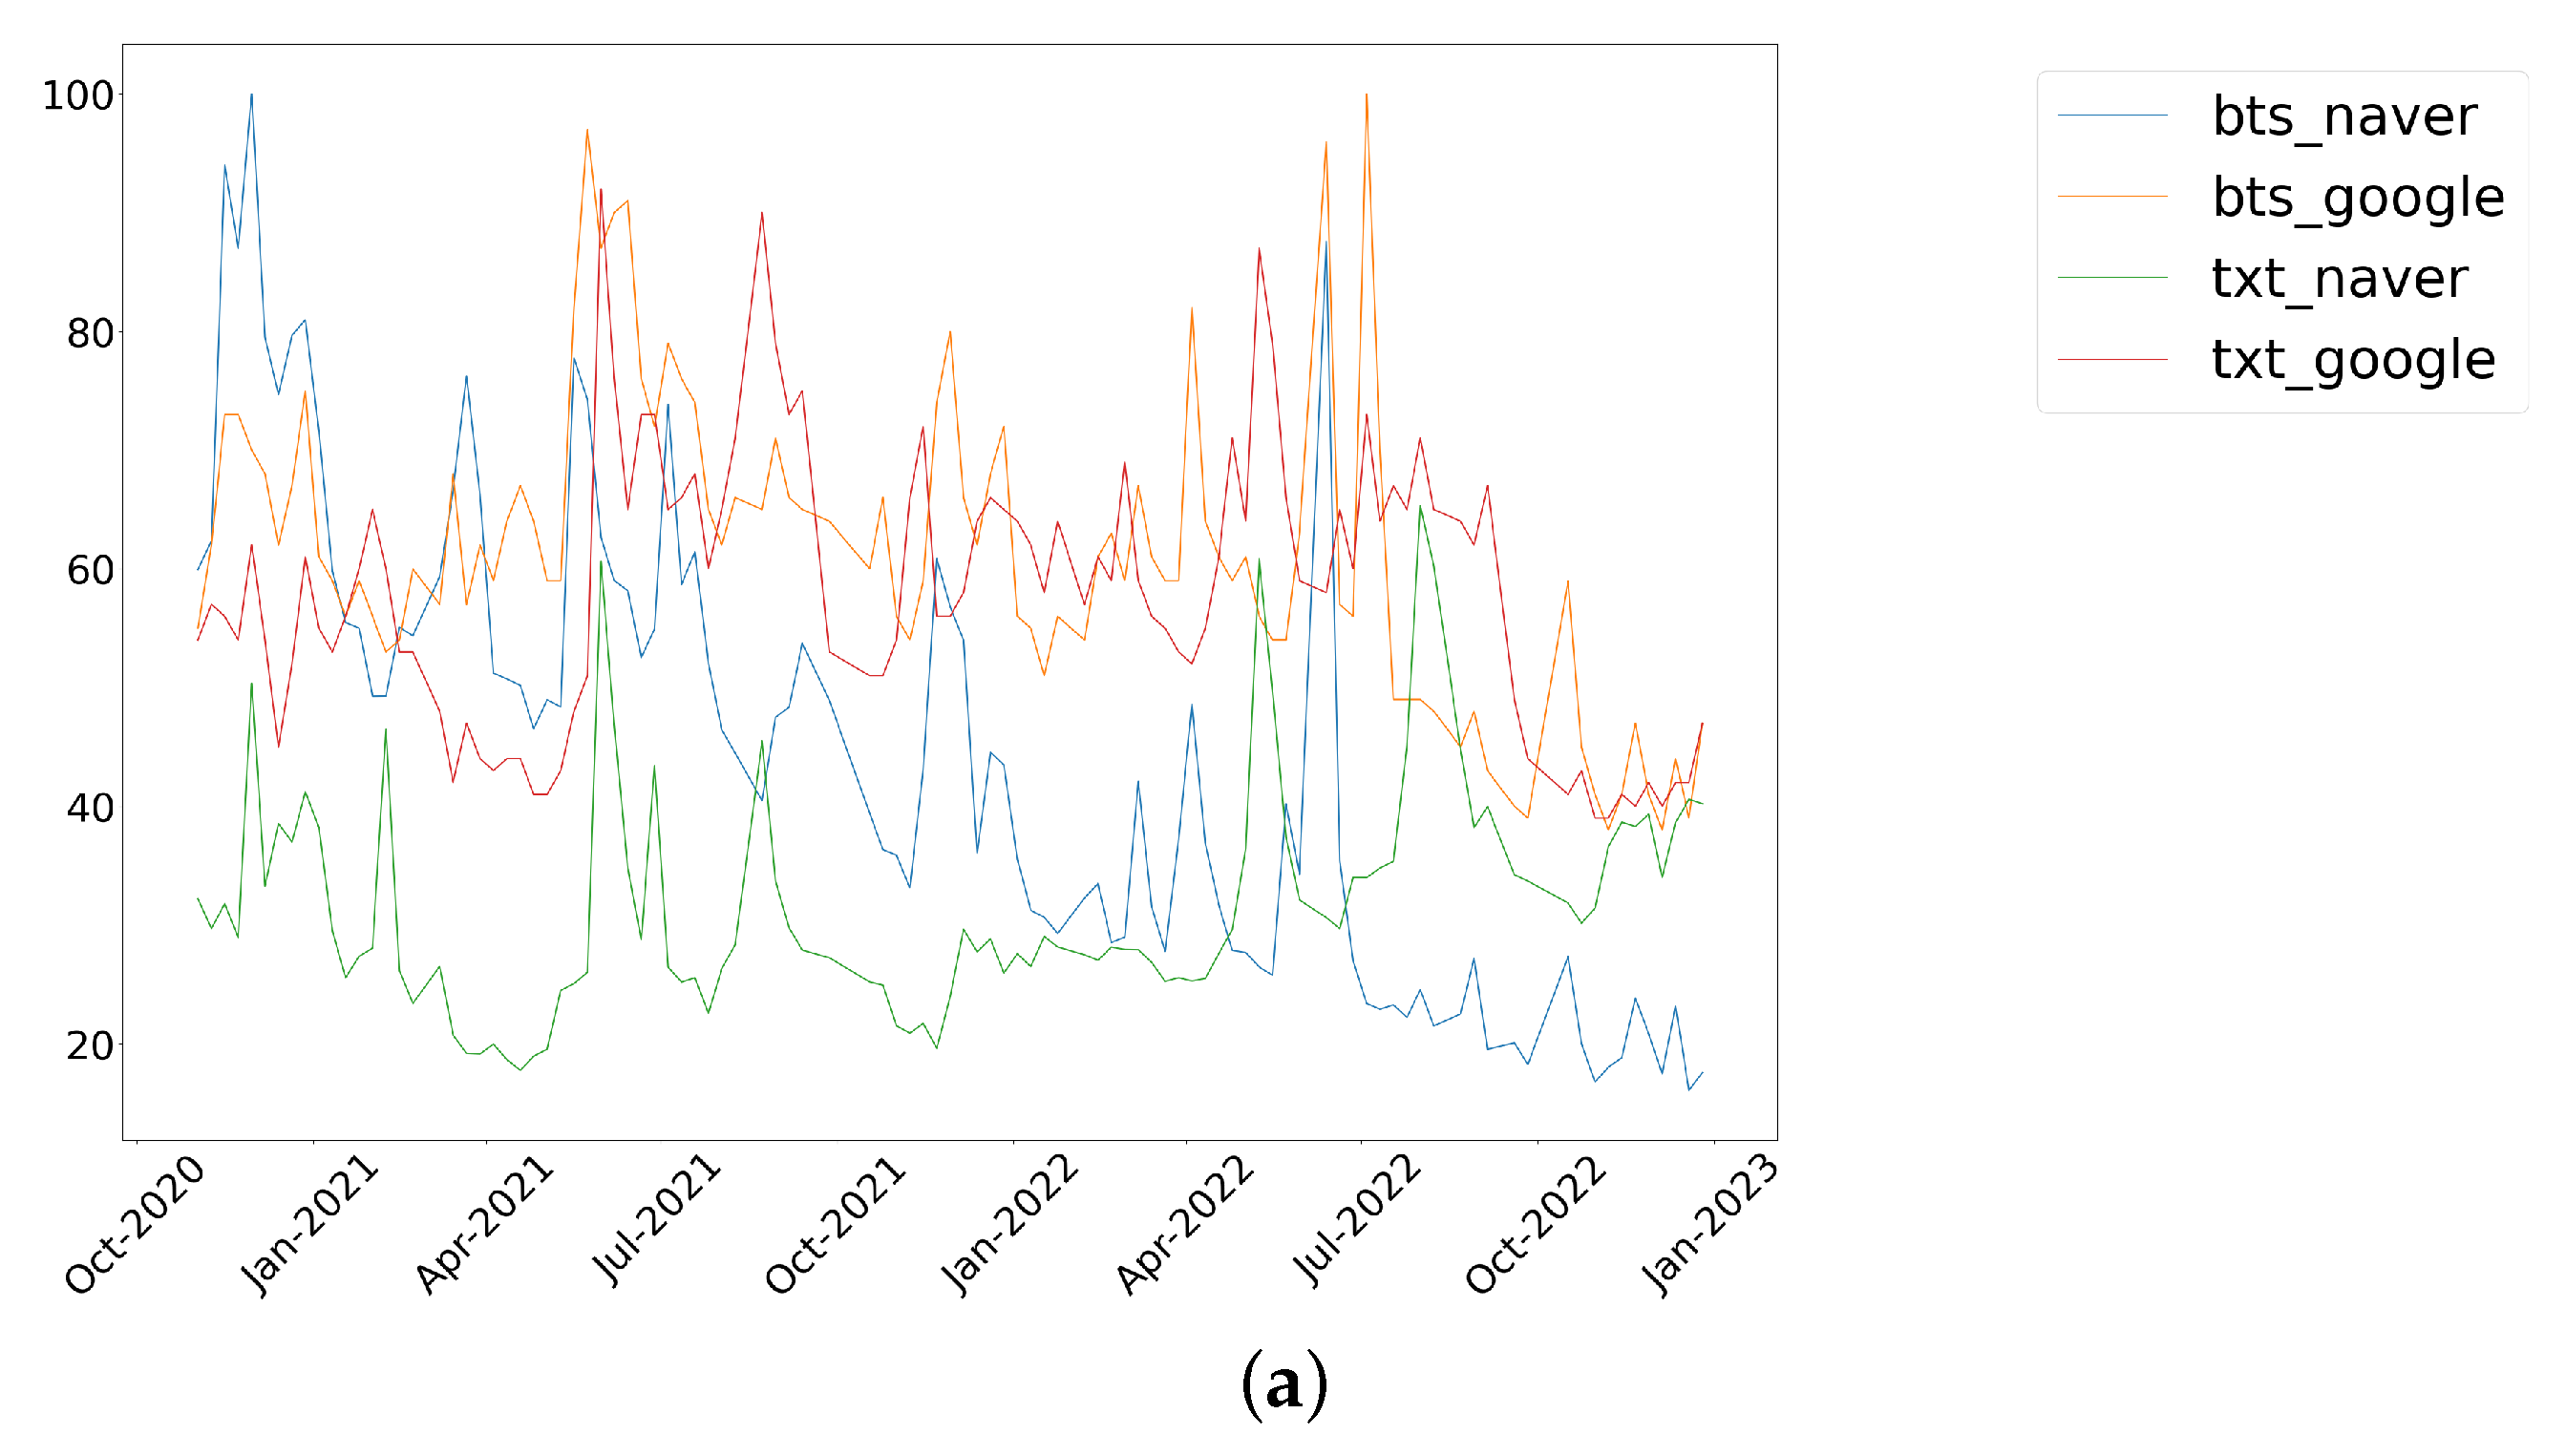
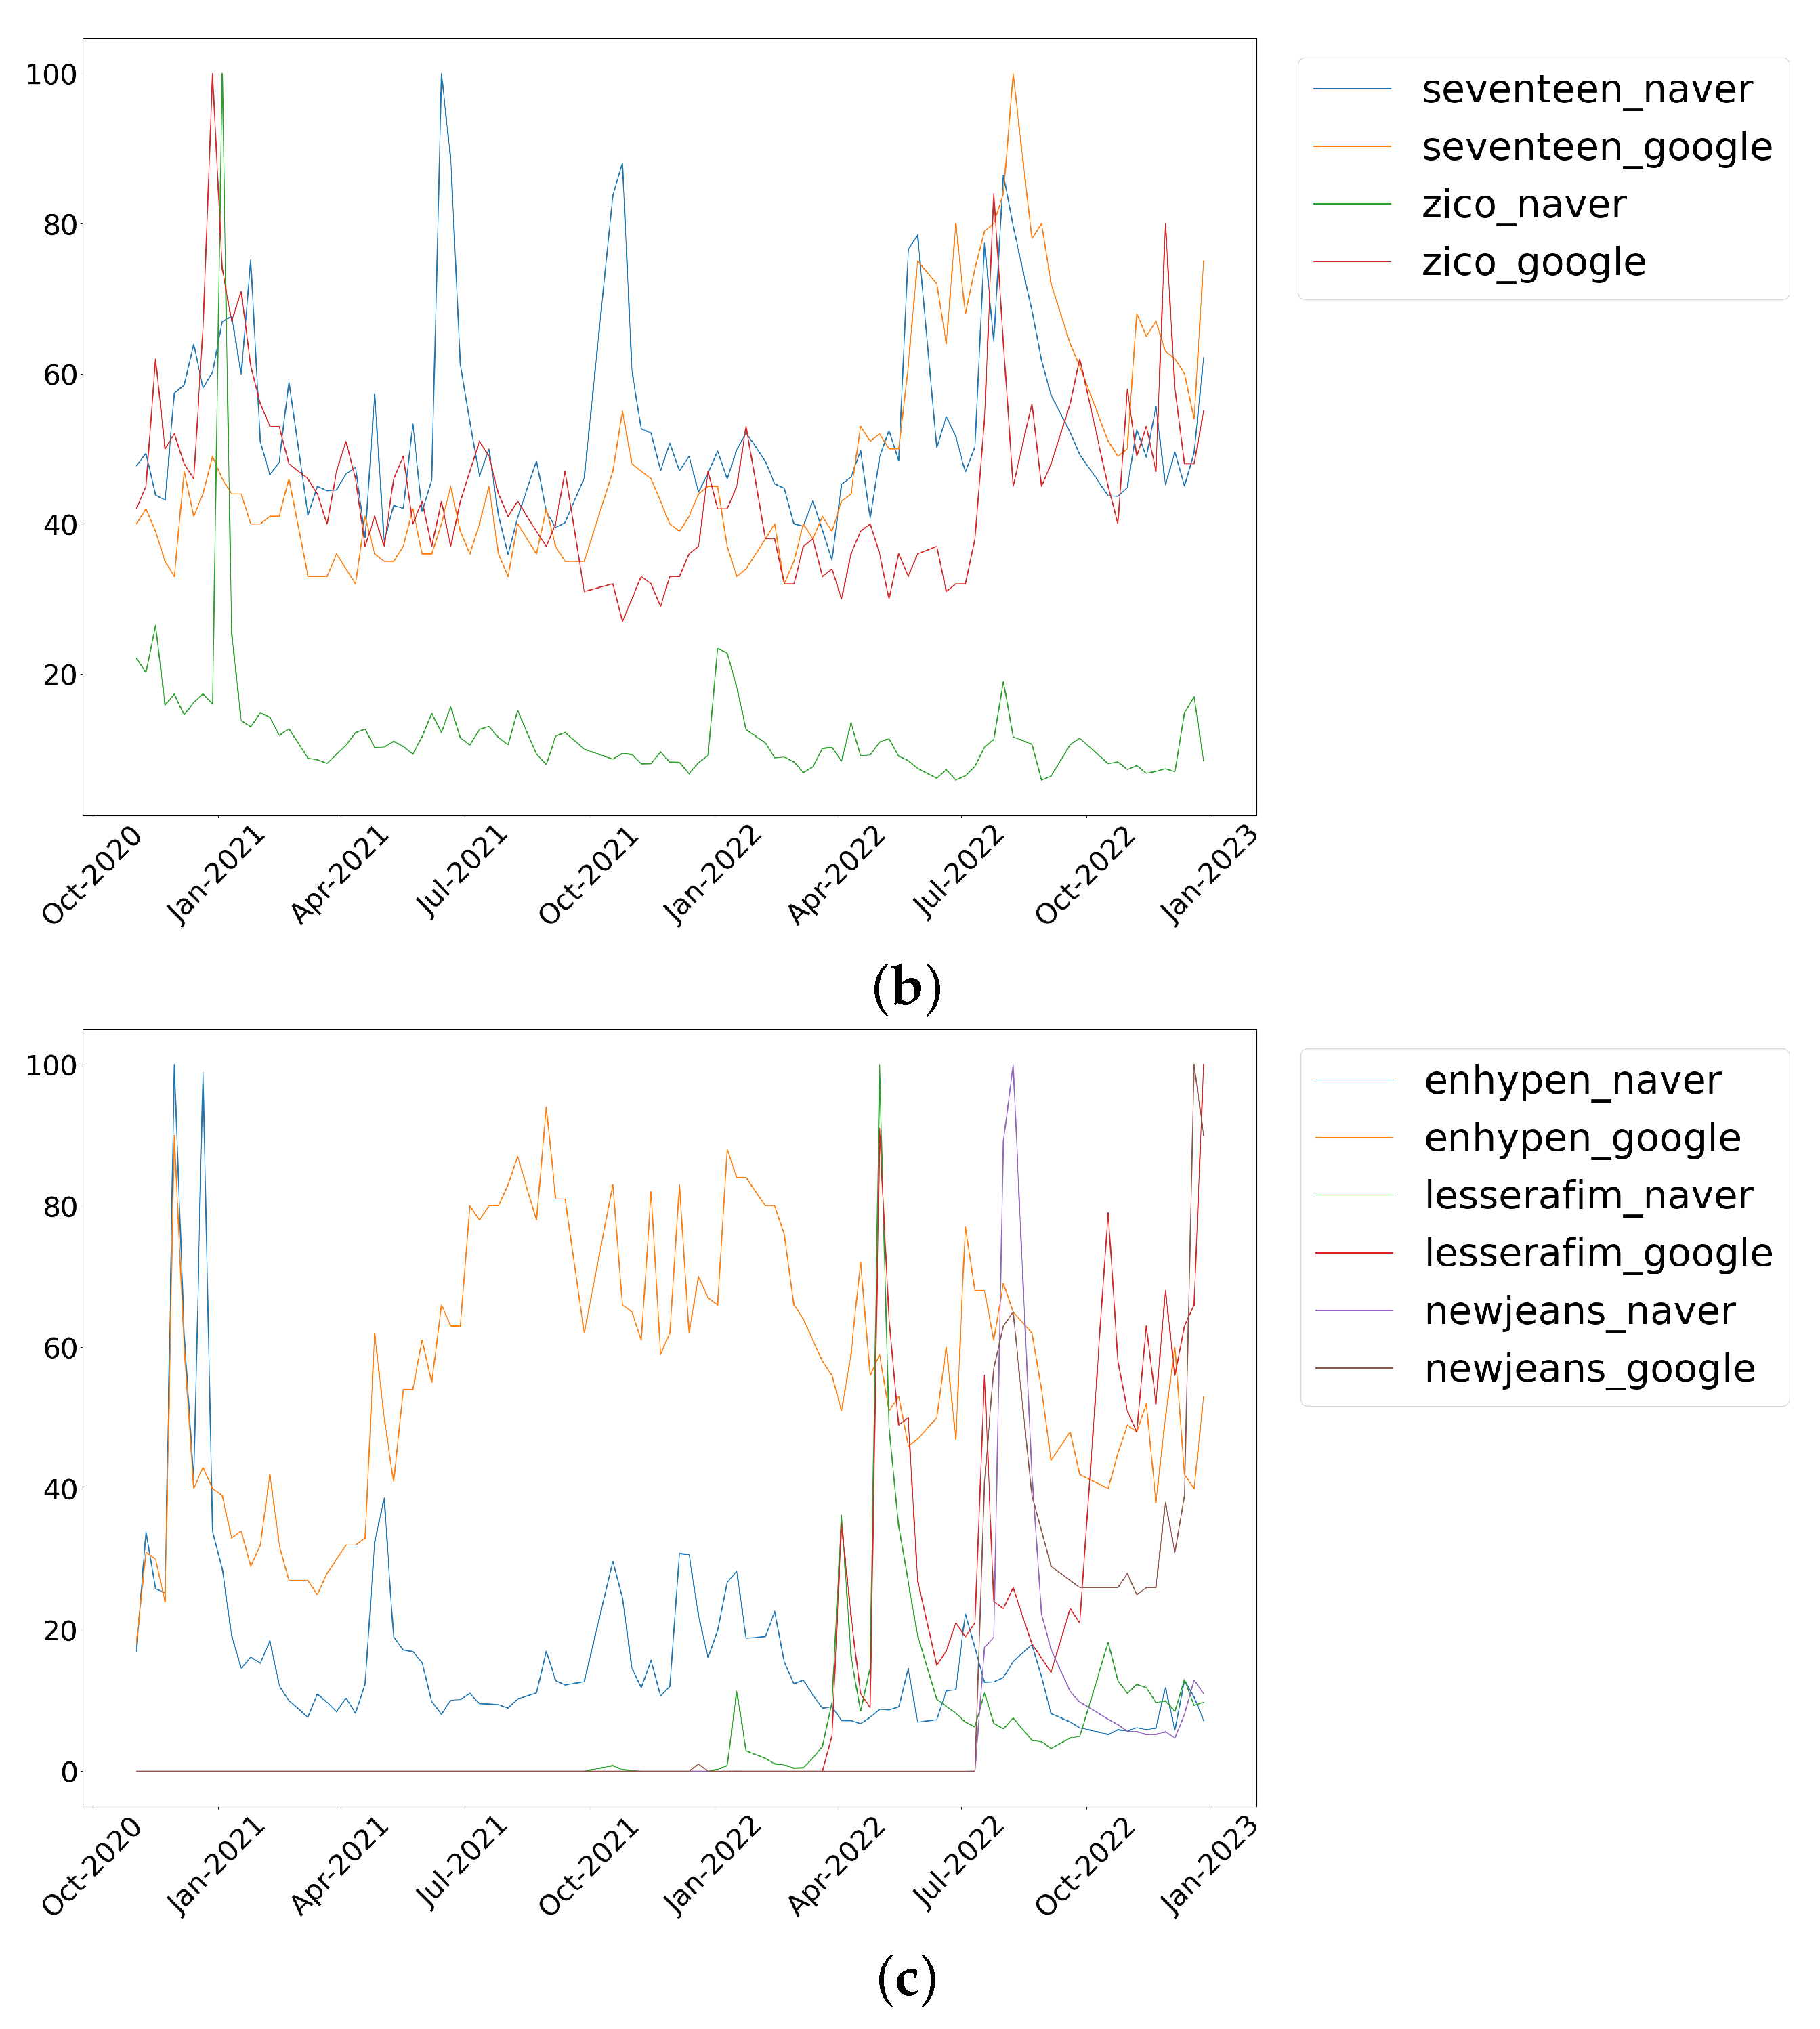
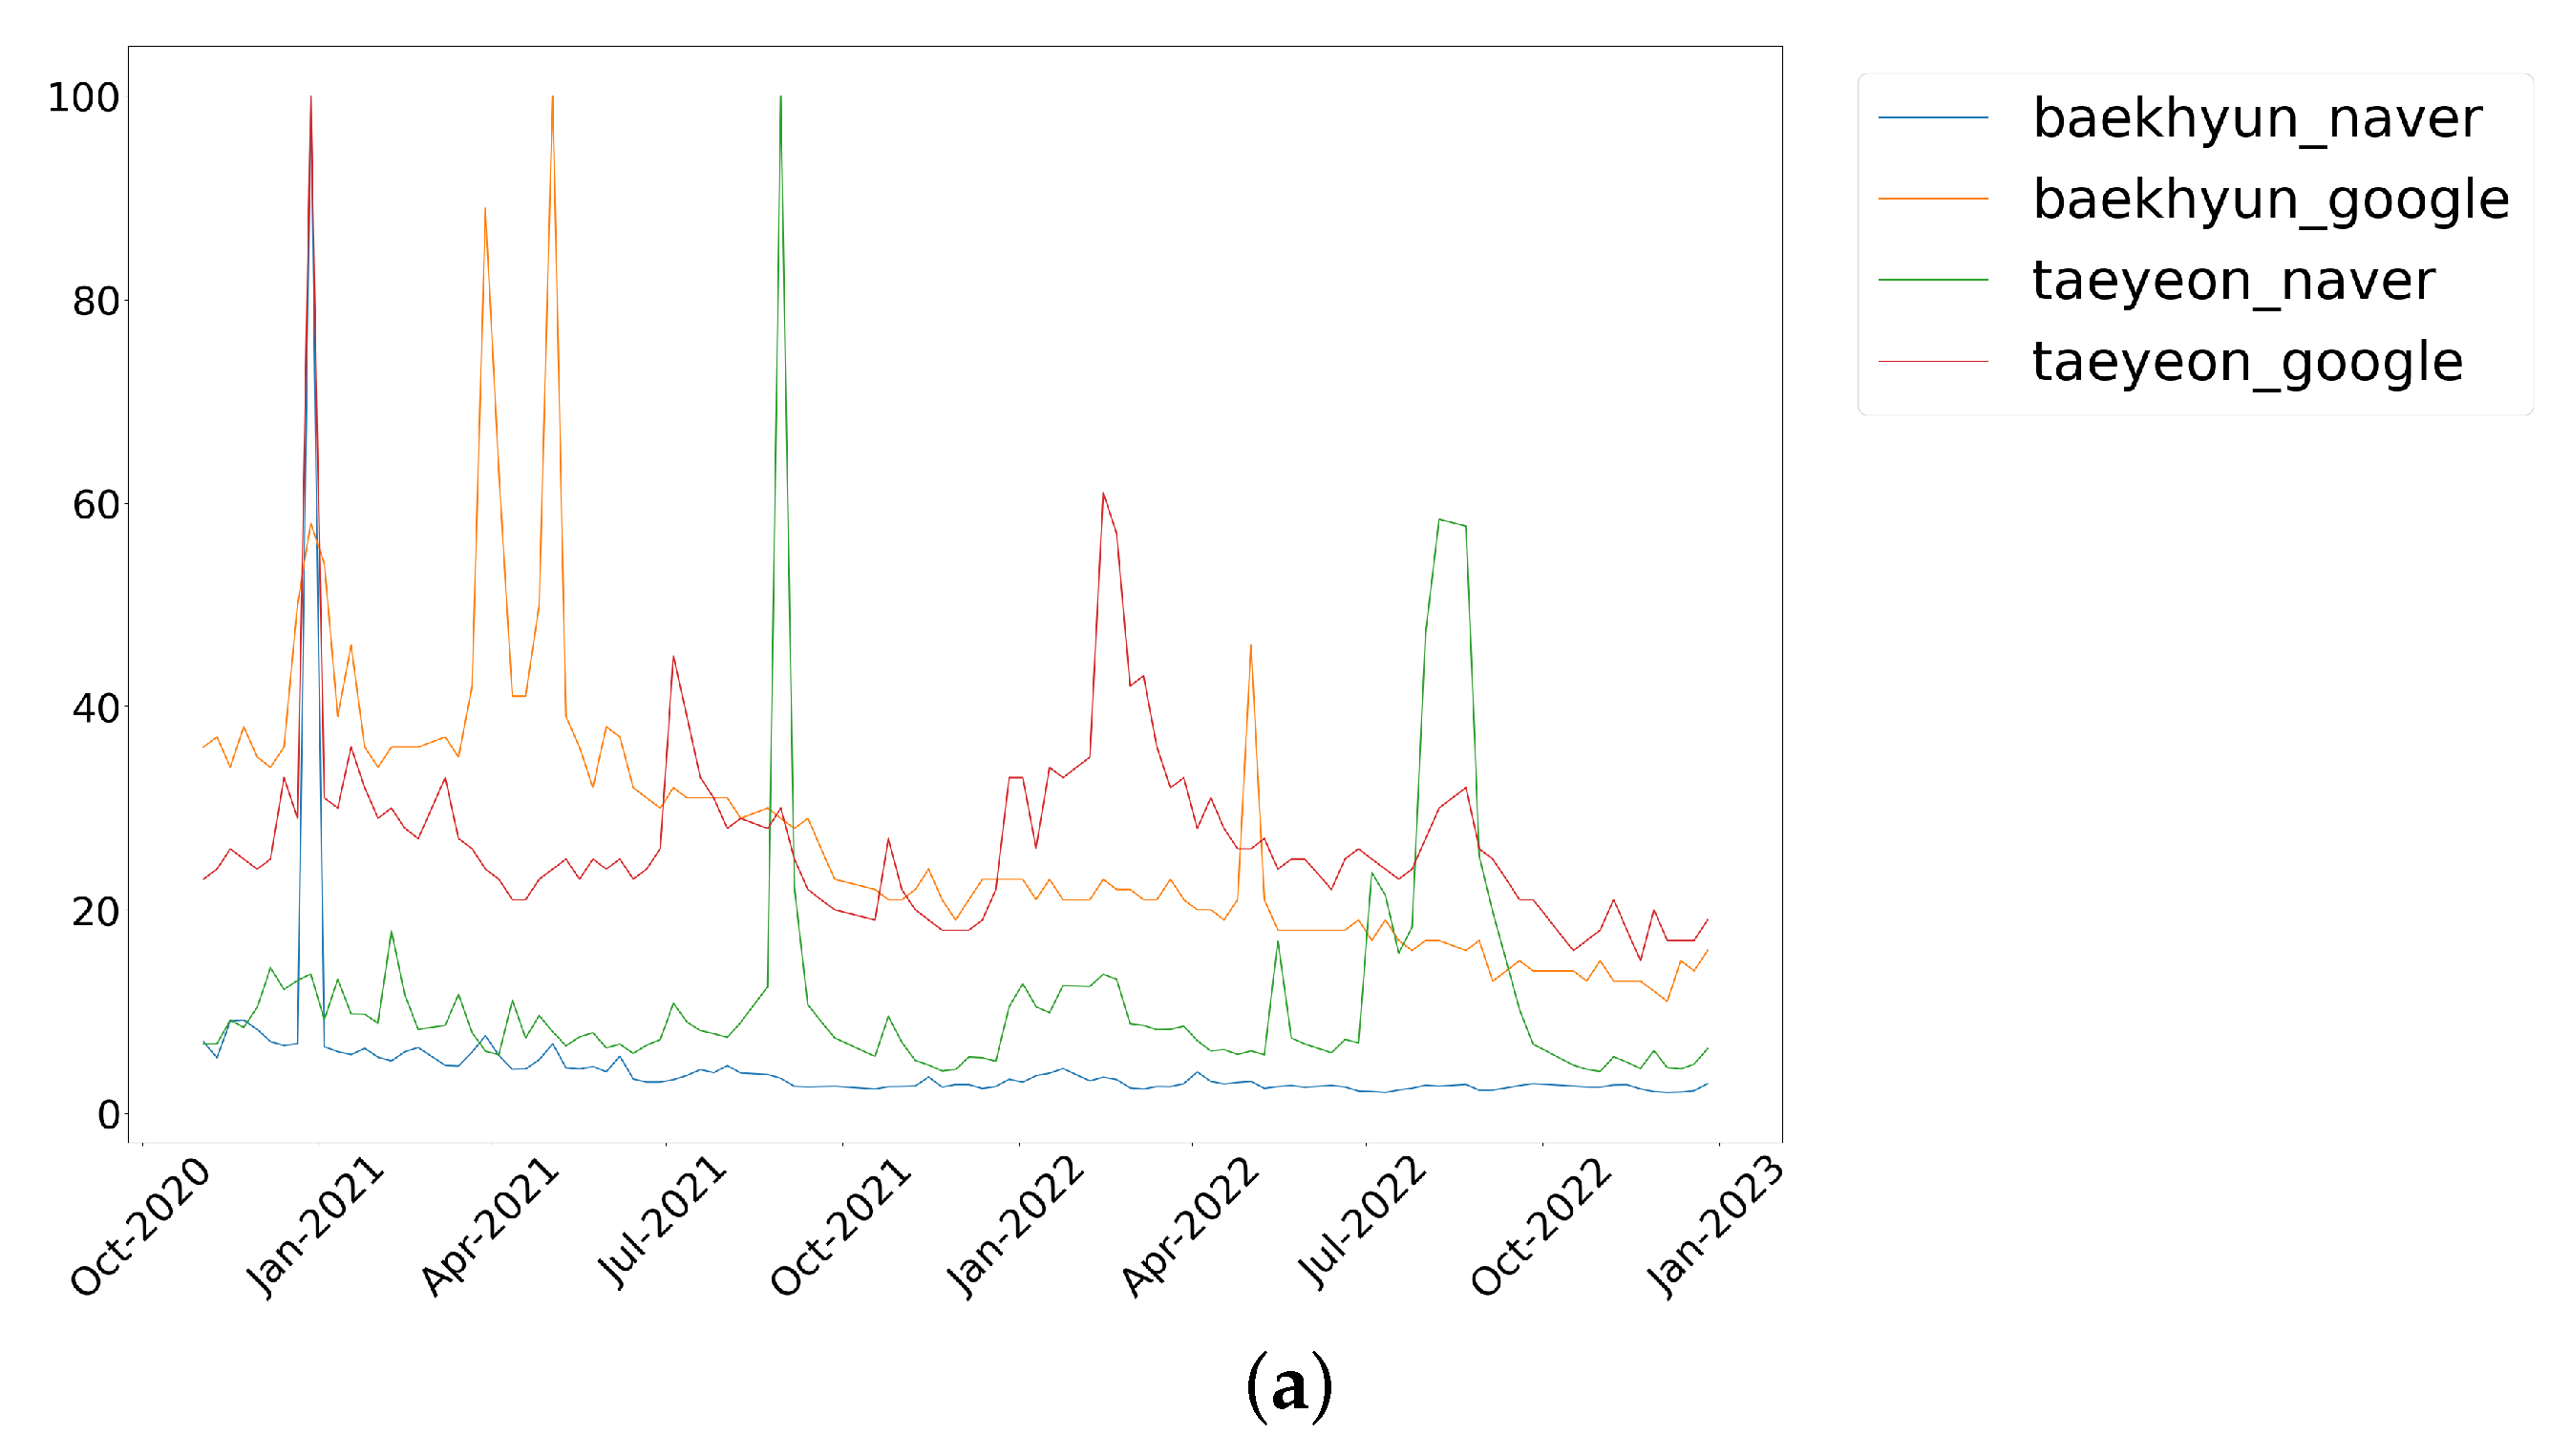
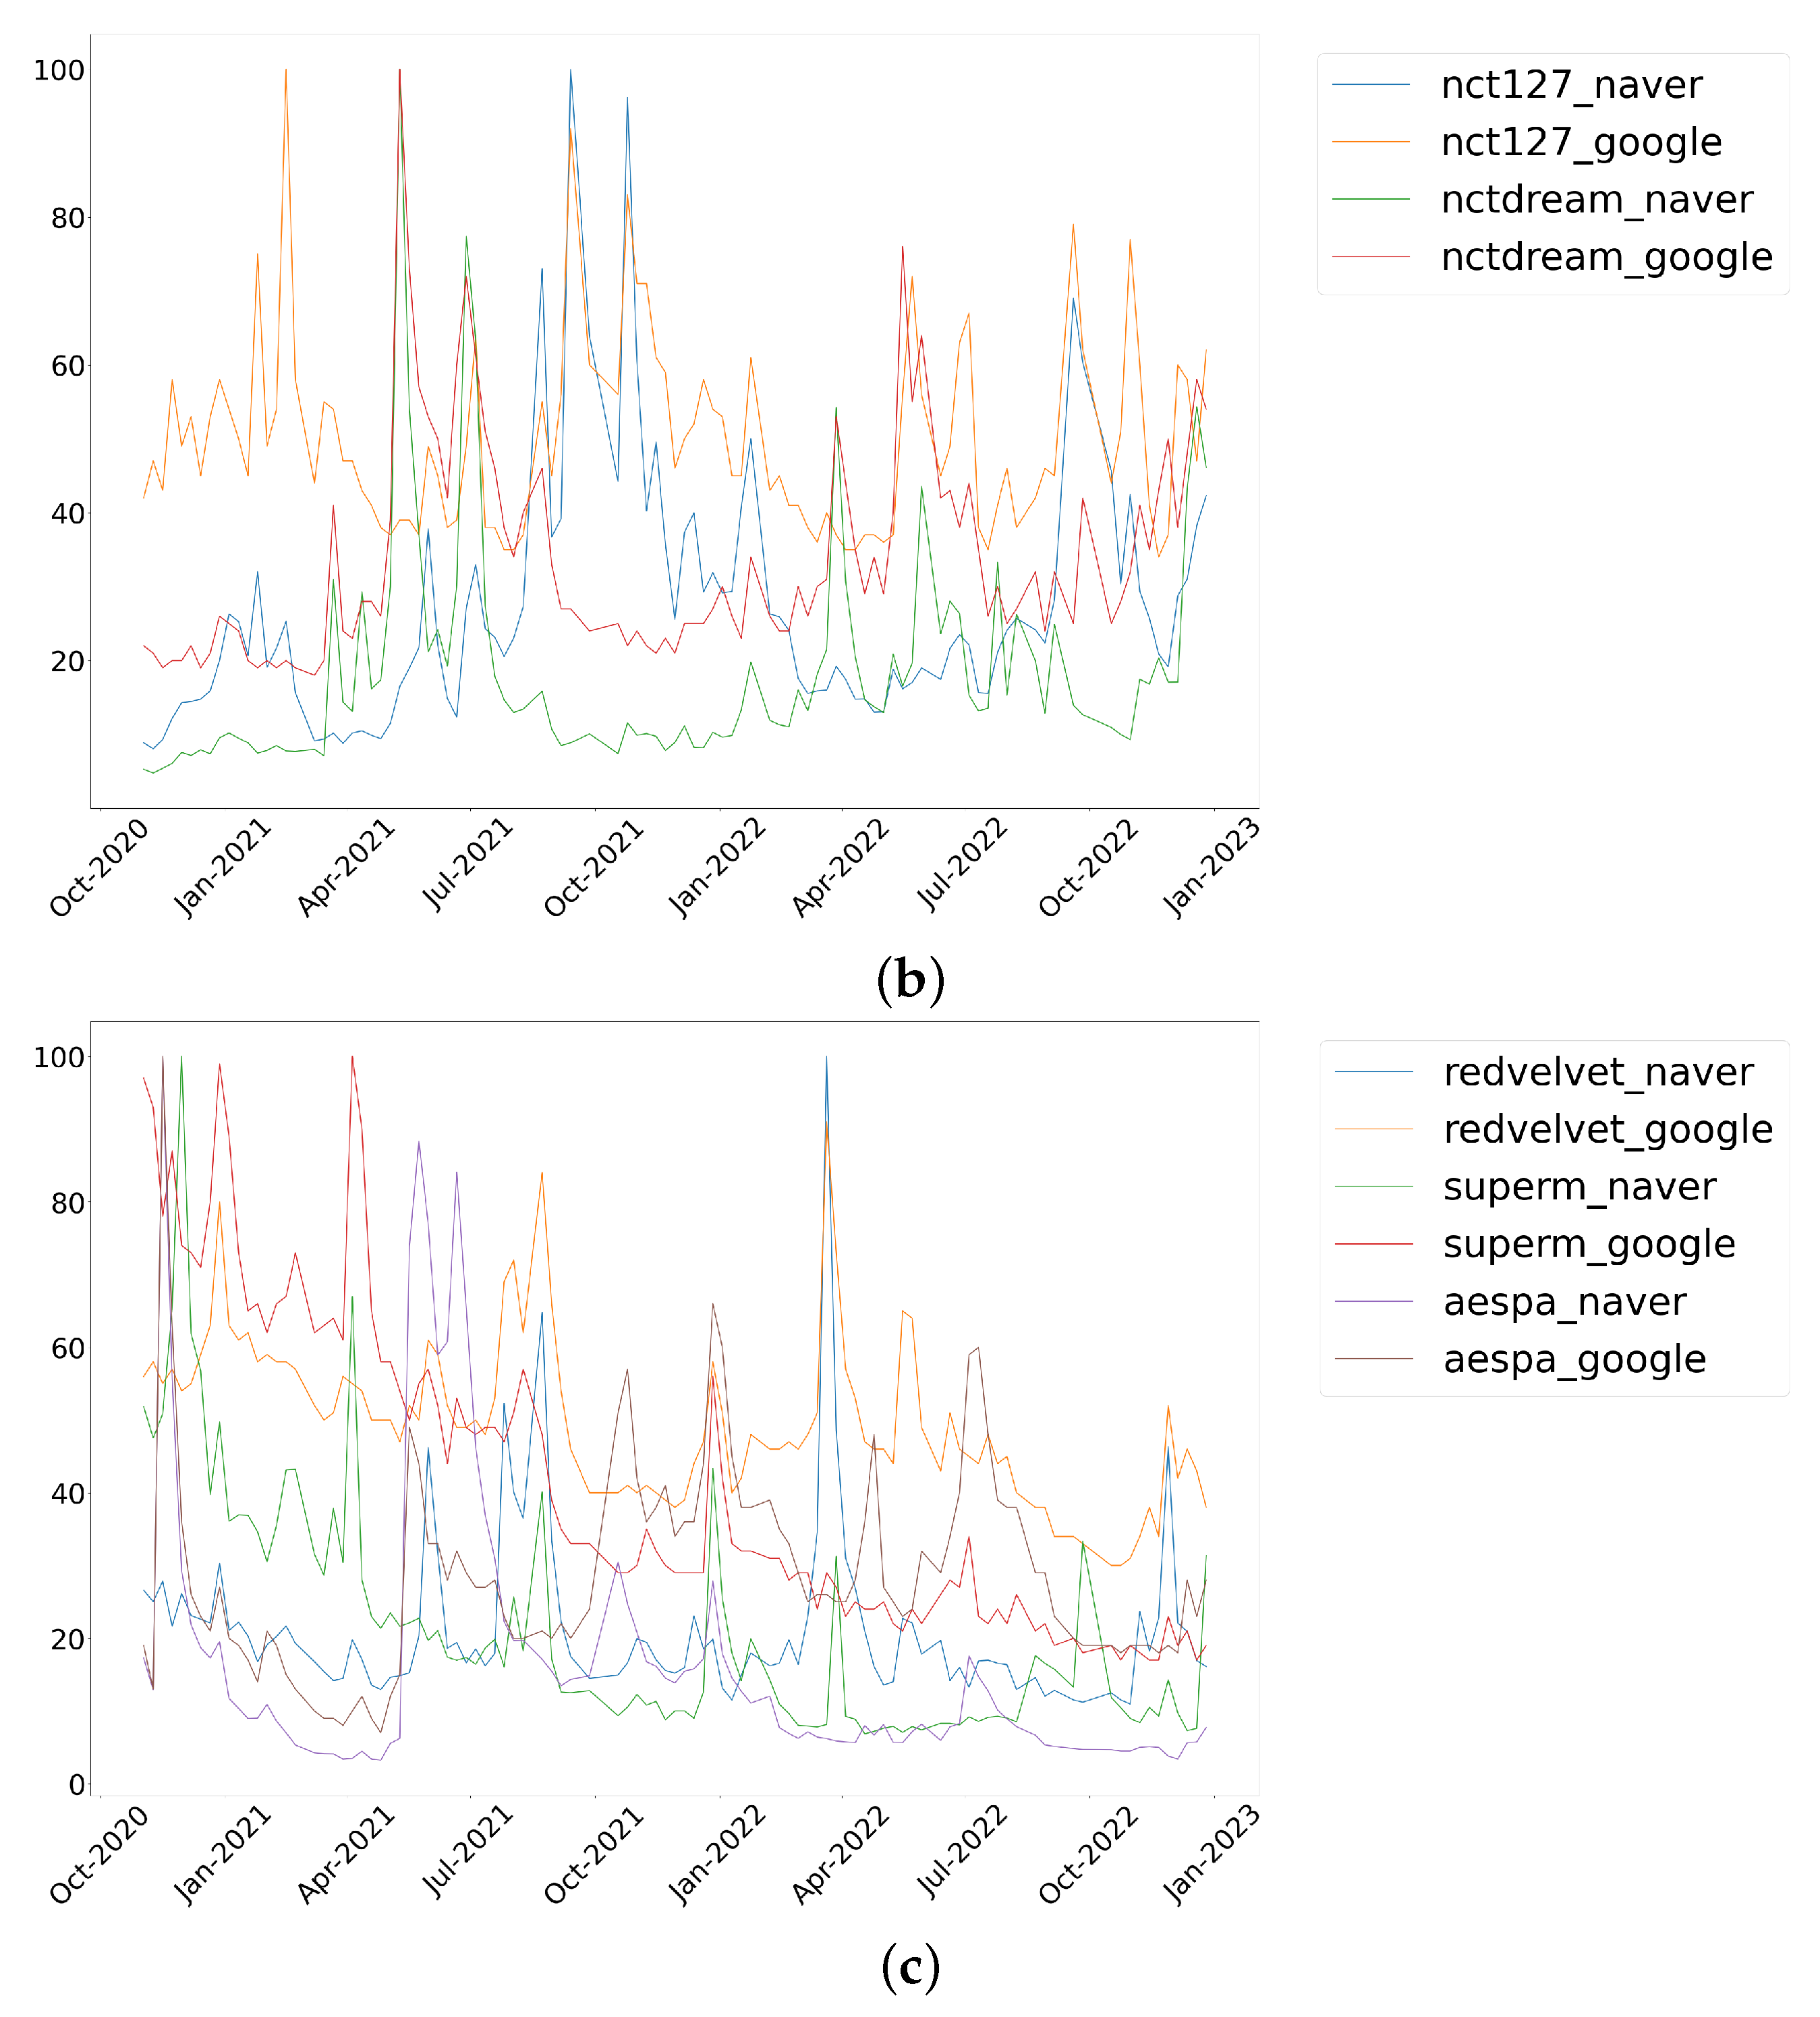
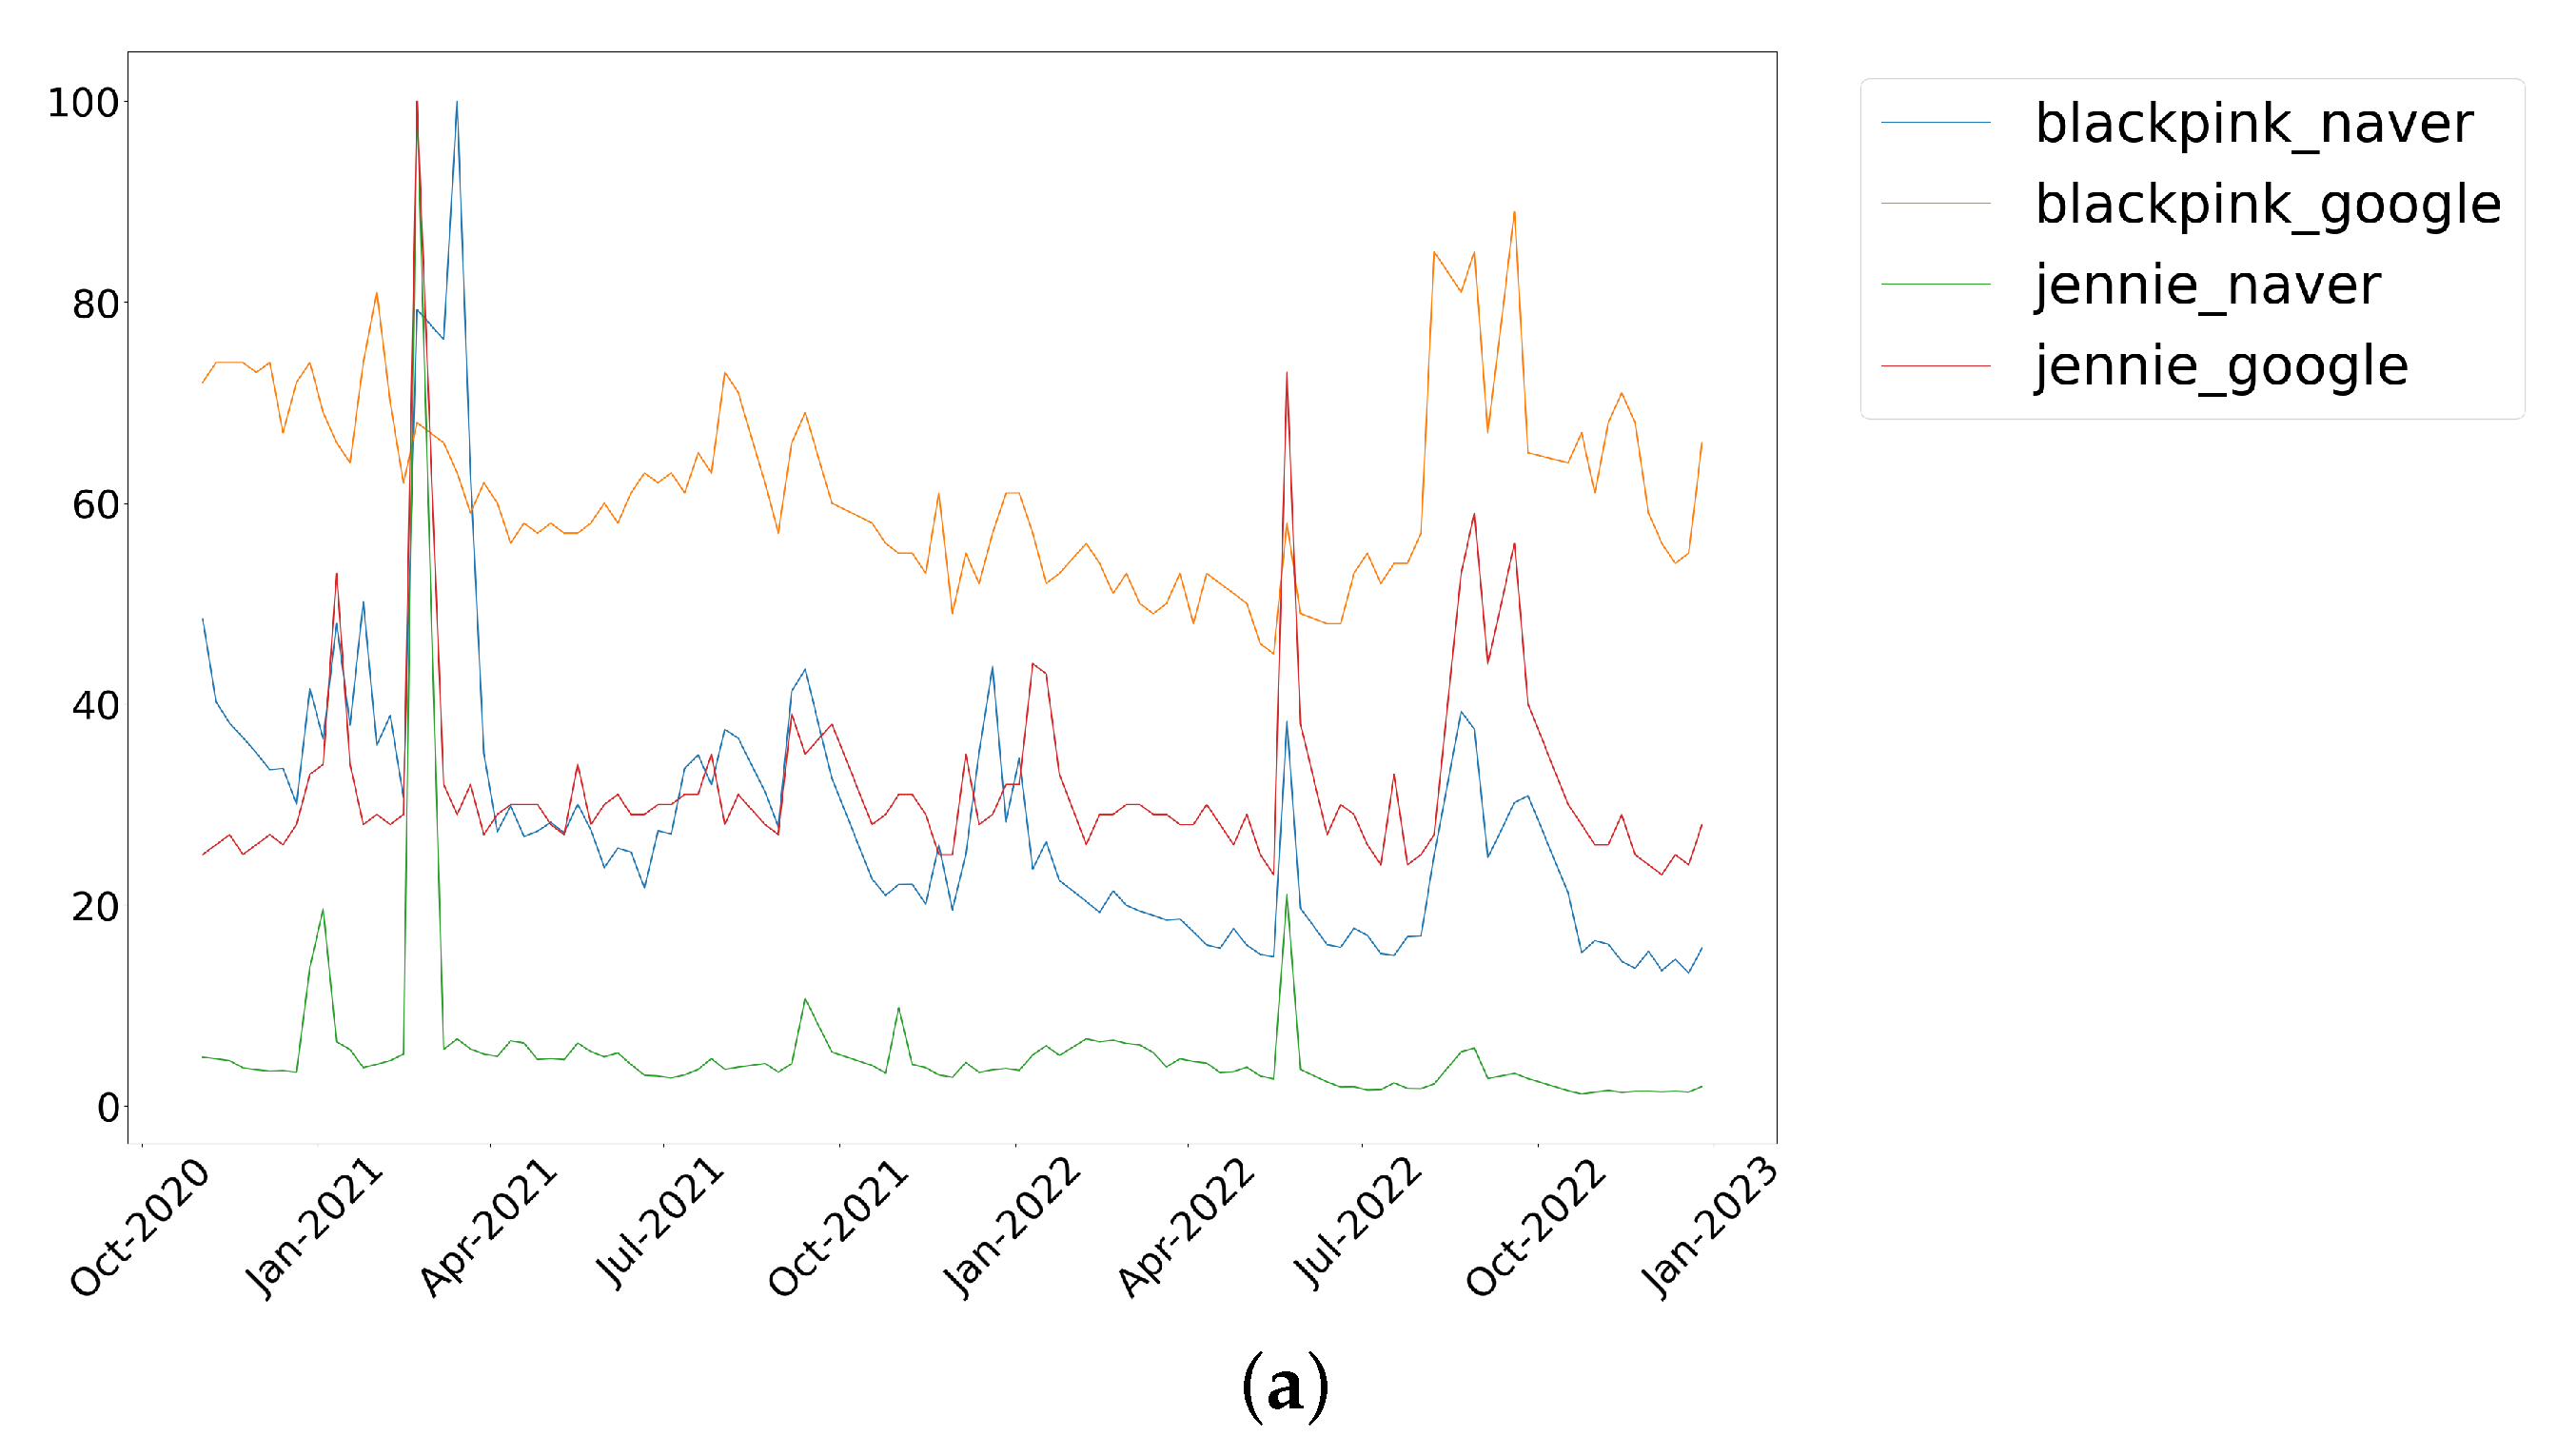
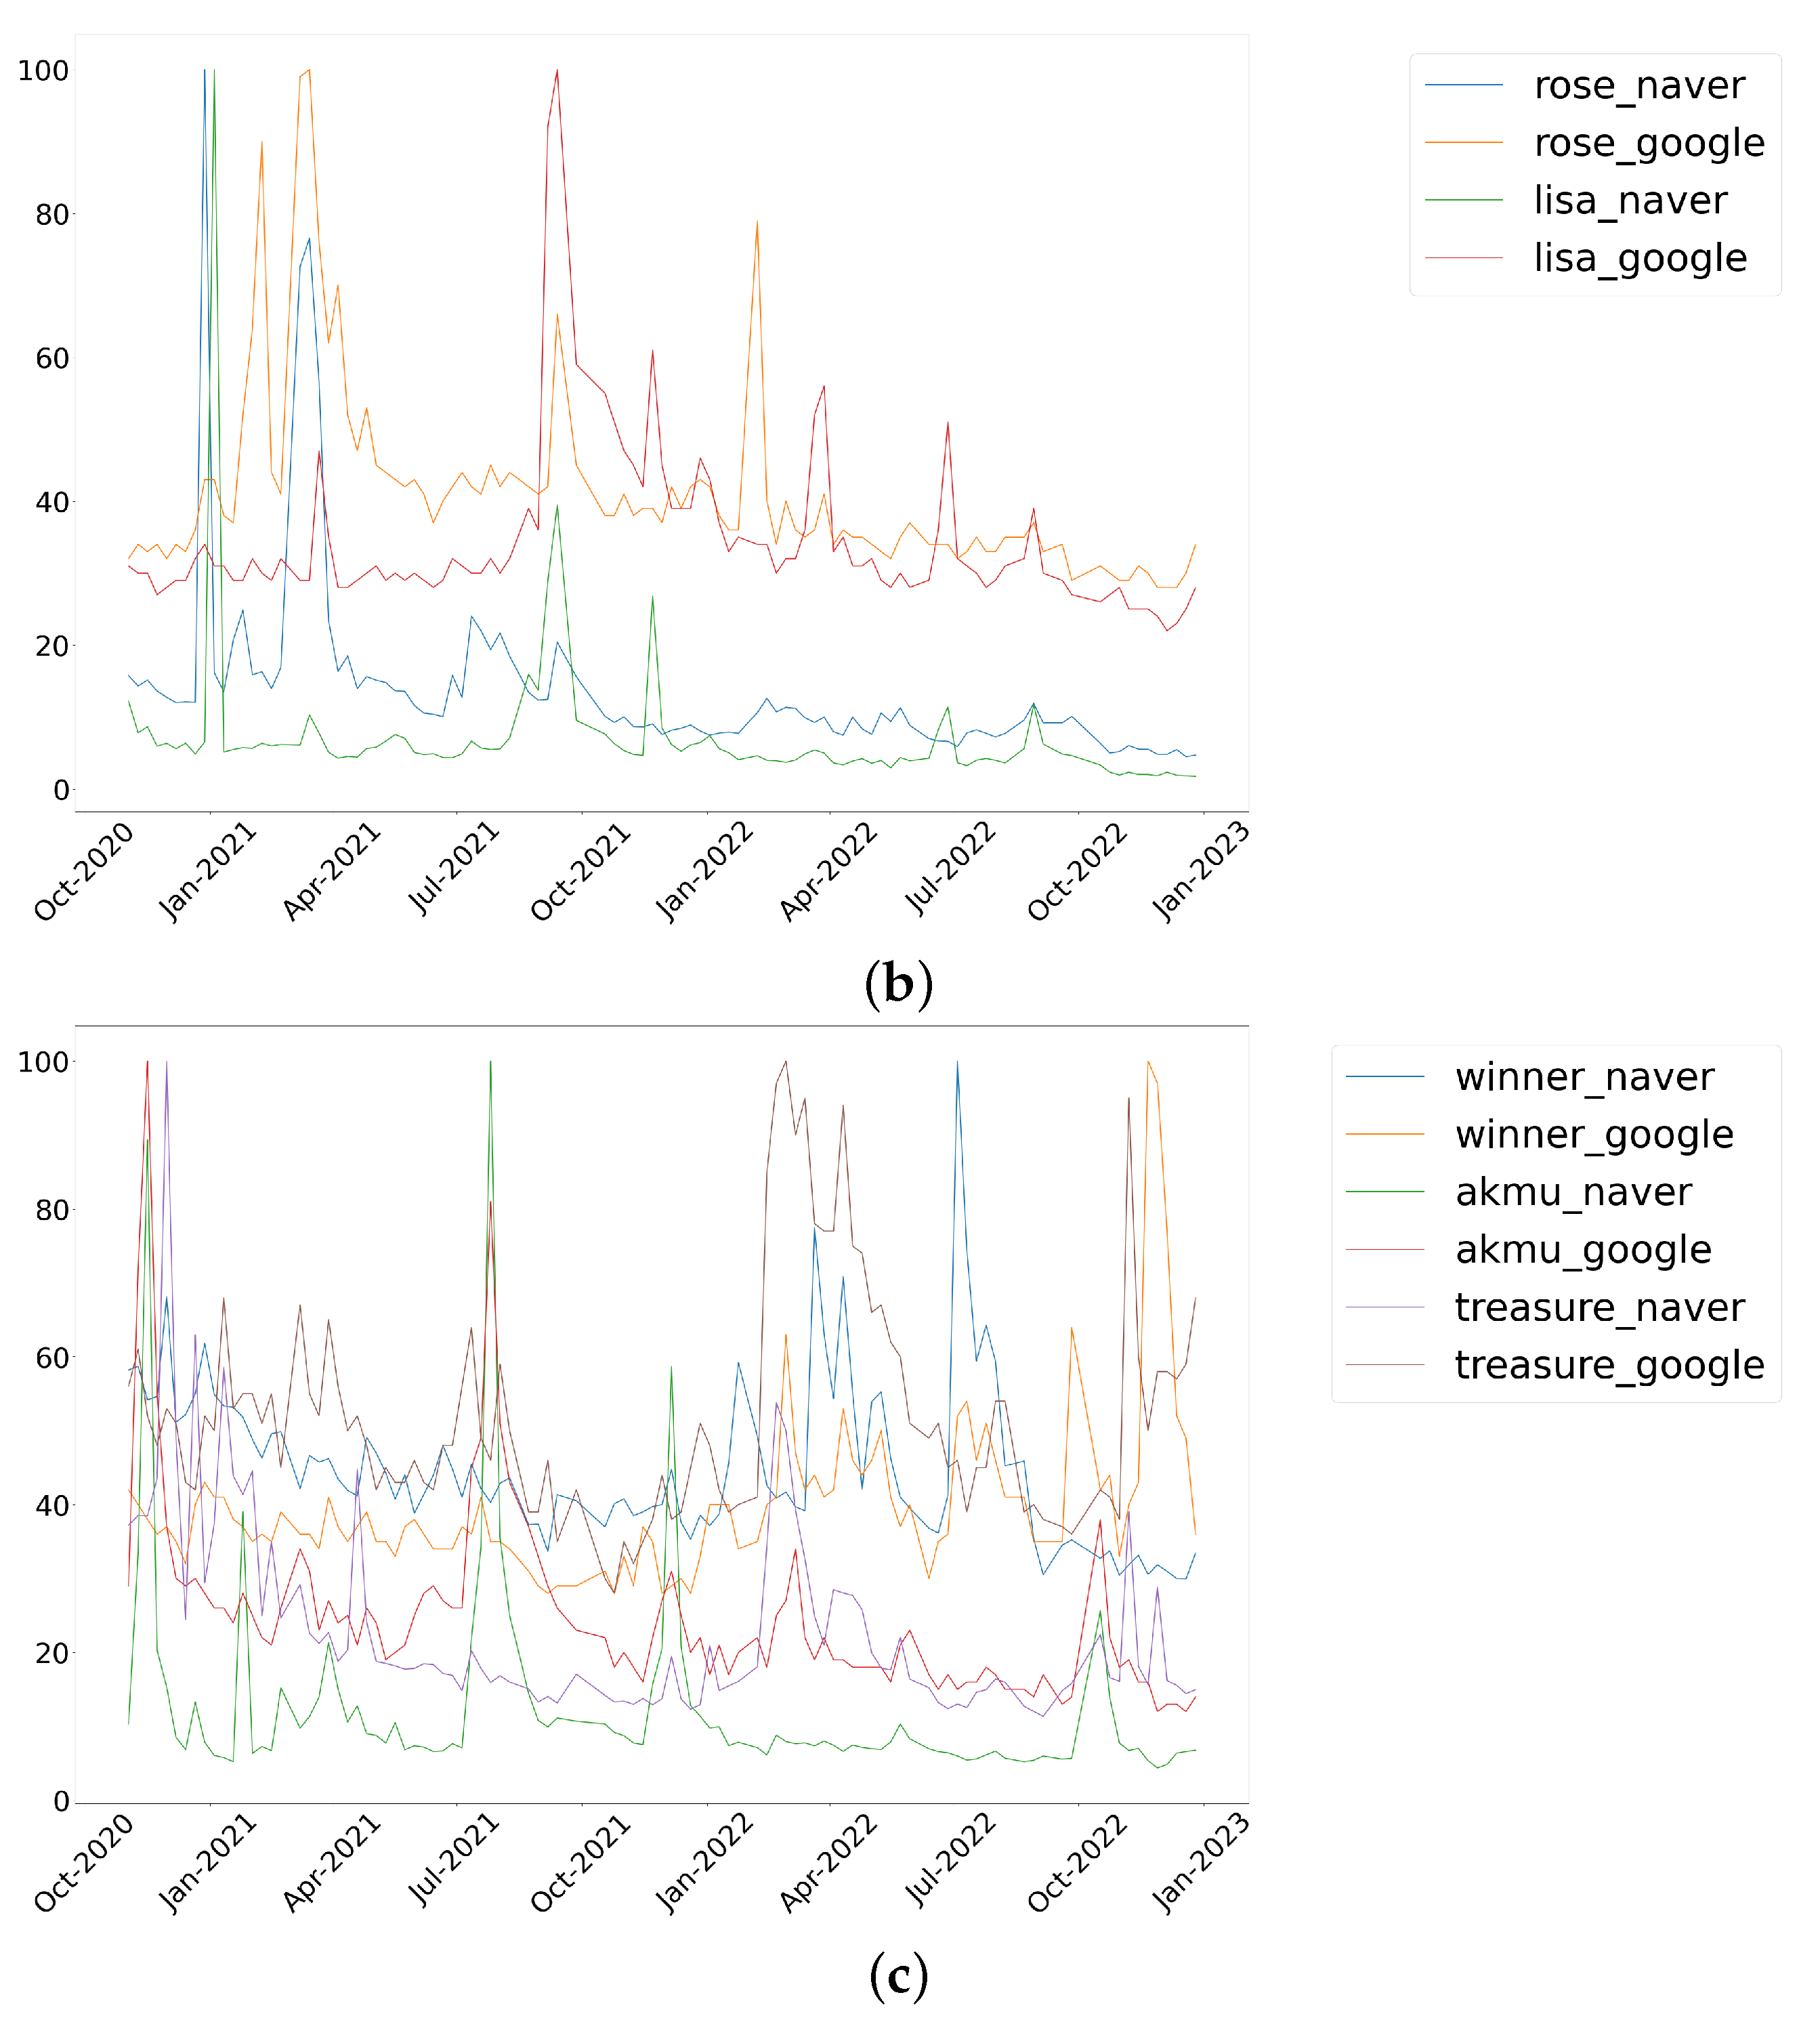
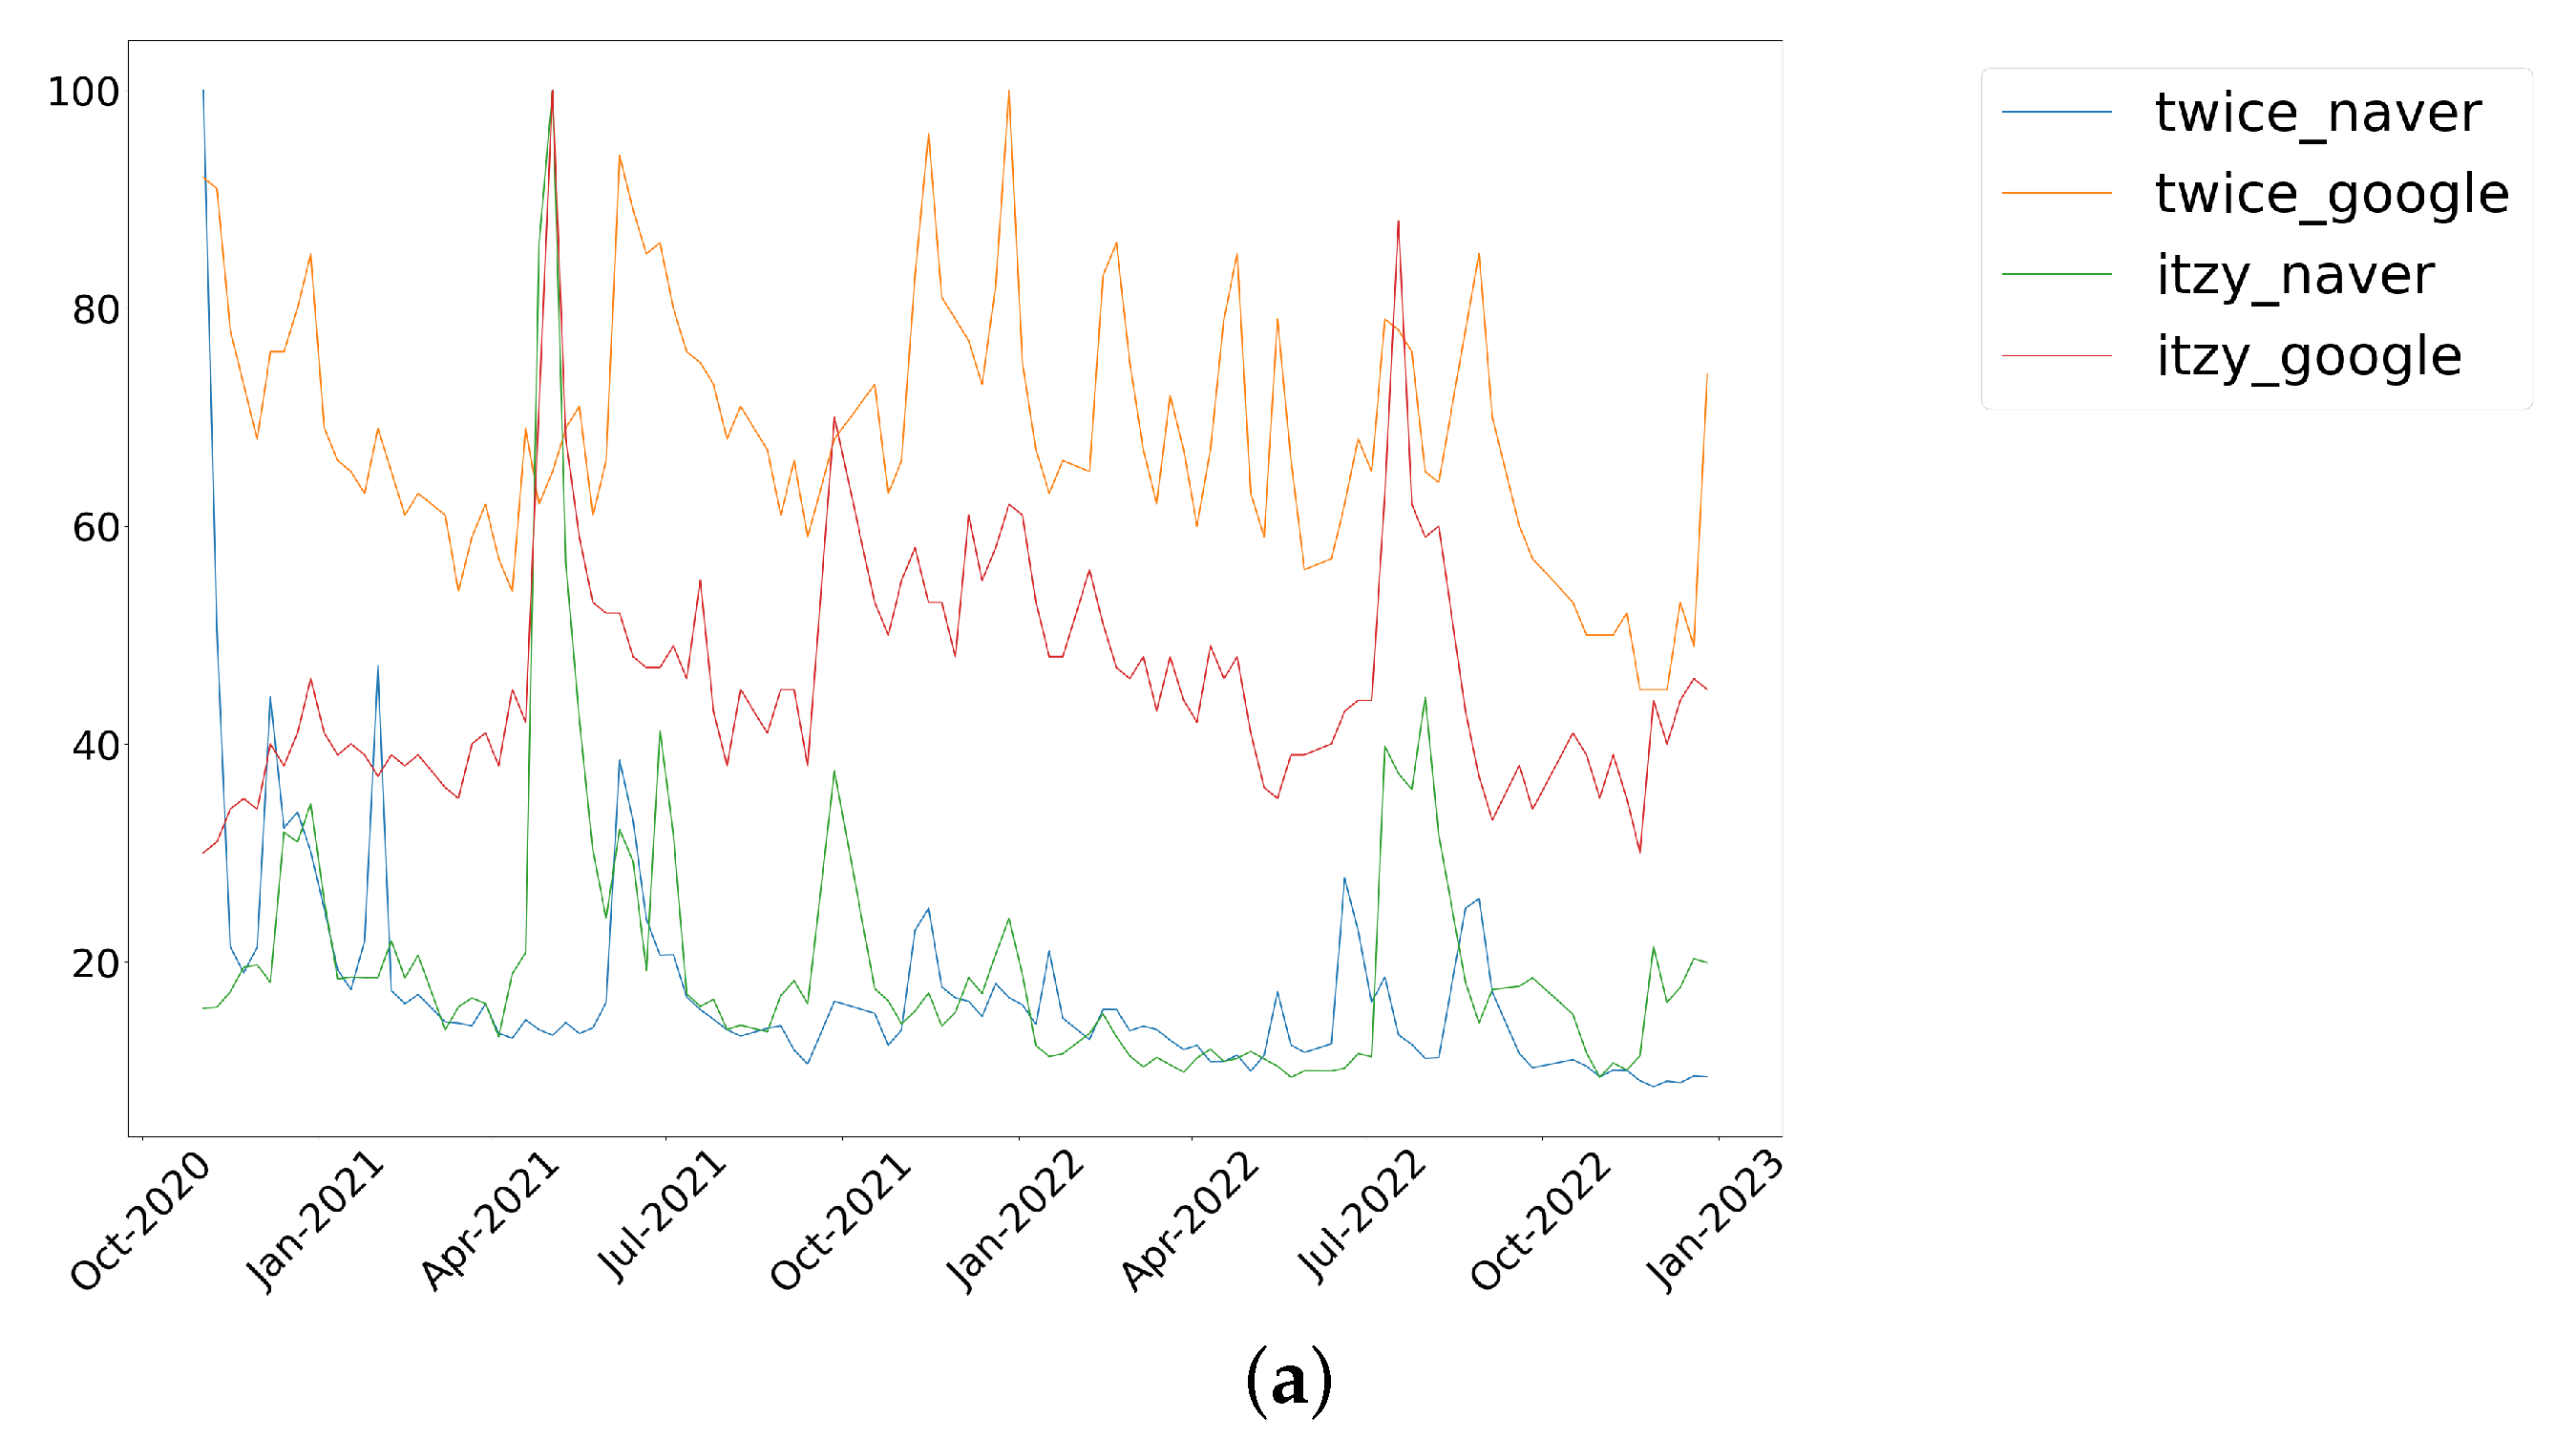
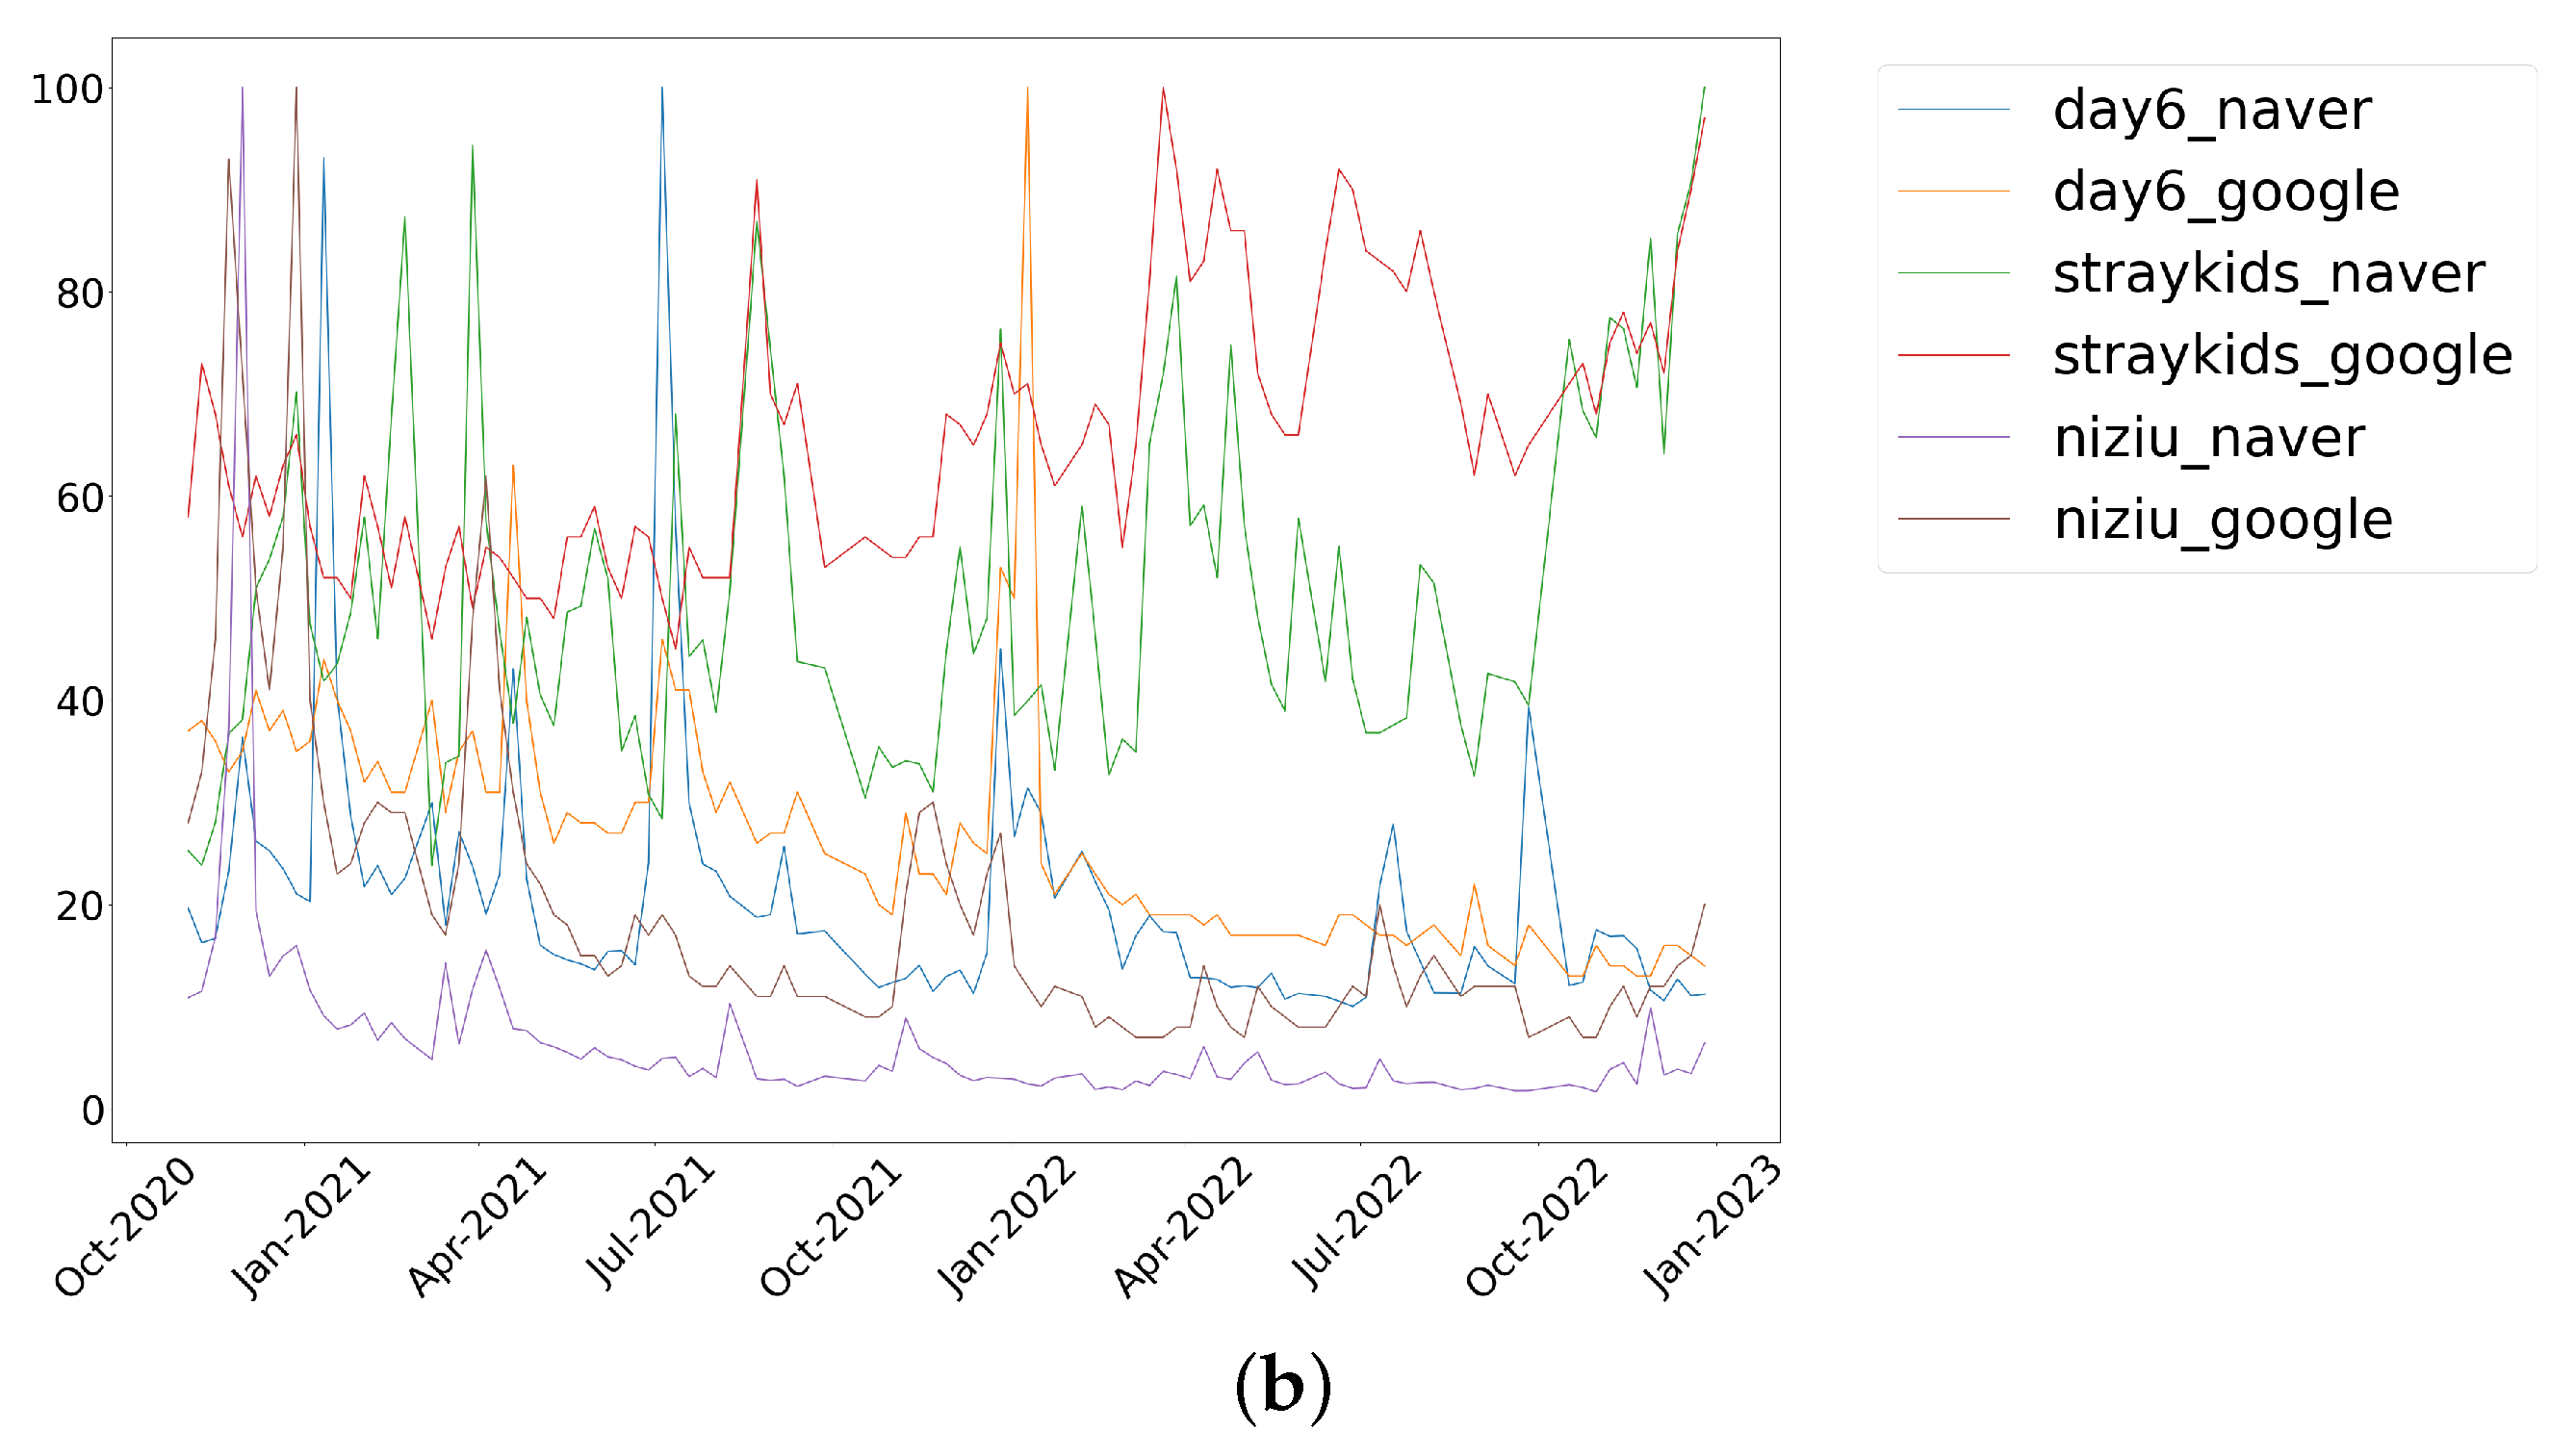
Figure 1, Figure 2, Figure 3, Figure 4, Figure 5, Figure 6, Figure 7 and Figure 8 depict the daily and weekly interest indexes of the representative artists from each entertainment company. In the early stages of the sample period, SM showed a significant increase in both indexes of singer Baekhyun and the Google Trend index of the group SuperM; however, it seemingly declined as the period progressed. In addition, the Naver Trend index of the group aespa consistently remained high, indicating a sustained interest in the group within Korea. In the case of HYBE, the Naver Trend index of its most representative group, BTS, remained high throughout the sample period, followed by high Google Trend indexes for the groups TXT and ENHYPEN. In addition, it can be observed through the Google Trend index of the group NewJeans that they received significant attention upon their debut in the second half of 2022. JYP consistently maintained high Google Trend indexes for its groups TWICE, ITZY, and Stray Kids, indicating a higher interest overseas than other agencies. In the case of YG, the Google Trend index of its most representative group, BLACKPINK, was high. In the latter half of the sample period, LISA’s Google Trend index was also high. Overall, there was a tendency towards lower interest, except for strikes, and it was estimated that there was a significant fluctuation in the interest indexes during the sample period. Additionally, the weekly interest index tended to be higher than the daily interest index, seemingly owing to it being averaged over seven days.
Figure 9 shows the stock prices of the four entertainment enterprises from November 2020 to December 2022. Compared to the other three companies, HYBE’s stock price has an extremely large value that differs significantly in its range. While the minimum value of HYBE is KRW 109,500, the maximum values of the other three companies are KRW 85,900, KRW 68,200, and KRW 73,100, respectively. None of these values exceed KRW 100,000, indicating a different range of values. Additionally, HYBE’s stock price continuously declined after November 2021 but rebounded after October 2022. Although SM showed a growth trend during the sample period, YG showed a continuous downward trend.
5. SHAP-XGBoost Analysis Results
In this section, we provide SHAP-XGBoost analysis results with several features for predicting the stock prices of the four companies. To discover the impact of local and global interests, we employed the Naver and Google Trend indexes for each artist in each company. Furthermore, for a relative comparison of the feature importance, we included the stock prices of other companies: the Korean stock index (KOSPI), the US stock index (S&P 500 index), Korean stock volatility (VKOSPI), and the US stock volatility (VIX) in the feature set. In addition, we used daily and weekly data to confirm the differences in the analysis results according to the data frequency. We implemented SHAP-XGBoost analysis using Python packages (“shap” and “xgboost”). The XGBoost hyperparameters are listed in Table 3 and Table 4.
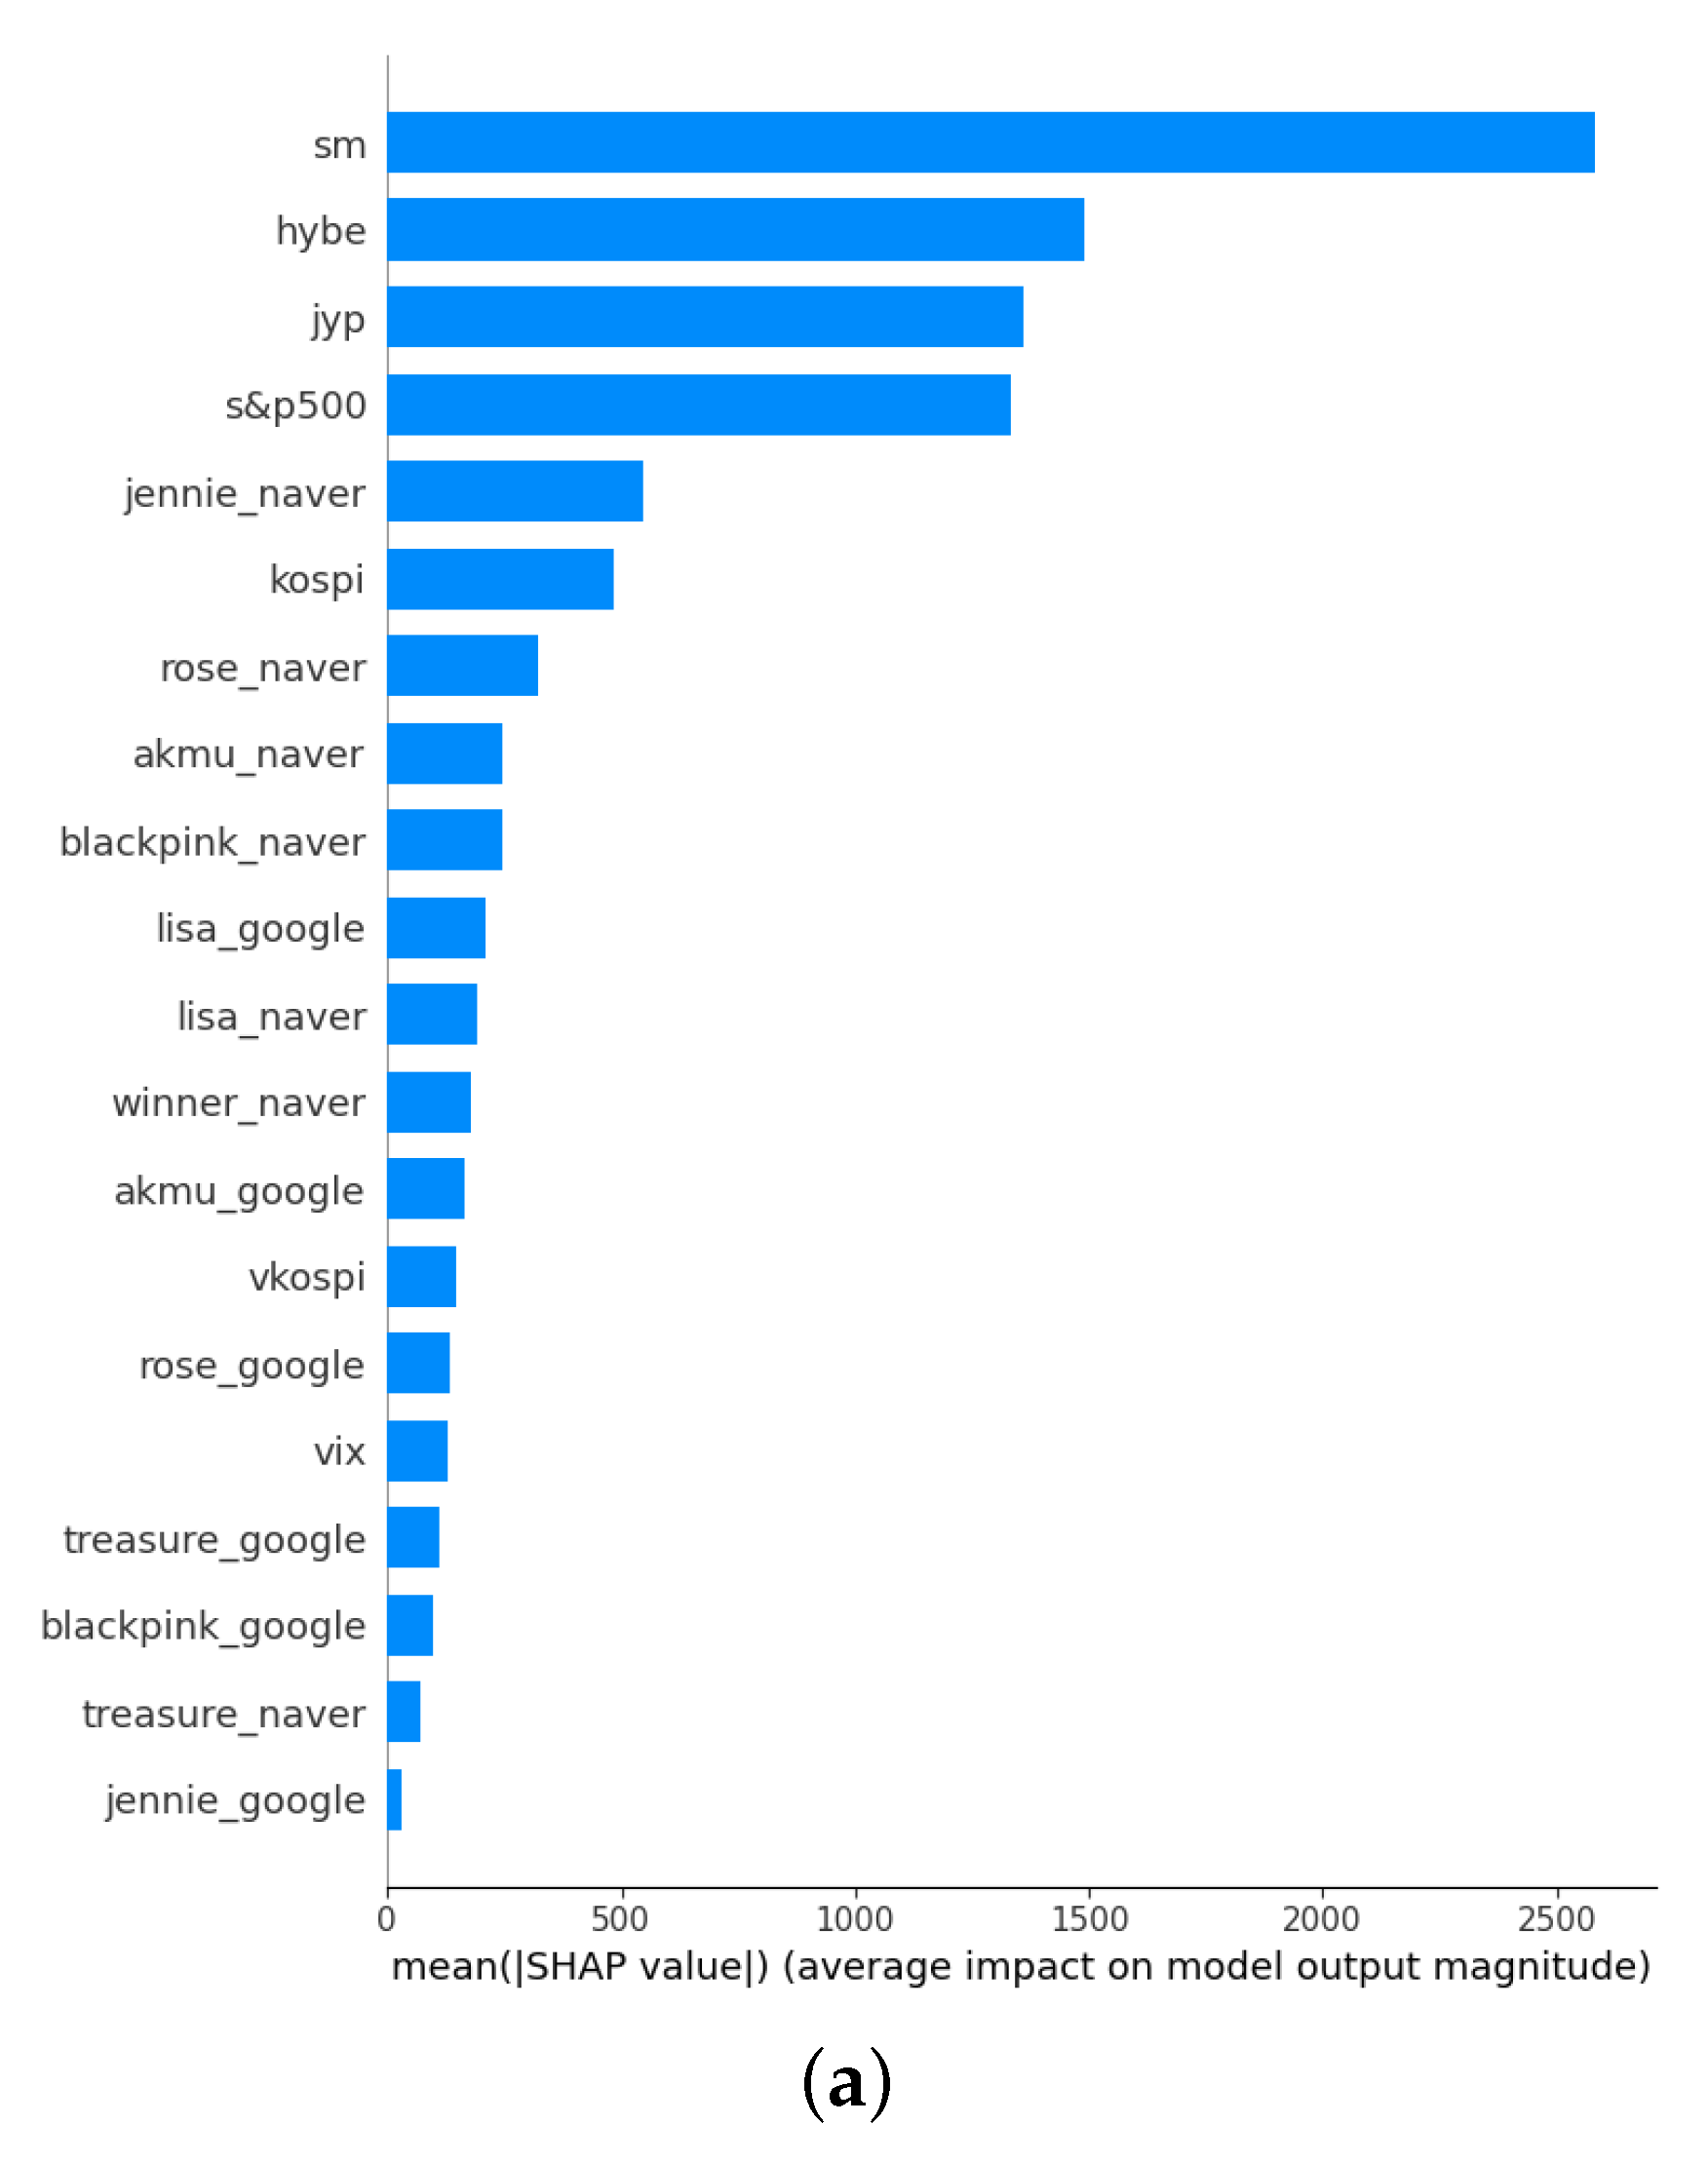
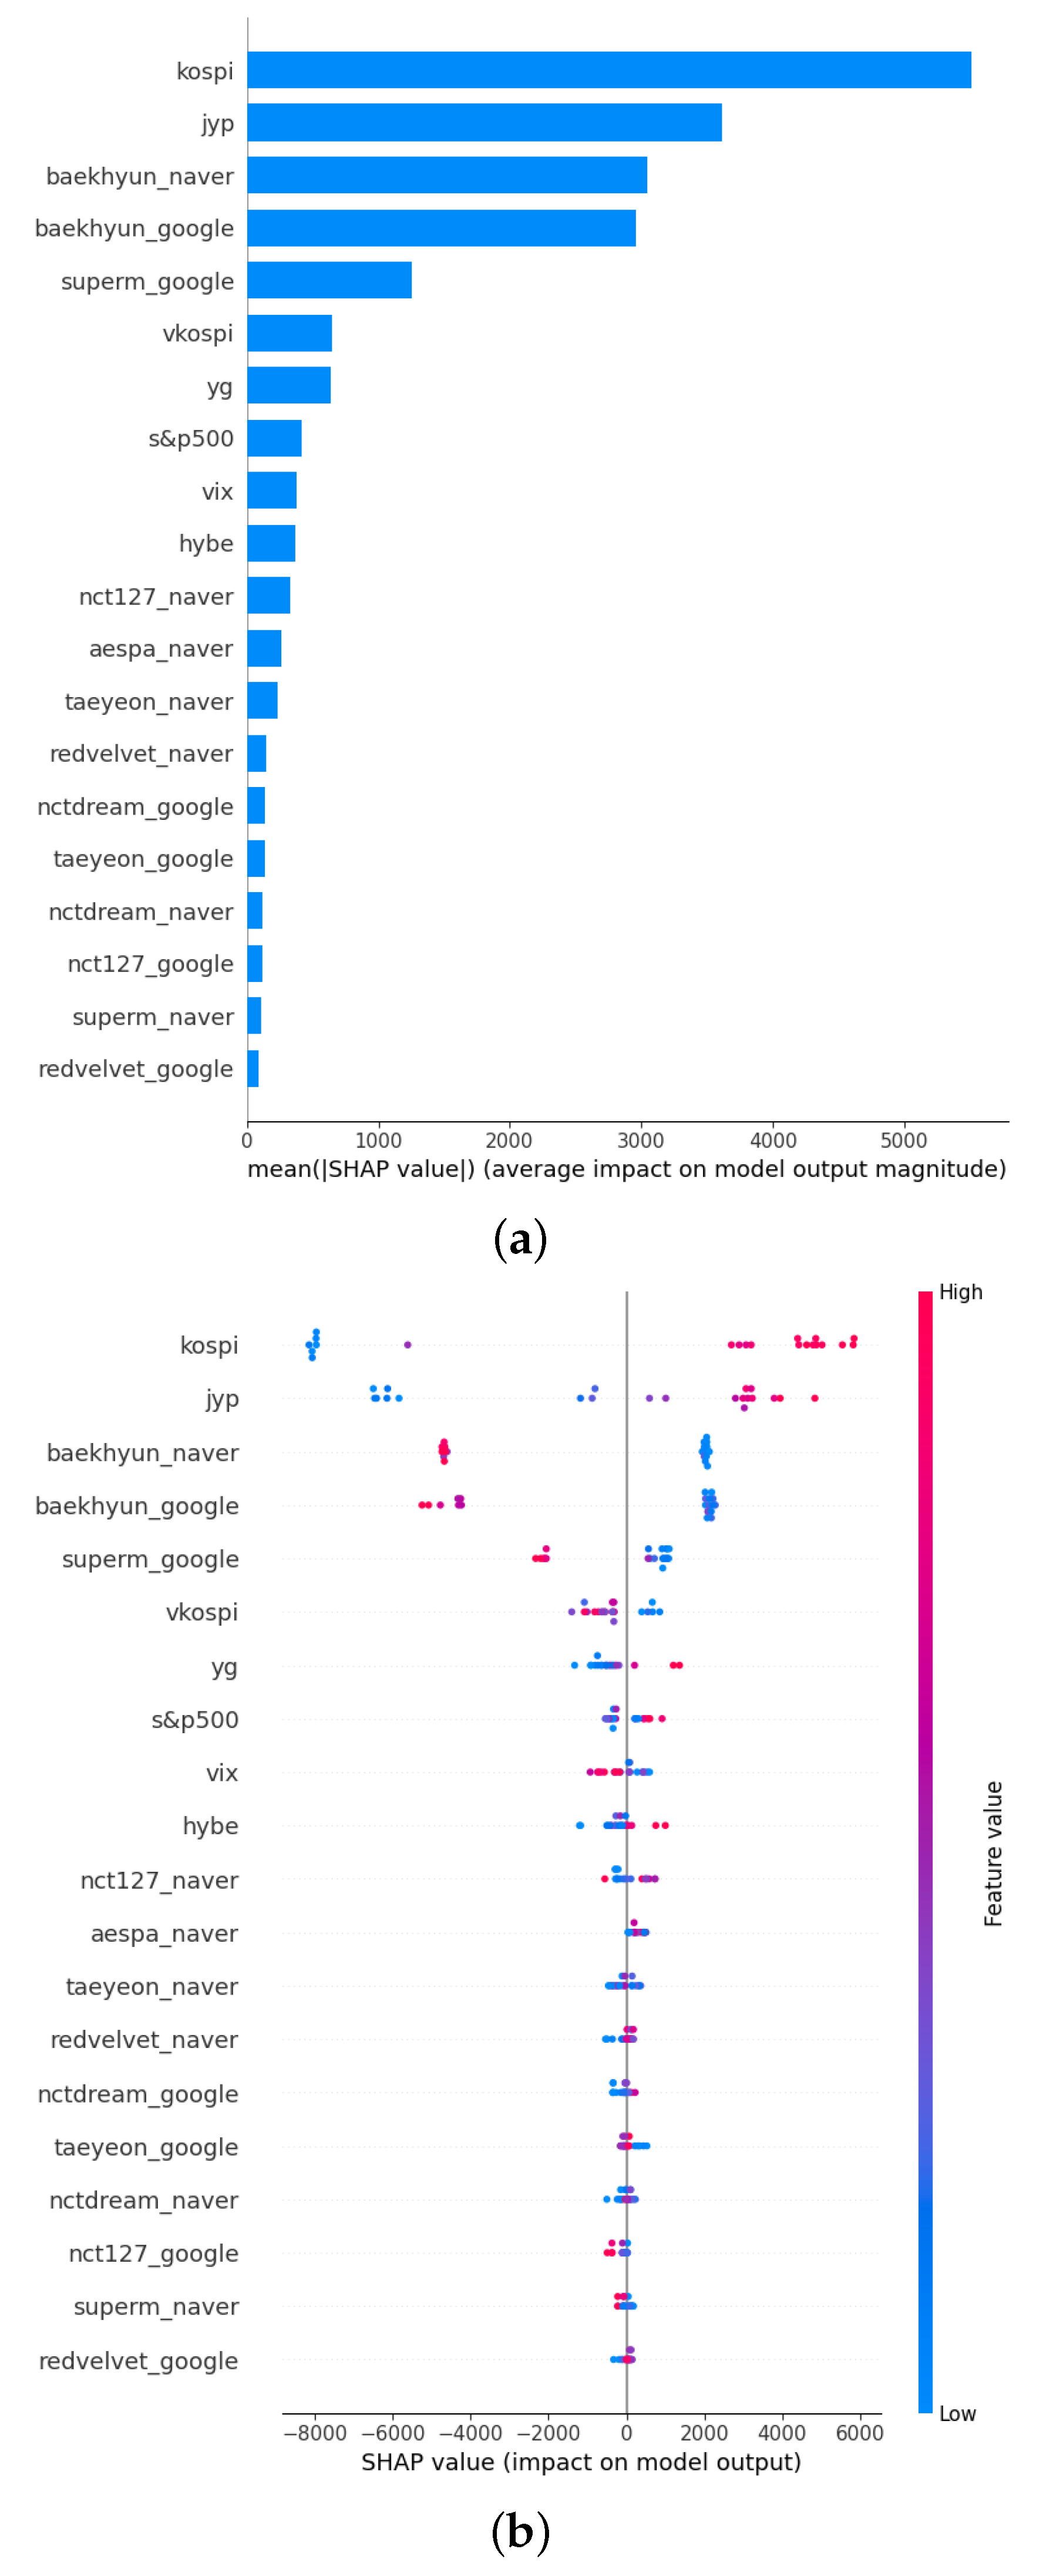
Figure 10 shows the results of calculating the SHAP value of the XGBoost model that predicts SM’s daily stock price using variables including SM-affiliated artists’ daily Naver and Google Trend indexes, HYBE, JYP, YG, KOSPI, VKOSPI, S&P 500, and VIX. Unlike the model trained with weekly data, JYP’s stock price had an overwhelmingly greater influence, followed by Baekhyun’s Google Trend index, YG’s stock price, and the S&P 500 index, which accounted for the top second to fourth places in terms of variable importance. Unlike the model trained with weekly data, JYP and YG’s stock prices showed a significantly higher positive correlation with variable importance, whereas the importance of HYBE’s stock price remained similar in ranking. In addition, unlike the model that predicts weekly stock prices, the importance of the KOSPI index was greatly reduced, and the importance of the S&P 500 and VIX variables increased, suggesting that the influence of the US market is greater in predicting daily data. The trend index of affiliated artists showed similar correlations and rankings, with no significant changes except that Baekhyun’s Google Trend index played a more important role than the Naver Trend index. Baekhyun’s trend index was followed by that of SuperM, which showed a negative correlation with SM’s daily stock price and had significant importance.
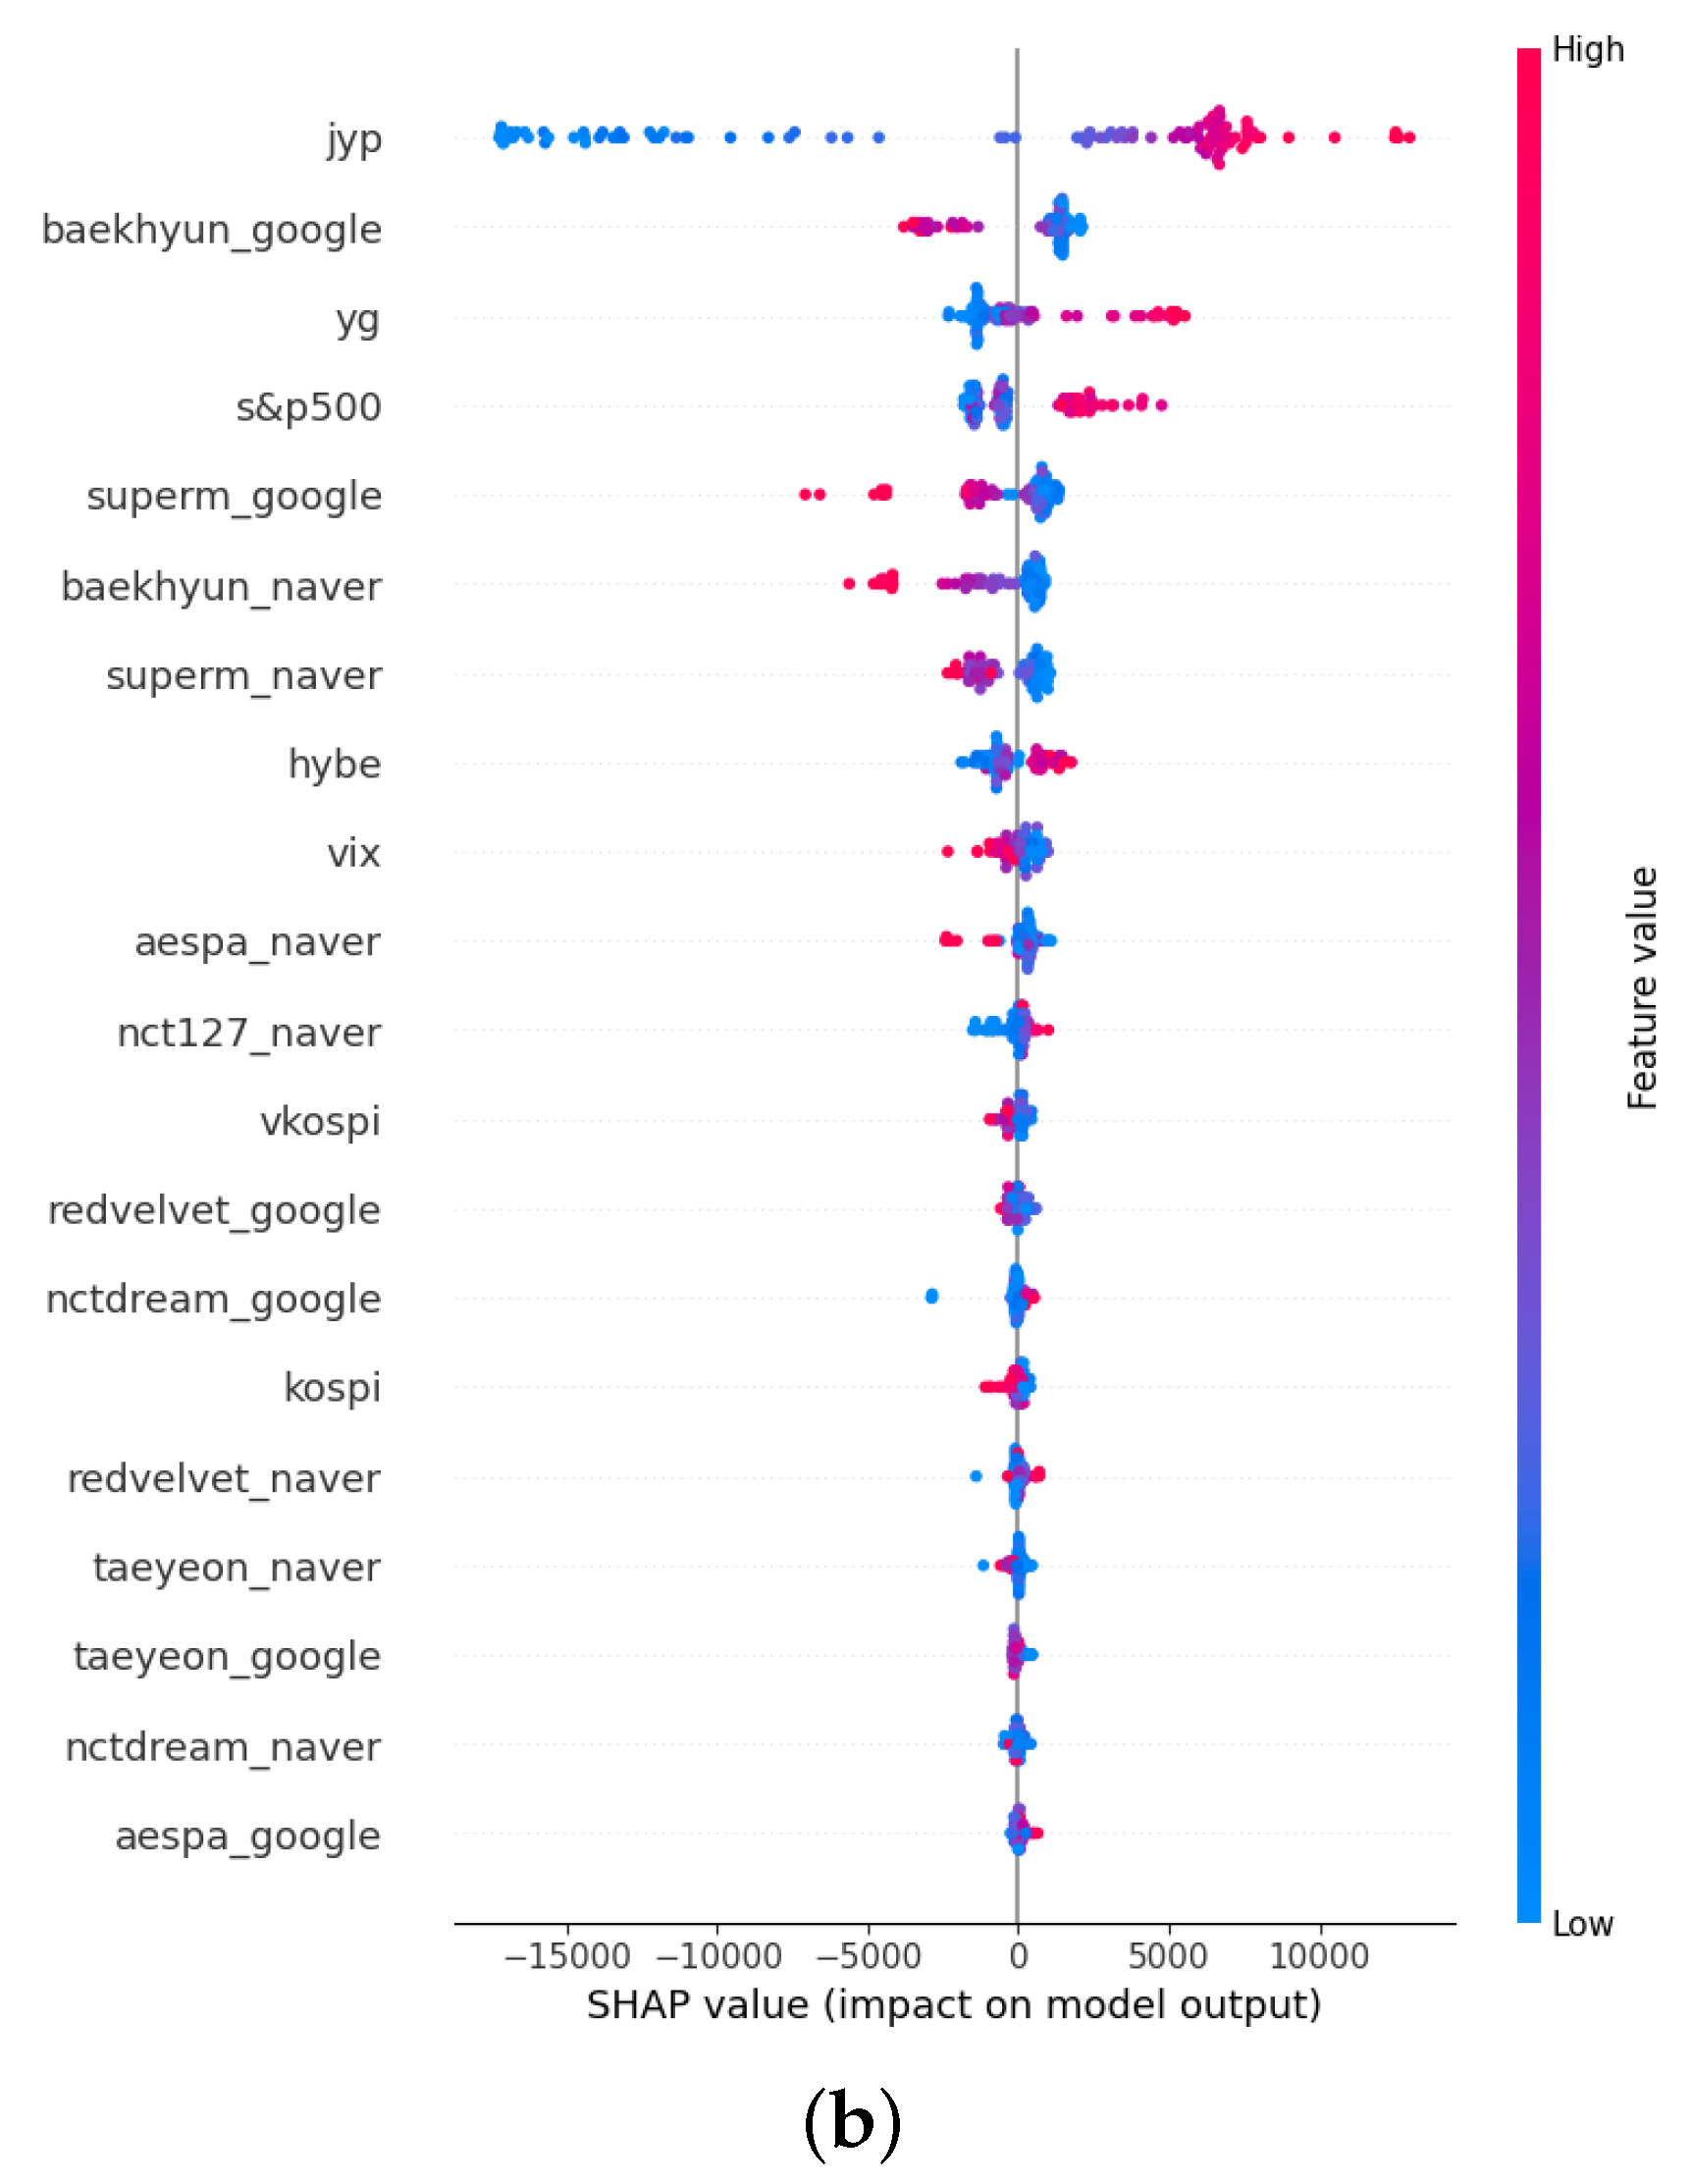
Figure 11 shows the SHAP value of the predictive model for HYBE’s daily stock price using the following variables: HYBE’s artists’ daily Naver and Google trend indexes, the stock prices of SM, JYP, and YG, and the indices of KOSPI, VKOSPI, S&P 500, and VIX. The S&P 500 was the most important variable for predicting the stock prices, as with the weekly model. However, significant differences were observed in the other variables. SM’s stock price was relatively more important than the other companies’ stock prices, ranking among the top four variables in terms of importance. In addition, JYP’s stock price became more important than in the model trained with weekly data. In terms of the daily trend index of HYBE’s artists, the Naver Trend index of the new group NewJeans had the sixth largest influence on stock price despite having a negative correlation with HYBE’s stock price. The trend indexes of the new groups ENHYPEN and LE SSERAFIM, which debuted in 2020 and 2022, respectively, had a significant impact. In the weekly model, BTS’s Naver Trend Index had the second largest influence; however, in the daily model, its influence was lower than that of the trend index of the new group. The stock index variables showed that the importance of the S&P 500 was significantly high, and the KOSPI index had the second largest importance and was positively correlated with HYBE’s stock price. VKOSPI and VIX had similar rankings in variable importance to the model trained with weekly data, and they had a negative correlation with HYBE’s stock price.
Figure 12 depicts the model that used daily data for YG’s stock price and included the daily Naver and Google Trend indexes of YG’s artists as well as the stock prices of SM, JYP, HYBE, KOSPI, VKOSPI, S&P 500, and VIX. The results showed that the stock prices of other agencies had a positive correlation with YG’s stock price and had a significant impact, and the variable importance of the S&P 500 index was even greater. In terms of the trend index of YG’s artists, Jennie’s Naver Trend index had higher variable importance than the KOSPI index. Furthermore, compared to the model trained with weekly data, the variable importance of the Naver Trend index of the singer–songwriter AKMU was relatively high and negatively correlated with YG’s stock price. Unlike the models for other agencies, the model for predicting YG’s stock price did not show a significant difference when using daily and weekly data; the stock prices of other agencies had a significant impact.
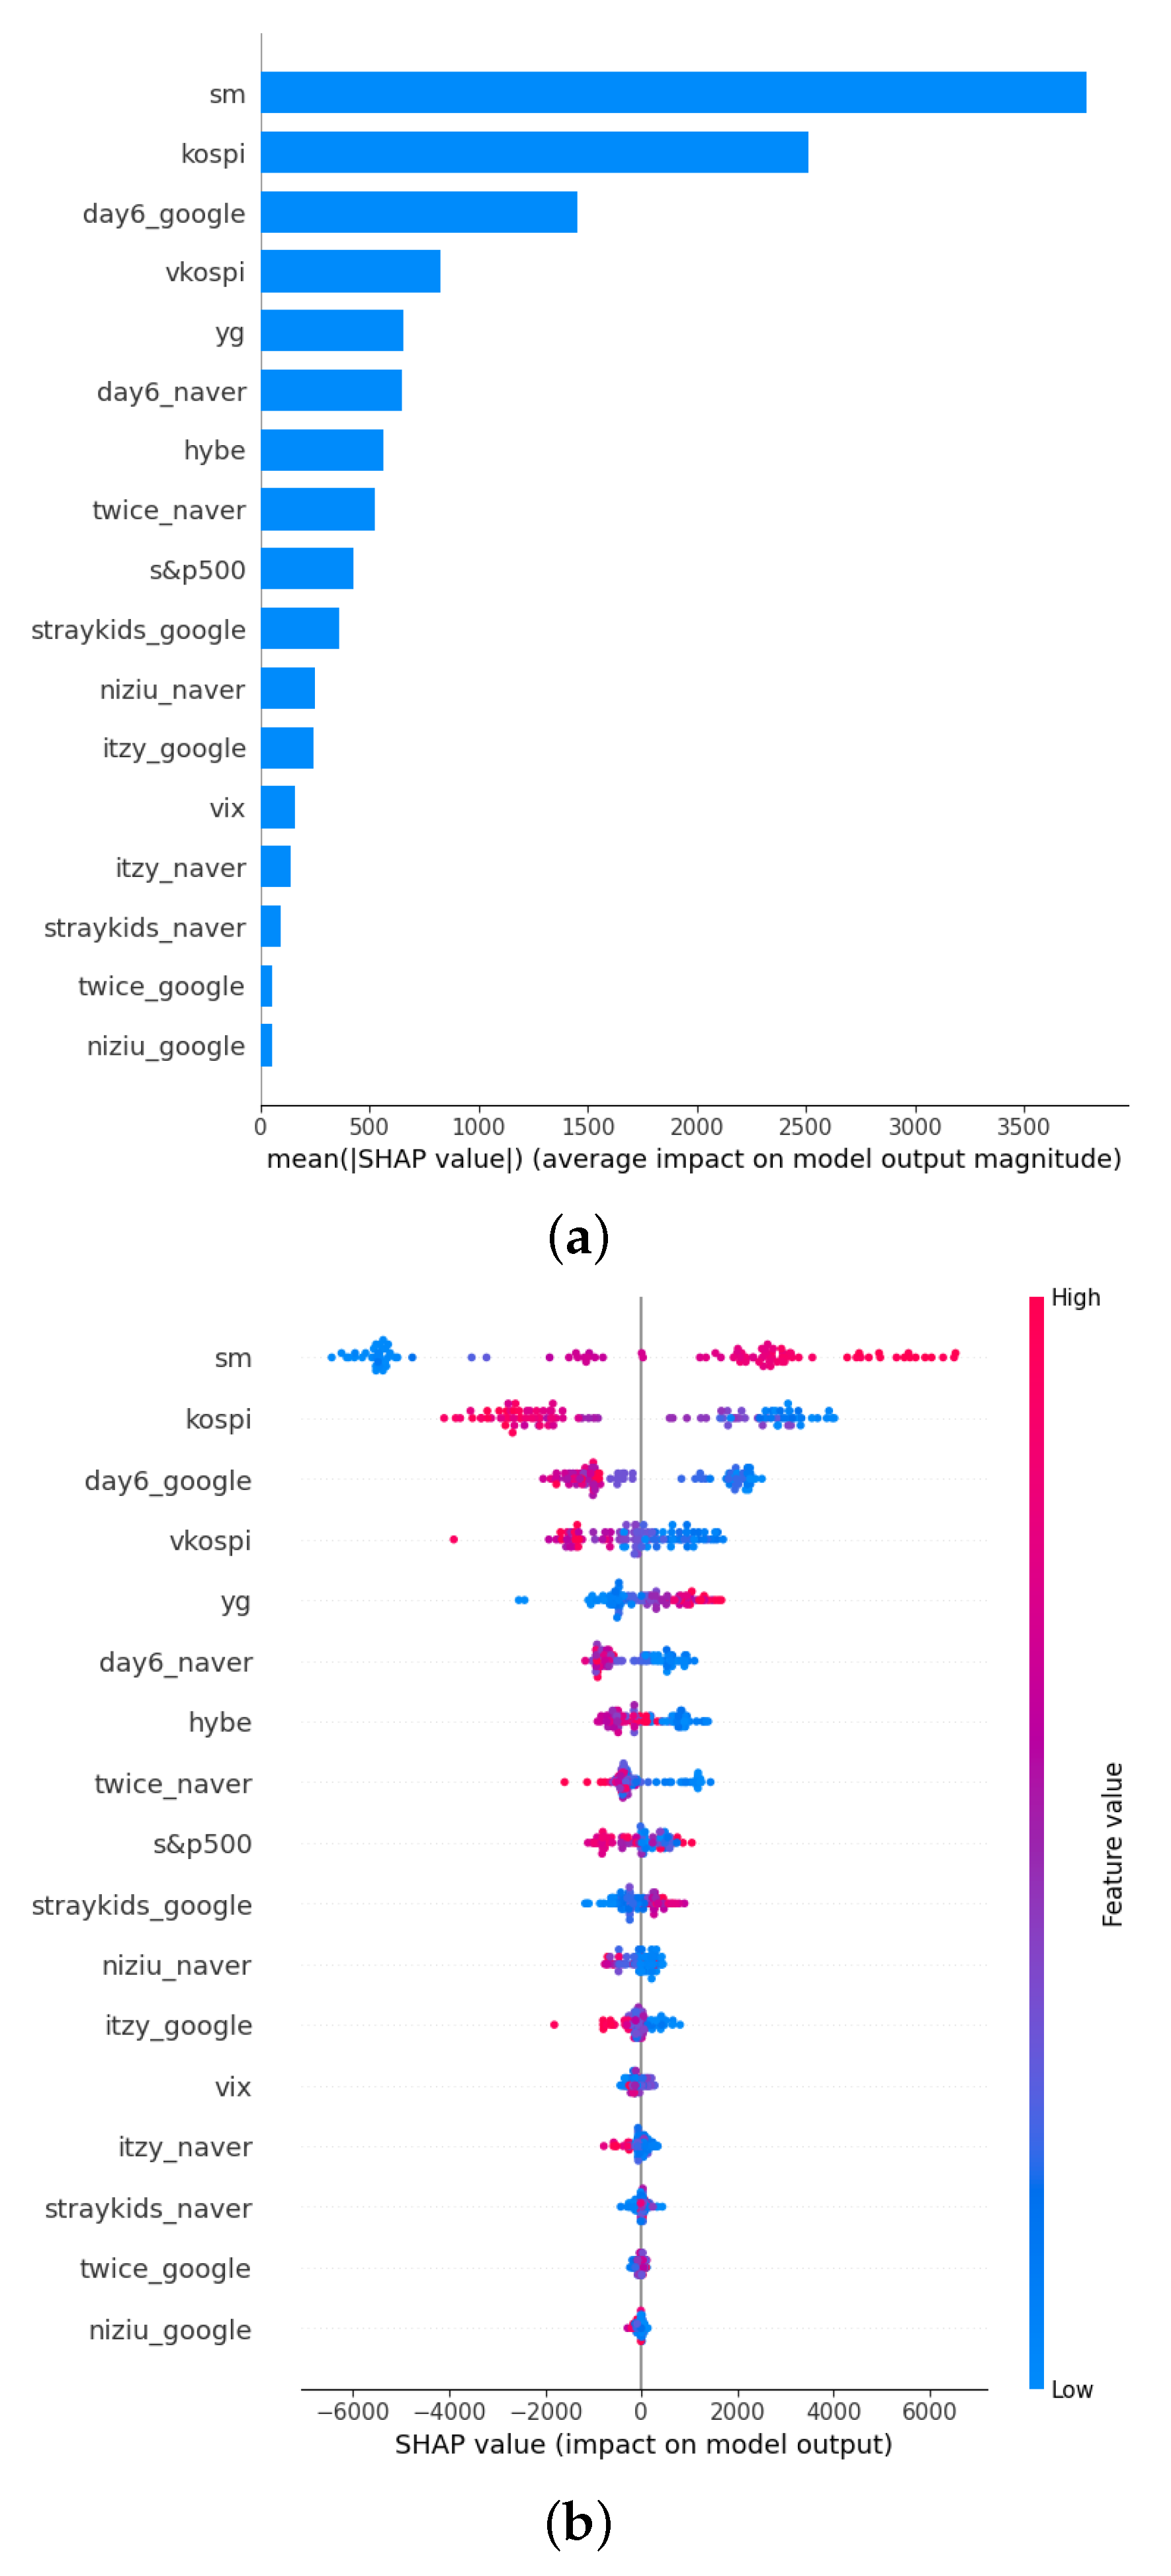
Figure 13 shows the results of calculating the SHAP value of the XGBoost model that predicted JYP’s daily stock price using various variables, including the daily Naver and Google Trend indexes of JYP’s affiliated artists, SM, HYBE, YG, KOSPI, VKOSPI, S&P 500, and VIX. Unlike the model that used weekly data, SM’s stock price was the most important, followed by KOSPI’s and DAY6’s Google Trend, which had a similar level of importance. Regarding the stock price index, KOSPI and VKOSPI had a relatively strong impact, and the importance of VKOSPI was higher than that of the weekly model, indicating that the influence of the domestic market is greater, even in predicting daily stock prices. However, KOSPI had a positive correlation with JYP’s stock price in the model predicting weekly stock prices. Conversely, KOSPI showed a weak negative correlation in the model predicting daily stock prices. The ranks of variable importance for the trend index of affiliated artists were almost identical, and it was also found that the Google Trend index of the group Stray Kids was the only variable that had a positive correlation with JYP’s daily stock price and a higher level of importance than the model predicting weekly stock prices.
Figure 14 shows the results of calculating the SHAP value of the XGBoost model, which predicts SM’s weekly stock price using various variables. KOSPI had the greatest influence, followed by JYP’s stock price and the trend index of Baekhyun, a member of the boy group EXO. Unlike the model that predicts HYBE’s stock price, the importance of HYBE’s stock price variables in predicting SM’s stock price is minimal. Among the trend index variables of affiliated artists, Baekhyun’s Google and Naver Trend indexes, followed by SuperM’s Google Trend index—a reorganized group consisting of popular members from each group—had significant importance. All showed a negative correlation with SM’s weekly stock price. Among the stock price index variables, KOSPI and VKOSPI had significantly higher variable importance, suggesting that domestic market influence is greater in predicting SM’s stock price.
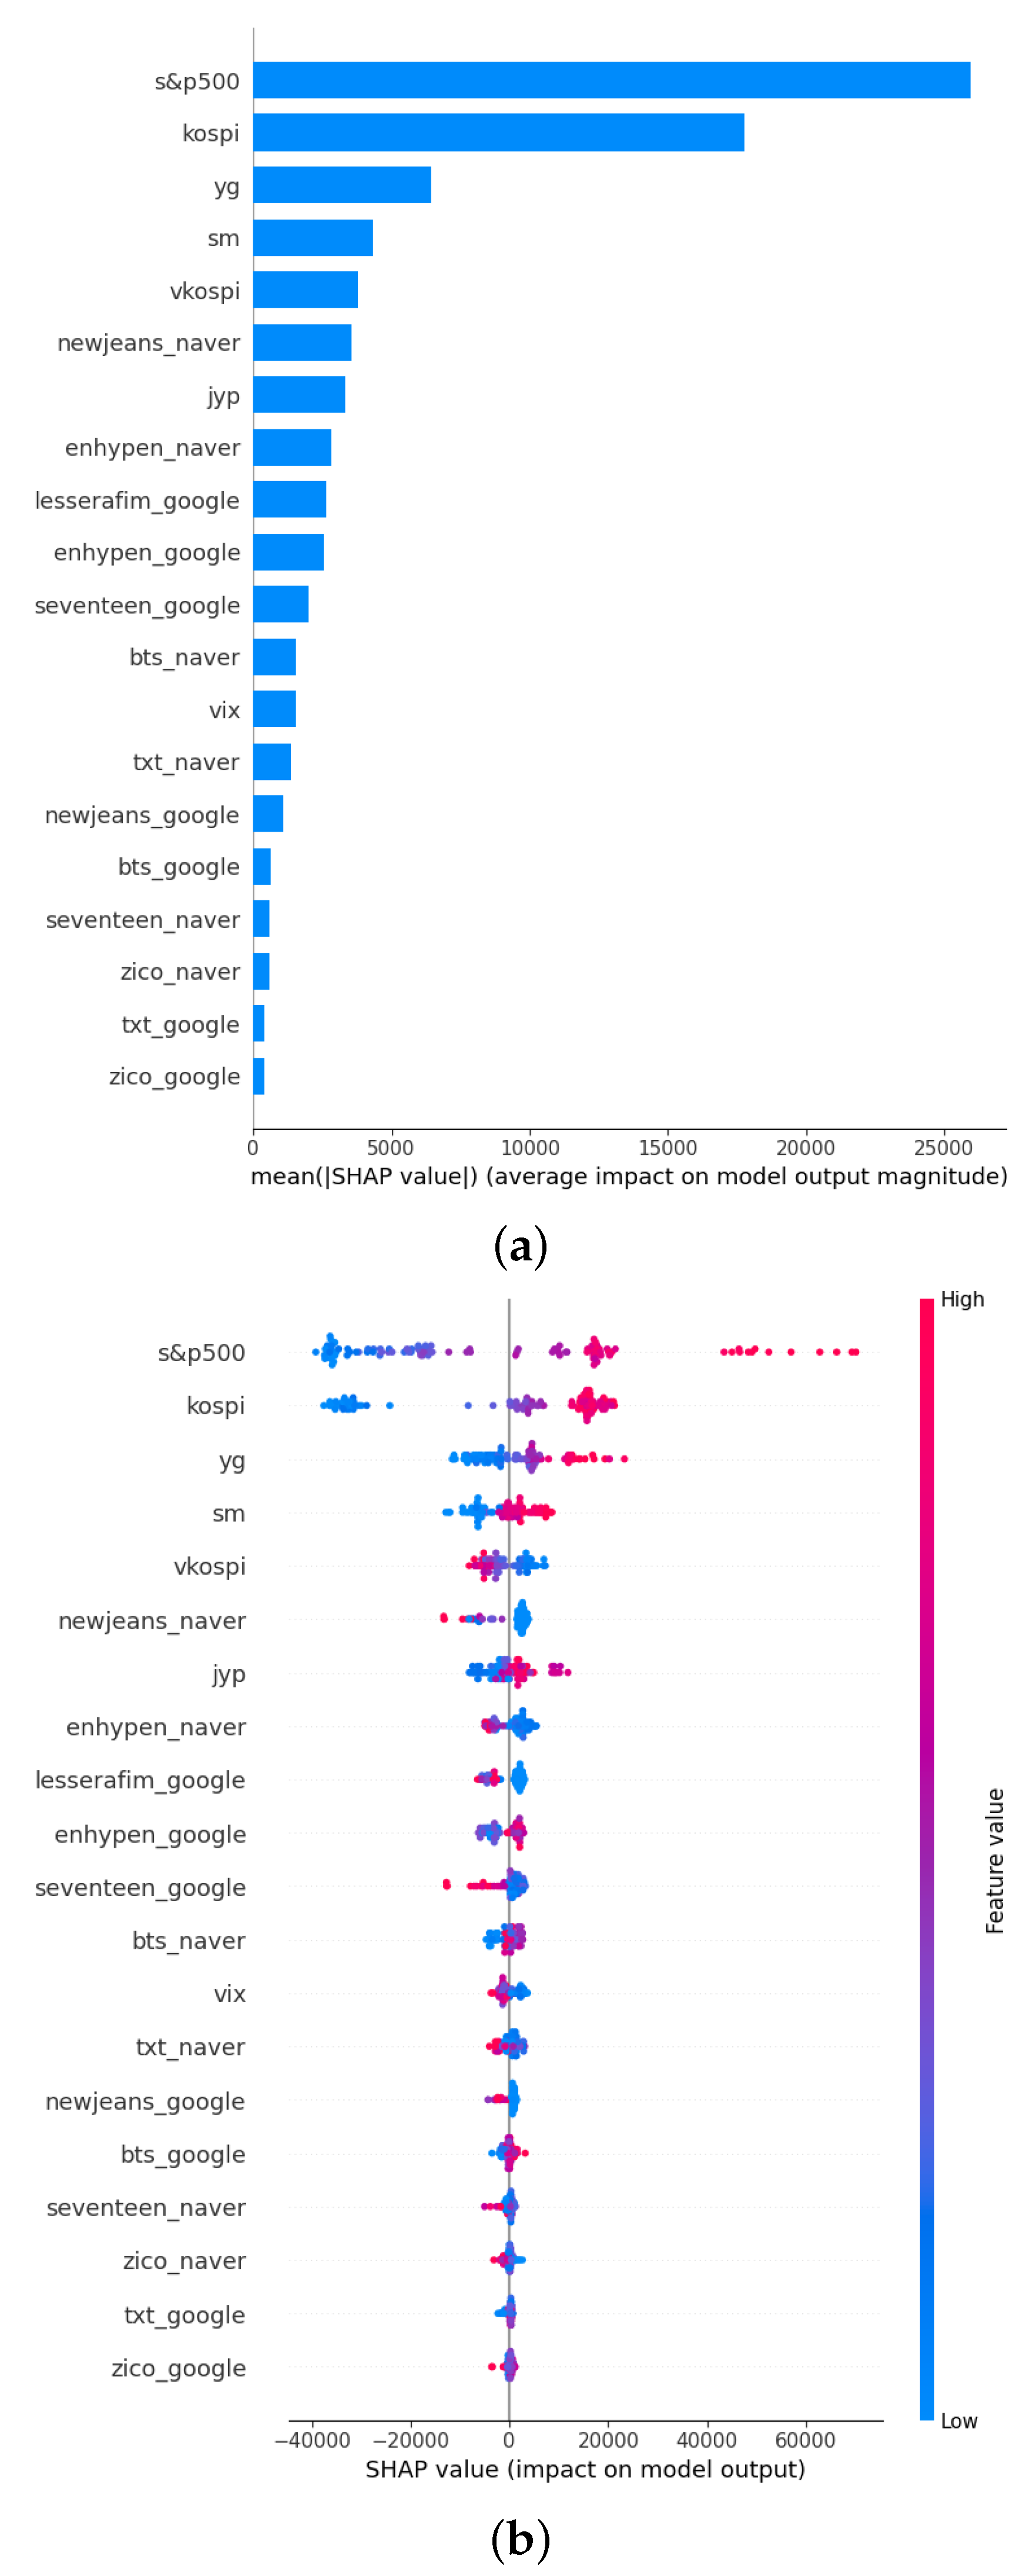
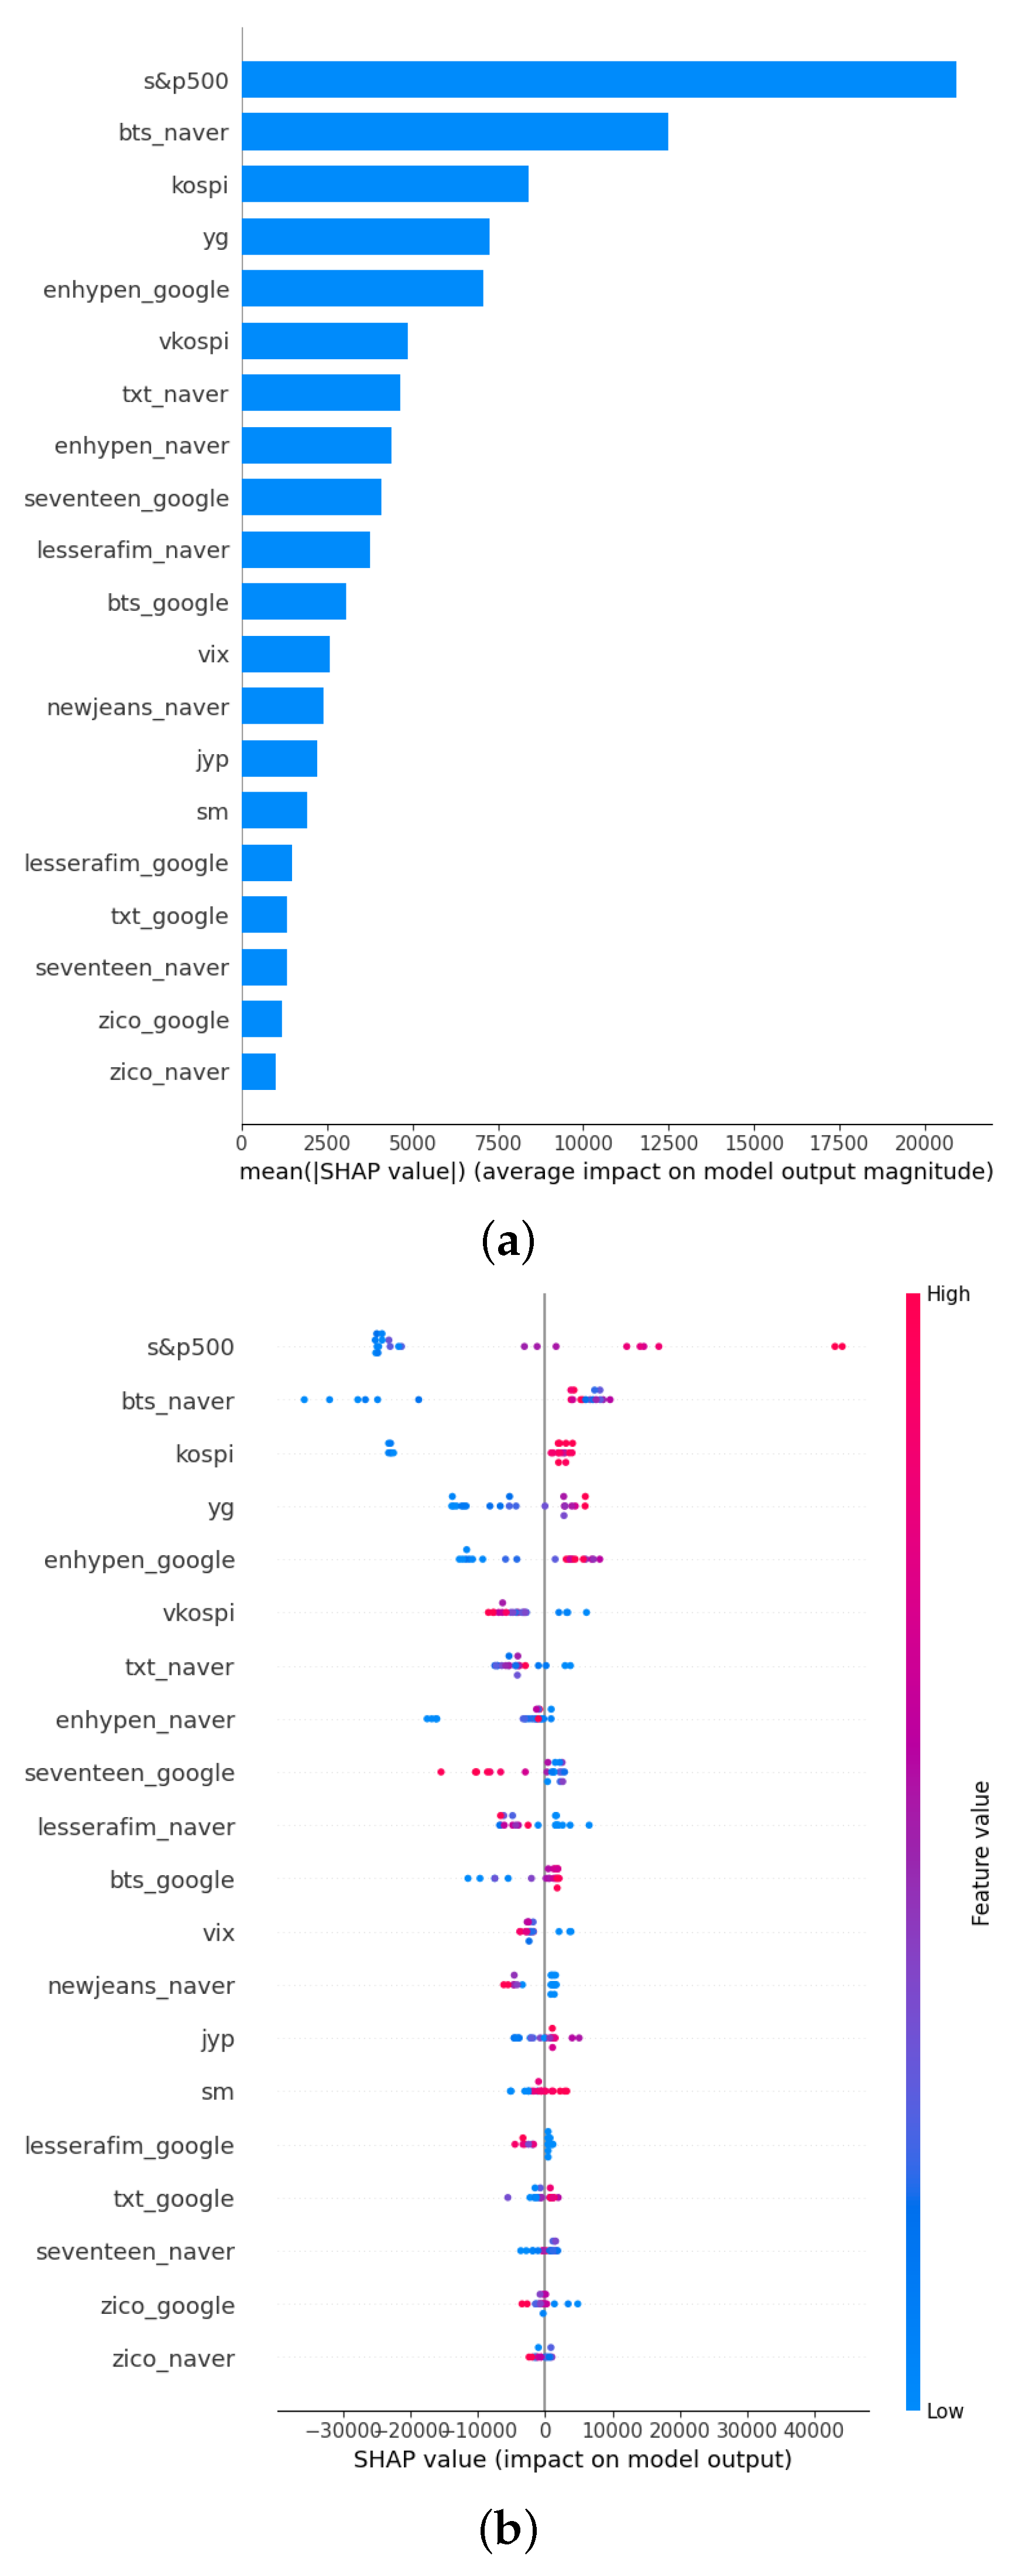
Figure 15 shows the results of calculating the SHAP values of the XGBoost model, which predicts the weekly stock price of HYBE using each variable. The results are explained using the XAI method. Similar to the previous results, the S&P 500 had the greatest influence; however, different results were observed for artist search volumes. Originally, the negative influence of the group LE SSERAFIM was high; however, after tuning the hyperparameters, BTS’s Naver Trend index had the second largest influence, after the S&P 500. Additionally, the influence of the group ENHYPEN, which debuted after 2020, was negligible in the previous model; however, in the newly tuned model, ENHYPEN’s Google Trend index had a significant influence, ranking among the top five variables. On the other hand, the influence of the group Seventeen and singer ZICO declined relatively, and their importance fell below that of the new groups, such as NewJeans, LE SSERAFIM, and ENHYPEN.
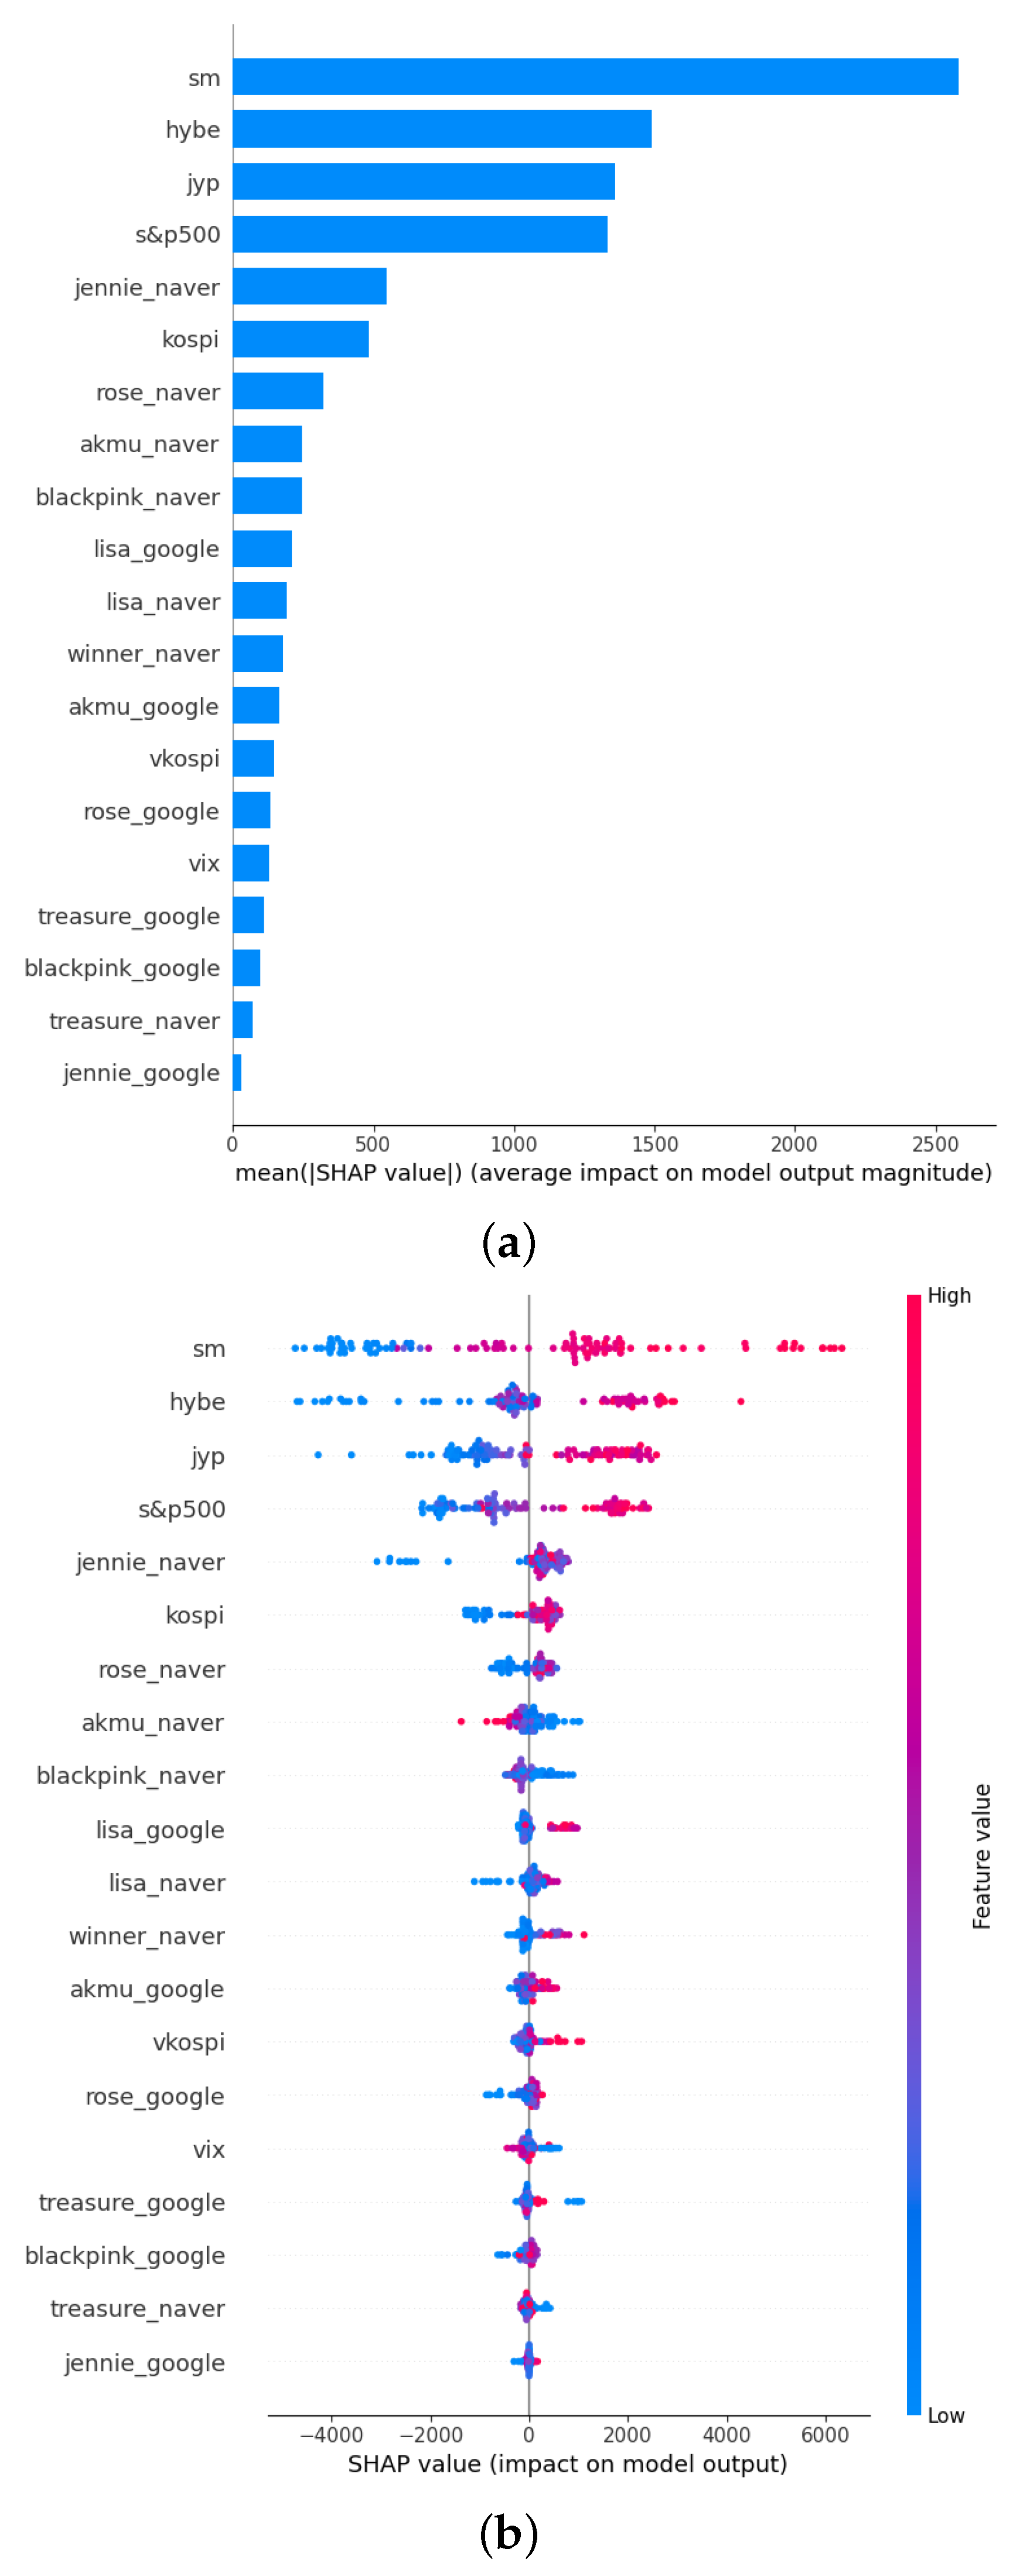
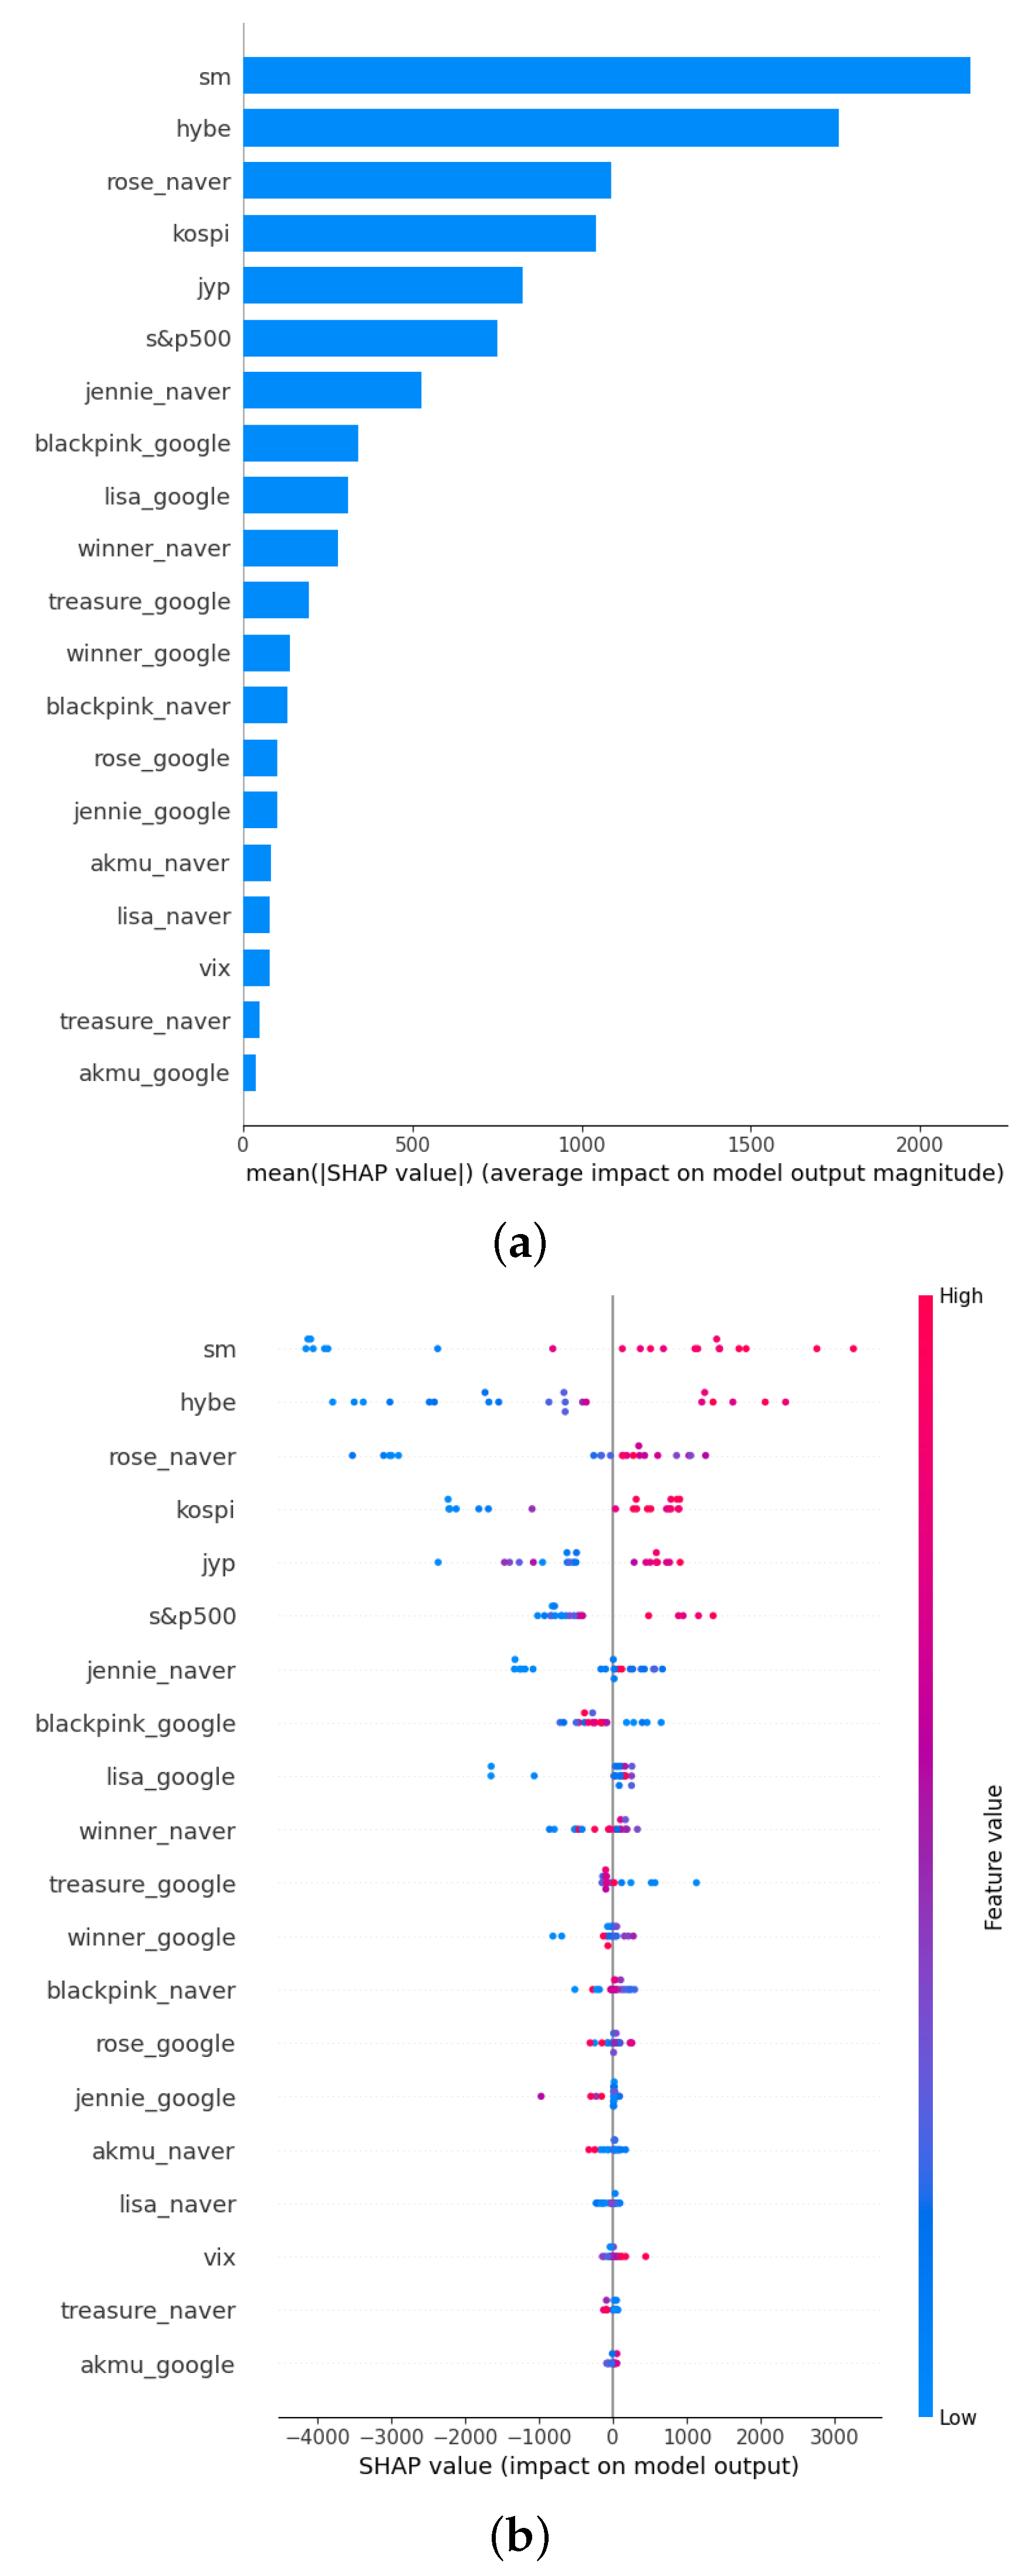
Figure 16 shows the results of calculating the SHAP value of an XGBoost model that predicts YG’s daily stock prices using various variables. Similar to the model that predicted the stock prices of the three major agencies, including YG, SM, and JYP, SM’s stock price had the highest variable importance. However, unlike the models that predicted the stock prices of SM and JYP, HYBE’s stock price also had a significant impact. The Naver Trend index of BLACKPINK member Rosé and the KOSPI Index were observed to have a significant impact. Observing the trend index of the artists, even within BLACKPINK, Lisa, who has a much larger overseas fandom than domestic artists, had higher variable importance in the Google Trend index. However, for Jennie and Rosé, who are members with similar popularity in Korea, the Naver Trend index had higher variable importance. Overall, the Google Trend index had higher variable importance in BLACKPINK’s trend index, indicating that the overall scale of the fandom is larger overseas. In addition, for the group Winner, the Naver Trend index had higher variable importance. On the other hand, the variable importance of the Google Trend index for the new group Treasure was higher, as the fandom size in countries such as Japan is relatively larger than in Korea.
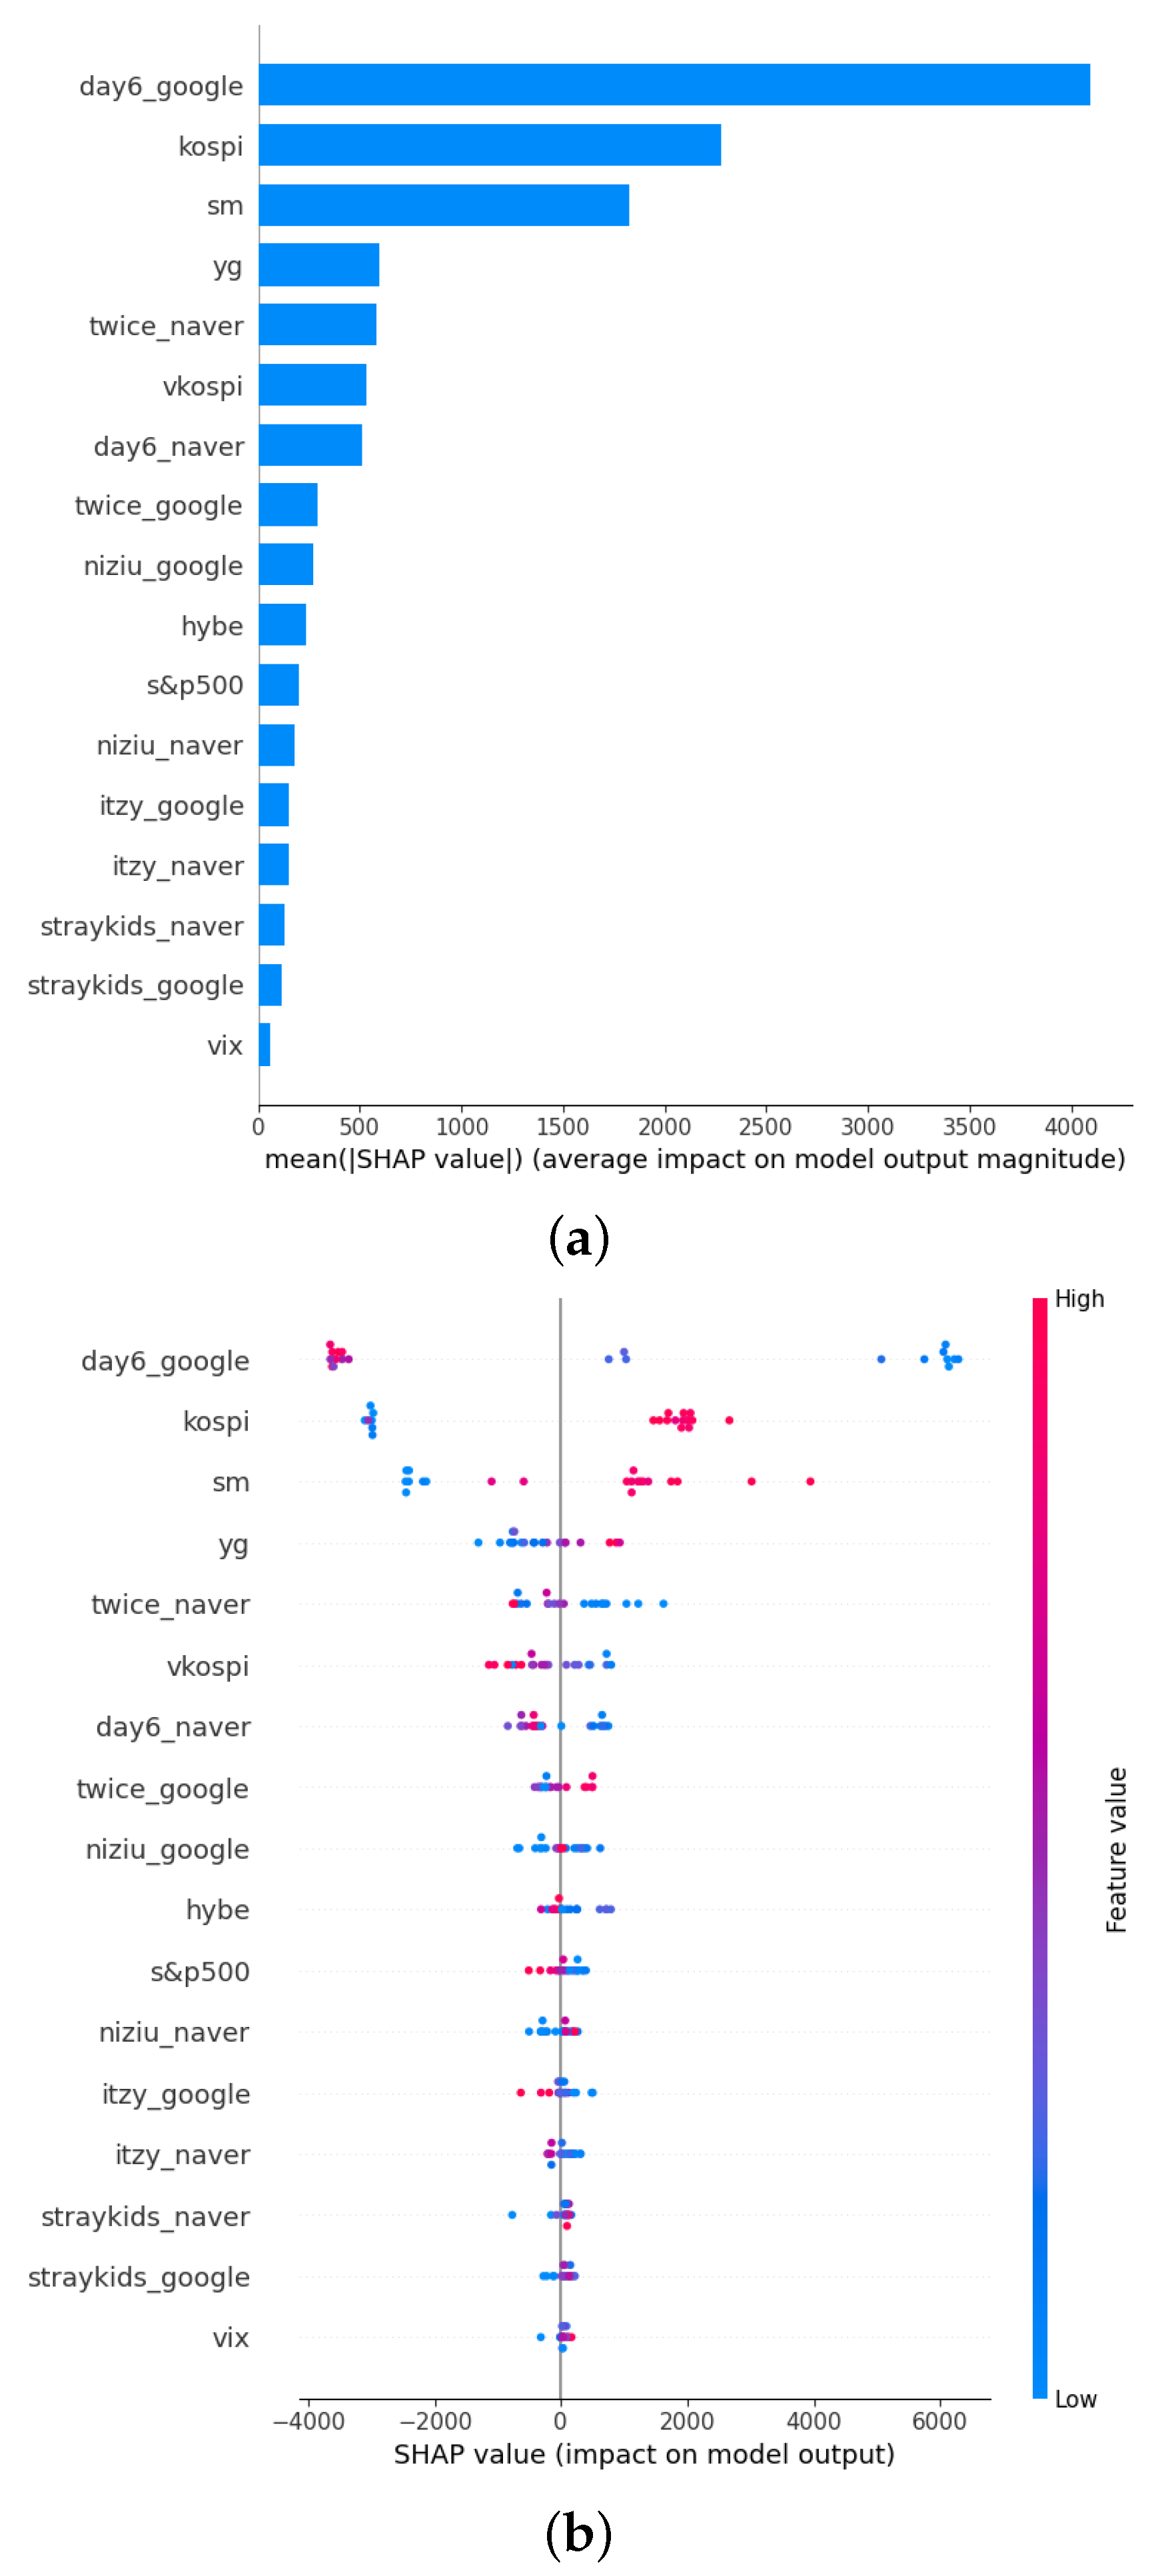
Figure 17 shows the results of calculating the SHAP value of the XGBoost model that predicted JYP’s weekly stock price using various variables. Examining the ranking of variable importance, the Google Trend index of the band group DAY6 had the greatest impact, followed by the KOSPI index, SM’s stock price, and YG’s stock price, indicating that these variables had a significant effect on predicting JYP’s weekly stock price. Similar to the model that predicts SM’s stock price, the influence of the stock prices of the three major agencies, excluding HYBE, was observed to be significant. Observing the stock price index, KOSPI and VKOSPI had a relatively strong impact, suggesting that the influence of the domestic market is greater in predicting JYP’s weekly stock price. In terms of the trend index of the affiliated artists, the Google Trend index of the group DAY6 had a large negative correlation with JYP’s stock price and a high level of importance. This is followed by the Naver Trend index of the girl-group TWICE, which also had a negative correlation with the stock price and ranked in the top five of variable importance.
6. Concluding Remarks
We investigated whether the public’s interest in artists affiliated with each entertainment company in the entertainment industry, which acts as an important indicator, has a financial impact on the company. Therefore, we selected four companies in the K-Pop industry, chose a representative artist for each company, and collected each artist’s Naver Keyword Trend and Google Trend indexes. A model using XGBoost was created to predict an entertainment company’s stock price based on the interest index, stock index, and other companies’ stock prices. Feature importance through SHAP was also observed.
The main findings are summarized as follows. First, SM, JYP, and YG were shown to be highly correlated with each other but not for HYBE, which has recently emerged as a major player in the K-Pop industry. In addition, YG is particularly influenced by variables from other companies, including HYBE, which may be owing to HYBE being a major shareholder in YG’s subsidiary music distribution company, YG PLUS.
Second, the influence of popular artists from each company is significant in predicting stock prices. In other words, the public’s interest in famous artists who generate the largest sales for an entertainment company affects the company’s stock price. Therefore, it can be said that the model used in this study generated reasonable and acceptable results.
Third, when the foreign ownership ratio of a company’s stocks is relatively high, the importance of Google Trend indexes is greater than that of Naver Trend indexes. For example, DAY6’s Google Trend index was found to be an important factor in the prediction model of daily JYP stock price, whereas SuperM’s Google Trend index was significant for SM, both of which have relatively high foreign ownership ratios. In contrast, for HYBE and YG, the Naver Trend indexes of NewJeans, TXT, BTS, and Jennie and Rosé were found to be more important than the Google Trend indexes.
Finally, the trend indexes of artists in SM and HYBE have a positive correlation with stock prices, whereas those in YG and JYP have a negative correlation. This may be due to the steady promotions and album releases of SM and HYBE artists, while YG and JYP suffered from negative publicity related to their artists and executives.
In concluding our study, it is important to acknowledge the limitations inherent in our research. Firstly, our study primarily focused on the application of SHAP-XGBoost analysis as the main methodology without providing a methodological robustness test. While our findings demonstrate a certain level of robustness within the scope of XGBoost, it is imperative to consider alternative boosting and machine learning methodologies, such as Adaptive Boosting and long short-term memory (Chang et al. [61], Chang et al. [62]) to further validate and strengthen our study results. We propose this robustness analysis as a subject for further research.
Secondly, while K-Pop has garnered significant popularity not only in Korea but also in other Asian countries such as China and Japan, we regrettably did not account for these effects in our analysis. To address this shortcoming, we recommend incorporating additional data, such as China’s Baidu search volume data, to comprehensively examine the impact of each region on the K-Pop industry. Furthermore, since this study used the interest index based on daily and weekly data, we also propose a study with intraday frequency as a future research task.
Lastly, it is crucial to acknowledge that our study solely relied on stock and volatility indices as the financial data influencing K-Pop entertainment companies’ stock prices. However, we recognize that various other financial and economic indicators, such as GDP, EPU index, and GPR index, may exert an influence on K-Pop stock prices. Hence, incorporating these additional indicators into the feature set for predicting entertainment stock prices would undoubtedly enhance the predictability of the model.
Author Contributions
Conceptualization, S.-Y.C.; Methodology, D.Y. and S.-Y.C.; Software, D.Y. and S.-Y.C.; Formal analysis and investigation, D.Y. and S.-Y.C.; Writing—original draft, D.Y.; Writing—review and editing, D.Y. and S.-Y.C. All authors have read and agreed to the published version of the manuscript.
Funding
The work of S.-Y. Choi was supported by a National Research Foundation of Korea (NRF) grant funded by the Korean government (MSIT) (No. 2021R1F1A1046138).
Data Availability Statement
The data used to support the findings of this study are available from the corresponding author upon request.
Conflicts of Interest
The authors declare no conflict of interest.
References
- Moussa, F.; BenOuda, O.; Delhoumi, E. The use of open source internet to analysis and predict stock market trading volume. Res. Int. Bus. Financ. 2017, 41, 399–411. [Google Scholar] [CrossRef]
- Chen, Y.; Zhao, H.; Li, Z.; Lu, J. A dynamic analysis of the relationship between investor sentiment and stock market realized volatility: Evidence from China. PLoS ONE 2020, 15, e0243080. [Google Scholar] [CrossRef] [PubMed]
- Lee, C.C.; Chen, M.P.; Lee, C.C. Investor attention, ETF returns, and country-specific factors. Res. Int. Bus. Financ. 2021, 56, 101386. [Google Scholar] [CrossRef]
- Bijl, L.; Kringhaug, G.; Molnár, P.; Sandvik, E. Google searches and stock returns. Int. Rev. Financ. Anal. 2016, 45, 150–156. [Google Scholar] [CrossRef]
- Swamy, V.; Dharani, M.; Takeda, F. Investor attention and Google Search Volume Index: Evidence from an emerging market using quantile regression analysis. Res. Int. Bus. Financ. 2019, 50, 1–17. [Google Scholar] [CrossRef]
- Costola, M.; Iacopini, M.; Santagiustina, C.R. Google search volumes and the financial markets during the COVID-19 outbreak. Financ. Res. Lett. 2021, 42, 101884. [Google Scholar] [CrossRef]
- Klein, T. A note on GameStop, short squeezes, and autodidactic herding: An evolution in financial literacy? Financ. Res. Lett. 2022, 46, 102229. [Google Scholar] [CrossRef]
- Koch, S.; Dimpfl, T. Attention and retail investor herding in cryptocurrency markets. Financ. Res. Lett. 2023, 51, 103474. [Google Scholar] [CrossRef]
- Han, J.; Miao, S.; Li, Y.; Yang, W.; Yin, H. Faulted-Phase classification for transmission lines using gradient similarity visualization and cross-domain adaption-based convolutional neural network. Electr. Power Syst. Res. 2021, 191, 106876. [Google Scholar] [CrossRef]
- Bhatnagar, M.; Yadav, A.; Swetapadma, A. Enhancing the resiliency of transmission lines using extreme gradient boosting against faults. Electr. Power Syst. Res. 2022, 207, 107850. [Google Scholar] [CrossRef]
- Bentéjac, C.; Csörgő, A.; Martínez-Muñoz, G. A comparative analysis of gradient boosting algorithms. Artif. Intell. Rev. 2021, 54, 1937–1967. [Google Scholar] [CrossRef]
- Nasiri, H.; Homafar, A.; Chelgani, S.C. Prediction of uniaxial compressive strength and modulus of elasticity for Travertine samples using an explainable artificial intelligence. Results Geophys. Sci. 2021, 8, 100034. [Google Scholar] [CrossRef]
- Fatahi, R.; Nasiri, H.; Dadfar, E.; Chehreh Chelgani, S. Modeling of energy consumption factors for an industrial cement vertical roller mill by SHAP-XGBoost: A “conscious lab” approach. Sci. Rep. 2022, 12, 7543. [Google Scholar] [CrossRef] [PubMed]
- Yang, Y.; Huang, Q.; Li, P. Online prediction and correction control of static voltage stability index based on Broad Learning System. Expert Syst. Appl. 2022, 199, 117184. [Google Scholar] [CrossRef]
- Zhang, J.; Ma, X.; Zhang, J.; Sun, D.; Zhou, X.; Mi, C.; Wen, H. Insights into geospatial heterogeneity of landslide susceptibility based on the SHAP-XGBoost model. J. Environ. Manag. 2023, 332, 117357. [Google Scholar] [CrossRef]
- Rathnayaka, R.K.T.; Jianguo, W.; Seneviratna, D.N. Geometric Brownian motion with Ito’s lemma approach to evaluate market fluctuations: A case study on Colombo Stock Exchange. In Proceedings of the 2014 International Conference on Behavioral, Economic, and Socio-Cultural Computing (BESC2014), Shanghai, China, 30 October–1 November 2014; pp. 1–6. [Google Scholar]
- Agustini, W.F.; Affianti, I.R.; Putri, E.R. Stock price prediction using geometric Brownian motion. J. Phys. Conf. Ser. 2018, 974, 012047. [Google Scholar] [CrossRef] [Green Version]
- Liu, Z.; Huang, S. Carbon option price forecasting based on modified fractional Brownian motion optimized by GARCH model in carbon emission trading. N. Am. J. Econ. Financ. 2021, 55, 101307. [Google Scholar] [CrossRef]
- Hu, H.; Zhao, C.; Li, J.; Huang, Y. Stock prediction model based on mixed fractional Brownian motion and improved fractional-order particle swarm optimization algorithm. Fractal Fract. 2022, 6, 560. [Google Scholar] [CrossRef]
- Kim, W.J.; Jung, G.; Choi, S.Y. Forecasting Cds term structure based on nelson–siegel model and machine learning. Complexity 2020, 2020, 2518283. [Google Scholar] [CrossRef]
- Shin, S.; Austin, P.C.; Ross, H.J.; Abdel-Qadir, H.; Freitas, C.; Tomlinson, G.; Chicco, D.; Mahendiran, M.; Lawler, P.R.; Billia, F.; et al. Machine learning vs. conventional statistical models for predicting heart failure readmission and mortality. Esc Heart Fail. 2021, 8, 106–115. [Google Scholar] [CrossRef]
- Grendas, L.N.; Chiapella, L.; Rodante, D.E.; Daray, F.M. Comparison of traditional model-based statistical methods with machine learning for the prediction of suicide behaviour. J. Psychiatr. Res. 2022, 145, 85–91. [Google Scholar] [CrossRef] [PubMed]
- Chae, S.C.; Choi, S.Y. Analysis of the Term Structure of Major Currencies Using Principal Component Analysis and Autoencoders. Axioms 2022, 11, 135. [Google Scholar] [CrossRef]
- Barber, B.M.; Odean, T. All that glitters: The effect of attention and news on the buying behavior of individual and institutional investors. Rev. Financ. Stud. 2008, 21, 785–818. [Google Scholar] [CrossRef] [Green Version]
- Da, Z.; Engelberg, J.; Gao, P. In search of attention. J. Financ. 2011, 66, 1461–1499. [Google Scholar] [CrossRef]
- Li, J.; Yu, J. Investor attention, psychological anchors, and stock return predictability. J. Financ. Econ. 2012, 104, 401–419. [Google Scholar] [CrossRef]
- Zhang, W.; Shen, D.; Zhang, Y.; Xiong, X. Open source information, investor attention, and asset pricing. Econ. Model. 2013, 33, 613–619. [Google Scholar] [CrossRef]
- Han, L.; Lv, Q.; Yin, L. Can investor attention predict oil prices? Energy Econ. 2017, 66, 547–558. [Google Scholar] [CrossRef]
- Halousková, M.; Stašek, D.; Horváth, M. The role of investor attention in global asset price variation during the invasion of Ukraine. Financ. Res. Lett. 2022, 50, 103292. [Google Scholar] [CrossRef]
- Bank, M.; Larch, M.; Peter, G. Google search volume and its influence on liquidity and returns of German stocks. Financ. Mark. Portf. Manag. 2011, 25, 239–264. [Google Scholar] [CrossRef]
- Alexander Dietzel, M.; Braun, N.; Schäfers, W. Sentiment-based commercial real estate forecasting with Google search volume data. J. Prop. Invest. Financ. 2014, 32, 540–569. [Google Scholar] [CrossRef] [Green Version]
- Liu, Y.; Chen, Y.; Wu, S.; Peng, G.; Lv, B. Composite leading search index: A preprocessing method of internet search data for stock trends prediction. Ann. Oper. Res. 2015, 234, 77–94. [Google Scholar] [CrossRef]
- Li, X.; Ma, J.; Wang, S.; Zhang, X. How does Google search affect trader positions and crude oil prices? Econ. Model. 2015, 49, 162–171. [Google Scholar] [CrossRef]
- Hu, H.; Tang, L.; Zhang, S.; Wang, H. Predicting the direction of stock markets using optimized neural networks with Google Trends. Neurocomputing 2018, 285, 188–195. [Google Scholar] [CrossRef]
- Huang, M.Y.; Rojas, R.R.; Convery, P.D. Forecasting stock market movements using Google Trend searches. Empir. Econ. 2020, 59, 2821–2839. [Google Scholar] [CrossRef]
- Fan, M.H.; Chen, M.Y.; Liao, E.C. A deep learning approach for financial market prediction: Utilization of Google trends and keywords. Granul. Comput. 2021, 6, 207–216. [Google Scholar] [CrossRef]
- El Ouadghiri, I.; Guesmi, K.; Peillex, J.; Ziegler, A. Public attention to environmental issues and stock market returns. Ecol. Econ. 2021, 180, 106836. [Google Scholar] [CrossRef]
- Dharani, M.; Hassan, M.K.; Abedin, M.Z.; Ismail, M.A. Does a search attention index explain portfolio returns in India? Borsa Istanb. Rev. 2022, 22, 226–239. [Google Scholar] [CrossRef]
- Joshi, A.M.; Hanssens, D.M. Movie advertising and the stock market valuation of studios: A case of “great expectations?”. Mark. Sci. 2009, 28, 239–250. [Google Scholar] [CrossRef] [Green Version]
- Joshi, A. Movie stars and the volatility of movie revenues. J. Media Econ. 2015, 28, 246–267. [Google Scholar] [CrossRef]
- Ltaifa, M.B.; Jamel, L.; Elnagar, A.K.; Derbali, A. Which is Determining in the Fluctuation of Stock Market Risk of Entertainment Compagnies in Viet Nam: Financial and Economic Crisis or Low Inflation Rate? Risk Financ. Manag. 2020, 2, p76. [Google Scholar] [CrossRef]
- Edwards Barros, C.M.; França Lopes, I.; Simão Kaveski, I.D. Pokémon Go!: Stock valuation and disruptive innovation in entertainment industry. Rev. Contemp. Contab. 2021, 18, 47–63. [Google Scholar] [CrossRef]
- Chen, Y. COVID-19 and the Dynamics of Disney’s Stock Price. In Proceedings of the 2022 7th International Conference on Social Sciences and Economic Development (ICSSED 2022), Wuhan, China, 25–27 March 2022; pp. 1425–1431. [Google Scholar]
- Wu, C.; Chen, Z. Media Coverage and the Noneffective Investment. In Proceedings of the 6th International Conference on E-Commerce, E-Business and E-Government, Plymouth, UK, 27–29 April 2022; pp. 10–14. [Google Scholar]
- Hayduk, T., III. Who Benefitted from the PyeongChang Olympic Announcement? Evidence from the South Korean Stock Market. J. Sport. Econ. 2022, 23, 39–75. [Google Scholar] [CrossRef]
- Yun, K.K.; Yoon, S.W.; Won, D. Prediction of stock price direction using a hybrid GA-XGBoost algorithm with a three-stage feature engineering process. Expert Syst. Appl. 2021, 186, 115716. [Google Scholar] [CrossRef]
- Antwarg, L.; Miller, R.M.; Shapira, B.; Rokach, L. Explaining anomalies detected by autoencoders using Shapley Additive Explanations. Expert Syst. Appl. 2021, 186, 115736. [Google Scholar] [CrossRef]
- Weng, F.; Zhu, J.; Yang, C.; Gao, W.; Zhang, H. Analysis of financial pressure impacts on the health care industry with an explainable machine learning method: China versus the USA. Expert Syst. Appl. 2022, 210, 118482. [Google Scholar] [CrossRef]
- Lin, B.; Bai, R. Machine learning approaches for explaining determinants of the debt financing in heavy-polluting enterprises. Financ. Res. Lett. 2022, 44, 102094. [Google Scholar] [CrossRef]
- Zou, Y.; Gao, C.; Gao, H. Business Failure Prediction Based on a Cost-Sensitive Extreme Gradient Boosting Machine. IEEE Access 2022, 10, 42623–42639. [Google Scholar] [CrossRef]
- Sairam, S.; Seshadhri, S.; Marafioti, G.; Srinivasan, S.; Mathisen, G.; Bekiroglu, K. Edge-based Explainable Fault Detection Systems for photovoltaic panels on edge nodes. Renew. Energy 2022, 185, 1425–1440. [Google Scholar] [CrossRef]
- Feng, Y.; Duan, Q.; Chen, X.; Yakkali, S.S.; Wang, J. Space cooling energy usage prediction based on utility data for residential buildings using machine learning methods. Appl. Energy 2021, 291, 116814. [Google Scholar] [CrossRef]
- Alsahaf, A.; Petkov, N.; Shenoy, V.; Azzopardi, G. A framework for feature selection through boosting. Expert Syst. Appl. 2022, 187, 115895. [Google Scholar] [CrossRef]
- Shapley, L.S. Stochastic games. Proc. Natl. Acad. Sci. USA 1953, 39, 1095–1100. [Google Scholar] [CrossRef] [Green Version]
- Bloch, L.; Friedrich, C.M. Data analysis with Shapley values for automatic subject selection in Alzheimer’s disease data sets using interpretable machine learning. Alzheimer’s Res. Ther. 2021, 13, 1–30. [Google Scholar] [CrossRef]
- Dong, H.; Sun, J.; Sun, X. A multi-objective multi-label feature selection algorithm based on shapley value. Entropy 2021, 23, 1094. [Google Scholar] [CrossRef]
- Rozemberczki, B.; Sarkar, R. The shapley value of classifiers in ensemble games. In Proceedings of the 30th ACM International Conference on Information & Knowledge Management, Gold Coast, Queensland, Australia, 1 November 2021; pp. 1558–1567. [Google Scholar]
- Li, Z. Extracting spatial effects from machine learning model using local interpretation method: An example of SHAP and XGBoost. Comput. Environ. Urban Syst. 2022, 96, 101845. [Google Scholar] [CrossRef]
- Aas, K.; Jullum, M.; Løland, A. Explaining individual predictions when features are dependent: More accurate approximations to Shapley values. Artif. Intell. 2021, 298, 103502. [Google Scholar] [CrossRef]
- Lundberg, S.M.; Lee, S.I. A unified approach to interpreting model predictions. In Proceedings of the Annual Conference on Neural Information Processing Systems 2017, Long Beach, CA, USA, 4–9 December 2017; pp. 4765–4774. [Google Scholar]
- Chang, V.; Li, T.; Zeng, Z. Towards an improved Adaboost algorithmic method for computational financial analysis. J. Parallel Distrib. Comput. 2019, 134, 219–232. [Google Scholar] [CrossRef]
- Chang, V.; Man, X.; Xu, Q.; Hsu, C.H. Pairs trading on different portfolios based on machine learning. Expert Syst. 2021, 38, e12649. [Google Scholar] [CrossRef]
Figure 1.
Daily interest indexes of the representative artists from HYBE. (a) Daily interest indexes of HYBE artists (BTS and TXT). (b) Daily interest indexes of HYBE artists (SEVENTEEN and ZICO). (c) Daily interest indexes of HYBE artists (ENHYPEN, NewJeans, and LE SSERAFIM).
Figure 1.
Daily interest indexes of the representative artists from HYBE. (a) Daily interest indexes of HYBE artists (BTS and TXT). (b) Daily interest indexes of HYBE artists (SEVENTEEN and ZICO). (c) Daily interest indexes of HYBE artists (ENHYPEN, NewJeans, and LE SSERAFIM).

Figure 2.
Daily interest indexes of the representative artists from SM. (a) Daily interest indexes of SM artists (Baekhyun and Taeyeon). (b) Daily interest indexes of SM artists (NCT 127 and NCT DREAM). (c) Daily interest indexes of SM artists (Red Velvet, SuperM, and aespa).
Figure 2.
Daily interest indexes of the representative artists from SM. (a) Daily interest indexes of SM artists (Baekhyun and Taeyeon). (b) Daily interest indexes of SM artists (NCT 127 and NCT DREAM). (c) Daily interest indexes of SM artists (Red Velvet, SuperM, and aespa).

Figure 3.
Daily interest indexes of the representative artists from YG. (a) Daily interest indexes of YG artists (BLACKPINK and JENNIE). (b) Daily interest indexes of YG artists (ROSÉ and LISA). (c) Daily interest indexes of YG artists (WINNER, AKMU, and TREASURE).
Figure 3.
Daily interest indexes of the representative artists from YG. (a) Daily interest indexes of YG artists (BLACKPINK and JENNIE). (b) Daily interest indexes of YG artists (ROSÉ and LISA). (c) Daily interest indexes of YG artists (WINNER, AKMU, and TREASURE).

Figure 4.
Daily interest indexes of the representative artists from JYP. (a) Daily interest indexes of JYP artists (TWICE and ITZY). (b) Daily interest indexes of JYP artists (DAY6, Stray Kids and NiZiU).
Figure 4.
Daily interest indexes of the representative artists from JYP. (a) Daily interest indexes of JYP artists (TWICE and ITZY). (b) Daily interest indexes of JYP artists (DAY6, Stray Kids and NiZiU).

Figure 5.
Weekly interest indexes of the representative artists from HYBE. (a) Weekly interest indexes of HYBE artists (BTS and TXT). (b) Weekly interest indexes of HYBE artists (SEVENTEEN and ZICO). (c) Weekly interest indexes of HYBE artists (ENHYPEN, NewJeans, and LE SSERAFIM).
Figure 5.
Weekly interest indexes of the representative artists from HYBE. (a) Weekly interest indexes of HYBE artists (BTS and TXT). (b) Weekly interest indexes of HYBE artists (SEVENTEEN and ZICO). (c) Weekly interest indexes of HYBE artists (ENHYPEN, NewJeans, and LE SSERAFIM).


Figure 6.
Weekly interest indexes of the representative artists from SM. (a) Weekly interest indexes of SM artists (Baekhyun and Taeyeon). (b) Weekly interest indexes of SM artists (NCT 127 and NCT DREAM). (c) Weekly interest indexes of SM artists (Red Velvet, SuperM, and aespa).
Figure 6.
Weekly interest indexes of the representative artists from SM. (a) Weekly interest indexes of SM artists (Baekhyun and Taeyeon). (b) Weekly interest indexes of SM artists (NCT 127 and NCT DREAM). (c) Weekly interest indexes of SM artists (Red Velvet, SuperM, and aespa).


Figure 7.
Weekly interest indexes of the representative artists from YG. (a) Weekly interest indexes of YG artists (BLACKPINK and JENNIE). (b) Weekly interest indexes of YG artists (ROSÉ and LISA). (c) Weekly interest indexes of YG artists (WINNER, AKMU, and TREASURE).
Figure 7.
Weekly interest indexes of the representative artists from YG. (a) Weekly interest indexes of YG artists (BLACKPINK and JENNIE). (b) Weekly interest indexes of YG artists (ROSÉ and LISA). (c) Weekly interest indexes of YG artists (WINNER, AKMU, and TREASURE).


Figure 8.
Weekly interest indexes of the representative artists from JYP. (a) Weekly interest indexes of JYP artists (TWICE and ITZY). (b) Weekly interest indexes of JYP artists (DAY6, Stray Kids, and NiZiU).
Figure 8.
Weekly interest indexes of the representative artists from JYP. (a) Weekly interest indexes of JYP artists (TWICE and ITZY). (b) Weekly interest indexes of JYP artists (DAY6, Stray Kids, and NiZiU).


Figure 9.
Stock prices of the four entertainment companies from November 2020 to December 2022.

Figure 10.
Daily SM. (a) Daily SM feature importance. (b) Daily SM summary.


Figure 11.
Daily HYBE. (a) Daily HYBE feature importance. (b) Daily HYBE summary.

Figure 12.
Daily YG. (a) Daily YG feature importance. (b) Daily YG summary.

Figure 13.
Daily JYP. (a) Daily JYP feature importance. (b) Daily JYP summary.

Figure 14.
Weekly SM. (a) Weekly SM feature importance. (b) Weekly SM summary.

Figure 15.
Weekly HYBE. (a) Weekly HYBE feature importance. (b) Weekly HYBE summary.

Figure 16.
Weekly YG. (a) Weekly YG feature importance. (b) Weekly YG summary.

Figure 17.
Weekly JYP. (a) Weekly JYP feature importance. (b) Weekly JYP summary.


Table 1.
Selected representative artists from the four entertainment companies.
| HYBE | SM | YG | JYP |
|---|---|---|---|
| BTS | Baekhyun (EXO) | BLACKPINK | TWICE |
| Tomorrow X Together (TXT) | Taeyeon (SNSD) | JENNIE | ITZY |
| ENHYPEN | Red Velvet | ROSÉ | NiZiU |
| ZICO | NCT 127 | LISA | DAY6 |
| SEVENTEEN | NCT DREAM | WINNER | Stray Kids |
| NewJeans | aespa | AKMU | |
| LE SSERAFIM | SuperM | TREASURE |
Table 2.
Summary statistics for the stock prices of HYBE, SM, YG, and JYP entertainment and stock indexes of KOSPI, VKOSPI, S&P 500, and VIX.
Table 2.
Summary statistics for the stock prices of HYBE, SM, YG, and JYP entertainment and stock indexes of KOSPI, VKOSPI, S&P 500, and VIX.
| Mean | Max. | Min. | Std.Dev. | Skewness | Kurtosis | |
|---|---|---|---|---|---|---|
| HYBE | 234,576.05 | 414,000 | 109,500 | 70,962.81 | 0.176 | 2.13 |
| SM | 59,092.88 | 85,900 | 28,100 | 18,078.03 | −0.72 | 1.92 |
| YG | 52,446.08 | 73,100 | 39,850 | 7764.52 | 0.59 | 2.59 |
| JYP | 47,369.40 | 68,200 | 30,950 | 9749.14 | 0.22 | 1.76 |
| KOSPI | 2803.24 | 3305.21 | 2155.49 | 327.40 | −0.20 | −1.30 |
| VKOSPI | 20.06 | 35.73 | 12.55 | 4.31 | 1.08 | 1.09 |
| S&P 500 | 4142.95 | 4796.56 | 3310.24 | 327.77 | 0.03 | −1 |
| VIX | 22.99 | 38.57 | 15.02 | 4.92 | 0.60 | −0.26 |
Table 3.
XGBoost parameter settings for the prediction of the daily stock prices of four entertainment enterprises. Linear booster and regression with squared loss were used as the base learner and learning objective, respectively.
Table 3.
XGBoost parameter settings for the prediction of the daily stock prices of four entertainment enterprises. Linear booster and regression with squared loss were used as the base learner and learning objective, respectively.
| Parameter | SM | HYBE | YG | JYP |
|---|---|---|---|---|
| Learning rate | 0.05 | 0.05 | 0.05 | 0.05 |
| Number of gradient-boosted trees | 1000 | 500 | 1000 | 1000 |
| Maximum depth of trees | 7 | 7 | 5 | 5 |
| L1 regularization term on weights | 0.05 | 0 | 0 | 0 |
| L2 regularization term on weights | 0 | 0 | 0 | 0 |
| Subsample ratio of columns for each level | 0.9 | 0.9 | 0.9 | 0.9 |
Table 4.
XGBoost parameter settings for the prediction of the weekly stock prices of four entertainment enterprises. Linear booster and regression with squared loss was used as the base learner and learning objective, respectively.
Table 4.
XGBoost parameter settings for the prediction of the weekly stock prices of four entertainment enterprises. Linear booster and regression with squared loss was used as the base learner and learning objective, respectively.
| Parameter | SM | HYBE | YG | JYP |
|---|---|---|---|---|
| Learning rate | 0.05 | 0.05 | 0.1 | 0.05 |
| Number of gradient-boosted trees | 1000 | 800 | 1000 | 1000 |
| Maximum depth of trees | 7 | 5 | 7 | 3 |
| L1 regularization term on weights | 0.05 | 0.05 | 0.05 | 0 |
| L2 regularization term on weights | 0 | 0 | 0 | 0 |
| Subsample ratio of columns for each level | 0.9 | 0.9 | 0.9 | 0.9 |
Disclaimer/Publisher’s Note: The statements, opinions and data contained in all publications are solely those of the individual author(s) and contributor(s) and not of MDPI and/or the editor(s). MDPI and/or the editor(s) disclaim responsibility for any injury to people or property resulting from any ideas, methods, instructions or products referred to in the content. |
© 2023 by the authors. Licensee MDPI, Basel, Switzerland. This article is an open access article distributed under the terms and conditions of the Creative Commons Attribution (CC BY) license (https://creativecommons.org/licenses/by/4.0/).
Share and Cite
MDPI and ACS Style
Yu, D.; Choi, S.-Y. Uncovering the Impact of Local and Global Interests in Artists on Stock Prices of K-Pop Entertainment Companies: A SHAP-XGBoost Analysis. Axioms 2023, 12, 538. https://0-doi-org.brum.beds.ac.uk/10.3390/axioms12060538
AMA Style
Yu D, Choi S-Y. Uncovering the Impact of Local and Global Interests in Artists on Stock Prices of K-Pop Entertainment Companies: A SHAP-XGBoost Analysis. Axioms. 2023; 12(6):538. https://0-doi-org.brum.beds.ac.uk/10.3390/axioms12060538
Chicago/Turabian StyleYu, Daeun, and Sun-Yong Choi. 2023. "Uncovering the Impact of Local and Global Interests in Artists on Stock Prices of K-Pop Entertainment Companies: A SHAP-XGBoost Analysis" Axioms 12, no. 6: 538. https://0-doi-org.brum.beds.ac.uk/10.3390/axioms12060538
Note that from the first issue of 2016, this journal uses article numbers instead of page numbers. See further details here.