Article

Forecasting the S&P 500 Index Using Mathematical-Based Sentiment Analysis and Deep Learning Models: A FinBERT Transformer Model and LSTM

1
Department of Industrial Management Engineering, Gachon University, Seongnam-si 13120, Republic of Korea
2
Department of Financial Mathematics, Gachon University, Seongnam-si 13120, Republic of Korea
*
Author to whom correspondence should be addressed.
Submission received: 21 July 2023 / Revised: 25 August 2023 / Accepted: 26 August 2023 / Published: 29 August 2023
(This article belongs to the Special Issue Mathematical and Computational Finance Analysis)

Abstract

:
Stock price prediction has been a subject of significant interest in the financial mathematics field. Recently, interest in natural language processing models has increased, and among them, transformer models, such as BERT and FinBERT, are attracting attention. This study uses a mathematical framework to investigate the effects of human sentiment on stock movements, especially in text data. In particular, FinBERT, a domain-specific language model based on BERT tailored for financial language, was employed for the sentiment analysis on the financial texts to extract sentiment information. In this study, we use “summary” text data extracted from The New York Times, representing concise summaries of news articles. Accordingly, we apply FinBERT to the summary text data to calculate sentiment scores. In addition, we employ the LSTM (Long short-term memory) methodology, one of the machine learning models, for stock price prediction using sentiment scores. Furthermore, the LSTM model was trained by stock price data and the estimated sentiment scores. We compared the predictive power of LSTM models with and without sentiment analysis based on error measures such as MSE, RMSE, and MAE. The empirical results demonstrated that including sentiment scores through the LSTM model led to improved prediction accuracy for all three measures. These findings indicate the significance of incorporating news sentiment into stock price predictions, shedding light on the potential impact of psychological factors on financial markets. By using the FinBERT transformer model, this study aimed to investigate the interplay between sentiment and stock price predictions, contributing to a deeper understanding of mathematical-based sentiment analysis in finance and its role in enhancing forecasting in financial mathematics. Furthermore, we show that using summary data instead of entire news articles is a useful strategy for mathematical-based sentiment analysis.

1. Introduction

The increase in user-made content on the web in the form of reviews, blogs, social networks, and tweets has resulted in circumstances in which everyone can publicly express their opinions about events, products, or people. This user-made text information can be critical to establishments and companies and provides valuable insights into consumer behavior, reputation management, and identification of new opportunities. Moreover, sentiment analysis has emerged as a powerful trading tool in the financial industry, in which markets are heavily influenced by human sentiments. In the financial sector, sentiment analysis provides valuable signals for stock trading strategies because market movements are often driven by sentiments.
Sentiment analysis, also known as opinion mining, involves computer studies of sentiments, emotions, and attitudes expressed in textual data regarding real entities or topics. It covers a wide range of areas and serves a wide range of purposes, such as assessing public sentiment regarding political movements, understanding market dynamics, measuring customer satisfaction, forecasting oil prices, and predicting stock prices. For example, Nguyen et al. [1] was the first to demonstrate the effectiveness of incorporating sentiment analysis by investigating large-scale test data to predict stock price movements. In addition, Li et al. [2] used Henry’s finance-specific dictionary to filter positive and negative words, and then calculated sentiment scores to enhance the accuracy of forecasting oil prices.
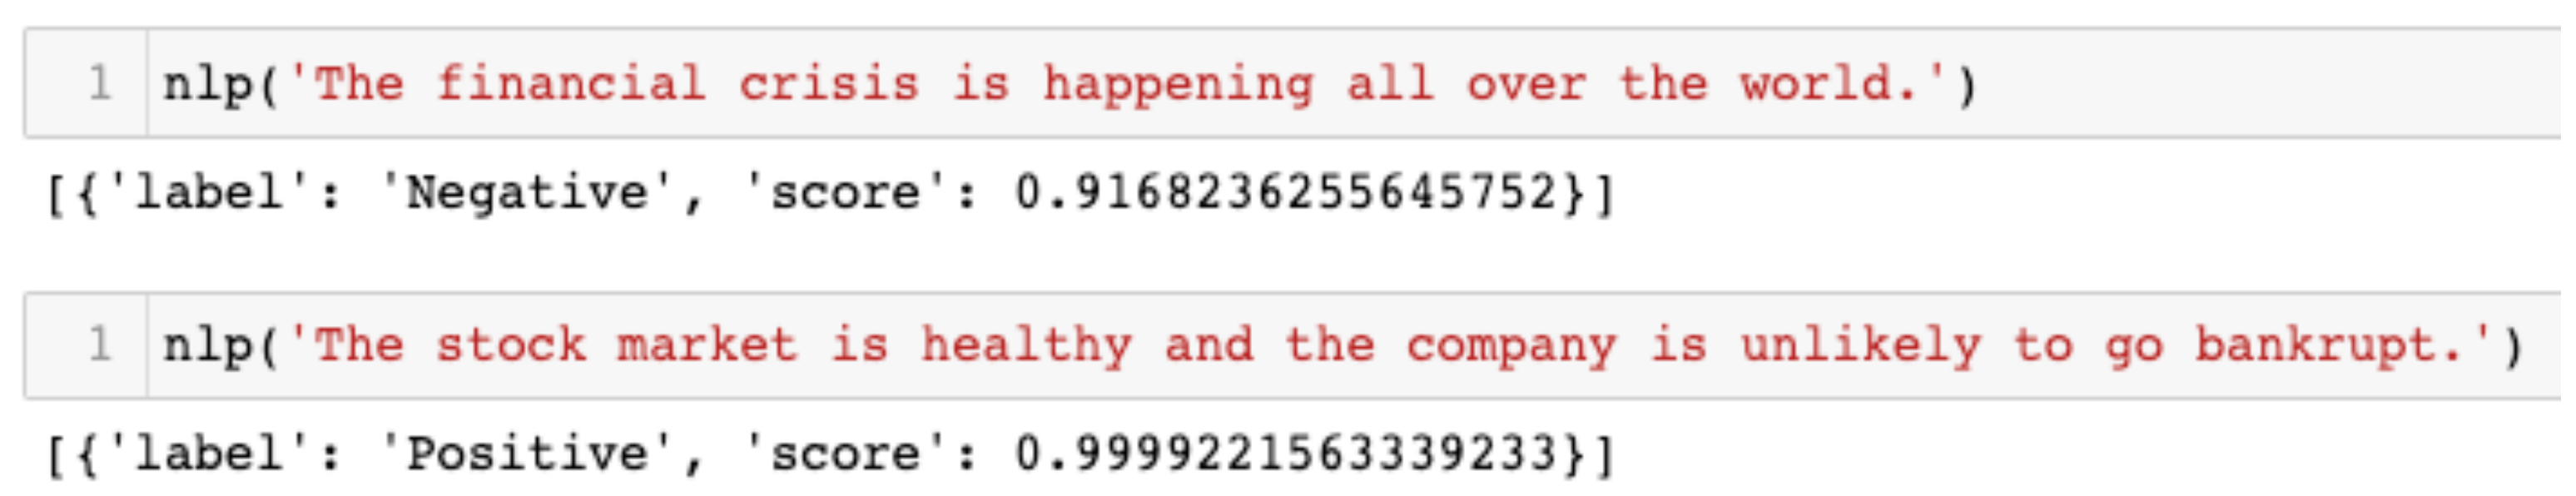
As previously mentioned, financial markets, particularly stock markets, were affected by sentiments; therefore, the sentiments can provide useful signals for trading. Accordingly, this study aimed to predict stock prices by extracting sentiments from news data. In particular, we perform a sentiment analysis using summarized text data to reduce the news body to a few sentences. That is, sentiment analysis will be performed with relatively little data in the body of the article. We estimate the sentiment of the summarized text data using FinBERT (Financial Bidirectional Encoder Representations from Transformers), a model specialized in finance. The FinBERT, a specialized language model built upon BERT, is tailored for financial language processing. Trained on financial texts such as news, earnings reports, regulations, and analyst summaries, FinBERT has gained prominence for its efficacy in predicting stock prices in various studies (Sidogi et al. [3], Fazlija and Harder [4], Jiang and Zeng [5]). In addition, we conducted a sentiment analysis on the data summarized in FinBERT and investigated whether these results affect stock price forecasts. A detailed introduction to FinBERT will be provided in Section 4.3.
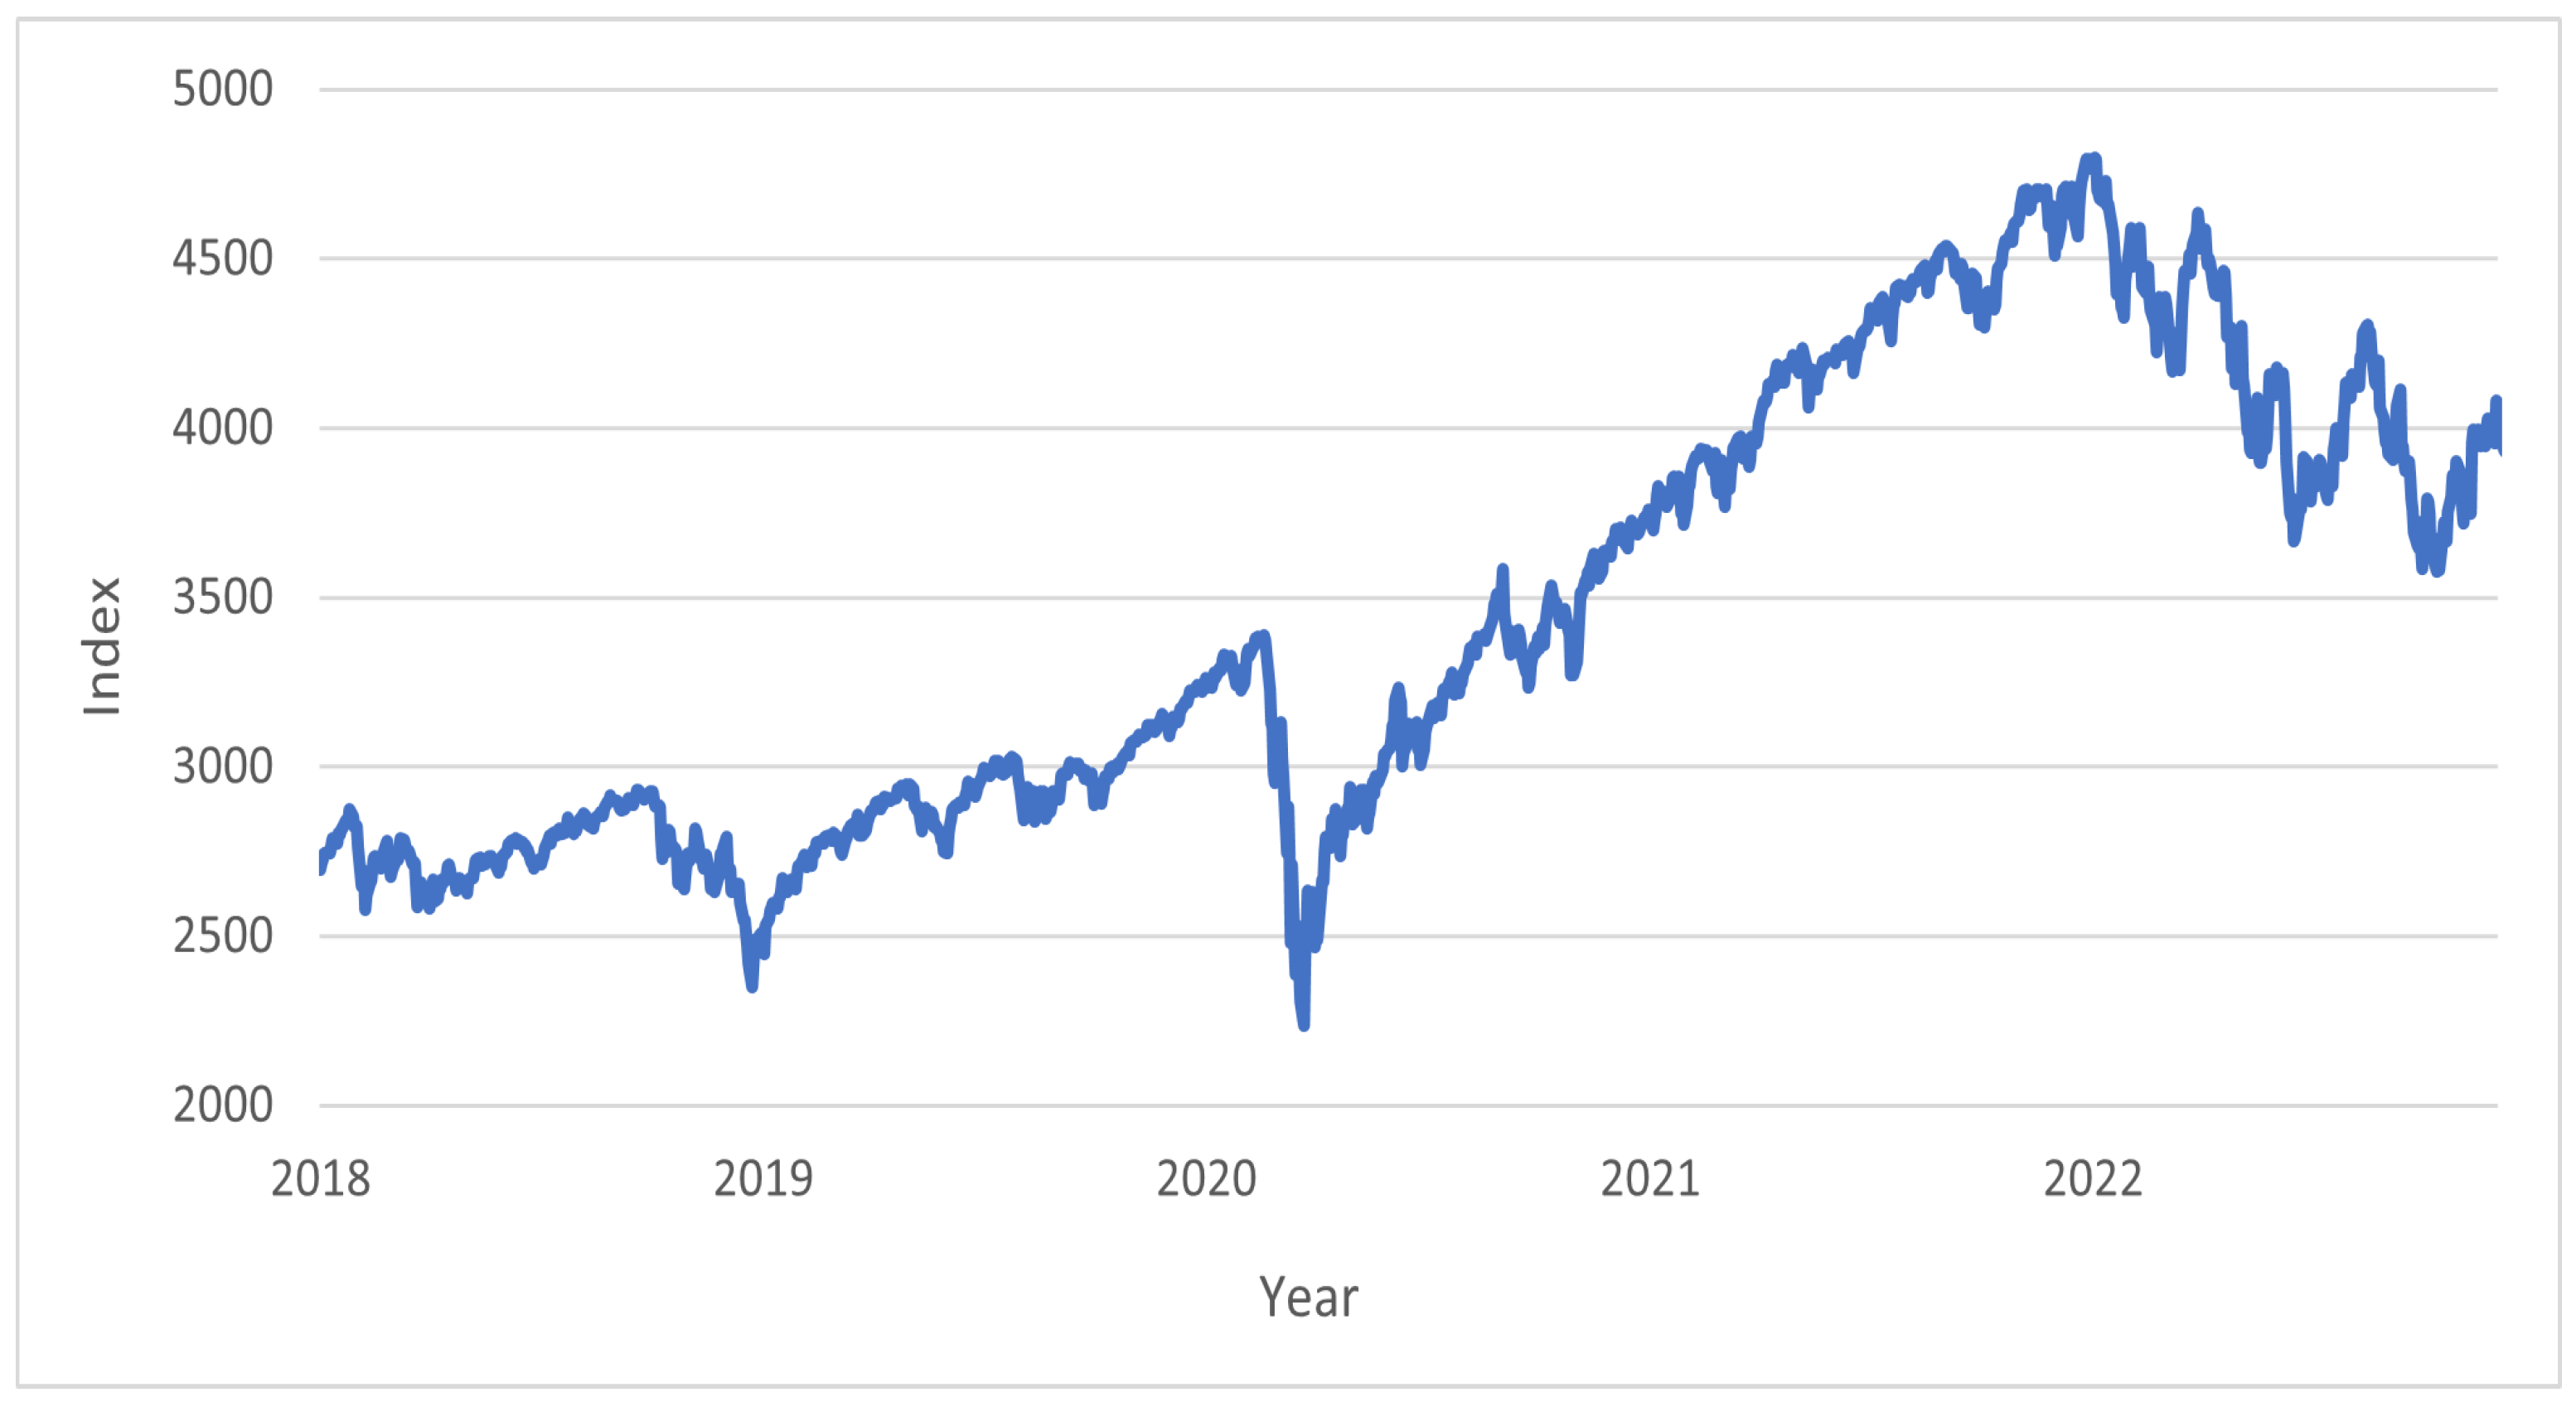
Based on the sentiment analysis by using the FinBERT, we predict the S&P 500 index price. Our analysis focuses on concise news summaries sourced from The New York Times website, encompassing headlines, summaries, and bodies. These summaries, offering a brief article overview, are subjected to sentiment analysis. Using the summary data, we are able to use a relatively small amount of data over the same period compared to using the full texts. The text data used are from 1 January 2018 to 31 December 2022, a total of 1826 days. Correspondingly, S&P 500 index predictions are made for the same time period. The S&P 500 index data are extracted from Yahoo Finance.
Methodologically, we performed sentiment analysis on summarized text data from The New York Times using FinBERT. This yielded a new variable termed ‘Sentiment Score’. Following Batra and Daudpota [
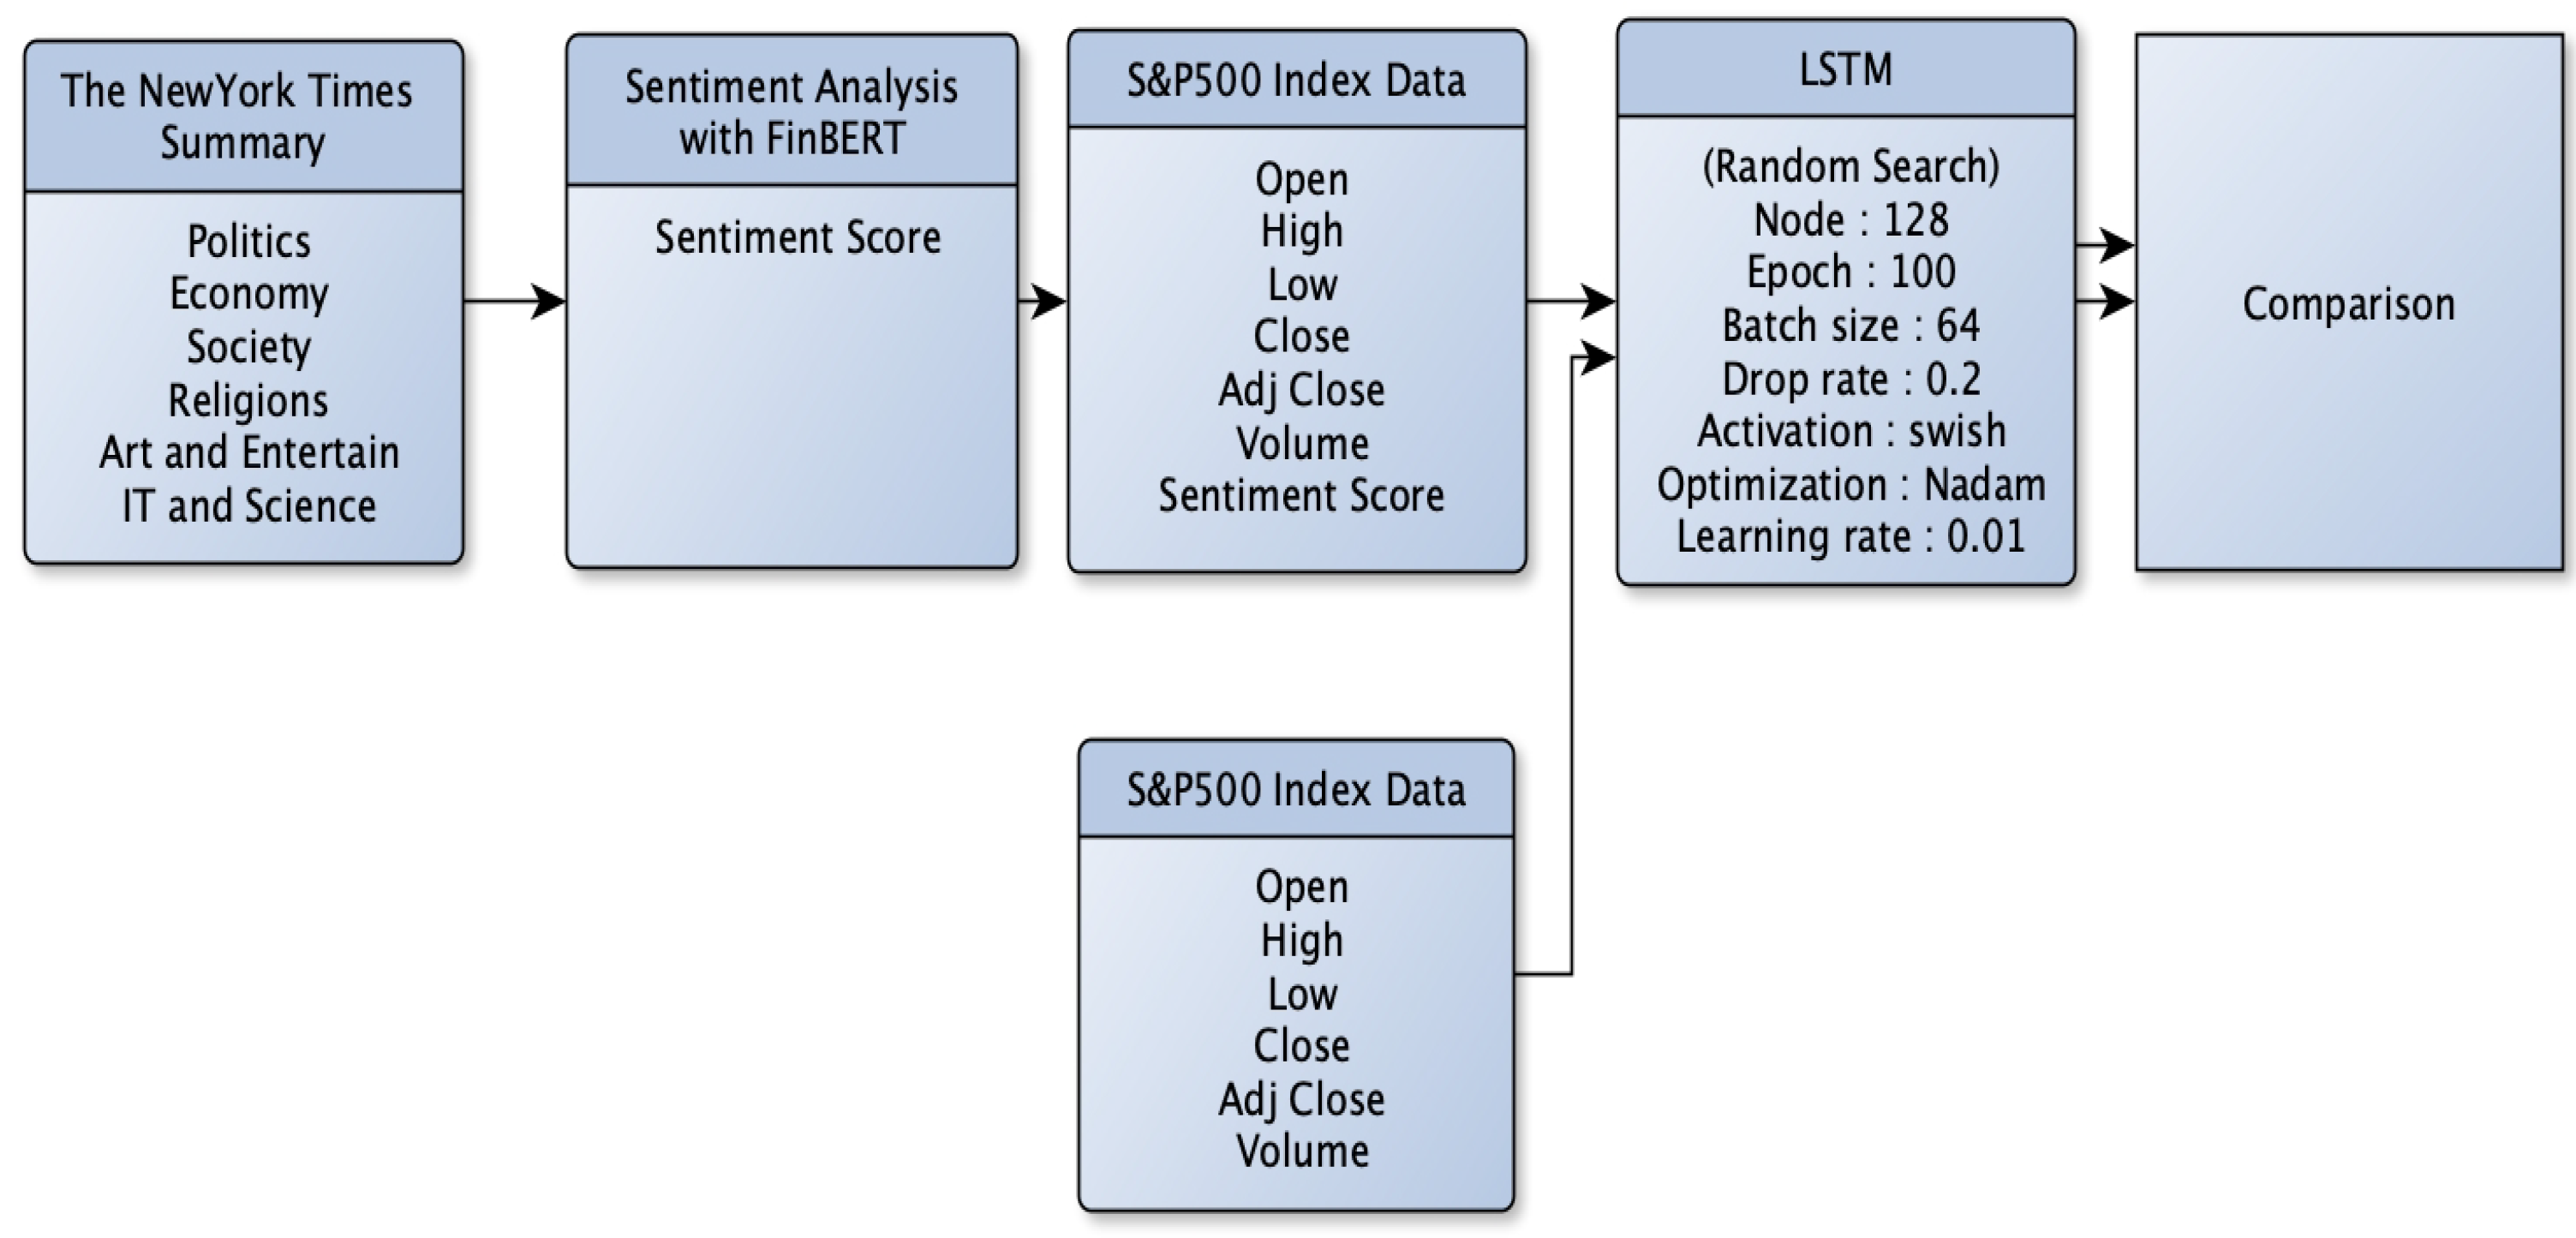
6], S&P 500 price prediction employed a variable set (‘Open’, ‘High’, ‘Low’, ‘Close’, ‘Adj Close’, and ‘Volume’) commonly used for such forecasts. Another prediction employed a set containing the sentiment score from prior analysis (‘Open’, ‘High’, ‘Low’, ‘Close’, ‘Adj Close’, ‘Volume’, and ‘Sentiment Score’). Both processes employed the same LSTM model optimized through random search (Bergstra and Bengio [7]). To evaluate the sentiment score’s impact on stock price prediction, we compared the performance of the group without a sentiment score and the one with it.
Our study contributes to the existing body of literature in three ways. First, it investigated the relationship between the sentiment of news articles and stock price predictions. The empirical findings provide evidence supporting the notion that sentiments expressed in news articles can be used to predict stock prices.
Second, FinBERT, a highly effective technique, was employed to enhance the sentiment analysis of news article summaries from The New York Times. Previous research has demonstrated that FinBERT outperforms other techniques such as ELMo (Embeddings from Language Model) and ULMFit (Universal Language Model Fine-Tuning) in sentiment analysis. This study contributes to the existing literature by utilizing FinBERT, which has been found to exhibit superior performance in sentiment analysis.
Third, this study used summary news data for sentiment analysis. In other words, the researchers leveraged the advantages of summary data in terms of data volume and processing. Despite employing relatively condensed content instead of full-text articles, the research outcomes were comparable to those of previous studies on stock price prediction. Notably, previous studies employed New York Times article data for sentiment analysis and established a connection between sentiment and stock prices (Wang et al. [8], Costola et al. [9]). However, this study achieved similar results solely through the use of summary data with relatively concise content.
Lastly, our research makes significant contributions to the field of mathematics-based sentiment analysis and asset prediction research. The advent of NLP and deep learning methodologies, such as BERT, has revolutionized the analysis of unstructured data through mathematical techniques, with sentiment analysis gathering substantial attention. This useful sentiment analysis technique finds applications in diverse domains, including marketing (Kauffmann et al. [10]), social science (Hu et al. [11]), and mathematical modeling (Sysoev et al. [12], Srinivasarao and Sharaff [13]). Our research design, built upon the foundation of FinBERT, further enriches and enhances these existing sentiment analysis studies. Furthermore, the prediction of financial assets remains a critical topic within financial mathematics. Recent studies have demonstrated the remarkable performance of Artificial Neural Network (ANN)-based machine learning methodologies in predicting future data (Casado-Vara et al. [14], Chae and Choi [15], Lin et al. [16]). Our study takes an effective approach by utilizing the LSTM methodology to forecast the price of the S&P 500, contributing substantially to the growing body of knowledge in this area.
The remainder of this paper is organized as follows. Related studies are reviewed in the following section. Section 3 describes the summary news data and S&P 500 index. In Section 4, a comprehensive overview of the news sentiment analysis process is provided, along with a brief exploration of both the LSTM model and the finBERT model. The empirical findings pertaining to the prediction of the S&P 500 through the utilization of sentiment analysis are presented in Section 5. We further provide a series of comprehensive discussions in Section 6. Finally, Section 7 presents the summary and concluding remarks.

2. Literature Review

In this section, we introduce various methods for sentiment analysis and previous studies on the application of sentiment analysis in the stock market.

2.1. Methodologies for Sentiment Analysis

Several methodologies have been used for sentiment analysis, which can be divided into machine learning and lexicon methods. In this section, we present studies that conducted stock price analysis through sentiment analysis using machine learning techniques. Kogan et al. [17] and Batra and Daudpota [6] employed a support vector machine (SVM) to predict the volatility of stock market returns. SVMs are supervised learning models used for pattern recognition and data analysis, primarily for classification and regression tasks. According to Schumaker et al. [18], recent advances in natural language processing (NLP) and machine-learning algorithms have facilitated the processing of news data and automated sentiment analysis. Oliveira et al. [19] used Twitter data to extract sentiments from microblogs and employed multiple machine learning models, such as multiple regression (MR), neural network (NN), support vector machine (SVM), random forest (RF), and ensemble mean (EA), for stock price prediction. In a study by Derakhshan and Beigy [20], English and Persian datasets were used to predict U.S. and Iranian stock markets, respectively. They proposed a new method called LDA-POS (LDA-based method with POS tagging), which involves grouping sentences into four POS tags without removing sentence terminologies. For the English data, Stanford Core NLP was used for sentiment analysis, whereas the Persian analysis used a library called JHazm. The authors found that the LDA-POS method exhibited superior predictive power compared to the neural net method using an SVM. Gupta and Chen [21] assigned sentiment labels to stock tweets using three machine-learning models: Naïve Bayes, logistic regression, and SVM. In Srijiranon et al. [22], sentiment expressed in financial and economic news was analyzed using the FinBERT model, and stock prices (SET 50) were predicted using PCA-EMD-LSTM, a hybrid prediction model that combines PCA (Principle Component Analysis), EMD (Empirical Mode Decomposition) and LSTM.
Previous studies employed lexicon-based sentiment analysis, which utilizes predefined word lists or dictionaries to determine the sentiment of a text based on the presence of positive and negative words. Li et al. [23] evaluated financial news articles using the Harvard psychological dictionary and the Loughran–McDonald financial sentiment dictionary for sentiment analysis. Li et al. [24] used four resources: the SenticNet 5, SentiWordNet 3.0, VADER (Valence Aware Dictionary and Sentiment Reasoner), and the Loughran–McDonald Financial Dictionary 2018. SenticNet 5 enabled fine-grained sentiment analysis and included sentiment polarity values and the four dimensions of fine-grained sentiments (pleasure, attention, sensitivity, and aptitude). SentiWordNet 3.0 contained positive and negative word sentiments. LMfinance was a domain-specific sentiment dictionary for financial news analysis that encompassed seven sentiments: positive, negative, uncertainty, litigious, weak modal, strong modal, and constraining. In this study, when the collected news contained words not associated with these sentiments, it was considered neutral. Das et al. [25] employed both machine learning and lexicon-based methods, such as logistic regression, SVC (Support Vector Classifier), textblob, VADER, Loughran–McDonald, Henry, and Stanford CoreNLP. The sentiment score data obtained using these methods were input into the LSTM to predict the direction of stock price movement. Long et al. [26] used subreddit data from the r/WallStreetBets site. When they conducted sentiment analysis using the VADER library, they found that it lacked domain-specific language implementation, prompting them to hire ten annotators to create and employ a customized VADER library. Their approach involved adjusting the scores for words with domain-specific meanings present in the existing VADER library and incorporating new words that were previously absent.

2.2. Stock Market and Sentiment Analysis

Recently, several studies have applied the various sentiment analysis methods introduced above to financial markets. In particular, they have used sentiment analysis to predict financial markets, such as stock and oil prices. This indicates that sentiment affects prices and can be used as an indicator for predicting prices. Yu et al. [27] investigated a knowledge-based forecasting method, the rough-set-refined text mining (RSTM) approach, for crude oil price tendency forecasting. This system consists of two models, text mining techniques and set theory, which together create useful patterns and rules that can be used to predict trends in the crude oil market. Kogan et al. [17] employed support vector machines (SVMs) to forecast stock market return volatility. The study concluded that the prediction performance of the text regression model exhibited a strong correlation with both historical and actual volatility, and that a combined model yielded even better results. Wang et al. [28] converted textual data into vectors using the bag-of-words model and used the data as inputs to a time series model. The results demonstrated increased accuracy in predicting stock price fluctuations when sentiment analysis was incorporated.
In particular, there are many previous studies that used news data as texts for sentiment analysis. They extracted sentiments from news data and applied them to financial markets. These studies demonstrated an improved prediction accuracy. Schumaker and Chen [29] proposed a framework called the Arizona financial text system (AZFinText) to review discrete stock price prediction using a linguistic and statistical technique that partitioned articles through similarity in industry and sector groupings and compared the results against quantitative funds and human stock pricing experts. A forecasted directional accuracy of 71.18% for the system resulted in a trading return of 8.50%. Schumaker et al. [18] found that when predicting stock price direction, the subjective tone of the news was important. Caporin and Poli [30] demonstrated that news-related variables can improve volatility predictions. This study examined the impact of information measures, selected using a penalized regression of daily volatility. Furthermore, we performed prediction exercises to demonstrate that models that incorporate news-related variables offer enhanced volatility predictions. Atkins et al. [31] utilized LDA and a simple Naïve Bayes classifier to predict stock market volatility movements. Their results indicated that the information captured in news articles can predict market volatility more accurately than the direction of price fluctuations. They achieved 56% accuracy in predicting the direction of stock market volatility following the acquisition of new information. Elshendy et al. [32] incorporated the sentiment of four media platforms (Twitter, Google Trends, Wikipedia, and global data on events, location, and tone database) to forecast the crude oil prices and achieved higher performance. Allen et al. [33] used the Thomson Reuters News Analytics (TRNA) dataset to construct a series of daily appraisal scores for the Dow Jones industrial average (DJIA) stock index components. They provided real-time numerical insights into news events. The sentiment scores obtained by TRNA and the Fama-French three-factor model indicated that the sentiment of financial news on the trading day had a significant impact on stock prices. Vanstone et al. [34] predicted stock prices by assigning scores to news and Twitter articles using the Bloomberg sentiment score. Bloomberg employs a proprietary and undisclosed approach to calculate sentiment scores. Using paired-samples t-tests and Wilcoxon signed-rank tests, the study confirmed that stock prices can be predicted more effectively when sentiment scores are incorporated into the predictions. Vasyl Derbentsev [35] uses the Binary Autoregressive Tree model (BART), and Neural Networks (Multilayer Perceptron, MLP) and an ensemble of Classification and Regression Trees models (Random Forest, RF) to predict the price movements of Bitcoin, Ethereum, and Ripple. As a result, when measuring MAPE, the RF model showed the best results. In Chatziloizos. et al. [36], sentiment analysis and historical stock price data were used to predict the price of four stocks: AAPL, GOOG, NVDA, and S&P 500 Information Technology. Overall, they found sentiment analysis to be a profitable and sometimes better solution than passive investing.

3. Data Description

New York Times Data and S&P 500 Index

We extract the news summary data from The New York Times by using Python’s BeautifulSoup module for sentiment analysis. The summary text data extraction process is as follows. We began by analyzing the HTML structure of the homepage and its constituent tags. Next, we identified the specific HTML tag for extraction and utilized the BeautifulSoup module to perform the extraction. The complete daily HTML file of The New York Times’ “Today’s Paper” page was then extracted and saved as a text file. Figure 1 presents an example of the summary text used. We used summary data from articles on various topics published in The New York Times on the front page.
The dataset used in this study covered a period from 1 January 2018 to 31 December 2022, totaling 1826 days. The reason for selecting this time period was due to changes in the URL and web page format of the Today’s Paper section, which occurred from December 2017 onwards. These changes disrupted the regularity of URLs and made it difficult to reliably collect data from periods prior to 2018. In addition, the other previous studies on sentiment analysis using news data (Schumaker et al. [18], Allen et al. [33], Vanstone et al. [34], Srijiranon et al. [22]) also had similar or shorter analysis durations. By concentrating on the 2018–2022 time period, we ensure more reliable and consistent data extraction, enhancing the integrity and validity of our analysis.
Several studies have used articles from The New York Times. In Kim [37], 760 health news articles in The New York Times for a period of approximately 33 weeks were used to learn about the relationship between real-world behavior and the audience who watched and shared the news. Iglesias et al. [38] proposed a method for classifying a large number of news articles into various categories. They collected hundreds of news articles from the online New York Times. Garvey and Maskal [39] also collected 8470 New York Times articles extracted from 1956 to March 2018 and calculated sentiment scores on artificial intelligence using the Google Cloud NLP tool.
The S&P 500 is a key stock market index tracking 500 major U.S. publicly traded companies, serving as a widely followed benchmark for the overall market performance. Figure 2 shows the daily closing prices of the S&P 500 from 2018 to 2022. We can observe a sharp drop in the first half of 2020 owing to COVID-19. When COVID-19 restrictions were eased, the S&P 500 recovered.
Table 1 presents the calculated mean, maximum, minimum, standard deviation, skewness, and kurtosis of the daily S&P 500 metrics collected from 2018 to 2022. In particular, because the skewness was approximately zero, the distribution of the S&P 500 index was symmetrical. In terms of kurtosis, it had a relatively flat distribution compared with the normal distribution because it had a negative value.

4. Methods

4.1. News Sentiment Analysis

For sentiment analysis, we calculate the sentiment score of the collected news summary data from The New York Times web pages. The steps of the calculation are shown as follows.
To compute the sentiment scores of the news summary data, we used daily summary text data. Let S k t represent the k-th summary text data on day t , ( k = 1 , 2 , , n ) . That is, we suppose that there is a total of n summary text data on day t. Initially, each daily summary text data was input to FinBERT, which produced three classification labels (positive, neutral, or negative) along with their associated probabilities. Denoting l b k as the label with the highest classification label probability of the S k t , and P r o b k as its probability value, we then mapped positive, neutral, and negative values to +1, 0, and −1, respectively. Let l b ˜ k be the mapped value. In addition, the sentiment score for each summary text dataset was calculated by multiplying the label with its corresponding probability. Finally, daily sentiment scores ( S C t ) were defined by summing up these scores of the day t. This process is outlined in Equation (1). The estimated daily sentiment scores were employed as features in an LSTM model for forecasting the S&P 500 index.
S C t = k = 1 n l b ˜ k ( S k t ) × P r o b k ( S k t ) ,
where l b ˜ k is the +1, 0, −1 depending on when the label l b k is positive, neutral, or negative for S k t .
There are studies that calculate sentiment scores in a different way than we do. In these studies, sentiment scores were calculated by adding labeled sentiment scores (Hutto and Gilbert [40]). In addition, Agarwal and Mittal [41] used the difference in probability between positive and negative sentiments. In their study, pointwise mutual information was used to calculate sentiment scores by calculating how often two words were used in one sentence. This was used to calculate the positivity and negativity of a sentence by calculating the frequency of words using positive- and negative-word dictionaries. However, its performance is poor because it does not consider the context (See Kiritchenko et al. [42]). Another approach for sentiment analysis is to use VADER, which calculates the sentiment score of a sentence based on its own dictionary. In Jang et al. [43], it was found that the value calculated by VADER was “positive” if it was higher than 0.2, “neutral” if it was between −0.2 and 0.2, and “negative” if it was lower than −0.2. They mapped “positive” to +1, “neutral” to 0, and “negative” to −1 for the calculated results.
Based on the sentiment score explained above, we performed a sentiment analysis using FinBERT to label each summary with a sentiment label of either positive, neutral, or negative for the collected daily news summaries from The New York Times from 2018 to 2022. Of the 30,797 summaries, the results for the positive, neutral, and negative articles are shown in Table 2. There were more negative articles than neutral and positive articles. This is primarily because articles often convey negative content. Furthermore, Table 3 presents the statistics of the daily sentiment scores. The positive and negative sentiment scores corresponded to the two ends of the spectrum, with a maximum of 1 and a minimum of −0.99. The average value was −0.18, indicating that the news sentences generally had negative sentiment scores, as shown in Table 3. The data did not follow a normal distribution, as evidenced by the skewness, kurtosis, and J-B tests. As shown in Figure 3, this means that sentiment scores based on sentiment classification tasks are not a normal distribution, as they tend to have values of −1, 0, or 1. Sentiment scores with values (e.g., ±0.5) in the middle indicate a low probability of belonging to that label. Therefore, this deviation from normal distribution can be attributed to the mixed distribution of sentiment analysis results, which exhibit peaks at −1, 0, and 1 for positive, negative, and neutral sentiments, respectively.

4.2. LSTM

A recurrent neural network (RNN) is a neural network model that can be used to solve sequence-to-sequence problems. This model differs from general neural networks because it has an output layer. In a general neural network, the calculated value of the ReLU function is passed to the output layer; however, in an RNN, the calculated value of t a n h is passed to the output layer and then recurrently circulates in the hidden layer. Owing to this structure, RNNs have a strong advantage in processing data with order by utilizing the recurrent structure within the hidden layer.
However, RNNs suffer from long-term dependency problems. Because the output function of the hidden layer is t a n h , when this value is less than 1 and continues to repeat, the previous information cannot be sufficiently conveyed to the last layer.
LSTM is a model designed to solve long-term dependency problems in RNNs Hochreiter and Schmidhuber [44]. As the size of the input data increases, vanishing or exploding gradients occur in conventional RNNs. To address this problem, LSTM models use cell states. The cell state is the memory in the LSTM and transmits previous information to the succeeding step. The cell state adds or removes cells from an existing state using gates. Gates can be classified as input, forget, or output. These gates are composed of neural networks with sigmoid functions and pointwise multiplication.
Figure 4 shows the structure of a typical LSTM network. C t 1 denotes the updated cell state obtained using the previous LSTM. h t 1 denotes the hidden layer of the previous LSTM. Using two input values, the cell state and hidden layer are updated by the operation of each gate. The tasks of each gate are as follows.
The forget gate calculates a portion of the past information, that is, the cell state information, that is forgotten. It is determined by the value of the sigmoid function, which is a variable owing to the pointwise multiplication of x t and weight. If the value of s i g m o i d ( σ ) is approximately equal to 1, it almost preserves past information; if it is approximately equal to zero, it almost forgets past information. The equation for the forget gate f t follows.
f t = σ ( W f [ h t 1 , x t ] + b f ) ,
where W f stands for the weight matrix of the forget gate and b f is the bias term associated with the forget gate. [ h t 1 , x t ] denotes the concatenated vector of the previous hidden state and the current input.
The input gate calculates the weight of the current data x t and past hidden layer value h t 1 . It has two parts: i t , which uses s i g m o i d , and g t , which uses t a n h . That is, it updates the cell state by reflecting the importance of the actual data at the current time x t . The equation for the input gate layer i t , g t follows.
i t = σ ( W i [ h t 1 , x t ] + b i ) , g t = t a n h ( W g [ h t 1 , x t ] + b g ) ,
where W i and W g stand for the weight matrix of the input gates, i t and g t , respectively. b i   and   b g are the biases terms associated with the input gates, i t and g t , respectively. Furthermore, the input gate updates the new cell state, C t as C t = f t C t 1 + i t g t .
The output gate, o t calculates the number of cell states updated from the forget and input gates that are passed on to the next step t t + 1 . The output gate and cell state follow these equations,
o t = σ ( W o [ h t 1 , x t ] + b o ) , h t = o t t a n h ( C t )
and W o stands for the weight matrix of the output gate. b o is the bias term associated with the output gate.

4.3. FinBERT

FinBERT is a pre-trained domain-specific language model based on Bidirectional Encoder Representations from Transformers (Araci [45]). BERT is a transformers-based language model that consists of two steps: pretraining and fine-tuning. In the pre-training step, it learns the syntax, semantic relations and patterns of the language by inputting a large amount of data, predicts masked words through masked language modeling, and learns the relationship between two sentences in the next sentence prediction task. It is a model that improves performance on specific tasks through fine-tuning. To improve its performance in finance domain specificity, FinBERT was trained on a large corpus of financial texts containing 4.9 billion tokens: 2.5 billion tokens for corporate annual and quarterly filings-the business description, risk factor, and MD&A sections of forms 10-K and 10-Q for Russell 3000 firms between 1994 and 2019; 1.1 billion tokens for analyst reports of S&P 500 firms between 2003 and 2012; and 1.3 billion tokens for earnings conference call transcripts of 7740 public firms between 2004 and 2019. It shows better accuracy in the finance domain than the BERT model. FinBERT was designed to process financial domain language. FinBERT exhibits better accuracy and processing speed in the financial domain than general models such as BERT. Moreover, the FinBERT model is continuously fine-tuned. According to Huang et al. [46], its accuracy in terms of the environment, society, and governance, which frequently appear in news sentences, is higher than those of other machine learning algorithms such as BERT, RNN, and LSTM.
Sentiment classification can be performed by FinBERT. In this task, FinBERT takes a sentence as input and output it as a 768-dimensional token. To predict which label (e.g., positive, neutral, negative) it belongs to and the probability, the token generated above is fed into a multinomial logistic classifier with a softmax function. The result is the label and probability of the input sentence. The result is shown in Figure 5.
FinBERT has gained attention as a powerful tool for predicting stock prices in financial analyses. Several studies investigated the effectiveness of this approach. Fazlija and Harder [4] classified sentiments using the FinBERT model implemented in Python. They used sentiment classification data to predict the future direction of the S&P 500 index. In Jiang and Zeng [5], FinBERT was used to analyze news title sentiments. The model was then combined with LSTM and FinBERT, and the LSTM model without sentiment analysis data and the ARIMA (Autoregressive Integrated Moving Average) model were compared. Consequently, the LSTM model with the results of the FinBERT sentiment analysis of news titles exhibited the best performance. However, the performance in long-term forecasting was poor compared to that in short-term forecasting. In addition, Sidogi et al. [3] studied the effect of sentiment in financial news headlines on stock price predictions. A sentiment analysis was conducted using FinBERT, and the predictive power of the LSTM model for stock price prediction based on the presence or absence of the resulting data was compared. The results showed that the model with sentiment analysis was more predictive, and additional indicators, such as sentiment analysis results and past stock price data, are required for stock price prediction.
Several previous studies have predicted stock prices through a similar research design to ours. For instance, in the work of Vanstone et al. [34], the Neural Network Autoregressive (NNAR) model was employed to forecast the S&P ASX20 index based on the presence or absence of sentiment scores. They utilized data extracted from Bloomberg to determine sentiment. Their investigation revealed that the model incorporating sentiment scores exhibited enhanced accuracy, as measured by Root Mean Square Error (RMSE), when compared to the base model. Similarly, Qiu et al. [47] explored the predictive capabilities of eight distinct models, including K-Nearest Neighbor (KNN), Support Vector Machine (SVM), Logistic Regression (LR), Gradient Boosting Decision Tree (GBDT), Decision Tree (DT), Random Forest (RF), Naïve Bayes (NB), and AdaBoost. Their study focused on forecasting the stock price of the Shanghai Stock Exchange 50, while considering the presence or absence of the sentiment index, and then comparing the performance of each model. Interestingly, they found that the AdaBoost model demonstrated poor predictive power when sentiment analysis was incorporated.
In addition, sentiment score calculation for feature extraction was mainly carried out using lexicon-based approaches such as SentiWordNet, a sentiment dictionary, or VADER in previous studies. Nguyen et al. [1] used SentiWordNet to extract the topics of the sentences using Stanford CoreNLP and calculated the sentiment score. SentiWordNet assigns a positive, neutral, or negative score to each word and combines the scores of the word to calculate the sentiment score of the sentence. There are also studies that perform sentiment analysis based on the dictionary, but calculate the sentiment score based on the number of positive and negative words in the sentence based on the dictionary that categorized words as positive or negative (Kalyani et al. [48]). However, this method can be inaccurate in calculating the sentiment score of a sentence based on the number of words without considering the context. In Li et al. [24], that study used VADER to calculate the sentiment score, which is a method of calculating the sentiment score of a sentence using a dictionary with pre-calculated positive, negative, and neutral sentiment scores. VADER calculates the sentiment score of a document by summing the sentiment scores of the words that make up a sentence. VADER changes the weight of words depending on the context. However, VADER does not fully consider it.

5. Empirical Results

This study follows the process shown in Figure 6 and uses two datasets of size 1240 to predict the S&P 500 index using LSTM. The first dataset used (‘Open’, ‘High’, ‘Low’, ‘Close’, ‘Adj Close’, and ‘Volume’) of the S&P 500 index. The second dataset used (‘Open’, ‘High’, ‘Low’, ‘Close’, ‘Adj Close’, ‘Volume’, and ‘Sentiment score’).
To calculate the sentiment score, we used news summaries from 2018 to 2022 provided by The New York Times. The news summaries also included weekends. However, the S&P 500 index excluded holidays. Therefore, we fitted the sentiment scores to the S&P 500 business-day data.
The features of the S&P 500 index had different scales. For example, ‘Open’, ‘High’, and ‘Low’ had similar sizes, but were different in absolute size in terms of ‘Volume’, which was the same as the ‘sentiment score’. Therefore, the weights could have excessively large values. Normalization using Sklearn’s MinMaxScaler was applied to reduce the complexity of the model and avoid overfitting.
We handled the data from 30 January 2018, to 30 December 2022. The data contained only business days, and we split the entire dataset into 70% training set and 30% test set without shuffling sequentially. Next, we removed the date feature and set ‘Close’ as the label. We used (‘Open’, ‘High’, ‘Low’, ‘Close’, ‘Adjusted Close’, ‘Volume’) and (‘Open’, ‘High’, ‘Low’, ‘Close’, ‘Adjusted Close’, ‘Volume’, ‘Sentiment Score’) as features. We then prepared the training and test sets to fit the input form of the LSTM model for short-term forecasting and converted them to (# of samples, 1, # of features). Then, we trained the LSTM layer model with hyperparameter tuning on the prepared train data. We used a random search method to determine the optimal hyperparameters.
Finally, the two feature sets were input into the LSTM model with the hyperparameter tuned to predict the S&P 500 index. We checked the goodness-of-fit of the model by comparing the error measures of the predicted results.

5.1. Hyperparameter Tuning

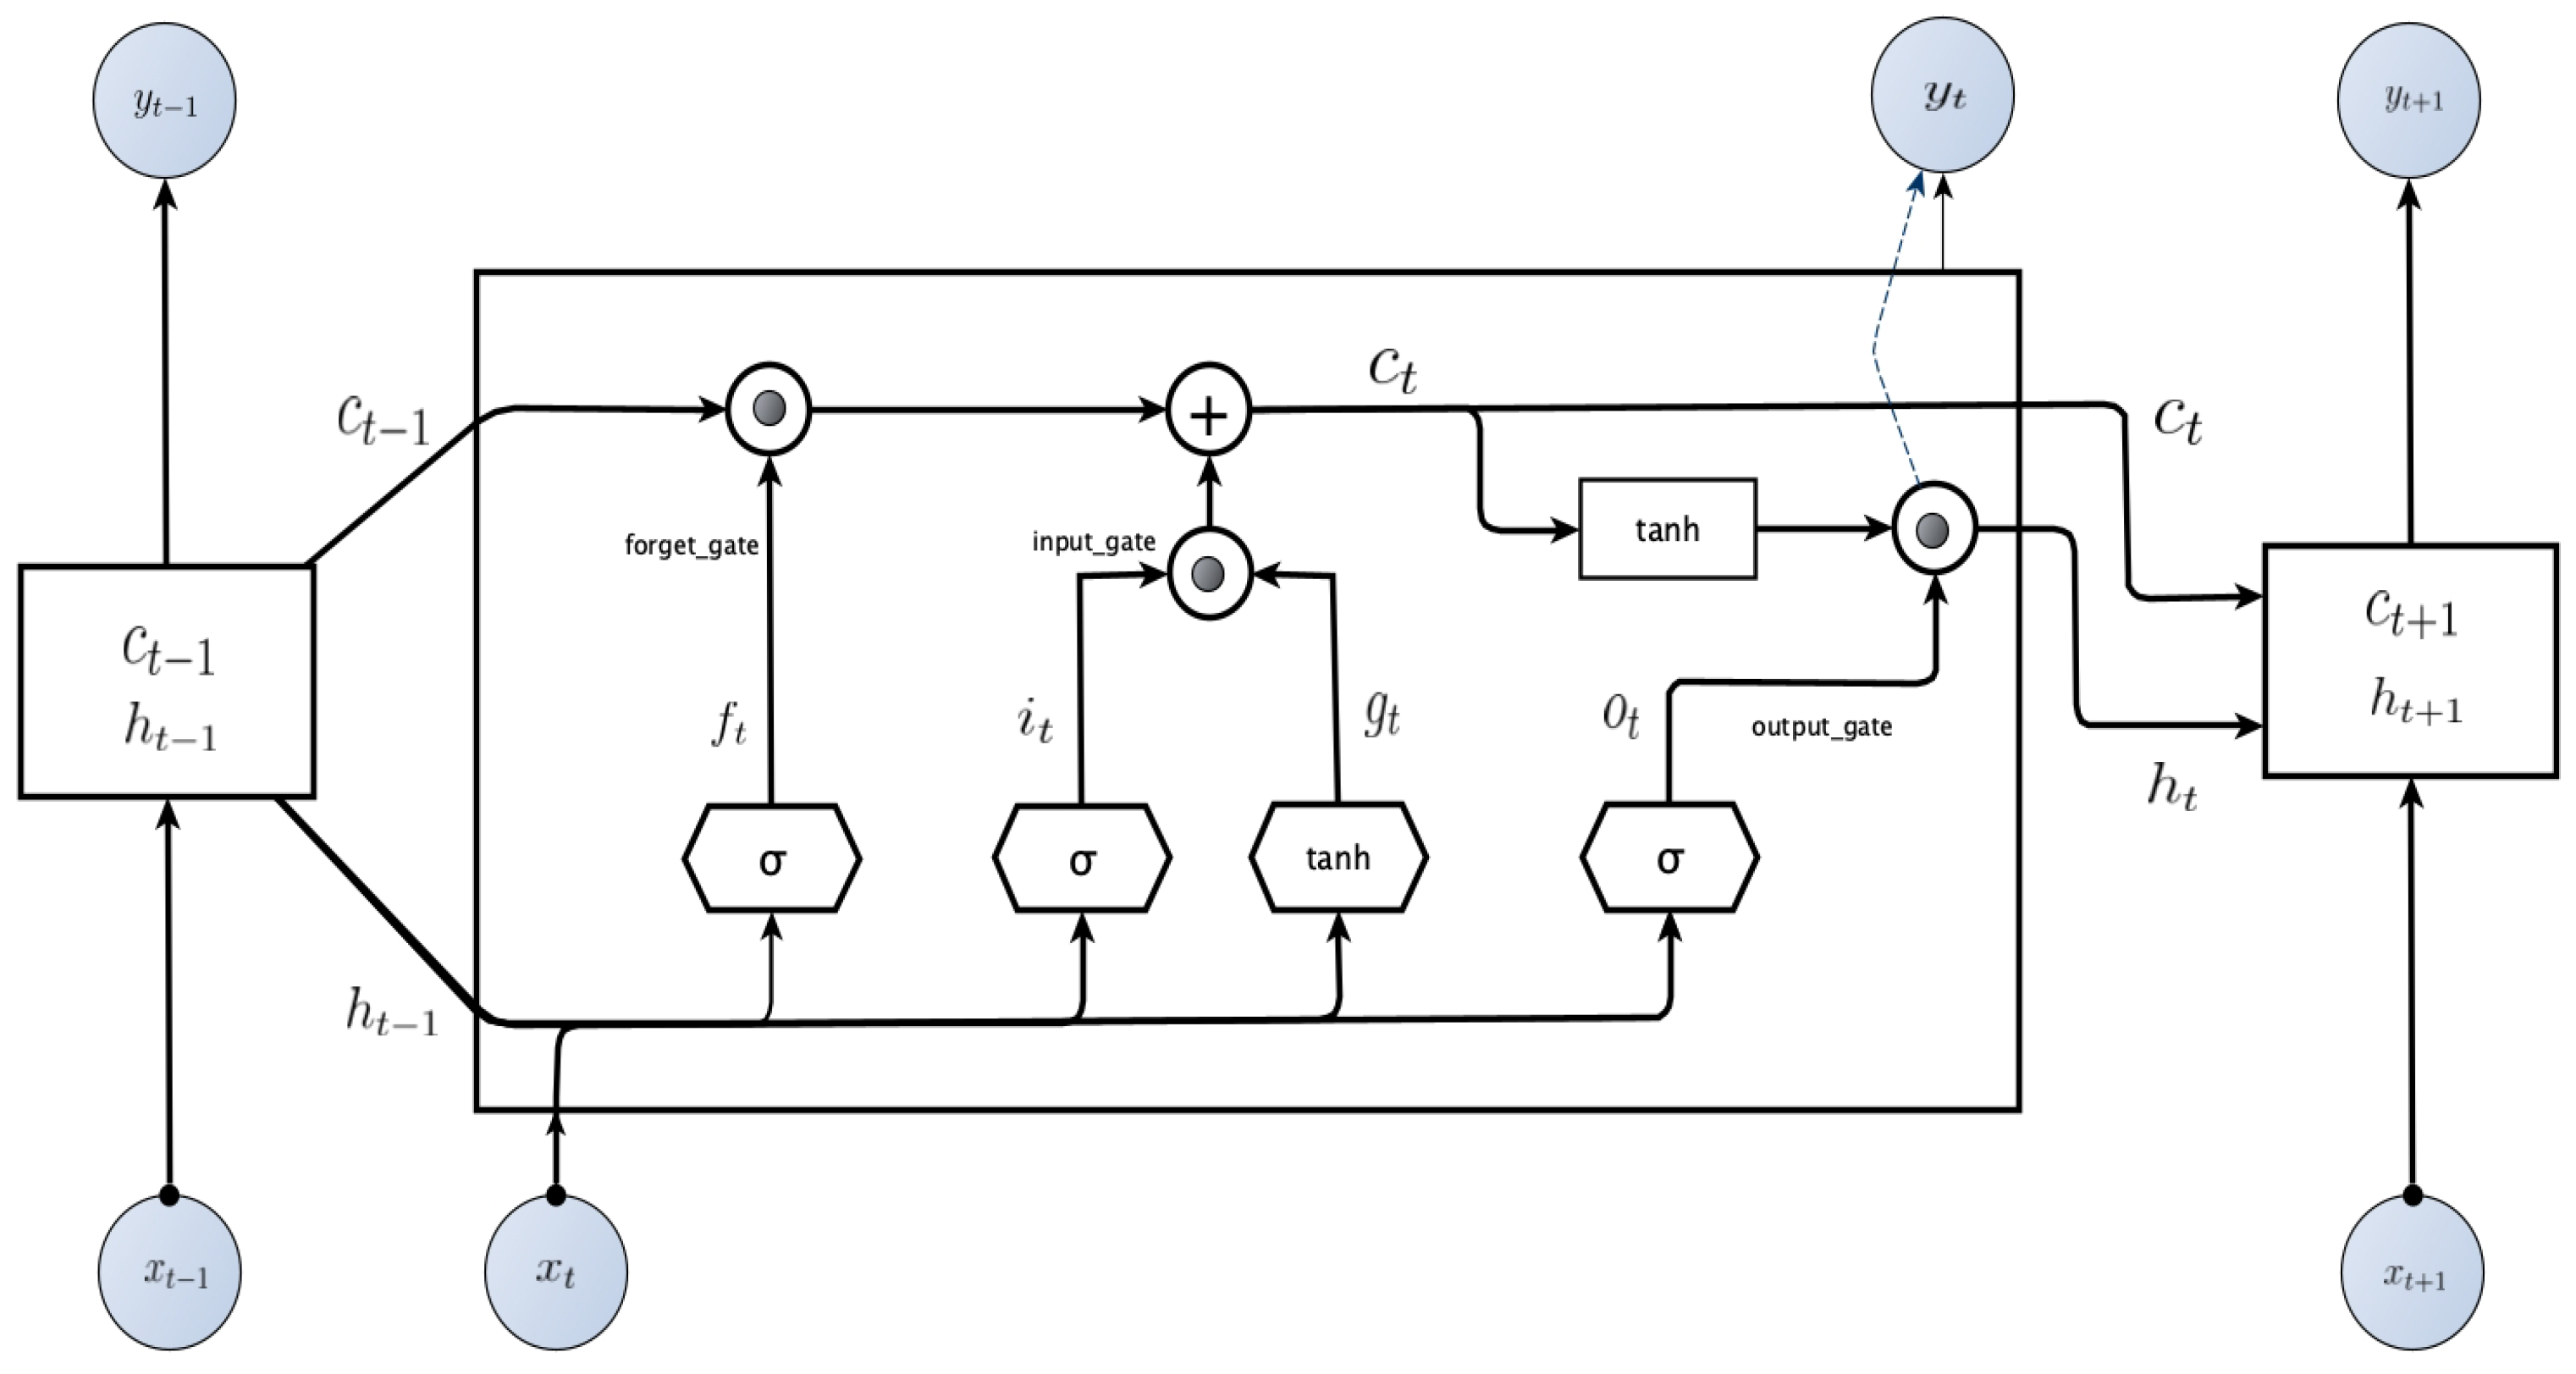
When modeling an LSTM, the choice of hyperparameters is important. The LSTM used the following hyperparameters: ‘unit’, ‘dropout rate’, ‘optimizer’, ‘activation function’, ‘learning rate’, ‘epochs’, and ‘batch size’. ‘unit’ determines the number of units in the layer; more units makes the model more complex and slower to learn. ‘dropout’ removes random neurons, preventing the model from overfitting. ‘optimizer’ selects the optimization algorithm, such as Adam, SGD, and Nadam. ‘activation function’ selects the activation function used by the layer; sigmoid and tanh are commonly used, and recently ReLU, ELU, and Swish are also used as they perform better. ‘learning rate’ determines the rate at which the model learns, with high learning rates enabling faster learning, but at the cost of performance. ‘epochs’ determines the number of times the model learns the dataset. ‘batch size’ determines the number of small batches of data used to train the model. Larger batches result in faster training, but may cause memory issues.
Random Search is one of the hyperparameter optimization methods. Tuning hyperparameters is the process of finding hyperparameters that minimize the error measure (e.g., MSE, MAE). Hyperparameters influence the performance of the model during training. Therefore, finding the optimal values for hyperparameters is crucial. Grid Search, another hyperparameter optimization method, tries all possible combinations of the hyperparameters grid to find the optimal values, which often requires a significant amount of resources. On the other hand, Random Search randomly selects hyperparameter grid points for tuning.
According to Bergstra and Bengio [7], Random Search outperformed Grid Search in most cases and required less computation time. Therfore, in this study, we used a Random Search algorithm, and the parameter grid used for the Random Search is presented in Table 4.
We also created a dataset from the data collected from 29 January 2018 to 30 December 2022, to check for lags of 1, 5, and 10. The results showed a significant and distinct change in the metrics when the lag was set to 1. The choice of lag 1 was driven by the fact that it exhibited higher explanatory power compared to lags 5 and 10 (See Table A1). Additionally, the difference in results between models with sentiment scores and those without became more pronounced when using lag 1. Moreover, among the models incorporating sentiment scores, the one utilizing lag 1 demonstrated the best performance, with the highest R 2 value. We also saw performance improvements across other error metrics.
Moreover, we focused on short-term forecasting, not long-term forecasting in this study. The reason for this is as follows. According to Kumar and Ningombam [49], fundamental analysis and technical analysis are two popular strategies for predicting stock prices. Fundamental analysis is based on the overall conditions of the economy and industry. Technical analysis is an analytical strategy that predicts the direction of a stock price and is preferred because it can predict short-term returns and actually helps traders make informed decisions before committing to trading. Therefore, our study focused on short-term forecasts and the news summary data we used is also short-term forecast because the frequency is daily. In addition, according to Jiang and Zeng [5], it is difficult to predict long-term behavior in the financial market because there are too many factors and these factors affect the financial market. In addition, there are many studies on daily stock price forecasting (Khare et al. [50], Weng et al. [51]). Due to the volatility of the market, the rate of change in prices is usually larger in long-term forecasts than short-term, so short-term price forecasts can be more effective than long-term forecasts. For these reasons, we focused on short-term forecasting rather than long-term forecasting. Fundamental investing also requires a long-term strategy, as it takes a long time to invest. Due to these characteristics, we also need a long-term strategy. So, we will be working on a long-term forecast in the future.

5.2. Error Measure

We used various measures in evaluating the forecasts using LSTM. The mean squared error (MSE) is a forecasting error that measures the difference between the predicted and actual values by squaring and taking the average of the two values. Therefore, the MSE varies sensitively depending on the size of the prediction error. The root mean squared error (RMSE) is the square root of the MSE. Therefore, it is less sensitive to error size because it takes the square root of the MSE. Thus, the error size can be interpreted more intuitively. The mean absolute error (MAE) is an average of absolute errors. It reacts less sensitively to prediction error size and receives less influence from outliers compared to MSE. Accordingly, lower MSE, RMSE, and MAE suggest better performance, reflecting closer average predictions to real values. On the other hand, R 2 is a statistical measure indicating how much of the variance in the dependent variable can be explained by the independent features of a model. It ranges from 0 to 1, where 0 indicates that the model does not explain any variance and 1 indicates a perfect fit. The R 2 was used to evaluate how well the model fitted the data and how much variation in stock prices could be attributed to the predictor variables. However, a high value of R 2 does not guarantee that the model is accurate. The formulas are as follows:
M S E = 1 n i = 1 n ( y i y ^ i ) 2
R M S E = 1 n i = 1 n ( y i y ^ i ) 2
M A E = 1 n i = 1 n y i y ^ i
R 2 = 1 S S E S S T
where n is the number of data, y i is the realized value of the S&P 500 index and y ^ i is the prediction value using the LSTM model.

5.3. Summary Results

We determined whether the results of the sentiment analysis of news data trained using the S&P 500 data from 2018 to 2022 could be used to forecast stock prices. According to Engelberg and Parsons [52], news about financial events affects stock prices. In this study, we determined whether a more accurate stock price prediction model could be created using sentiment scores of the summary text in The Front Page section of The New York Times and financial event news.
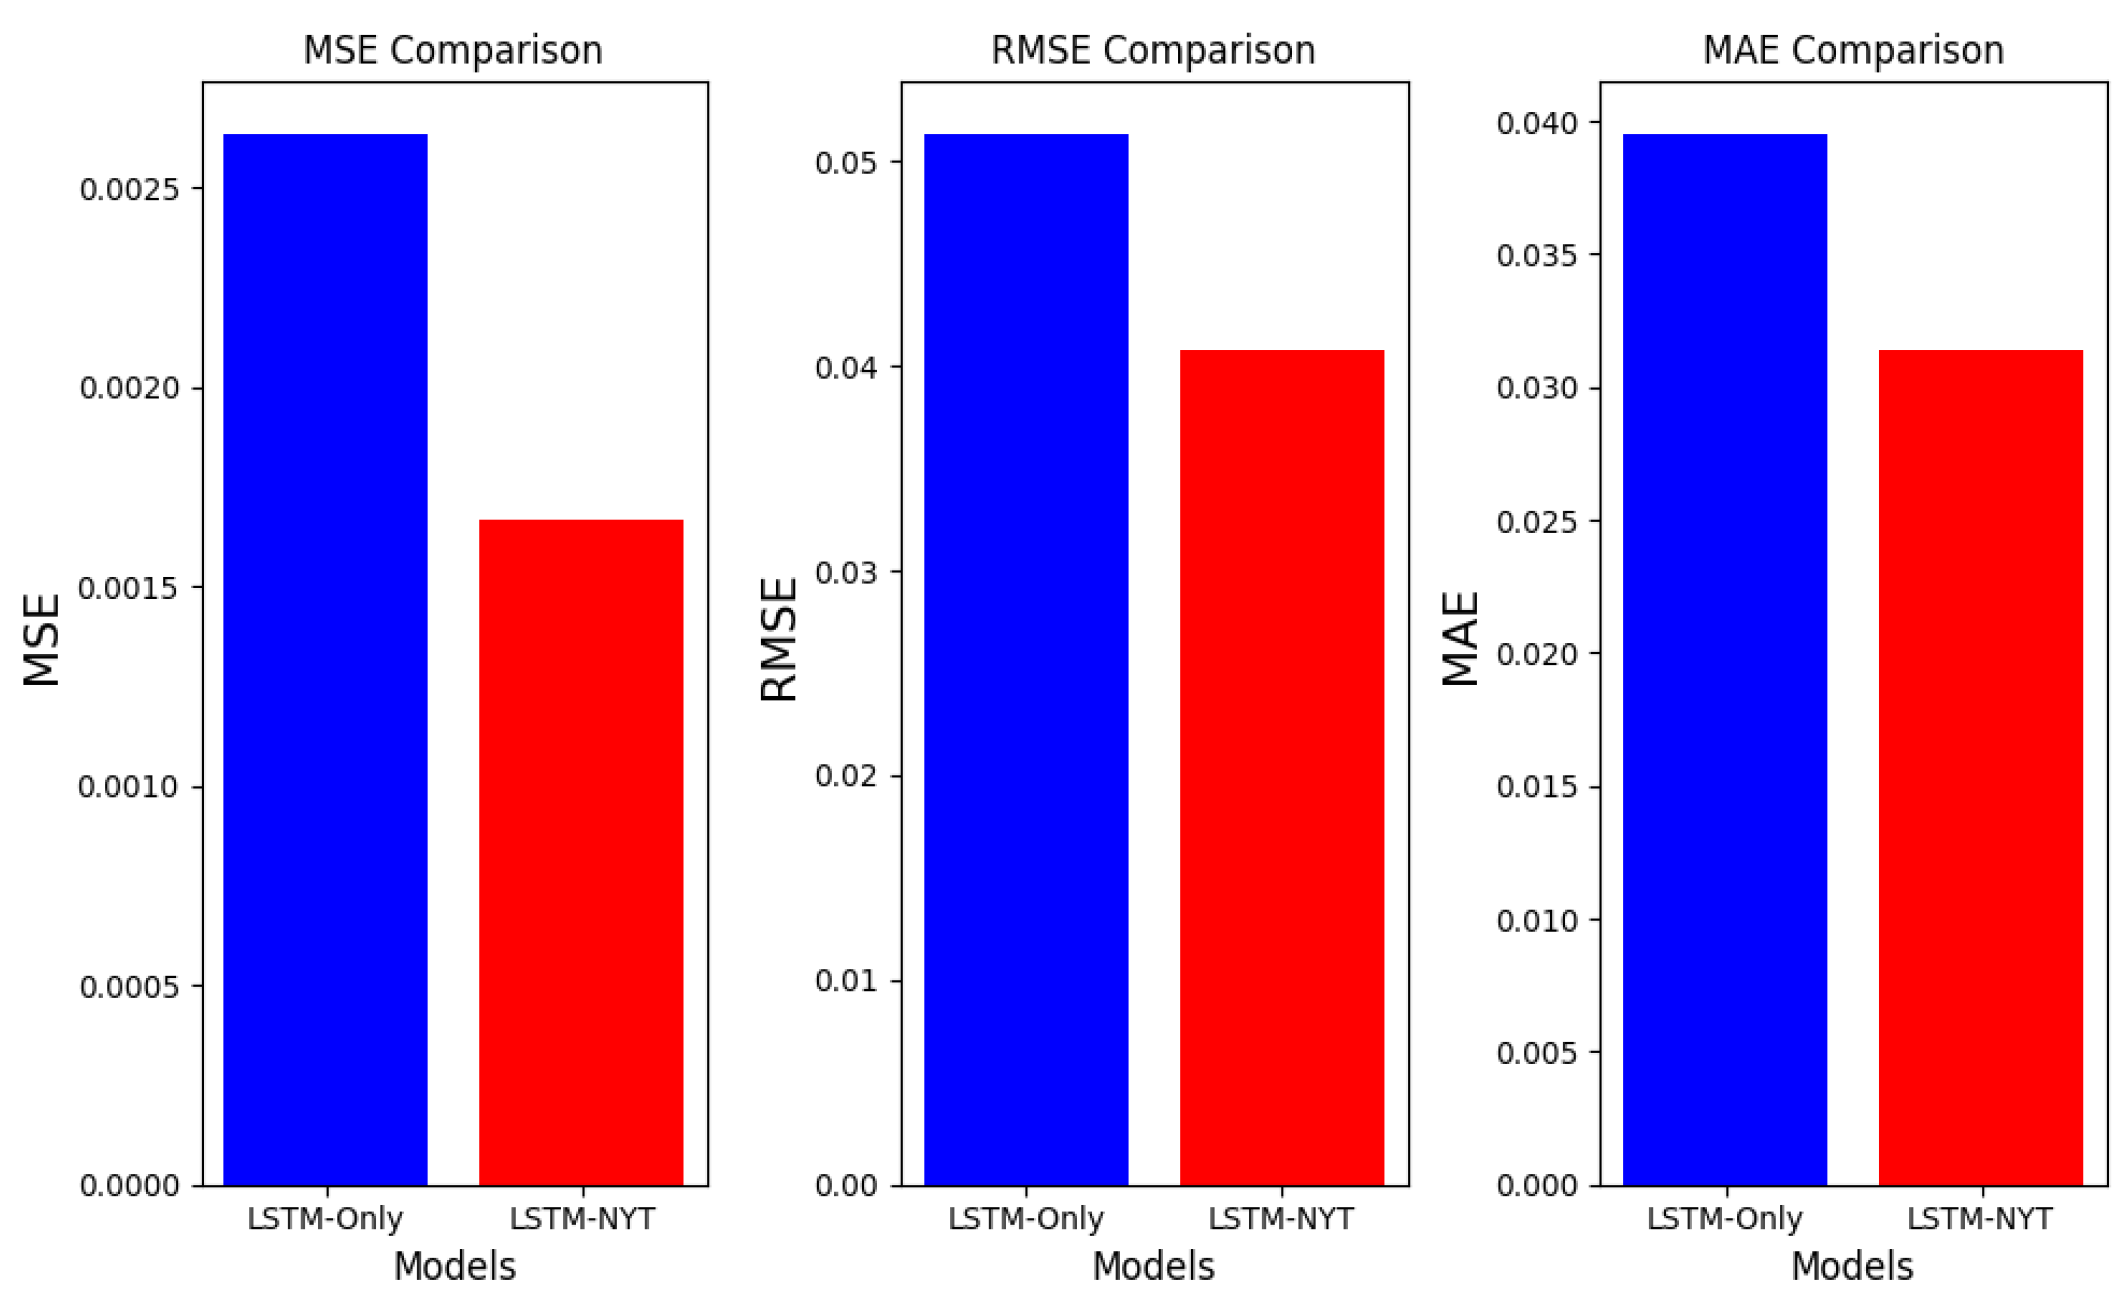
Table 5 demonstrates the model’s ability to predict the S&P 500 index by utilizing both S&P 500 data and The New York Times sentiment analysis. Specifically, the table presents the best-performing results among values obtained from 10 iterations of random search hyperparameter tuning. As depicted in the table, models that incorporate sentiment scores exhibit a noticeable enhancement in error measures. This improvement is reflected in an elevated R 2 value, signifying increased consistency and heightened predictive stability. Furthermore, 
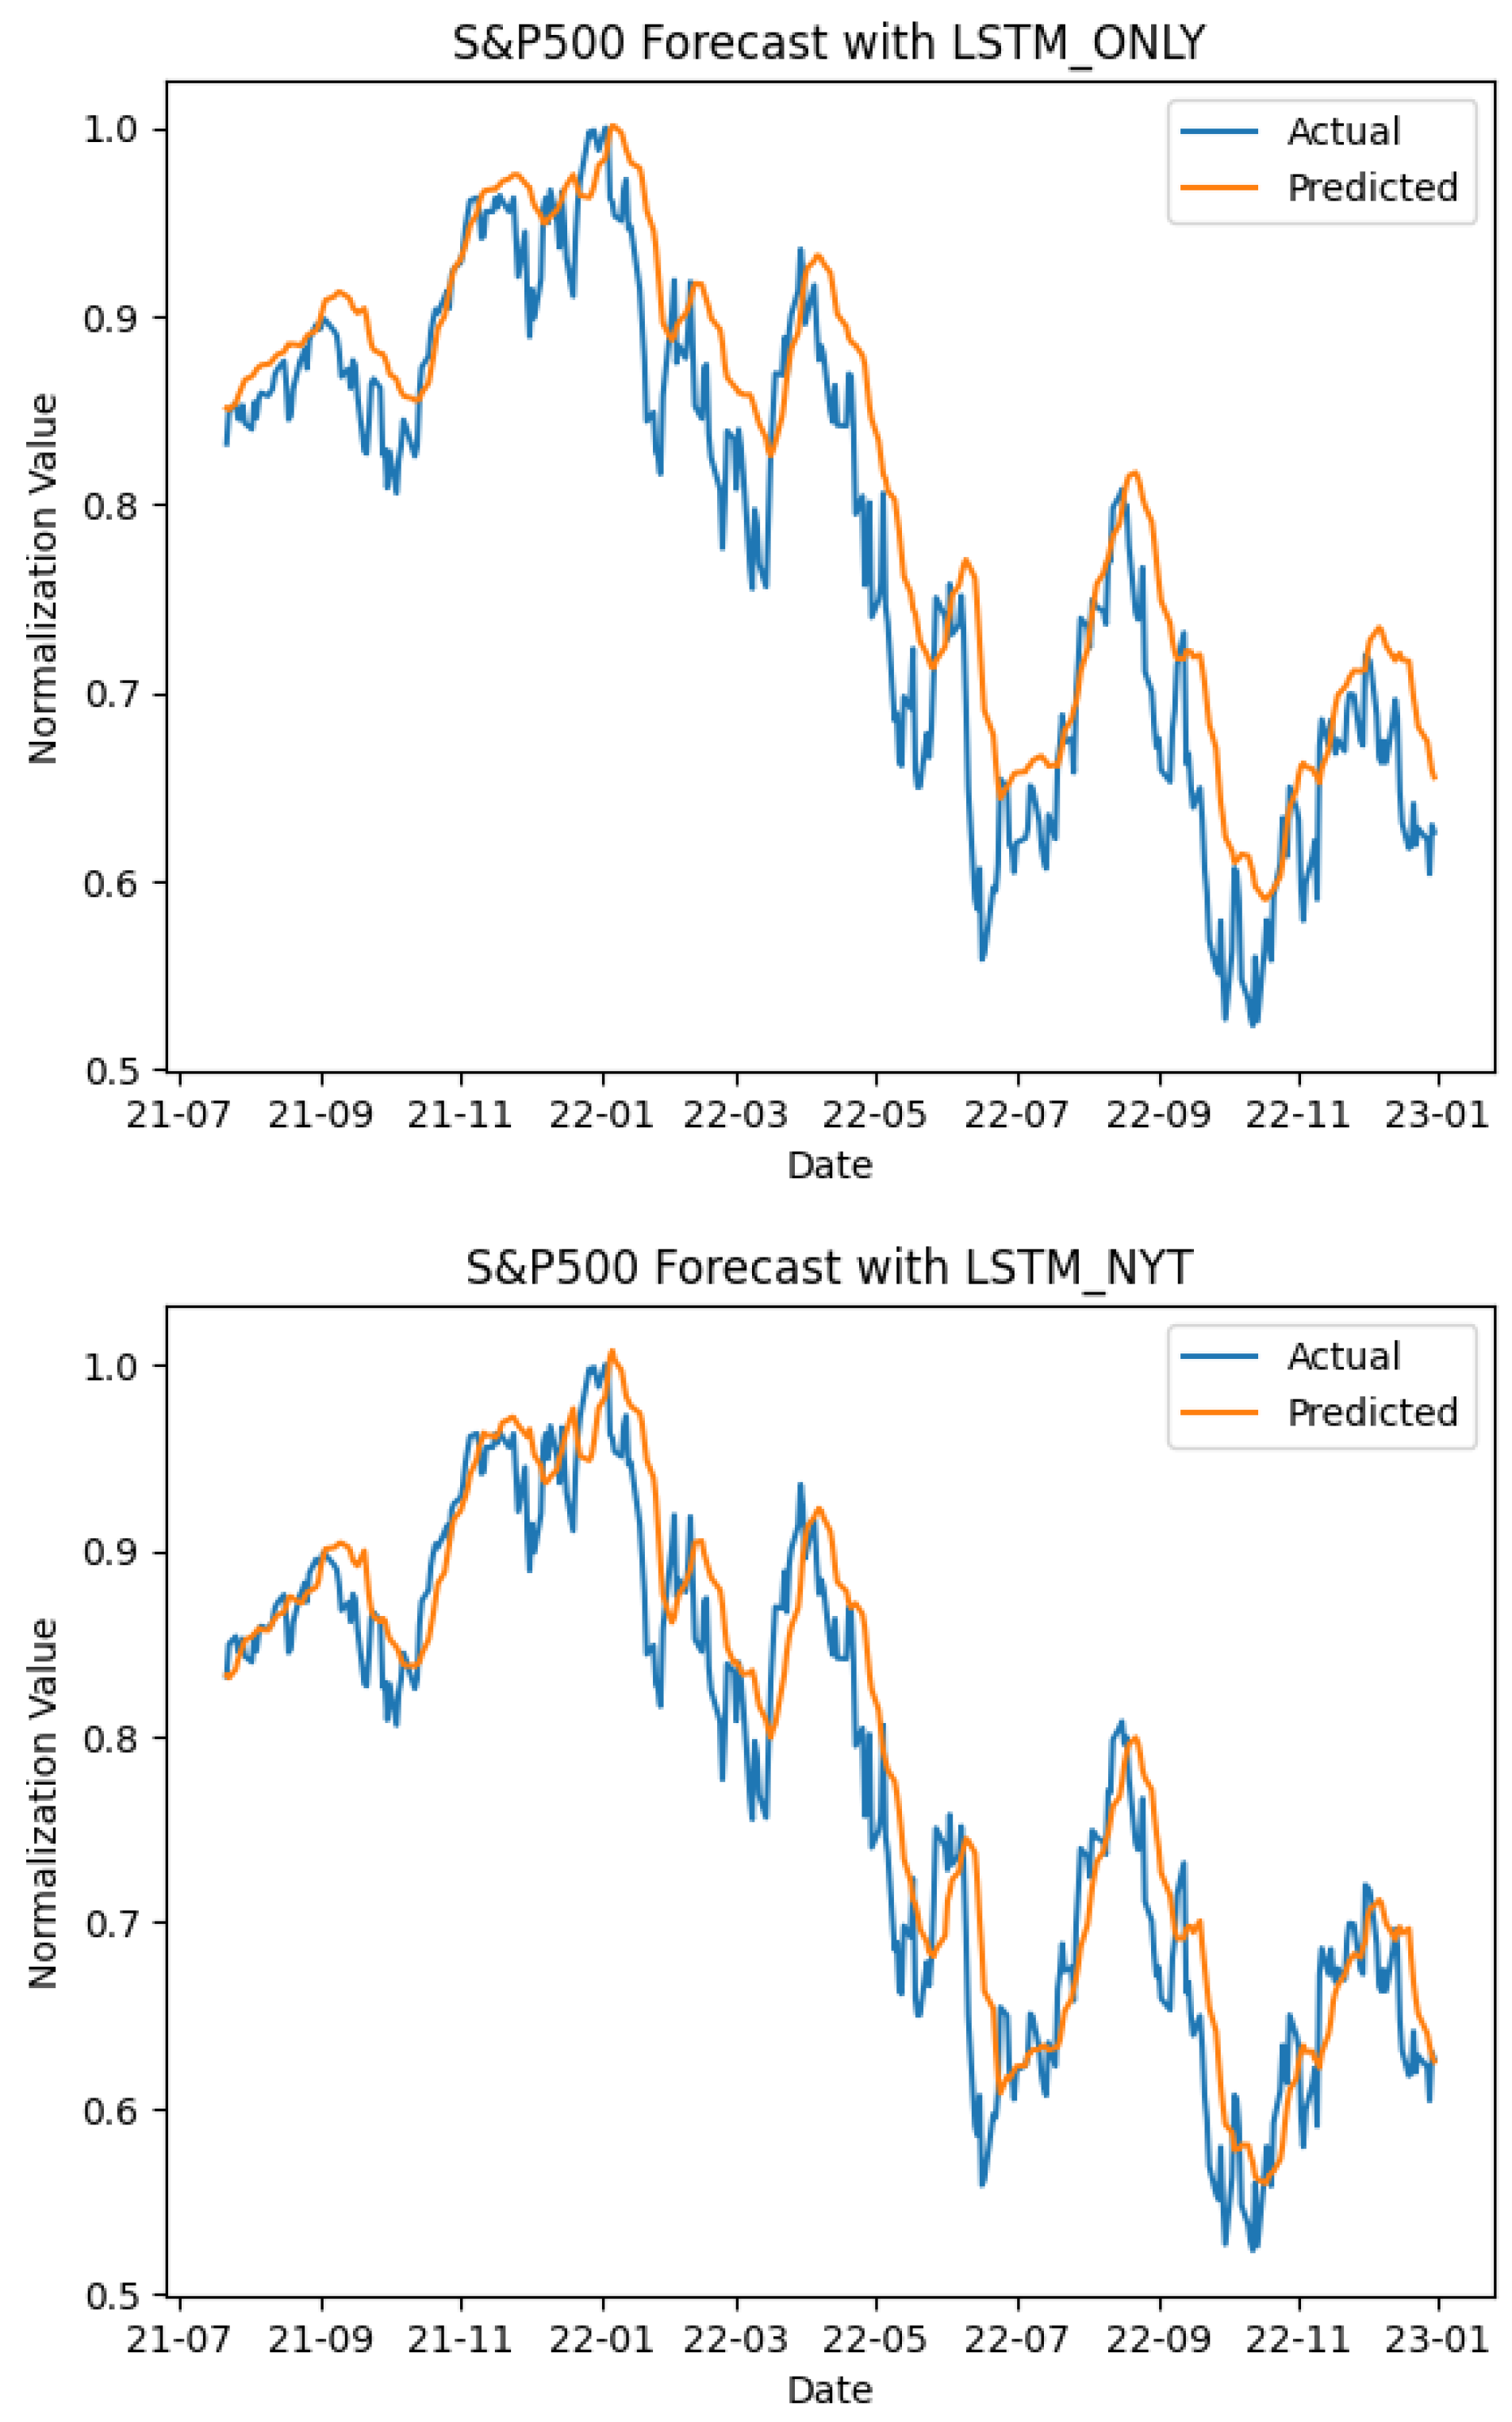
Figure 7 provides a comparative view, highlighting the distinct error measures of the two models. This differentiation further indicates the pronounced advantages of integrating sentiment scores. Moreover, Figure 8 visually emphasizes the predictive capacity of the sentiment score integrated model by demonstrating the predicted normalized S&P 500 index. Remarkably, the predictive trends described in the figure substantiate the model’s superior proficiency in forecasting the actual normalized S&P 500 index.
In conclusion, the model that used the daily summary explained the S&P 500 index better than the LSTM model with the basic features of the S&P 500 index. Specifically, whereas previous studies used results of sentiment analyses of news related to companies to predict stock prices, this study used sentiment analysis of news summaries from various fields other than the corporate and financial sectors. Additionally, predicting S&P 500 index using a feature set containing sentiment scores resulted in smaller errors. This finding confirms that news sentiments on various topics affect stock prices.
Additionally, we categorized the predicted values of the LSTM Only model (LSTM_Only) and the LSTM model with sentiment scores (LSTM_NYT). Subsequently, an independent two-sample t-test was performed to identify statistically significant distinctions between these two groups. According to the t-test (Table 6), there was a significant difference in the mean between the two predicted value groups.

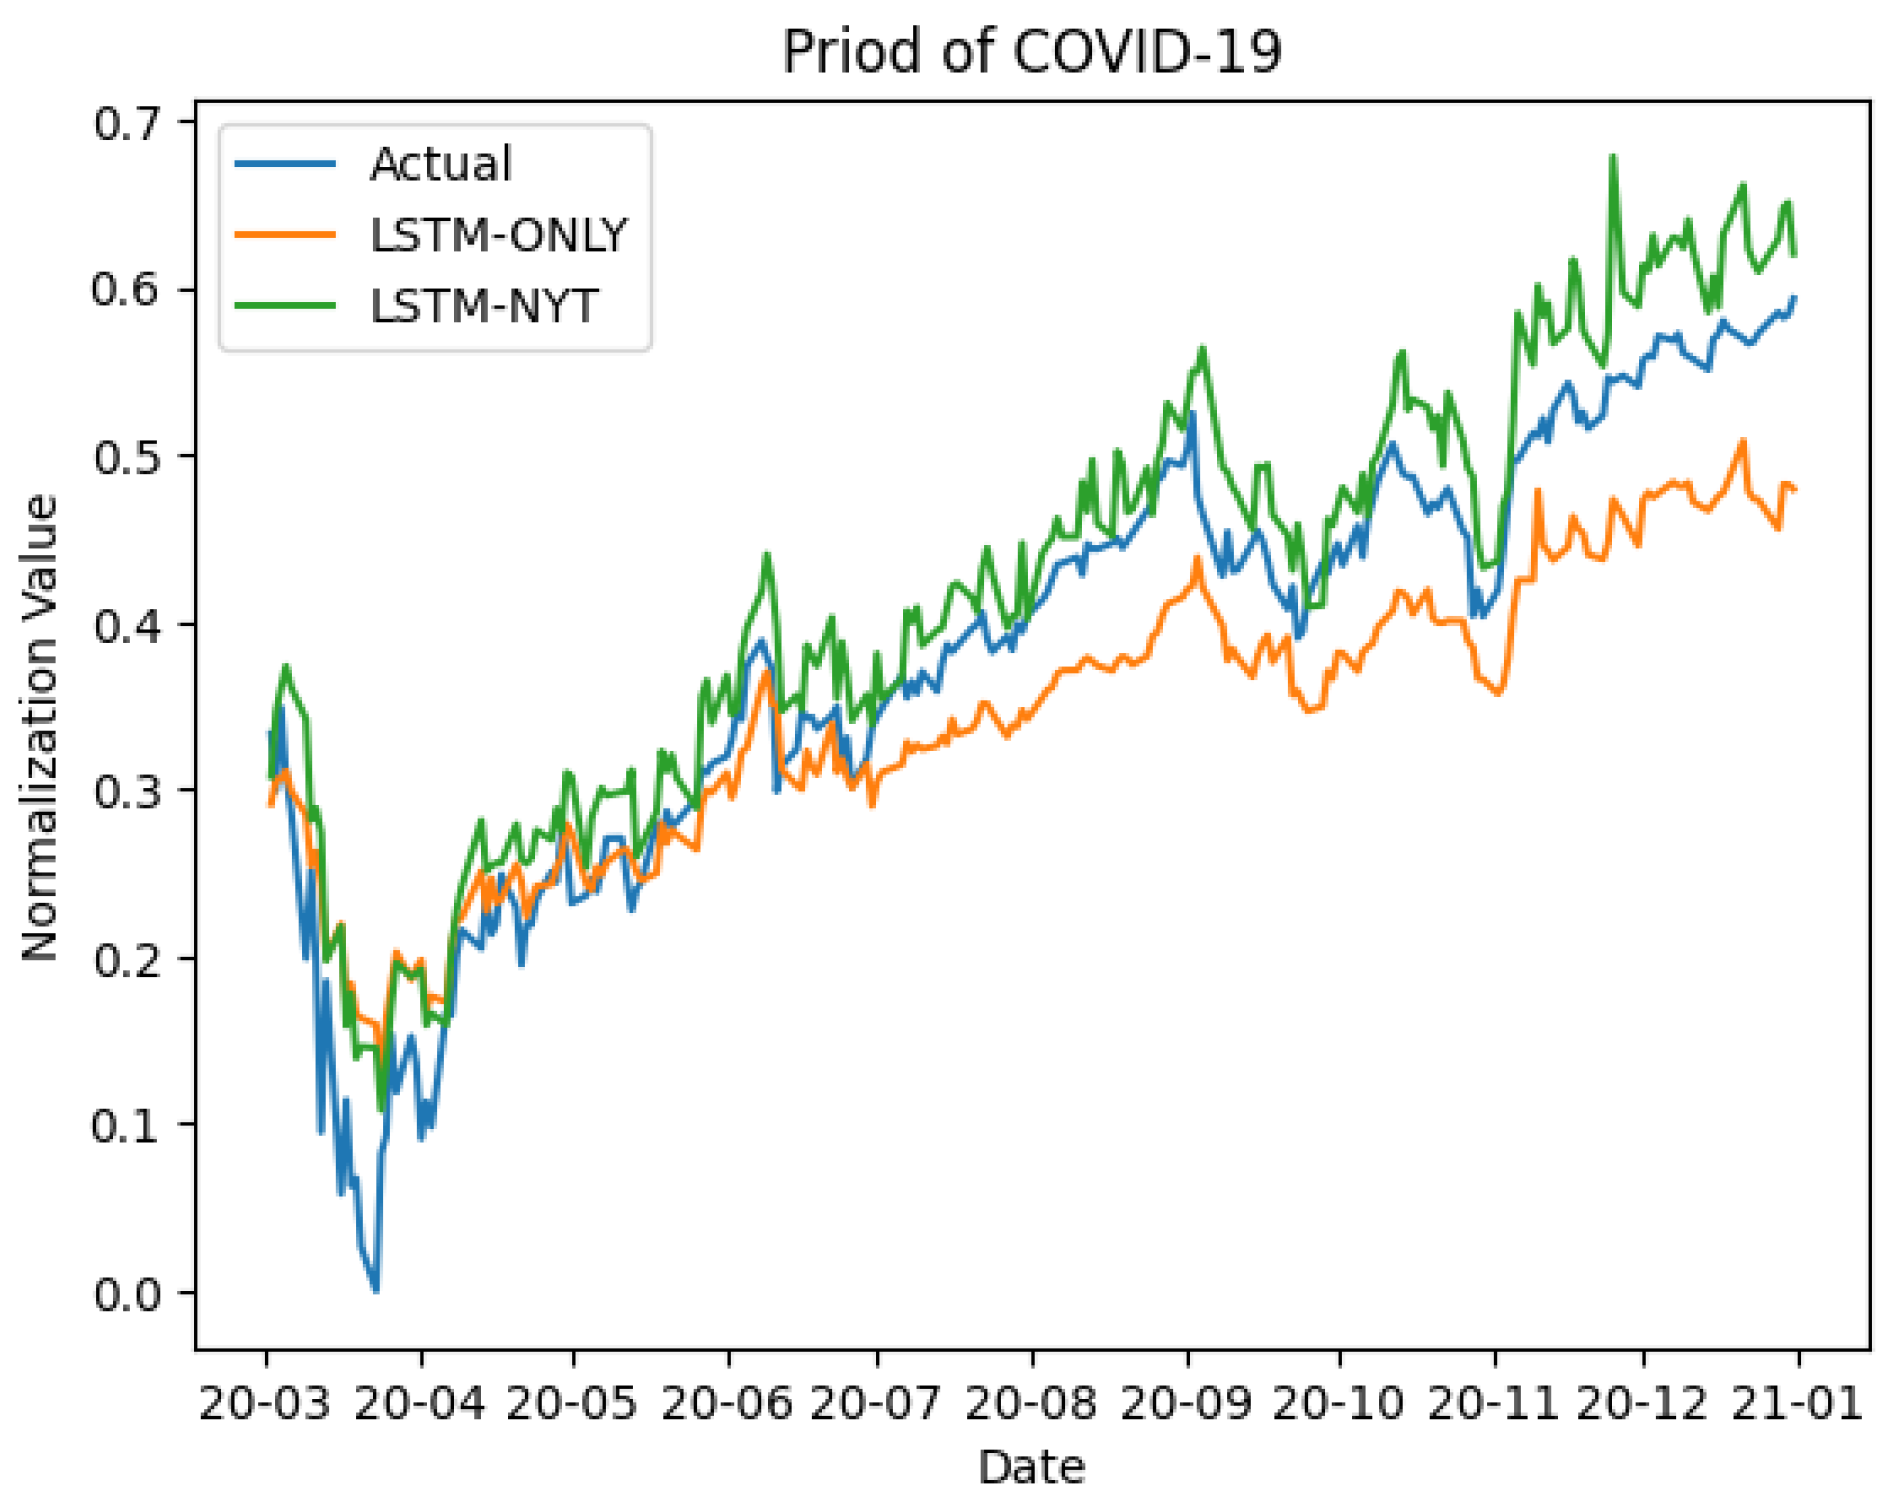
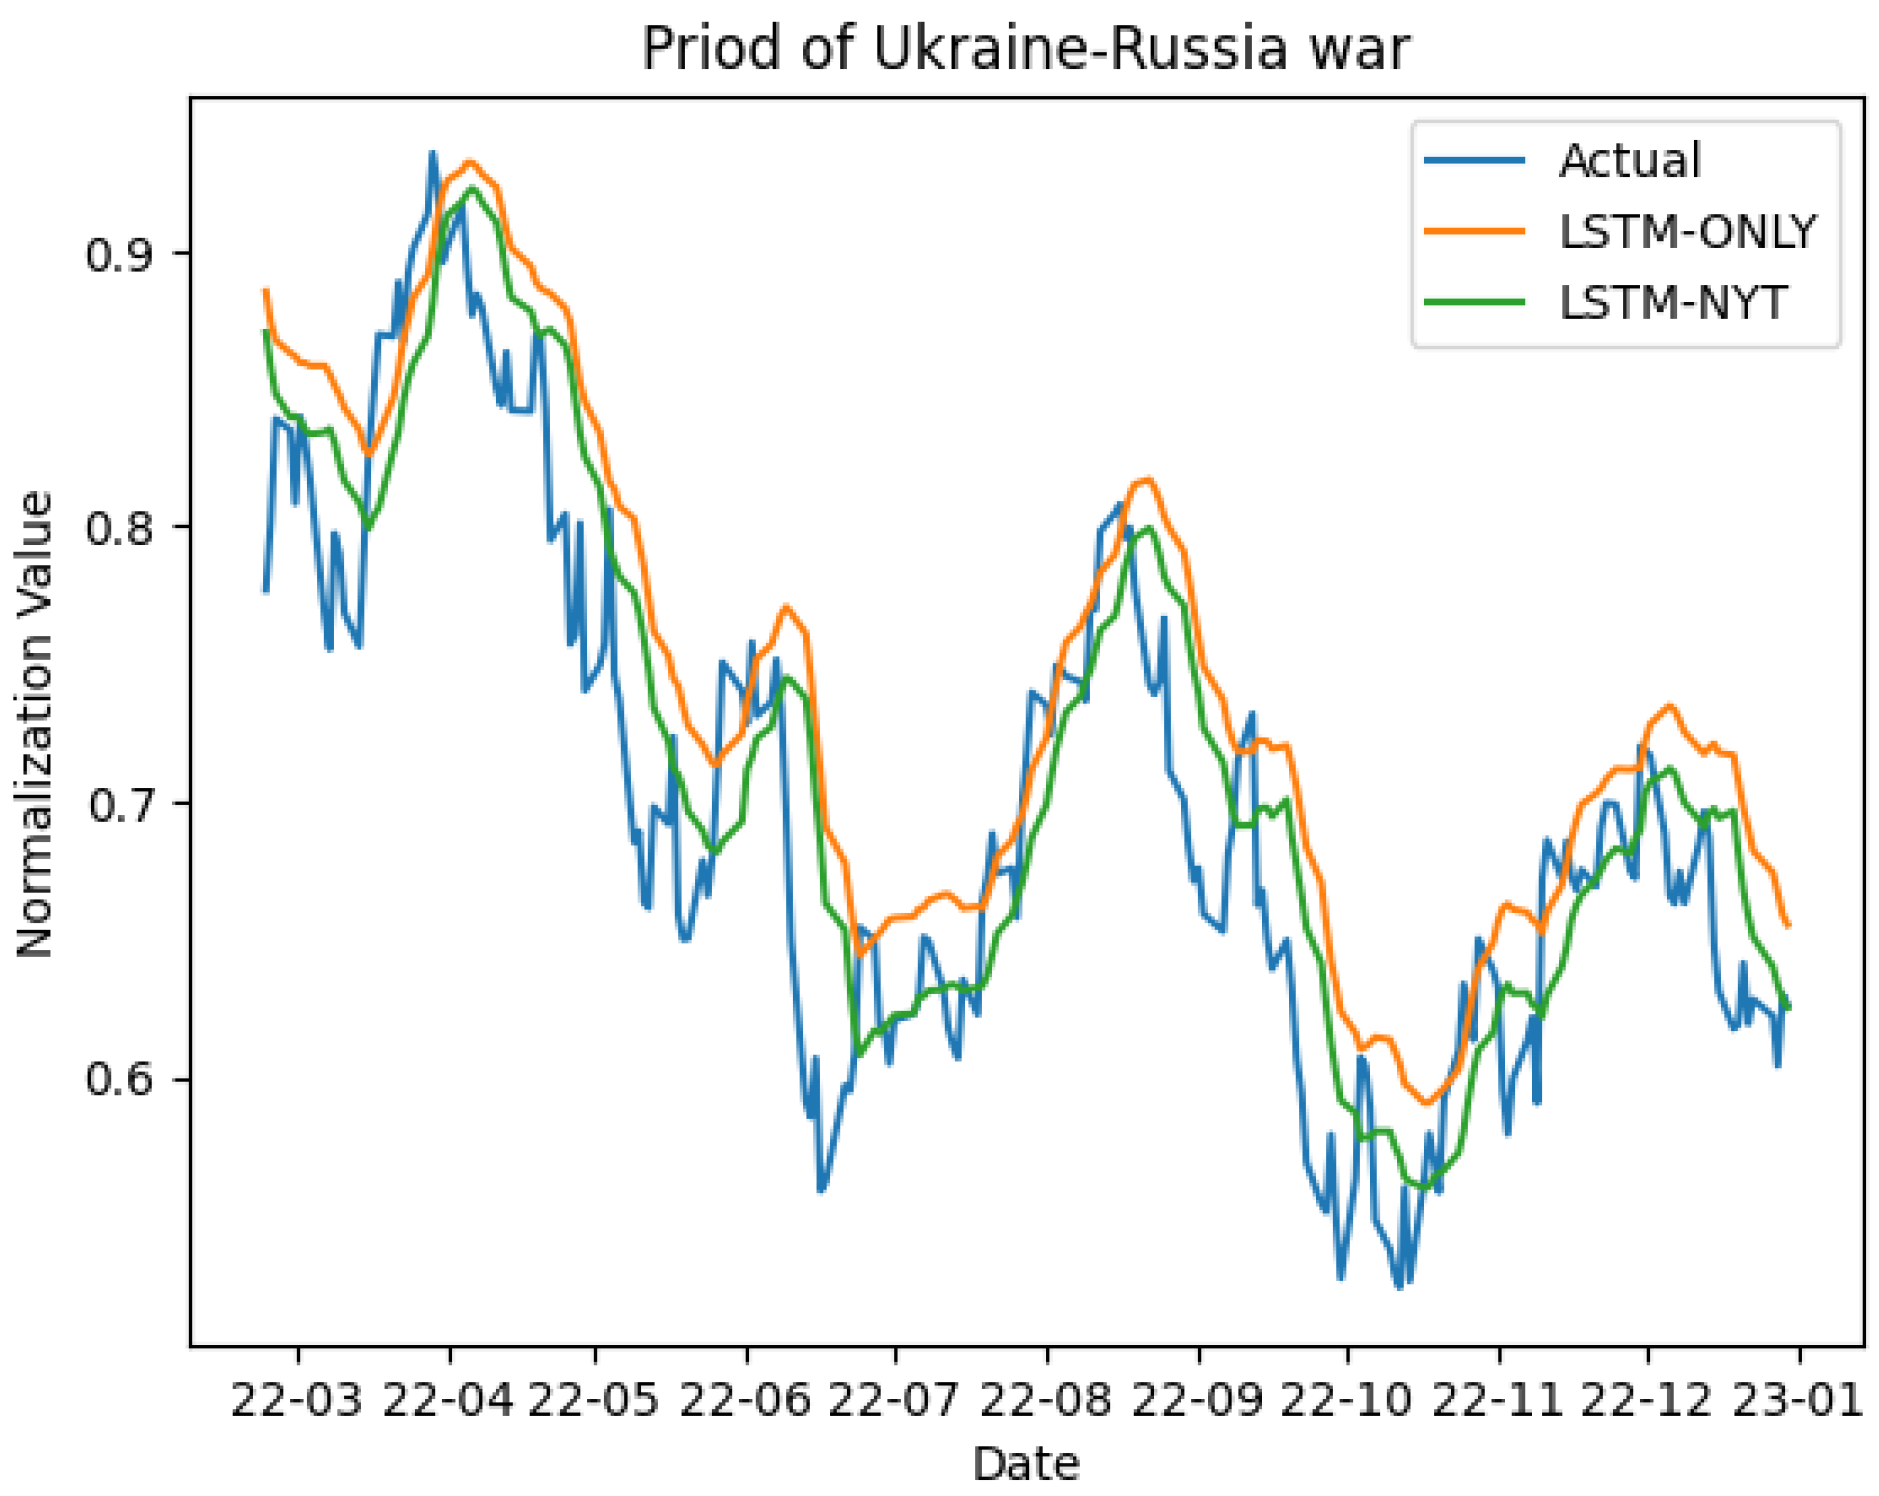
5.4. Model Performance in Crisis Periods

In this subsection, we examine how sentiment scores impact S&P 500 index prediction during high-volatility periods. We focus on the COVID-19 and Russia–Ukraine (RU) War periods. The sudden COVID-19 pandemic severely affected financial markets, causing significant disruptions (Choi [53], Szczygielski et al. [54], Liu et al. [55]). The RU War also led to increased market volatility, characterized by supply chain disruptions and energy concerns (Umar et al. [56], Lo et al. [57], Alam et al. [58]). The COVID-19 disruption spanned from 1 March 2020 to 31 December 2020, while the RU War disruption occurred from 23 February 2022 to 31 December 2022.
We employ LSTM models to make predictions both with and without sentiment scores. Table 7 shows that models with sentiment scores outperform models without sentiment scores in terms of measuring error, even during the COVID-19 period. Including sentiment scores also increased the R 2 value, improving the explanatory power of the model. Similarly, Table 8 also indicates that models incorporating sentiment scores performed better even during the RU War. Visual representations in Figure 9 and Figure 10 provide intuitive insights into predictive performance during the COVID-19 and RU War periods.
In conclusion, our analysis underscores the meaningful role of sentiment scores in predicting the S&P 500 index, particularly during phases of high volatility.

6. Discussion

In the finance domain, stock prices exhibit high volatility and complexity. Predicting stock prices has driven numerous research efforts. The broader social environment, especially sentiments in diverse media such as news or social networks, is recognized as a potential driver of stock prices. Significant news releases particularly affect stock movements. Several studies have explored sentiment analysis on media, especially news articles, to understand sentiments’ role in stock price prediction (Li et al. [23], Nguyen et al. [1], Kalyani et al. [48], Mohan et al. [59]). They have explored sentiments’ impact on stock price prediction, employing slightly different sentiment extraction methods. Nevertheless, their common findings underscore the notable influence of sentiments on stock price prediction.
Likewise, our study aimed to enhance stock price predictions by incorporating sentiment analysis outcomes into our predictive models. Specifically, we extracted sentiments from The New York Times article summaries, as a representation of various media sources. This investigation allowed us to establish that the sentiment extracted from the summary of an article played an important role in predicting stock prices. By integrating sentiment analysis into our models, we achieved more precise stock price predictions. Our study highlights the crucial role of sentiments in improving stock price prediction methods, affirming the importance of the social atmosphere.
To ensure the consistency of sentiment analysis, we intentionally focused on using only one source, The New York Times, for sentiment extraction in our study. However, we acknowledge that employing different financial news media or data sources may lead to variations in sentiment analysis due to differences in word selection and content. Relying on a single news source limits the generalizability of our findings to broader market scenarios.
In future research, we aim to address this limitation by expanding our analysis to include various media outlets such as The New York Times, Reuters, Yahoo Finance, and the Wall Street Journal (Chowdhury et al. [60], Kalyani et al. [48], Souma et al. [61]). By incorporating data from diverse sources, we aim to explore the consistency and robustness of sentiment analysis across different platforms. This comparative analysis will provide valuable insights into the variations and potential biases that may arise from employing multiple news sources. Moreover, we intend to investigate the applicability of sentiment analysis beyond traditional news articles. For instance, we will explore the feasibility of extracting sentiments from individually authored content on platforms such as Twitter. According to Souza et al. [62], exploring this approach could provide a distinct viewpoint on sentiments from the public or market participants, potentially enhancing our stock price prediction models with real-time sentiment data from social media. By expanding our scope to encompass multiple media sources and exploring unconventional data outlets, we aim to enhance the reliability and applicability of sentiment analysis in the context of stock price prediction, ultimately contributing to a more comprehensive understanding of sentiment-driven market dynamics.
In addition, our study’s main focus was evaluating how sentiments in articles influence stock price fluctuations. To achieve this, we concentrated solely on stock data and sentiment scores, omitting other potential impacting factors. The outcomes showed that article sentiment, particularly from the summary, notably influenced stock price prediction. Nevertheless, it is crucial to acknowledge that actual stock price movements can be driven by a multitude of factors, including macroeconomic indicators, company fundamentals, geopolitical events, and external shocks. Several studies have predicted stock prices by considering these indicators (Boyer and Filion [63], Hussainey and Khanh Ngoc [64], Al-Tamimi et al. [65], Weng et al. [66], Choi [67], Umar et al. [68]), and we plan to conduct a comprehensive analysis of their influence in our future research.
Furthermore, we chose the LSTM model for stock price prediction due to its suitability for sequential analysis. To validate this choice, we conducted a comparison experiment in Appendix B using an alternative machine learning model for S&P 500 prediction. The results highlight the superior forecasting accuracy of the LSTM model. Similarly, Sethia and Raut [69] found that LSTM outperformed GRU, ANN, and SVM models in stock price prediction. However, according to their findings, it is important to note that LSTM may have limitations in handling extreme price drops or rapid price spikes when used as a single model. To address this limitation, our future research will explore and compare the predictive capabilities of various machine learning models when incorporating sentiment scores into the prediction process. Furthermore, although we used FinBERT for the sentiment analysis process in this study, we propose as a future study to calculate the sentiment score of summary data using the lexicon-based approaches (SentiWordNet, a sentiment-dictionary, and VADER) methodology.
Finally, we conducted sentiment analysis using summary data from New York Times articles, a more efficient approach than analyzing the entire article body due to reduced data volume. Summaries capture essential content in a few sentences. While summary data saves space, it might not encompass all article details. Hence, comparing predictive performance between models analyzing full articles versus summaries is crucial. Furthermore, optimizing effective article summarization without losing sentiments is one of the future research topics.

7. Concluding Remarks

Stock price prediction is a field in which active research is continuously being conducted. This study investigated the impact of news sentiment on stock prices. We collected summary data from The New York Times website and compared the accuracy of stock price predictions with and without sentiment analysis results. Our target stock price index was the S&P 500, and we used five-year data (2018–2022). Our study differs from previous studies in two ways. First, we did not restrict ourselves to financial articles, but instead used data from articles on various fields that were available on the Front Page of The New York Times. The collected text data were subjected to sentiment analysis using the FinBERT model specifically designed for the financial domain. Second, we used article summaries on The New York Times rather than full article texts. For the prediction model, we employed an LSTM model optimized using a random search method.
The main contributions of this study are as follows: First, we conducted a sentiment analysis on the collected news data. Stock prices were predicted using two datasets that were distinguished by the presence or absence of sentiment analysis results. The stock price we predicted is S&P 500, and an LSTM model tuned using the Random Search method was used for the prediction. As a result, the MSE, RMSE, and MAE of the model that included the sentiment analysis result were significantly reduced compared to the model that did not. Through this, we were able to confirm that the sentiment of the news affects the prediction of the stock price. Similar results can be found in the existing literature on sentiment analysis and news on stock prices, such as Heston and Sinha [70] and Wang et al. [8]. Moreover, the model incorporating sentiment scores shows a higher R 2 value, indicating a strong fit. This suggests that utilizing sentiment analysis enhances stock price prediction accuracy. These results emphasize sentiment’s significance in finance, providing insights for better risk management and informed investment strategies.
Second, we used FinBERT for the sentiment analysis of news. As previously explained, FinBERT is a BERT model trained based on finance-related news data and contains the characteristics of the finance domain. In Araci [45], it was found that FinBERT outperformed other techniques such as ELMo and ULMFit even with only 500 training sets in the financial domain. They also found that it could solve the data shortage problem even with a small amount of data. Costola et al. [9] also used FinBERT to analyze sentiments and found a significant relationship between stock return and sentiment. We also performed sentiment analysis on the summary data of The New York Times using FinBERT and found a relationship between the result and the stock price.
Third, by performing sentiment analysis using summary data, the size of data was reduced compared to using full news. The study is meaningful because it produced results similar to those of other studies that used full articles. Although summarizing the articles reduced the amount of text data, the subjects and sentiments that the articles aimed to convey were not lost. In addition, among the words that appear in the text, it was determined that meaningless words or expressions that could interfere with sentiment analysis would have been removed. Therefore, the results show that we can predict stock prices using the sentiments extracted from summary data. Using summary data can significantly reduce the amount of data and analysis time, with results similar to those that use full texts of the articles. This is important, particularly for time-consuming sentiment analyses.
Our study revealed that incorporating sentiment analysis results from news data into a stock price prediction model improves prediction accuracy. This finding implies that stock market movements are related to sentiments. This allows investors to use sentiment analysis as a way to bring higher returns. Furthermore, this study provides further research possibilities for various sentiment analyses. Numerous studies have employed sentiment analysis across various domains. For example, Daniel et al. [71] explored Twitter users’ sentiment in response to events by companies such as Apple, Microsoft, and Walmart. Hasselgren et al. [72] proposed a method recommending stocks based on sentiment trends extracted from Twitter. Sun et al. [73] analyzed sentiments on the Guba platform to anticipate bear markets. Wu et al. [74] highlighted sentiment’s efficacy in predicting small-size company stock prices. In Wang et al. [75], sentiment analysis predicted fundraising results from online comments. Kauffmann et al. [76] improved product recommendations through Amazon reviews’ sentiment classification. In addition, our research allows companies to identify the relationship between sentiment and stock prices and manage their stock prices using sentiment analysis of news. As an example of corporate management, Suunto, a Finnish outdoor company, employed sentiment analysis to manage negative feedback during a product launch, preserving brand integrity (“10 Sentiment Analysis Examples That Will Help Improve Your Products”, 15 November 2018, Wonderflow, https://www.wonderflow.ai/blog/sentiment-analysis-examples/#examples (accessed on 1 August 2023)).

Author Contributions

Conceptualization, S.-Y.C.; Methodology, J.K., H.-S.K. and S.-Y.C.; Software, J.K. and H.-S.K.; formal analysis and investigation, J.K., H.-S.K. and S.-Y.C.; Writing—original draft, J.K., H.-S.K. and S.-Y.C.; Writing—review & editing, J.K., H.-S.K. and S.-Y.C. All authors have read and agreed to the published version of the manuscript.

Funding

The work of S.-Y.Choi was supported by the National Research Foundation of Korea (NRF) grant funded by the Korean government (MSIT) (No. 2021R1F1A1046138).

Data Availability Statement

The data used to support the findings of this study are available from the corresponding author upon request.

Acknowledgments

We appreciate editors. Furthermore, we thank the anonymous reviewers; their comments and suggestions helped improve and refine this manuscript.

Conflicts of Interest

The authors declare no conflict of interest.

Appendix A. The Choice of Optimal Lag

Table A1 shows the error measures of the two models according to lags of 1, 5, and 10.
Table A1. Error Measures of the lags.
LagModelMSERMSEMAE R 2
1LSTM-Only0.00620.07910.07030.60
1LSTM-NYT0.00190.04430.03610.87
5LSTM-Only0.01390.11820.10860.11
5LSTM-NYT0.01590.12620.11430.00
10LSTM-Only0.00680.08290.07000.56
10LSTM-NYT0.00560.07530.06660.64

Appendix B. Comparison with Other ML Models

Our study employed LSTM methodology for short-term forecasting of the S&P 500 index. Error measures in Table A2 indicate predictions from the alternative models (Gradient Boosting, XGBoost, AdaBoost). While a significant performance difference is evident when comparing LSTM models with and without sentiment scores, the impact of sentiment scores is less clear for the alternative models. Despite using normalized data, the alternative models have lower forecasting accuracy than our LSTM. Consequently, demonstrating the performance difference due to the inclusion or exclusion of sentiment scores was difficult for the alternative models over the LSTM model.
Table A2. Error Measures of Models.
ModelMSERMSEMAE R 2
Gradient BoostingLSTM-Only0.00110.01910.01590.4651
LSTM-NYT0.00110.01920.01600.4654
XGBoostLSTM-Only0.00110.02040.01690.4437
LSTM-NYT0.00110.02050.01690.4388
AdaBoostLSTM-Only0.00190.02750.02390.0323
LSTM-NYT0.00190.02730.02380.0495

References

  1. Nguyen, T.H.; Shirai, K.; Velcin, J. Sentiment analysis on social media for stock movement prediction. Expert Syst. Appl. 2015, 42, 9603–9611. [Google Scholar] [CrossRef]
  2. Li, J.; Xu, Z.; Yu, L.; Tang, L. Forecasting oil price trends with sentiment of online news articles. Procedia Comput. Sci. 2016, 91, 1081–1087. [Google Scholar] [CrossRef]
  3. Sidogi, T.; Mbuvha, R.; Marwala, T. Stock price prediction using sentiment analysis. In Proceedings of the 2021 IEEE International Conference on Systems, Man, and Cybernetics (SMC), Melbourne, Australia, 17–20 October 2021; pp. 46–51. [Google Scholar]
  4. Fazlija, B.; Harder, P. Using financial news sentiment for stock price direction prediction. Mathematics 2022, 10, 2156. [Google Scholar] [CrossRef]
  5. Jiang, T.; Zeng, A. Financial sentiment analysis using FinBERT with application in predicting stock movement. arXiv 2023, arXiv:2306.02136. [Google Scholar]
  6. Batra, R.; Daudpota, S.M. Integrating StockTwits with sentiment analysis for better prediction of stock price movement. In Proceedings of the 2018 International Conference on Computing, Mathematics and Engineering Technologies (ICoMET), Sukkur, Pakistan, 3–4 March 2018; pp. 1–5. [Google Scholar]
  7. Bergstra, J.; Bengio, Y. Random search for hyper-parameter optimization. J. Mach. Learn. Res. 2012, 13, 281–305. [Google Scholar]
  8. Wang, Z.; Ho, S.B.; Lin, Z. Stock market prediction analysis by incorporating social and news opinion and sentiment. In Proceedings of the 2018 IEEE International Conference on Data Mining Workshops (ICDMW), Singapore, 17–20 November 2018; pp. 1375–1380. [Google Scholar]
  9. Costola, M.; Hinz, O.; Nofer, M.; Pelizzon, L. Machine learning sentiment analysis, COVID-19 news and stock market reactions. Res. Int. Bus. Financ. 2023, 64, 101881. [Google Scholar] [CrossRef] [PubMed]
  10. Kauffmann, E.; Peral, J.; Gil, D.; Ferrández, A.; Sellers, R.; Mora, H. A framework for big data analytics in commercial social networks: A case study on sentiment analysis and fake review detection for marketing decision-making. Ind. Mark. Manag. 2020, 90, 523–537. [Google Scholar] [CrossRef]
  11. Hu, X.; Tang, L.; Tang, J.; Liu, H. Exploiting social relations for sentiment analysis in microblogging. In Proceedings of the Sixth ACM International Conference on Web Search and Data Mining, Rome, Italy, 4–8 February 2013; pp. 537–546. [Google Scholar]
  12. Sysoev, A.; Linchenko, A.; Kalitvin, V.; Anikin, D.; Golovashina, O. Studying Comments on Russian Patriotic Actions: Sentiment Analysis Using NLP Techniques and ML Approaches. In Proceedings of the 2021 3rd International Conference on Control Systems, Mathematical Modeling, Automation and Energy Efficiency (SUMMA), Lipetsk, Russia, 10–12 November 2021; pp. 494–499. [Google Scholar]
  13. Srinivasarao, U.; Sharaff, A. Machine intelligence based hybrid classifier for spam detection and sentiment analysis of SMS messages. Multimed. Tools Appl. 2023, 82, 31069–31099. [Google Scholar] [CrossRef]
  14. Casado-Vara, R.; Martin del Rey, A.; Pérez-Palau, D.; de-la Fuente-Valentín, L.; Corchado, J.M. Web traffic time series forecasting using LSTM neural networks with distributed asynchronous training. Mathematics 2021, 9, 421. [Google Scholar] [CrossRef]
  15. Chae, S.C.; Choi, S.Y. Analysis of the Term Structure of Major Currencies Using Principal Component Analysis and Autoencoders. Axioms 2022, 11, 135. [Google Scholar] [CrossRef]
  16. Lin, Y.; Lin, Z.; Liao, Y.; Li, Y.; Xu, J.; Yan, Y. Forecasting the realized volatility of stock price index: A hybrid model integrating CEEMDAN and LSTM. Expert Syst. Appl. 2022, 206, 117736. [Google Scholar] [CrossRef]
  17. Kogan, S.; Levin, D.; Routledge, B.R.; Sagi, J.S.; Smith, N.A. Predicting risk from financial reports with regression. In Proceedings of the Human Language Technologies: The 2009 Annual Conference of the North American Chapter of the Association for Computational Linguistics, Boulder, CO, USA, 31 May–4 June 2009; pp. 272–280. [Google Scholar]
  18. Schumaker, R.P.; Zhang, Y.; Huang, C.N.; Chen, H. Evaluating sentiment in financial news articles. Decis. Support Syst. 2012, 53, 458–464. [Google Scholar] [CrossRef]
  19. Oliveira, N.; Cortez, P.; Areal, N. The impact of microblogging data for stock market prediction: Using Twitter to predict returns, volatility, trading volume and survey sentiment indices. Expert Syst. Appl. 2017, 73, 125–144. [Google Scholar] [CrossRef]
  20. Derakhshan, A.; Beigy, H. Sentiment analysis on stock social media for stock price movement prediction. Eng. Appl. Artif. Intell. 2019, 85, 569–578. [Google Scholar] [CrossRef]
  21. Gupta, R.; Chen, M. Sentiment analysis for stock price prediction. In Proceedings of the 2020 IEEE Conference on Multimedia Information Processing and Retrieval (MIPR), Shenzhen, China, 6–8 August 2020; pp. 213–218. [Google Scholar]
  22. Srijiranon, K.; Lertratanakham, Y.; Tanantong, T. A hybrid Framework Using PCA, EMD and LSTM methods for stock market price prediction with sentiment analysis. Appl. Sci. 2022, 12, 10823. [Google Scholar] [CrossRef]
  23. Li, X.; Xie, H.; Chen, L.; Wang, J.; Deng, X. News impact on stock price return via sentiment analysis. Knowl.-Based Syst. 2014, 69, 14–23. [Google Scholar] [CrossRef]
  24. Li, X.; Wu, P.; Wang, W. Incorporating stock prices and news sentiments for stock market prediction: A case of Hong Kong. Inf. Process. Manag. 2020, 57, 102212. [Google Scholar] [CrossRef]
  25. Das, N.; Sadhukhan, B.; Chatterjee, T.; Chakrabarti, S. Effect of public sentiment on stock market movement prediction during the COVID-19 outbreak. Soc. Netw. Anal. Min. 2022, 12, 92. [Google Scholar] [CrossRef] [PubMed]
  26. Long, S.; Lucey, B.; Xie, Y.; Yarovaya, L. “I just like the stock”: The role of Reddit sentiment in the GameStop share rally. Financ. Rev. 2023, 58, 19–37. [Google Scholar] [CrossRef]
  27. Yu, L.; Wang, S.; Lai, K. A rough-set-refined text mining approach for crude oil market tendency forecasting. Int. J. Knowl. Syst. Sci. 2005, 2, 33–46. [Google Scholar]
  28. Wang, B.; Huang, H.; Wang, X. A novel text mining approach to financial time series forecasting. Neurocomputing 2012, 83, 136–145. [Google Scholar] [CrossRef]
  29. Schumaker, R.P.; Chen, H. A quantitative stock prediction system based on financial news. Inf. Process. Manag. 2009, 45, 571–583. [Google Scholar] [CrossRef]
  30. Caporin, M.; Poli, F. Building news measures from textual data and an application to volatility forecasting. Econometrics 2017, 5, 35. [Google Scholar] [CrossRef]
  31. Atkins, A.; Niranjan, M.; Gerding, E. Financial news predicts stock market volatility better than close price. J. Financ. Data Sci. 2018, 4, 120–137. [Google Scholar] [CrossRef]
  32. Elshendy, M.; Colladon, A.F.; Battistoni, E.; Gloor, P.A. Using four different online media sources to forecast the crude oil price. J. Inf. Sci. 2018, 44, 408–421. [Google Scholar] [CrossRef]
  33. Allen, D.E.; McAleer, M.; Singh, A.K. Daily market news sentiment and stock prices. Appl. Econ. 2019, 51, 3212–3235. [Google Scholar] [CrossRef]
  34. Vanstone, B.J.; Gepp, A.; Harris, G. Do news and sentiment play a role in stock price prediction? Appl. Intell. 2019, 49, 3815–3820. [Google Scholar] [CrossRef]
  35. Derbentsev, V.; Halyna Velykoivanenko, N.D. Machine learning approach for forecasting cryptocurrencies time series. Appl. Sci. 2019, 8, 65–93. [Google Scholar] [CrossRef]
  36. Chatziloizos, G.; Gunopulos, D.; Konstantinou, K. Forecasting Stock Market Trends using Deep Learning on Financial and Textual Data. In Proceedings of the 10th International Conference on Data Science, Technology and Applications—DATA, Online Streaming, 6–8 July 2021; pp. 105–114. [Google Scholar] [CrossRef]
  37. Kim, H.S. Attracting views and going viral: How message features and news-sharing channels affect health news diffusion. J. Commun. 2015, 65, 512–534. [Google Scholar] [CrossRef] [PubMed]
  38. Iglesias, J.A.; Tiemblo, A.; Ledezma, A.; Sanchis, A. Web news mining in an evolving framework. Inf. Fusion 2016, 28, 90–98. [Google Scholar] [CrossRef]
  39. Garvey, C.; Maskal, C. Sentiment analysis of the news media on artificial intelligence does not support claims of negative bias against artificial intelligence. OMICS J. Integr. Biol. 2020, 24, 286–299. [Google Scholar] [CrossRef] [PubMed]
  40. Hutto, C.; Gilbert, E. Vader: A parsimonious rule-based model for sentiment analysis of social media text. In Proceedings of the International AAAI Conference on Web and Social Media, Ann Arbor, MI, USA, 1–4 June 2014; Volume 8, pp. 216–225. [Google Scholar]
  41. Agarwal, B.; Mittal, N. Categorical probability proportion difference (CPPD): A feature selection method for sentiment classification. In Proceedings of the 2nd Workshop on Sentiment Analysis where AI Meets Psychology, Mumbai, India, 15 December 2012; pp. 17–26. [Google Scholar]
  42. Kiritchenko, S.; Zhu, X.; Mohammad, S.M. Sentiment analysis of short informal texts. J. Artif. Intell. Res. 2014, 50, 723–762. [Google Scholar] [CrossRef]
  43. Jang, E.; Choi, H.; Lee, H. Stock prediction using combination of BERT sentiment Analysis and Macro economy index. J. Korea Soc. Comput. Inf. 2020, 25, 47–56. [Google Scholar]
  44. Hochreiter, S.; Schmidhuber, J. Long short-term memory. Neural Comput. 1997, 9, 1735–1780. [Google Scholar] [CrossRef] [PubMed]
  45. Araci, D. Finbert: Financial sentiment analysis with pre-trained language models. arXiv 2019, arXiv:1908.10063. [Google Scholar]
  46. Huang, A.H.; Wang, H.; Yang, Y. FinBERT: A large language model for extracting information from financial text. Contemp. Account. Res. 2023, 40, 806–841. [Google Scholar] [CrossRef]
  47. Qiu, Y.; Song, Z.; Chen, Z. Short-term stock trends prediction based on sentiment analysis and machine learning. Soft Comput. 2022, 26, 2209–2224. [Google Scholar] [CrossRef]
  48. Kalyani, J.; Bharathi, P.; Jyothi, P. Stock trend prediction using news sentiment analysis. arXiv 2016, arXiv:1607.01958. [Google Scholar]
  49. Kumar, S.; Ningombam, D. Short-Term Forecasting of Stock Prices Using Long Short Term Memory. In Proceedings of the 2018 International Conference on Information Technology (ICIT), Bhubaneswar, India, 19–21 December 2018; pp. 182–186. [Google Scholar] [CrossRef]
  50. Khare, K.; Darekar, O.; Gupta, P.; Attar, V.Z. Short term stock price prediction using deep learning. In Proceedings of the 2017 2nd IEEE International Conference on Recent Trends in Electronics, Information & Communication Technology (RTEICT), Bangalore, India, 19–20 May 2017; pp. 482–486. [Google Scholar] [CrossRef]
  51. Weng, B.; Lu, L.; Wang, X.; Megahed, F.M.; Martinez, W. Predicting short-term stock prices using ensemble methods and online data sources. Expert Syst. Appl. 2018, 112, 258–273. [Google Scholar] [CrossRef]
  52. Engelberg, J.E.; Parsons, C.A. The causal impact of media in financial markets. J. Financ. 2011, 66, 67–97. [Google Scholar] [CrossRef]
  53. Choi, S.Y. Industry volatility and economic uncertainty due to the COVID-19 pandemic: Evidence from wavelet coherence analysis. Financ. Res. Lett. 2020, 37, 101783. [Google Scholar] [CrossRef] [PubMed]
  54. Szczygielski, J.J.; Charteris, A.; Bwanya, P.R.; Brzeszczyński, J. The impact and role of COVID-19 uncertainty: A global industry analysis. Int. Rev. Financ. Anal. 2022, 80, 101837. [Google Scholar] [CrossRef]
  55. Liu, J.; Wan, Y.; Qu, S.; Qing, R.; Sriboonchitta, S. Dynamic correlation between the Chinese and the us financial markets: From global financial crisis to covid-19 pandemic. Axioms 2022, 12, 14. [Google Scholar] [CrossRef]
  56. Umar, Z.; Polat, O.; Choi, S.Y.; Teplova, T. The impact of the Russia-Ukraine conflict on the connectedness of financial markets. Financ. Res. Lett. 2022, 48, 102976. [Google Scholar] [CrossRef]
  57. Lo, G.D.; Marcelin, I.; Bassène, T.; Sène, B. The Russo-Ukrainian war and financial markets: The role of dependence on Russian commodities. Financ. Res. Lett. 2022, 50, 103194. [Google Scholar] [CrossRef]
  58. Alam, M.K.; Tabash, M.I.; Billah, M.; Kumar, S.; Anagreh, S. The impacts of the Russia–Ukraine invasion on global markets and commodities: A dynamic connectedness among G7 and BRIC markets. J. Risk Financ. Manag. 2022, 15, 352. [Google Scholar] [CrossRef]
  59. Mohan, S.; Mullapudi, S.; Sammeta, S.; Vijayvergia, P.; Anastasiu, D.C. Stock price prediction using news sentiment analysis. In Proceedings of the 2019 IEEE Fifth International Conference on Big Data Computing Service and Applications (BigDataService), Newark, CA, USA, 4–9 April 2019; pp. 205–208. [Google Scholar]
  60. Chowdhury, S.G.; Routh, S.; Chakrabarti, S. News analytics and sentiment analysis to predict stock price trends. Int. J. Comput. Sci. Inf. Technol. 2014, 5, 3595–3604. [Google Scholar]
  61. Souma, W.; Vodenska, I.; Aoyama, H. Enhanced news sentiment analysis using deep learning methods. J. Comput. Soc. Sci. 2019, 2, 33–46. [Google Scholar] [CrossRef]
  62. Souza, T.T.P.; Kolchyna, O.; Treleaven, P.C.; Aste, T. Twitter sentiment analysis applied to finance: A case study in the retail industry. arXiv 2015, arXiv:1507.00784. [Google Scholar]
  63. Boyer, M.M.; Filion, D. Common and fundamental factors in stock returns of Canadian oil and gas companies. Energy Econ. 2007, 29, 428–453. [Google Scholar] [CrossRef]
  64. Hussainey, K.; Khanh Ngoc, L. The impact of macroeconomic indicators on Vietnamese stock prices. J. Risk Financ. 2009, 10, 321–332. [Google Scholar] [CrossRef]
  65. Al-Tamimi, H.A.H.; Alwan, A.A.; Abdel Rahman, A. Factors affecting stock prices in the UAE financial markets. J. Transnatl. Manag. 2011, 16, 3–19. [Google Scholar] [CrossRef]
  66. Weng, B.; Martinez, W.; Tsai, Y.T.; Li, C.; Lu, L.; Barth, J.R.; Megahed, F.M. Macroeconomic indicators alone can predict the monthly closing price of major US indices: Insights from artificial intelligence, time-series analysis and hybrid models. Appl. Soft Comput. 2018, 71, 685–697. [Google Scholar] [CrossRef]
  67. Choi, S.Y. Analysis of stock market efficiency during crisis periods in the US stock market: Differences between the global financial crisis and COVID-19 pandemic. Phys. Stat. Mech. Appl. 2021, 574, 125988. [Google Scholar] [CrossRef]
  68. Umar, Z.; Bossman, A.; Choi, S.Y.; Teplova, T. Does geopolitical risk matter for global asset returns? Evidence from quantile-on-quantile regression. Financ. Res. Lett. 2022, 48, 102991. [Google Scholar] [CrossRef]
  69. Sethia, A.; Raut, P. Application of LSTM, GRU and ICA for stock price prediction. In Proceedings of the Information and Communication Technology for Intelligent Systems: Proceedings of ICTIS 2018, Ahmedabad, India, 6–7 April 2018; Springer: Berlin/Heidelberg, Germany, 2019; Volume 2, pp. 479–487. [Google Scholar]
  70. Heston, S.L.; Sinha, N.R. News vs. sentiment: Predicting stock returns from news stories. Financ. Anal. J. 2017, 73, 67–83. [Google Scholar] [CrossRef]
  71. Daniel, M.; Neves, R.F.; Horta, N. Company event popularity for financial markets using Twitter and sentiment analysis. Expert Syst. Appl. 2017, 71, 111–124. [Google Scholar] [CrossRef]
  72. Hasselgren, B.; Chrysoulas, C.; Pitropakis, N.; Buchanan, W.J. Using Social Media & Sentiment Analysis to Make Investment Decisions. Future Internet 2022, 15, 5. [Google Scholar]
  73. Sun, Y.; Fang, M.; Wang, X. A novel stock recommendation system using Guba sentiment analysis. Pers. Ubiquitous Comput. 2018, 22, 575–587. [Google Scholar] [CrossRef]
  74. Wu, D.D.; Zheng, L.; Olson, D.L. A decision support approach for online stock forum sentiment analysis. IEEE Trans. Syst. Man Cybern. Syst. 2014, 44, 1077–1087. [Google Scholar] [CrossRef]
  75. Wang, W.; Guo, L.; Wu, Y.J. The merits of a sentiment analysis of antecedent comments for the prediction of online fundraising outcomes. Technol. Forecast. Soc. Chang. 2022, 174, 121070. [Google Scholar] [CrossRef]
  76. Kauffmann, E.; Peral, J.; Gil, D.; Ferrández, A.; Sellers, R.; Mora, H. Managing marketing decision-making with sentiment analysis: An evaluation of the main product features using text data mining. Sustainability 2019, 11, 4235. [Google Scholar] [CrossRef]
Figure 1. New York Times article’s headline (blue box) and summary (red box).
Axioms 12 00835 g001
Figure 2. Closing prices of S&P 500 index (2018–2022).
Axioms 12 00835 g002
Figure 3. Sentiment score density plot.
Axioms 12 00835 g003
Figure 4. Architecture of LSTM.
Axioms 12 00835 g004
Figure 5. Result of Sentiment Classification with FinBERT.
Axioms 12 00835 g005
Figure 6. Flow chart.
Axioms 12 00835 g006
Figure 7. Comparison of the error measures.
Axioms 12 00835 g007
Figure 8. Forecasting S&P 500 index.
Axioms 12 00835 g008
Figure 9. Forecasting S&P 500 during COVID-19 pandemic.
Axioms 12 00835 g009
Figure 10. Forecasting S&P 500 during RU War.
Axioms 12 00835 g010
Table 1. Summary statistics for the S&P 500 index.
Period: 1 January 2018–31 December 2022 (1259 Days)
MeanMax.Min.Std. Dev.SkewnessKurtosis
3449.734796.562237.4668.910.36−1.28
Table 2. The statistics of the positive, neutral, and negative class.
LabelsPositiveNeutralNegativeTotal
ratio8.05%27.9%64.05%30,797
Table 3. Summary statistics for the daily sentiment score for The New York Times. The Jarque–Bera statistic was used to test the null hypothesis of normality for the sample returns. indicates a rejection of the null hypothesis at the 1 % significance level.
SectorsMeanMax.Min.Std. Dev.SkewnessKurtosisJarque–Bera
Score−0.181.0−0.990.52−0.03−0.0918.53
Table 4. Random search hyperparameter grid.
ParameterGrid
units[32, 64, 128, 256]
dropout_rate[0.1, 0.2, 0.3, 0.4, 0.5],
optimizer[Adam Nadam, RMSprop, SGD]
activation[ReLU, tanh, SELU, ELU, Swish]
learning_rate[0.001, 0.01, 0.1]
epochs[50, 100, 150]
batch_size[16, 32, 64]
Table 5. Forecast Error Measure.
Evaluation MeasureMSERMSEMAE R 2
LSTM-Only0.00260.05130.03940.8339
LSTM-NYT0.00160.04070.03130.8950
Table 6. t-test results.
SamplesNMeanStd. Dev.t-Statisticp-Value
LSTM-Only3650.8140.1142.2550.024
LSTM-NYT3650.7950.123
Table 7. Forecast Error Measures during COVID-19 pandemic.
Evaluation MeasureMSERMSEMAE R 2
LSTM-Only0.0040.0640.0550.771
LSTM-NYT0.0020.0510.0420.851
Table 8. Forecast Error Measures during RU War.
Evaluation MeasureMSERMSEMAE R 2
LSTM-Only0.0030.0590.0470.623
LSTM-NYT0.0020.0450.0360.778
Disclaimer/Publisher’s Note: The statements, opinions and data contained in all publications are solely those of the individual author(s) and contributor(s) and not of MDPI and/or the editor(s). MDPI and/or the editor(s) disclaim responsibility for any injury to people or property resulting from any ideas, methods, instructions or products referred to in the content.

