Article

Experimental Validation in a Controlled Environment of a Methodology for Assessing the Dynamic Behavior of Railway Track Components

1
Department of Mechanical Engineering, Escuela Politécnica Nacional, Ladrón de Guevara E11-253, Quito 170525, Ecuador
2
DIMEB Research Group, Escuela Politécnica Nacional, Quito 170525, Ecuador
3
Departamento de Ingeniería de Maderas, Facultad de Ingeniería, Universidad del Bío-Bío, Concepción 4051381, Chile
4
Department of Mechanical Engineering and Materials, Universitat Politècnica de València, 46022 Valencia, Spain
5
Acoustical and Mechanical Engineering Laboratory (LEAM), Universitat Politècnica de Catalunya (UPC), C/Colom 11, 08222 Terrassa, Spain
*
Author to whom correspondence should be addressed.
Submission received: 13 April 2022 / Revised: 14 May 2022 / Accepted: 17 May 2022 / Published: 19 May 2022
(This article belongs to the Section Vehicle Engineering)

Abstract

:
This article presents a novel methodology conducted under controlled laboratory conditions to assess the dynamic behavior of the components of railway tracks by applying an unbalanced mass excitation force. The methodology for obtaining accurate measurements, which uses different excitation parameters, is based on an unbalanced mass device, and from these data, the transmissibility of the mass-elastomer system is estimated. For assessment of the dynamic behavior, different sine sweep rate excitations, the unbalanced mass, and background noise are considered. The experimental measurements of transmissibility with a shaker and an unbalanced mass device are performed to validate the methodology. For this, frequency-by-frequency transmissibility measurements and the swept sine were performed by the shaker, with a sine sweep from 1 to 51 Hz, using the unbalanced mass device with different sine sweep rates and unbalanced mass. The results obtained allow comparison of the transmissibility by excitation at specific frequencies and the sine sweep to validate the excitation parameters of the unbalanced mass device. Thus, a transmissibility estimation error with the sweep rate, the unbalanced mass, and the background noise is developed. By using the proposed methodology, it is possible to lower the error of the estimated transmissibility of the system with background noise.

1. Introduction

The construction of a new line at a grade railway track and underground increases the level of vibration caused by the passage of trains near infrastructures (e.g., hospitals, education centers, and old infrastructures). Moreover, construction activities and increased traffic on existing railway tracks increase the level of vibration in these infrastructures [1]. In the sleeper track model on ballast, to dynamically characterize the stiffness and damping, three main elastomeric elements can be identified, such as the rail pad, mants under sleepers, and mants under ballast [2]. In these models, the mechanical behavior of the elastomeric materials is often represented using simplified viscoelastic models. Examples of these are the Kelvin–Voigt model, where the elastomeric element is represented using an elastic spring and a viscous damper [3]. Developing solutions for the design of railway tracks and to predict the propagation of vibrations to infrastructures is very important to effect accurate measurements to assess the dynamic behavior of railway tracks. For the identification of the dynamic parameters of railway tracks, the most commonly used methods are based on excitation impact tests by means of instrumented hammers; the measurements of the frequency response function with a small and large hammer and their overlap test measurements have been obtained through field tests [4,5,6,7].
Generated force with an unbalanced mass device has usually been used for excitation at low frequencies [8,9] and the study of the dynamic behavior of structures [10,11]. The transmissibility response function has been estimated from experimental measurements by accelerometers placed on the base of the test rig, and the dynamic mass of the system is evaluated using shakers to ensure that the test rig is sufficiently excited [12,13,14]. Moreover, estimation methods of the transmissibility matrix performed in the laboratory are based on the environmental excitations of the test rig, e.g., floor vibrations [15]. These methods have resulted in a reasonable estimate of the transmissibility matrix, provided that the vibrations generated by an excitation source provide sufficient spectral power in the direction of excitation of the system and considering the background noise to obtain an adequate signal-to-noise ratio [16,17]. Sine sweep base excitation vibration tests have been performed to certify structures of the aeronautical industry in a low-frequency environment, where dynamic behavior can be characterized by a small number of modes [18,19]. In addition, during the sine sweep, at each frequency, the response levels in all accelerometers were investigated; the load cells were different from a steady-state response [20]. The effects of the swept sine based on the sweep rate and a system of a single degree of freedom were examined [21] determining that, with high sine-sweep rates, the steady-state response was not achieved. So, the result in this dynamic transmissibility case could be modified by the presence of transients [22,23]. For this, the non-dimensional sweep parameter that depends on the resonant frequency and the sweep rate were defined as other components for the analysis of the swept sine response [24]. The excitation with sine sweep using one unbalanced mass device has been another method with a sweep rate that concentrates the mechanical vibration energy in short-frequency ranges to ensure that, at these frequencies, the signal-to-noise ratio is large enough [9,25,26]. The excitation parameters, such as the sine sweep rate, unbalanced mass, amplitude, and force have been used to generate harmonic excitation during experimental tests by means of an unbalanced mass device [27,28]. However, the combination of the excitation parameters of the unbalanced mass device that provides the vibrational excitation energy on the system, considering the background noise of the vibrations affecting the system, has not been determined. The problem of the experimental determination of the excitation parameters of an unbalanced mass device has not been specifically addressed. The spectral power required to generate sine sweep excitation close to the stable state on a railway system with the appropriate excitation parameters has not been determined. The criteria based on the sweep parameter and signal-to-noise ratio for the evaluation of the dynamic behavior of the components of railway systems have not been addressed.
This paper presents the experimental determination of the excitation parameters that allows assessment of the dynamic behavior of railway track components by applying an excitation force on a mass-elastomer system that uses an unbalanced mass device designed and implemented in the laboratory. The experimental determination of the excitation parameters is based on an exciter machine, with an unbalanced rotating mass system that supports the dynamic mass at four points. The vibrations induced to the dynamic mass are obtained through a set of accelerometers. From these data, the dynamic transmissibility of the system can be determined. In order to experimentally determine the excitation parameters in the laboratory, a test system consisting of the following parts was designed and implemented: a mass-elastomer system to be tested, a test rig on which this system rests, and an exciter motor. The mass-elastomer system represents the track, and the exciter motor represents the exciter machine described previously. In the same way as the machine used in the proposed track characterization system, this motor was installed on the mass-elastomer system. This generates a controlled excitation thanks to an unbalanced mass, creating a sine sweep excitation. The validation measurements of the transmissibility are determined by three methods: with the harmonic excitation applied by a shaker, with the sine sweep excitation also applied by a shaker, and using an exciter motor with different parameters of sweep rate and sweep time. The results obtained allow comparison of the transmissibility obtained by the different types of excitation and validate the excitation parameters to be used in the assessment of the dynamic behavior of the railway components in a controlled environment.
The main contribution of this paper is to experimentally determine the maximum sweep parameter that ensures steady-state conditions and suitable signal-to-noise ratios during a sine sweep excitation process for the unbalanced mass device proposed. In this situation, when the response of the excited system complies with the steady-state condition and its signal-to-noise ratio is large enough, it is possible to accurately estimate the frequency response functions (FRF) of the system. Moreover, the sweep rate, the unbalanced mass, and the sweep time parameters are also determined for these optimal sine sweep excitation conditions.
The rest of the paper is organized as follows. The mass-elastomer system model is described in Section 2. The experimental system identification method in the presence of background noise is described in Section 4. The experimental results and their discussion are presented in Section 5, where in Section 5.1, the parameters of the optimal sine sweep excitation conditions are determined, and where in Section 5.3, the FRF of a sample system are obtained by using the proposed methodology. Major conclusions are given in Section 6.

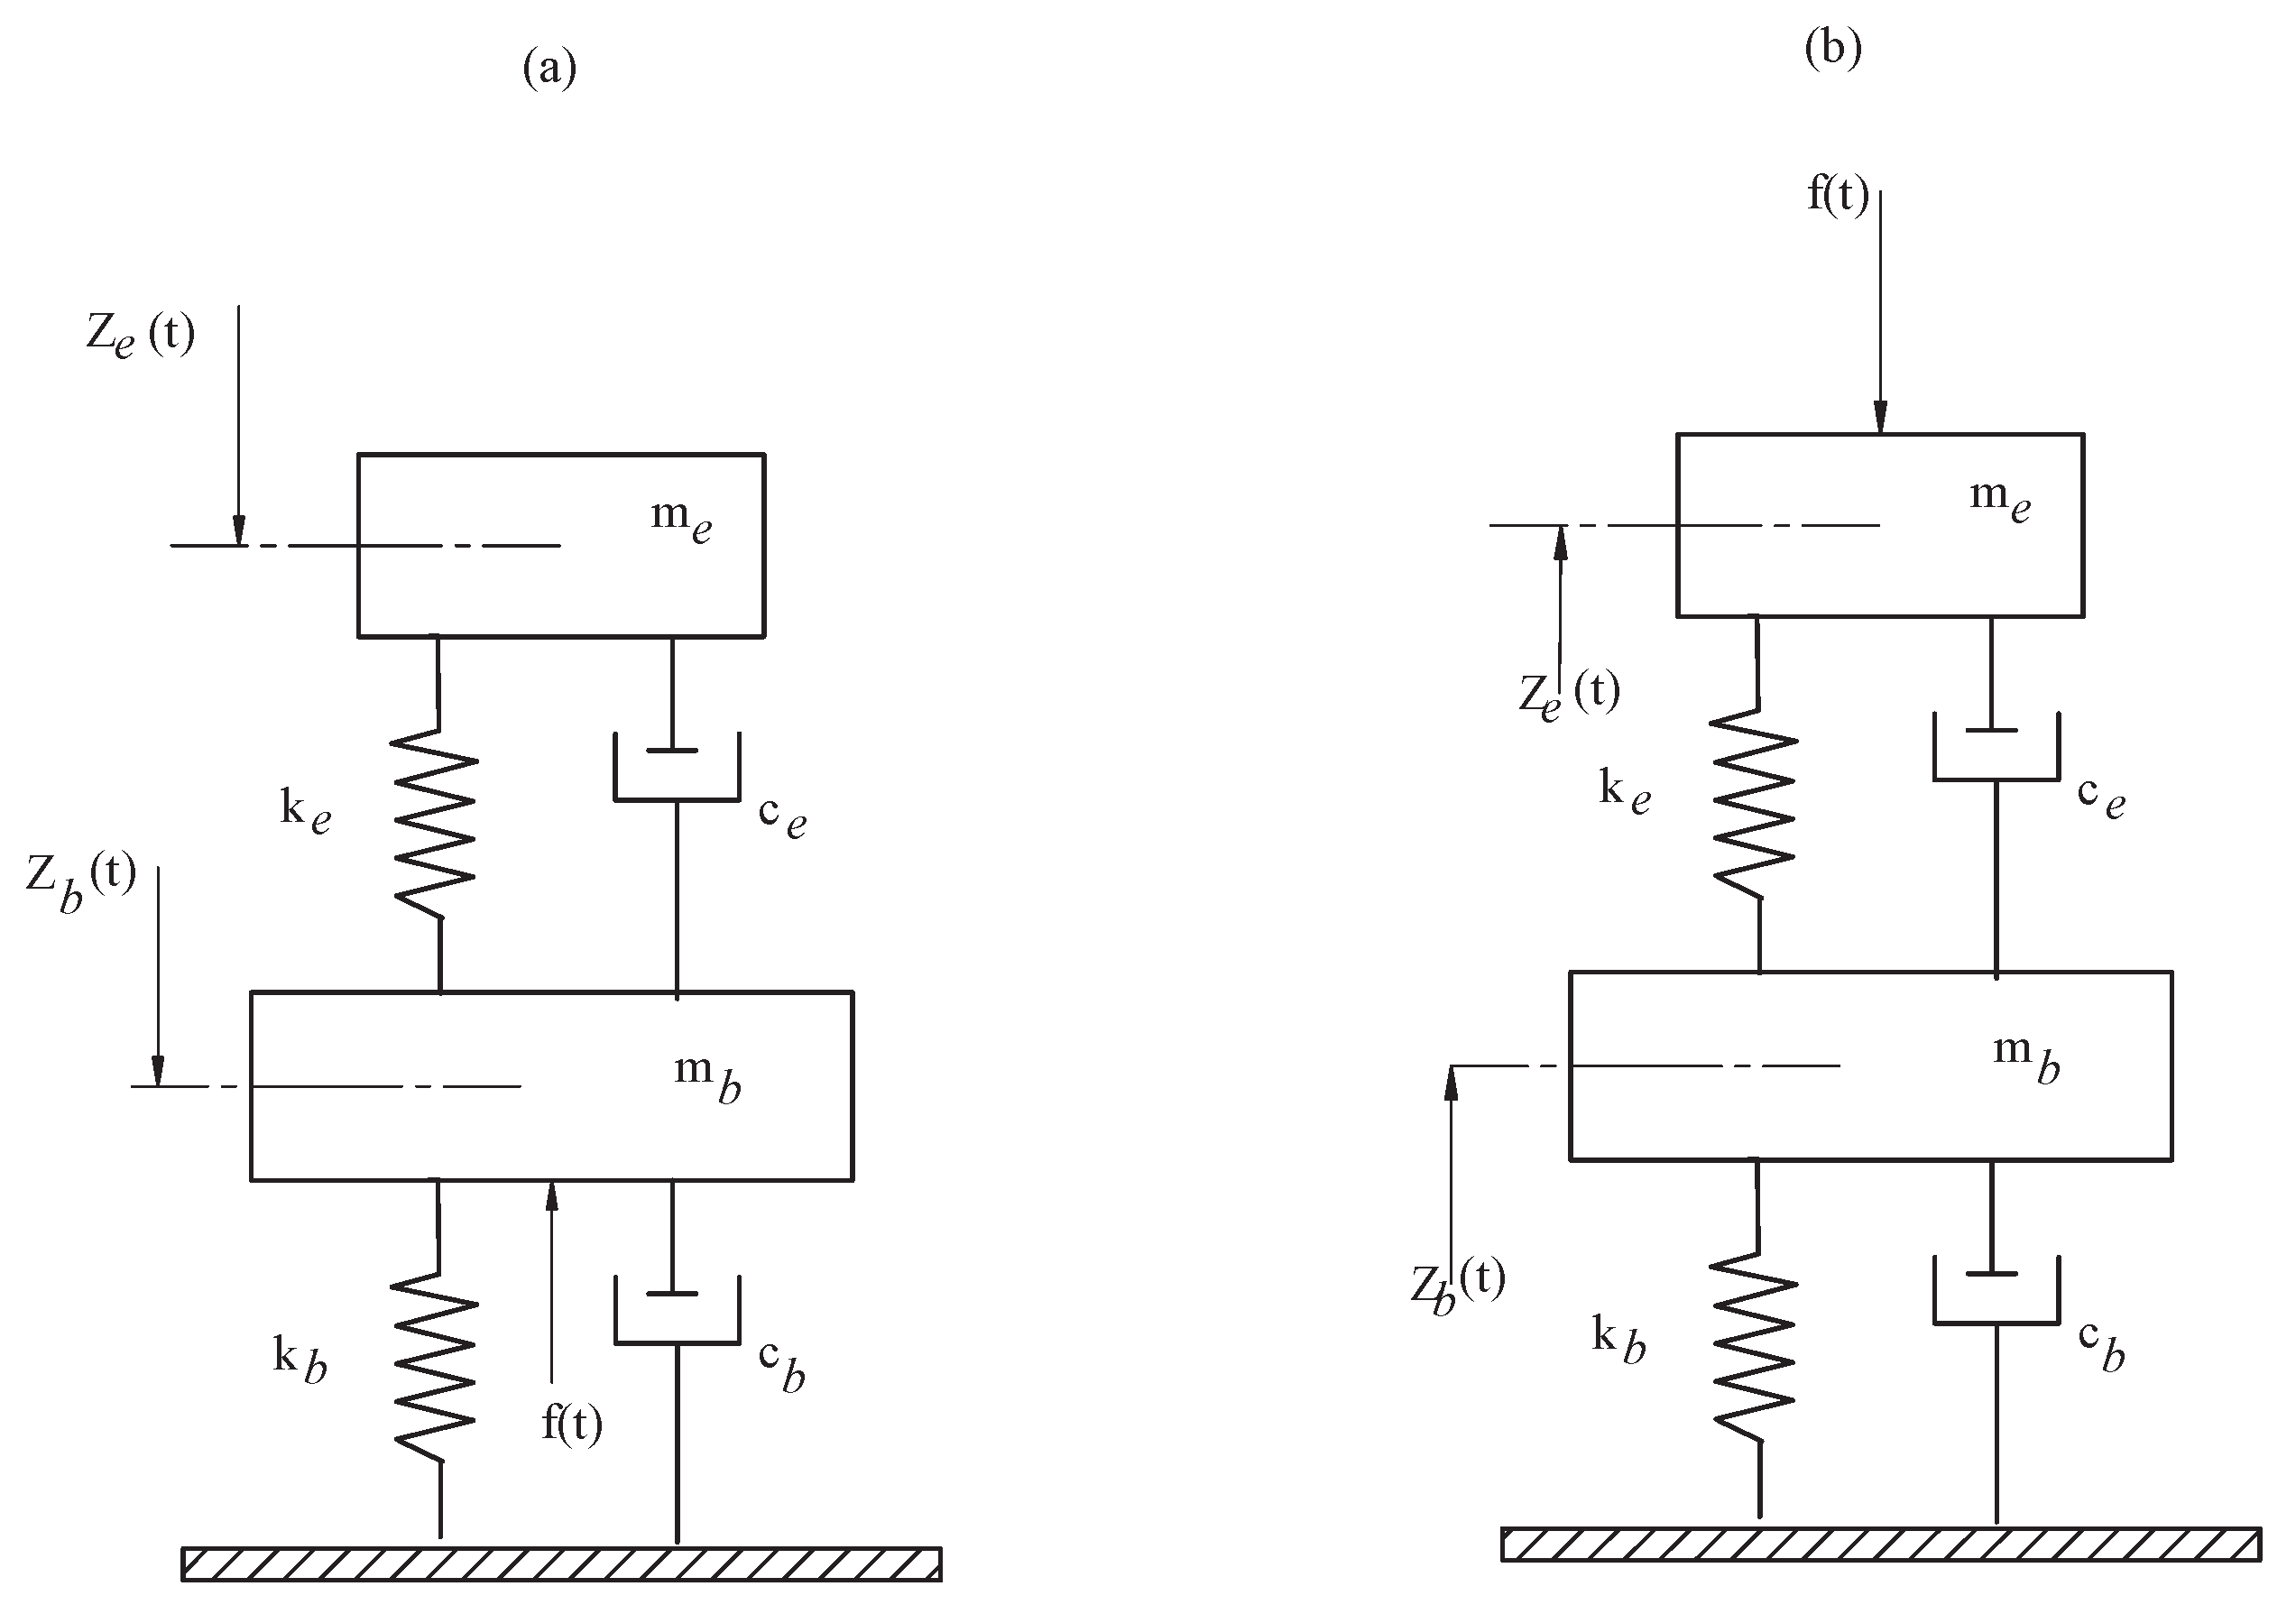
2. Description of the Mass-Elastomer System Model

The experimental study of the methodology through the application of the harmonic load and sinusoidal sweep with an agitator placed under the test rig and an unbalanced mass device placed on the system was developed, as shown in Figure 1. In experimentation, a preload on the elastomeric material of m e = 170.91 kg for both models was evaluated. The experimental methodology first used the model of a single degree of freedom with excitation at the base using a shaker, as indicated in Figure 1a, and then used a model of two degrees of freedom with the excitation force above in the mass-elastomer system, with the mass of the base m b = 393.5 kg and stiffness k b = 29.23 × 10 6 N/m, as shown in Figure 1b. The test rig was a base frame that was supported by the ground. For the estimation of the dynamic parameters of stiffness and damping factors, as the case of elastomers, the transmissibility function was used [14].
The mass-elastomer system was given an excitation due to a force f ( t ) generated by shaker or an unbalanced mass device excitation for FRF measurements, as shown in Figure 1a, and Figure 2a, respectively. In Figure 2b, for the unbalanced mass device, the approximate model of the application of the excitation force over the mass of the system (see Figure 1b) is used. The excitation force f ( t ) can be controlled using a sine sweep signal source in a signal generator expressed as [29]:
f ( t ) = m e ω s + α t 2 sin α 2 t 2 + ω s t + β
where the sweep rate α = ( ω s ω e ) / T , the start frequency ω s , and the end frequency ω e inside the time period T are time dependent, and β is a complex constant, which depends on the eigenfrequency, the sweep rate α , and the damping ζ e [18]. The effect of the initial condition β is neglected to analyze the influence of the normalized rate on the amplitude of the system response [30]. The non-dimensional sweep parameter, η s is used to quantify the deviation of the sine sweep response due to the excitation by an unbalanced mass device or shaker device and the steady-state response. For a linear sweep, the value of η s is defined as [20]
η s = α ( 2 ζ n ) 2 f n 2
The analysis and quantification of the effects for the characterization of the test rig are presented using Equations (1) and (2). The empirical model that identifies the frequency deviation during the passage of the sine sweep by the resonance concerning the system’s frequency is given by [30]:
η R = 1 + 2.057 sign ( α L ) | α L |
where α L = α / ω n 2 is the standardized sweep rate, and η R = ω m a x / ω n is the standardized parameter of the maximum peak frequency as a function of the natural frequency of the system.
For the mass-elastomer system with a damping factor, the equation of motion can be expressed as:
Z e Z b s h = k e + i ω c e k e + i ω c e ω 2 m e
where k e is the stiffness of the elastomeric material, m e is the mass of the system, and c e is the damping factor. However, when the excitation source is placed on the m e , as shown, the ratio Z e / Z b for load case B is given by:
Z b Z e = k e + i ω c e k b + k e + i ω ( c b + c e ) ω 2 m b
In Figure 1a, the mass-elastomer system can be modeled as a two-degrees-of-freedom system; then, FRF with the source of excitation under m b is developed with Equation (4). In Figure 1b, the mass-elastomer system can be modeled as a two-degrees-of-freedom system; then, FRF with the source of excitation on m e is developed with Equation (5).
For this transmissibility ratio, the following load case A is obtained [31]:
Z e Z b = 1 + 2 ζ n ω ω n 2 1 ω ω n 2 2 + 2 ζ n ω ω n 2
where the maximum peak-amplitude in the range from 1 to 51 Hz can be extracted by the ratio ω / ω n = 1 of Equation (6). The peak corresponding to the vibration mode n can be represented by three dynamic parameters, such as the frequency of the peak ω n , the width of the peak ζ e , and the level of the peak 1 / 2 ζ n [22]. The peak-amplitude method is used to experimentally find the dynamic stiffness k e and the damping coefficient c e of the mechanical system, because it assumes that the entire response can be attributed to a local mode, and that the effects due to the other modes can be ignored [32].

3. Methodology for Assessing the Dynamic Behavior of Railway Tracks

The proposed methodology intends to first assess the estimation FRF by fast sweep rates to reduce the test time but considering the lowest FRF estimation of amplitude error, for which the presence of background noise must be determined, and the best signal-to-noise ratio must be determined during tests. For this methodology, a model of two degrees of freedom was developed and solved numerically, which resembles a railway track, applying an excitation force on the upper part of the system, as shown in Figure 1b. Then, the static stiffness values of the elastomeric material must be initially known to determine the test range of the excitation parameters, such as the sweep rate and the location of the unbalanced mass of the excitation device. The static stiffness value of the elastomeric material for railway use according to its location on the track was 2.38 × 10 6 N/m [33,34,35]. The dynamic stiffness values of the test rig and the damping factor of the system were known. The background noise values were taken in the range of [10 6 –10 3 ] (m/s 2 ) 2 /Hz. Moreover, sweep rates with values between 0.5 and 5 Hz/s were used.

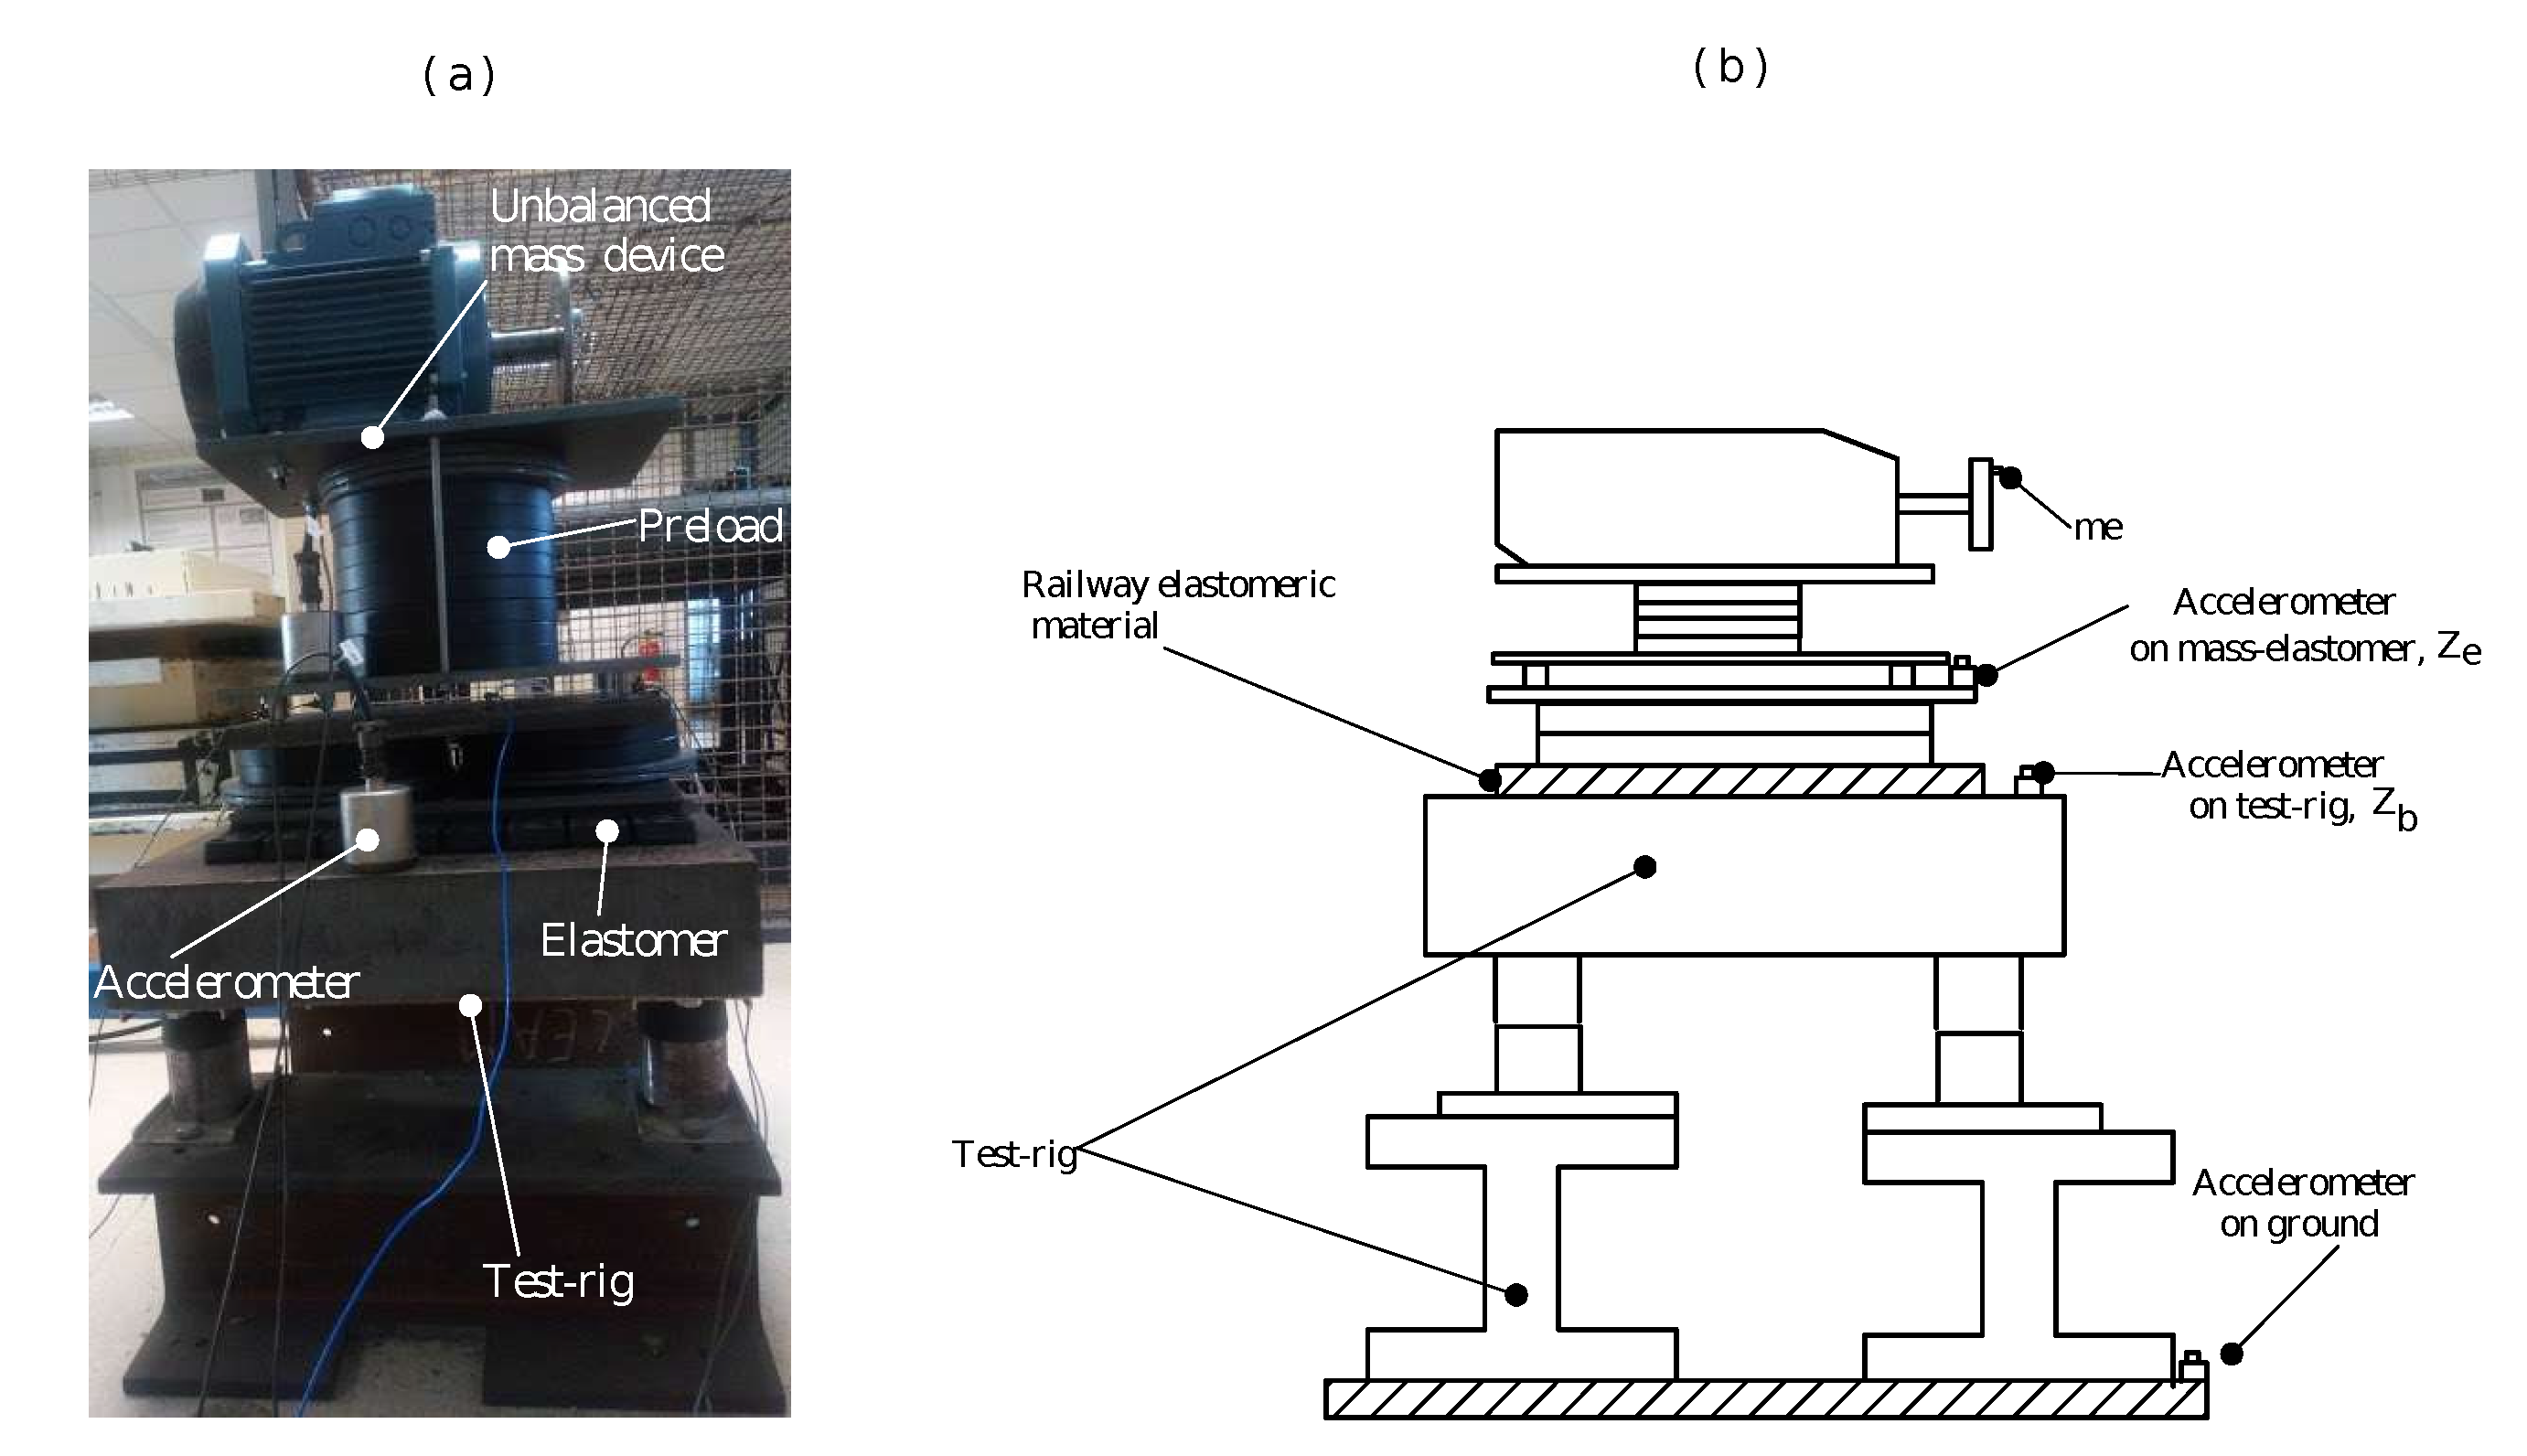
4. Experimental FRF Determination of the Mass-Elastomer System

In the case of transmissibility, the measurement excitation signals of input and output are represented as z b and z e , depending on the position of the excitation source, as shown in Figure 2. One sine sweep harmonic signal z s h a k e r ( t ) for certain excitation parameters such as the sweep rate, amplitude, and excitation time is generated, in addition to test conditions such as background noise when the excitation source is turned on [20]. The vibrations z s h a k e r ( t ) of an unbalanced mass device or shaker device on the mechanical system are produced due to the sine sweep excitation signal [36]. For the signal processing, an overlap of 50%, standardized block size of N = 1024 points, and f s = 1000 Hz were applied. The aliasing effect during the acquisition of data in measurements z b and z e was reduced by applying low-pass filtering with f s 2.56 f m a x . The sample of input and output signals were represented as z i n p u t m ( ( n 1 ) Δ t ) and z o u t p u t m ( ( n 1 ) Δ t ) , respectively, with sampling time Δ t and n representing the number of data points of blocksize n { 1 , , N } . Moreover, the signal register length T was split into M blocksizes of equal length, with m { 1 , , M } [37].
In Figure 3, measurements z b and z e were acquired using the experimentally determined parameters of the sweep rate, α , length, and T with a bandwidth from 10 to 51 Hz in testing. The signal was split into M blocksizes of equal length, and to reduce the effects of leakage, they were multiplied with the Hanning window w ( n 1 ) Δ t .
Therefore, to convert from a two-sided spectrum to a single-sided spectrum, a factor 2 / f s was incorporated with the unit ( m / s 2 ) 2 [14]. The T ^ e b ( i ω ) estimated of the mass-elastomer system was acquired by
T ^ e b ( ω ) = S ^ Z e Z b ( ω ) S ^ Z b Z b ( ω )
where S ^ Z e Z b ( ω ) is the cross-power spectrum between Z b ( ω ) and Z e ( ω ) , and S ^ Z b Z b ( ω ) is the power spectrum of Z b ( ω ) . The T ^ e b is assumed as a normally distributed asymptotically circular complex; thus, the signal of the response, z ˜ b ( t ) , with background noise, η z b and η z e , is given by [38]
z ˜ b ( t ) = z b ( t ) + ε s h a p e 100 · σ 2 ( z b ) ( t ) · N D
where ε s h a p e is the shape error of the FRF obtained with background noise added to the response signal z ˜ b ( t ) in the time domain, σ 2 ( z b ) ( t ) is the signal power spectral density, and N D is a normally distributed random function [39]. The noise additions were calculated using Equation (8).

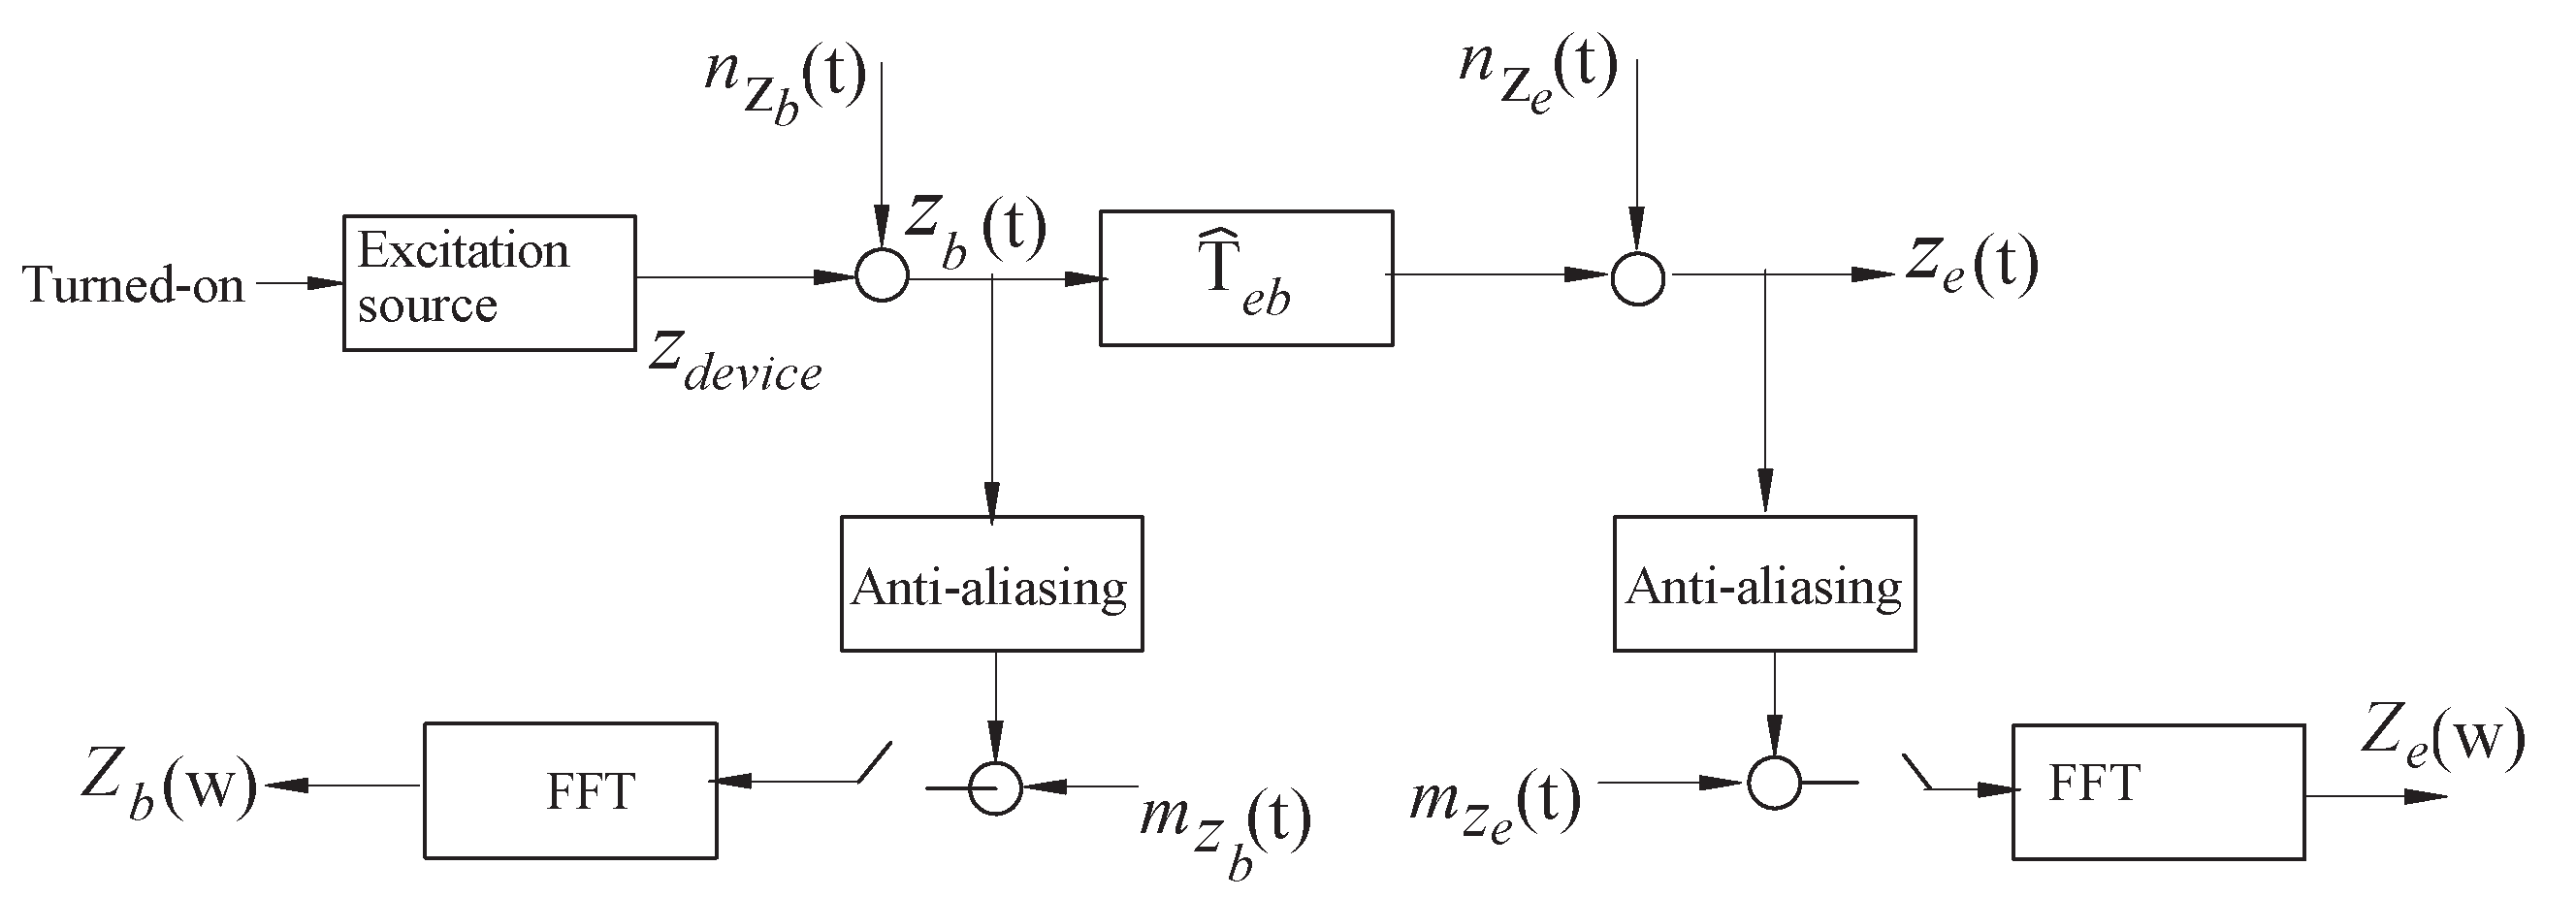
The Input Excitation Analysis Method

To accurately estimate the FRF, the presence of background noise was needed to acquire accurate measurements with enough spectral power input, using a source of excitation external to the system. The experimentally determined parameters that produced the best signal-to-noise ratio were [12]
S N R p = 10 log 10 100 · σ 2 ( z b ) ( t ) ε s h a p e · σ 2 ( z b ) ( t )
Equation (9) was applied to generate the noise sequence whose power is a percentage % of the signal power that gives the SNR. Then, the background noise was added to the original signal z b ( t ) using Equation (8). The p spectral power density S ^ Z b Z b p of the input excitation is dependent on the sweep rate, amplitude, and signal time due to the unbalanced mass device.

5. Experimental Results

An elastomeric material 400 mm in length and 400 mm in wide with 18 mm thickness was selected as the test object for this experimental investigation. The elastomeric material was placed on a steel base 500 mm in length and 500 mm wide with a thickness of 100 mm, defined as a test rig supported by the ground, as shown in Figure 2a. A preload mass of 170.91 kg was mounted on the elastomeric material that included 21 kg of the unbalanced mass device used for the experimental estimation of the transmissibility T ^ e b of the mass-elastomer system. For this, a sinusoidal excitation at specific frequencies and sine sweep were applied under the base of the test rig using an electromagnetic shaker (Br u ¨   &   Kjaer , type: 4825), and the maximum force of 200 N is presented in Figure 1a.
Moreover, the unbalanced mass device placed on the mass-elastomer system with a control system (ABB, type: ACS401000532) was used for the estimation of T ^ e b transmissibility. In addition, a linear sine sweep was carried out between 1 and 51 Hz with three sweep rates α , and a disc with respect to the axis of rotation of the device had three positions e 1 , e 2 , and e 3 in which the mass m of 0.10 kg that would generate the imbalance was placed, as shown in Figure 1b. The excitation device had four force transducers (Br u ¨   &   Kjaer , type: 8230-003) with a sensitivity between 0.2275 and 0.2829 mV/N located in the supports of its base, as shown in Figure 2a. Three piezoelectric accelerometers (PCB, type: 393B31) with a sensitivity range of 1.025–1.046 V/ms 2 were located on the ground, in the test rig, and on the system; see Figure 2b. For the acquisition of the excitation signals, an analyzer (LMS spectral testing Pimento) with a bandwidth of 40 kHz and 24 channels was used.
In this section, the sequence of experimental tests with the results of different experimental parameters and test conditions, as well as the validation of the methodology to evaluate the dynamic behavior of structural systems based on accurate measurements, are shown below:
  • Apply the peak-amplitude method to determine the transmissibility curve.
    • Specific frequencies by shaker.
    • Sine sweep by shaker.
  • Maximum amplitude frequency estimation.
    • Numerical analysis of the standardized parameters α L and η R .
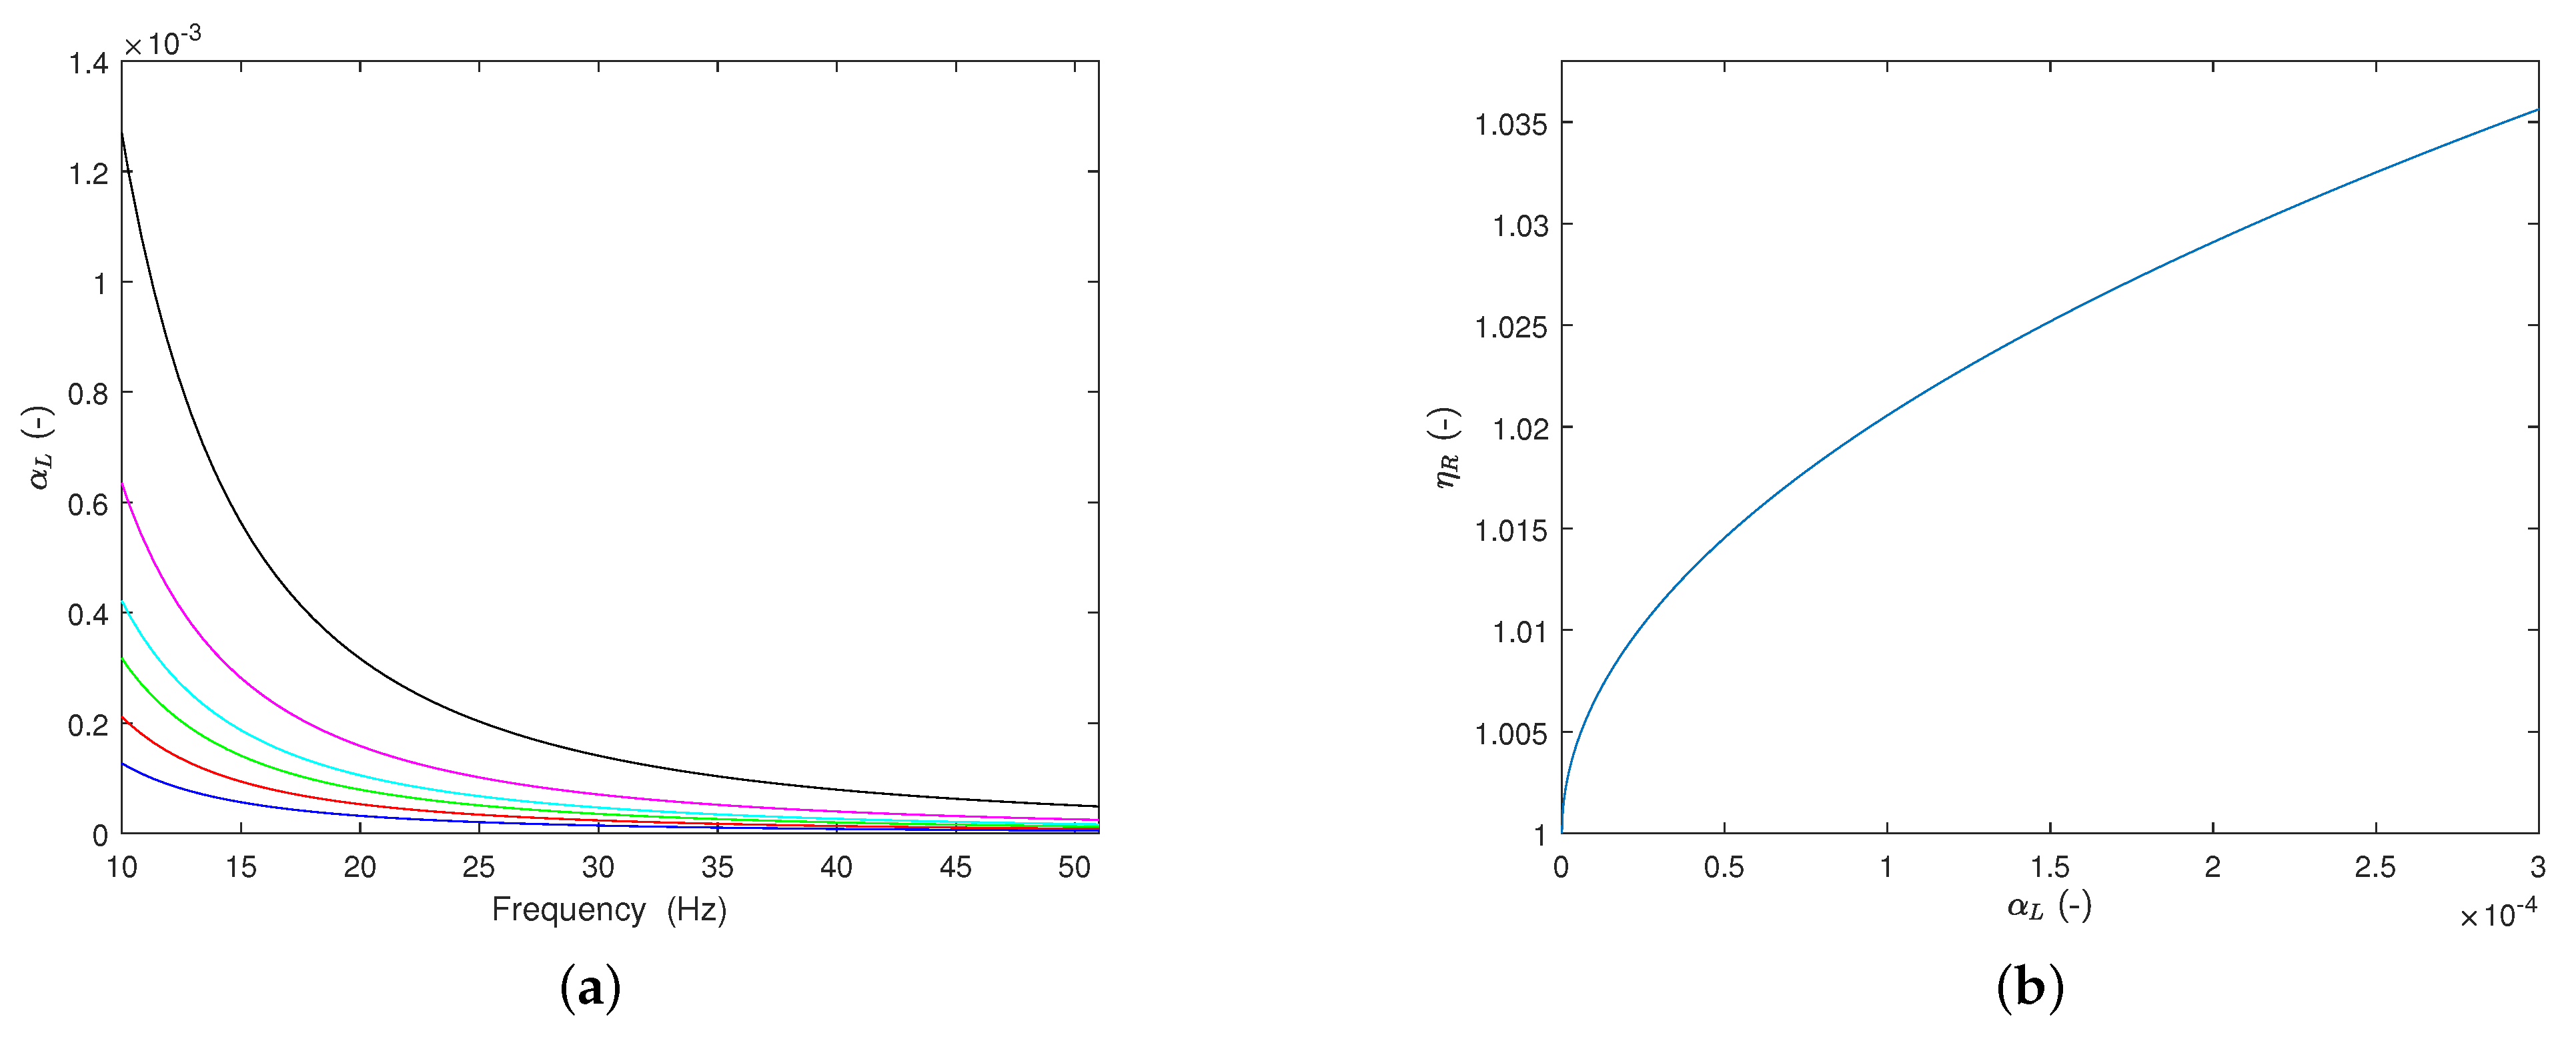
    • Development of an approximate curve that relates ω m a x to the maximum amplitude of the vibratory response.
  • Use the SNR for estimate transmissibility by the unbalanced mass device.
    • Apply the spectral analysis method for the measurements of the input and output signals.
    • Define the signal-to-noise ratio for different excitation parameters.
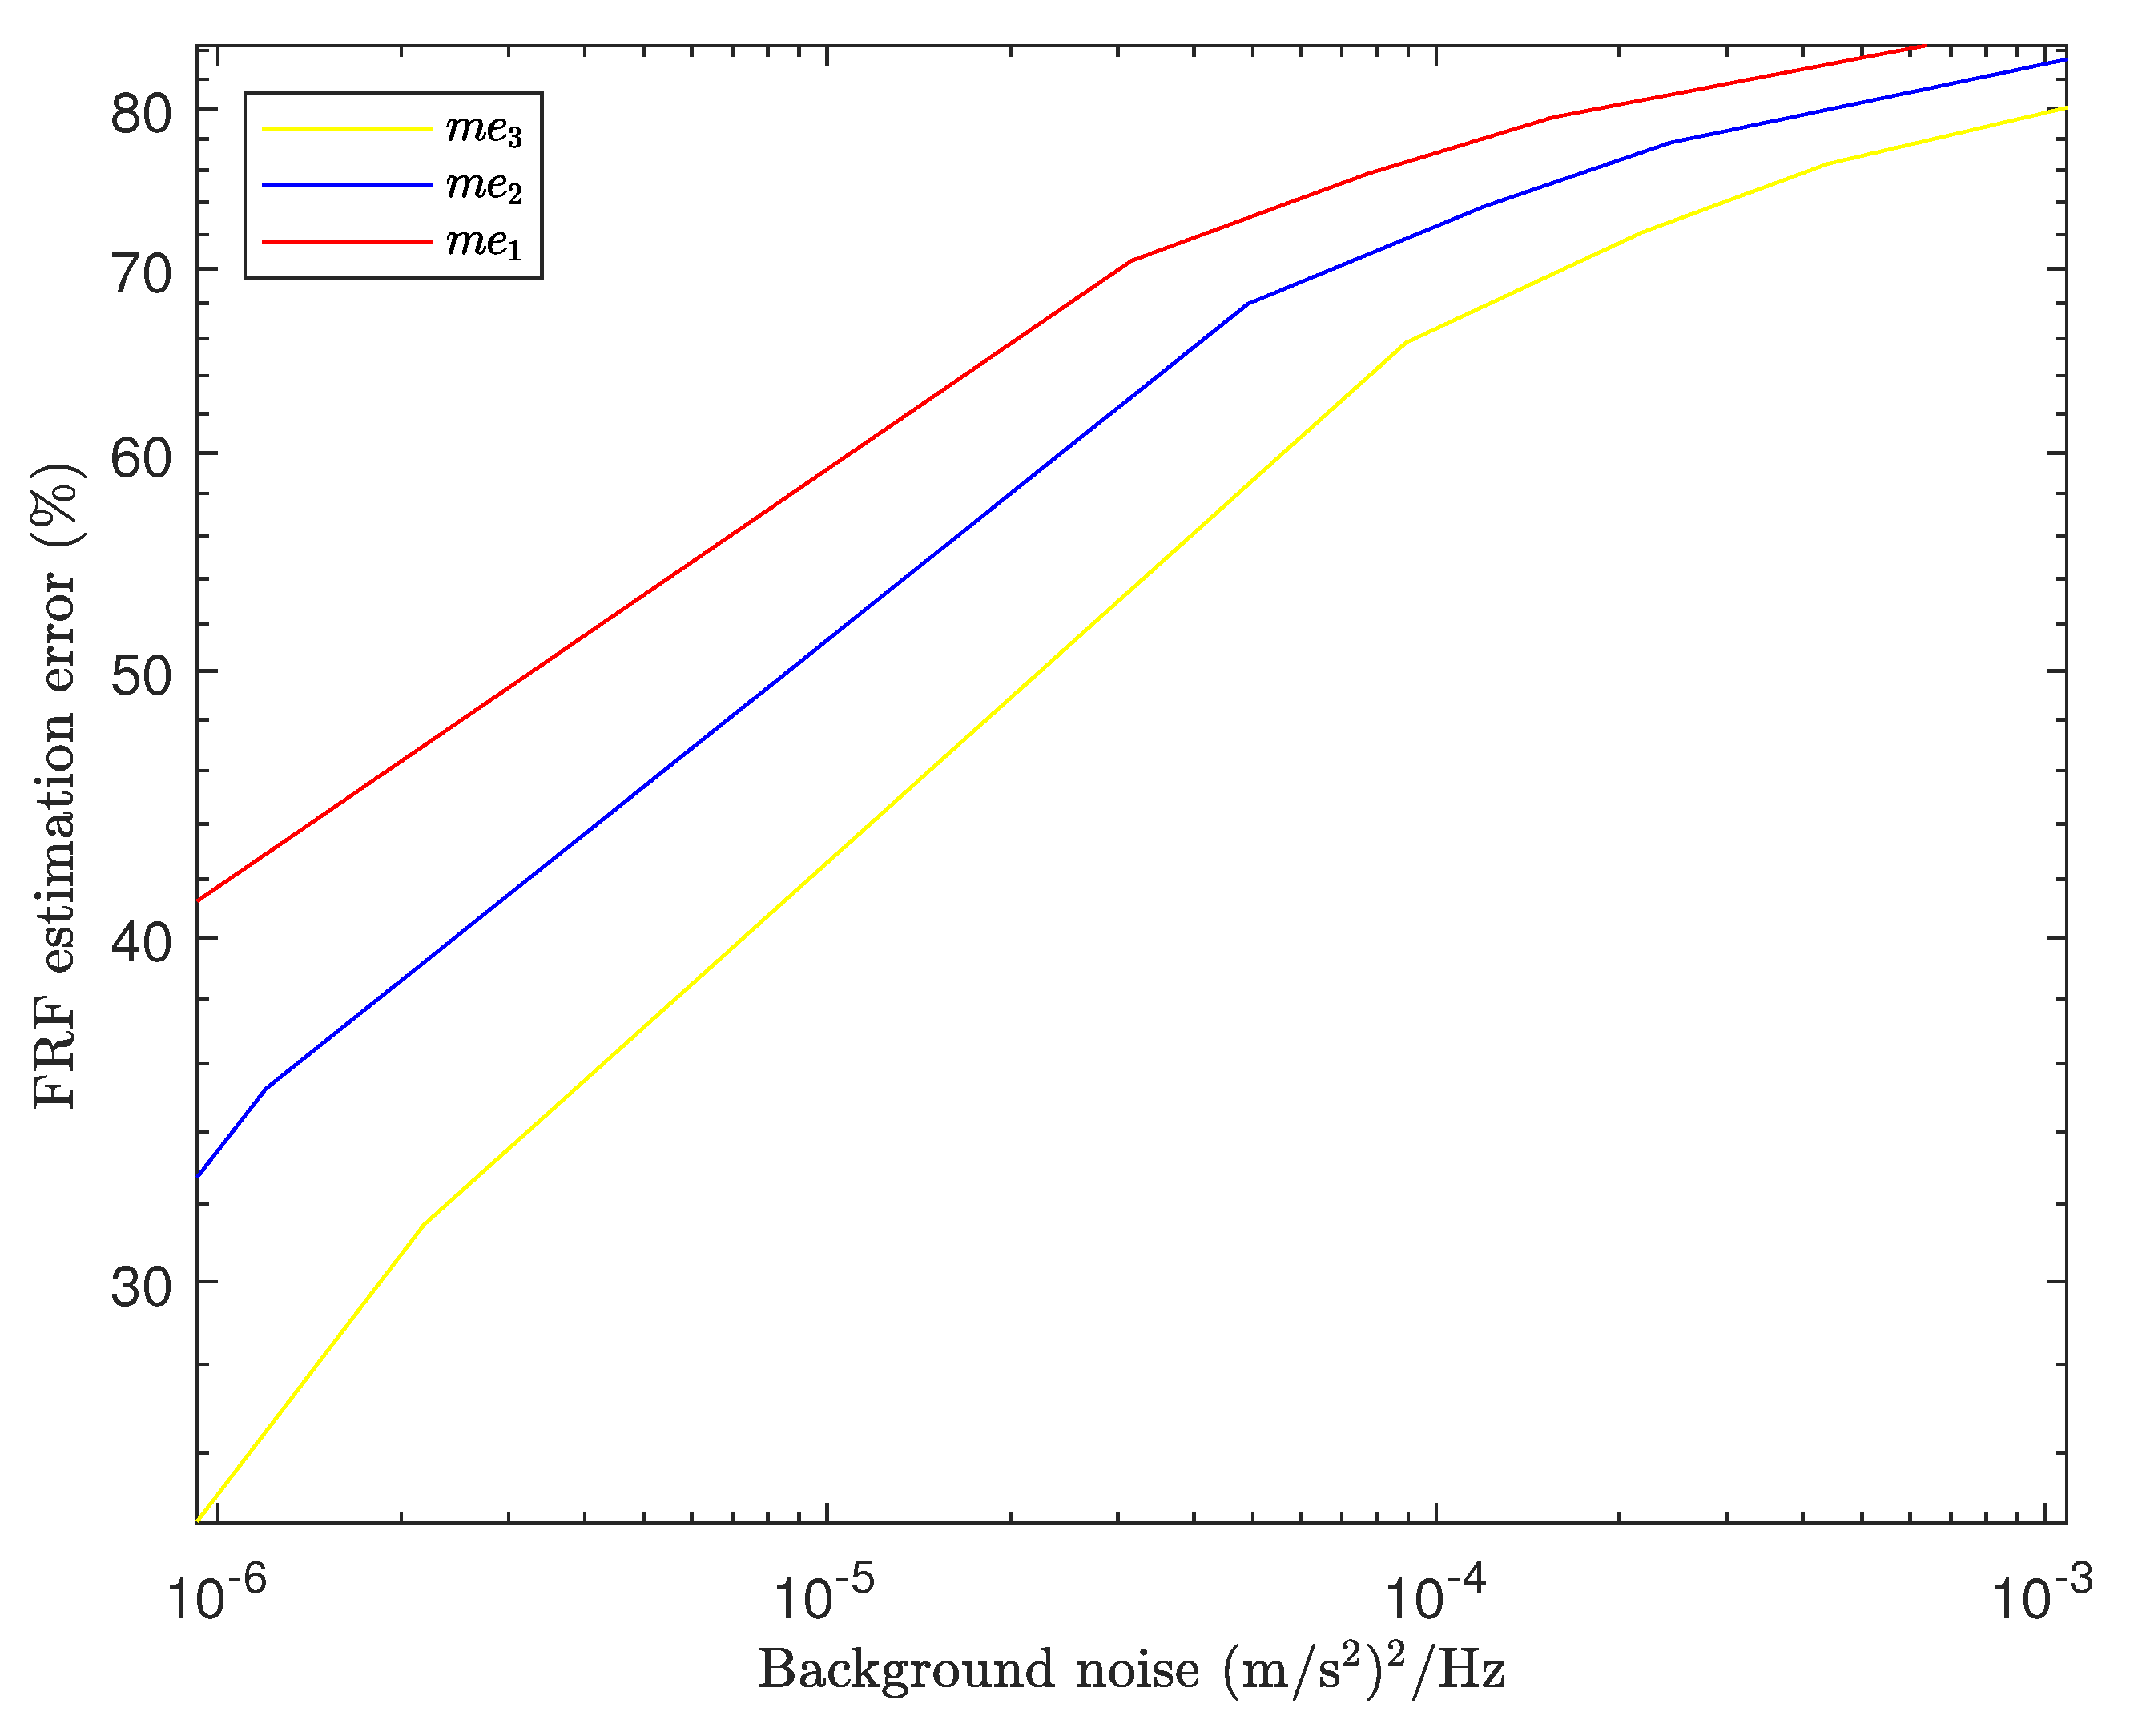
    • Find the error, ε , to estimate the transmissibility, T ^ e b based on the SNR due to background noise.
  • Determine the excitation parameters of the unbalanced mass sweep rate α , unbalanced mass me, and excitation frequency ω m a x of the mass-elastomer system.
    • Define η R , the standardized parameter of the maximum peak frequency as a function of the natural frequency of the system.
    • Determine the stiffness, k e , of the railway elastomeric component and its damping factor, ζ e , to validate the methodology.

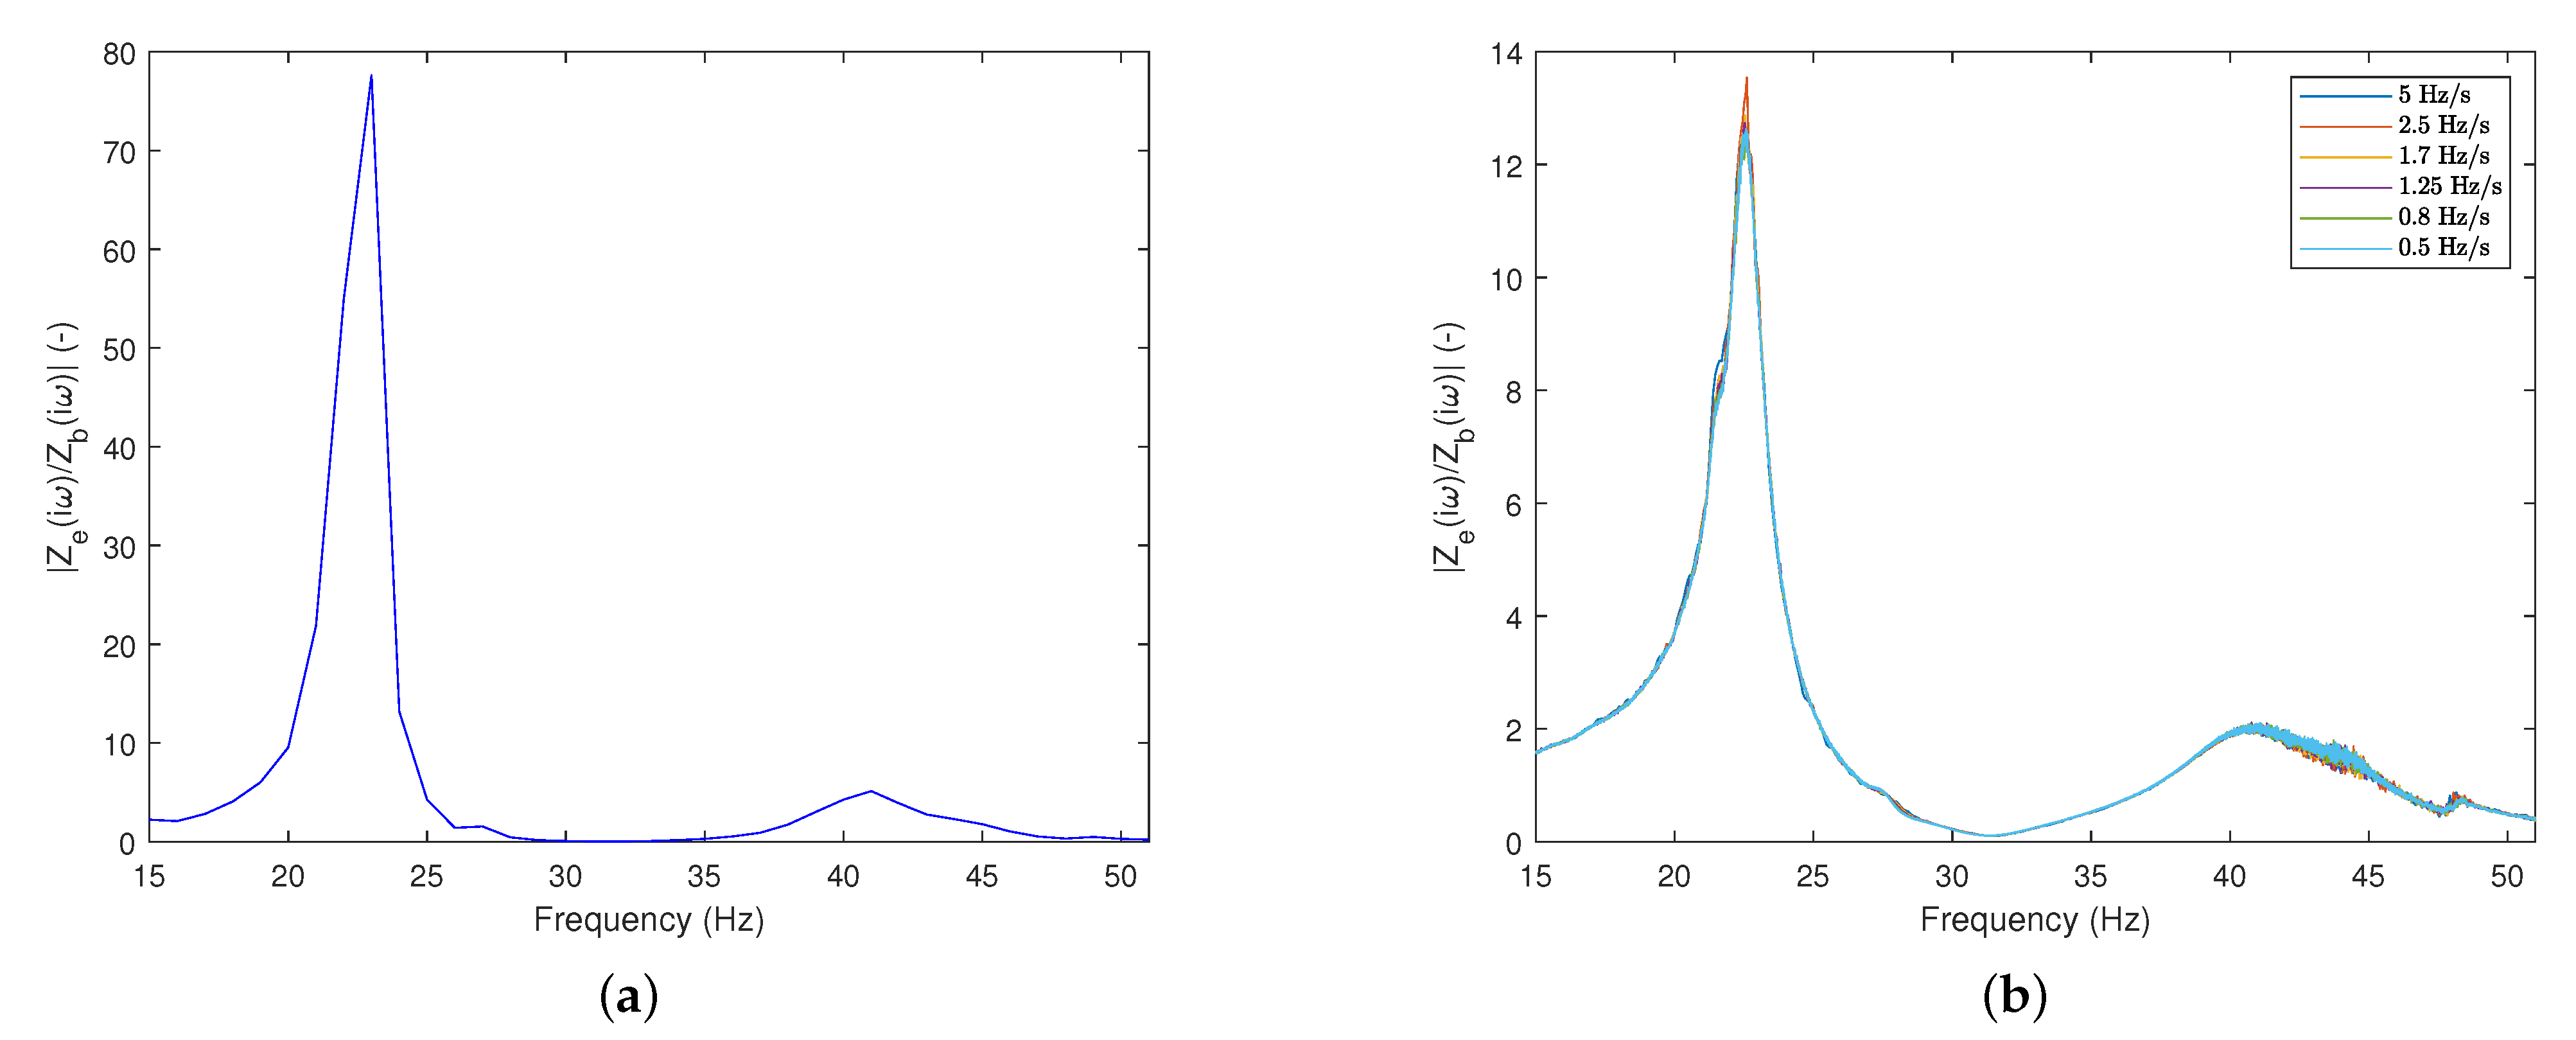
5.1. Apply Peak-Amplitude Method to Determine the Transmissibility Curve

For this experiment, the transmissibility ratio T ^ e b of the mass-elastomer system was found. A shaker device B & K type 4825 was turned on to excite the base with specific sine harmonic excitation between 1 Hz and 50 Hz in steps of 1 Hz, as shown in Figure 1a. The sampling signal at 1 kHz was chosen because it was the closest sampling value to the vibration analyzer software. The signal for 10 s with a resolution 0.1 Hz was collected. A 24-bit ADC with a blocksize of 10,000 sampling points was chosen. Each blocksize was filtered using a Hanning window.
In Figure 4a, the experimental frequency-to-frequency transmissibility curve has been drawn in steps of 1 Hz in the frequency range of 10 to 51 Hz. The maximum peak corresponding to the resonant frequency at 23 Hz with an amplitude at 8.81, c e = 1731.8 N·s/m, and the damping factor ζ e < 0.06 was obtained by Equation (6). Moreover, with the mass of 170.91 kg placed in the elastomeric material the stiffness was at 3.57 × 10 6 N/m. Additionally, six transmissibility curves were obtained at different sine sweep rates, as shown in Figure 4b; the transmissibility ratio at 12.63, the peak amplitude corresponding to the sweep rate of 0.5 Hz/s, and resonance frequency at 22.57 Hz were chosen. With a mass load of 170.91 kg, the estimated stiffness at 3.45 × 10 6 N/m was obtained. The error due to the difference in the frequencies obtained with frequency-to-frequency excitation was around 3.35% using the sine sweep. A response distortion was presented by the sine sweep; therefore, the modal parameters identified from the response were also perturbed [20]. The experimental methodology is evaluated based on the criteria of the ISO 10846 standard for the dynamic characterization of elastomeric materials used in railway applications and determined only the transmissibility function. Therefore, we do not consider the phase-angle information [40].

5.2. Maximum Amplitude Frequency Estimation

In this investigation, an approximate curve that relates ω m a x , at which the maximum amplitude of the vibratory response occurs with the normalized rate of the excitation α L , was obtained from Equation (3), as shown in Figure 4b The normalized values of the sweep rate, α L , of the experimental sweep sine test at different rates were obtained using a shaker with base excitation, as shown in Figure 5a. Thus, knowing the value of ω m a x and the value of the α rate applied in the sine sweep, it was possible to determine a range for the real value of the natural frequency through the proposed model, as shown in Figure 5b. In Figure 5a, the numerical values of the standardized sweep rate of the range between 1.67 × 10 5 and 1.19 × 10 3 obtained from the α L = α / ω n 2 were determined. In addition, the values of the standardized maximum frequency, η R , between 1.002 and 1.035, were developed by applying Equation (3), as shown in Figure 5b.

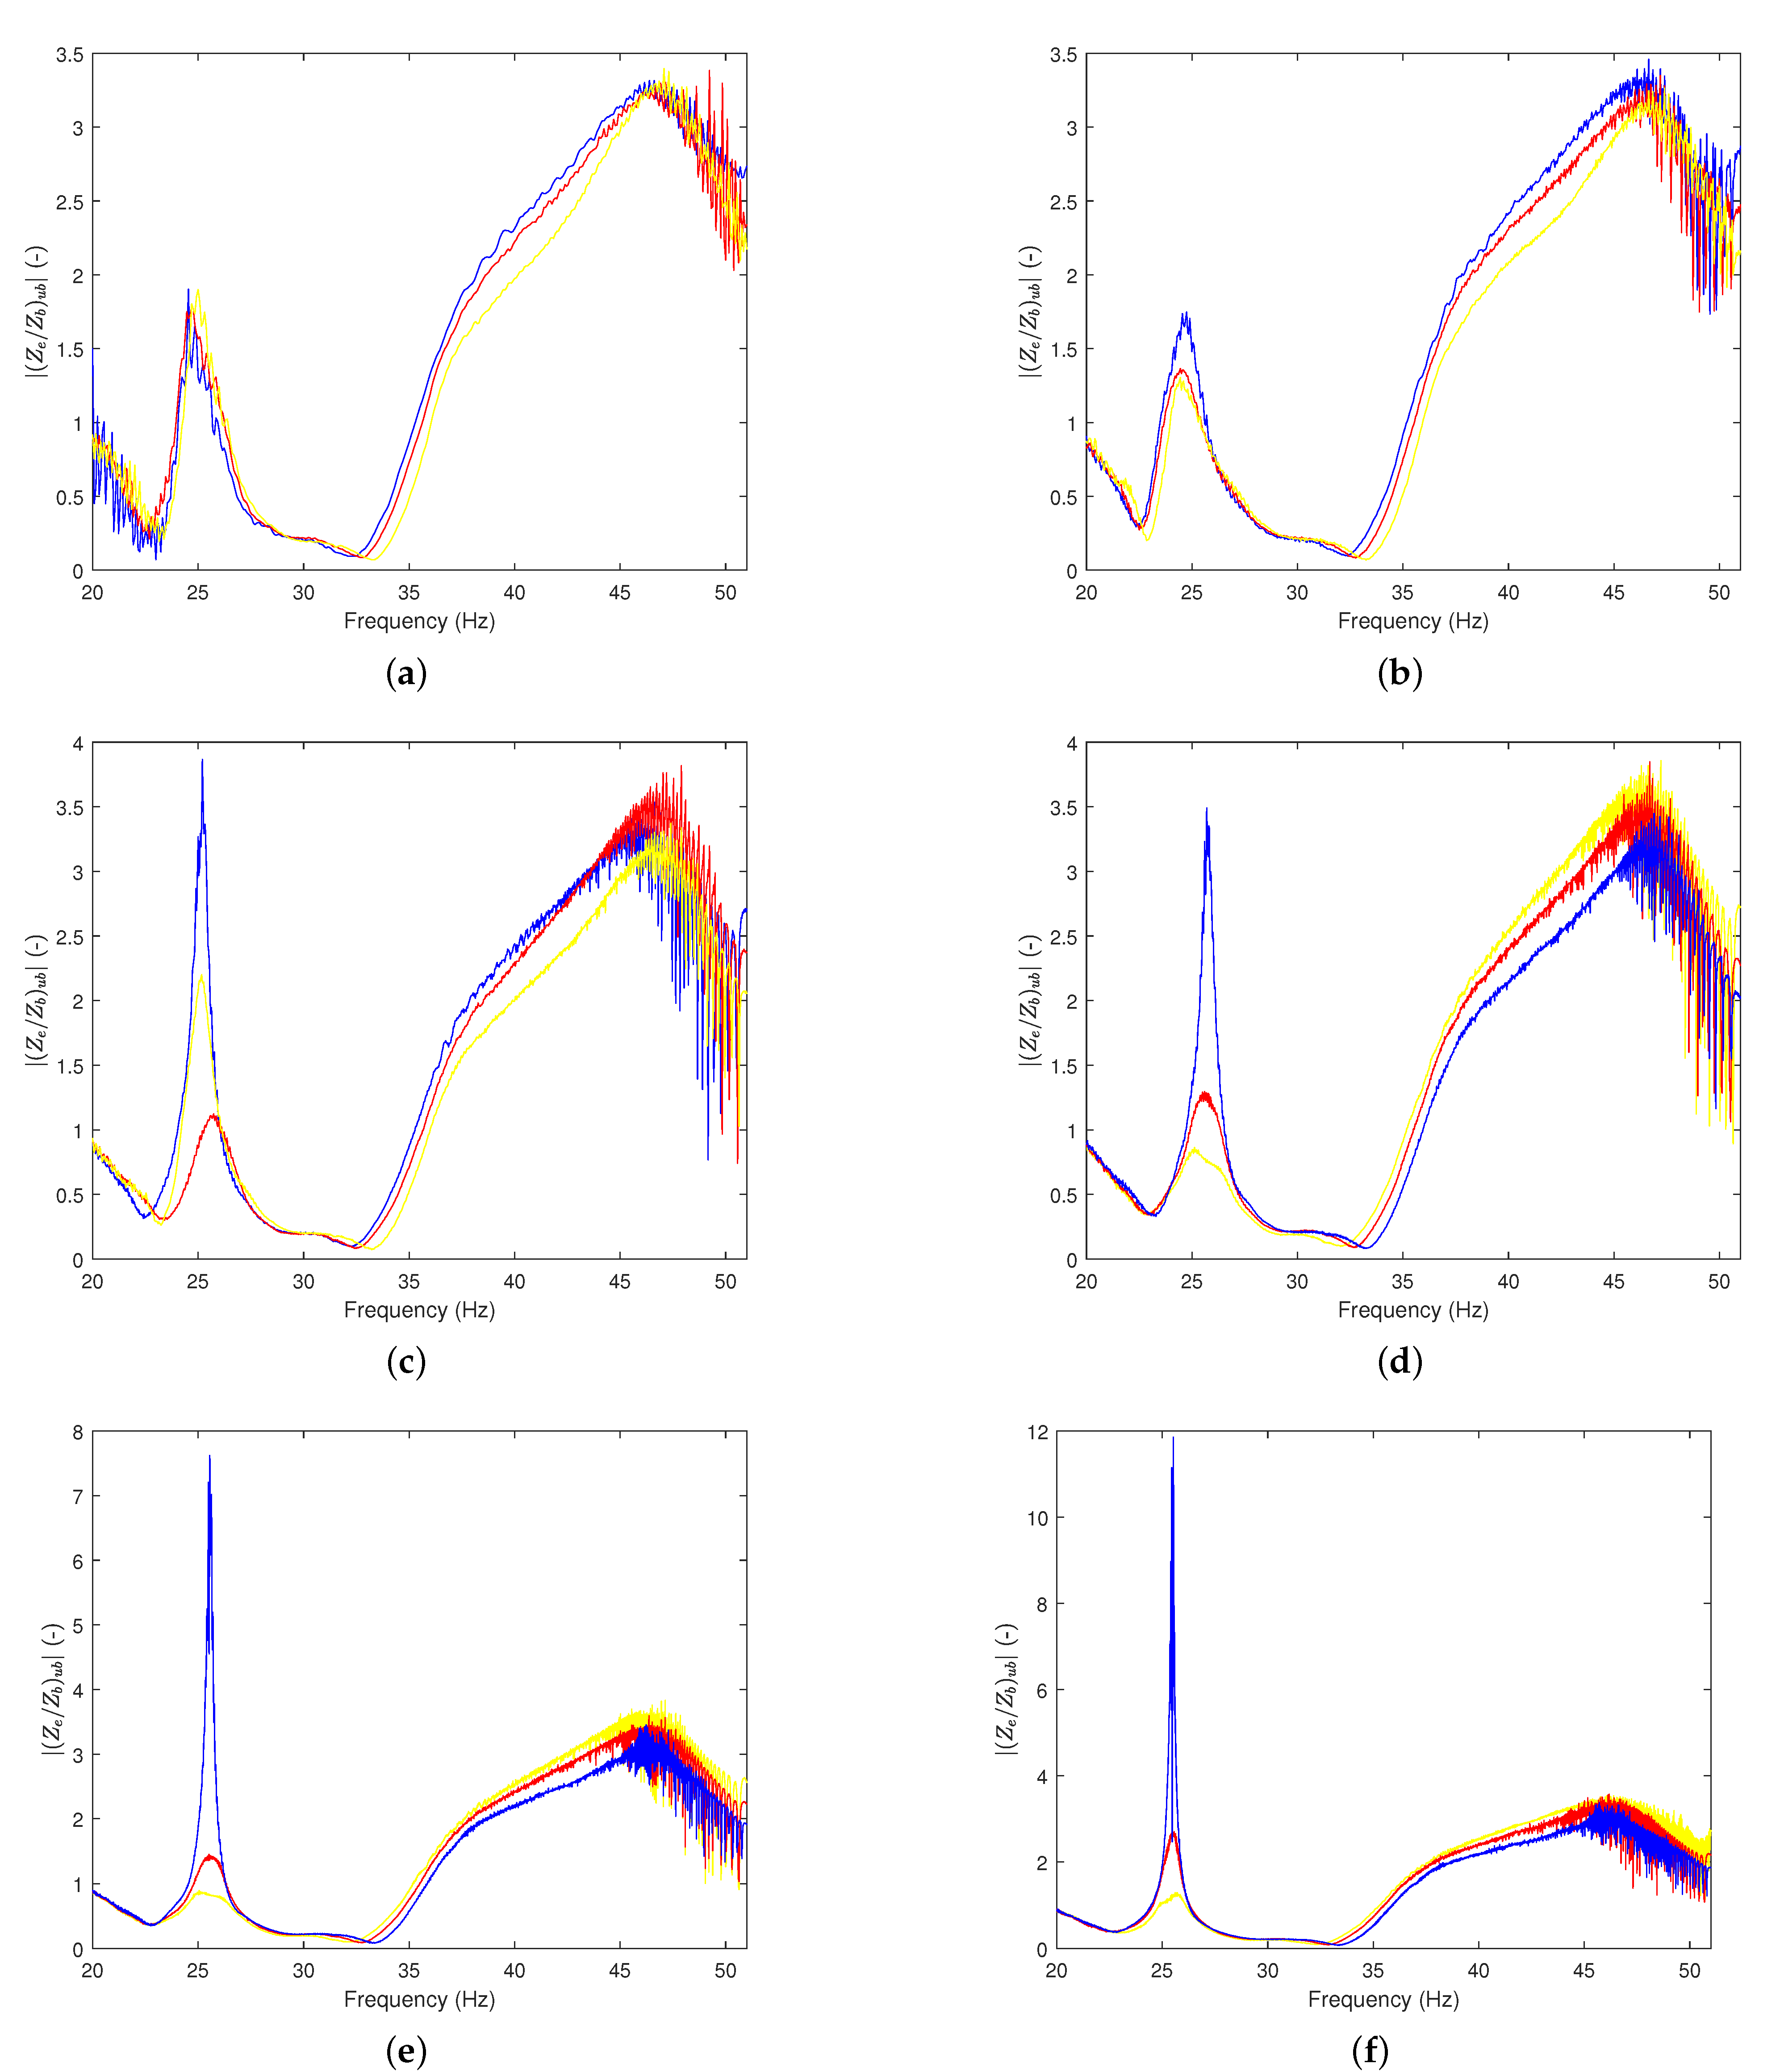
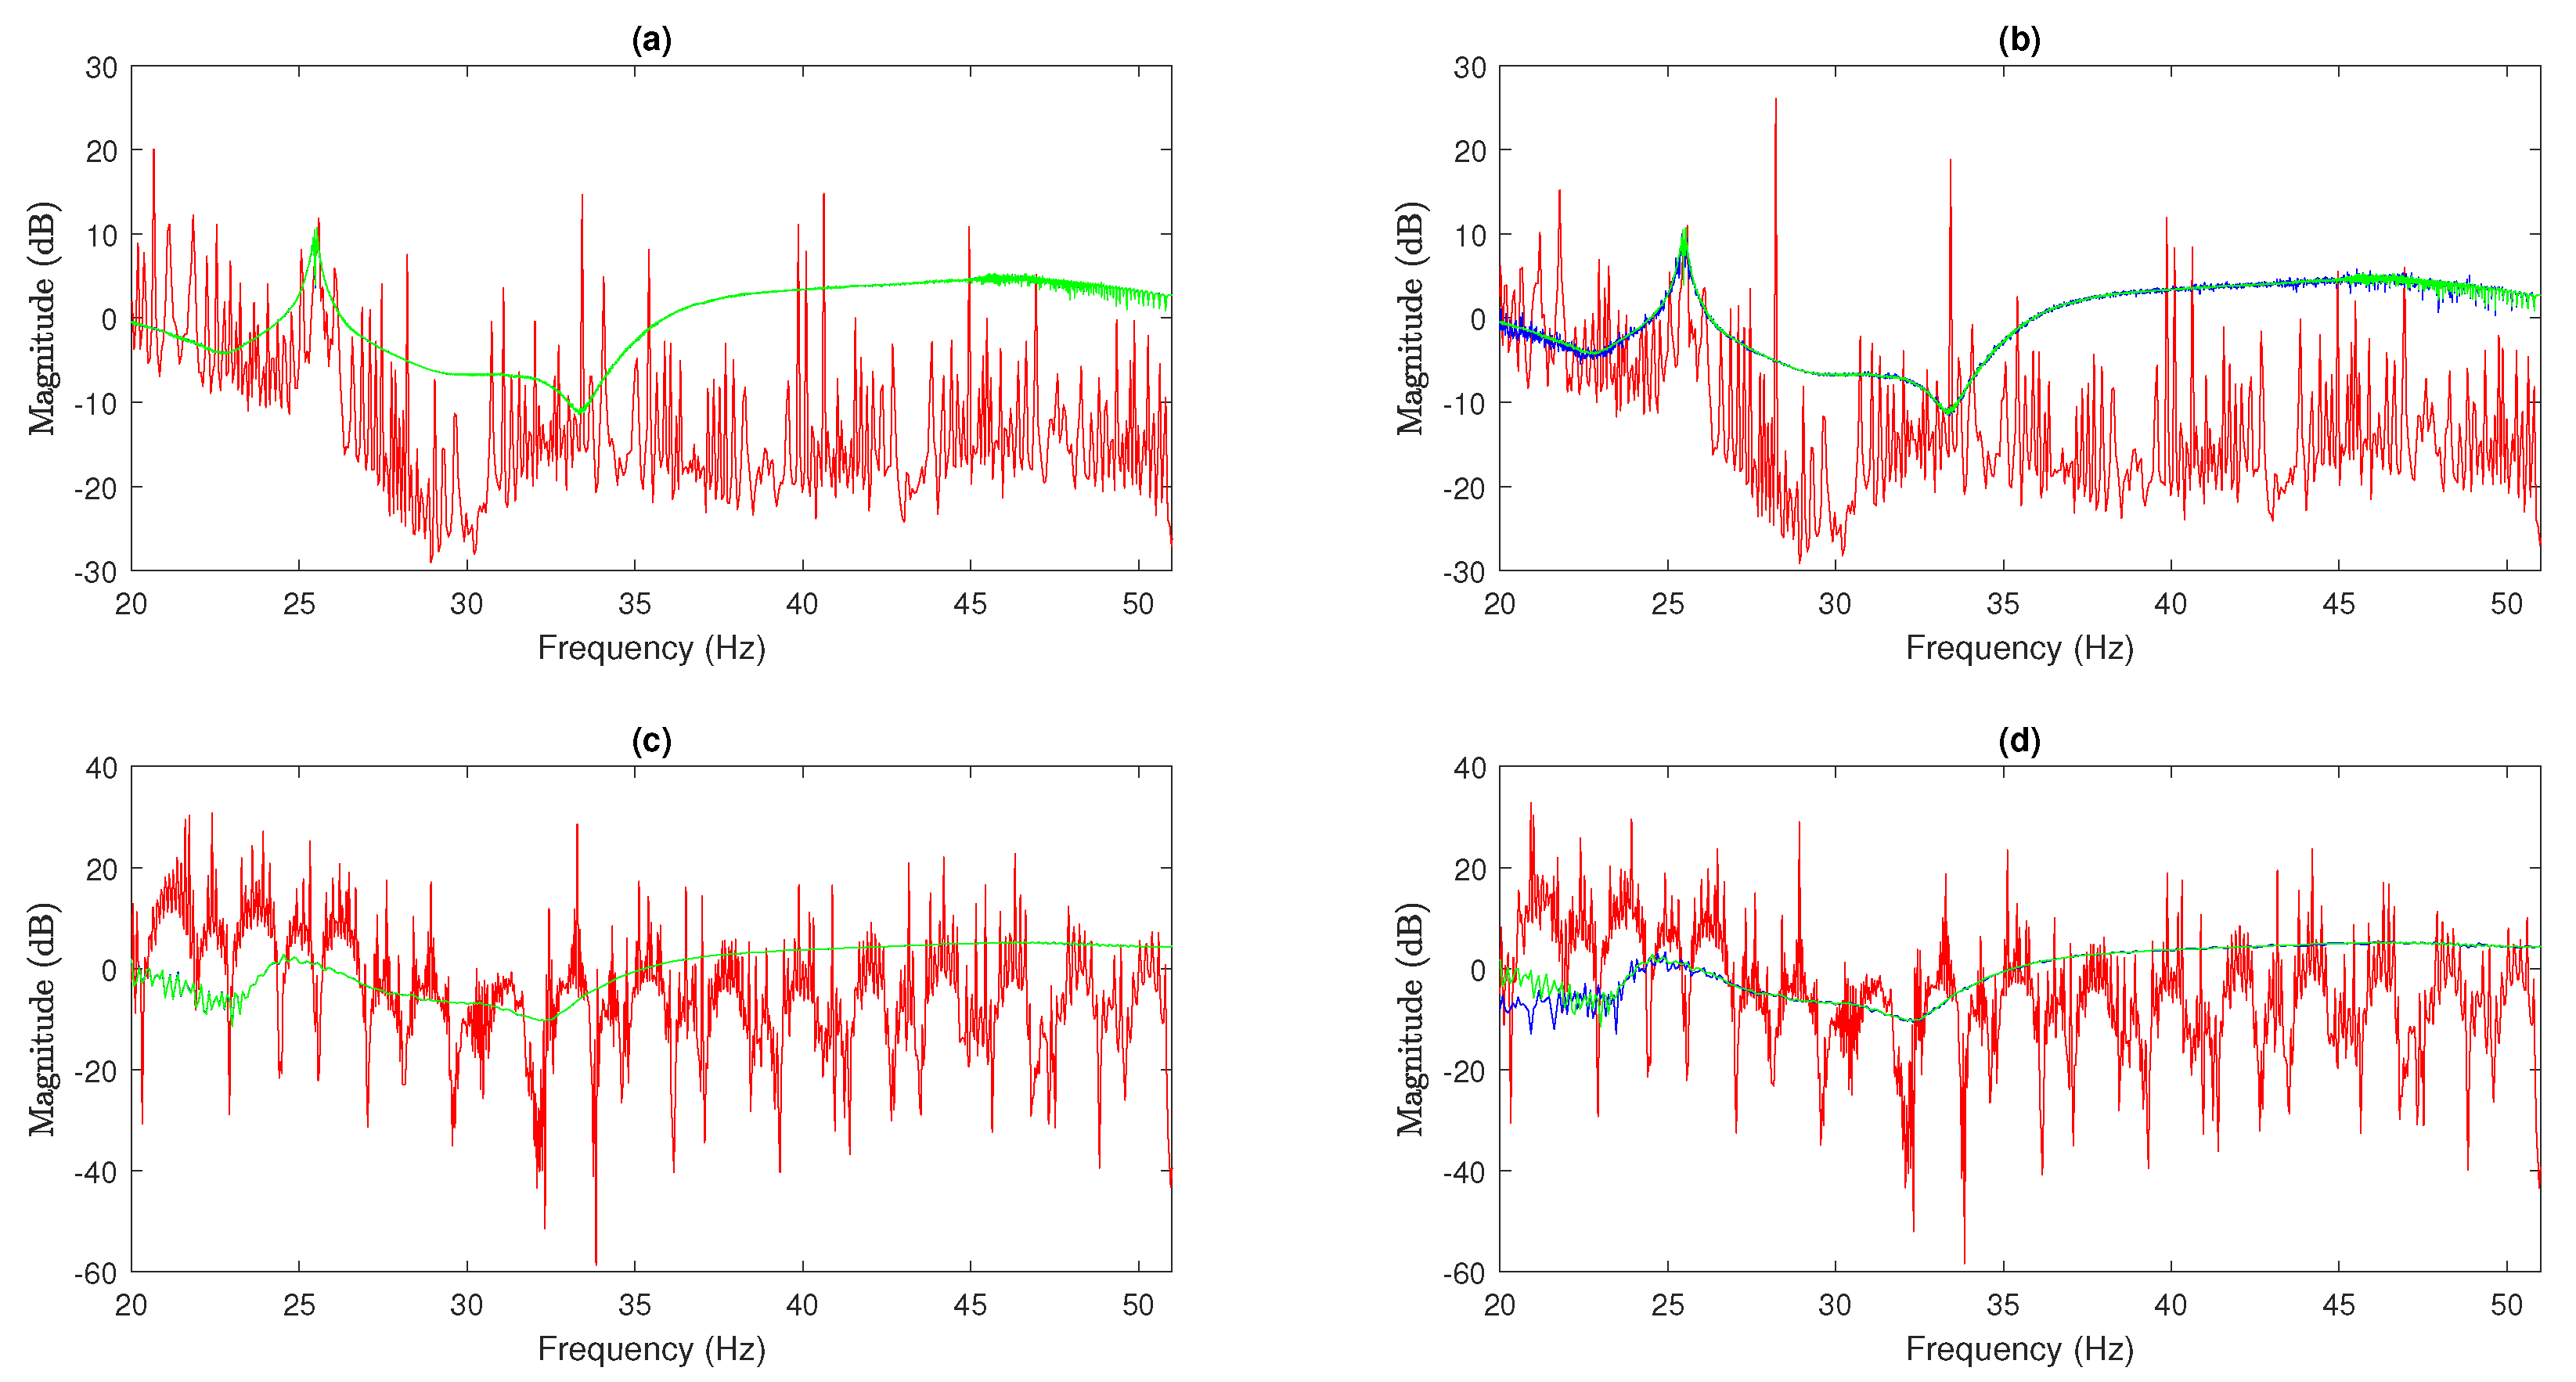
5.3. Use the SNR to Estimate Transmissibility by the Unbalanced Mass Device

The proposed test to estimate the transmissibility T ^ e b was developed using the exciter device for three unbalanced masses me and six sweep rates α placed on the mass-elastomer system with a mass of 70.74 kg, as shown in Figure 2. With each unbalanced mass of 0.25 × 10 2 kgm, 0.45 × 10 2 kgm, and 0.65 × 10 2 kgm, the amplitude T ^ e b decreased due to the location of the mass of 0.10 kg at each position of the rotating disc of the device, different sweep rates between 0.5 and 5 Hz/s, and without background noise, as shown in Figure 6. Moreover, the maximum peak frequency from 25.55 Hz to 24.54 Hz decreased due to distortion, as shown in Section 2. Therefore, the best measurements that minimized the distortion of the maximum peak to extract the dynamic parameters of the mass-elastomer system k e , damping factor ζ e , and frequency of resonance ω r during the sine sweep for the bandwidth 10–51 Hz were chosen. The sweep parameter η s , for the measurements of the input Z e ( ω ) and output Z b ( ω ) signals of the system, according to the excitation parameters of me, α , and bandwidth Δ ω , satisfied the steady-state condition when η s < 0.1 [20] was obtained by Equation (2). Moreover, the sweep parameters η s for different excitation conditions me, α , and ω r are shown in Table 1. The small value η s = 0.043 of the sweep response level was very close to steady state; so the unbalanced mass 0.65 × 10 2 kgm, sweep rate 0.5 Hz/s, and bandwidth at low frequencies 10–51 Hz were chosen to obtain accurate measurements of excitation of the system, as shown in Figure 2.
The measurements of the response signal of the mass-elastomer system for each unbalanced mass me and sweep rate α of the signal-to-noise ratio 0–30 dB were obtained by adding background noise from Equation (9). The estimated transmissibility for the unbalanced mass excitation parameter me 3 , for the best steady-state condition η s < 0.1 , sine sweep rates of 0.5 Hz/s and 5 Hz/s were chosen, and background noise to the response signal Z b was added between 0 dB and 30 dB, as shown in Figure 7, where the maximum peak amplitude error to estimate the transmissibility with sine sweep without background noise and with background noise was calculated. Moreover, operating Equation (7), the estimated transmissibility was obtained using the method of spectral analysis. In Figure 7a, the comparative transmissibility (signal with background noise results) with the error of 1%, slower sweep rate of 0.5 Hz/s, and the best SNR, 30 dB, shows the maximum peak shape was observed more clearly between 23 Hz and 25 Hz. In Figure 7b, the comparative transmissibility error of 20%, with a poor SNR, 0 dB, and slower sweep rate, 0.5 Hz/s, was proof of the effect of background noise on the bandwidth between 10 and 25 Hz. Moreover, for the highest sine sweep rate of 5 Hz/s and the best SNR of 30 dB, there was attenuation of the maximum peak in the range from 20 to 30 Hz with an error of less than 6% of the FRF without background noise, as shown in Figure 7c. For a poor SNR of 0 dB and the highest sine sweep rate of 5 Hz/s, an error increase close to 200% was evidenced due to the attenuation of the maximum peak of the FRF in the range from 20 to 25 Hz, as shown in Figure 7d.
The processing of the measurements experimentally in the laboratory with background noise, as without background noise, was carried out for the calculation of the PSD (power spectral density) by the Hanning window and 50% overlap. In Figure 8, the increase in background noise, evidenced by different parameters of sweep rate excitation and the unbalanced mass device disc location, caused an increase in the FRF estimation error. Thus, the mean amplitude errors of the T ^ e b without background noise and with background noise were obtained.
The fundamental frequency with the presence of background noise is around 25 Hz for the different excitation conditions. This indicates that the excitation force of the unbalanced mass device and low scan rates using FFT processing affect the obtaining of reliable measurements with the presence of background noise, as shown in Figure 7. In addition, the methodology presented is for the characterization of railway components in the laboratory under controlled conditions, applying the ISO 10846 and 7626 standards for the vertical direction, thus avoiding the use of multi-degrees of freedom. Additionally, a sinusoidal load applied to the centroid of the base is used to avoid chaotic motion, as was rightly pointed out. Therefore, we designed the spectral analysis to correctly apply the FFT.
In the validation of the results of the dynamic parameters of the elastomeric material, the shaker and the unbalanced mass device were used in order to find its stiffness, k e , and frequency with the maximum peak amplitude method, for which the sweep rate of 0.5 Hz/s and unbalanced mass me 3 were chosen due to the η s < 0.1 value, as shown in Table 1. It was also evident that, for these conditions of excitation, the mean amplitude error in the estimate of T ^ e b for background noise values <10 6 ( m / s 2 ) 2 / Hz was less than 5%, as shown in Figure 8; thus, the experimentally developed curves can ensure that the measurements have the best SNR as the PSD varies due to the increase in the unbalancing mass.
The input signal was designed based on the presence of noise and the best signal-to-noise ratio was obtained for the unbalanced mass device with the lowest FRF estimation error at low sweep rates between 0.5 Hz/s and 0.83 Hz/s, with which a movement in stable state would be obtained, as shown in Figure 9. The unbalanced masses contribute to the estimation error of the FRF that the greater the unbalanced mass, the lower the estimation error is obtained with respect to the presence of noise of background, as shown in Figure 8.
The results of the dynamic stiffness k e obtained during excitation at specific frequencies for a preload mass of 170.91 kg were 3.57 × 10 6 N/m, and with sine sweeps at different sweep rates, α i were between 3.40 × 10 6 and 3.44 × 10 6 N/m corresponding to an error of 4.8% using the shaker, as shown in Figure 9, respectively.
The validated methodology can be especially useful when elastomeric material characterization is performed in highly noisy laboratories. This methodology could also be extended to characterization procedures that consider operating conditions, such as in situ experimental tests.
Therefore, the determination of the stiffness throughout a certain frequency range can be carried out with a couple of tests. This simplifies the laboratory procedures significantly, and will allow accurate estimation of the dynamic stiffness uncertainty not to be impossible.
Moreover, the results of the dynamic stiffness during the sine sweep with the unbalanced mass device and the preload mass of 170.91 kg were obtained according to the best excitation conditions shown in Section 5.3. So, the dynamic stiffness corresponding to 3.61 × 10 6 N/m and a damping factor ζ e < 0.06 were chosen. The dynamic stiffness error due to the sweep sine was 1.12% by the unbalanced mass device and, at specific frequencies, was 5.8% by the shaker excitation. Therefore, the elastomeric material was characterized by the excitation parameters shown in Section 5.1 and Section 5.3, and also by applying the sine sweep to obtain the dynamic transmissibility of the mass-elastomer system, as shown in Figure 1b.

6. Conclusions

Measurements at specific frequencies, at different sweep rates, and in different unbalance conditions were performed to validate the experimental methodology developed in the laboratory. Moreover, the effect of the sine sweep rate was verified due to distortion of the resonance peak by the different laboratory tests. Additionally, the error in the estimation of the dynamic parameters of the elastomeric material was obtained by the different excitation tests. Based on the results obtained, the following conclusions can be drawn.
(1)
In the test with the unbalanced mass device, a better signal-to-noise ratio and slower sweep rate can effectively improve the estimate of transmissibility. The FRF estimation error decreased as the signal-to-noise ratio increased. The location of the unbalanced mass in the largest position of the rotating disc of the unbalanced mass device showed a decrease in the FRF estimation error.
(2)
In the laboratory test, different background noise conditions demonstrated the dependence on the sweep rate to achieve the best steady-state condition using the unbalanced mass device.
(3)
By obtaining the stiffness of the elastomeric material, the damping factor using the shaker with frequency–frequency excitation, and sine sweep, as well as the unbalanced mass device, the background noise effects of the FRF were experimentally validated.
(4)
The methodology was validated in the laboratory with the characterization of the elastomeric material for railway applications to determine the dynamic parameters of stiffness k e and damping factor ζ e using the unbalanced mass device.
(5)
The methodology is useful for reducing setup time in cases where several different samples need to be tested, such as quality control tests in the manufacturing process.

Author Contributions

Conceptualization, methodology, and formal analysis, S.R., C.A., D.V., I.Z., W.V. and C.V.; resources, S.R.; data curation, S.R.; writing—original draft preparation, S.R. and C.A.; writing—review and editing, S.R., C.A., I.Z., D.V., W.V., V.O. and C.V.; software, S.R.; investigation, S.R.; project administration, S.R. and C.A.; visualization, S.R.; supervision, C.V. All authors have read and agreed to the published version of the manuscript.

Funding

This research received no external funding.

Acknowledgments

The authors appreciate the support provided by Escuela Politécnica Nacional EPN-Ecuador for the development of the unfunded internal project: PII-DIM-2022-01. The authors are grateful to the multidisciplinary research groups of the Escuela Politécnica Nacional EPN-Ecuador, with their lines of research: “Sustainable Production in Manufacturing Processes” and “Mitigation of Vibrations and Energy Efficiency of Automotive, Railway and Aeronautical Transport Systems”, for the assistance received.

Conflicts of Interest

The authors declare no conflict of interest.

Abbreviations

The following abbreviations are used in this manuscript:
FRFFrequency Response Functions
PSDPower Spectral Density
SNRSignal-to-Noise Ratio

References

  1. Shi, J.; Wen, S.; Zhao, X.; Wu, G. Sustainable development of urban rail transit networks: A vulnerability perspective. Sustainability 2019, 11, 1335. [Google Scholar] [CrossRef] [Green Version]
  2. Reina, S.; Arcos, R.; Clot, A.; Romeu, J. An Efficient Experimental Methodology for the Assessment of the Dynamic Behaviour of Resilient Elements. Materials 2020, 13, 2889. [Google Scholar] [CrossRef]
  3. Zbiciak, A.; Kraśkiewicz, C.; Oleksiewicz, W.; Lipko, C. Viscoelastic dynamic models of resilient elements used in railway tracks. MATEC Web Conf. 2016, 86, 01015. [Google Scholar] [CrossRef] [Green Version]
  4. Oregui, M.; Molodova, M.; Núñez, A.; Dollevoet, R.; Li, Z. Experimental investigation into the condition of insulated rail joints by impact excitation. Exp. Mech. 2015, 55, 1597–1612. [Google Scholar] [CrossRef] [Green Version]
  5. Oregui, M.; Li, Z.; Dollevoet, R. An investigation into the modeling of railway fastening. Int. J. Mech. Sci. 2015, 92, 1–11. [Google Scholar] [CrossRef]
  6. Arlaud, E.; D’Aguiar, S.C.; Balmes, E. Receptance of railway tracks at low frequency: Numerical and experimental approaches. Transp. Geotech. 2016, 9, 1–16. [Google Scholar] [CrossRef]
  7. Zhao, Y.; Li, X.; Lv, Q.; Jiao, H.; Xiao, X.; Jin, X. Measuring, modelling and optimising an embedded rail track. Appl. Acoust. 2017, 116, 70–81. [Google Scholar] [CrossRef]
  8. ISO 7626-2; Mechanical Vibration and Shock. Experimental Determination of Mechanical Mobility. Part 2: Measurements Using Single Point Traslation Excitation with an Attached Vibration Exciter. ISO: Geneva, Switzerland, 2015.
  9. Ding, D.; Liu, W.; Li, K.; Sun, X.; Liu, W. Low frequency vibration tests on a floating slab track in an underground laboratory. J. Zhejiang Univ.-Sci. A 2011, 12, 345–359. [Google Scholar] [CrossRef]
  10. Yaroshevich, N.; Zabrodets, I.; Yaroshevich, T. Dynamics of Starting of Vibrating Machines with Unbalanced Vibroexciters on Solid Body with Flat Vibrations. Appl. Mech. Mater. 2016, 849, 36–45. [Google Scholar] [CrossRef]
  11. Wang, L. Vibration characterization of fully-closed high speed railway subgrade through frequency: Sweeping test. Soil Dyn. Earthq. Eng. 2016, 88, 33–44. [Google Scholar] [CrossRef]
  12. Beijen, M.; Heertjes, M.; Voorhoeve, R.; Oomen, T. Evaluating performance of multivariable vibration isolators: A frequency domain identification approach applied to an industrial AVIS. In Proceedings of the 2017 American Control Conference (ACC), Seattle, WA, USA, 24–26 May 2017; pp. 3512–3517. [Google Scholar]
  13. Weijtjens, W.; De Sitter, G.; Devriendt, C.; Guillaume, P. Operational modal parameter estimation of MIMO systems using transmissibility functions. Automatica 2014, 50, 559–564. [Google Scholar] [CrossRef]
  14. Beijen, M.A.; Voorhoeve, R.; Heertjes, M.F.; Oomen, T. Experimental estimation of transmissibility matrices for industrial multi-axis vibration isolation systems. Mech. Syst. Signal Process. 2018, 107, 469–483. [Google Scholar] [CrossRef] [Green Version]
  15. Beijen, M.; Heertjes, M.; Voorhoeve, R.; Oomen, T. Estimating transmissibility functions in industrial vibration isolation systems by combining floor and shaker excitations. In Proceedings of the 36th Benelux Meeting on Systems and Control, Spa, Belgium, 28–30 March 2017; p. 70. [Google Scholar]
  16. Pintelon, R.; Schoukens, J. System Identification: A Frequency Domain Approach; John Wiley & Sons: Hoboken, NJ, USA, 2012. [Google Scholar]
  17. Pauwels, S.; Michel, J.; Robijns, M.; Peeters, B.; Debille, J. A New MIMO Sine Testing Technique for Accelerated High Quality FRF Measurements. In Proceedings of the 24th International Modal Analysis Conference, St. Louis, MI, USA, 30 January–2 February 2006. [Google Scholar]
  18. Gloth, G.; Sinapius, M. Analysis of swept-sine runs during modal identification. Mech. Syst. Signal Process. 2004, 18, 1421–1441. [Google Scholar] [CrossRef]
  19. Roy, N.; Girard, A. Revisiting the effect of sine sweep rate on modal identification. In Proceedings of the 12th European Conference Space Structures, Materials & Environmental Testing, Noordwijk, The Netherlands, 20–23 March 2012. [Google Scholar]
  20. Roy, N.; Violin, M.; Cavro, E. Sine sweep effect on specimen modal parameters characterization. Adv. Aircr. Spacecr. Sci. 2018, 5, 187–204. [Google Scholar]
  21. Lollock, J. The effect of swept sinusoidal excitation on the response of a single-degree-of-freedom oscillator. In Proceedings of the 43rd AIAA/ASME/ASCE/AHS/ASC Structures, Structural Dynamics, and Materials Conference, Denver, CO, USA, 22–25 April 2002; p. 1230. [Google Scholar]
  22. Girard, A.; Bugeat, L. Effect of Sine Sweep Rate on Modal Parameter Identification. In Proceedings of the 5th International Symposium on Environmental Testing for Space Programmes, Noordwijk, The Netherlands, 15–17 June 2004; Volume 558, pp. 153–156. [Google Scholar]
  23. Orlando, S.; Peeters, B.; Coppotelli, G. Improved FRF estimators for MIMO Sine Sweep data. In Proceedings of the ISMA 2008 International Conference on Noise and Vibration Engineering, Leuven, Belgium, 15–17 September 2008; pp. 229–241. [Google Scholar]
  24. Lalanne, C. Mechanical Shock; CRC Press: Boca Raton, FL, USA, 2020. [Google Scholar]
  25. Arcos Villamarín, R.; Sans Garcia, J.; Romeu Garbí, J.; Razquin, C.; Cardona Gonyalons, J.; Oregui, M. Methodology for the experimental evaluation of frequency response functions in the frame of railway-induced or construction-induced groundbourne vibration. In Proceedings of the EuroRegio 2016, Porto, Portugal, 13–15 June 2016; Sociedade Portuguesa de Acústica: Lisboa, Portugal, 2016. [Google Scholar]
  26. Ciulli, E.; Forte, P. Nonlinear response of tilting pad journal bearings to harmonic excitation. Machines 2019, 7, 43. [Google Scholar] [CrossRef] [Green Version]
  27. Trethewey, M.W.; Sommer, H.J., III. Application of a pure moment exciter for measurement of moment-rotational DOF frequency response functions. Proc. SPIE Int. Soc. Opt. Eng. 2002, 4753, 1153–1158. [Google Scholar]
  28. Cveticanin, L.; Zukovic, M.; Balthazar, J.M. Dynamics of Mechanical Systems with Non-Ideal Excitation; Springer: Berlin, Germany, 2018. [Google Scholar]
  29. Mituletu, I.C.; Gillich, G.R.; Maia, N.M. A method for an accurate estimation of natural frequencies using swept-sine acoustic excitation. Mech. Syst. Signal Process. 2019, 116, 693–709. [Google Scholar] [CrossRef]
  30. Markert, R.; Seidler, M. Analytically based estimation of the maximum amplitude during passage through resonance. Int. J. Solids Struct. 2001, 38, 1975–1992. [Google Scholar] [CrossRef]
  31. Rao, S.S. Mechanical Vibrations, in SI Units, Global Edition; Pearson: London, UK, 2017. [Google Scholar]
  32. Ewins, D. Basics and state-of-the-art of modal testing. Sadhana 2000, 25, 207–220. [Google Scholar] [CrossRef] [Green Version]
  33. Reina, S.; Arcos, R.; Romeu, J. Experimental study of a methodology for the dynamic characterization of systems using unbalanced mass excitation. In INTER-NOISE and NOISE-CON Congress and Conference Proceedings; Institute of Noise Control Engineering: Madrid, Spain, 2019; Volume 259, pp. 7424–7433. [Google Scholar]
  34. Arcos Villamarín, R.; Cardona Gonyalons, J.; Torres, R.; Turiel, I. RECYTRACK Project: Elastomeric eco-friendly material based on end-of-life tires blended with organic bind resin for railway applications. J. Mech. Eng. Autom. 2014, 4, 165–171. [Google Scholar]
  35. Diego, S.; Casado, J.; Carrascal, I.; Ferreño, D.; Cardona, J.; Arcos, R. Numerical and experimental characterization of the mechanical behavior of a new recycled elastomer for vibration isolation in railway applications. Constr. Build. Mater. 2017, 134, 18–31. [Google Scholar] [CrossRef]
  36. Reina, S.; Arcos Villamarín, R.; Romeu Garbí, J.; Clot, A. Optimización de los parámetros para la determinación experimental de la receptanciaa partir de una excitación armónica con barrido logarítmico en frecuencia. In Proceedings of the XXII Congreso Nacional de Ingeniería Mecánica, Madrid, Spain, 19–21 September 2018; pp. 1253–1261. [Google Scholar]
  37. Pintelon, R.; Schoukens, J. Measurement of frequency response functions using periodic excitations, corrupted by correlated input/output errors. IEEE Trans. Instrum. Meas. 2001, 50, 1753–1760. [Google Scholar] [CrossRef]
  38. Shin, K.; Hammond, J. Fundamentals of Signal Processing for Sound and Vibration Engineers; John Wiley & Sons: Hoboken, NJ, USA, 2008. [Google Scholar]
  39. Chandra, N.H.; Sekhar, A. Swept sine testing of rotor-bearing system for damping estimation. J. Sound Vib. 2014, 333, 604–620. [Google Scholar] [CrossRef]
  40. ISO 10846-2: 1997; Acoustics and Vibration–Laboratory Measurement of Vibro-Acoustic Transfer Properties of Resilient Elements–Part 2. ISO: Geneva, Switzerland, 1997.
Figure 1. Models of two-degrees-of-freedom for the validation of the experimental identification method. (a) Excitation force at specific frequencies and harmonic sine sweep under the base using the shaker, load case A; (b) application of the excitation force with sine sweep on the mass-elastomer system using the unbalanced mass device, load case B.
Machines 10 00394 g001
Figure 2. Schematic representation for the determination of the transmissibility T ( ω ) of the mass-elastomer system on the test rig: (a) dynamic testing installation; (b) two-degrees-of-freedom model for the mass-elastomer system.
Machines 10 00394 g002
Figure 3. Scheme of the methodology to obtain the dynamic parameters of the railway track for estimates of transmissibility T ^ e b ( ω ) via measurements: z b ( t ) and z e ( t ) are the actual input–output signals, and z s h a k e r ( t ) is the excitation shaker device. The n z b ( t ) , n z e ( t ) , and m z b ( t ) , m z e are the background noise and the input–output measurement noise, respectively.
Machines 10 00394 g003
Figure 4. Peak–amplitude method using the electromagnetic shaker (Br u ¨ &Kjaer, type: 4825): (a) the solid blue line represents T ^ e b for specific frequencies; (b) the magnitude plots of the estimated transmissibility of the system T ^ e b for different sweep rates, α i .
Machines 10 00394 g004
Figure 5. Numerical–analysis of the standardized parameters α L and η R : (a) The solid blue/red/green/cyan/magenta/black line represents the standardized sweep rate α L for specific sweep rates 0.5, 0.8, 1.25, 1.7, 2.5, and 5 Hz/s, respectively; (b) the magnitude plots of the η R of Equation (3) for different standardized sweep rates, α L .
Machines 10 00394 g005
Figure 6. Transmissibility– τ ( ω ) obtained from the measurements Z e ( ω ) and Z b ( ω ) by an unbalanced mass device for 0.25 × 10 3 kgm (solid yellow line), 0.45 × 10 3 kgm (solid red line), and 0.65 × 10 3 kgm (solid line blue): (a) α = 5 Hz/s, (b) α = 2.5 Hz/s, (c) α = 1.7 Hz/s, (d) α = 1.25 Hz/s, (e) α = 0.83 Hz/s, and (f) α = 0.5 Hz/s.
Machines 10 00394 g006
Figure 7. Estimated–FRF at different sine sweep rates α i and background noise added using the unbalanced mass me 3 = 0.65 × 10 2 kgm. The solid red line, solid blue line, and solid green line represent the transmissibility obtained experimentally with background noise without signal processing, with signal processing, and without background noise with signal processing, respectively. (a) α = 0.5 Hz/s with 30 dB SNR noise; (b) α = 0.5 Hz/s with 0 dB SNR noise; (c) α = 5 Hz/s with 30 dB SNR noise; and (d) α = 5 Hz/s with 0 dB SNR noise.
Machines 10 00394 g007
Figure 8. The mean–amplitude error in the estimate of T ^ e b obtained for 0.5 Hz/s with different amounts of background noise solving Equations (8) and (9). The solid yellow line, solid red line, and solid blue line represent me 3 = 0.65 × 10 2 kgm, me 2 = 0.45 × 10 2 kgm, and me 1 = 0.25 × 10 2 kgm, respectively.
Machines 10 00394 g008
Figure 9. Transmissibility τ ( ω ) obtained from the measurements Z e ( ω ) and Z b ( ω ) by an unbalanced mass device for 0.25 × 10 3 kgm (solid yellow line), 0.45 × 10 3 kgm (solid red line), and 0.65 × 10 3 kgm (solid line blue): (a) α = 5 Hz/s, (b) α = 2.5 Hz/s, (c) α = 1.7 Hz/s, (d) α = 1.25 Hz/s, (e) α = 0.83 Hz/s, and (f) α = 0.5 Hz/s.
Machines 10 00394 g009
Table 1. Sweep parameter η s for different unbalanced masses me, sweep rates α , and resonance frequencies ω r .
me [kg m] η 5 [ ] η 2.5 [ ] η 1.7 [ ] η 1.25 [ ] η 0.83 [ ] η 0.5 [ ]
0.25 × 10 2 0.6150.3660.2490.1410.0950.076
0.45 × 10 2 0.4800.3100.1940.1240.0890.057
0.65 × 10 2 0.4190.2350.1490.1180.0750.043
Publisher’s Note: MDPI stays neutral with regard to jurisdictional claims in published maps and institutional affiliations.

