
Study on Condition Monitoring of Pitch Bearings Based on Stress Measurement


1
Department of Mechanical Engineering, Hunan Institute of Engineering, Xiangtan 411104, China
2
Hunan Province Engineering Laboratory of Wind Power Operation, Maintenance and Testing Technology, Xiangtan 411104, China
3
Harbin Electric Wind Energy Co., Ltd., Xiangtan 411102, China
*
Author to whom correspondence should be addressed.
Machines 2024, 12(3), 154; https://0-doi-org.brum.beds.ac.uk/10.3390/machines12030154
Submission received: 25 December 2023
/
Revised: 19 February 2024
/
Accepted: 21 February 2024
/
Published: 23 February 2024
(This article belongs to the Special Issue Advances in Bearing Modeling, Fault Diagnosis, RUL Prediction (2nd Edition))
Abstract
:Pitch bearings in wind turbines are crucial components that enable safe blade pitching, optimize electrical power output, and ensure turbine protection. Traditional vibration analysis-based methods used for high-speed bearings are not applicable to monitoring pitch bearings, due to its slow non-integer cycle rotation. To address this issue, a stress-based pitch bearing monitoring method is proposed in this paper. First, finite element analysis is conducted to establish the relationship between the maximum surface stress on the outer race of the pitch bearing and the presence of cracks. This relationship allows the identification of cracks on the outer race and an assessment of their severity based on the value of the maximum surface stress. Second, the outer race of the pitch bearing is divided into several segments, and a singularity detection technique is employed to locate the position of cracks on the outer race based on the stresses measured from the segments. To verify the proposed method, a wind turbine pitch bearing test rig was developed in a laboratory. Experimental results have shown that the proposed method can effectively and accurately identify and locate cracks on the outer race of the bearing, thereby demonstrating its great potential as a reliable approach for monitoring the condition of wind turbine pitch bearings.
1. Introduction
Amid the challenges posed by climate change and environmental pollution, there is a discernible shift in global energy consumption toward an era in which clean energy sources are gradually supplanting fossil fuels. Wind energy is one of the most important clean energy sources, and the global installed capacity of wind power has been growing rapidly. The Global Wind Energy Council projects that by 2024, annual onshore wind power capacity will exceed 100 GW, and by 2025, the annual offshore capacity will surpass 25 GW for the first time. By 2027, the global installed wind power capacity is expected to reach 680 GW, with 130 GW installed offshore [1]. The Energy Research Institute of the National Development and Reform Commission of China predicts that by 2050, the domestic installed wind power capacity will reach 2400 GW, accounting for 33.8% of the total domestic installed capacity. The vigorous development of wind power and other clean energy sources is an inevitable choice to achieve China’s sustainable development goals [2]. As the capacity of individual wind turbines increases, the overall structure of the turbines becomes more complex and the coupling between various components becomes tighter. Consequently, the probability of turbine failure also increases [3].
A wind turbine pitch bearing usually operates in extreme and harsh environments, greatly increasing the probability of failure. Failure of the pitch bearing can lead to a loss of control of the blades and damage to the entire turbine system. Due to the high cost of maintenance and replacement of pitch bearings, condition monitoring and fault diagnosis of those bearings are crucial for reducing operational and maintenance costs and improving system reliability. Research on condition monitoring and early fault detection of pitch bearings has gained increasing attention in recent years. Currently, common methods include vibration analysis [4,5], the finite element method [6], oil analysis [7,8], and acoustic emission [9]. Liu et al. proposed an empirical wavelet thresholding method to remove heavy noise and extract weak fault signals, successfully achieving fault diagnosis of pitch bearings [10]. Pan et al. proposed a systemic approach based on cyclic domain resampling to map time series signals to the angular domain. They eliminated time attributes and used segment-wise aggregation approximations with neighborhood correlations to reduce the number of circular domain signals, ultimately detecting frequency changes in vibration signals when initial faults occurred [11]. Sandoval et al. proposed a new method for low-speed bearing fault diagnosis based on permutation and spectral entropy measurement, successfully identifying different fault types based on different entropy values [12]. Relative to vibration-based status monitoring and fault diagnosis methods, acoustic-emission-based methods have stronger resistance to noise interference, higher sensitivity, and a broader frequency response. After subsequent signal processing, acoustic emission frequency signals become clearer and purer, enabling fault identification and determination, particularly in the process of handling low-frequency signals. Liu et al. proposed a discrete/random separation cepstrum editing (DRS-CEL) method to extract weak fault features from original acoustic emission signals. They edited the cepstrum using discrete/random separation, then further filtered residual noise leaked by DRS-CEL using morphological envelope analysis and demodulated the denoised signal to infer specific bearing fault types in the frequency domain [13]. Zhang et al. used a new time-convolutional enhancement Bayesian search algorithm to search for the “synthetic period” of unknown signals. They estimated window length and used a split Bayesian augmented Lagrange algorithm based on split-window technology to build a time-varying model. Finally, they determined pitchbearing fault types using envelope analysis [14,15]. Chen et al. integrated Bladed and MATLAB using Python and cloud platforms to produce an integrated lifecycle simulation to reduce simulation time. They proposed a 3D modeling method to calculate crack propagation in yaw bearings throughout the entire lifecycle, accurately identifying and predicting the evolution of early crack propagation in yaw bearings [16].
Due to the pitch bearing’s very slow operating speed (less than 5 rpm), collected fault signals are weak and often masked by heavy noise interference. Unlike gearbox bearings such as main bearings, generator bearings, and continuous rotation bearings, the pitch bearing has a very limited rotation angle (within 90°), resulting in a limited number of fault signals. Moreover, the pitch bearing undergoes no-integer cycle rotation, making applying conventional vibration detection methods challenging. Interference from blade flapping and dynamic wind loads can cause speed fluctuations, further complicating pitch bearing fault data collection. The various methods mentioned above are difficult to apply in practical work.
Zhang et al. conducted a study based on long-term monitoring data of the steel structure at the Hangzhou Olympic Center Stadium. They investigated the correlation between stress variations at different measurement points, proposed an interpolation method for missing stress data, and successfully restored the missing monitoring data for a specific measurement point [17]. Nong Zhang et al. utilized a borehole stress field instrument to study the advanced abutment stress caused by longwall mining in a mined coal seam. By monitoring the dynamic changes in vertical and horizontal stresses, they provided a reliable basis for predicting dynamic hazards such as rock bursts [18]. Blanquer et al. investigated the chemical-mechanical stresses occurring in electrodes during the cycling process of batteries and proposed an operational technique for stress monitoring, which provides significant reference value for battery diagnostics and design [19]. The aforementioned tasks are all accomplished through stress monitoring, and all to some extent utilize stress monitoring for object condition monitoring.
Inspired by the above applications, this article proposes a condition monitoring method for pitch bearings based on stress measurement. When cracks appear on the outer ring of the pitch bearing, the cracks will cause a local decrease in the strength of the outer ring material, resulting in stress concentration in the area near the cracks. When external loads act on the outer ring, the stress near the crack will concentrate at the crack, leading to an increase in stress in that area. Therefore, the presence of a crack in the outer race of pitch bearing will be judged by analyzing the change in stress on the outer race. To determine the location of the outer ring crack, the stress changes at the crack location and the overall stress distribution on the outer race surface are studied, and effective methods are developed to locate the outer race crack.
The novelty of this work lies in its pioneering approach to tackling the condition monitoring challenge associated with non-integer cycle rotating bearings, a dimension that has hitherto been overlooked in existing literature. Furthermore, our study introduces a robust methodology for the identification and localization of cracks occurring in the outer race of the pitch bearing, providing a reliable solution where none has been explored before.
2. Finite Element Simulation Analysis
2.1. Finite Element Model
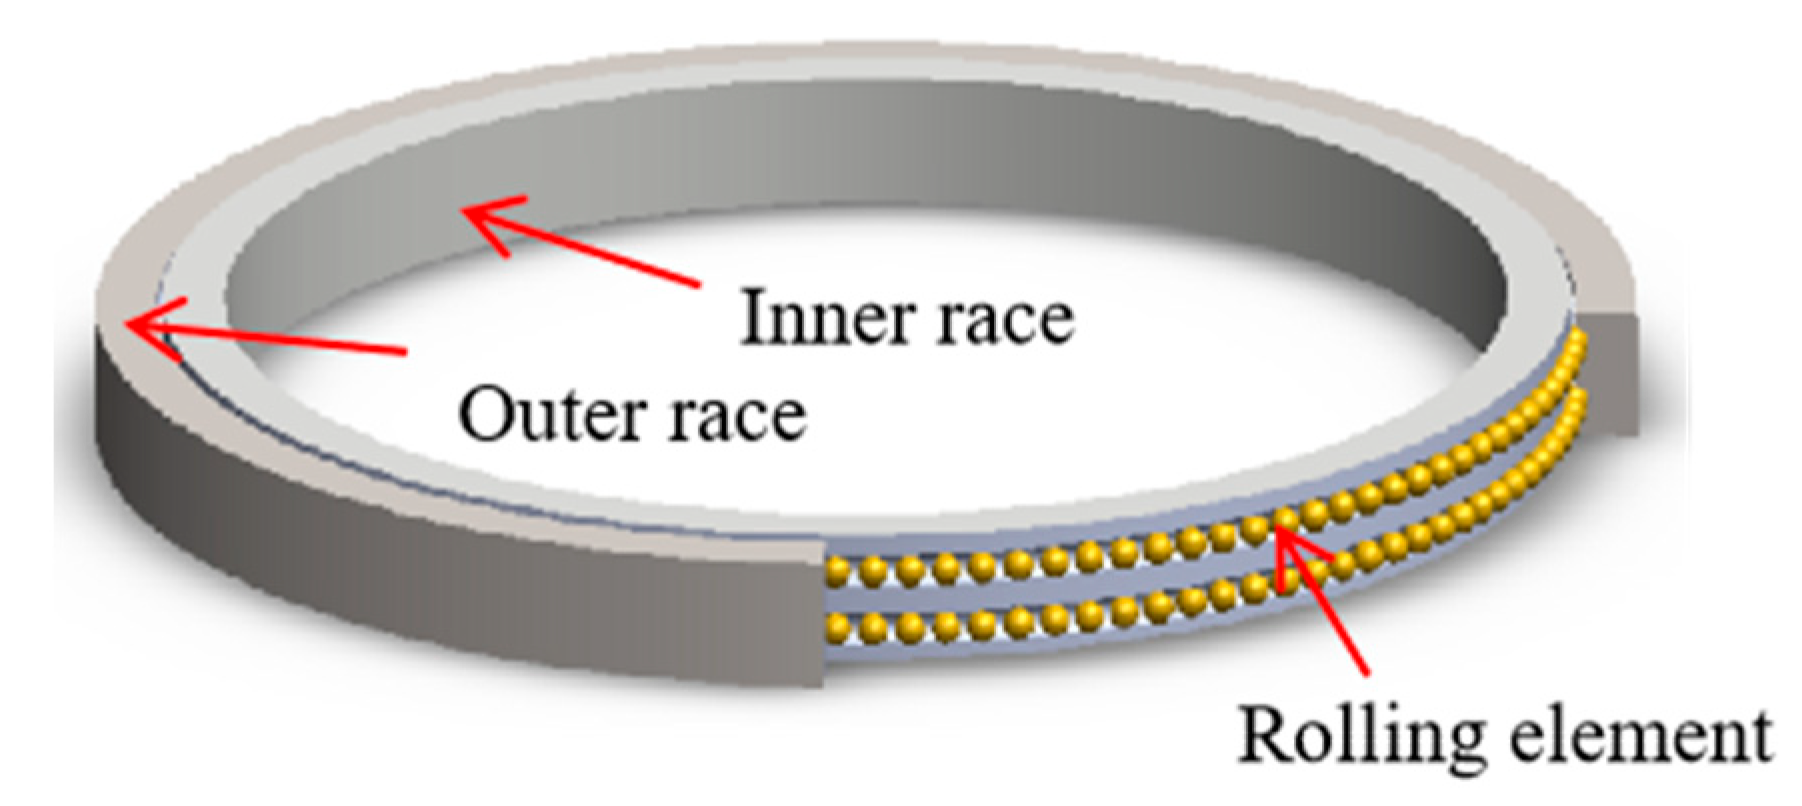
The structural parameters of the double-row, four-point contact ball pitch bearings used in a wind turbine pitch system are shown in Table 1, and a 3D model of the pitch bearing is shown in Figure 1. Each steel ball and raceway of the pitch bearing is in four-point contact, as shown in Figure 2. The bearing material used is alloy structural steel 42CrMo, and the steel balls are made of alloy structural steel GCr15. The Poisson’s ratio of the inner and outer races of the bearing is vi = ve = 0.3, and the elastic modulus is Ei = Ee = 210 GPa. The Poisson’s ratio of the steel ball is vb = 0.3, and the elastic modulus is Eb = 206 GPa.
During finite element modeling, the following considerations were taken into account: Due to the large size of the pitch bearing, the engagement of the drive pinion with the bearing raceway did not substantially affect the contact stress between the steel balls and the raceway. Additionally, because the inner and outer rings of the pitch bearing were large relative to the steel balls and raceway, the influence of arcs and chamfers in the bearing structure on the contact stress between the steel balls and the raceway was minimal. Furthermore, because the pitch bearing operated at low speeds, static analysis was sufficient to meet the mechanical performance requirements of the bearing. Therefore, considerations such as bearing seals and lubrication status, which might affect the internal load of the bearing, were not necessary during the analysis.
In the finite element model, besides the steel balls being modeled as spheres, both the inner and outer rings were treated as solid bodies and contained numerous arc structures. When tetrahedral or hexahedral elements were used for meshing, irregular and deformed elements were generated, leading to computational difficulties. Therefore, those elements were not used [20]. To mitigate the influence of mesh density on stress and strain values, stress value comparisons were done for various mesh densities, as shown in Figure 3. When the mesh density reached 1.06 million, the percentage difference between the values tended toward zero, and the maximum stress in the pitch bearing tended to remain constant. Therefore, the mesh setting for this study’s finite element simulation analysis was 1.06 million elements.
In actual operation, the speed of the wind turbine pitch bearing is very slow, and the bearing is more often stationary than rotating. Therefore, when a finite element analysis of the pitch bearing was done, only a static analysis of its structure was necessary. During the finite element analysis of the pitch bearing, the influence of the preloading force on the displacement of the outer ring of the bearing was minimal. Thus, the displacement of the outer ring of the bearing could be ignored, and it was assumed that its position was fixed. That assumption had a negligible effect on the final calculation results of load distribution and stress magnitude. Therefore, full constraints were applied to the outer surface of the bearing outer ring to keep its position unchanged, whereas no constraints were required for the inner ring of the bearing. During the simulation analysis, to prevent the steel balls from sliding in the circumferential direction of the raceway, constraints were applied to restrict their circumferential displacement.
During operation, external loads acting on a pitch bearing can generally be transformed into 3 types of forces: axial force, radial force, and overturning moment. When the bearing forces were studied, it was important to first establish a coordinate system for the pitch bearing, as shown in Figure 4. The y axis was aligned with the bearing axis, and the position angle φj for each ball could be expressed as φj = 2π(j − 1)/(Z/2), where Z is the number of double-row steel balls in the bearing (j = 1, 2, 3… Z/2), and r is the inner ring diameter direction. Due to the minimal influence of radial and axial loads, this study considered only the effect of the overturning moment on the outer ring of the pitch bearing. The values of the overturning moment applied to the inner ring of the pitch bearing are shown in Table 2. The total torque direction gradually increased from being aligned with the x axis to forming a 45° angle with the x axis.
2.2. Calculation Solution and Result Analysis
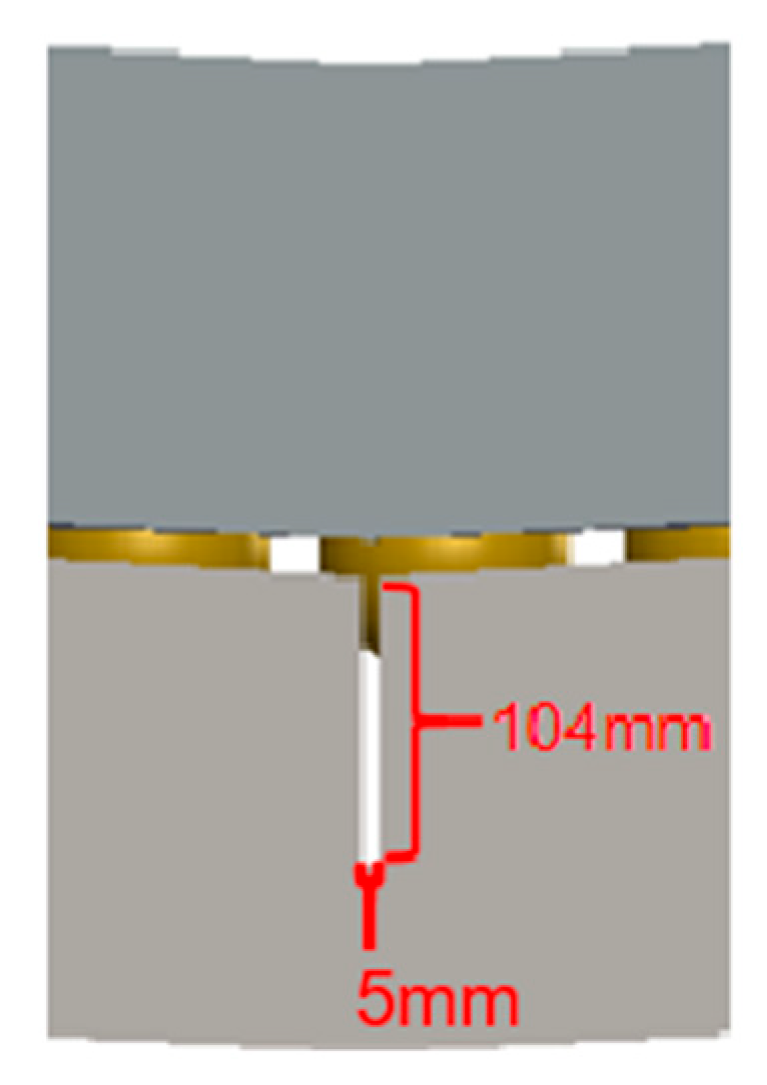
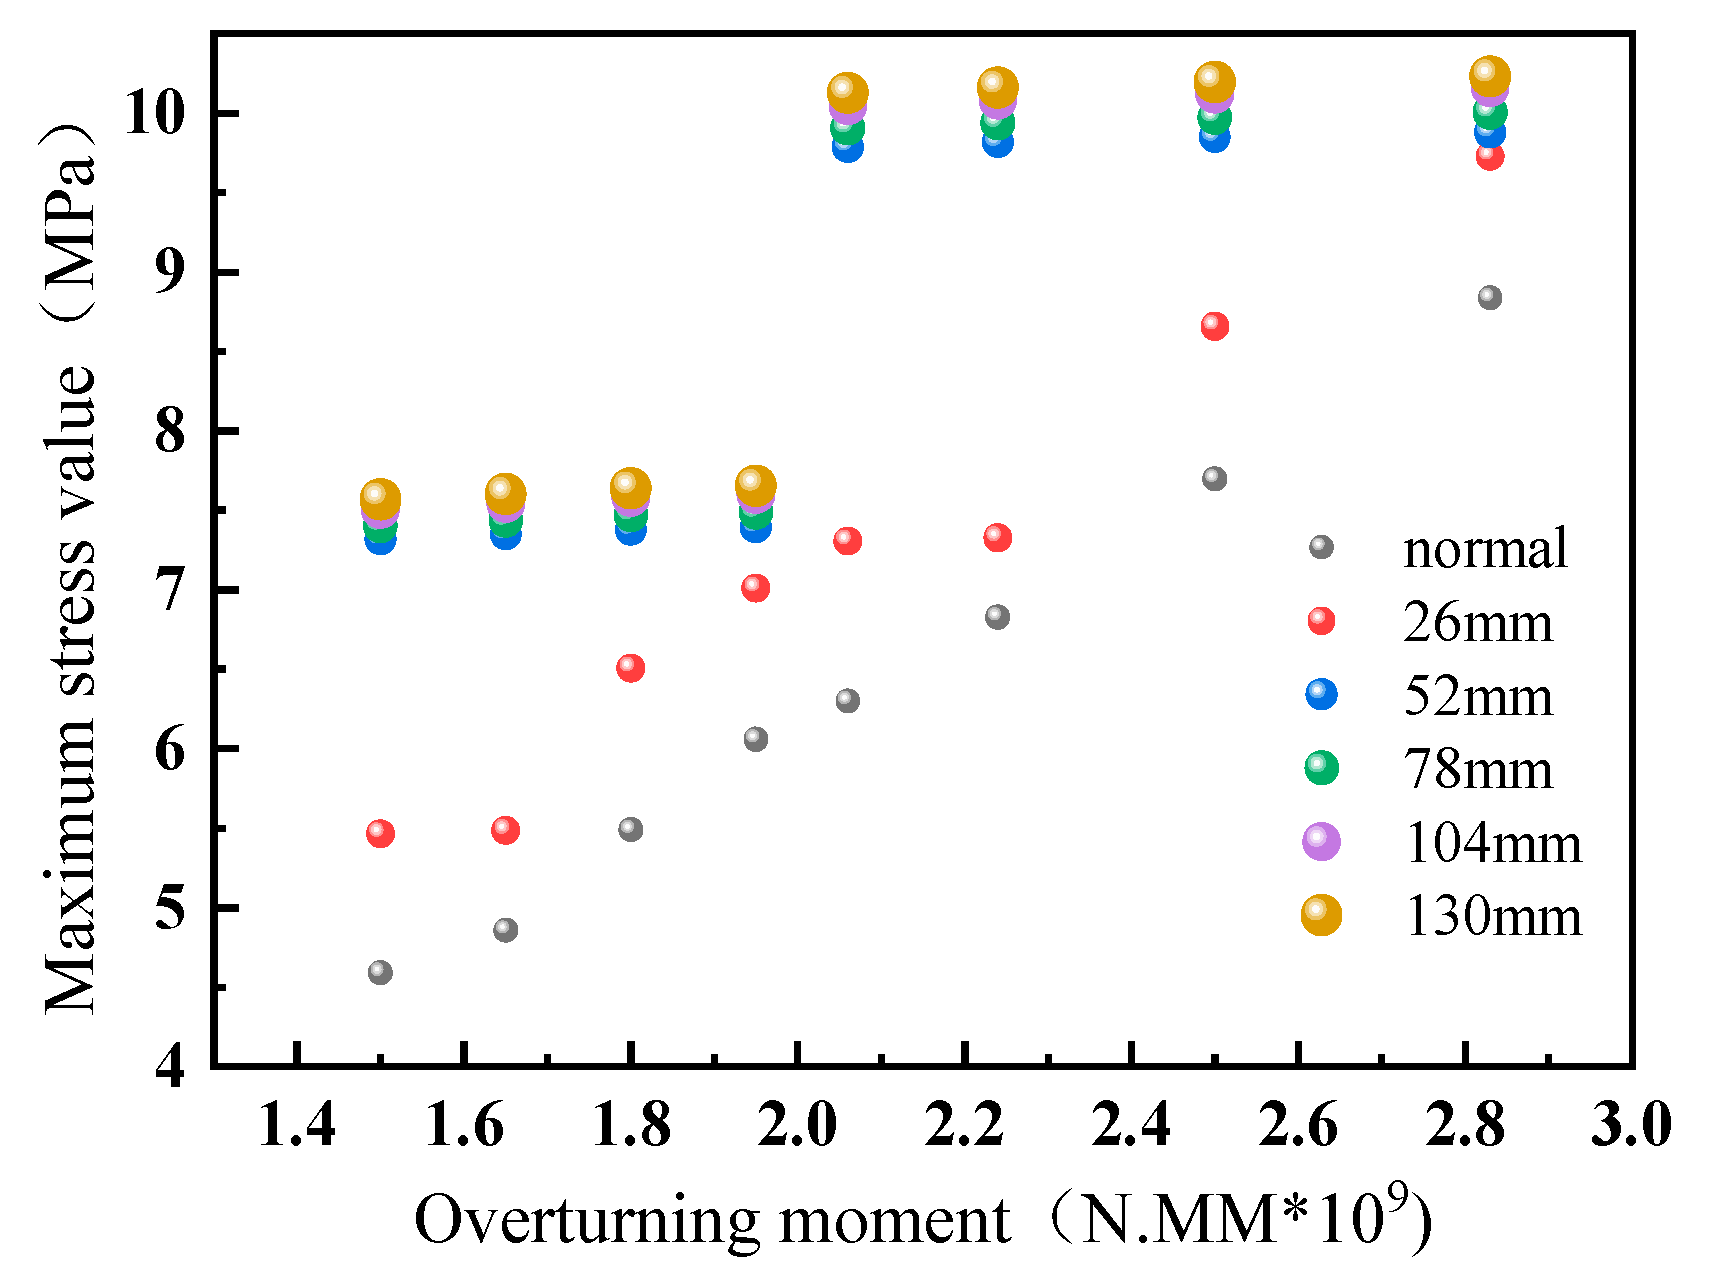
The partial 3D model for crack simulation is shown in Figure 5. The nonlinear analysis of the configured model is carried out. Since the crack failure occurred only on the outer race, cracks with widths of 5 mm, depths of 26 mm, lengths of 260 mm, 52 mm, 78 mm, 104 mm, and 130 mm were simulated on the outer ring. When there is a crack in the outer race of the variable rotor bearing, the local strength of the material will be reduced due to the crack, so that the stress is concentrated in the area near the crack. When external loading is applied to the material, the stress near the crack will be concentrated at the crack, resulting in increased stress in the region. This stress concentration leads to crack propagation and material failure. As a result, the stress at the crack will increase. Therefore, the overturning torque in Table 2 is applied to the inner race under normal and cracked conditions, and the maximum surface stress value of the outer race under normal and cracked conditions is obtained, as shown in Figure 6. It can be seen from Figure 6 that when the outer race of the variable pitch bearing is cracked, the maximum surface stress of the outer race under normal conditions after different overturning torque is applied to the bearing is smaller than that under cracked condition. Under the same overturning moment, the maximum surface stress of the bearing outer race increases with the increase of crack depth.
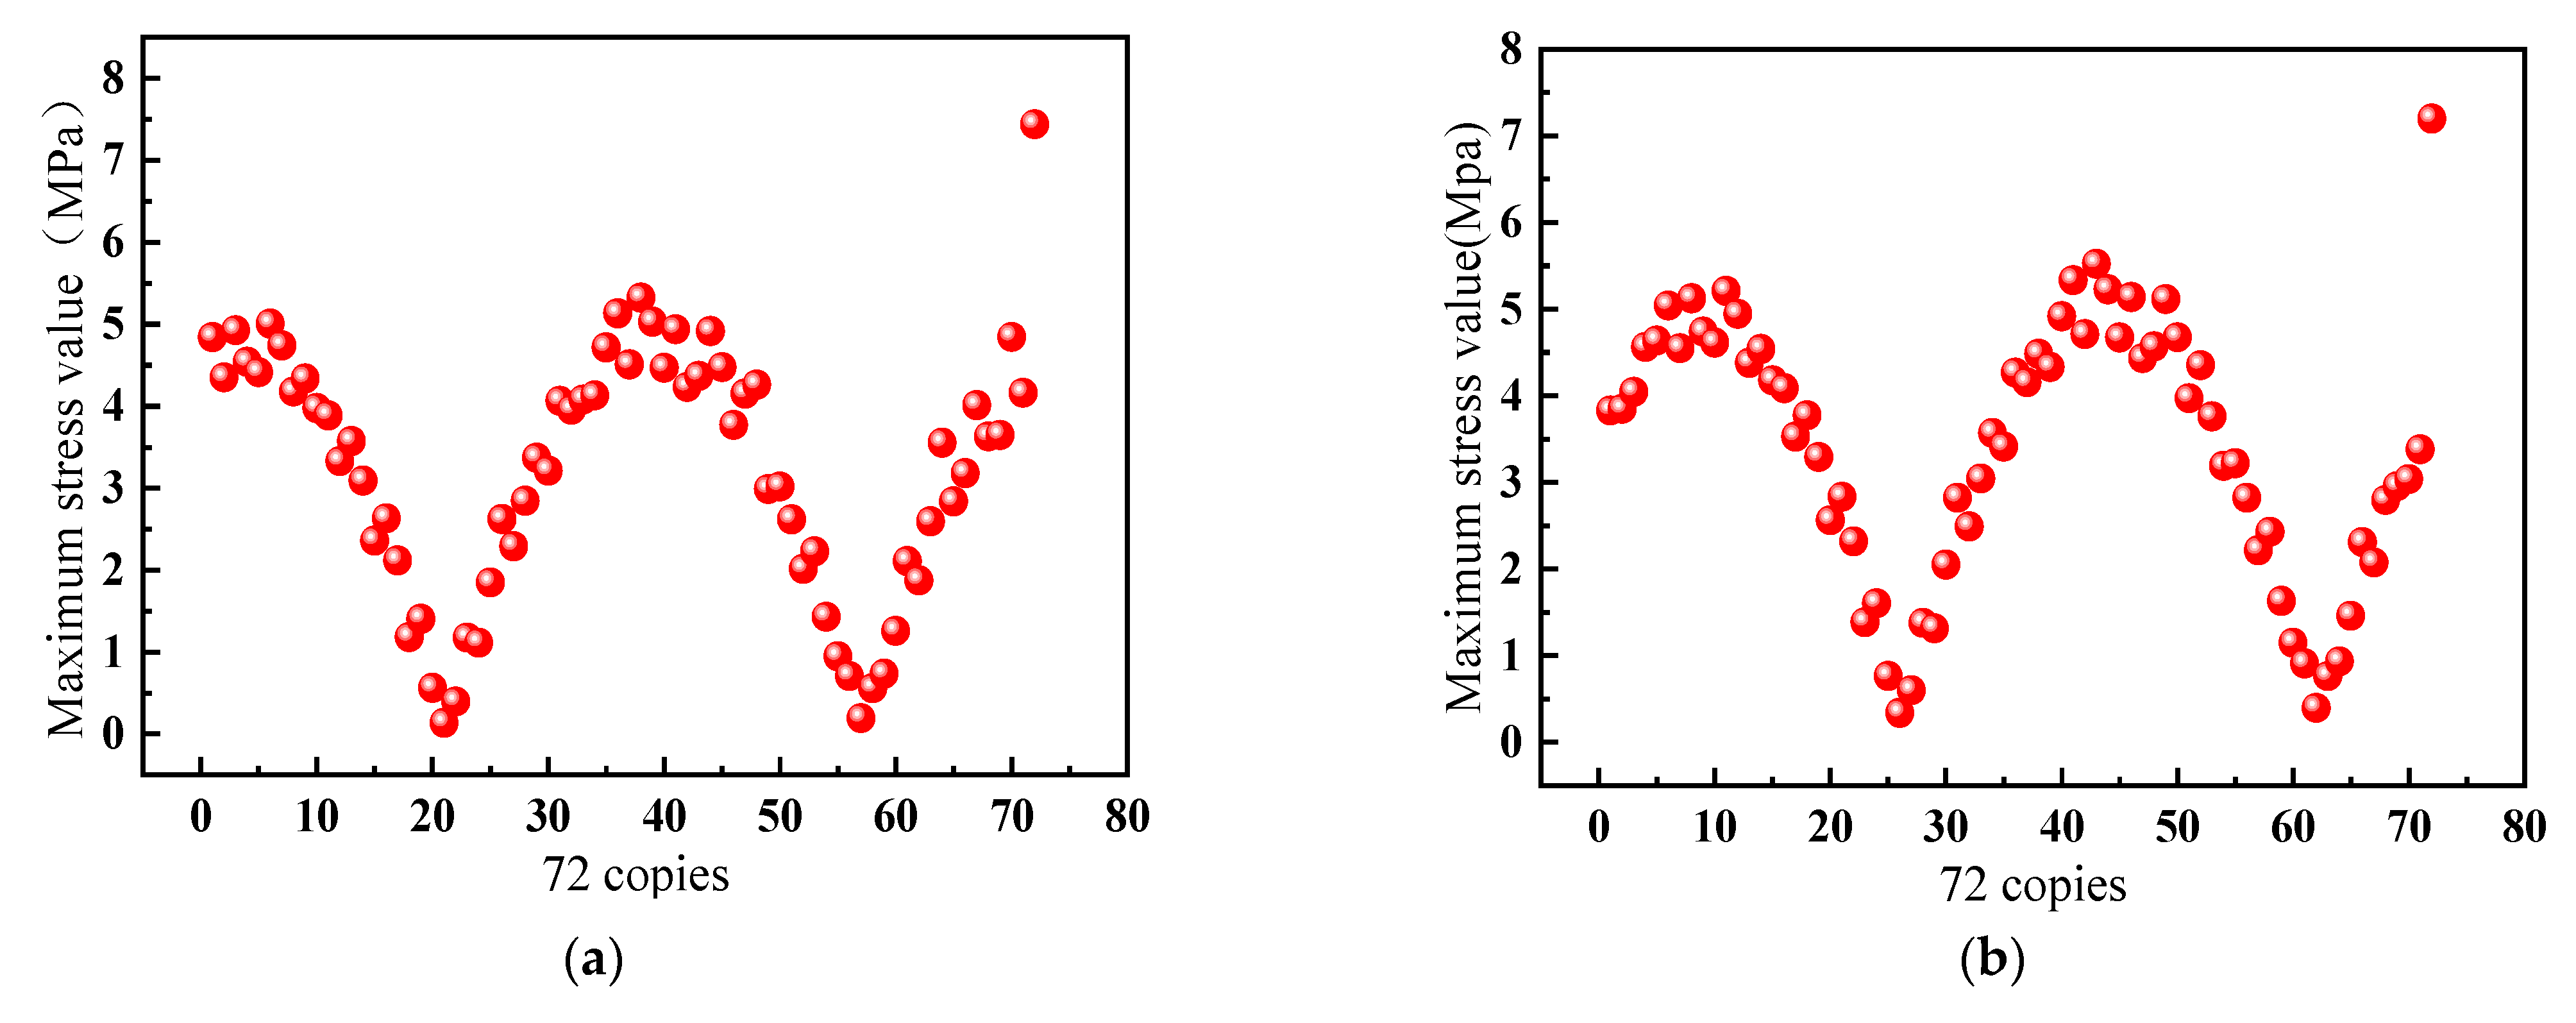
To determine the location of the crack, the outer race of the variable pitch bearing is evenly divided into 36 sections based on the angle. Cracks with depths of 78 mm and 104 mm are selected as references. The data for the 36 sections shown in Figure 7a,b are obtained by using a bearing with a crack depth of 78 mm as an example, and applying tilting moments of 1.65 × 10⁹ N.MM and 1.80 × 10⁹ N.MM to the inner race of the variable pitch bearing. The data in Figure 7c represents the stress values obtained from the inner race of the bearing with an outer race crack depth of 104 mm, under a tilting moment of 1.65 × 10⁹ N.MM. Figure 7 shows that the stress values for the outer race’s first 35 parts formed a sinusoidal curve, but there was a sudden change in stress value for the 36th part, deviating from the normal value. That indicated that the crack was at the 36th part. Therefore, when a crack appeared on the outer race of the pitch bearing, the stress at the crack location increased.
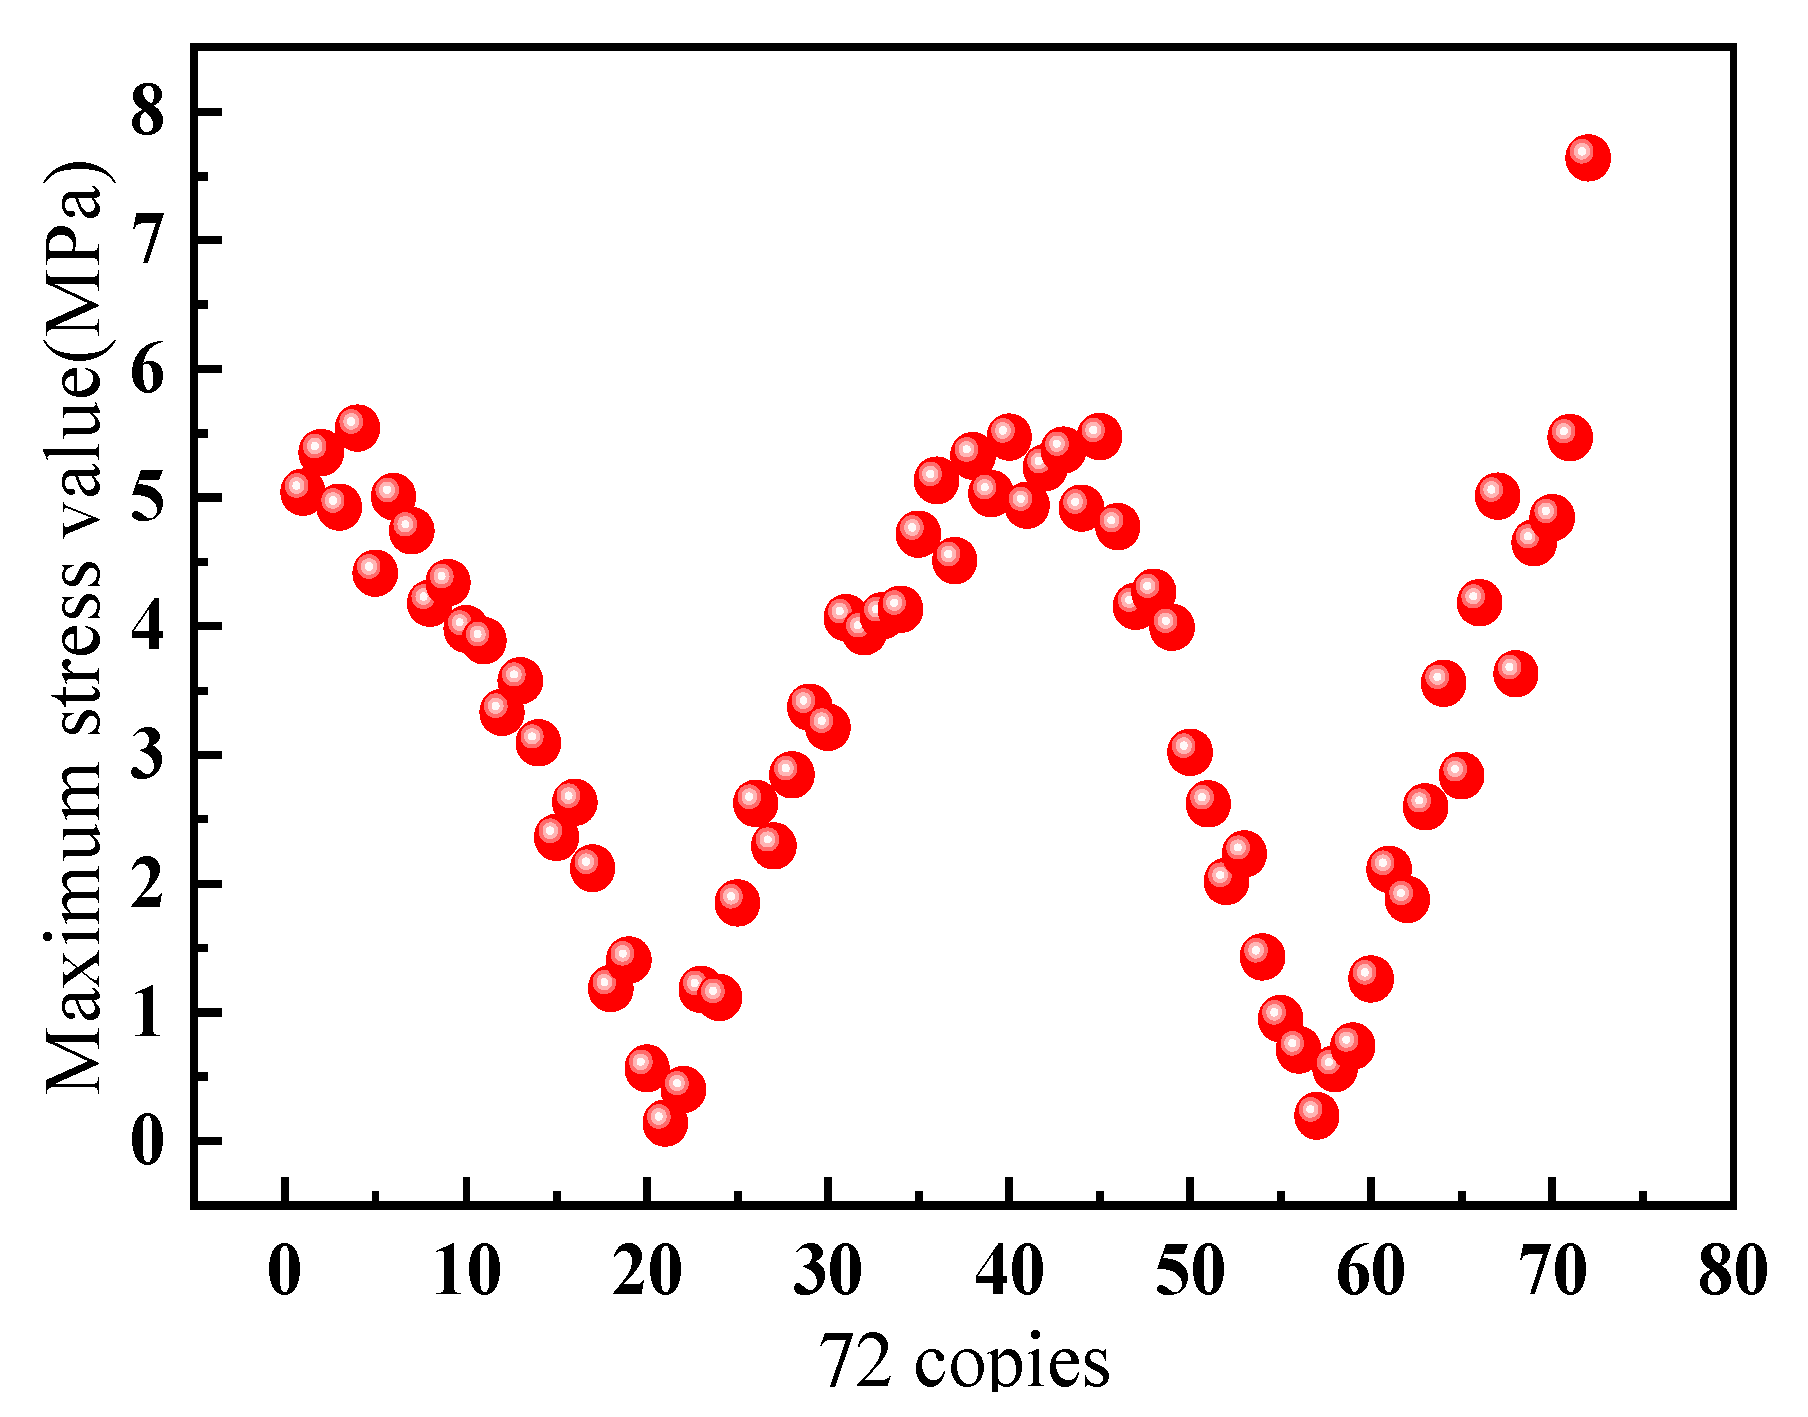
To ensure the feasibility of this method, the outer race of the pitch bearing was further divided into 72 equal parts based on the angle; the stress values for the 72 parts are shown in Figure 8. The figure shows that at the 72nd part, there was a marked difference in the maximum stress on the outer race surface, whereas the other parts had a sinusoidal curve similar to that observed with the 36 parts. That demonstrates that when a crack appeared on the outer race of the pitch bearing, the stress at the crack location was substantially greater than it was in the normal state, and the stress values were notably prominent.
2.3. Fault Location
In actual wind turbine operations, the load on the pitch bearing of the wind turbine generator changes constantly. This study used singular point detection for crack positioning to avoid the influence of pitch bearing loads on fault localization. The singular point detection chosen was a typical unsupervised singular detection algorithm in integrated learning algorithms. The core idea of this algorithm is to randomly select feature hyperplanes and continuously partition the data space until each subspace contains only one data point or reaches a preset depth limit. In this partitioning process, more outlier data points are partitioned earlier, and therefore their average depth is smaller. The equation for calculating the outlier score of a data sample x is [21]:
where h(x) is the path length of sample x, and its calculation equation is
where e is the number of edges that sample x passes from the root node to the leaf node of the tree, size is the number of samples in the same leaf node as x, E[h(x)] is the mean of h(x) for sample x in all trees, and c(φ) is the average path length of the tree given φ data samples, which is used to normalize E[h(x)]. The calculation equation is
where H(φ − 1) = ln(φ − 1) + 0.5772. From Equation (1), it can be observed that the average path E[h(x)] of data x in each tree is shorter and the anomaly score value Score(x) is closer to 1, indicating that it is more likely to be an outlier. Conversely, when the anomaly score value Score(x) is closer to 0, it indicates that it is more likely to be a normal point.
h(x) = e + c(size),
The specific detection process of the singularity detection algorithm is as follows. First, an isolated tree is created. Given the data sample space, some samples are randomly selected to form the training space, and the features and their partition values are arbitrarily selected. The training space is recursively divided, and the points smaller than the partition value in the current dimension are placed on the left branch of the current node, and the points greater than or equal to the partition value are placed on the right branch of the current node until any of the following conditions are met: (1) The subsample space cannot be separated; (2) Reach the specified cutting depth. The above process is repeated to construct t isolated trees to form an isolated forest. The test Spaces in the data sample space are input into the trained isolated trees for data evaluation, and the outliers are identified according to the outlier scores of the sample points.
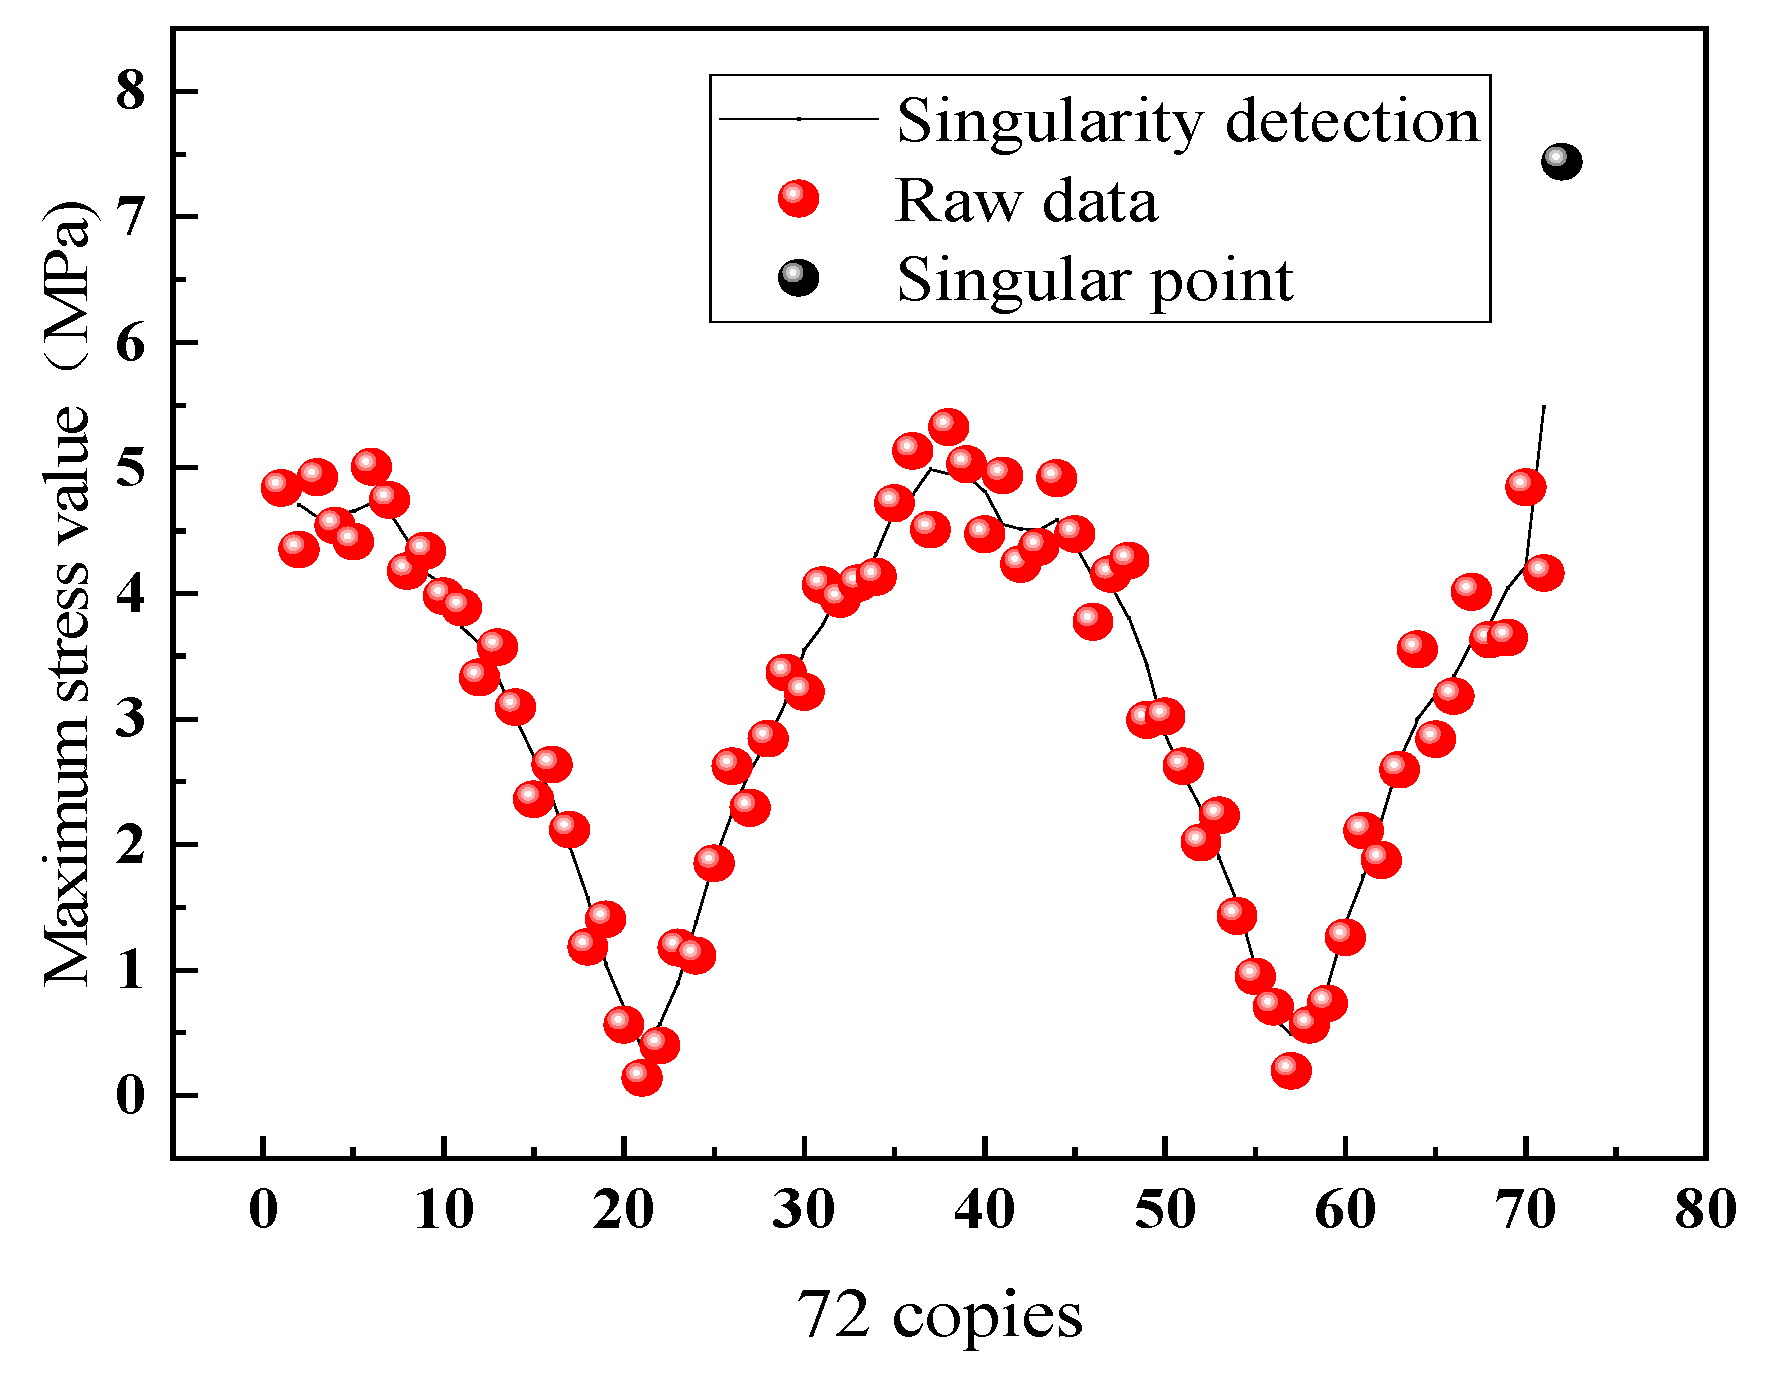
Figure 8 shows a scatterplot of the maximum stress for each of the 72 parts of the outer race; the scatterplot has a sinusoidal curve. When a fault occurred in the outer race of the pitch bearing, the maximum stress value for the part with a crack deviated from the normal data points. Therefore, this study used singular point detection to identify the outlier data points and determine the location of the pitch bearing fault. As shown in Figure 9, the singular point detection identified the 72nd point as an outlier corresponding to the crack’s location.
2.4. Research on Different Crack Lengths
When the crack width was fixed at 5 mm, and the depth was fixed at 78 mm, the length of the crack varied, and finite element simulation analysis was done on a pitch bearing with cracks of lengths 52 mm, 104 mm, 156 mm, and 208 mm, as well as a normal pitch bearing, under different overturning moments. A comparison of the maximum stress values on the outer ring surface of the pitch bearing under various conditions is shown in Figure 10. It can be seen that when a crack appeared, the maximum stress on the outer race exceeded the normal value, and as the crack length increased, the maximum stress on the outer race surface decreased.
Using the same method as before, a pitch bearing with a crack 104 mm long was selected as a reference. The outer race of the bearing was evenly divided into 72 parts according to the angle, and an overturning moment of 1.65 × 10⁹ N.MM was applied to the inner race of the pitch bearing. The maximum stress values on the outer race surface under normal and cracked conditions are shown in Figure 11. It can be seen that the stress on the bearing was very high at the 72nd part, whereas the other parts were normal. To determine the location of the crack, the same singular point detection method as before was used, as shown in Figure 12. It can be seen that the 72nd data point could be accurately identified as an outlier, which accurately identified the location of the crack.
3. Test Verification
To verify the effectiveness of the method proposed in this paper for condition monitoring of pitch bearings and to validate the correctness of finite element simulation analysis, a small-scale pitch bearing test rig was set up to emulate the installation and fixing methods of pitch bearings in large wind turbine generators. Due to limitations in the experimental conditions, it was not feasible to use large-scale, double-row, four-point contact ball bearings. Instead, small-scale, single-row contact ball bearings were used as a substitute for the large-scale ball bearings. The specifications of the test bearings are shown in Table 3. The stress was measured using strain gauges, the specifications of which are shown in Table 4.
Because small-scale, single-row contact ball bearings were used, only 16 strain gauges were used. The bearings were divided into 16 equal sections based on angles, and the 16 strain gauges were attached to the bearings using the specialized adhesive H610. The strain gauges were connected to the instrument using a 1/4 bridge configuration. In the original setup with large-scale, double-row, four-point contact ball bearings, the external load on the bearings was a combination of the gravity of the wind turbine blades and the force exerted by the wind on the blades. However, due to limited experimental conditions, it was not feasible to apply a toppling moment that could cause deformation of the small-scale, single-row contact ball bearings by manipulating the blades in the laboratory. Instead, a jack was used to directly apply force to the shaft, simulating the loading conditions of the blades by exerting force on the shaft. The stress on the side of the bearing in a stationary state was then collected. The experimental setup is shown in Figure 13. The schematic diagram of the test device is shown in Figure 14.
A moving average filter is a digital signal processing technique for smoothing or removing noise from a signal. The principle behind the technique is to take the average of the signal values over a continuous period of time, then use that average value as the filtered output. The basic principle of the moving average filter can be expressed using
where y(n) is the filtered output, x(n) is the current value of the input signal, and M is the window size of the moving average filter. The window size determines the number of consecutive signal values that must be considered when taking the average, that is, the time range over which the averaging must be done. A moving average filter has a wide range of applications and can be used for various types of signal processing, such as audio, image, and sensor signals. By adjusting the window size, the filter’s frequency response can be controlled, thus achieving different filtering effects.
Stress data were collected from a normal small-scale, single-row contact ball bearing, with 16 strain gauges corresponding to 16 channels, resulting in 16 stress datasets. Due to interference from the data acquisition device, a moving average filter was applied to those 16 datasets. After multiple parameter comparisons, a window size of 501 was selected for the moving average filter. An example of one dataset with a sampling frequency of 1000 Hz is shown in Figure 15. The figure shows that the filtered data tended to stabilize. Therefore, the current channel data were selected as the average value of the filtered data. The data obtained by performing the same operation on all 16 channels are shown in Figure 16a. The data obtained by changing the load on the bearing are shown in Figure 16b. From the figures, it can be observed that the experimental data trends are consistent with the finite element analysis data, thereby demonstrating the correctness of the finite element simulation analysis.
A crack with a depth of 8 mm and a width of 1 mm is cut into the outer race of the small single-row contact ball bearing as shown in Figure 17, and a strain gauge is pasted under the corresponding number. Stress data were collected from the faulty bearing, and the same filtering method was applied to the data from all 16 channels, resulting in the 16 sets of data shown in Figure 18. It can be observed from the figure that there was a noticeable difference in the data collected from the 7th strain gauge compared to the data from the other gauges. Singular point detection was done, as shown in Figure 19, and it precisely identified the 7th data point as an outlier.
In order to prove the effectiveness of this method in actual wind turbines, the data collected by faulty bearings under different loads are shown in Figure 20a, when loads are applied to bearings. It can be seen from the figure that the data collected from strain gauge 7 present anomalies under different loads, while the other data present as normal. This corresponds to the occurrence of a crack fault around strain gauge number 7, leading to an increase in stress values. By conducting anomaly detection on the data for different loads in Figure 20a, it is possible to detect that the data corresponding to strain gauge number 7 are consistently anomalous across different load conditions. The difference between the faulty data collected from strain gauge number 7 and the anomaly detection values is illustrated in Figure 20b. It can be observed from the figure that when a crack occurs on the outer race of the pitch bearing, the stress value at the crack location increases, and so does the difference with the detection values. This indicates that when the load on the pitch bearing of a wind turbine generator keeps changing, the method proposed in this paper can effectively monitor cracks on the outer race of the pitch bearing.
4. Conclusions
This paper presents a method for monitoring the condition of a wind turbine pitch bearing based on variations in outer race stress. The method was validated through finite element simulation analysis and simulation experiments. The results demonstrate the following:
- When cracks appear on the outer race of a pitch bearing, the stress at the crack on the outer race of the pitch bearing will increase. The more severe the crack fault is, the more sensitive the maximum stress on the outer race surface of the pitch bearing is to changes in external load. This is reflected in the observation that the deeper the crack depth on the outer race surface of the pitch bearing, the greater the maximum stress value on the outer race surface. The longer the crack length on the outer race, the smaller the maximum stress value on the outer race surface. This indicates that stress changes can not only be used for detecting cracks in the outer race of pitch bearings, but also for evaluating their severity.
- Using a singular point detection method enables accurate localizing of a crack’s position, indicating that the proposed method can not only effectively detect the occurrence of outer race crack faults in the pitch bearing, but also accurately determine their severity and location.
Author Contributions
Z.W. initiated this paper, constructed the framework, conducted research design, organized the data, and drafted the original manuscript. W.Y. established the framework, edited and revised the manuscript, and supervised the project. X.S. carried out data collection. K.W. edited and revised the manuscript, obtained funding, and supervised the project. All authors contributed to the intellectual content. All authors have read and agreed to the published version of the manuscript.
Funding
The work reported above was supported by the National Natural Science Foundation of China (52175089 and 12002125).
Data Availability Statement
The data presented in this study are available on request from the corresponding author. The data are not publicly available due to the huge size of stress distribution data.
Conflicts of Interest
Author Xiaoping Song was employed by the company Harbin Electric Wind Energy Co., Ltd. The remaining authors declare that the research was conducted in the absence of any commercial or financial relationships that could be construed as a potential conflict of interest.
References
- GWEC. Global Wind Report 2023. 2023. Available online: https://gwec.net/globalwindreport2023/ (accessed on 15 August 2023).
- Energy Research Institute, National Development and Reform Commission. Study on Scenario and Path of China’s High Proportion of Renewable Energy Development in 2050 [R/OL]. Available online: http://www.efchina.org/Reports-zh/china-2050-high-renewable-energy-penetration-scenario-and-roadmap-study-zh (accessed on 15 August 2023).
- Hofmann, M.; Sperstad, I.B. Will 10 MW Wind Turbines Bring Down the Operation and Maintenance Cost of Offshore Wind Farms? Energy Procedia 2014, 53, 231–238. [Google Scholar] [CrossRef]
- Zvokelj, M.; Zupan, S.; Prebil, I. Multivariate and multiscale monitoring of large-size low-speed bearings using Ensemble Empirical Mode Decomposition method combined with Principal Component Analysis. Mech. Syst. Signal Process. 2010, 24, 1049–1067. [Google Scholar] [CrossRef]
- Liu, Z.; Zhang, L. Naturally damaged wind turbine blade bearing fault detection using novel iterative nonlinear filter and morphological analysis. IEEE Trans. Ind. Electron. 2019, 67, 8713–8722. [Google Scholar] [CrossRef]
- Plaza, J.; Abasolo, M.; Coria Martínez, I.; Aguirrebeitia, J.; Fernandez de Bustos, I. A new finite element approach for the analysis of slewing bearings in wind turbine generators using superelement techniques. Meccanica 2015, 50, 1623–1633. [Google Scholar] [CrossRef]
- Liu, R. Condition monitoring of low-speed and heavily loaded rolling element bearing. Ind. Lubr. Tribol. 2007, 59, 297–300. [Google Scholar] [CrossRef]
- Bai, X.Q.; Xiao, H.L.; Zhang, L. The Condition Monitoring of Large Slewing Bearing Based on Oil Analysis Method. Key Eng. Mater. 2011, 474–476, 716–719. [Google Scholar] [CrossRef]
- Van Hecke, B.; Yoon, J.; He, D. Low speed bearing fault diagnosis using acoustic emission sensors. Appl. Acoust. 2016, 105, 35–44. [Google Scholar] [CrossRef]
- Liu, Z.; Zhang, L.; Carrasco, J. Vibration analysis for large-scale wind turbine blade bearing fault detection with an empirical wavelet thresholding method. Renew. Energy 2020, 146, 99–110. [Google Scholar] [CrossRef]
- Pan, Y.; Hong, R.; Chen, J.; Qin, Z.; Feng, Y. Incipient fault detection of wind turbine large-size slewing bearing based on circular domain. Measurement 2019, 137, 130–142. [Google Scholar] [CrossRef]
- Sandoval, D.; Leturiondo, U.; Pozo, F.; Vidal, Y. Low-speed bearing fault diagnosis based on permutation and spectral entropy measures. Appl. Sci. 2020, 10, 4666. [Google Scholar] [CrossRef]
- Liu, Z.; Wang, X.; Zhang, L. Fault diagnosis of industrial wind turbine blade bearing using acoustic emission analysis. IEEE Trans. Instrum. Meas. 2020, 69, 6630–6639. [Google Scholar] [CrossRef]
- Zhang, C.; Márquez, F.P.G.; Zhang, L. Artificial Intelligence Techniques and Cloud Computing for Wind Turbine Pitch Bearing Fault Detection. In Non-Destructive Testing and Condition Monitoring Techniques in Wind Energy; Elsevier BV: Amsterdam, The Netherlands, 2022. [Google Scholar]
- Zhang, C.; Liu, Z.; Zhang, L. Wind turbine blade bearing fault detection with Bayesian and Adaptive Kalman Augmented Lagrangian Algorithm. Renew. Energy 2022, 199, 1016–1023. [Google Scholar] [CrossRef]
- Chen, Y.; Jin, X.; Yue, Y.; Wang, S.; Han, H.; Wen, M.; Wang, Q.; Cheng, P. Investigation on 3D fatigue crack propagation in pitch bearing raceway of offshore wind turbines. Ocean. Eng. 2023, 269, 113524. [Google Scholar] [CrossRef]
- Zhang, Z.; Luo, Y. Restoring method for missing data of spatial structural stress monitoring based on correlation. Mech. Syst. Signal Process. 2017, 91, 266–277. [Google Scholar] [CrossRef]
- Zhang, N.; Zhang, N.; Han, C.; Qian, D.; Xue, F. Borehole stress monitoring analysis on advanced abutment pressure induced by longwall mining. Arab. J. Geosci. 2014, 7, 457–463. [Google Scholar] [CrossRef]
- Albero Blanquer, L.; Marchini, F.; Seitz, J.R.; Daher, N.; Bétermier, F.; Huang, J.; Gervillié, C.; Tarascon, J.M. Optical sensors for operando stress monitoring in lithium-based batteries containing solid-state or liquid electrolytes. Nat. Commun. 2022, 13, 1153. [Google Scholar] [CrossRef] [PubMed]
- Wang, Y.; Yuan, Q. Static load-carrying capacity and fatigue life of a double row pitch bearing with radial interference. Proc. Inst. Mech. Eng. Part C J. Mech. Eng. Sci. 2014, 228, 307–316. [Google Scholar] [CrossRef]
- Jiang, J.; Li, T.; Chang, C.; Yang, C.; Liao, L. Fault diagnosis method for lithium-ion batteries in electric vehicles based on isolated forest algorithm. J. Energy Storage 2022, 50, 104177. [Google Scholar] [CrossRef]
Figure 1.
3D Model of Pitch Bearings.

Figure 2.
Contact Illustration between Steel Balls and Raceways.

Figure 3.
Grid independence.

Figure 4.
Bearing Coordinate System.

Figure 5.
Three-dimensional crack damage model.

Figure 6.
The maximum stress value of the outer race surface in normal and cracked state.

Figure 7.
Failure data when divided into 36 copies. (a) Overturning moment of 1.65 × 10⁹ N.MM, (b) Overturning moment of 1.80 × 10⁹ N.MM, (c) Depth 104 mm and overturning moment of 1.65 × 10⁹ N.MM.
Figure 7.
Failure data when divided into 36 copies. (a) Overturning moment of 1.65 × 10⁹ N.MM, (b) Overturning moment of 1.80 × 10⁹ N.MM, (c) Depth 104 mm and overturning moment of 1.65 × 10⁹ N.MM.

Figure 8.
Failure data when divided into 72 copies. (a) Overturning moment of 1.65 × 10⁹ N.MM, (b) Overturning moment of 1.80 × 10⁹ N.MM, (c) Depth 104 mm and overturning moment of 1.65 × 10⁹ N.MM.
Figure 8.
Failure data when divided into 72 copies. (a) Overturning moment of 1.65 × 10⁹ N.MM, (b) Overturning moment of 1.80 × 10⁹ N.MM, (c) Depth 104 mm and overturning moment of 1.65 × 10⁹ N.MM.


Figure 9.
Singularity detection.

Figure 10.
Maximum stress value of the outer race surface in normal and cracked state.

Figure 11.
Failure data when divided into 72 copies.

Figure 12.
Singularity detection.

Figure 13.
Test device system. (a) Strain gauge pasting, (b) Connection mode of strain gauge, (c) Data acquisition equipment, (d) General diagram of the test device.
Figure 13.
Test device system. (a) Strain gauge pasting, (b) Connection mode of strain gauge, (c) Data acquisition equipment, (d) General diagram of the test device.

Figure 14.
Schematic diagram of the testing device.

Figure 15.
Test stress value.

Figure 16.
Normal test data. (a) Normal data (b) Normal data under different loads.

Figure 17.
Faulty bearings.

Figure 18.
Failure test data.

Figure 19.
Singularity detection.

Figure 20.
Fault data. (a) Failure data under different loads, (b) The difference between the fault point and the detected value data.
Figure 20.
Fault data. (a) Failure data under different loads, (b) The difference between the fault point and the detected value data.


Table 1.
Structural Parameters of Pitch Bearings.
| Structural Parameter | Numerical Value | Unit |
|---|---|---|
| Outside diameter D | 3220 | mm |
| Inside diameter d | 2700 | mm |
| Pitch diameter dm | 2950 | mm |
| Ball diameter Dn | 63.5 | mm |
| Bearing height H | 272 | mm |
| Ball quantity Z | 2 × 121 | mm |
| Coefficient of curvature radius of inner race groove fi | 0.525 | |
| Coefficient of curvature radius of outer race groove fe | 0.525 | |
| Contact Angle α | 45 | ° |
Table 2.
Values of Overturning Moment Applied to Pitch Bearings.
| X-Axis Direction/N.MM | Z-Axis Direction/N.MM | Total Moment/N.MM |
|---|---|---|
| 1.50 × 10⁹ | 0 | 1.50 × 10⁹ |
| 1.50 × 10⁹ | 5.00 × 10⁸ | 1.65 × 10⁹ |
| 1.50 × 10⁹ | 1.00 × 10⁹ | 1.80 × 10⁹ |
| 1.50 × 10⁹ | 1.25 × 10⁹ | 1.95 × 10⁹ |
| 2.00 × 10⁹ | 5.00 × 10⁸ | 2.06 × 10⁹ |
| 2.00 × 10⁹ | 1.00 × 10⁹ | 2.24 × 10⁹ |
| 2.00 × 10⁹ | 1.50 × 10⁹ | 2.50 × 10⁹ |
| 2.00 × 10⁹ | 2.00 × 10⁹ | 2.83 × 10⁹ |
Table 3.
Experimental Bearing Specifications.
| Structural Parameter | Numerical Value | Unit |
|---|---|---|
| Outside diameter D | 200 | mm |
| Inside diameter d | 100 | mm |
| Pitch diameter dm | 150 | mm |
| Ball diameter Dn | 10 | mm |
| Bearing height H | 30 | mm |
| Coefficient of curvature radius of inner race groove fi | 0.525 | |
| Coefficient of curvature radius of outer race groove fe | 0.525 | |
| Contact Angle α | 45 | ° |
Table 4.
Strain Gauge Specifications.
| Strain Gauge Parameter | Numerical Value | Unit |
|---|---|---|
| Resistance value | 120 ± 1 | Ω |
| Base length × base width | 9 × 4 | mm |
| Grid length × grid width | 5 × 3 | mm |
| Supply voltage | 3–5 | v |
| Strain limit | 20,000 | um/m |
Disclaimer/Publisher’s Note: The statements, opinions and data contained in all publications are solely those of the individual author(s) and contributor(s) and not of MDPI and/or the editor(s). MDPI and/or the editor(s) disclaim responsibility for any injury to people or property resulting from any ideas, methods, instructions or products referred to in the content. |
© 2024 by the authors. Licensee MDPI, Basel, Switzerland. This article is an open access article distributed under the terms and conditions of the Creative Commons Attribution (CC BY) license (https://creativecommons.org/licenses/by/4.0/).
Share and Cite
MDPI and ACS Style
Wu, Z.; Yang, W.; Song, X.; Wei, K. Study on Condition Monitoring of Pitch Bearings Based on Stress Measurement. Machines 2024, 12, 154. https://0-doi-org.brum.beds.ac.uk/10.3390/machines12030154
AMA Style
Wu Z, Yang W, Song X, Wei K. Study on Condition Monitoring of Pitch Bearings Based on Stress Measurement. Machines. 2024; 12(3):154. https://0-doi-org.brum.beds.ac.uk/10.3390/machines12030154
Chicago/Turabian StyleWu, Zian, Wenxian Yang, Xiaoping Song, and Kexiang Wei. 2024. "Study on Condition Monitoring of Pitch Bearings Based on Stress Measurement" Machines 12, no. 3: 154. https://0-doi-org.brum.beds.ac.uk/10.3390/machines12030154
Note that from the first issue of 2016, this journal uses article numbers instead of page numbers. See further details here.