
Comparison of Ki-67 Labeling Index Patterns of Diffuse Large B-Cell Lymphomas and Burkitt Lymphomas Using Image Analysis: A Multicenter Study

 ,
,  ,
,  ,
,
Abstract
:1. Introduction
2. Materials and Methods
2.1. Samples
2.2. Image Analysis
2.3. Statistical Analysis
3. Results
3.1. Sample Characteristics
3.2. Ki-67 Labeling Index between BLs and DLBCLs
3.3. Ki-67 Labeling Index between ABC and GCB Subtypes of DLBCLs
3.4. Ki-67 Labeling Index between BLs and ABC and GCB Subtypes of DLBCLs
3.5. Ki-67 Labeling Index between BLs and DLBCLs with a High Proliferation Index
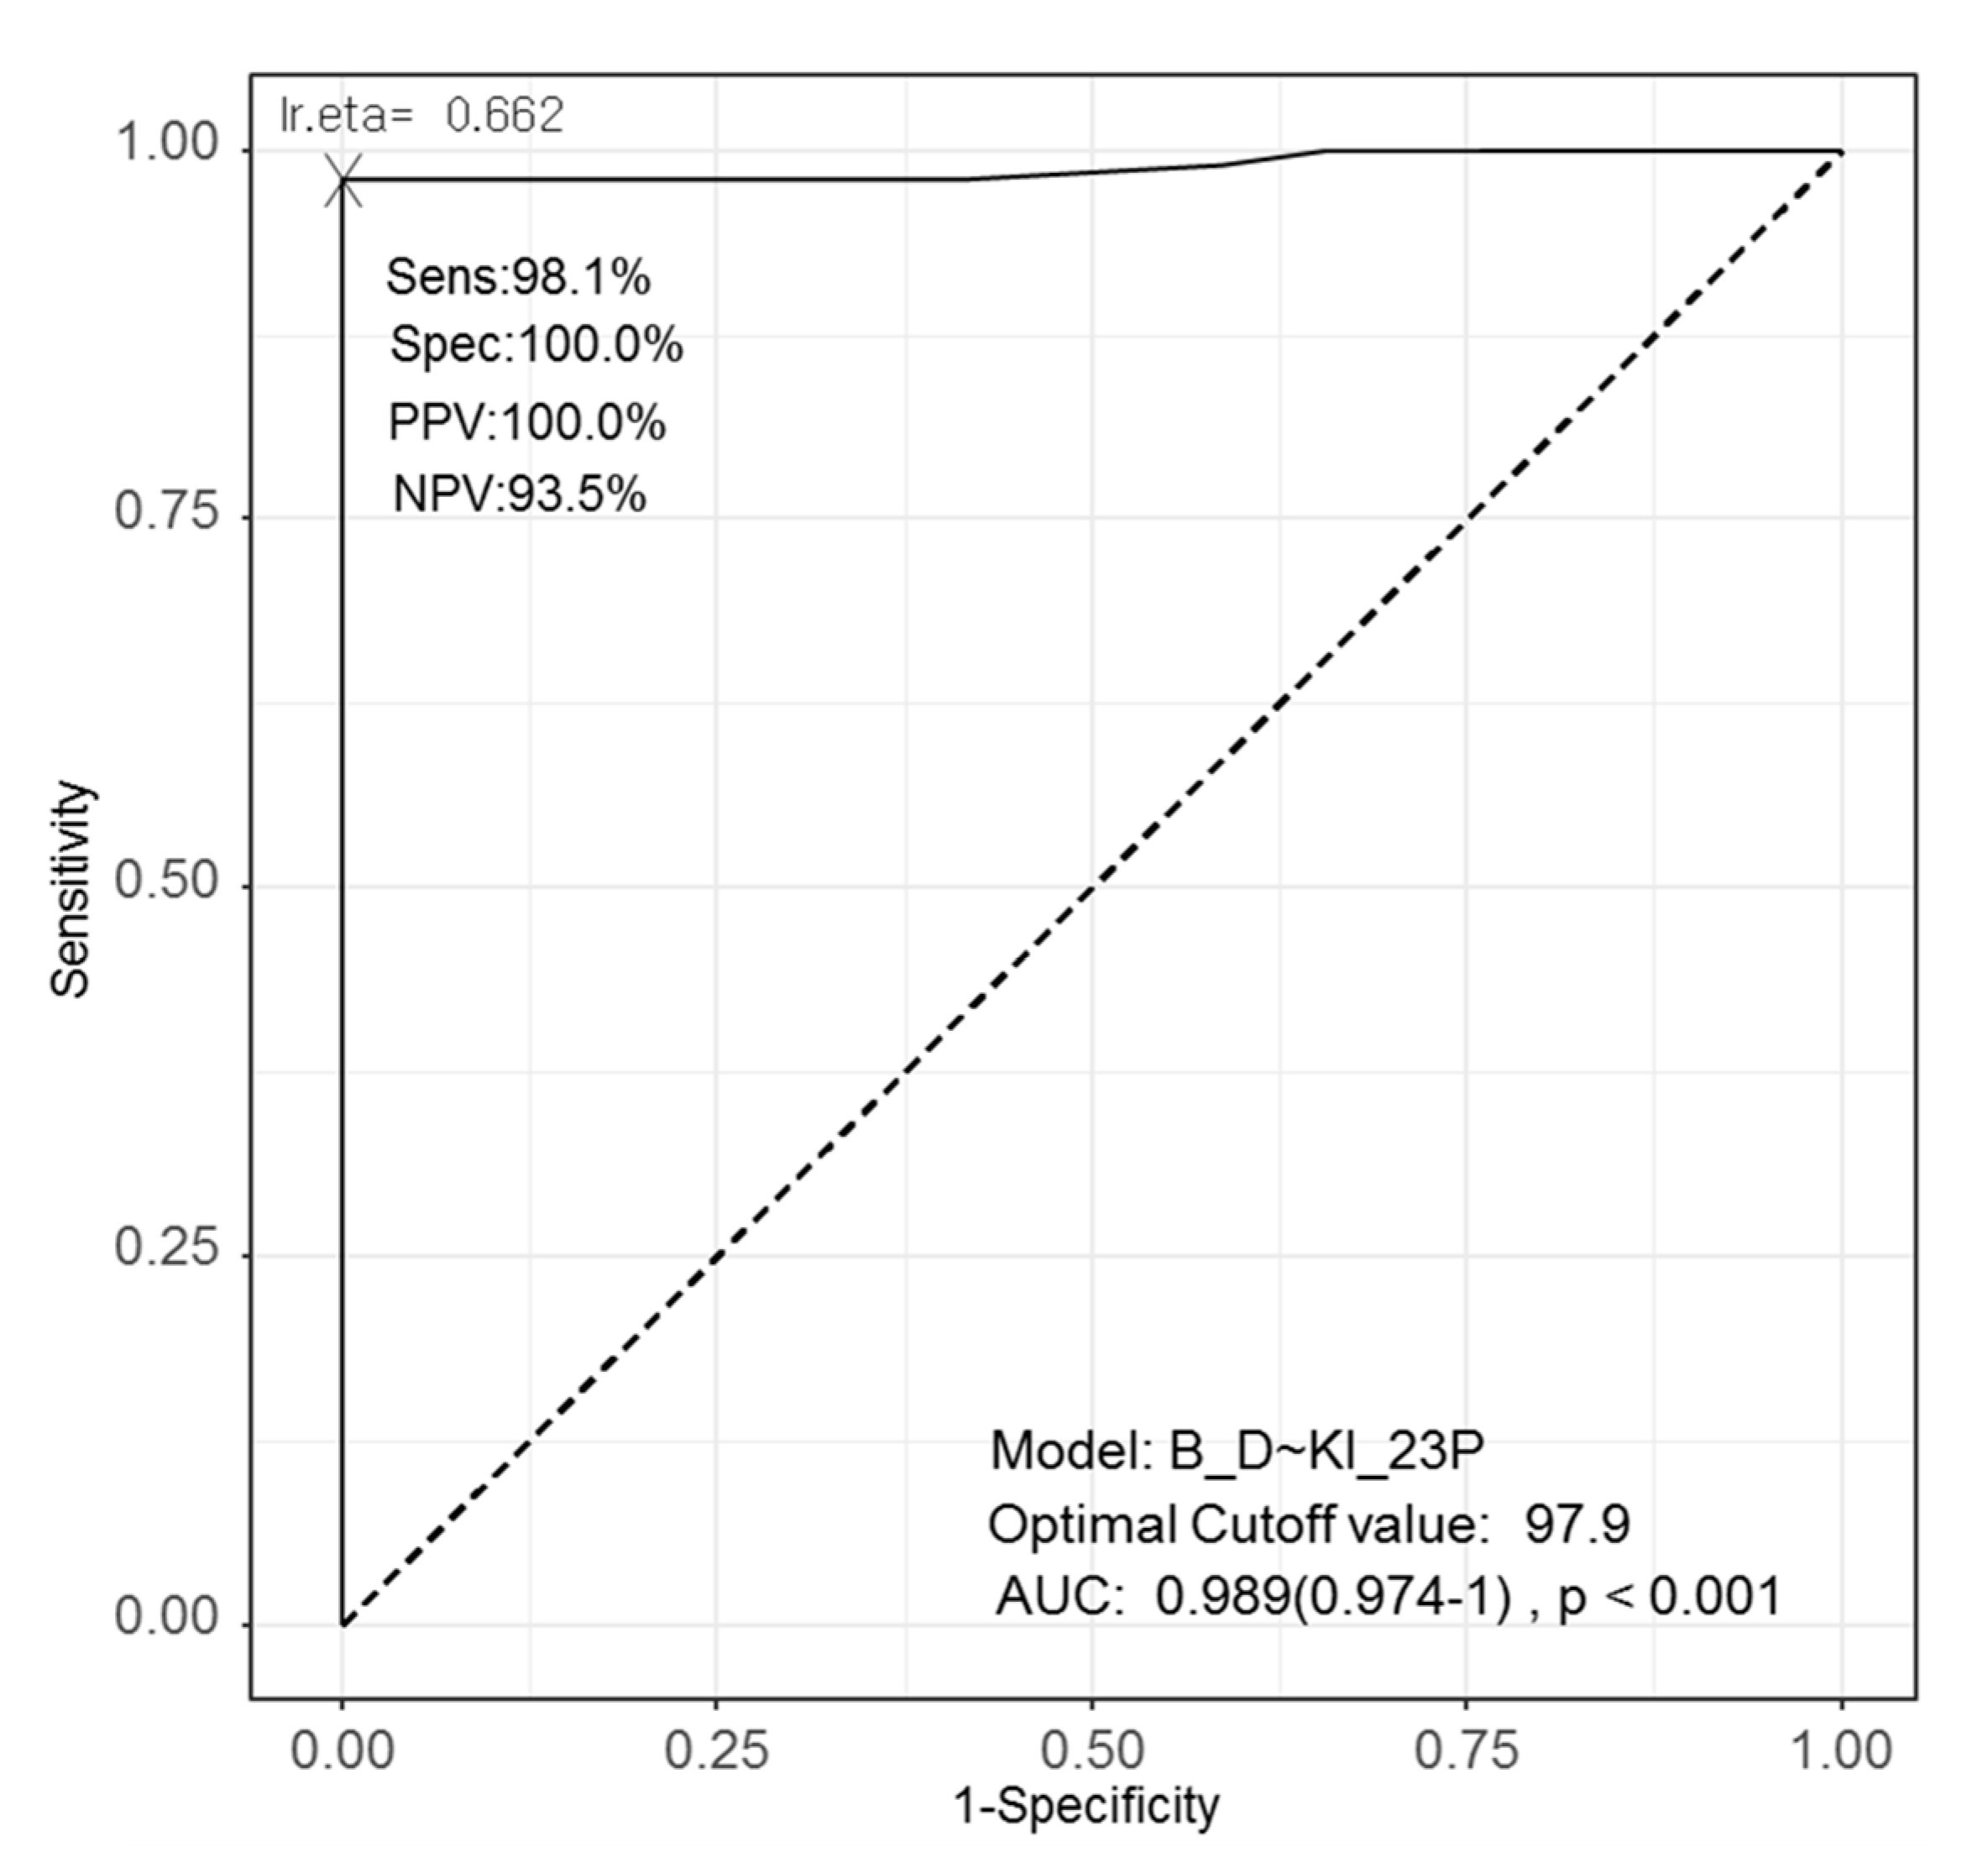
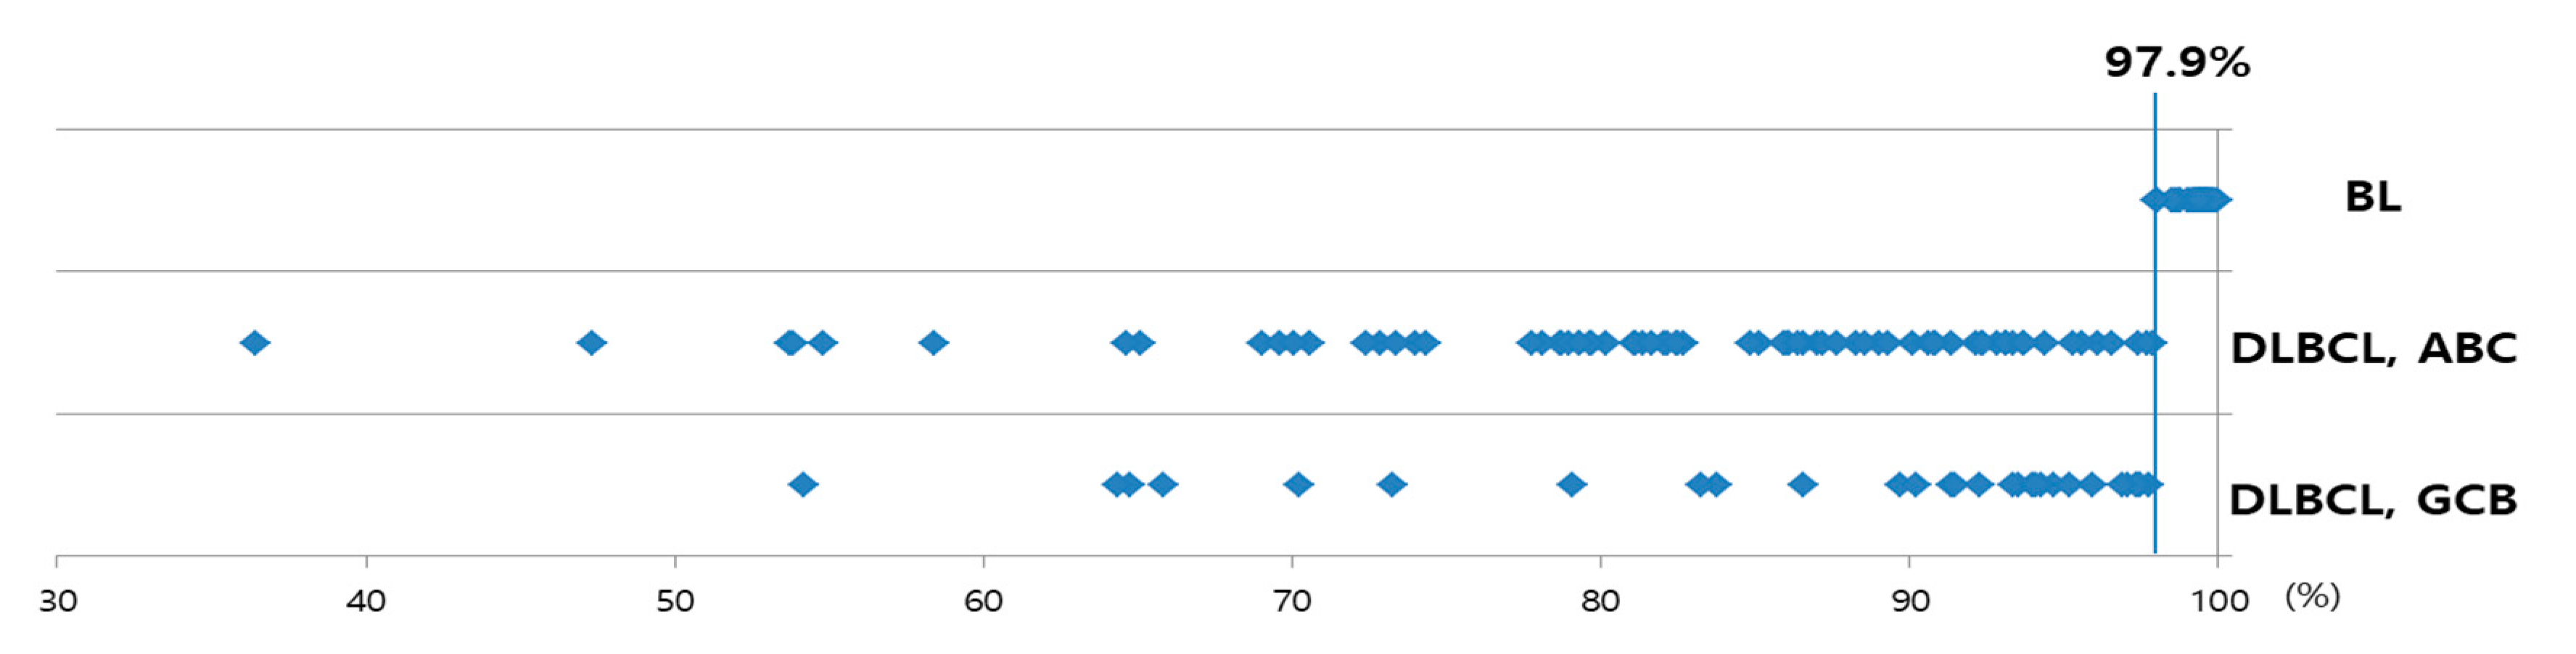
3.6. ROC Curve, AUC, and Optimal Cut-Off Value for Differentiating BLs and DLBCLs
3.7. Inter- and Intra-Observer Variability (Comparison between the Samples Reviewed by Different People and on Different Days)
4. Discussion
5. Conclusions
Supplementary Materials
Author Contributions
Funding
Institutional Review Board Statement
Informed Consent Statement
Data Availability Statement
Acknowledgments
Conflicts of Interest
References
- Campo, E.; Harris, N.L.; Pileri, S.A. WHO Classification of Tumours of Haematopoietic and Lymphoid Tissues; International Agency for Research on Cancer: Lyon, France, 2017. [Google Scholar]
- Jung, H.R.; Huh, J.; Ko, Y.H.; Jeon, Y.K.; Yoon, S.O.; Kim, S.H.; Yang, W.I.; Park, G.; Kim, J.H.; Paik, J.H.; et al. Classification of malignant lymphoma subtypes in Korean patients: A report of the 4th nationwide study. J. Hematop. 2019, 12, 173–181. [Google Scholar] [CrossRef]
- Jaffe, E.S.; Arber, D.A.; Harris, N.L.; Campo, E.; Quintanilla-Fend, L. Hematopathology, 2nd ed.; Elsevier: Amsterdam, The Netherlands, 2016.
- Siegel, R.L.; Miller, K.D.; Fuchs, H.E.; Jemal, A. Cancer Statistics, 2021. CA Cancer J. Clin. 2021, 71, 7–33. [Google Scholar] [CrossRef] [PubMed]
- Bellan, C.; Stefano, L.; Giulia, D.F.; Rogena, E.A.; Lorenzo, L. Burkitt lymphoma versus diffuse large B-cell lymphoma: A practical approach. Hematol. Oncol. 2010, 28, 53–56. [Google Scholar] [PubMed]
- Chen, B.-J.; Fend, F.; Campo, E.; Quintanilla-Martinez, L. Aggressive B-cell lymphomas—from morphology to molecular pathogenesis. Ann. Lymphoma 2019, 3. [Google Scholar] [CrossRef]
- Frick, M.; Dörken, B.; Lenz, G. The molecular biology of diffuse large B-cell lymphoma. Adv. Hematol. 2011, 2, 369–379. [Google Scholar] [CrossRef] [Green Version]
- Menon, M.P.; Pittaluga, S.; Jaffe, E.S. The histological and biological spectrum of diffuse large B-cell lymphoma in the World Health Organization classification. Cancer J. 2012, 18, 411–420. [Google Scholar] [CrossRef] [Green Version]
- Crombie, J.; LaCasce, A. The treatment of Burkitt lymphoma in adults. Blood J. Am. Soc. Hematol. 2021, 137, 743–750. [Google Scholar]
- Swerdlow, S.H.; Campo, E.; Pileri, S.A.; Harris, N.L.; Stein, H.; Siebert, R.; Advani, R.; Ghielmini, M.; Salles, G.A.; Zelenetz, A.D.; et al. The 2016 revision of the World Health Organization classification of lymphoid neoplasms. Blood 2016, 127, 2375–2390. [Google Scholar] [CrossRef] [PubMed] [Green Version]
- Di Napoli, A.; Remotti, D.; Agostinelli, C.; Ambrosio, M.R.; Ascani, S.; Carbone, A.; Facchetti, F.; Lazzi, S.; Leoncini, L.; Lucioni, M.; et al. A practical algorithmic approach to mature aggressive B cell lymphoma diagnosis in the double/triple hit era: Selecting cases, matching clinical benefit. Virchows Arch. 2019, 475, 513–518. [Google Scholar] [CrossRef] [Green Version]
- Li, S.; Lin, P.; Young, K.H.; Kanagal-Shamanna, R.; Yin, C.C.; Medeiros, L.J. MYC/BCL2 double-hit high-grade B-cell lymphoma. Adv. Anat. Pathol. 2013, 20, 315–326. [Google Scholar] [CrossRef]
- Xie, Y.; Pittaluga, S.; Jaffe, E.S. The histological classification of diffuse large B-cell lymphomas. Semin. Hematol. 2015, 52, 57–66. [Google Scholar] [CrossRef] [Green Version]
- Sabattini, E.; Bacci, F.; Sagramoso, C.; Pileri, S.A. WHO classification of tumours of haematopoietic and lymphoid tissues in 2008: An overview. Pathologica 2010, 102, 83–87. [Google Scholar] [PubMed]
- Chettiankandy, T.J.; Tupkari, J.V.; Kumar, K.; Ahire, M.S. B-cell lymphoma, unclassifiable, with features intermediate between diffuse large B-cell lymphoma and classical Burkitt’s lymphoma: A case report and review. J. Oral. Maxillofac. Pathol. 2016, 20, 333. [Google Scholar] [CrossRef] [PubMed]
- Naresh, K.N.; Ibrahim, H.A.; Lazzi, S.; Rince, P.; Onorati, M.; Ambrosio, M.R.; Bilhou-Nabera, C.; Amen, F.; Reid, A.; Mawanda, M.; et al. Diagnosis of Burkitt lymphoma using an algorithmic approach—Applicable in both resource-poor and resource-rich countries. Br. J. Haematol. 2011, 154, 770–776. [Google Scholar] [CrossRef]
- Web-R, a Web-Based Statistical Analysis Software. Available online: http://web-r.org (accessed on 17 February 2021).
- Taub, R.; Moulding, C.; Battey, J.; Murphy, W.; Vasicek, T.; Lenoir, G.M.; Leder, P. Activation and somatic mutation of the translocated c-myc gene in Burkitt lymphoma cells. Cell 1984, 36, 339–348. [Google Scholar] [CrossRef]
- O’Malley, D.P.; Auerbach, A.; Weiss, L.M. Practical Applications in Immunohistochemistry: Evaluation of Diffuse Large B-Cell Lymphoma and Related Large B-Cell Lymphomas. Arch. Pathol. Lab. Med. 2015, 139, 1094–1107. [Google Scholar] [CrossRef]
- Miller, I.; Min, M.; Yang, C.; Tian, C.; Gookin, S.; Carter, D.; Spencer, S.L. Ki67 is a Graded Rather than a Binary Marker of Proliferation versus Quiescence. Cell Rep. 2018, 24, 1105–1112.e1105. [Google Scholar] [CrossRef] [Green Version]
- Broyde, A.; Boycov, O.; Strenov, Y.; Okon, E.; Shpilberg, O.; Bairey, O. Role and prognostic significance of the Ki-67 index in non-Hodgkin’s lymphoma. Am. J. Hematol. 2009, 84, 338–343. [Google Scholar] [CrossRef]
- Llanos, M.; Alvarez-Argüelles, H.; Alemán, R.; Oramas, J.; Díaz-Flores, L.; Batista, N. Prognostic significance of Ki-67 nuclear proliferative antigen, bcl-2 protein, and p53 expression in follicular and diffuse large B-cell lymphoma. Med. Oncol. 2001, 18, 15–22. [Google Scholar] [CrossRef]
- Acs, B.; Pelekanou, V.; Bai, Y.; Martinez-Morilla, S.; Toki, M.; Leung, S.C.Y.; Nielsen, T.O.; Rimm, D.L. Ki67 reproducibility using digital image analysis: An inter-platform and inter-operator study. Lab. Investig. 2019, 99, 107–117. [Google Scholar] [CrossRef]
- Koopman, T.; Buikema, H.J.; Hollema, H.; de Bock, G.H.; van der Vegt, B. Digital image analysis of Ki67 proliferation index in breast cancer using virtual dual staining on whole tissue sections: Clinical validation and inter-platform agreement. Breast Cancer Res. Treat. 2018, 169, 33–42. [Google Scholar] [CrossRef] [PubMed] [Green Version]
- Laurinavicius, A.; Plancoulaine, B.; Laurinaviciene, A.; Herlin, P.; Meskauskas, R.; Baltrusaityte, I.; Besusparis, J.; Dasevicius, D.; Elie, N.; Iqbal, Y.; et al. A methodology to ensure and improve accuracy of Ki67 labelling index estimation by automated digital image analysis in breast cancer tissue. Breast Cancer Res. 2014, 16, R35. [Google Scholar] [CrossRef] [Green Version]
- Tuominen, V.J.; Ruotoistenmäki, S.; Viitanen, A.; Jumppanen, M.; Isola, J. ImmunoRatio: A publicly available web application for quantitative image analysis of estrogen receptor (ER), progesterone receptor (PR), and Ki-67. Breast Cancer Res. 2010, 12, R56. [Google Scholar] [CrossRef] [PubMed] [Green Version]
- Zhang, Y.; Wang, H.; Ren, C.; Yu, H.; Fang, W.; Zhang, N.; Gao, S.; Hou, Q. Correlation Between C-MYC, BCL-2, and BCL-6 Protein Expression and Gene Translocation as Biomarkers in Diagnosis and Prognosis of Diffuse Large B-cell Lymphoma. Front. Pharm. 2019, 9, 1497. [Google Scholar] [CrossRef] [PubMed]


| Clinicopathologic Parameters | Units | BLs | DLBCLs | p-Value | ||
|---|---|---|---|---|---|---|
| (n = 29) | (n = 103) | |||||
| Age | years | 51.0 ± 24.8 | range 5–81 | 62.1 ± 14.6 | range 17–89 | 0.027 |
| Sex | 0.951 | |||||
| Male | No. | 18 (62.1%) | 61 (59.2%) | |||
| Female | No. | 11 (37.9%) | 42 (40.8%) | |||
| M:F | 1:0.61 | 1:0.69 | ||||
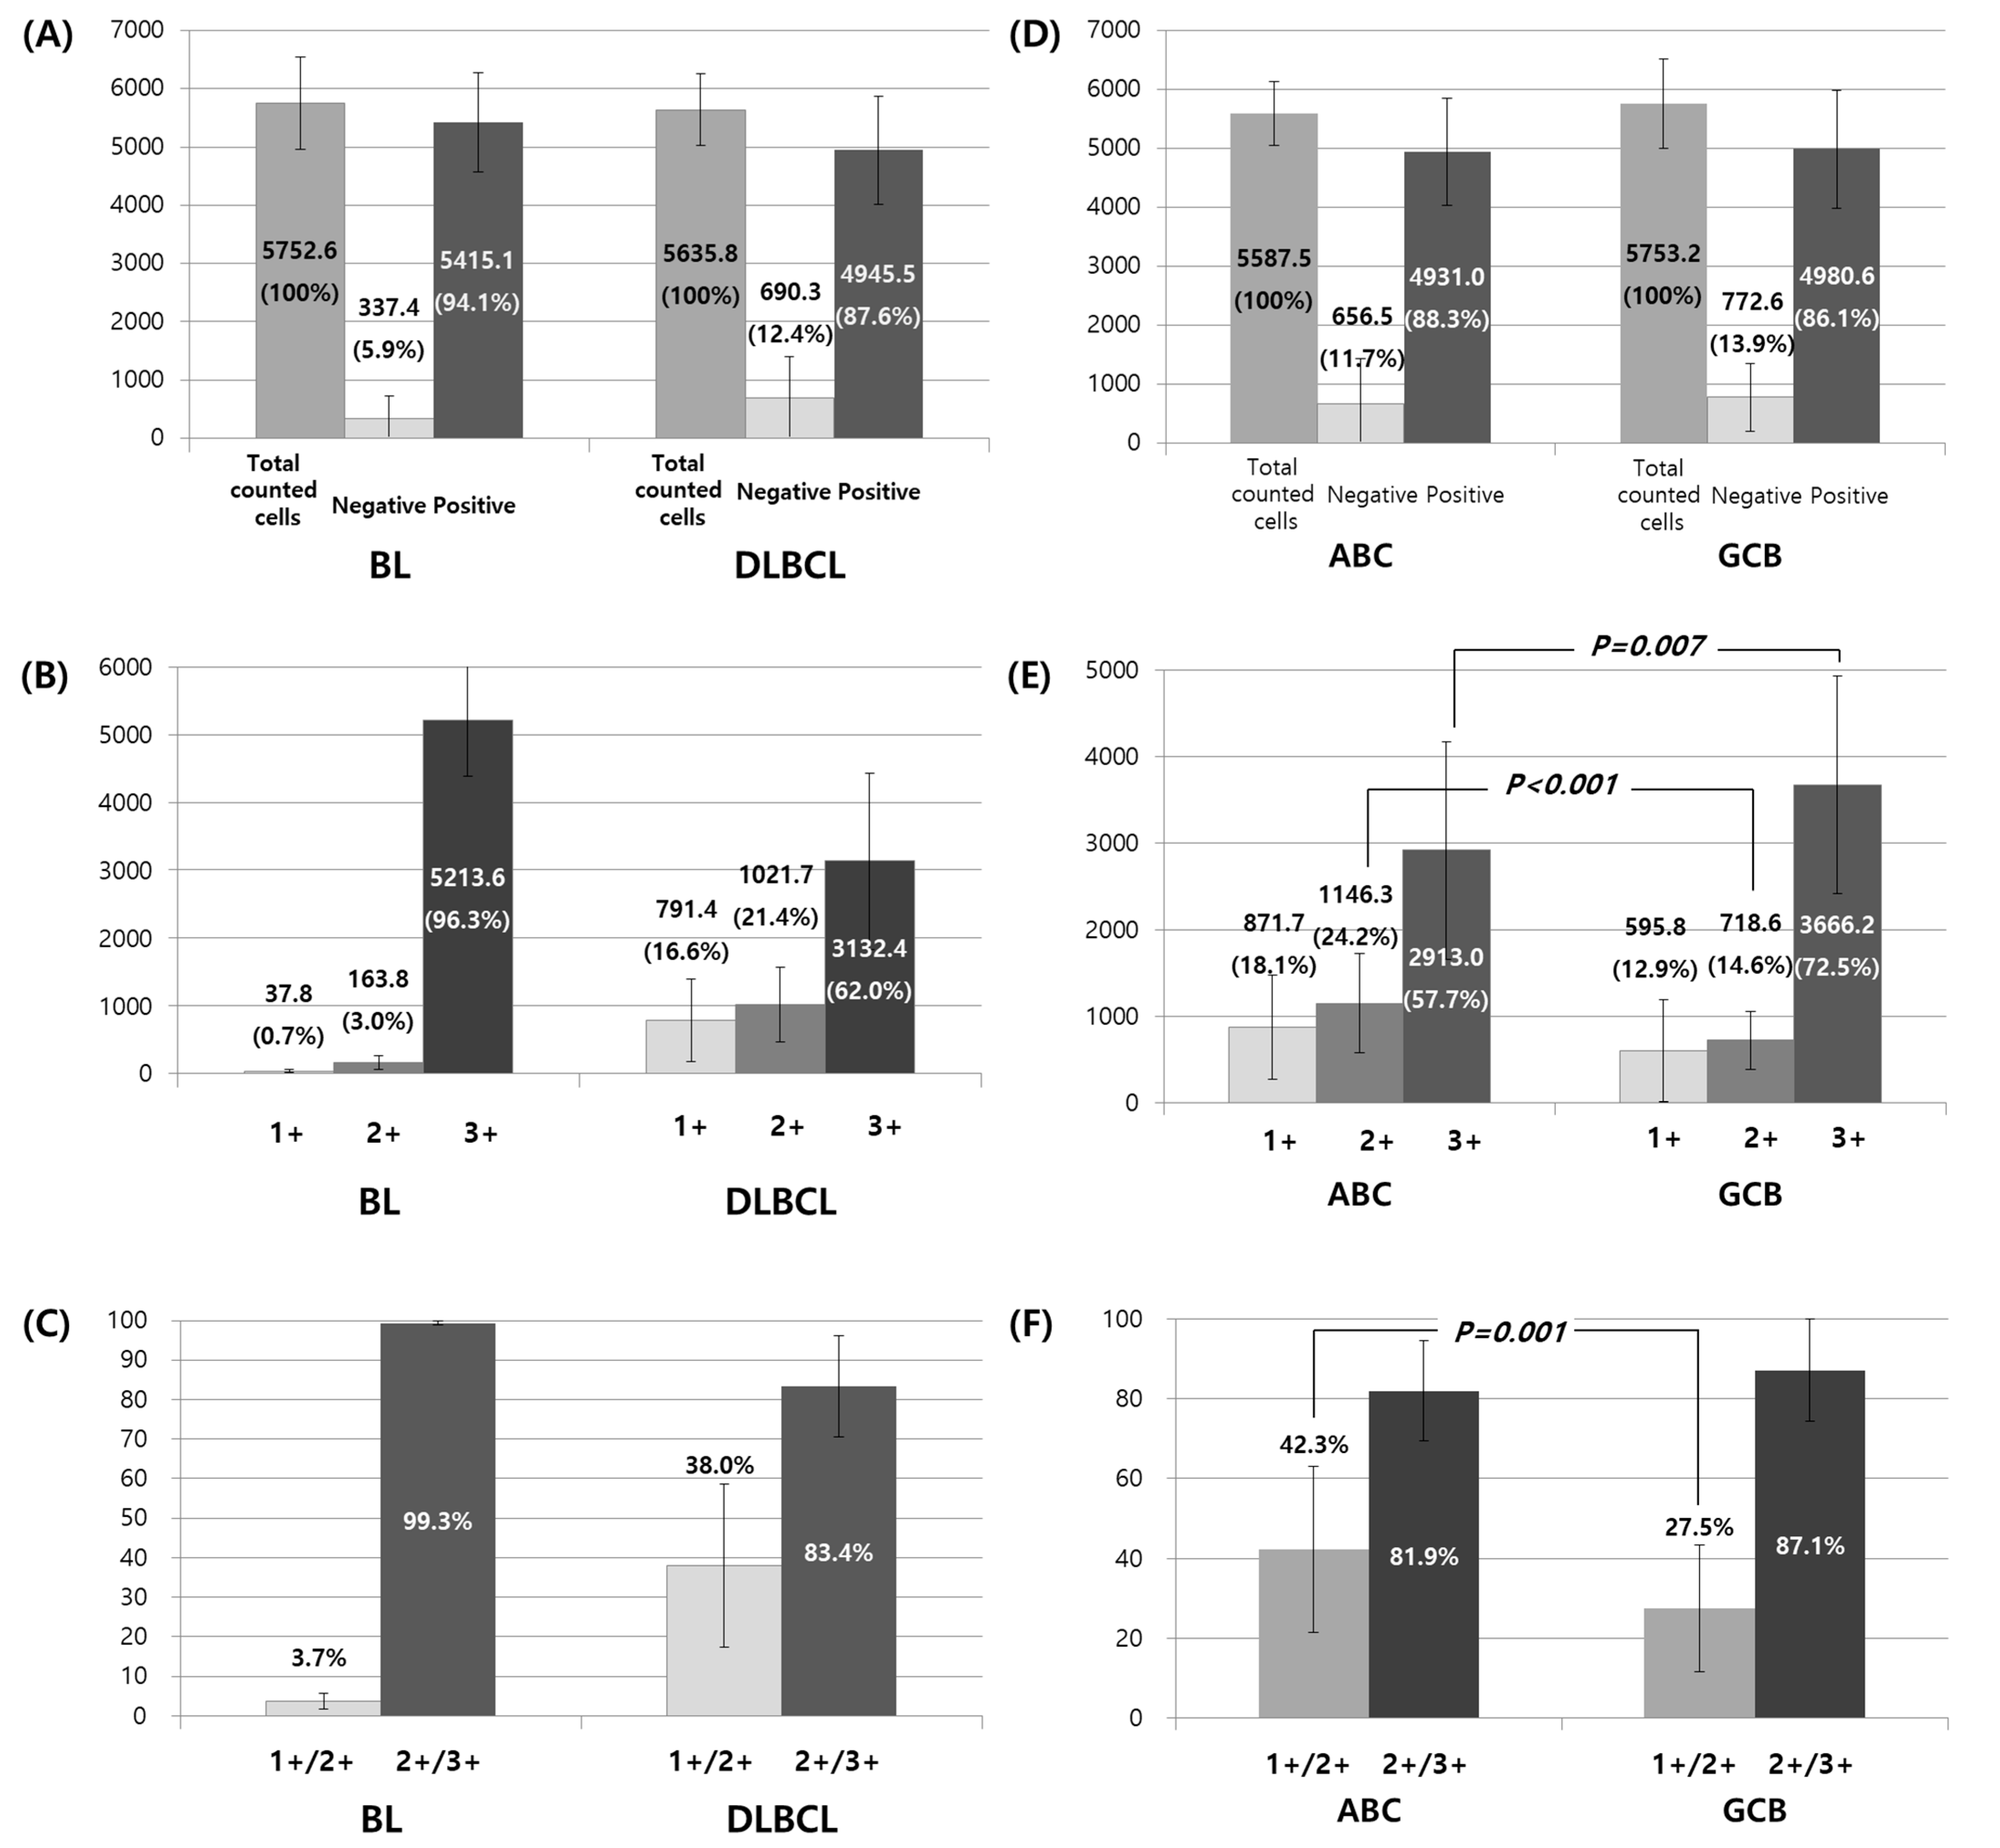
| Total counted cells | No. | 5752.6 ± 786.2 | 4269–7613 | 5635.8 ± 612.8 | 3437–8239 | 0.397 |
| Negative cells | No. | 337.4 ± 385.4 | 23–1468 | 690.3 ± 715.2 | 7–2882 | 0.001 |
| % | 5.9 ± 6.6 | 0.4–26.6 | 12.4 ± 13.2 | 0.1–53.5 | <0.001 | |
| Positive cells | No. | 5415.1 ± 850.9 | 4002–7442 | 4945.5 ± 928.1 | 2168–7421 | 0.016 |
| % | 94.1 ± 6.6 | 73.4–99.6 | 87.6 ± 13.2 | 46.5–99.9 | <0.001 | |
| 1+ | No. | 37.8 ± 24.9 | 2–103 | 791.4 ± 608.1 | 29–3337 | <0.001 |
| % | 0.7 ± 0.5 | 0.0–2.0 | 14.2 ± 11.1 | 0.4–58.7 | <0.001 | |
| 2+ | No. | 163.8 ± 102.3 | 10–493 | 1021.7 ± 547.2 | 148–2451 | <0.001 |
| % | 2.9 ± 1.7 | 0.2–9.2 | 18.1 ± 9.5 | 2.8–45.5 | <0.001 | |
| 3+ | No. | 5213.6 ± 825.7 | 3737–7269 | 3132.4 ± 1296.8 | 147–6422 | <0.001 |
| % | 90.6 ± 6.2 | 67.8–95.5 | 55.3 ± 21.3 | 2.6–92.1 | <0.001 | |
| Proportion of 1+ in positive cells | % | 0.7 ± 0.5 | 16.6 ± 12.8 | <0.001 | ||
| Proportion of 2+ in positive cells | % | 3.0 ± 1.8 | 21.4 ± 12.3 | <0.001 | ||
| Proportion of 3+ in positive cells | % | 96.3 ± 2.0 | 62.0 ± 20.6 | <0.001 | ||
| Proportion of 1+/2+ in positive cells | % | 3.7 ± 2.0 | 38.0 ± 20.6 | <0.001 | ||
| Proportion of 2+/3+ in positive cells | % | 99.3 ± 0.5 | 83.4 ± 12.8 | <0.001 | ||
| Clinicopathologic Parameters | Units | ABC Type | GCB Type | p-Value | ||
|---|---|---|---|---|---|---|
| (n = 73) | (n = 30) | |||||
| Age | years | 62.8 ± 14.5 | range 24–89 | 60.5 ± 15.2 | range 17–84 | 0.475 |
| Sex | 0.099 | |||||
| Male | No. | 39 (53.4%) | 22 (73.3%) | |||
| Female | No. | 34 (46.6%) | 8 (26.7%) | |||
| M:F | 1:0.87 | 1:0.36 | ||||
| Total counted cells | No. | 5587.5 ± 541.1 | 4520–8239 | 5753.2 ± 757.6 | 3437–7133 | 0.282 |
| Negative cells | No. | 656.5 ± 767.6 | 7–2882 | 772.6 ± 571.4 | 13–2438 | 0.457 |
| % | 11.7 ± 14.0 | 0.1–53.5 | 13.9 ± 11.1 | 0.2–46.4 | 0.457 | |
| Positive cells | No. | 4931.0 ± 905.0 | 2378–7421 | 4980.6 ± 997.1 | 2168–6866 | 0.807 |
| % | 88.3 ± 14.0 | 46.5–99.9 | 86.1 ± 11.1 | 53.6–99.8 | 0.457 | |
| 1+ | No. | 871.7 ± 599.3 | 115–3337 | 595.8 ± 594.3 | 115–2344 | 0.036 |
| % | 15.6 ± 10.8 | 2.0–58.7 | 10.8 ± 10.8 | 2.1–44.8 | 0.046 | |
| 2+ | No. | 1146.3 ± 570.4 | 335–2451 | 718.6 ± 333.6 | 148–1520 | <0.001 |
| % | 20.4 ± 9.9 | 5.6–45.5 | 12.4 ± 5.4 | 2.8–24.5 | <0.001 | |
| 3+ | No. | 2913.0 ± 1256.9 | 147–5253 | 3666.2 ± 1227.8 | 1422–6287 | 0.007 |
| % | 52.2 ± 22.2 | 2.6–88.5 | 62.9 ± 16.8 | 27.0–92.1 | 0.021 | |
| Proportion of 1+ in positive cells | % | 18.1 ± 12.6 | 12.8 ± 12.3 | 0.063 | ||
| Proportion of 2+ in positive cells | % | 24.2 ± 13.1 | 14.6 ± 5.9 | <0.001 | ||
| Proportion of 3+ in positive cells | % | 57.7 ± 20.8 | 72.6 ± 15.4 | 0.001 | ||
| Proportion of 1+/2+ in positive cells | % | 42.3 ± 20.8 | 27.4 ± 15.4 | 0.001 | ||
| Proportion of 2+/3+ in positive cells | % | 81.9 ± 12.6 | 87.2 ± 12.3 | 0.063 | ||
| Clinicopathologic Parameters | Units | BLs | DLBCLs with a High Proliferation Index (2+/3+ > 90%) | p-Value | ||
|---|---|---|---|---|---|---|
| (n = 29) | (n = 42, 23 ABC, 19 GCB) | |||||
| Age | years | 51.0 ± 24.8 | range 5–81 | 62.2 ± 14.9 | range 25–85 | 0.034 |
| Sex | 1.000 | |||||
| Male | No. | 18 (62.1%) | 26 (61.9%) | |||
| Female | No. | 11 (37.9%) | 16 (38.1%) | |||
| M:F | 1:0.61 | 1:0.62 | ||||
| Total counted cells | No. | 5752.6 ± 786.2 | 4269–7613 | 5759.9 ± 575.9 | 5004–7133 | 0.964 |
| Negative cells | No. | 337.4 ± 385.4 | 23–1468 | 669.2 ± 681.5 | 7–2737 | 0.011 |
| % | 5.9 ± 6.6 | 0.4–26.6 | 11.7 ± 12.6 | 0.1–53.5 | 0.013 | |
| Positive cells | No. | 5415.1 ± 850.9 | 4002–7442 | 5090.7 ± 899.6 | 2378–6866 | 0.131 |
| % | 94.1 ± 6.6 | 73.4–99.6 | 88.3 ± 12.6 | 46.5–99.9 | 0.013 | |
| 1+ | No. | 37.8 ± 24.9 | 2–103 | 281.6 ± 126.2 | 29–519 | <0.001 |
| % | 0.7 ± 0.5 | 0.0–2.0 | 5.0 ± 2.3 | 0.4–9.3 | <0.001 | |
| 2+ | No. | 163.8 ± 102.3 | 10–493 | 835.6 ± 503.5 | 148–2400 | <0.001 |
| % | 2.9 ± 1.7 | 0.2–9.2 | 14.6 ± 8.9 | 2.8–45.5 | <0.001 | |
| 3+ | No. | 5213.6 ± 825.7 | 3737–7269 | 3973.4 ± 1095.3 | 898–6422 | <0.001 |
| % | 90.6 ± 6.2 | 67.8–95.5 | 68.7 ± 17.1 | 17.0–92.1 | <0.001 | |
| Proportion of 1+ in positive cells | % | 0.7 ± 0.5 | 5.7 ± 2.6 | <0.001 | ||
| Proportion of 2+ in positive cells | % | 3.0 ± 1.8 | 17.4 ± 12.6 | <0.001 | ||
| Proportion of 3+ in positive cells | % | 96.3 ± 2.0 | 76.9 ± 13.7 | <0.001 | ||
| Proportion of 1+/2+ in positive cells | % | 3.7 ± 2.0 | 23.1 ± 13.7 | <0.001 | ||
| Proportion of 2+/3+ in positive cells | % | 99.3 ± 0.5 | 94.3 ± 2.6 | <0.001 | ||
Publisher’s Note: MDPI stays neutral with regard to jurisdictional claims in published maps and institutional affiliations. |
© 2021 by the authors. Licensee MDPI, Basel, Switzerland. This article is an open access article distributed under the terms and conditions of the Creative Commons Attribution (CC BY) license (http://creativecommons.org/licenses/by/4.0/).
Share and Cite
Chong, Y.; Kim, T.E.; Cho, U.; Jin, M.-S.; Yim, K.; Thakur, N.; Kim, J.O.; Cho, I.; Park, G. Comparison of Ki-67 Labeling Index Patterns of Diffuse Large B-Cell Lymphomas and Burkitt Lymphomas Using Image Analysis: A Multicenter Study. Diagnostics 2021, 11, 343. https://0-doi-org.brum.beds.ac.uk/10.3390/diagnostics11020343
Chong Y, Kim TE, Cho U, Jin M-S, Yim K, Thakur N, Kim JO, Cho I, Park G. Comparison of Ki-67 Labeling Index Patterns of Diffuse Large B-Cell Lymphomas and Burkitt Lymphomas Using Image Analysis: A Multicenter Study. Diagnostics. 2021; 11(2):343. https://0-doi-org.brum.beds.ac.uk/10.3390/diagnostics11020343
Chicago/Turabian StyleChong, Yosep, Tae Eun Kim, Uiju Cho, Min-Sun Jin, Kwangil Yim, Nishant Thakur, Jong Ok Kim, Inju Cho, and Gyeongsin Park. 2021. "Comparison of Ki-67 Labeling Index Patterns of Diffuse Large B-Cell Lymphomas and Burkitt Lymphomas Using Image Analysis: A Multicenter Study" Diagnostics 11, no. 2: 343. https://0-doi-org.brum.beds.ac.uk/10.3390/diagnostics11020343