Article

EVAE-Net: An Ensemble Variational Autoencoder Deep Learning Network for COVID-19 Classification Based on Chest X-ray Images

by
Daniel Addo
1,*,
Shijie Zhou
1,
Jehoiada Kofi Jackson
1,
Grace Ugochi Nneji
2,
Happy Nkanta Monday
2,
Kwabena Sarpong
1,
Rutherford Agbeshi Patamia
1,
Favour Ekong
1 and
Christyn Akosua Owusu-Agyei
3
1
School of Information and Software Engineering, University of Electronic Science and Technology of China, Chengdu 610056, China
2
Department of Computing, Oxford Brookes College of Chengdu University of Technology, Chengdu 610059, China
3
School of Computing and Artificial Intelligence, Southwest Jiaotong University, Chengdu 610032, China
*
Author to whom correspondence should be addressed.
Submission received: 23 September 2022 / Revised: 13 October 2022 / Accepted: 18 October 2022 / Published: 22 October 2022

Abstract

:
The COVID-19 pandemic has had a significant impact on many lives and the economies of many countries since late December 2019. Early detection with high accuracy is essential to help break the chain of transmission. Several radiological methodologies, such as CT scan and chest X-ray, have been employed in diagnosing and monitoring COVID-19 disease. Still, these methodologies are time-consuming and require trial and error. Machine learning techniques are currently being applied by several studies to deal with COVID-19. This study exploits the latent embeddings of variational autoencoders combined with ensemble techniques to propose three effective EVAE-Net models to detect COVID-19 disease. Two encoders are trained on chest X-ray images to generate two feature maps. The feature maps are concatenated and passed to either a combined or individual reparameterization phase to generate latent embeddings by sampling from a distribution. The latent embeddings are concatenated and passed to a classification head for classification. The COVID-19 Radiography Dataset from Kaggle is the source of chest X-ray images. The performances of the three models are evaluated. The proposed model shows satisfactory performance, with the best model achieving 99.19 % and 98.66 % accuracy on four classes and three classes, respectively.

1. Introduction

In late December 2019, the COVID-19 disease was discovered in Wuhan, a city in eastern China, and began spreading worldwide. By March 2020, the World Health Organization (WHO) classified it as a pandemic. COVID-19 is a pathogen strain caused by SARS-CoV2 that causes severe acute respiratory discomfort and exhibits symptoms of pneumonia in humans. The infection usually starts in the mucous membrane in the throat and rapidly spreads to the lungs. Once in the lungs, it impairs function and mutates rapidly before a patient can be diagnosed correctly. It is transmitted efficiently from human-to-human via aerosol and is highly infectious. This makes COVID-19 a public health emergency. Early detection and diagnosis are significant for breaking the transmission chain and controlling its spread.
To help control the spread of the disease, healthcare professionals and researchers have adopted several modalities to detect the virus. Some of the modalities include reverse transcriptase–polymerase chain reaction (RT-PCR) test [1], chest X-ray (CXR) image [2,3], and computed tomography (CT) scans [4]. RT-PCR has been the go-to diagnostic modality for detecting COVID-19 pathogens. It requires acquiring a respiratory specimen from the subject’s body. Though efficient, it has some disadvantages, such as a longer detection time and a lower detection rate.
Chest radiography images in the last decade have been used as a primary diagnostic tool in clinical practice to examine the cardiothoracic region for abnormalities. Pulmonary fibrosis, pneumonia, emphysema, chronic bronchitis, and lung cancer are a few of the pulmonary diseases that have been detected using chest radiography images [5,6]. In using CXR images as a diagnostic tool, lung abnormalities, such as bilateral or interstitial lung consolidation and/or ground grass opacities [7] can be identified, making CXR images a remarkable tool for detecting of COVID-19 disease at the early stage [8]. Given the similarity between COVID-19 and other respiratory disorders, such as pneumonia, the experience of the specialist is essential to identify and characterize COVID-19 biomarkers from other related clinical findings. Manually characterizing and identifying these biomarkers is tedious and does not permit the procedure to be repeated since it is time-consuming. Therefore, an automatic system is required to identify normal or COVID-19 cases with high accuracy by analyzing CXR images. Not only will it speed up the detection process, but it will also help reduce the workloads of health professionals.
Detecting COVID-19 is a typical classification problem in machine learning (ML) and deep learning (DL). ML and DL have demonstrated their effectiveness in solving problems in several domains. One advantage that has placed ML and DL as benchmark techniques in medical imaging is their computational capabilities and the availability of large labeled datasets [9]. They have been explored to detect pulmonary abnormalities in CXR imaging [10]. A deep convolutional neural network (CNN) for classifying lung images was proposed by Anthimopoulos et al. [11]. A CNN-based method to quantify the percentage of emphysema on simulated CXR images was presented by Campo et al. [12]. A deep neural network that incorporates both global and local features to identify pneumonia was proposed by Jaiswal et al. [13]. In the context of COVID-19, several works have been proposed to detect COVID-19 disease using CXR images [14,15,16,17].
DL models may suffer from overfitting, high variance, and/or generalization errors because of the limited size of the training data and the presence of noise in the training data. Ensemble learning is a technique used to combine multiple models and is a practical approach to handling these errors. Not only does it handle these errors, it also yields better results compared to single models [18].
Researchers have recently found that unsupervised pre-training helps train supervised deep neural networks [19]. One such fundamental unsupervised method employed to transform raw input data into a meaningful representation is autoencoders (AEs) [
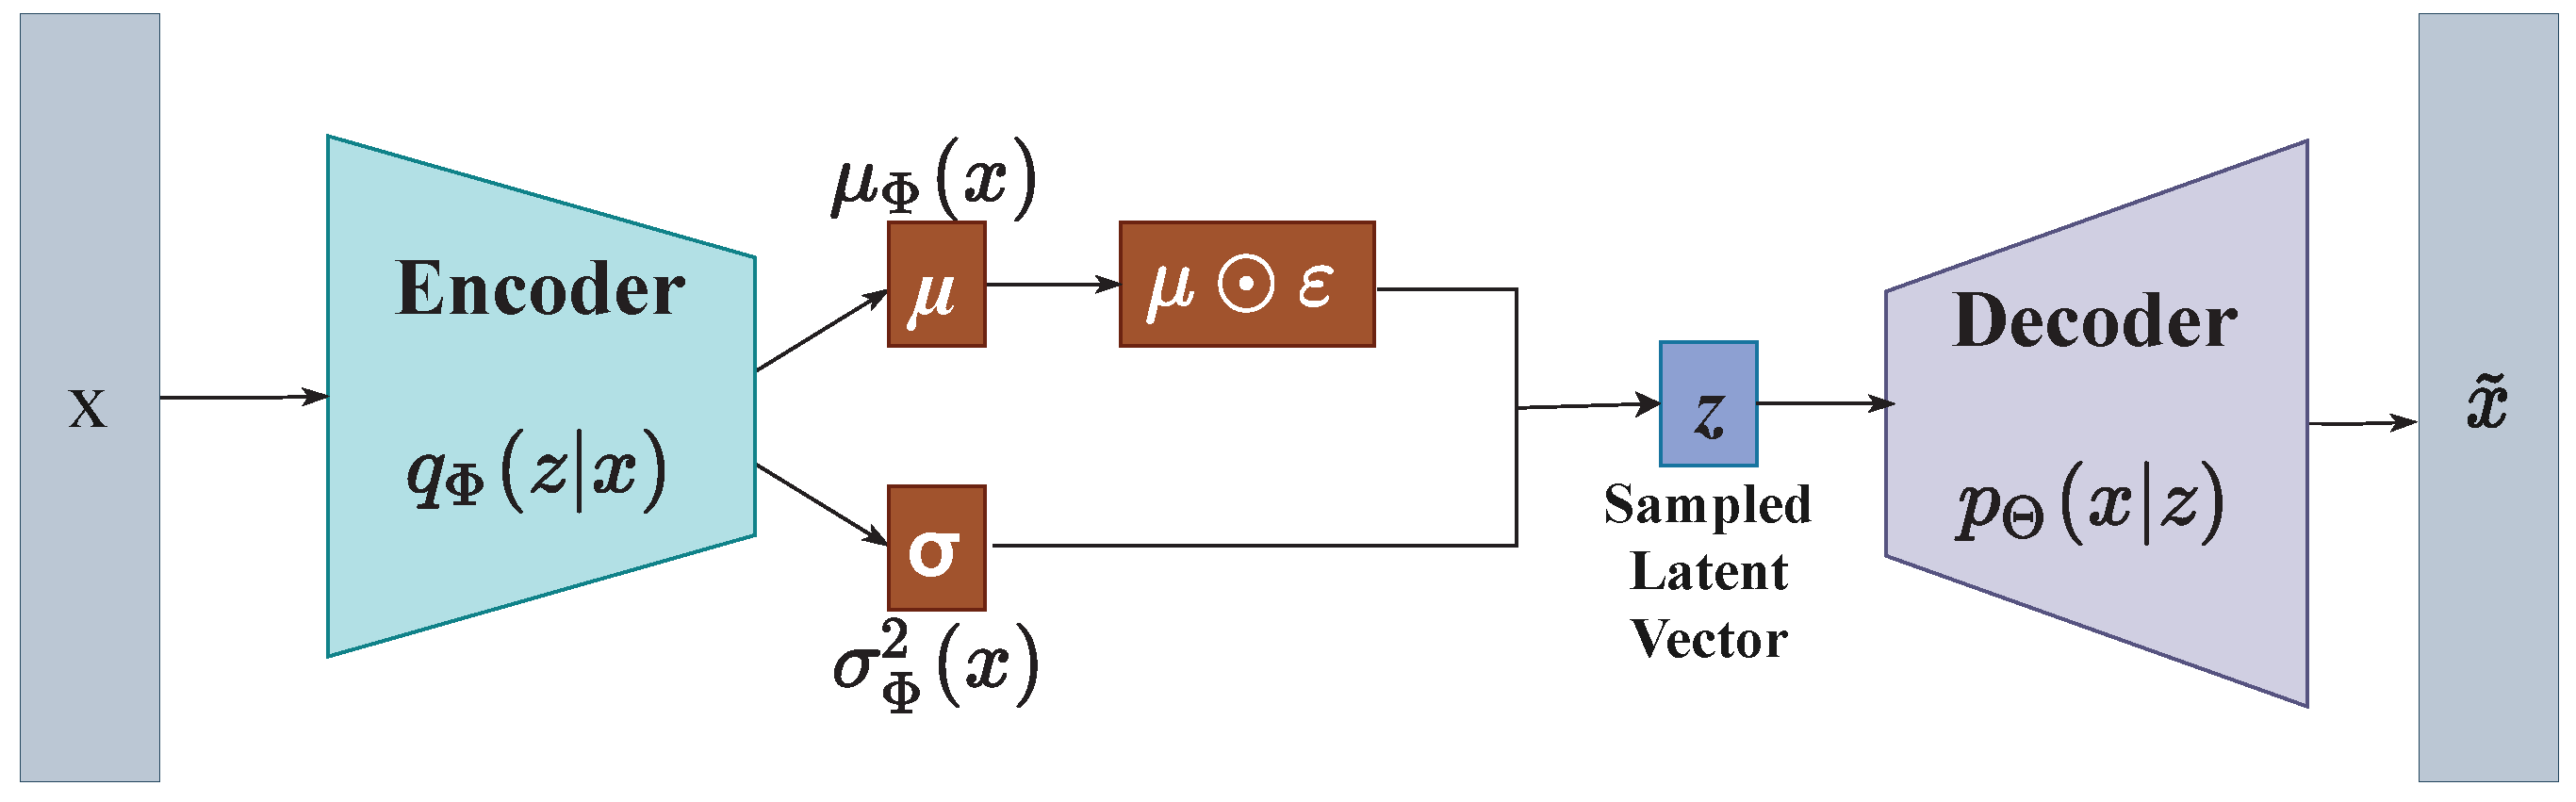
20]. Unlike conventional AEs, which try to learn a distance function, VAEs, proposed by Kingma and Welling [21], are powerful generative AEs that provide high-quality representations of the raw input data and generate desirable virtual instances in the controllable smooth latent space [22].
Compared with conventional AEs, VAEs are highly capable of a more general approximation of the intractable posterior density and can efficiently carry out the inference [21]. These advantages combined make VAEs extensively utilized and successful for a variety of machine learning tasks such as audio data recognition [23], text captioning [24], and natural image processing [25]. Furthermore, the latent representations generated by VAEs can be controlled more accurately owing to the variational lower bound in the optimization of VAEs. This accurate modeling could provide superior representations compared to other AE variants and enhance the results of several downstream tasks, such as image classification [26].
Additionally, by adjusting the distribution parameters, the generation of new instances can be easily controlled since VAEs learn the parameters of the specific probabilistic distributions. Again, due to their closed-form objective function, VAEs are more stable throughout training stages than other generative paradigms, such as generative adversarial networks (GANs) [27], and have the potential to generate shaper samples that are comparable to GANs [28]. Another major benefit of VAEs is their capability to handle larger datasets compared to variational inference. This is because VAEs can operate quickly using a single feedforward neural network to represent a stochastic function of the input variables. In contrast, variational inference typically becomes increasingly computationally complex as the number of samples increases.
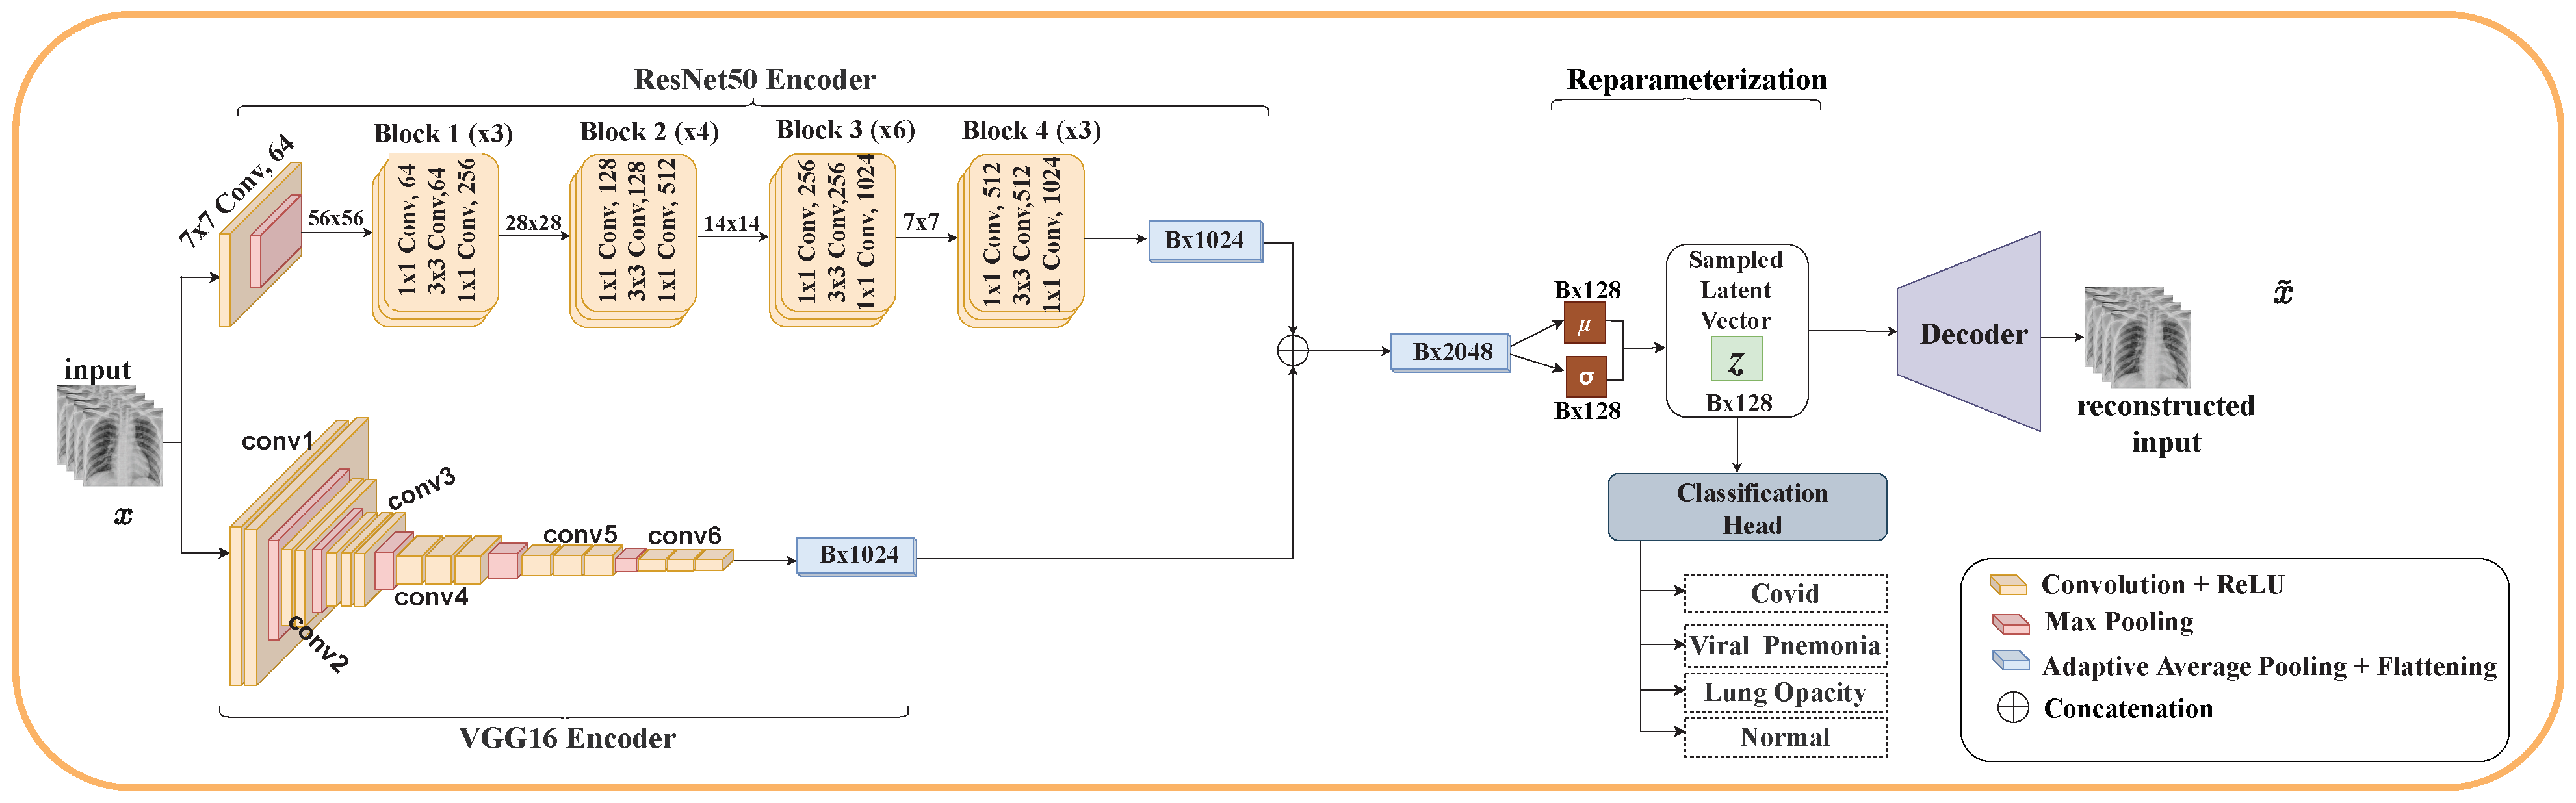
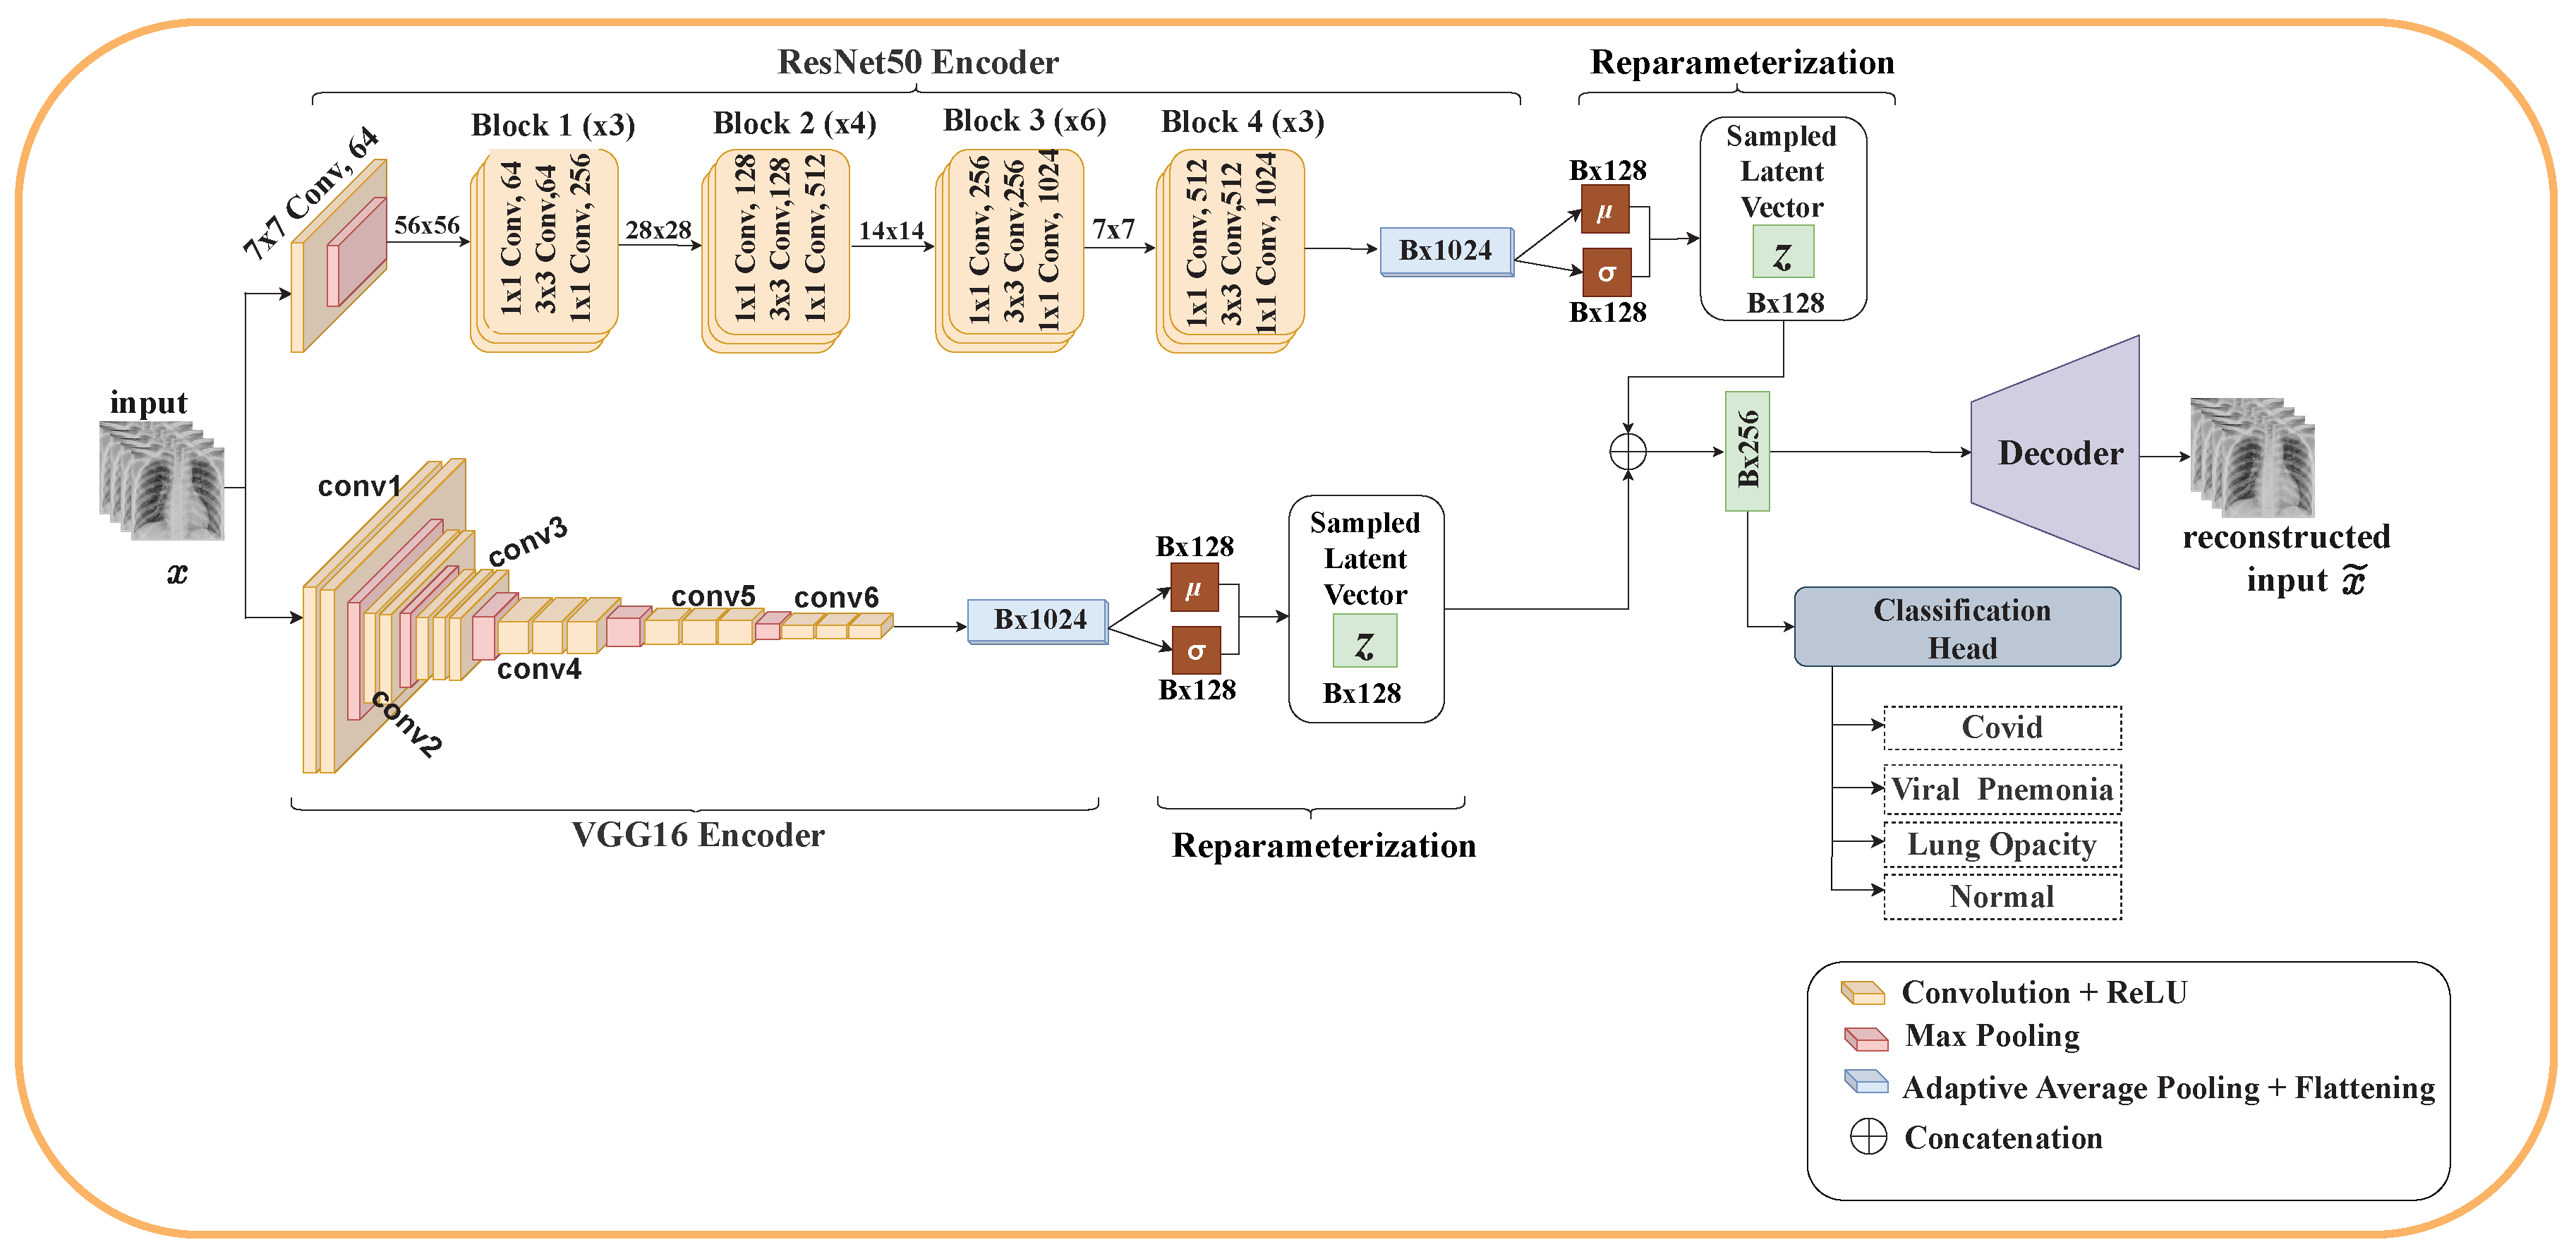
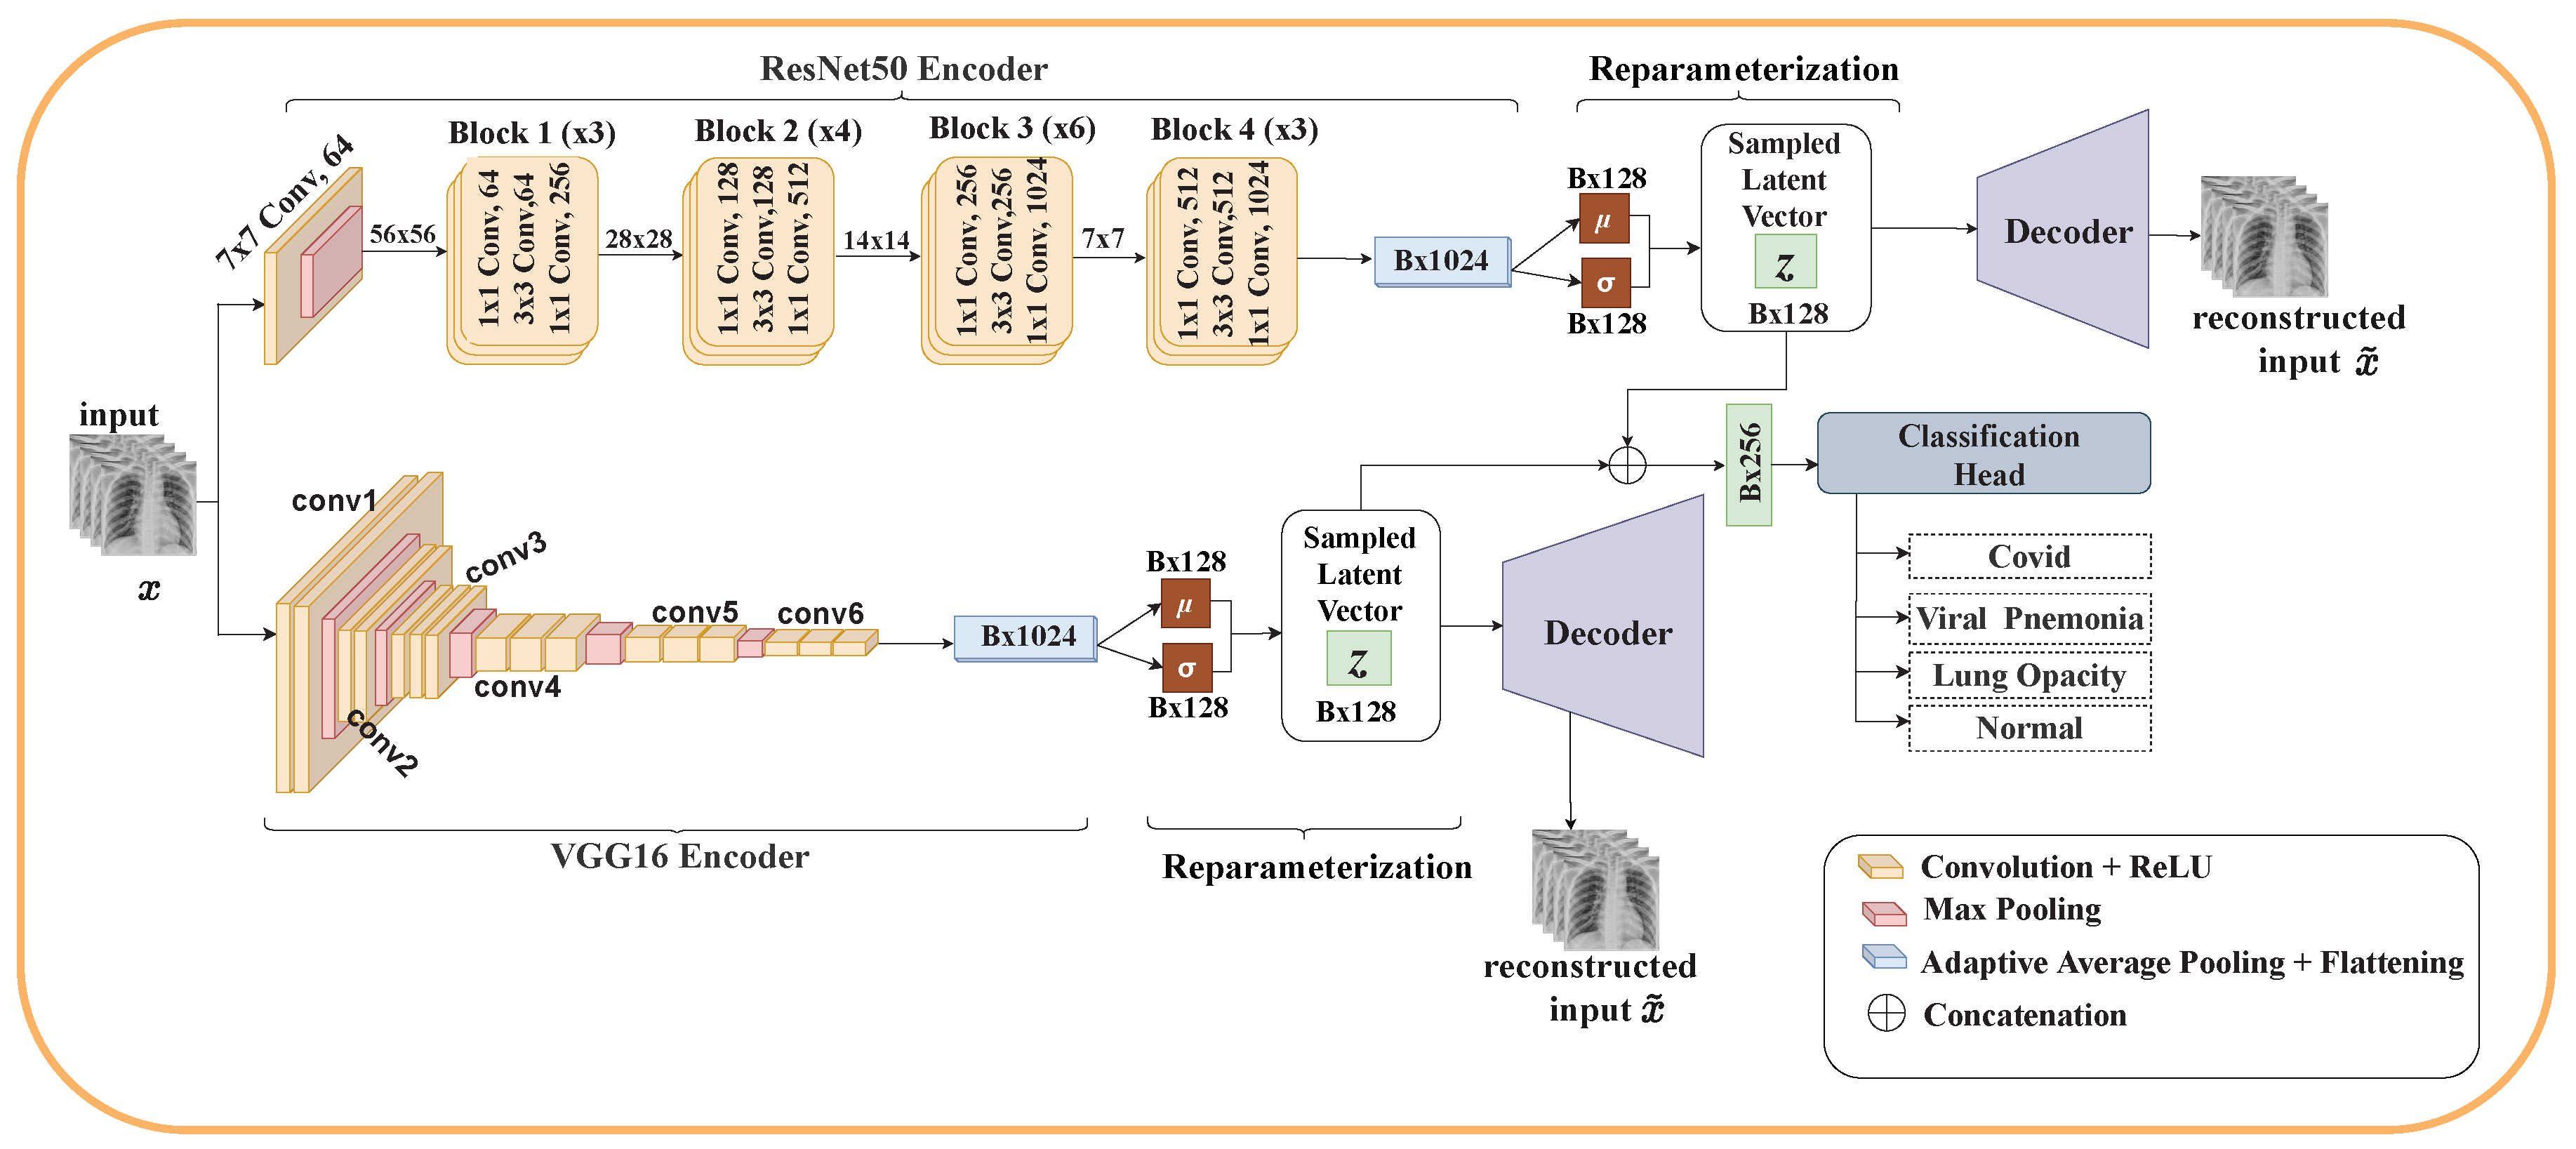
Motivated by this, we propose EVAE-Net, an ensemble variational autoencoder deep learning network that combines the high-quality latent representations generated by VAE and ensemble learning for COVID-19 classification based on chest X-ray images. Three variants of EVAE-Net are proposed, and their performances are compared. The proposed model consists of two encoders, one or two reparameterization phases, a classification head, and one or two decoders. In the case of the single reparameterization phase, the feature maps from the encoders are merged before sampling the latent embeddings. The latent embeddings are then passed to the classification head and the decoder for reconstruction. In the case where each encoder has its reparameterization phase, the feature maps from each encoder are passed to their respective reparameterization phase to generate the latent embeddings. The latent embeddings are merged to form a single latent embedding and passed to the classification head. The individual latent embeddings are passed to their respective decoders for reconstruction. Our proposed methodology achieves promising classification performance, with the best model achieving 98.66 % accuracy, 98.47 % recall, 98.60 % F1 score, and 98.75 % precision for three classes, and 99.19 % accuracy, 98.82 % recall and precision, and 98.94 % F1 score for four classes.

Contributions

The main contributions of our work are summarized as follows:
  • Propose a deep learning model based on VAE and ensemble learning for COVID-19 classification. Particularly, three models are proposed. Each model consists of an encoder for feature extraction, a reparameterization phase for sampling latent vectors from the extracted features, a decoder for reconstructing the input image from the latent vector, and a classification head for classifying COVID-19.
  • Demonstrate the superiority of the proposed model by performing essential experiments. The experiment was conducted on both three classes and four classes using the standard COVID-19 radiography database. Several classification metrics were used, including accuracy, recall, precision, F1 score, and ROC-AUC. The experimental results demonstrate that the proposed EVAE-Net can automatically classify COVID-19 infections from CXR images and achieve better performance.
  • Compare the performance of the proposed model to that of several state-of-the-art models, showing our proposed model outperforms these existing models.
The remaining work is structured as follows: In Section 2, we present related studies and works. Section 3 describes the research methodology. The datasets used in this work, evaluation metrics, and experimental setup are described in Section 4, followed by results and analysis in Section 5. Finally, we present discussion and conclusions of the study in Section 6 and Section 7, respectively.

2. Related Work

Since the outbreak of COVID-19, the scientific community has responded with high volumes of research dedicated to different levels. ML and DL models have been adopted in several areas to help deal with COVID-19 disease discovery and spread monitoring [29,30,31,32], prognosis [33], etc. Nevertheless, most of these ML and DL models focus on preprocessing X-ray or CT scan images to detect and classify COVID-19. Several tools, techniques, and datasets have been utilized to facilitate the detection and classification of COVID-19.

2.1. Deep Learning Models

Researchers have identified several approaches for identifying COVID-19 from chest X-ray images. One well-established method is the conventional method. However, this approach is not acceptable in the medical field due to its limitations, such as wasting time extracting features and inaccurate results leading to false positive results. In recent years, researchers have conducted several studies to detect COVID-19 infections. The researchers in [34] presented CovXNet, a deep learning model to classify COVID-19 and pneumonia infections by utilizing a public dataset containing 1493 non-COVID pneumonia and 305 COVID-19 pneumonia cases. Their model achieved an accuracy of 96.9%. Using four pretrained models, VGG16, ResNet50, DenseNet-121, and MobileNet, Umair et al. [35] proposed a technique for binary classification of COVID-19 and compared the performances of the four models. DenseNet-121 achieved the best performance with an accuracy of 96.49%.
The authors of Li et al. [36] proposed COVNET, a deep learning model for detecting COVID-19 infections. The proposed model successfully differentiated between COVID-19 pneumonia and community-acquired pneumonia (CAP) with sensitivity and specificity rates of 90% and 96%, respectively. A novel deep learning model, CovidDetNet, for detecting COVID-19 infections using chest radiograph images was proposed by Ullah et al. [37]. The proposed model comprises nine convolutional layers, one fully-connected layer, two activation functions (ReLU and Leaky ReLU), and two normalization operations (batch normalization and cross-channel normalization) and achieved an accuracy of 98.40%. A 17-layered deep learning model, DarkCovidNet, with different filter sizes for detecting COVID-19 infection, was presented by Ozturk et al. [38]. The authors used DarkNet [39] as the backbone for their model. The proposed model provided accurate diagnostics for binary classification (COVID vs. no findings) with 98.08% accuracy and multi-class classification (COVID vs. no findings vs. pneumonia) with 87.02% accuracy.
The authors of Khan et al. [40] proposed CoroNet, a CNN for the classification of COVID-19 by modifying an Xception pre-trained model. The model achieved an accuracy of 89.6%. In Agrawal and Choudhary [41], researchers presented FocusCovid, an automated deep learning model for detecting COVID-19 using chest radiograph images. The authors used FocusNet [42], a UNet-based encoder–decoder architecture proposed for medical image segmentation, as their backbone network. The model achieved 99.2% and 95.2% accuracy for binary classification and multi-classification, respectively. In [43], a convolution support estimation network (CSEN) that combines the advantages of a representation-based technique and deep learning was presented to detect COVID-19 infections from X-ray images. The proposed method uses training samples and a dictionary to map the sparse support coefficients to the query samples.
Other works have also exploited automated feature extraction and filtering techniques [44,45,46,47]. For example, the authors of [44] segregated COVID-19 positive cases and healthy cases by exploring several image filter techniques, such as a conservative smoothing filter and a Gaussian filter, and feature extraction techniques, such as linear discriminant analysis (LDA) and principal component analysis (PCA). The extracted features were then passed to various classification models, including CNN, SVM, and logistic regression (LR). The proposed model achieved impressive results by attaining an overall accuracy of 99.93%.

2.2. Transfer Learning Methods

In the COVID-19 detection and classification literature, most of the ML and DL models employed use pre-trained models as the baseline of their models. The pre-trained models were trained using the Imagenet dataset [48], and their weights are available for download. Although the baseline models used were the same, the architecture of the individual models is different [49]. VGGNet [50], ResNet [51], EfficientNet [52], DenseNet [53], and SqueezeNet [54] are few examples of state-of-the-art pre-trained models. In the literature, a large number of works have been proposed using transfer learning [49,55,56,57,58,59,60,61,62,63]. The authors of [62] implemented a deep learning model by fine-tuning three pre-trained models—VGG16, VGG19, and ResNet201—using chest X-ray images for binary classification of COVID-19. Using Bi-LSTM and CNN, Aslan et al. [60] designed a hybrid model to detect COVID-19 from CT scans. The authors used AlexNet as their pre-trained models. Similarly, Apostolopoulos and Mpesiana [49] proposed a CNN architecture based on transfer learning using ReLU [64] as the activation function and dropout to deal with overfitting. A binary and multi-class classification model using NASNet-large, DenseNet169, InceptionV3, ResNet18, and Inception ResNetV2 was proposed by Punn and Agarwal [59]. To overcome class imbalance, the authors used a weighted class-loss function (giving higher weight to COVID labels) and a random sampling technique (upsampled minority class). Using transfer learning and fine-tuning, El Asnaoui et al. [65] conducted a comparative study on several pre-trained models. They applied intensity normalization [66] during the preprocessing stage to enhance image quality, and they applied contrast-limited adaptive histogram equalization (CLAHE) [67]. Similarly, using five pre-trained models, the authors of [63] presented a deep learning model to detect COVID-19 from CT scan images. The authors assessed the performance of histogram equalization (HE) and CLAHE enhancement on CT scan images. The best pre-trained model attained an accuracy of 95.75%.

2.3. Autoencoders and Variational Autoencoders

In recent years, autoencoders (AEs) and variational autoencoders (VAEs) have been exploited for different medical tasks [68,69,70,71,72,73,74]. Given input data, AEs and VAEs transform the input from a high dimension to a low dimension known as a latent vector. Due to this capability, they have also been adopted for dimensionality reduction tasks [75,76,77]. VAEs are probabilistic variations of AEs. Unlike AEs, which attempt only to learn the latent representation of the input data, VAEs attempt to learn the latent distribution of the input data [78]. AE and VAE approaches have been adopted in several works. The authors of Rashid et al. [79] proposed a two-stage deep CNN scheme dubbed “AutoCovNet” to detect COVID-19. They used an encoder–decoder at the first stage and an encoder-merging network for the second stage. The weights learned from the first stage are used to initialize the encoder in the second stage. The outputs from the different layers in the encoder model are connected to the encoder-merging network, which finally performs feature extraction. The extracted features are then used to perform classification. An integrated model consisting of a pre-trained model, sparse autoencoder, and a feedforward neural network was proposed by J.L. et al. [80]. Similarly, Abdulkareem et al. [81] proposed a model that used stacked autoencoders instead of sparse autoencoders. Other works have also explored stacked autoencoders [82,83,84]. To deal with anomaly localization and lack of pixel annotation in CT images, Zhou et al. [78] proposed a “Weak Variational Autoencoder for Localisation and Enhancement (WAVLE)” framework with two parts: the localization part, which generates attention maps by combining a context-encoding variational autoencoder with a gradient-based technique; and an enhancement part that localizes the infected regions in the CT images, combining the attention maps generated in the first part. An unsupervised deep learning variational autoencoder model was proposed by Mansour et al. [85]. InceptionV4 with Adagrad was used as the feature extractor, and an unsupervised VAE performed classification. The quality of the image was enhanced using adaptive Wiener filtering during preprocessing. So far, this is the only work similar to our work. In our work, we explore the latent representations generated by VAE and leverage the capabilities of ensemble learning to design three ensembled variational autoencoder models to classify COVID-19. Several other methods and techniques to detect and classify COVID-19 have been proposed in the literature [15,17,86,87,88,89,90,91,92]. Table 1 summarizes the related works.
The abovementioned studies use convolutional operations to extract relevant features from the given input. The feature map is then passed to the classification head to detect or classify COVID-19. These feature maps may contain the relevant features extracted from the input image. However, a convolution neural network sees the input image as a cluster of pixels arranged in distinct patterns. It does not understand them as components present in the image nor the probability distribution of these components. With VAE, given a feature map, it describes the probability distribution of the feature map in a latent space. Thus, each attribute in the feature map is represented as a probability distribution for which we can randomly sample latent vectors for classification instead of using the entire feature map. This statistical distribution enforces a continuous, smooth latent space representation of the latent vector with its values near one another in a latent space, thereby acting as further filtering of the feature map to a reduced dimension but still holding relevant features with a probability distribution for classification.

3. Materials and Methods

This section discusses the theoretical aspect of VAEs and our proposed model. We describe the theory of variational autoencoders and the loss functions used in this work. We then describe the architectural design of the three proposed approaches.

3.1. Variational Autoencoders

AEs are neural network architectures with two main parts: an encoder f e and a decoder f d . Given input datum x i , the encoder transforms x i into a latent representation z i , which is of lower dimension than x i . The decoder takes z i as input and attempts to reconstruct x i ˜ . Reconstruction loss, L , is computed to measure the model’s performance. L is computed by comparing the difference between x i and x i ˜ . The weights of the model are updated through backpropagation. VAEs are probabilistic variations of AEs that combine Bayesian variational inference and deep learning. Similar to AEs, VAEs also have encoders and decoders and perform the same function. Figure 1 shows the basic architecture of VAEs. Instead of just learning the latent representation, VAEs learn the probability distribution of the training data through an amortized inference procedure that provides the means for computing the latent representation of the input data via the encoder. The encoder acts as the variational posterior q ϕ z | x , while the decoder acts as a generative model representing the likelihood p θ x | z . Given the posterior and the likelihood, we can define a joint inference distribution as
q ϕ z , x p θ x q ϕ z | x
Any probability distribution function (PDF) can be used as the posterior distribution, but it is mainly assumed to be a multivariate Gaussian with diagonal covariance matrix p z ( z ) = N ( z ; 0 , I ) . The likelihood function p θ x | z can be a Gaussian distribution or a Bernoulli distribution. In the encoder, the weights and biases are parameterized by the variational parameter ϕ , while in the decoder, the weights and biases are parameterized by the model parameter θ . Unlike in autoencoders, where the encoder outputs z (a probability distribution representing the latent embeddings), encoders in VAEs output μ and log σ 2 and generate ε from N ( 0 , I ) , out of which z is sampled using a reparameterization trick. The variable z is then fed as input to the decoder, which tries to reconstruct x; z is defined as:
z = g ε , ϕ , x = μ + σ ε
where ⊙ is an elementwise multiplication operation, and z is a probability distribution representing the relevant features from the input x. Assuming z N μ , σ 2 , then z can be reparameterized by
z = μ + σ ε , ε p ε = N 0 , 1
Since p θ z and q ϕ z | x are both Gaussian distributions, the difference between the two distributions can be computed directly. Given a data point x ( i ) , the resulting likelihood is calculated as:
L θ , ϕ ; x = E q ϕ z | x i log p θ x | z +       D K L q ϕ z | x i p θ z
Equation (4) is known as evidence lower bound (ELBO). The objective of the model is to maximize ELBO L ( θ , ϕ , x ) with respect to θ , the model parameters, and ϕ , the variational parameters. The first part of ELBO represents the reconstruction loss, which ensures the decoder is able to reconstruct x i ˜ from the latent representation z. The second part of ELBO acts as a regularizer called a divergence. It measures the divergence between q ϕ ( z | x ) and p θ ( z ) as well as penalizes the entanglement between the components in the latent space.

3.2. Kullback–Leiber (KL) Divergence

KL divergence measures how similar two probability distributions are. Given two probability distributions p ( x ) and q ( x ) defined over x, the KL divergence denoted by D K L ( p ( x ) | | q ( x ) ) from q ( x ) to p ( x ) is defined as:
D K L ( q ( x ) | | p ( x ) ) = i p x i log p x i q x i

3.3. Maximum Mean Divergence (MMD)

Similar to KL divergence, MMD measures how close two distributions are to each other. Given two probability distributions, p ( x ) and q ( x ) , MMD, denoted as
M M D p x q x , is defined as:
M M D q x p x = E q ( x ) , q ( x ) [ k ( x , x ) ] + E p ( x ) , p ( x ) [ k ( x , x ) ] 2 E q ( x ) , p ( x ) [ k ( x , x ) ]
where k ( x , x ) is any universal kernel, for which we use the Gaussian kernel in this work.

3.4. Loss Function Establishment

In this study, we adopted two objective functions. The first objective function ensures the VAE reconstructs x ˜ i as closer to the actual input datum x i such that the latent representation z that is created is in some particular distribution. First, we compute the reconstruction loss by measuring the difference between x ˜ i and x i . The reconstruction loss, denoted as L ( θ , ϕ ; x ) , is defined as:
L θ , ϕ ; x = E q ϕ z | x log p θ x | z log q θ z | x
where q ϕ z | x represents the latent distribution created by the encoder from the input data, and p θ x | z represents the reconstructed distribution from the latent representation by the decoder. Afterwards, the divergence among the latent representation distribution is measured. In this study, we adopt the MMD. The final VAE loss is defined as:
L V A E = L θ , ϕ ; x + M M D ( q ϕ ( z | x ) | | p ( z ) )
The cross-entropy (CE) loss was adopted as the second objective function to handle the classification task. The CE loss function is computed as:
L c l s O , y = 1 N i = 1 N y i log S O
where N represents the number of classes, O R N × 1 represents the output from the fully connected layer, y and y i represent the true label in the batch and predicted label of image i in the batch, respectively, and S is the softmax applied to the output of O to normalize it.

3.5. Ensemble Variational Autoencoder

This section details the architecture of our proposed model. Using VAE and ensemble learning, we propose three different architectures for the classification of COVID-19. Each architecture consists of two encoders (ResNet50 and VGG16), reparameterization, a classification head, and either one or two decoders. The classification layers of ResNet50 and VGG16 were removed.

3.5.1. ResNet50 Encoder

The ResNet50 encoder follows the ResNet50 architecture [51]. The first layer is a convolutional layer with a kernel size of 7 × 7 and 64 different kernels with a 2 × 2 stride. The layer is immediately followed by a 2 × 2 max-pooling layer. Four sequential blocks follow Layer 1. Each block performs a convolution operation with different kernel sizes. In Block 1, there is a 1 × 1 , 64 kernel convolutional operation followed by a 3 × 3 , 64 kernel convolutional and finally a 1 × 1 , 256 kernel operation. Block 1 is repeated 3 times, giving a total of 9 layers. Similarly, in Blocks 2, 3, and 4, the kernel sizes used are (128, 128, 512), (256, 256, 1024), and (512, 512, 1024), respectively. Blocks 2, 3, and 4 are repeated 4, 6, and 3 times, respectively, giving a total of 50 layers. Finally, an adaptive average pooling and flattening layer is applied to the output of Block 4.

3.5.2. VGG16 Encoder

We adopted the VGG16 [50] architecture for the VGG16 encoder. There are two 3 × 3 convolutional filter layers and a 2 × 2 max-pooling layer. Each of these two layers are repeated 3 times. Next, there are three 3 × 3 convolutional filter layers and a 2 × 2 max-pooling layer, each of which is repeated two times. Finally, adaptive average pooling and flattening is applied.

3.5.3. Reparameterization

The outputs from the encoders are transformed using a linear layer to the dimension of the latent space, R B × 128 , where B is the batch size. We then perform random sampling from a standard normal Gaussian distribution having a mean and variance. Two linear layers are used to implement the mean and variance, which has the same dimension as the latent space. Standard deviation is computed from the variance, and Equation (2) was applied to sample z.

3.5.4. Classification Head

The classification head takes z as input and performs a linear transformation on it. The output dimension of the classification head is R B × C , where B is the batch size, and C = 3 , 4 is the number of classes.

3.5.5. Decoders

The decoder performs the reverse operation of the encoder. It takes z as input and performs a C o n v T r a n s p o s e 2 d on it to upsample it to produce an output X ˜ X .

3.5.6. Model One

In this model, as depicted in Figure 2, the feature maps of the last layers in both encoders are concatenated before performing the reparameterization trick to sample the latent embedding z. This model allows us to merge at a high level the individual features from both encoders, giving us a richer feature map before sampling z. The sampled latent vector is then passed as input to the decoder to reconstruct the input and the classification head to classify the various types of pneumonia. In this model, only one decoder is used. There are two objective functions: L V A E , which ensures the output of the decoder is closer to that of the input; and L c l s O , y , which provides the classification head the ability to accurately classify the various types of pneumonia. The advantage of this model is its simplicity. It takes advantage of concatenating the feature maps of each encoder before sampling the latent vector. Though this is the simplest of the three models, its performance depends on the sensitivity of how well each encoder can extract relevant features from the input since they share a single decoder and a single L V A E objective function.

3.5.7. Model Two

This model combines separate low-level VAEs to form a high-level VAE. Each low-level VAE learns the representation of the input data to create its latent vector. These independent latent vectors are merged to create an integrated low-level representation. Like Model One, Model Two also employs a single decoder and two objective functions. The computational cost of this model is higher than that of Model One. There is a three-stage learning process involved: first, learning the low-level VAEs of individual encoders; second, reconstruction of the low-level representation to high-representation by the decoder; third, classification of the various types of pneumonia by the classification head. Despite its computational cost, it presents some advantages. The decoder and classification head input is composed of low-level representations from the individual encoders, which already have distribution regularization terms. Thus, the merged representations already consist of approximated multivariate standard normal distributions representing the input of each encoder. Similar to Model One, performance also depends on the sensitivity of how well each encoder can extract relevant features from the input, since they share a single decoder and a single L V A E objective function. Figure 3 depicts the architecture of Model Two.

3.5.8. Model Three

This model is similar to Model Two. The difference is that for Model Three, each encoder implements its decoders. After reparameterization, the latent vectors of the individual encoder are merged to form one latent vector and then passed to the classification head. The individual latent vectors are then passed to their respective decoders to reconstruct the input. Three objective functions are used: two L V A E function—one for each encoder–decoder—and L c l s O , y for the classification task. This model inherits all the advantages presented by architecture two. In addition, it solves the performance problem of Models One and Two since each encoder now implements its own decoder and L V A E . Figure 4 depicts the architecture of Model Three.

4. Experiments

4.1. Dataset

In this study, we used the COVID-19 Radiography Database curated by [93,94], which is publicly available in the Kaggle repository. The dataset comprises 21,165 X-ray images: 3616 COVID-19-positive, 10,192 normal (non-COVID), 6012 lung opacity (non-COVID lung infection), and 1345 viral pneumonia. We experimented with both three and four classes. For four classes, we split the dataset into training (12,696 samples, representing 60% of the entire dataset), validation (6351 samples, representing 30% of the entire dataset), and testing (2118 samples, representing 10% of the entire dataset) sets. For the three classes, we combined lung opacity and viral pneumonia to form one set called viral pneumonia. To increase the number of COVID samples, we performed data augmentation using Augmentor to generate 6000 samples. We then sampled 5000 COVID images, 5000 normal images, and 5000 pneumonia images. We then split the dataset into training (10,499 samples, representing 70% of the dataset), validation (3750 samples, representing 25% of the dataset), and testing (750 samples, representing 5% of the dataset). Table 2 shows the composition of the dataset for four classes and three classes. Figure 5 shows samples of images from the dataset.

4.2. Selection of Backbone Networks

To select the backbone networks for our work, we experimented with four pre-trained models: ResNet50, DenseNet201, VGG16, and Xception, out of which we chose the top two models with the highest performance. We ran each model on the four-class dataset for 20 epochs using a learning rate of 0.00003 and the Adam optimizer. The ResNet50 pre-trained model obtained the best results, followed by VGG16. DenseNet201 and Xception showed similar results. Hence, we selected ResNet50 and VGG16 as the backbone networks for our model. Table 3 shows the results of the backbone network selection experiment.

4.3. Evaluation Metrics

In this study, five quantitative measures were adopted to measure the performance and effectiveness of our proposed model: accuracy, precision, recall, area under the curve (AUC), and F1 score.
TP (True Positive); TN (True Negative); FP (False Positive); FN (False Negative).
  • Accuracy: Measures how close a predicted label is to the true label.
    A c c u r a c y = T P + T N T P + T N + F P + F N
  • Precision: Measures actual positives from all predicted positive labels:
    P r e c i s i o n = T P T P + F P
  • Recall: Known also as sensitivity, measures the ratio between all positive samples correctly classified to all positive samples (both correct and incorrect). Recall shows a model’s ability to actually classify positive samples as positive.
    R e c a l l = T P T P + F N
  • ROC AUC Score: Shows the relationship that exists between the true positive rate (recall) and the false positive rate. It also shows how good a model is at differentiating positive and negative target classes. ROC AUC is calculated using area under the curve (AUC).
  • F1 Score: Measures the harmonic mean of recall and precision.
    F 1 S c o r e = 2 × P r e c i s i o n × R e c a l l P r e c i s i o n + R e c a l l
  • Confusion Metric: Provides an intuitive and descriptive way to summarize the performance and correctness of a model.

4.4. Experimental Setup

In all the experiments, the input image was resized to a fixed size of 224 × 224 before feeding it to the network, there was a mini-batch size of 4 for both training and validation sets. The dimensions of the input image were 4 × 3 × 224 × 224 . All models were trained for 20 epochs. For the validation set, the weight with the best accuracy was saved. We adopted two loss functions: maximum mean divergence (MMD) for variational autoencoder (refer to Equation (8)) and cross-entropy function for the classification task. The Adam optimizer was chosen as the primary optimizer and had a learning rate of 0.00003 . We also experimented with three additional learning rates: 0.00001 , 0.00002 , and 0.00004 . Table 4 shows the hyperparameters used in this study.
Choosing an optimal objective function for the experiment was also considered. Since the architectures involve multiple tasks—reconstruction and classification—the chosen objective functions should improve the disentanglement between the latent embeddings and the classification of the different types of pneumonia. For the encoder–decoder, the objective function should consider both the reconstruction loss and a regularization term. Mean square error (MSE) loss was chosen for the reconstruction task, with MMD as the regularization term and cross-entropy as the loss for classification.
The network weights were initialized randomly since we did not use pre-trained models as the backbone for our network. All experiments were conducted on a single GPU (GEFORCE RTX 3060) with an 8-core AMD Ryzen 7 3700X processor.

5. Results and Analysis

This section reports the various experimental results of the proposed models using the COVID-19 Radiography dataset. For each of the models, we conducted several experiments by changing some of the hyperparameters. For the initial experiment, the Adam optimizer with a learning rate of 0.00003 was used and was trained for 20 epochs with a batch size of 4. This was done for both three and four classes. In the subsequent experiments, the optimizer was kept constant while we varied the learning rate.

5.1. Model Complexity

Table 5 shows the computational complexity of our proposed model in terms of the number of parameters and multiply-and-accumulate operations (MACs). From the table, Models One and Two have almost the same complexity since both models share a single decoder unit. The slight difference between their complexities is a result of Model Two performing a reparameterization operation for both encoders compared to a single reparameterization operation in Model One. For Model Three, each encoder has its own decoder, resulting in a higher number of parameters. Additionally, there are two reconstruction loss functions for the reconstruction of the input image, and one cross-entropy loss for the classification task, resulting in higher MACs.

5.2. Validation and Testing Performance Evaluation

Table 6 shows the best performance metrics for each model on the validation set. From the table, it can be observed that a learning rate of 0.00003 produced better results for the four classes, while for the three classes, different learning rates produced different results for every model.
For three classes, Model One achieves 98.14 % accuracy, 98 % recall, 98.2 % precision, and 98.15 % F1 score; Model Two achieves 98 % accuracy and 97.99 % recall, precision, and F1 score; Model Three achieves 98.24 % accuracy and recall, 98.32 % precision, and 98.27 % F1 score. For four classes, Model One achieves 96.44 % accuracy, 95.18 % recall, 96.48 % precision, and 95.49 % F1 score; Model Two achieves 97.12 % accuracy, 96.18 % recall, 96.23 % precision, and 97.14 % F1 score; Model Three achieves 98.72 % accuracy, 98.52 % recall, 98.55 % precision, and 98.77 % F1 score.
Table 7 shows the performance metrics of the best model (Model Three). For the three classes, it achieved 98.24 % accuracy, recall, and F1 score, and 98.25 % precision. For the four classes, an accuracy of 98.72 % , recall of 98.52 % , precision of 98.55 % , and F1 score of 98.77 % was achieved. 
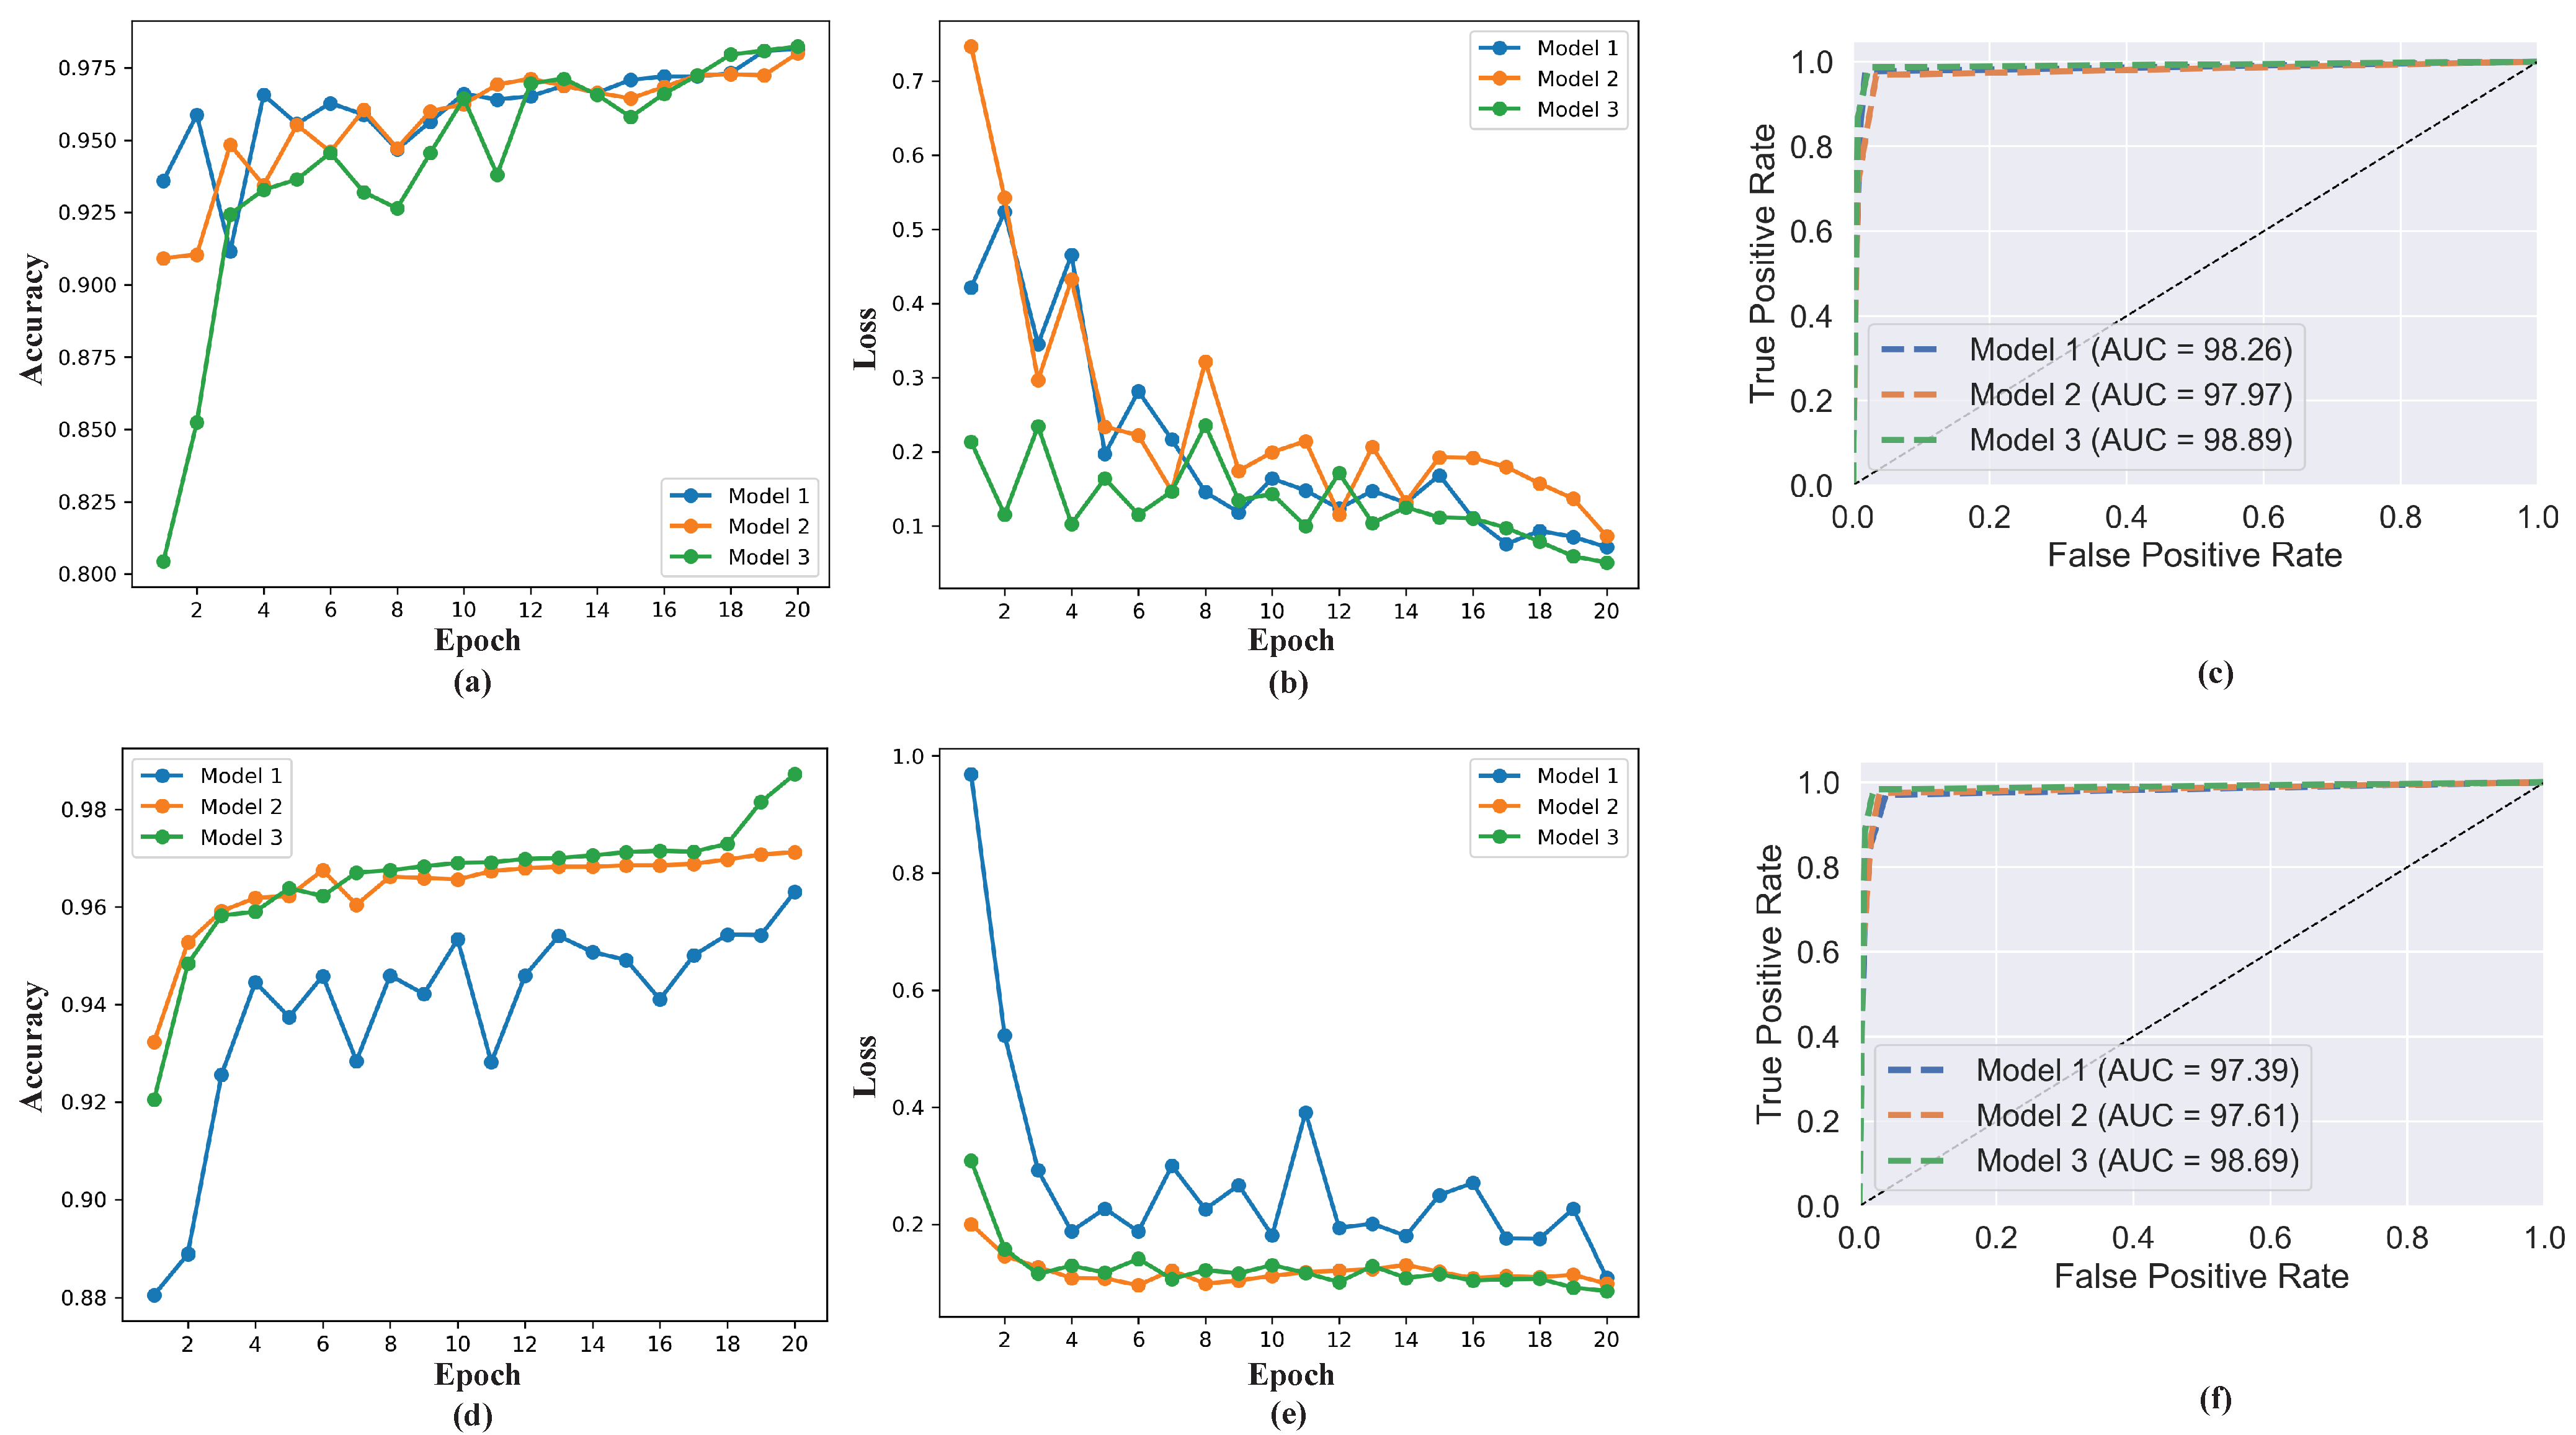
Figure 6 shows the accuracy, loss, and ROC AUC graph comparing the performance of the three models for both three classes and four classes. These results indicates the proposed model’s capability in classifying COVID-19. For all the performances measured, the best results are obtained with 20 training epochs, which is an indication that the performance of the model increases gradually as the number of epochs increases.
We performed cross-validation using the testing set, as depicted in Table 8, which the model was not exposed to during training and validation. Cross-validations was performed to verify that our model does not suffer from overfitting and to test the model’s robustness. For three classes, Model One achieves 98.57 % accuracy, 98.42 % recall, and 98.47 % precision and F1 score; Model Two achieves 98.43 % accuracy, 98.37 % recall, and 98.35 % precision and F1 score; Model Three achieves 98.66 % accuracy, 98.47 % recall, 98.69 % precision, and 98.60 % F1 score. For four classes, Model One achieves 97.04 % accuracy, 96.55 % recall and F1 score, and 96.89 % precision; Model Two achieves 97.99 % accuracy, 97.90 % recall, 97.70 % precision, and 97.91 % F1 score; Model Three achieves 99.19 % accuracy, 98.82 % recall and precision, and 98.94 % F1 score. Table 9 and 
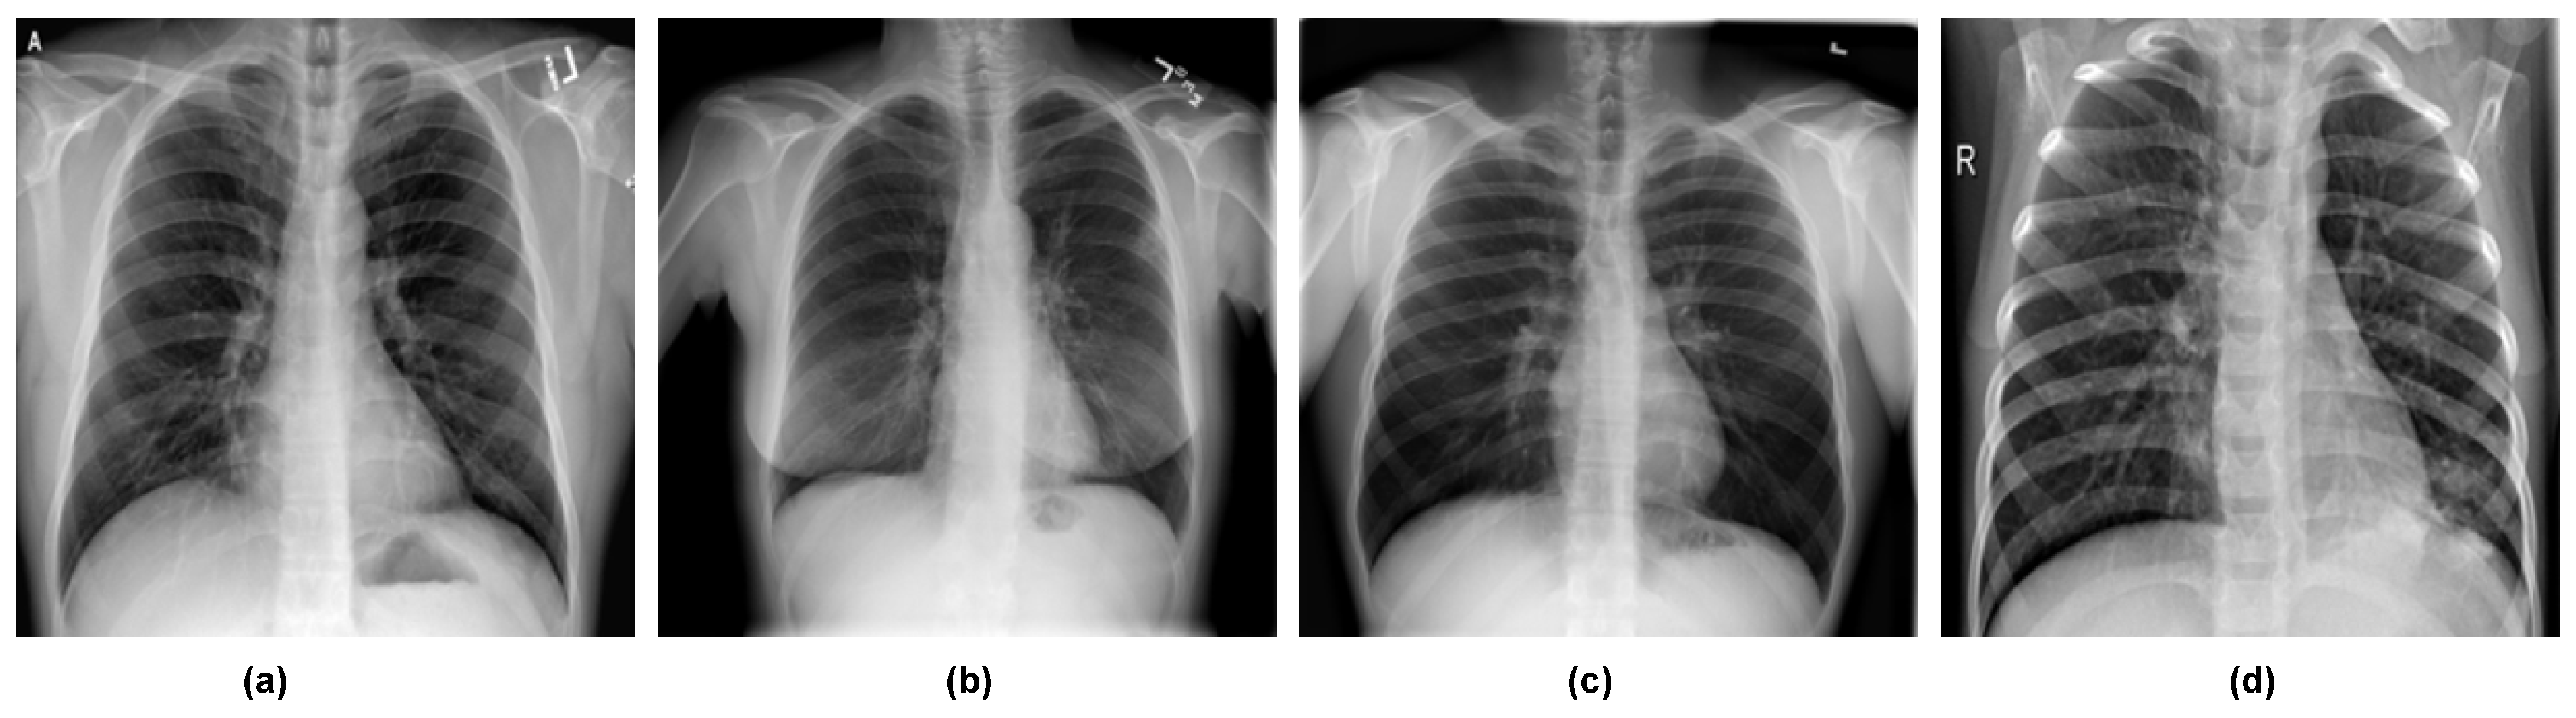
Table 10 show the confusion matrix for the cross-validation on the testing dataset. For three classes, out of a total of 487 radiographs, the model misclassified 130 radiographs; of those, 47 were COVID-19 images, 43 were normal images, and 40 were viral pneumonia images. For four classes, out of 2118 radiographs, the proposed model misclassified 17; of those, 4 were COVID-19 images, 3 were normal images, 6 were lung opacity images, and 4 were viral pneumonia images. This indicates the proposed model has higher true negative and true positive values and lower false negative and false positive values, suggesting the proposed model can accurately classify COVID-19 infections.

5.3. Ablation Studies

An ablation study was conducted to observe the contribution of the latent vector’s dimension to the model’s performance. The default dimension of the latent vector throughout the experiment was 128. Using a learning rate of 0.00003 and the Adam optimizer, we experimented with two lower dimensions for the ablation study: 32 and 64. The ablation study was conducted for both three classes and four classes on the validation dataset. Table 11 shows the ablation study for various latent sizes. The table shows that the model’s performance increases with an increase in the latent vector’s dimension. A latent dimension of 128 achieves higher performance in all the models.

5.4. Comparison with State-of-the-Art Methods

We compared our proposed model to various methods, as shown in Table 12. The comparison shows the proposed model, EVAE-Net, outperformed the methods in [37,40,41,95,96] using the same dataset (COVID-19 Radiography Database) for COVID-19 classification and methods that used other modalities [17,38,49,97]. It was worth noting that most of these methods only focused on either three classes or four classes. In our proposed model, we tested both three classes and four classes, making our model generalize better for COVID-19 classification.

6. Discussion and Future Work

In this study, we adopted VAE combined with an ensemble technique for the classification of COVID-19 with high accuracy. Table 4 and Table 7 show the best model’s validation and testing performance metrics. Of the three models, Model Three achieved the best performance. This reveals that the best result is obtained when each encoder implements its own decoder. With a single decoder, as with Model One and Model Two, the model’s performance highly depends on how each encoder can extract relevant features from the input, since they share a single L V A E . With a decoder for each encoder, each encoder implements its L V A E with the advantage of learning to improve its performance from the loss by extracting more relevant features from the input. This further improves the latent embeddings sampled during the reparameterization stage since they are sampled from feature maps with more relevant features. A merger of the two latent vectors produces a richer latent vector, producing a higher classification result. The proposed EVAE-Net is more accurate than PCR since PCR results rely on the sample collection time and how they are stored and processed. Again, PCR results have high false negative rates when the patient is tested too early or too late after exposure to the virus. Further, the proposed model has higher true negative and true positive values and lower false negative and false positive values, suggesting the proposed model can accurately classify COVID-19 infections.
Although the proposed EVAE-Net produced interesting results, it still has some limitations, which we will address in future work. The proposed model cannot indicate the exact region of pneumonia in the chest X-ray image, which is vital for a radiologist. Future work will consider an attention mechanism focusing on the precise pneumonia region in the chest X-ray image. Since we only concentrated on using chest X-ray images for this study, the proposed model is biased toward chest X-ray images. This study did not consider other data modalities, such as CT scans. In future research, we will extensively examine other imaging modalities, which will help the model to generalize better.
Furthermore, we will combine several imaging modalities into a single dataset to investigate the robustness of the proposed model in future studies. We will also examine how image enhancement techniques such as discrete wavelet transform (DWT), CLAHE, etc., will enhance the feature maps from the encoders to improve the model’s performance. We believe images that the model incorrectly classified can be improved when enhanced.
Other limitations are associated with the nature of VAE architecture. VAE architecture requires rich domain-specific knowledge, and this barrier prevents end users without design expertise from utilizing VAEs. Even researchers with expert knowledge must go through an arduous trial-and-error process to tune the architecture manually. For example, finding the optimal depth of the VAE is unknown from the beginning. Thus, it is unknown how to choose the appropriate number of convolutional, pooling, and dense layers for the VAE architecture and what the optimal hyperparameters for each convolutional and deconvolutional layer are. In future studies, we will explore neural architecture search (NAS) to find solutions to this limitation.
In recent years, many Internet of Things (IoT) devices, particularly Medical Internet of Things (MIoT), have been adopted in the health sector to combat various medical issues. Several applications have been deployed in these smart devices for remote patient monitoring (RPM) and other related medical tasks. In fighting against COVID-19, one important aspect of containing the virus is an effective and fast diagnosis method. With the rate at which the virus spreads, diagnosing and screening it quickly is key to containing it. Therefore, there is a need to develop effective and efficient deep learning models leveraging the advantages of IoT and MIoT to diagnose and screen COVID-19 with speed.

7. Conclusions

This study proposed an ensemble variational autoencoder network for the classification of COVID-19 with high accuracy. We exploited variational autoencoders to produce feature-rich latent vectors for classification. Three different ensemble variational autoencoders were designed. Models One and Two have two encoders and a single decoder; Model Three has two decoders. In the case of Model One, the feature maps from the two encoders are concatenated before reparameterization to sample the latent vector. The latent vector is then passed to the classification head for classification and to the decoder for reconstruction of the input image. Models Two and Three each implement reparameterization. The latent vectors from reparameterization are merged and passed to the classification head and the decoder. Our model was trained on the COVID-19 Radiography Dataset. In the case of three classes, the best model achieved 98.66 % accuracy, 98.47 % recall, 98.60 % F1 score, and 98.75 % precision. For four-class classification, 99.19 % accuracy, 98.82 % recall and precision, and 98.94 % F1 score were accomplished. We demonstrated that our model can automatically predict and classify COVID-19 by extracting relevant features from chest radiograph images. This will go a long way to help reduce radiologists’ workload and to avoid misdiagnosing COVID-19 patients. In future studies, we will adopt different DL strategies, such as attention mechanisms and NAS, to improve the computational complexity and performance of EVAE-Net.

Author Contributions

Formal analysis, D.A. and K.S.; funding acquisition, S.Z.; methodology, D.A.; project administration, J.K.J.; supervision, S.Z.; validation and ablation study, R.A.P., F.E., and G.U.N.; visualization, H.N.M. and C.A.O.-A.; writing—original draft, D.A.; writing—review and editing, J.K.J. and K.S. All authors have read and agreed to the published version of the manuscript.

Funding

This work was supported in part by the Sichuan Provincial Key R&D Program (no. 2020YFG0031).

Institutional Review Board Statement

Not applicable.

Informed Consent Statement

Not applicable.

Data Availability Statement

The dataset that supports this study was obtained from the Kaggle repository https://www.kaggle.com/datasets/tawsifurrahman/covid19-radiography-database (accessed on 14 August 2022), which was curated by [93,94]. It is publicly available. Further details can be found here.

Conflicts of Interest

The authors declare no conflict of interest.

References

  1. Fang, Y.; Zhang, H.; Xie, J.; Lin, M.; Ying, L.; Pang, P.; Ji, W. Sensitivity of Chest CT for COVID-19: Comparison to RT-PCR. Radiology 2020, 296, 200432. [Google Scholar] [CrossRef] [PubMed]
  2. De Moura, J.; García, L.R.; Vidal, P.F.L.; Cruz, M.; López, L.A.; Lopez, E.C.; Novo, J.; Ortega, M. Deep Convolutional Approaches for the Analysis of COVID-19 Using Chest X-Ray Images From Portable Devices. IEEE Access 2020, 8, 195594–195607. [Google Scholar] [CrossRef] [PubMed]
  3. Nagura-Ikeda, M.; Imai, K.; Tabata, S.; Miyoshi, K.; Murahara, N.; Mizuno, T.; Horiuchi, M.; Kato, K.; Imoto, Y.; Iwata, M.; et al. Clinical Evaluation of Self-Collected Saliva by Quantitative Reverse Transcription-PCR (RT-qPCR), Direct RT-qPCR, Reverse Transcription–Loop-Mediated Isothermal Amplification, and a Rapid Antigen Test To Diagnose COVID-19. J. Clin. Microbiol. 2020, 58, e01438-20. [Google Scholar] [CrossRef]
  4. Abdel-Basset, M.; Chang, V.; Hawash, H.; Chakrabortty, R.K.; Ryan, M. FSS-2019-nCov: A deep learning architecture for semi-supervised few-shot segmentation of COVID-19 infection. Knowl.-Based Syst. 2021, 212, 106647. [Google Scholar] [CrossRef] [PubMed]
  5. Wielpütz, M.O.; Heußel, C.P.; Herth, F.J.; Kauczor, H.U. Radiological Diagnosis in Lung Disease. Deutsch. Ärzteblatt Int. 2014, 111, 181–187. [Google Scholar] [CrossRef] [PubMed] [Green Version]
  6. Candemir, S.; Antani, S. A review on lung boundary detection in chest X-rays. Int. J. Comput. Assist. Radiol. Surg. 2019, 14, 563–576. [Google Scholar] [CrossRef] [Green Version]
  7. Eastin, C.; Eastin, T. Clinical Characteristics of Coronavirus Disease 2019 in China. J. Emerg. Med. 2020, 58, 711–712. [Google Scholar] [CrossRef]
  8. Wong, H.Y.F.; Lam, H.Y.S.; Fong, A.H.T.; Leung, S.T.; Chin, T.W.Y.; Lo, C.S.Y.; Lui, M.M.S.; Lee, J.C.Y.; Chiu, K.W.H.; Chung, T.; et al. Frequency and Distribution of Chest Radiographic Findings in COVID-19 Positive Patients. Radiology 2019, 296, 201160. [Google Scholar] [CrossRef] [Green Version]
  9. Kim, M.; Yun, J.; Cho, Y.; Shin, K.; Jang, R.; Bae, H.j.; Kim, N. Deep Learning in Medical Imaging. Neurospine 2019, 16, 657–668. [Google Scholar] [CrossRef] [Green Version]
  10. Tang, Y.X.; Tang, Y.B.; Peng, Y.; Yan, K.; Bagheri, M.; Redd, B.A.; Brandon, C.J.; Lu, Z.; Han, M.; Xiao, J.; et al. Automated abnormality classification of chest radiographs using deep convolutional neural networks. NPJ Digit. Med. 2020, 3, 1–8. [Google Scholar] [CrossRef]
  11. Anthimopoulos, M.; Christodoulidis, S.; Ebner, L.; Christe, A.; Mougiakakou, S. Lung Pattern Classification for Interstitial Lung Diseases Using a Deep Convolutional Neural Network. IEEE Trans. Med. Imaging 2016, 35, 1207–1216. [Google Scholar] [CrossRef] [PubMed]
  12. Campo, M.I.; Pascau, J.; Estepar, R.S.J. Emphysema quantification on simulated X-rays through deep learning techniques. In Proceedings of the 2018 IEEE 15th International Symposium on Biomedical Imaging (ISBI 2018), Washington, DC, USA, 4–7 April 2018; pp. 273–276. [Google Scholar] [CrossRef]
  13. Jaiswal, A.K.; Tiwari, P.; Kumar, S.; Gupta, D.; Khanna, A.; Rodrigues, J.J. Identifying pneumonia in chest X-rays: A deep learning approach. Measurement 2019, 145, 511–518. [Google Scholar] [CrossRef]
  14. Srivastava, G.; Chauhan, A.; Jangid, M.; Chaurasia, S. CoviXNet: A novel and efficient deep learning model for detection of COVID-19 using chest X-Ray images. Biomed. Signal Process. Control 2022, 78, 103848. [Google Scholar] [CrossRef] [PubMed]
  15. Hosseinzadeh, H. Deep multi-view feature learning for detecting COVID-19 based on chest X-ray images. Biomed. Signal Process. Control 2022, 75, 103595. [Google Scholar] [CrossRef]
  16. Ieracitano, C.; Mammone, N.; Versaci, M.; Varone, G.; Ali, A.R.; Armentano, A.; Calabrese, G.; Ferrarelli, A.; Turano, L.; Tebala, C.; et al. A fuzzy-enhanced deep learning approach for early detection of Covid-19 pneumonia from portable chest X-ray images. Neurocomputing 2022, 481, 202–215. [Google Scholar] [CrossRef]
  17. Mostafiz, R.; Uddin, M.S.; Alam, N.A.; Mahfuz Reza, M.; Rahman, M.M. Covid-19 detection in chest X-ray through random forest classifier using a hybridization of deep CNN and DWT optimized features. J. King Saud Univ. Comput. Inf. Sci. 2020, 34, 3226–3235. [Google Scholar] [CrossRef]
  18. Robi, P. Ensemble Learning. In Ensemble Machine Learning; Springer: Berlin/Heidelberg, Germany, 2012; pp. 1–34. [Google Scholar]
  19. Erhan, D.; Bengio, Y.; Courville, A.; Manzagol, P.A.; Vincent, P.; Bengio, S. Why Does Unsupervised Pre-training Help Deep Learning? J. Mach. Learn. Res. 2010, 11, 625–660. [Google Scholar]
  20. Rumelhart, D.E.; Hinton, G.E.; Williams, R.J. Learning Representations by Back-propagating Errors. Nature 1986, 323, 533–536. [Google Scholar] [CrossRef]
  21. Kingma, D.P.; Welling, M. Auto-Encoding Variational Bayes. In Proceedings of the 2nd International Conference on Learning Representations, ICLR 2014, Banff, AB, Canada, 14–16 April 2014. [Google Scholar]
  22. Kingma, D.P.; Welling, M. An Introduction to Variational Autoencoders. Found. Trends Mach. Learn. 2019, 12, 307–392. [Google Scholar] [CrossRef] [Green Version]
  23. Blaauw, M.; Bonada, J. Modeling and Transforming Speech Using Variational Autoencoders. In Proceedings of the Interspeech 2016, San Francisco, CA, USA, 8–12 September 2016; pp. 1770–1774. [Google Scholar] [CrossRef]
  24. Pu, Y.; Gan, Z.; Henao, R.; Yuan, X.; Li, C.; Stevens, A.; Carin, L. Variational Autoencoder for Deep Learning of Images, Labels and Captions. In Proceedings of the 30th International Conference on Neural Information Processing Systems, Barcelona, Spain, 5–10 December 2016; pp. 2360–2368. [Google Scholar]
  25. Chen, X.; Song, J.; Hilliges, O. Unpaired Pose Guided Human Image Generation. In Proceedings of the IEEE Conference on Computer Vision and Pattern Recognition (CVPR) Workshops, Long Beach, CA, USA, 15–20 June 2019; pp. 46–55. [Google Scholar]
  26. Kingma, D.P.; Mohamed, S.; Jimenez Rezende, D.; Welling, M. Semi-supervised Learning with Deep Generative Models. In Proceedings of the Advances in Neural Information Processing Systems, Montreal, QC, Canada, 8–13 December 2014; Volume 27, pp. 3581–3589. [Google Scholar]
  27. Goodfellow, I.; Pouget-Abadie, J.; Mirza, M.; Xu, B.; Warde-Farley, D.; Ozair, S.; Courville, A.; Bengio, Y. Generative Adversarial Nets. In Proceedings of the Advances in Neural Information Processing Systems, Montreal, QC, Canada, 8–13 December 2014; Volume 27, pp. 2672–2680. [Google Scholar]
  28. Dai, B.; Wipf, D.P. Diagnosing and Enhancing VAE Models. In Proceedings of the 7th International Conference on Learning Representations, ICLR 2019, New Orleans, LA, USA, 6–9 May 2019. [Google Scholar]
  29. Richardson, P.; Griffin, I.; Tucker, C.; Smith, D.; Oechsle, O.; Phelan, A.; Stebbing, J. Baricitinib as potential treatment for 2019-nCoV acute respiratory disease. Lancet 2020, 395, e30–e31. [Google Scholar] [CrossRef] [Green Version]
  30. Zheng, N.; Du, S.; Wang, J.; Zhang, H.; Cui, W.; Kang, Z.; Yang, T.; Lou, B.; Chi, Y.; Long, H.; et al. Predicting COVID-19 in China Using Hybrid AI Model. IEEE Trans. Cybern. 2020, 50, 2891–2904. [Google Scholar] [CrossRef]
  31. Lin, L.; Hou, Z. Combat COVID-19 with artificial intelligence and big data. J. Travel Med. 2020, 27, taaa080. [Google Scholar] [CrossRef] [PubMed]
  32. Allam, Z.; Jones, D.S. On the Coronavirus (COVID-19) Outbreak and the Smart City Network: Universal Data Sharing Standards Coupled with Artificial Intelligence (AI) to Benefit Urban Health Monitoring and Management. Healthcare 2020, 8, 46. [Google Scholar] [CrossRef] [PubMed] [Green Version]
  33. Liang, W.; Yao, J.; Chen, A.; Lv, Q.; Zanin, M.; Liu, J.; Wong, S.; Li, Y.; Lu, J.; Liang, H.; et al. Early triage of critically ill COVID-19 patients using deep learning. Nat. Commun. 2020, 11, 3543. [Google Scholar] [CrossRef] [PubMed]
  34. Mahmud, T.; Rahman, M.A.; Fattah, S.A. CovXNet: A multi-dilation convolutional neural network for automatic COVID-19 and other pneumonia detection from chest X-ray images with transferable multi-receptive feature optimization. Comput. Biol. Med. 2020, 122, 103869. [Google Scholar] [CrossRef] [PubMed]
  35. Umair, M.; Khan, M.S.; Ahmed, F.; Baothman, F.; Alqahtani, F.; Alian, M.; Ahmad, J. Detection of COVID-19 using transfer learning and Grad-CAM visualization on indigenously collected X-ray dataset. Sensors 2021, 21, 5813. [Google Scholar] [CrossRef]
  36. Li, L.; Qin, L.; Xu, Z.; Yin, Y.; Wang, X.; Kong, B.; Bai, J.; Lu, Y.; Fang, Z.; Song, Q.; et al. Using Artificial Intelligence to Detect COVID-19 and Community-acquired Pneumonia Based on Pulmonary CT: Evaluation of the Diagnostic Accuracy. Radiology 2020, 296, E65–E71. [Google Scholar] [CrossRef]
  37. Ullah, N.; Khan, J.A.; Almakdi, S.; Khan, M.S.; Alshehri, M.; Alboaneen, D.; Raza, A. A Novel CovidDetNet Deep Learning Model for Effective COVID-19 Infection Detection Using Chest Radiograph Images. Appl. Sci. 2022, 12, 6269. [Google Scholar] [CrossRef]
  38. Ozturk, T.; Talo, M.; Yildirim, E.A.; Baloglu, U.B.; Yildirim, O.; Rajendra Acharya, U. Automated detection of COVID-19 cases using deep neural networks with X-ray images. Comput. Biol. Med. 2020, 121, 103792. [Google Scholar] [CrossRef]
  39. Redmon, J.; Farhadi, A. YOLO9000: Better, Faster, Stronger. In Proceedings of the 2017 IEEE Conference on Computer Vision and Pattern Recognition (CVPR), Honolulu, HI, USA, 21–26 July 2017; pp. 6517–6525. [Google Scholar] [CrossRef] [Green Version]
  40. Khan, A.I.; Shah, J.L.; Bhat, M.M. CoroNet: A deep neural network for detection and diagnosis of COVID-19 from chest X-ray images. Comput. Methods Programs Biomed. 2020, 196, 105581. [Google Scholar] [CrossRef]
  41. Agrawal, T.; Choudhary, P. FocusCovid: Automated COVID-19 detection using deep learning with chest X-ray images. Evol. Syst. 2021, 2022, 1–13. [Google Scholar] [CrossRef]
  42. Kaul, C.; Manandhar, S.; Pears, N. Focusnet: An attention-based fully convolutional network for medical image segmentation. In Proceedings of the 2019 IEEE 16th International Symposium on Biomedical Imaging (ISBI 2019), Venice, Italy, 8–11 April 2019. [Google Scholar]
  43. Yamac, M.; Ahishali, M.; Degerli, A.; Kiranyaz, S.; Chowdhury, M.E.H.; Gabbouj, M. Convolutional Sparse Support Estimator-Based COVID-19 Recognition From X-Ray Images. IEEE Trans. Neural Netw. Learn. Syst. 2021, 32, 1810–1820. [Google Scholar] [CrossRef] [PubMed]
  44. Rasheed, J. Analyzing the Effect of Filtering and Feature-Extraction Techniques in a Machine Learning Model for Identification of Infectious Disease Using Radiography Imaging. Symmetry 2022, 14, 1398. [Google Scholar] [CrossRef]
  45. Singh, M.; Bansal, S.; Ahuja, S.; Dubey, R.K.; Panigrahi, B.K.; Dey, N. Transfer learning–based ensemble support vector machine model for automated COVID-19 detection using lung computerized tomography scan data. Med. Biol. Eng. Comput. 2021, 59, 825–839. [Google Scholar] [CrossRef]
  46. Rasheed, J.; Hameed, A.A.; Djeddi, C.; Jamil, A.; Al-Turjman, F. A machine learning-based framework for diagnosis of COVID-19 from chest X-ray images. Interdiscip. Sci. Comput. Life Sci. 2021, 13, 103–117. [Google Scholar] [CrossRef] [PubMed]
  47. Rasheed, J.; Shubair, R.M. Screening Lung Diseases Using Cascaded Feature Generation and Selection Strategies. Healthcare 2022, 10, 1313. [Google Scholar] [CrossRef] [PubMed]
  48. Subramanian, N.; Elharrouss, O.; Al-Maadeed, S.; Chowdhury, M. A review of deep learning-based detection methods for COVID-19. Comput. Biol. Med. 2022, 143, 105233. [Google Scholar] [CrossRef] [PubMed]
  49. Apostolopoulos, I.D.; Mpesiana, T.A. Covid-19: Automatic detection from X-ray images utilizing transfer learning with convolutional neural networks. Phys. Eng. Sci. Med. 2020, 43, 635–640. [Google Scholar] [CrossRef]
  50. Simonyan, K.; Zisserman, A. Very Deep Convolutional Networks for Large-Scale Image Recognition. In Proceedings of the 3rd International Conference on Learning Representations, ICLR 2015, San Diego, CA, USA, 7–9 May 2015. [Google Scholar]
  51. He, K.; Zhang, X.; Ren, S.; Sun, J. Deep Residual Learning for Image Recognition. In Proceedings of the IEEE Conference on Computer Vision and Pattern Recognition (CVPR), Las Vegas, NV, USA, 27–30 June 2016. [Google Scholar]
  52. Tan, M.; Le, Q.V. EfficientNet: Rethinking Model Scaling for Convolutional Neural Networks. In Proceedings of the 36th International Conference on Machine Learning, ICML 2019, Long Beach, CA, USA, 9–15 June 2019; Volume 97, pp. 6105–6114. [Google Scholar]
  53. Huang, G.; Liu, Z.; van der Maaten, L.; Weinberger, K.Q. Densely Connected Convolutional Networks. In Proceedings of the 2017 IEEE Conference on Computer Vision and Pattern Recognition, CVPR 2017, Honolulu, HI, USA, 21–26 July 2017; pp. 2261–2269. [Google Scholar] [CrossRef] [Green Version]
  54. Iandola, F.N.; Moskewicz, M.W.; Ashraf, K.; Han, S.; Dally, W.J.; Keutzer, K. SqueezeNet: AlexNet-level accuracy with 50x fewer parameters and <1MB model size. CoRR 2016, abs/1602.07360. Available online: https://arxiv.org/abs/1602.07360 (accessed on 21 July 2022).
  55. Tan, W.; Liu, P.; Li, X.; Liu, Y.; Zhou, Q.; Chen, C.; Gong, Z.; Yin, X.; Zhang, Y. Classification of COVID-19 pneumonia from chest CT images based on reconstructed super-resolution images and VGG neural network. Health Inf. Sci. Syst. 2021, 9, 1–12. [Google Scholar] [CrossRef]
  56. Wang, L.; Lin, Z.Q.; Wong, A. COVID-Net: A tailored deep convolutional neural network design for detection of COVID-19 cases from chest X-ray images. Sci. Rep. 2020, 10, 1–12. [Google Scholar] [CrossRef]
  57. Song, Y.; Zheng, S.; Li, L.; Zhang, X.; Zhang, X.; Huang, Z.; Chen, J.; Wang, R.; Zhao, H.; Zha, Y.; et al. Deep learning Enables Accurate Diagnosis of Novel Coronavirus (COVID-19) with CT images. IEEE/ACM Trans. Comput. Biol. Bioinform. 2021, 18, 2775–2780. [Google Scholar] [CrossRef] [PubMed]
  58. Yang, S.; Jiang, L.; Cao, Z.; Wang, L.; Cao, J.; Feng, R.; Zhang, Z.; Xue, X.; Shi, Y.; Shan, F. Deep learning for detecting corona virus disease 2019 (COVID-19) on high-resolution computed tomography: A pilot study. Ann. Transl. Med. 2020, 8, 450. [Google Scholar] [CrossRef] [PubMed]
  59. Punn, N.S.; Agarwal, S. Automated diagnosis of COVID-19 with limited posteroanterior chest X-ray images using fine-tuned deep neural networks. Appl. Intell. 2020, 51, 2689–2702. [Google Scholar] [CrossRef]
  60. Aslan, M.F.; Unlersen, M.F.; Sabanci, K.; Durdu, A. CNN-based transfer learning–BiLSTM network: A novel approach for COVID-19 infection detection. Appl. Soft Comput. 2021, 98, 106912. [Google Scholar] [CrossRef] [PubMed]
  61. Hara, K.; Saito, D.; Shouno, H. Analysis of function of rectified linear unit used in deep learning. In Proceedings of the 2015 International Joint Conference on Neural Networks (IJCNN), Killarney, Ireland, 12–16 July 2015; pp. 1–8. [Google Scholar] [CrossRef]
  62. Kandhari, R.; Negi, M.; Bhatnagar, P.; Mangipudi, P. Use of Deep Learning Models to detect COVID-19 from Chest X-Rays. In Proceedings of the 2021 International Conference on Computer Communication and Informatics (ICCCI), Coimbatore, India, 27–29 January 2021; pp. 1–5. [Google Scholar] [CrossRef]
  63. Lawton, S.; Viriri, S. Detection of COVID-19 from CT Lung Scans Using Transfer Learning. Comput. Intell. Neurosci. 2021, 2021, 1–14. [Google Scholar] [CrossRef] [PubMed]
  64. Agarap, A.F. Deep Learning using Rectified Linear Units (ReLU). CoRR 2018, abs/1803.08375. Available online: http://arxiv.org/abs/1803.08375 (accessed on 13 July 2022).
  65. El Asnaoui, K.; Chawki, Y.; Idri, A. Automated Methods for Detection and Classification Pneumonia Based on X-Ray Images Using Deep Learning. Artif. Intell. Blockchain Future Cybersecur. Appl. 2021, 90, 257–284. [Google Scholar] [CrossRef]
  66. Sintorn, I.M.; Bischof, L.; Jackway, P.; Haggarty, S.; Buckley, M. Gradient based intensity normalization. J. Microsc. 2010, 240, 249–258. [Google Scholar] [CrossRef]
  67. Yadav, G.; Maheshwari, S.; Agarwal, A. Contrast limited adaptive histogram equalization based enhancement for real time video system. In Proceedings of the 2014 International Conference on Advances in Computing, Communications and Informatics (ICACCI), Delhi, India, 24–27 September 2014; pp. 2392–2397. [Google Scholar] [CrossRef]
  68. El-Shafai, W.; Abd El-Nabi, S.; El-Rabaie, E.S.; Ali, A.M.; Soliman, N.F.; Algarni, A.D.; Abd El-Samie, F.E. Efficient Deep-Learning-Based Autoencoder Denoising Approach for Medical Image Diagnosis. Comput. Mater. Contin. 2022, 70, 6107–6125. [Google Scholar] [CrossRef]
  69. Chen, M.; Shi, X.; Zhang, Y.; Wu, D.; Guizani, M. Deep Features Learning for Medical Image Analysis with Convolutional Autoencoder Neural Network. IEEE Trans. Big Data 2017, 7, 750–758. [Google Scholar] [CrossRef]
  70. Siddalingappa, R.; Kanagaraj, S. Anomaly Detection on Medical Images using Autoencoder and Convolutional Neural Network. Int. J. Adv. Comput. Sci. Appl. 2021, 12, 148–156. [Google Scholar] [CrossRef]
  71. Mao, K.; Tang, R.; Wang, X.; Zhang, W.; Wu, H. Feature Representation Using Deep Autoencoder for Lung Nodule Image Classification. Complexity 2018, 2018, 1–11. [Google Scholar] [CrossRef]
  72. Elbattah, M.; Loughnane, C.; Guérin, J.L.; Carette, R.; Cilia, F.; Dequen, G. Variational Autoencoder for Image-Based Augmentation of Eye-Tracking Data. J. Imaging 2021, 7, 83. [Google Scholar] [CrossRef] [PubMed]
  73. Sandfort, V.; Yan, K.; Graffy, P.M.; Pickhardt, P.J.; Summers, R.M. Use of Variational Autoencoders with Unsupervised Learning to Detect Incorrect Organ Segmentations at CT. Radiol. Artif. Intell. 2021, 3, e200218. [Google Scholar] [CrossRef]
  74. Bardou, D.; Bouaziz, H.; Lv, L.; Zhang, T. Hair removal in dermoscopy images using variational autoencoders. Ski. Res. Technol. 2022, 28, 445–454. [Google Scholar] [CrossRef] [PubMed]
  75. Li, X.; Zhang, T.; Zhao, X.; Yi, Z. Guided autoencoder for dimensionality reduction of pedestrian features. Appl. Intell. 2020, 50, 4557–4567. [Google Scholar] [CrossRef]
  76. Ramamurthy, M.; Robinson, Y.H.; Vimal, S.; Suresh, A. Auto Encoder based Dimensionality reduction and classification using Convolutional Neural Networks for Hyperspectral Images. Microprocess. Microsyst. 2020, 79, 103280. [Google Scholar] [CrossRef]
  77. Wang, Y.; Yao, H.; Zhao, S. Auto-encoder based dimensionality reduction. Neurocomputing 2016, 184, 232–242. [Google Scholar] [CrossRef]
  78. Zhou, Q.; Wang, S.; Zhang, X.; Zhang, Y.D. WVALE: Weak variational autoencoder for localisation and enhancement of COVID-19 lung infections. Comput. Methods Programs Biomed. 2022, 221, 106883. [Google Scholar] [CrossRef]
  79. Rashid, N.; Hossain, M.A.F.; Ali, M.; Islam Sukanya, M.; Mahmud, T.; Fattah, S.A. AutoCovNet: Unsupervised feature learning using autoencoder and feature merging for detection of COVID-19 from chest X-ray images. Biocybern. Biomed. Eng. 2021, 41, 1685–1701. [Google Scholar] [CrossRef]
  80. Gayathri, J.L.; Abraham, B.; Sujarani, M.S.; Nair, M.S. A computer-aided diagnosis system for the classification of COVID-19 and non-COVID-19 pneumonia on chest X-ray images by integrating CNN with sparse autoencoder and feed forward neural network. Comput. Biol. Med. 2022, 141, 105134. [Google Scholar] [CrossRef]
  81. Abdulkareem, K.H.; Mostafa, S.A.; Al-Qudsy, Z.N.; Mohammed, M.A.; Al-Waisy, A.S.; Kadry, S.; Lee, J.; Nam, Y. Automated System for Identifying COVID-19 Infections in Computed Tomography Images Using Deep Learning Models. J. Healthc. Eng. 2022, 2022, 1–13. [Google Scholar] [CrossRef]
  82. Dhahri, H.; Rabhi, B.; Chelbi, S.; Almutiry, O.; Mahmood, A.; Alimi, A.M. Automatic Detection of COVID-19 Using a Stacked Denoising Convolutional Autoencoder. Comput. Mater. Contin. 2021, 69, 3259–3274. [Google Scholar] [CrossRef]
  83. Li, D.; Fu, Z.; Xu, J. Stacked-autoencoder-based model for COVID-19 diagnosis on CT images. Appl. Intell. 2020, 51, 2805–2817. [Google Scholar] [CrossRef]
  84. Wang, S.H.; Zhang, X.; Zhang, Y.D. DSSAE: Deep Stacked Sparse Autoencoder Analytical Model for COVID-19 Diagnosis by Fractional Fourier Entropy. ACM Trans. Manag. Inf. Syst. 2022, 13, 1–20. [Google Scholar] [CrossRef]
  85. Mansour, R.F.; Escorcia-Gutierrez, J.; Gamarra, M.; Gupta, D.; Castillo, O.; Kumar, S. Unsupervised Deep Learning based Variational Autoencoder Model for COVID-19 Diagnosis and Classification. Pattern Recognit. Lett. 2021, 151, 267–274. [Google Scholar] [CrossRef] [PubMed]
  86. Ortiz, A.; Trivedi, A.; Desbiens, J.; Blazes, M.; Robinson, C.; Gupta, S.; Dodhia, R.; Bhatraju, P.K.; Liles, W.C.; Lee, A.; et al. Effective deep learning approaches for predicting COVID-19 outcomes from chest computed tomography volumes. Sci. Rep. 2022, 12, 1–10. [Google Scholar] [CrossRef]
  87. Barshooi, A.H.; Amirkhani, A. A novel data augmentation based on Gabor filter and convolutional deep learning for improving the classification of COVID-19 chest X-Ray images. Biomed. Signal Process. Control 2022, 72, 103326. [Google Scholar] [CrossRef]
  88. Mamalakis, M.; Swift, A.J.; Vorselaars, B.; Ray, S.; Weeks, S.; Ding, W.; Clayton, R.H.; Mackenzie, L.S.; Banerjee, A. DenResCov-19: A deep transfer learning network for robust automatic classification of COVID-19, pneumonia, and tuberculosis from X-rays. Comput. Med. Imaging Graph. 2021, 94, 102008. [Google Scholar] [CrossRef]
  89. Liu, J.; Sun, W.; Zhao, X.; Zhao, J.; Jiang, Z. Deep feature fusion classification network (DFFCNet): Towards accurate diagnosis of COVID-19 using chest X-rays images. Biomed. Signal Process. Control 2022, 76, 103677. [Google Scholar] [CrossRef]
  90. Li, C.F.; Xu, Y.D.; Ding, X.H.; Zhao, J.J.; Du, R.Q.; Wu, L.Z.; Sun, W.P. MultiR-Net: A Novel Joint Learning Network for COVID-19 segmentation and classification. Comput. Biol. Med. 2022, 144, 105340. [Google Scholar] [CrossRef]
  91. Özdemir, Ö.; Sönmez, E.B. Attention mechanism and mixup data augmentation for classification of COVID-19 Computed Tomography images. J. King Saud Univ. Comput. Inf. Sci. 2021, 34, 6199–6207. [Google Scholar] [CrossRef]
  92. Almomany, A.; Ayyad, W.R.; Jarrah, A. Optimized implementation of an improved KNN classification algorithm using Intel FPGA platform: Covid-19 case study. J. King Saud Univ. Comput. Inf. Sci. 2022, 34, 3815–3827. [Google Scholar] [CrossRef]
  93. Rahman, T.; Khandakar, A.; Qiblawey, Y.; Tahir, A.; Kiranyaz, S.; Abul Kashem, S.B.; Islam, M.T.; Al Maadeed, S.; Zughaier, S.M.; Khan, M.S.; et al. Exploring the effect of image enhancement techniques on COVID-19 detection using chest X-ray images. Comput. Biol. Med. 2021, 132, 104319. [Google Scholar] [CrossRef]
  94. Chowdhury, M.E.H.; Rahman, T.; Khandakar, A.; Mazhar, R.; Kadir, M.A.; Mahbub, Z.B.; Islam, K.R.; Khan, M.S.; Iqbal, A.; Emadi, N.A.; et al. Can AI Help in Screening Viral and COVID-19 Pneumonia? IEEE Access 2020, 8, 132665–132676. [Google Scholar] [CrossRef]
  95. Wu, T.; Tang, C.; Xu, M.; Hong, N.; Lei, Z. ULNet for the detection of coronavirus (COVID-19) from chest X-ray images. Comput. Biol. Med. 2021, 137, 104834. [Google Scholar] [CrossRef] [PubMed]
  96. Aslan, M.F.; Sabanci, K.; Durdu, A.; Unlersen, M.F. COVID-19 diagnosis using state-of-the-art CNN architecture features and Bayesian Optimization. Comput. Biol. Med. 2022, 142, 105–244. [Google Scholar] [CrossRef]
  97. Gopatoti, A.; Vijayalakshmi, P. CXGNet: A Tri-phase Chest X-ray Image Classification for COVID-19 Diagnosis using Deep CNN with Enhanced Grey-wolf Optimizer. Biomed. Signal Process. Control 2022, 77, 103860. [Google Scholar] [CrossRef]
Figure 1. Basic architecture of a variational autoencoder.
Diagnostics 12 02569 g001
Figure 2. Model One: This architecture has two encoders and a single decoder. The feature maps of the last layers of both encoders are concatenated to give a richer feature map before reparameterization is done to sample the latent embedding z.
Diagnostics 12 02569 g002
Figure 3. Model Two: Each encoder performs its own reparameterization to generate its own latent embedding z. The latent embeddings are then merged and passed as input to the decoder and classification head for reconstruction and classification of pneumonia, respectively.
Diagnostics 12 02569 g003
Figure 4. Model Three: Each encoder performs its own reparameterization to generate its own latent embedding z. The latent embeddings are passed to their respective decoders for reconstruction of the input image and then merged and passed as input to the classification head for classification of pneumonia.
Diagnostics 12 02569 g004
Figure 5. Sample datasets used in this work: (a) sample with COVID-19, (b) sample with lung opacity, (c) sample with normal, and (d) sample viral pneumonia.
Diagnostics 12 02569 g005
Figure 6. Performance comparison of the three models in terms of validation accuracy and loss. The (ac) presents the performance of the three models on three classes, while the (df) presents the performance on four classes.
Diagnostics 12 02569 g006
Table 1. Summary of related works.
Ref./YearTechniqueAdvantagesLimitations
[34]/2020Depthwise convolution with varying dilation rates
  • Efficiently extracts chest X-ray features by varying depthwise convolution and changing the dilation rate
  • No sensitivity analysis was performed
[35]/2021Transfer learning
  • Classification task is made easier using pre-trained networks.
  • Highlights the features extracted in the X-ray images using Grad-CAM.
  • Dropout is used to avoid overfitting
  • Did not test the robustness of the model on multi-class classification
[36]/2020CNN
  • Extracts both 2D local and 3D global representative features
  • Vanishing gradient problem is solved by use of residual network
  • Model was trained on a smaller dataset
[37]/2022CovidDetNet classifier
  • Computationally efficient due to fewer layers
  • Successfully extracts more distinguishing features
  • Normalization technique is used, which improves the convergence during training from the chest radiograph images
  • Did not test the robustness of the model on other classes, such as four-classes
[38]/2020DarkCovidNet classifier
  • Classification performance is improved using 5-fold cross-validation
  • Could use dropout to avoid overfitting
[40]/2020CoroNet classifier
  • Transfer learning is used to improve the quality of the deep features
  • Dropout can be used to avoid overfitting
  • Model was trained on a small dataset
[41]/2021FocusCovid classifier
  • Data augmentation and normalization are used to avoid overfitting
  • Classification performance is improved using attention mechanisms
  • Classification task is made easier using pre-trained networks.
  • Cross-validation is used to estimate the general effectiveness of the models
  • Model was trained on a smaller dataset
[43]/2021Convolution support estimation network (CSEN)
  • Efficient in terms of speed and memory usage
  • Performance degrades rapidly due to the scarcity of data
[59]/2021Transfer learning
  • Class imbalance problem is dealt with using the weighted loss function
  • Visualizes the prediction of the model using activation maps and LIME technique
  • Cross-validation method is used to estimate the general effectiveness of the models
  • Focused only on posterior–anterior (PA) view of the X-rays, so unable to differentiate other views of X-ray images
[60]/2021CNN-based transfer learning–BiLSTM
  • CNN combined with LSTM provides better classification accuracy Data augmentation used to avoid overfitting
  • Dropout can be used to avoid overfitting
[62]/2021Transfer learning
  • A pre-trained network trained on a larger dataset is used to work efficiently on small datasets.
  • Model was trained on a small dataset.
  • Only binary classification was performed.
[63]/2021Transfer learning
  • HE and CLAHE were used to eliminate noise and improve the quality of the CT scan images.
  • Data augmentation was applied to avoid overfitting.
  • Pre-trained models are used to stabilize training
  • Model was trained on a small dataset.
  • Only binary classification was performed.
[65]/2021Transfer learning
  • Handles chest CT images and chest X-ray images.
  • Intensity normalization CLAHE were used to eliminate noise and improve the quality of the X-ray images.
  • Data augmentation, weight-decay, and L2 regularizer are applied over-fitting.
  • Only binary classification was done
Table 2. Dataset composition for both three and four classes.
SetCOVIDNormalLung OpacityViral Pneumonia
Four classes   Training216761153607807
Validation108530581804404
Testing3641019601134
Total361610,19260121345
Three classesTraining35003500-3500
Validation12501250-1250
Testing250250-250
Total50005000-5000
Table 3. Experimental results for the selection of the backbone network.
Pre-Trained ModelAccuracy (%)Recall (%)Precision (%)F1 Score (%)
ResNet5096.4396.4596.4596.42
VGG1696.2196.1996.2196.24
DenseNet12195.7395.7395.7795.76
Xception95.7195.795.7495.74
Table 4. Selected hyperparameters for EVAE-Net.
HyperparameterValue
Learning rate0.00003
Optimizer algorithmAdam
Number of epochs20
Batch size4
Latent dimension128
Input image dimensions 3 × 224 × 224
Table 5. Computational complexity of the three models in terms of parameters (in millions) and multiply-and-accumulate operations (MACs).
ModelParameters (M)MACS (G)
Model One56.17692.291
Model Two56.96392.294
Model Three87.745123.120
Table 6. Best performance for the three models on the validation dataset. For each model, the performance metrics for both three classes and four classes are shown, along with the best learning rate.
ModelPredicted ClassesLearning RateAccuracy (%)Recall (%)Precision (%)F1 Score (%)
Model Onethree classes0.0000398.1498.0098.2098.15
four classes0.0000396.4495.1896.4895.49
Model Twothree classes0.0000198.0097.9997.9997.99
four classes0.0000397.1296.1896.2397.14
Model Threethree classes0.0000498.2498.2498.3298.27
four classes0.0000398.7298.5298.5598.77
Table 7. Performance metrics of the best model among the three models for both three and four classes on the validation dataset.
Predicted ClassesModelAccuracy (%)Recall (%)Precision (%)F1 Score (%)
Three classesModel Three98.2498.2498.2598.24
Four classesModel Three98.7298.5298.5598.77
Table 8. Cross-validation results on the testing dataset for both three classes and four classes.
ModelPredicted classesAccuracy (%)Recall (%)Precision (%)F1 Score (%)
Model OneThree classes98.5798.4298.4798.47
Four classes97.0496.5596.8996.55
Model TwoThree classes98.4398.3798.3598.35
Four classes97.9997.9097.7097.91
Model ThreeThree classes98.6698.4798.7598.60
Four classes99.1998.8298.8298.94
Table 9. Confusion matrix for three classes on the testing dataset for the best model.
Predicted Class
COVID-19NormalViral Pneumonia
Actual ClassCOVID-19203740
Normal1020733
Viral Pneumonia2515210
Table 10. Confusion matrix for four classes on the test dataset for the best model.
Predicted Classes
COVID-19NormalLung OpacityViral Pneumonia
Actual ClassCOVID-19361103
Normal1101602
Lung Opacity215953
Viral Pneumonia301130
Table 11. Ablation study of different latent vector sizes on the performance of the model. Latent size of 128 achieved the best performance among all the models. (Optimizer = Adam; Learning rate = 0.00003; Epochs = 20; set = validation dataset).
ModelLatent SizeAccuracy (%)LossRecall (%)Precision (%)F1 Score (%)
4 Classes
Model One3293.120.211393.0092.7693.05
6494.520.173694.2794.2094.23
12896.440.110595.1896.4895.49
Model Two3294.790.176594.7294.7594.74
6495.270.136595.3095.2995.35
12897.120.099896.1896.2397.14
Model Three3295.880.153295.8295.8595.82
6496.270.111296.2596.2996.29
12898.720.087598.5298.5598.77
3 Classes
Model One3295.460.163295.4095.4895.50
6496.320.124596.3096.2996.30
12898.140.096698.0098.2098.15
Model Two3295.190.154295.1095.1195.13
6496.350.125496.3396.3896.35
12898.000.0806197.9997.9997.99
Model Three3295.460.146395.4495.4295.45
6496.650.105296.7096.6996.70
12898.240.050698.2498.3298.27
Table 12. Performance comparison of proposed model with existing studies. Methods with * used the COVID-19 Radiography Dataset.
ClassMethodAccuracy (%)Recall (%)Precision (%)F1 Score (%)
4Gopatoti and Vijayalakshmi [97]94.0095.3195.3193.74
Ozturk et al. [38]90.1390.3988.3888.28
* Khan et al. [40]92.9392.5890.2992.26
Apostolopoulos and Mpesiana [49]91.9291.4989.1890.40
Mostafiz et al. [17]98.4897.8998.7298.29
EVAE-Net99.1998.8298.8298.94
3Gopatoti and Vijayalakshmi [97]97.0596.9694.4495.38
* Agrawal and Choudhary [41]95.2095.2095.6095.20
* Wu et al. [95]97.6796.5496.6596.59
* Aslan et al. [96]96.2996.4296.4294.53
* Ullah et al. [37]98.4096.6697.0096.82
EVAE-Net98.6698.4798.7598.60
Publisher’s Note: MDPI stays neutral with regard to jurisdictional claims in published maps and institutional affiliations.

