
Performance Evaluation of BD FACSPrestoTM Near-Patient CD4 Counter for Monitoring Antiretroviral Therapy in HIV-Infected Individuals in Primary Healthcare Clinics in Thailand

 and
and
Abstract
:1. Introduction
2. Materials and Methods
2.1. Study Design
2.2. Patients and Blood Sample Collection
2.3. Standard TriTEST/TruCOUNT Tubes Method
2.4. BDB FACSPresto Near-Patient CD4 Counter Method
2.5. Quality Control and Assay Precision
2.6. Statistical Analysis
3. Results
4. Discussion
5. Conclusions
Author Contributions
Funding
Institutional Review Board Statement
Informed Consent Statement
Data Availability Statement
Conflicts of Interest
References
- Belaunzaran-Zamudio, P.F.; Caro-Vega, Y.N.; Shepherd, B.E.; Rebeiro, P.F.; Crabtree-Ramirez, B.E.; Cortes, C.P.; Grinsztejn, B.; Gotuzzo, E.; Mejia, F.; Padgett, D.; et al. The population impact of late presentation with advanced HIV disease and delayed antiretroviral therapy in adults receiving HIV care in Latin America. Am. J. Epidemiol. 2020, 189, 564–572. [Google Scholar] [CrossRef] [PubMed]
- Brennan, A.T.; Maskew, M.; Larson, B.A.; Tsikhutsu, I.; Bii, M.; Vezi, L.; Fox, M.P.; Venter, W.D.; Ehrenkranz, P.; Rosen, S. Who is seeking antiretroviral treatment for HIV now? Characteristics of patients presenting in Kenya and South Africa in 2017–2018. J. Int. AIDS Soc. 2019, 22, e25358. [Google Scholar] [CrossRef] [Green Version]
- Auld, A.F.; Shiraishi, R.W.; Oboho, I.; Ross, C.; Bateganya, M.; Pelletier, V.; Dee, J.; Francois, K.; Duval, N.; Antoine, M.; et al. Trends in prevalence of advanced HIV disease at antiretroviral therapy enrollment–10 countries, 2004–-2015. MMWR Morb. Mortal. Wkly. Rep. 2017, 66, 558–563. [Google Scholar] [CrossRef] [Green Version]
- UNAIDS. Understanding Fast-Track: Accelerating Action to End the Aids Epidemic by 2030. Available online: Unaids.org/sites/default/files/media_asset/201506_JC2743_Understanding_FastTrack_en.pdf (accessed on 15 January 2022).
- UNAIDS. The Joint United on Nations Programme HIV/AIDS. Available online: https://www.unaids.org/en/regionscountries/countries/thailand (accessed on 15 August 2021).
- World Health Organization. Antiretroviral Therapy for HIV Infection in Adults and Adolescents: Recommendations for a Public Health Approach—2010 Revision, 2010 Rev. Available online: https://apps.who.int/iris/handle/10665/43554 (accessed on 15 August 2021).
- Fauci, A.S.; Macher, A.M.; Longo, D.L.; Lane, H.C.; Rook, A.H.; Masur, H.; Gelmann, E.P. NIH conference. Acquired immunodeficiency syndrome: Epidemiologic, clinical, immunologic, and therapeutic considerations. Ann. Intern. Med. 1984, 100, 92–106. [Google Scholar] [CrossRef] [Green Version]
- HIV Surrogate Marker Collaborative Group. Human immunodeficiency virus type 1 RNA level and CD4 count as prognostic markers and surrogate end points: A meta-analysis. HIV Surrogate Marker Collaborative Group. AIDS Res. Hum. Retrovir. 2000, 16, 1123–1133. [Google Scholar] [CrossRef] [PubMed]
- World Health Organization. Consolidated Guidelines on HIV Prevention, Testing, Treatment, Service Delivery and Monitoring: Recommendations for a Public Health Approach; World Health Organization: Geneva, Switzerland, 2021. Available online: https://apps.who.int/iris/handle/10665/44379 (accessed on 1 June 2021).
- Ford, N.; Meintjes, G.; Vitoria, M.; Greene, G.; Chiller, T. The evolving role of CD4 cell counts in HIV care. Curr. Opin. HIV AIDS 2017, 12, 123–128. [Google Scholar] [CrossRef] [PubMed]
- 1997 revised guidelines for performing CD4+ T-cell determinations in persons infected with human immunodeficiency virus (HIV). Centers for Disease Control and Prevention. MMWR Recomm. Rep. 1997, 46, 1–29.
- National Committee for Clinical Laboratory Standards, Clinical Application of Flow Cytometry: Immunophenotyping of Lymphocytes. Approved Guideline; NCCLS Document H42A; NCCLS: Wayne, PA, USA, 1998; Volume 18.
- Mandy, F.F.; Nicholson, J.K.; McDougal, J.S.; CDC. Guidelines for performing single-platform absolute CD4+ T-cell determinations with CD45 gating for persons infected with human immunodeficiency virus. Centers for Disease Control and Prevention. MMWR Recomm. Rep. 2003, 52, 1–13. [Google Scholar]
- BD Biosciences, Becton Dickinson FACSPrestoTM System: A Near-Patient Complete CD4 Testing Solution. Available online: https://www.bd.com/documents/bd-legacy/brochures/biosciences/BDB_BD-FACSPresto-TS_TR.pdf (accessed on 15 August 2021).
- Thakar, M.; Angira, F.; Pattanapanyasat, K.; Wu, A.H.B.; O’Gorman, M.; Zeng, H.; Qu, C.; Mahajan, B.; Sukapirom, K.; Chen, D.; et al. CD4 Lymphocyte Enumeration and Hemoglobin Assessment Aid for Priority Decisions: A Multisite Evaluation of the BD FACSPresto™ System. Open AIDS J. 2017, 11, 76–90. [Google Scholar] [CrossRef]
- Daneau, G.; Aboud, S.; Prat, I.; Urassa, W.; Kestens, L. Performance of FACSPresto Point-of-Care Instrument for CD4-T Cell Enumeration in Human Immunodeficiency Virus (HIV)-Infected Patients Attending Care and Treatment Clinics in Belgium and Tanzania. PLoS ONE 2017, 12, e0170248. [Google Scholar] [CrossRef]
- Angira, F.; Akoth, B.; Omolo, P.; Opollo, V.; Bornheimer, S.; Judge, K.; Tilahun, H.; Lu, B.; Omana-Zapata, I.; Zeh, C. Clinical Evaluation of the BD FACSPresto Near-Patient CD4 Counter in Kenya. PLoS ONE 2016, 11, e0157939. [Google Scholar] [CrossRef] [PubMed]
- Makadzange, A.T.; Bogezi, C.; Boyd, K.; Gumbo, A.; Mukura, D.; Matubu, A.; Ndhlovu, C.E. Evaluation of the FACSPresto, a New Point of Care Device for the Enumeration of CD4% and Absolute CD4+ T Cell Counts in HIV Infection. PLoS ONE 2016, 11, e0157546. [Google Scholar] [CrossRef] [PubMed] [Green Version]
- Coetzee, L.M.; Moodley, K.; Glencross, D.K. Performance Evaluation of the Becton Dickinson FACSPresto Near-Patient CD4 Instrument in a Laboratory and Typical Field Clinic Setting in South Africa. PLoS ONE 2016, 11, e0156266. [Google Scholar]
- Negedu-Momoh, O.R.; Jegede, F.E.; Yakubu, A.; Balogun, O.; Abdullahi, M.; Badru, T.; Oladele, E.A.; Agbakwuru, C.; Khamofu, H.; Torpey, K. Performance evaluation of BD FACSPresto point of care CD4 analyzer to enumerate CD4 counts for monitoring HIV infected individuals in Nigeria. PLoS ONE 2017, 12, e0178037. [Google Scholar] [CrossRef] [PubMed] [Green Version]
- Moran, Z.; Sacks, J.A.; Frimpong, F.K.; Frimpong, A.B.; Ben Amor, Y. Performance of the BD-FACS Presto for CD4 count and hemoglobin measurement in a district hospital and rural laboratory in Ghana. PLoS ONE 2019, 14, e0212684. [Google Scholar]
- World Health Organization. March 2014 Supplement to the 2013 Consolidated Guidelines on the Use of Antiretroviral Drugs for Treating and Preventing HIV Infection: Recommendations for a Public Health Approach. Available online: https://apps.who.int/iris/handle/10665/104264. (accessed on 15 August 2021).
- Passing, H.; Bablok. A new biometrical procedure for testing the equality of measurements from two different analytical methods. Application of linear regression procedures for method comparison studies in clinical chemistry, Part I. J Clin. Chem. Clin. Biochem. 1983, 21, 709–720. [Google Scholar] [PubMed]
- Bland, J.M.; Altman, D.G. Statistical methods for assessing agreement between two methods of clinical measurement. Lancet 1986, 1, 307–310. [Google Scholar] [CrossRef]
- Scott, L.E.; Galpin, J.S.; Glencross, D.K. Multiple method comparison: Statistical model using percentage similarity. Cytom. B Clin. Cytom. 2003, 54, 46–53. [Google Scholar] [CrossRef]
- Mtapuri-Zinyowera, S.; Chideme, M.; Mangwanya, D.; Mugurungi, O.; Gudukeya, S.; Hatzold, K.; Mangwiro, A.; Bhattacharya, G.; Lehe, J.; Peter, T. Evaluation of the PIMA point-of-care CD4 analyzer in VCT clinics in Zimbabwe. J. Acquir. Immune Defic. Syndr. 2010, 55, 1–7. [Google Scholar] [CrossRef] [Green Version]
- Scott, L.E.; Campbell, J.; Westerman, L.; Kestens, L.; Vojnov, L.; Kohastsu, L.; Nkengasong, J.; Peter, T.; Stevens, W. A meta-analysis of the performance of the Pima CD4 for point of care testing. BMC Med. 2015, 13, 168. [Google Scholar] [CrossRef] [Green Version]
- Glencross, D.K.; Coetzee, L.M.; Faal, M.; Masango, M.; Stevens, W.S.; Venter, W.F.; Osih, R. Performance evaluation of the Pima point-of-care CD4 analyser using capillary blood sampling in field tests in South Africa. J. Int. AIDS Soc. 2012, 15, 3. [Google Scholar] [CrossRef] [PubMed] [Green Version]
- Dieye, T.N.; Vereecken, C.; Diallo, A.A.; Ondoa, P.; Diaw, P.A.; Camara, M.; Karam, F.; Mboup, S.; Kestens, L. Absolute CD4 T-cell counting in resource-poor settings: Direct volumetric measurements versus bead-based clinical flow cytometry instruments. J. Acquir. Immune Defic. Syndr. 2005, 39, 32–37. [Google Scholar] [CrossRef]
- Pattanapanyasat, K.; Lerdwana, S.; Noulsri, E.; Chaowanachan, T.; Wasinrapee, P.; Sakulploy, N.; Pobkeeree, V.; Suksripanich, O.; Thanprasertsuk, S.; Spira, T.J.; et al. Evaluation of a new single-parameter volumetric flow cytometer (CyFlow(green)) for enumeration of absolute CD4+ T lymphocytes in human immunodeficiency virus type 1-infected Thai patients. Clin. Diagn. Lab. Immunol. 2005, 12, 1416–1424. [Google Scholar] [CrossRef] [PubMed] [Green Version]
- Pattanapanyasat, K.; Phuang-Ngern, Y.; Lerdwana, S.; Wasinrapee, P.; Sakulploy, N.; Noulsri, E.; Thepthai, C.; McNicholl, J.M. Evaluation of a single-platform microcapillary flow cytometer for enumeration of absolute CD4+ T-lymphocyte counts in HIV-1 infected Thai patients. Cytom. B Clin. Cytom. 2007, 72, 387–396. [Google Scholar] [CrossRef]
- Sukapirom, K.; Onlamoon, N.; Thepthai, C.; Polsrila, K.; Tassaneetrithep, B.; Pattanapanyasat, K. Performance evaluation of the Alere PIMA CD4 test for monitoring HIV-infected individuals in resource-constrained settings. J. Acquir. Immune Defic. Syndr. 2011, 58, 141–147. [Google Scholar] [CrossRef] [PubMed]


| Variation | Mean % CV ± SD | |
|---|---|---|
| FACSCalibur/TriTest/TruCount | FACSPresto | |
| Within-run | 2.6 ± 1.2 | 3.8 ± 2.0 |
| Between-run | 7.8 ± 3.7 | 8.3 ± 4.6 |
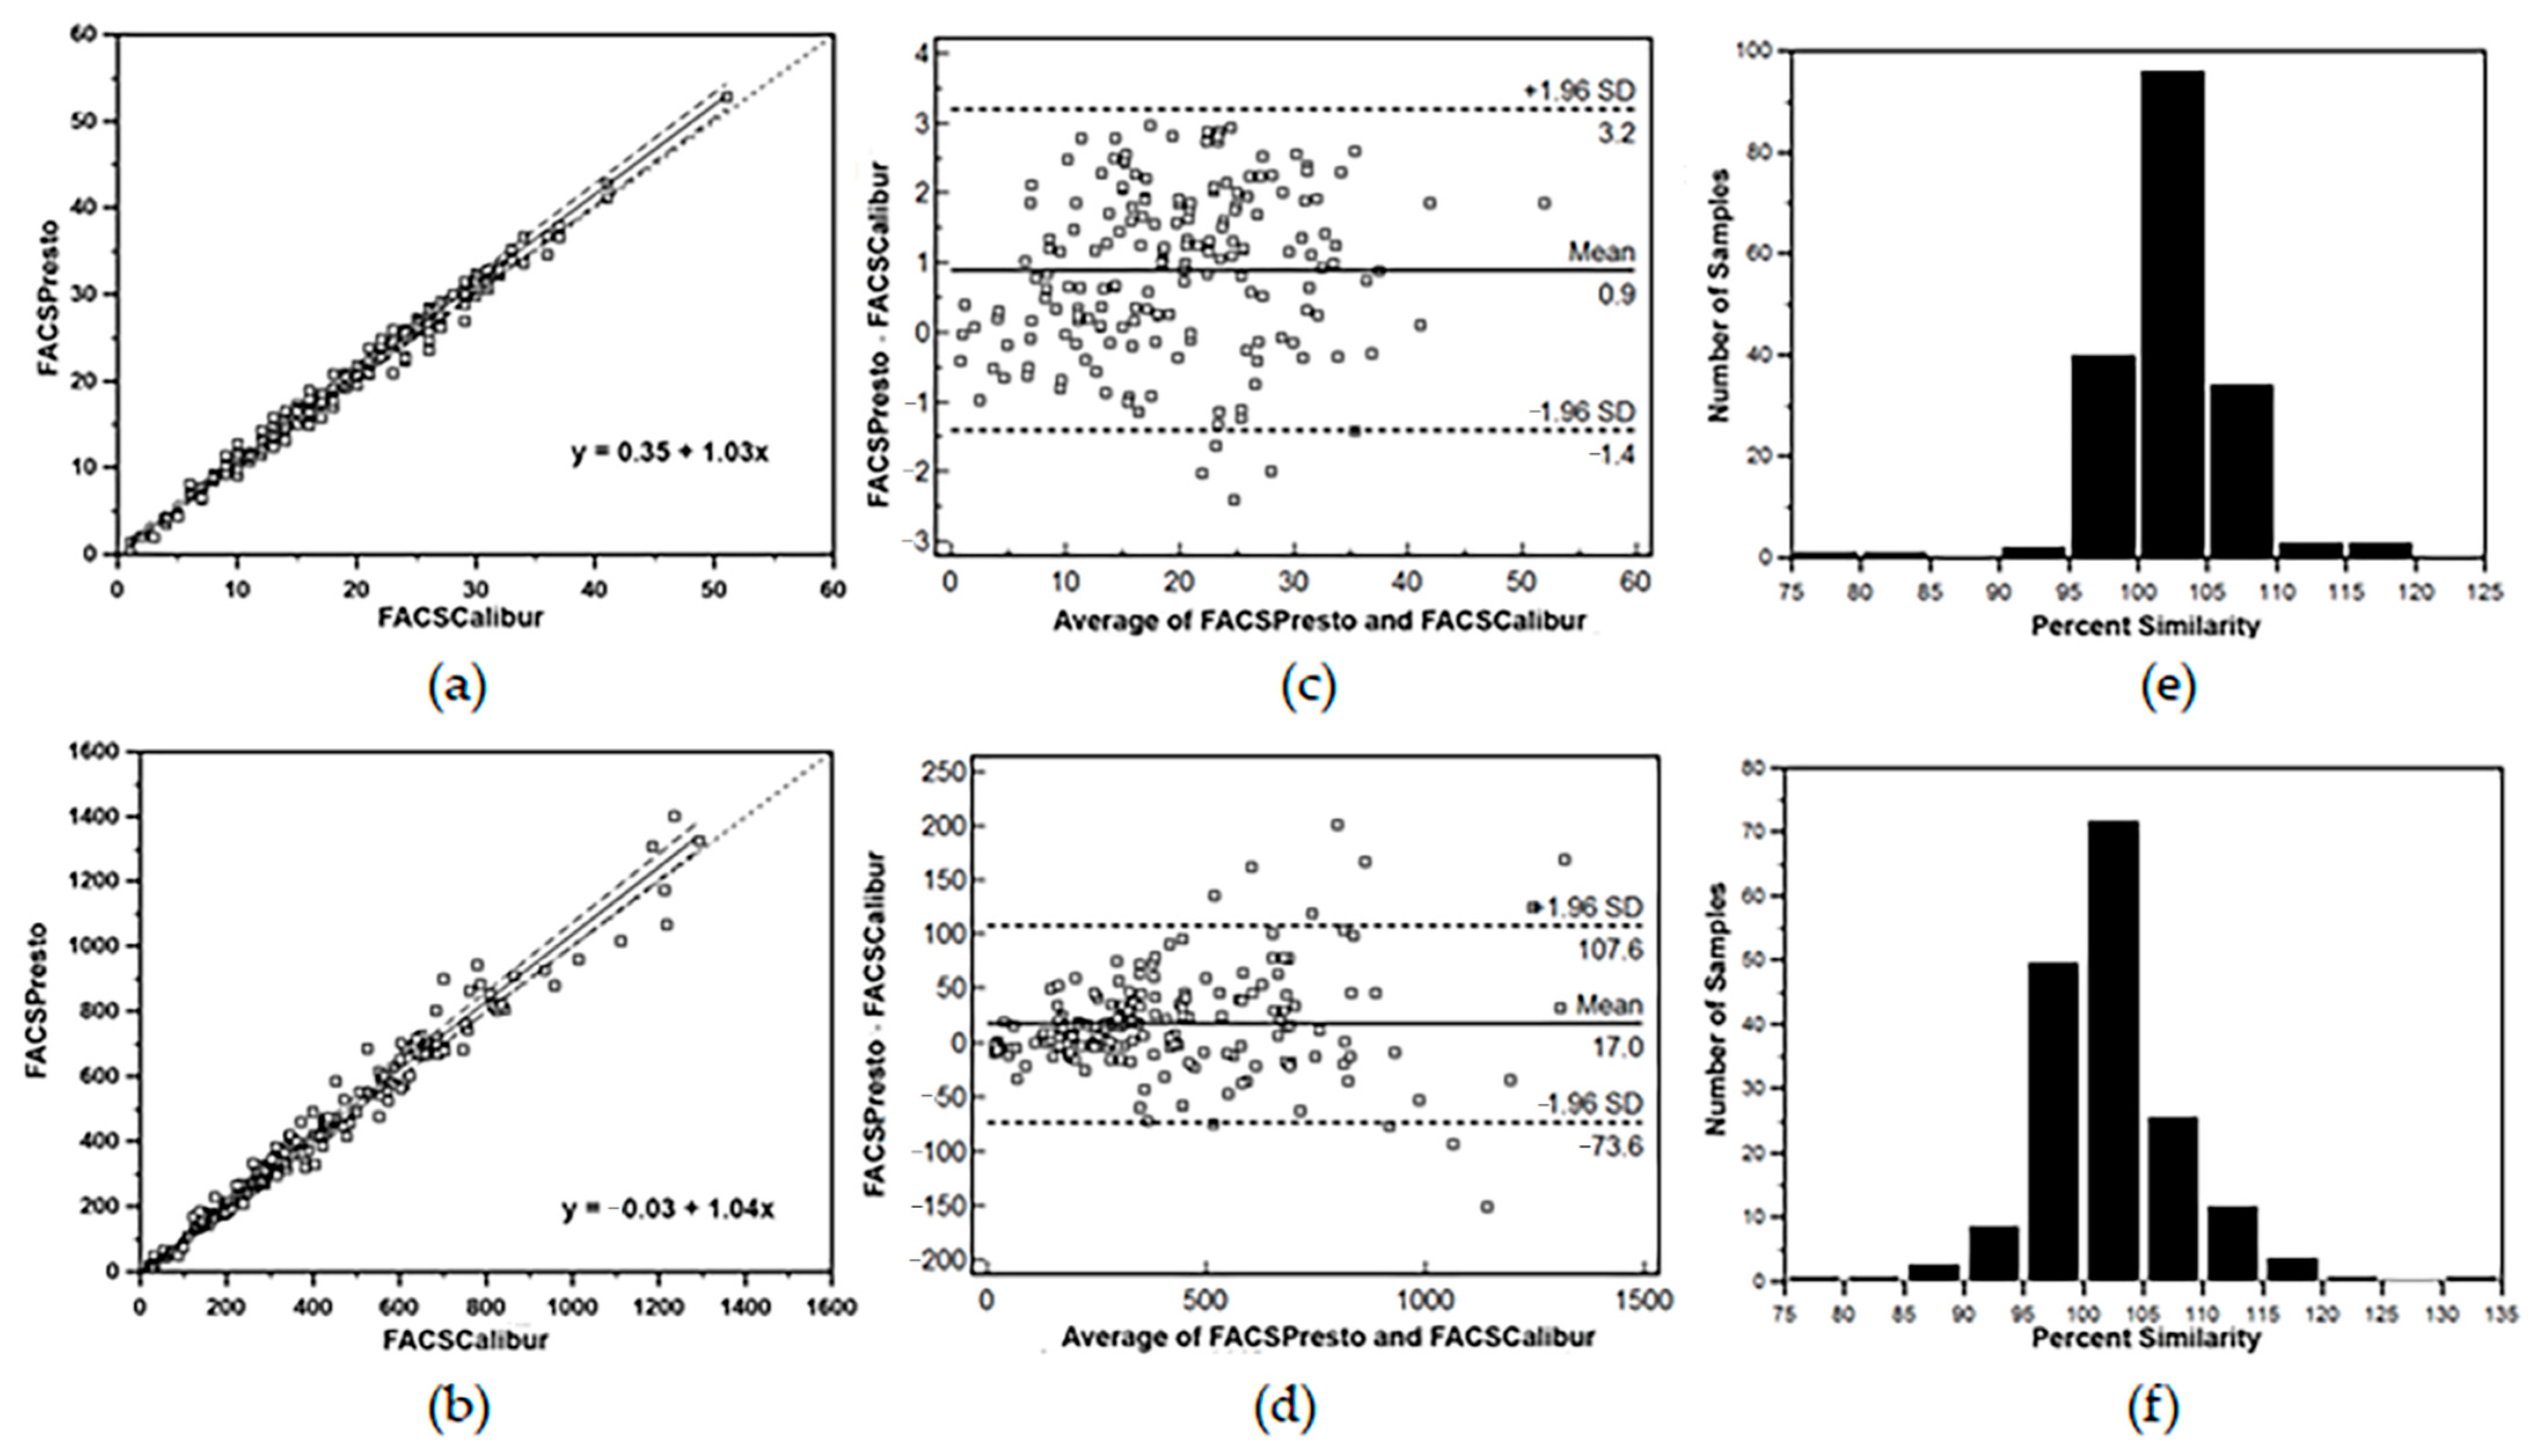
| Parameter | CD4 (%) | Absolute CD4 (cells/μL) |
|---|---|---|
| Regression | y = 0.75 + 1.02x | y = 0.92 + 1.07x |
| 95% * CI for intercept | +0.06 to 1.82 | −32.17 to 36.20 |
| 95% CI for slope | 0.98 to 1.06 | 0.97 to 1.13 |
| Bland–Altman mean bias | +1.2 | +20.5 |
| ** LOA (mean difference ± 1.96SD) | 1.0 to 3.3% | −136.1 to +177.2 |
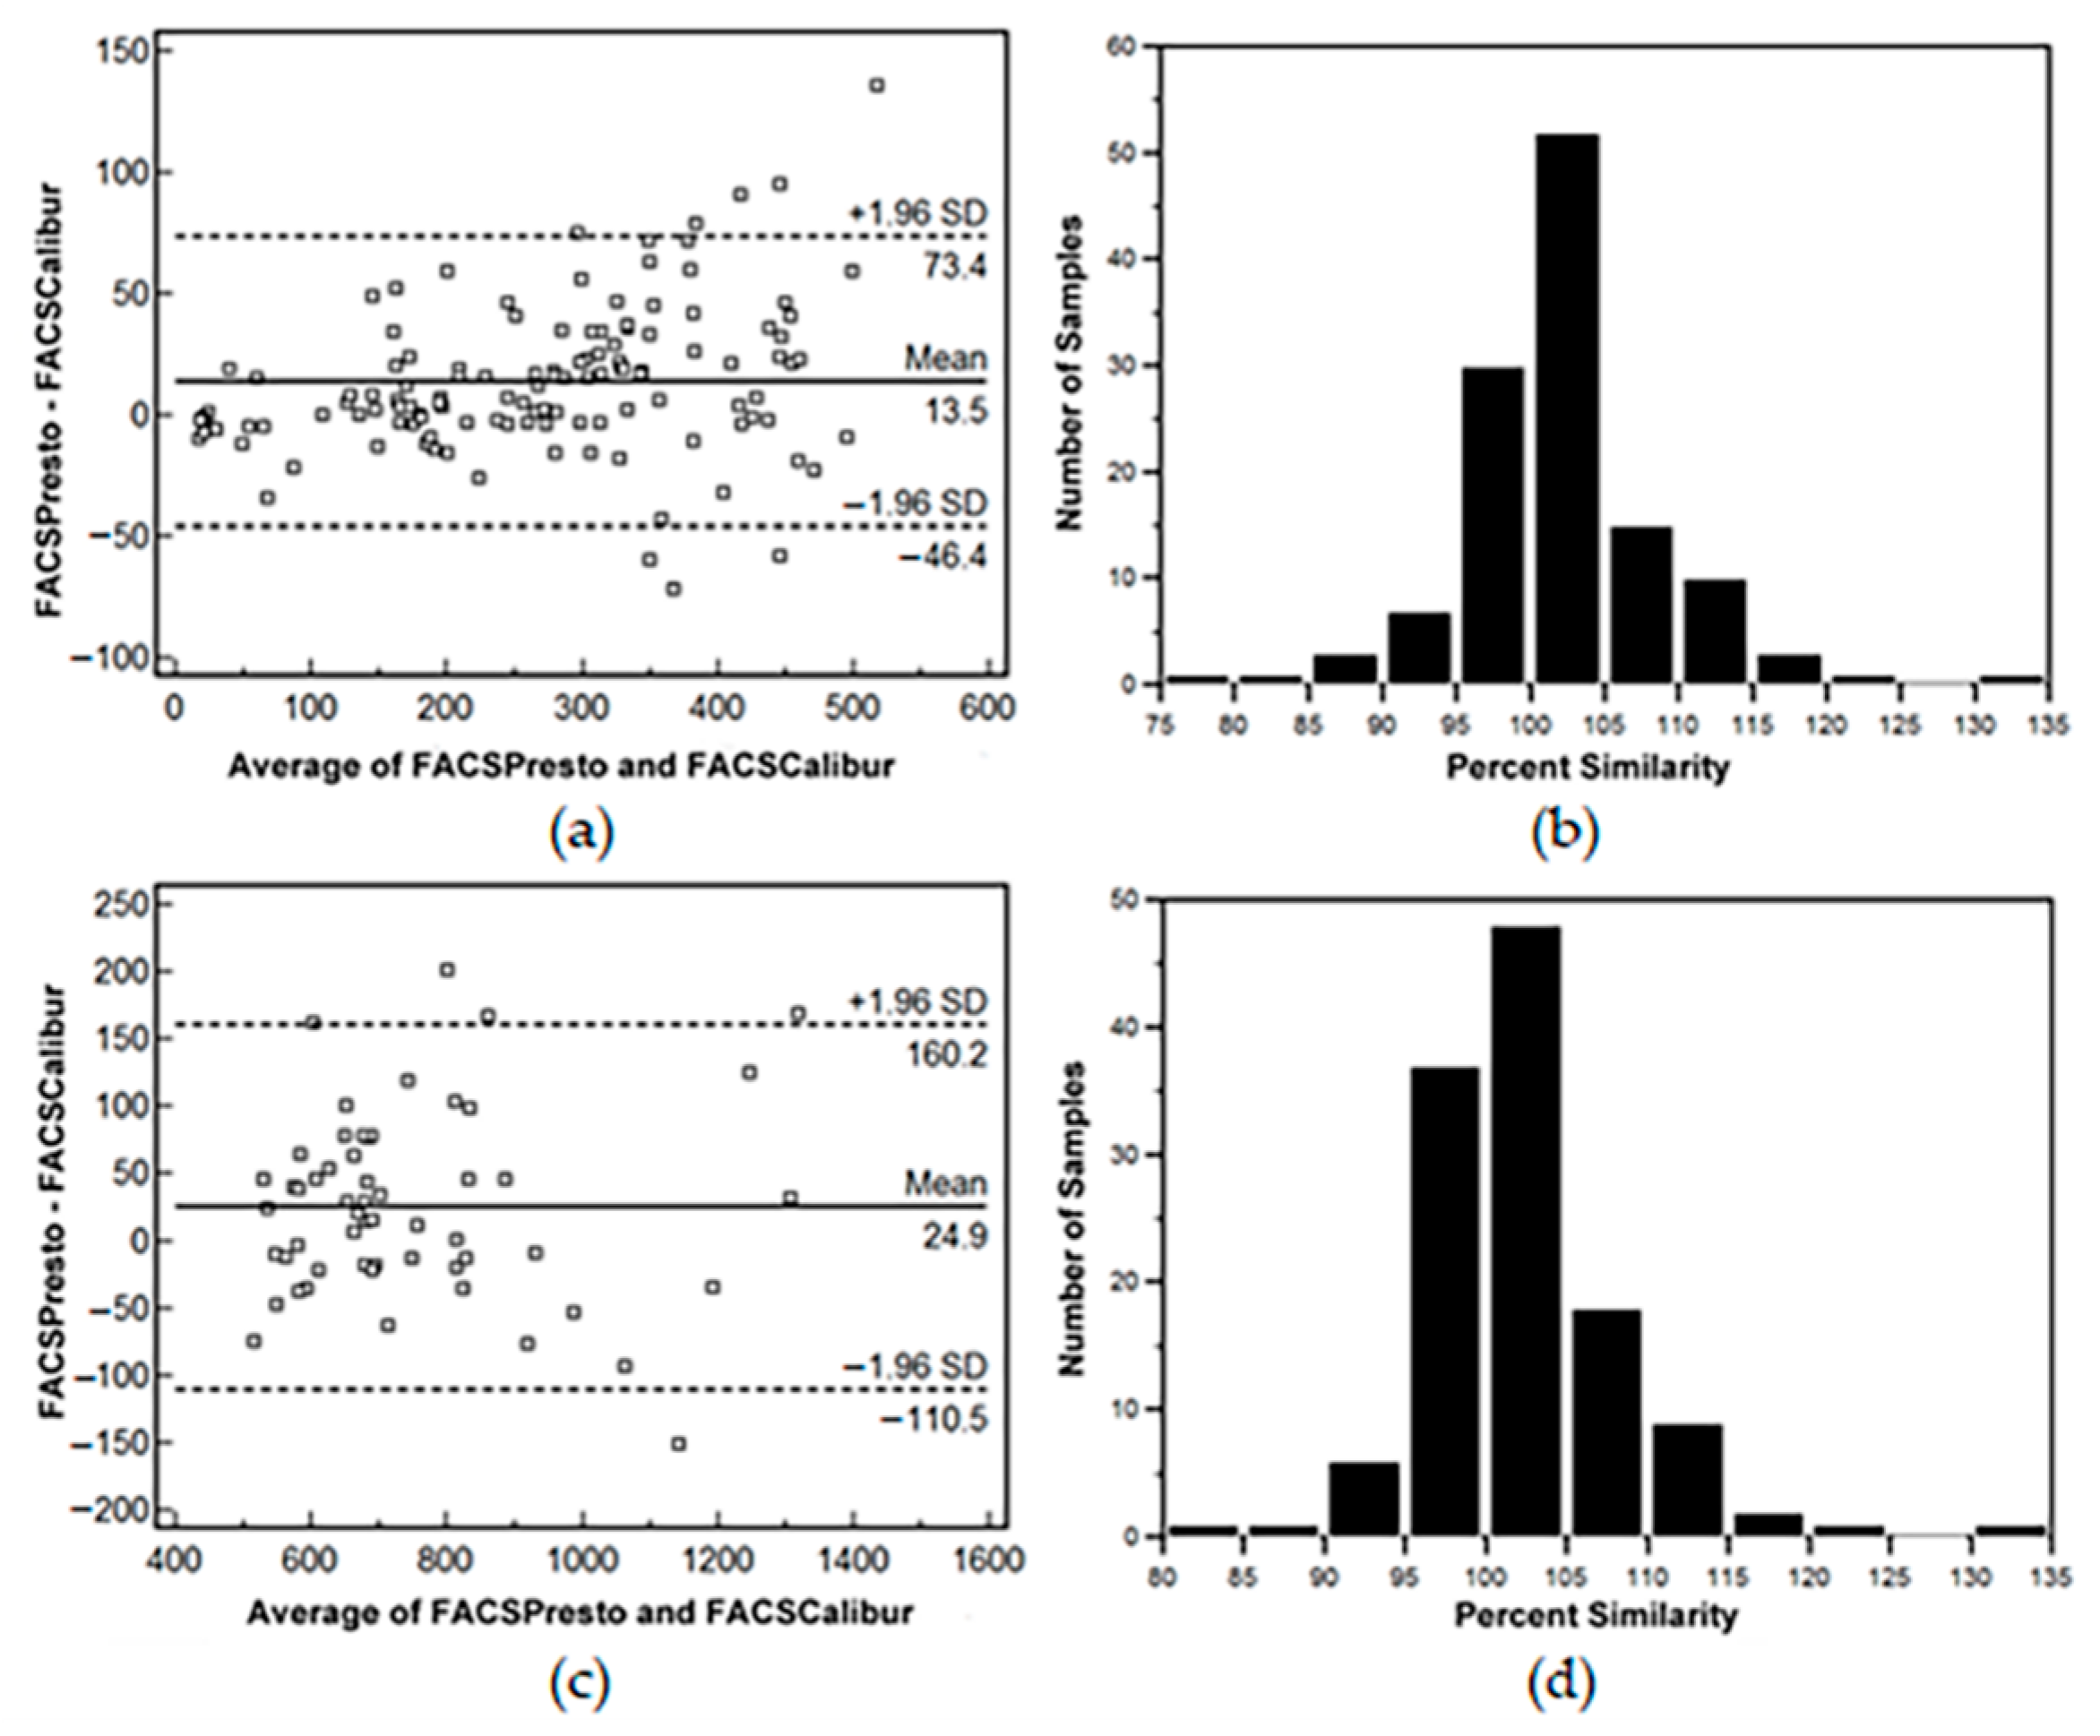
| FACSPresto Venous vs. Capillary | ||
| Parameter | CD4 (%) | Absolute CD4 (cells/μL) |
| Mean | ||
| Venous blood | 28.23 ± 8.18% | 874 ± 617 |
| Capillary blood | 27.05 ± 8.39% | 928 ± 656 |
| Regression | y = −1.34 + 1.01x | y = −15.84 + 1.91x |
| 95% * CI for intercept | −2.67 to 0.03 | −48.77 to 9.46 |
| 95% CI for slope | 0.97 to 1.06 | 1.05 to 1.14 |
| Bland–Altman mean bias | −1.2% | +54 |
| ** LOA (mean difference ± 1.96SD) | −4.6 to 2.2% | −148.3 to +256.2 |
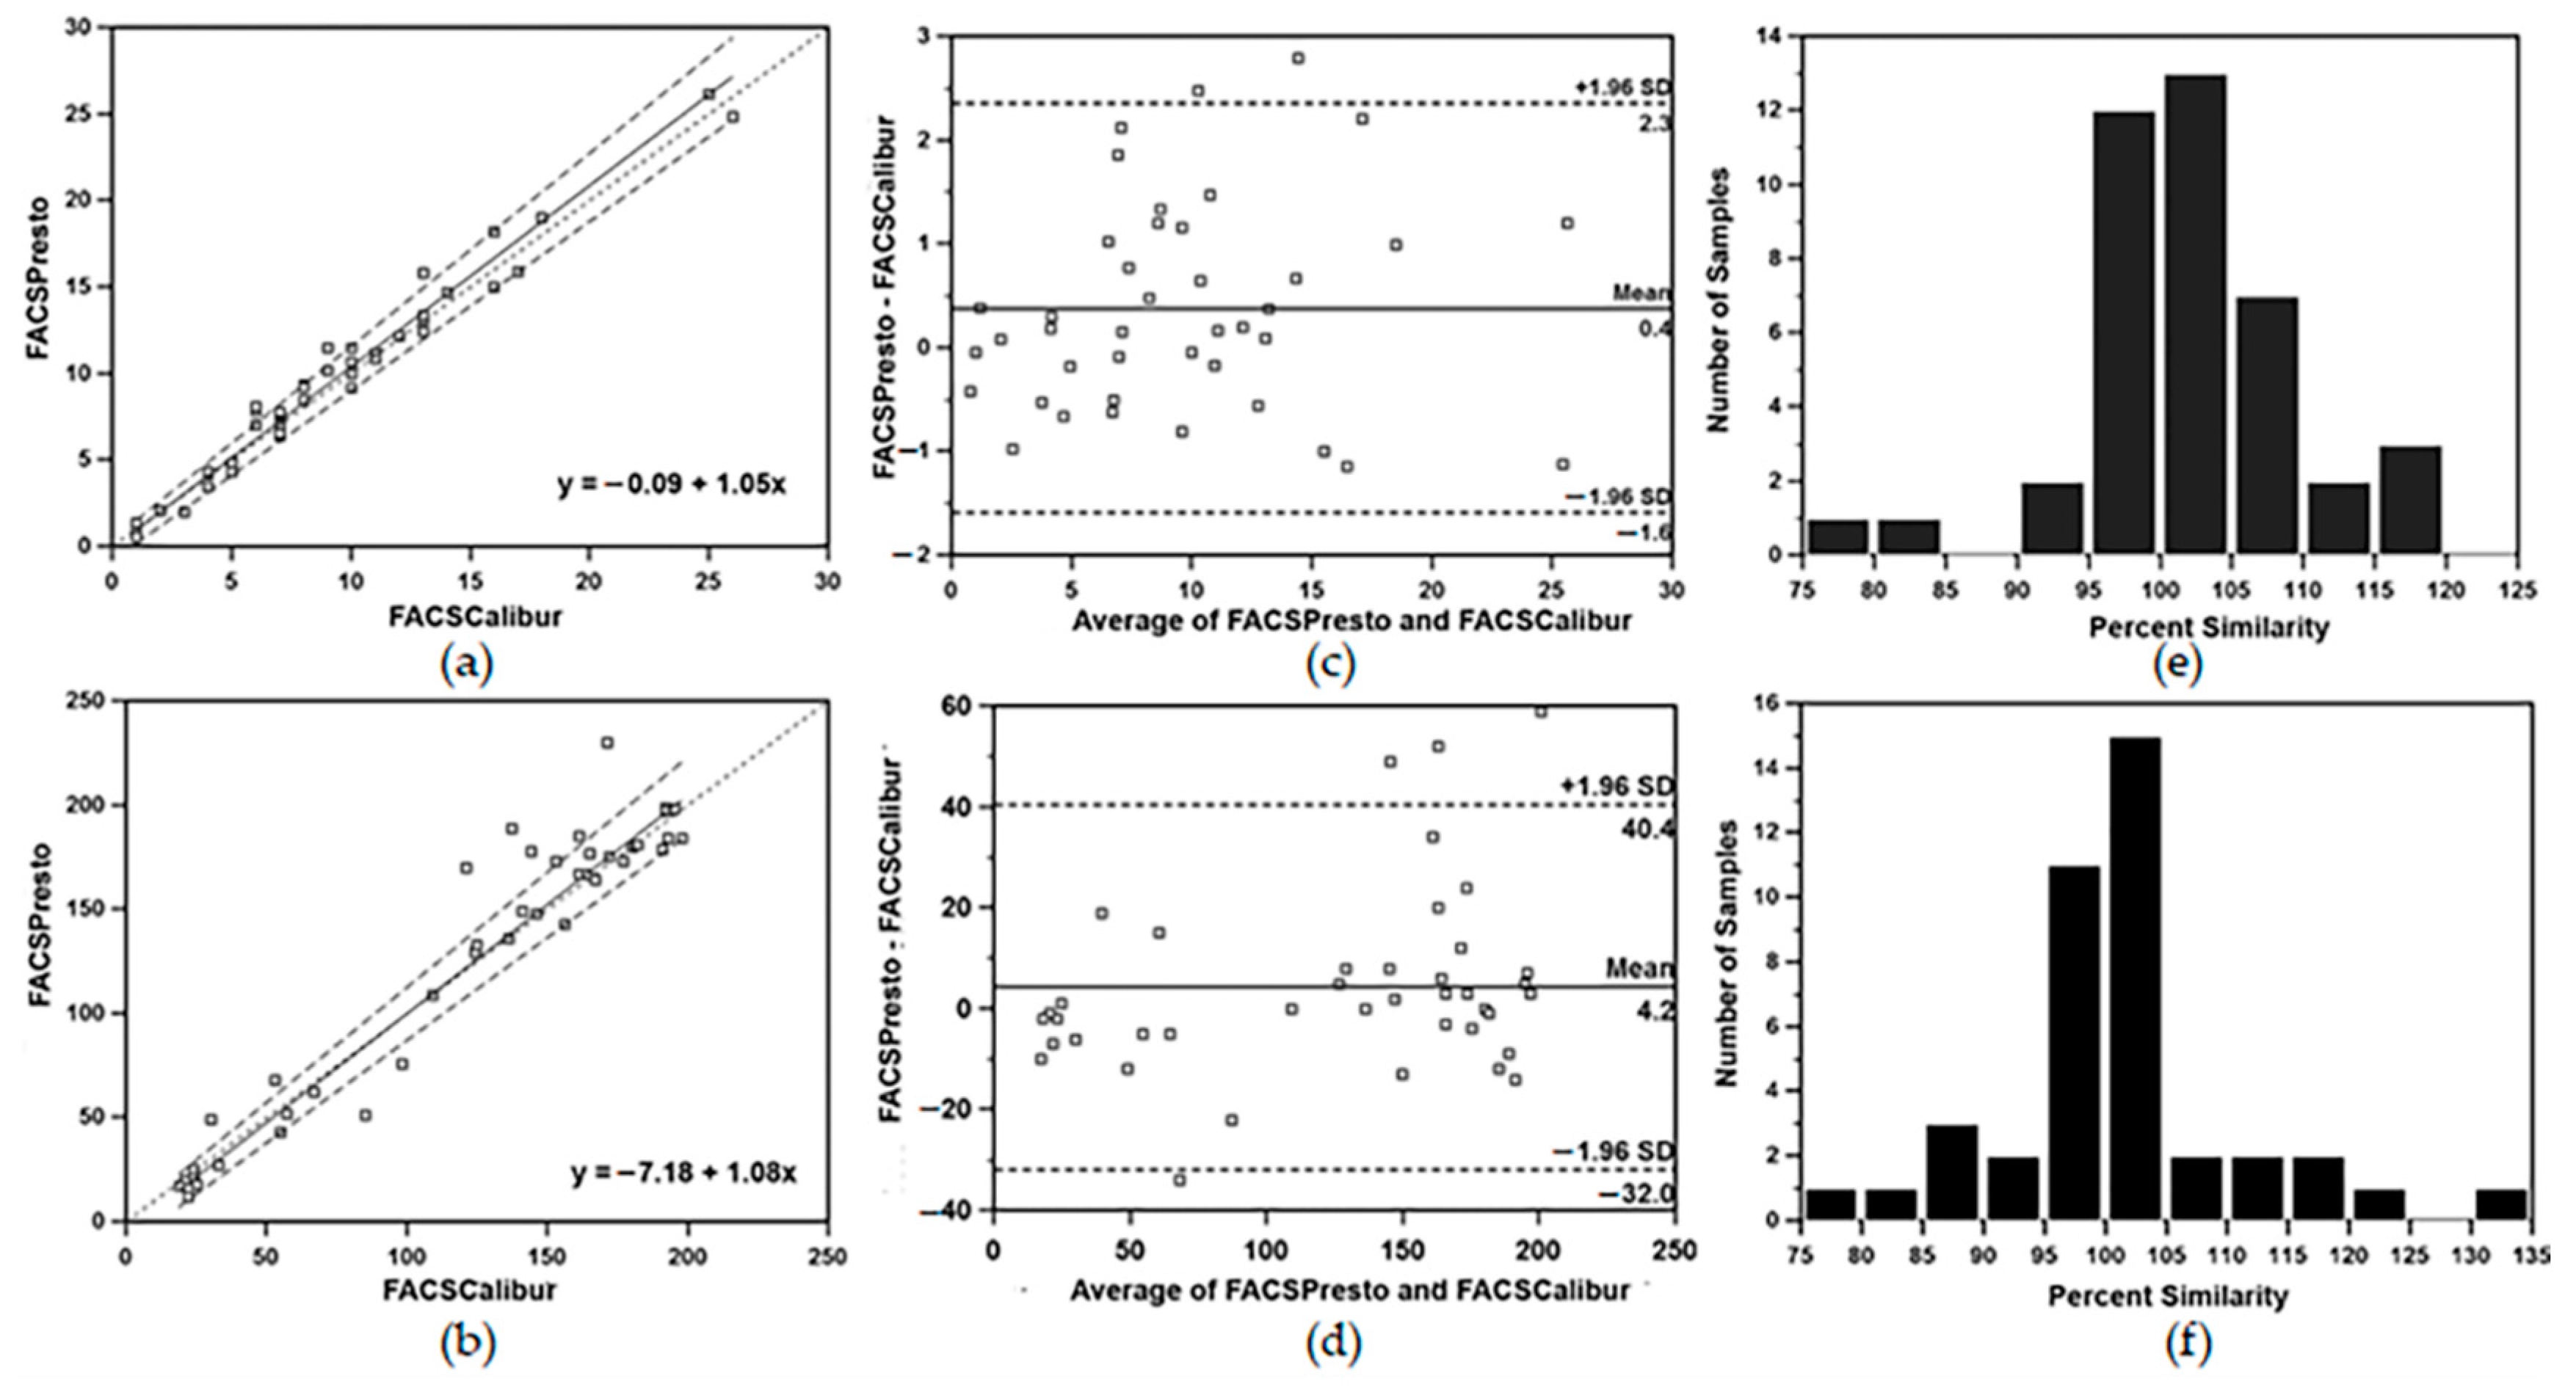
| FACSPresto Capillary vs. FACSCalibur | ||
| Parameter | CD4 (%) | Absolute CD4 (cells/μL) |
| Regression | y = −0.62 + 0.97x | y = −34.41 + 1.09x |
| 95% * CI for intercept | −2.11 to 0.57 | −73.26 to 4.82 |
| 95% CI for slope | 0.93 to 1.04 | 1.03 to 1.15 |
| Bland–Altman mean bias | −1.2% | +40.4 |
| ** LOA (mean difference ± 1.96SD) | −5.6 to 3.2% | −273.6 to +354.4 |
| Parameter | Sample Size | Flow Cytometer | Method | Bland–Altman Mean Bias Analysis (95% CI) | |
|---|---|---|---|---|---|
| % CD4 | Absolute CD4 (cells/µL) | ||||
| Present study | 180 | BD FACSCalibur | TriTEST/ TruCOUNT | +0.9 (−1.4 to 3.2) | +17.0 (−73.6 to 107.6) |
| South Africa [19] | 214 | BC Coulter XL | FlowCare PanLeuco-gate | +1.41 (−1.7 to 4.5) | +40.39 (−49.4 to 130.2) |
| Kenya/USA [17] | 189 | BD FACSCalibur | TriTEST/ TruCOUNT | +3.19 (−14.01 to 20.40) | −0.78 (−21.26 to 19.69) |
| Tanzania/Belgium [16] | 200 | BD FACSCalibur | TriTEST/ TruCOUNT | +0.6 (−11 to 13) | +2.5 (−15 to 20) |
| India/China/Kenya/USA/Thailand [15] | 720 | BD FACSCalibur | TriTEST/ TruCOUNT | +0.75 (−2.12 to 3.61) | +3.10 (−22.89 to 16.80) |
| Ghana [21] | 53 | BD FACSCount | new CD4 reagent | +6.9 (−11.9 to 25.7) | +44 (−72 to 160) |
Publisher’s Note: MDPI stays neutral with regard to jurisdictional claims in published maps and institutional affiliations. |
© 2022 by the authors. Licensee MDPI, Basel, Switzerland. This article is an open access article distributed under the terms and conditions of the Creative Commons Attribution (CC BY) license (https://creativecommons.org/licenses/by/4.0/).
Share and Cite
Sukapirom, K.; Matchua, S.; Thepthai, C.; Srimark, N.; Khowawisetsut, L.; Pattanapanyasat, K. Performance Evaluation of BD FACSPrestoTM Near-Patient CD4 Counter for Monitoring Antiretroviral Therapy in HIV-Infected Individuals in Primary Healthcare Clinics in Thailand. Diagnostics 2022, 12, 382. https://0-doi-org.brum.beds.ac.uk/10.3390/diagnostics12020382
Sukapirom K, Matchua S, Thepthai C, Srimark N, Khowawisetsut L, Pattanapanyasat K. Performance Evaluation of BD FACSPrestoTM Near-Patient CD4 Counter for Monitoring Antiretroviral Therapy in HIV-Infected Individuals in Primary Healthcare Clinics in Thailand. Diagnostics. 2022; 12(2):382. https://0-doi-org.brum.beds.ac.uk/10.3390/diagnostics12020382
Chicago/Turabian StyleSukapirom, Kasama, Somrat Matchua, Charin Thepthai, Narinee Srimark, Ladawan Khowawisetsut, and Kovit Pattanapanyasat. 2022. "Performance Evaluation of BD FACSPrestoTM Near-Patient CD4 Counter for Monitoring Antiretroviral Therapy in HIV-Infected Individuals in Primary Healthcare Clinics in Thailand" Diagnostics 12, no. 2: 382. https://0-doi-org.brum.beds.ac.uk/10.3390/diagnostics12020382