
Establishment of ICU Mortality Risk Prediction Models with Machine Learning Algorithm Using MIMIC-IV Database


Abstract
:1. Introduction
2. Methods
2.1. Data Source and Population
2.2. Selection of Variables
2.3. Data Analysis and Model Construction
3. Results
4. Discussion
5. Conclusions
Supplementary Materials
Author Contributions
Funding
Institutional Review Board Statement
Informed Consent Statement
Data Availability Statement
Acknowledgments
Conflicts of Interest
References
- Terwiesch, C.; Diwas, K.C.; Kahn, J.M. Working with capacity limitations: Operations management in critical care. Crit. Care 2011, 15, 308. [Google Scholar] [CrossRef] [Green Version]
- Lin, W.-T.; Chen, W.-L.; Chao, C.-M.; Lai, C.-C. The outcomes and prognostic factors of the patients with unplanned intensive care unit readmissions. Medicine 2018, 97, e11124. [Google Scholar] [CrossRef] [PubMed]
- Akkoç, I.; Yücetaş, E.; İşitemiz, İ.; Toptaş, M.; Tas, A.; Sen, O.; Ozgur, F.; Erguven, H. Mortality Rate In Intensive Care Units of Tertiary Health Institutions and Identifying Risk Factors: Analysis of 3945 Patients. Bezmialem Sci. 2017, 5, 116–120. [Google Scholar] [CrossRef] [Green Version]
- Mayr, V.D.; Dünser, M.W.; Greil, V.; Jochberger, S.; Luckner, G.; Ulmer, H.; Friesenecker, B.E.; Takala, J.; Hasibeder, W.R. Causes of death and determinants of outcome in critically ill patients. Crit. Care 2006, 10, R154. [Google Scholar] [CrossRef] [Green Version]
- Huber, W.; Rauch, J.; Saugel, B.; Mair, S.; Messer, M.; Lahmer, T.; Schultheiss, C.; Luppa, P.; Schmid, R.J.C.C. Prognostic value of neutrophil gelatinase-associated lipocalin and transpulmonary thermodilution-derived parameters within 48 hours after admission. Crit. Care 2013, 17, 1–200. [Google Scholar] [CrossRef] [Green Version]
- Sekulic, A.D.; Trpkovic, S.V.; Pavlovic, A.P.; Marinkovic, O.M.; Ilic, A.N. Scoring systems in assessing survival of critically ill ICU patients. Med. Sci. Monit. Int. Med. J. Exp. Clin. Res. 2015, 21, 2621. [Google Scholar] [CrossRef] [PubMed] [Green Version]
- Wu, S.-C.; Chou, S.-E.; Liu, H.-T.; Hsieh, T.-M.; Su, W.-T.; Chien, P.-C.; Hsieh, C.-H. Performance of Prognostic Scoring Systems in Trauma Patients in the Intensive Care Unit of a Trauma Center. Int. J. Environ. Res. Public Health 2020, 17, 7226. [Google Scholar] [CrossRef]
- Ferreira, F.L.; Bota, D.P.; Bross, A.; Mélot, C.; Vincent, J.L. Serial evaluation of the SOFA score to predict outcome in critically ill patients. JAMA 2001, 286, 1754–1758. [Google Scholar] [CrossRef] [PubMed] [Green Version]
- Basile-Filho, A.; Lago, A.F.; Menegueti, M.G.; Nicolini, E.A.; Rodrigues, L.A.d.B.; Nunes, R.S.; Auxiliadora-Martins, M.; Ferez, M.A. The use of APACHE II, SOFA, SAPS 3, C-reactive protein/albumin ratio, and lactate to predict mortality of surgical critically ill patients: A retrospective cohort study. Medicine 2019, 98, e16204. [Google Scholar] [CrossRef]
- Goldstein, B.A.; Navar, A.M.; Carter, R.E. Moving beyond regression techniques in cardiovascular risk prediction: Applying machine learning to address analytic challenges. Eur. Heart J. 2017, 38, 1805–1814. [Google Scholar] [CrossRef] [PubMed] [Green Version]
- Szlosek, D.A.; Ferrett, J. Using Machine Learning and Natural Language Processing Algorithms to Automate the Evaluation of Clinical Decision Support in Electronic Medical Record Systems. EGEMS 2016, 4, 1222. [Google Scholar] [CrossRef] [PubMed] [Green Version]
- Ge, W.; Huh, J.-W.; Park, Y.R.; Lee, J.-H.; Kim, Y.-H.; Turchin, A. An Interpretable ICU Mortality Prediction Model Based on Logistic Regression and Recurrent Neural Networks with LSTM units. AMIA Annu. Symp. Proc. 2018, 2018, 460–469. [Google Scholar] [PubMed]
- Raith, E.P.; Udy, A.A.; Bailey, M.; McGloughlin, S.; MacIsaac, C.; Bellomo, R.; Pilcher, D.V. Prognostic Accuracy of the SOFA Score, SIRS Criteria, and qSOFA Score for In-Hospital Mortality Among Adults With Suspected Infection Admitted to the Intensive Care Unit. JAMA 2017, 317, 290–300. [Google Scholar] [CrossRef]
- Kulin, M.; Fortuna, C.; De Poorter, E.; Deschrijver, D.; Moerman, I. Data-Driven Design of Intelligent Wireless Networks: An Overview and Tutorial. Sensors 2016, 16, 790. [Google Scholar] [CrossRef] [Green Version]
- Pirracchio, R.; Petersen, M.L.; Carone, M.; Rigon, M.R.; Chevret, S.; van der Laan, M.J. Mortality prediction in intensive care units with the Super ICU Learner Algorithm (SICULA): A population-based study. Lancet Respir. Med. 2015, 3, 42–52. [Google Scholar] [CrossRef] [Green Version]
- Li, F.; Xin, H.; Zhang, J.; Fu, M.; Zhou, J.; Lian, Z. Prediction model of in-hospital mortality in intensive care unit patients with heart failure: Machine learning-based, retrospective analysis of the MIMIC-III database. BMJ Open 2021, 11, e044779. [Google Scholar] [CrossRef] [PubMed]
- Luo, Y.; Wang, Z.; Wang, C. Improvement of APACHE II score system for disease severity based on XGBoost algorithm. BMC Med. Inform. Decis. Mak. 2021, 21, 237. [Google Scholar] [CrossRef] [PubMed]
- Pollack, M.M.; Patel, K.M.; Ruttimann, U.E. The Pediatric Risk of Mortality III--Acute Physiology Score (PRISM III-APS): A method of assessing physiologic instability for pediatric intensive care unit patients. J. Pediatr. 1997, 131, 575–581. [Google Scholar] [CrossRef] [Green Version]
- Tang, R.; Wang, H.; Peng, J.; Wang, D. A trauma-related survival predictive model of acute respiratory distress syndrome. J. Clin. Lab. Anal. 2021, 35, e24006. [Google Scholar] [CrossRef] [PubMed]
- Hu, T.; Lv, H.; Jiang, Y. The association between four scoring systems and 30-day mortality among intensive care patients with sepsis: A cohort study. Sci. Rep. 2021, 11, 11214. [Google Scholar] [CrossRef] [PubMed]
- Chen, T.; Guestrin, C. Xgboost: A scalable tree boosting system. In Proceedings of the 22nd Acm Sigkdd International Conference on Knowledge Discovery and Data Mining, San Francisco, CA, USA, 13–17 August 2016; pp. 785–794. [Google Scholar]
- Johnson, A.; Bulgarelli, P.L.; Pollard, T.; Horng, S.; Celi, L.A.; Mark, R. MIMIC-IV (version 1.0). 2021. PhysioNet 2021. [Google Scholar] [CrossRef]
- Aperstein, Y.; Cohen, L.; Bendavid, I.; Cohen, J.; Grozovsky, E.; Rotem, T.; Singer, P. Improved ICU mortality prediction based on SOFA scores and gastrointestinal parameters. PLoS ONE 2019, 14, e0222599. [Google Scholar] [CrossRef] [PubMed]
- Berry, M.J.A.; Linoff, G.S. Data Mining Techniques: For. Marketing, Sales, and Customer Relationship Management; John Wiley & Sons, Inc.: Hoboken, NJ, USA, 2004. [Google Scholar]
- Bader-El-Den, M. Self-adaptive heterogeneous random forest. In Proceedings of the 2014 IEEE/ACS 11th International Conference on Computer Systems and Applications (AICCSA), Doha, Qatar, 10–13 November 2014; pp. 640–646. [Google Scholar]
- Bader-El-Den, M.; Teitei, E.; Adda, M. Hierarchical classification for dealing with the Class imbalance problem. In Proceedings of the 2016 International Joint Conference on Neural Networks (IJCNN), Vancouver, BC, Canada, 24–29 July 2016; pp. 3584–3591. [Google Scholar]
- He, H.; Ma, Y. Imbalanced Learning: Foundations, Algorithms, and Applications; Wiley: Hoboken, NJ, USA, 2013. [Google Scholar]
- Zhang, Z.; Chen, L.; Xu, P.; Hong, Y.J.L. Predictive analytics with ensemble modeling in laparoscopic surgery: A technical note. Laparosc. Endosc. Robot. Surg. 2022, 5, 25–34. [Google Scholar] [CrossRef]
- Li, C.; Zhang, Z.; Ren, Y.; Nie, H.; Lei, Y.; Qiu, H.; Xu, Z.; Pu, X. Machine learning based early mortality prediction in the emergency department. Int. J. Med. Inform. 2021, 155, 104570. [Google Scholar] [CrossRef]
- Zhu, Y.; Zhang, J.; Wang, G.; Yao, R.; Ren, C.; Chen, G.; Jin, X.; Guo, J.; Liu, S.; Zheng, H.; et al. Machine Learning Prediction Models for Mechanically Ventilated Patients: Analyses of the MIMIC-III Database. Front. Med. 2021, 8, 662340. [Google Scholar] [CrossRef] [PubMed]
- Pattalung, T.N.; Ingviya, T.; Chaichulee, S. Feature Explanations in Recurrent Neural Networks for Predicting Risk of Mortality in Intensive Care Patients. J. Pers. Med. 2021, 11, 934. [Google Scholar] [CrossRef]
- Teres, D.; Lemeshow, S. The APACHE III prognostic system. Chest 1992, 102, 1919–1920. [Google Scholar] [CrossRef]
- Beck, D.H.; Taylor, B.L.; Millar, B.; Smith, G.B. Prediction of outcome from intensive care: A prospective cohort study comparing Acute Physiology and Chronic Health Evaluation II and III prognostic systems in a United Kingdom intensive care unit. Crit. Care Med. 1997, 25, 9–15. [Google Scholar] [CrossRef]
- Halpern, N.A.; Pastores, S.M. Critical care medicine in the United States 2000–2005: An analysis of bed numbers, occupancy rates, payer mix, and costs. Crit. Care Med. 2010, 38, 65–71. [Google Scholar] [CrossRef]
- Halpern, N.A.; Bettes, L.; Greenstein, R. Federal and nationwide intensive care units and healthcare costs: 1986–1992. Crit. Care Med. 1994, 22, 2001–2007. [Google Scholar]
- Rivera-Fernández, R.; Vázquez-Mata, G.; Bravo, M.; Aguayo-Hoyos, E.; Zimmerman, J.; Wagner, D.; Knaus, W. The Apache III prognostic system: Customized mortality predictions for Spanish ICU patients. Intensive Care Med. 1998, 24, 574–581. [Google Scholar] [CrossRef] [PubMed]
- Timsit, J.-F.; Fosse, J.-P.; Troché, G.; De Lassence, A.; Alberti, C.; Garrouste-Orgeas, M.; Bornstain, C.; Adrie, C.; Cheval, C.; Chevret, S. Calibration and discrimination by daily Logistic Organ Dysfunction scoring comparatively with daily Sequential Organ Failure Assessment scoring for predicting hospital mortality in critically ill patients. Crit. Care Med. 2002, 30, 2003–2013. [Google Scholar] [CrossRef] [PubMed]
- Jang, H.N.; Park, H.J.; Cho, H.S.; Bae, E.; Lee, T.W.; Chang, S.-H.; Park, D.J. The logistic organ dysfunction system score predicts the prognosis of patients with alcoholic ketoacidosis. Ren. Fail. 2018, 40, 693–699. [Google Scholar] [CrossRef] [PubMed] [Green Version]
- Le Gall, J.R.; Klar, J.; Lemeshow, S.; Saulnier, F.; Alberti, C.; Artigas, A.; Teres, D. The Logistic Organ Dysfunction system. A new way to assess organ dysfunction in the intensive care unit. ICU Scoring Group. JAMA 1996, 276, 802–810. [Google Scholar] [CrossRef] [PubMed]
- Metnitz, P.G.H.; Moreno, R.P.; Almeida, E.; Jordan, B.; Bauer, P.; Campos, R.A.; Iapichino, G.; Edbrooke, D.; Capuzzo, M.; Le Gall, J.-R. SAPS 3--From evaluation of the patient to evaluation of the intensive care unit. Part 1: Objectives, methods and cohort description. Intensive Care Med. 2005, 31, 1336–1344. [Google Scholar] [CrossRef] [Green Version]
- Ho, K.M.; Dobb, G.J.; Knuiman, M.; Finn, J.; Lee, K.Y.; Webb, S.A.R. A comparison of admission and worst 24-hour Acute Physiology and Chronic Health Evaluation II scores in predicting hospital mortality: A retrospective cohort study. Crit. Care 2006, 10, R4. [Google Scholar] [CrossRef] [Green Version]
- Markgraf, R.; Deutschinoff, G.; Pientka, L.; Scholten, T. Comparison of acute physiology and chronic health evaluations II and III and simplified acute physiology score II: A prospective cohort study evaluating these methods to predict outcome in a German interdisciplinary intensive care unit. Crit. Care Med. 2000, 28, 26–33. [Google Scholar] [CrossRef]
- Knaus, W.A.; Wagner, D.P.; Draper, E.A.; Zimmerman, J.E.; Bergner, M.; Bastos, P.G.; Sirio, C.A.; Murphy, D.J.; Lotring, T.; Damiano, A. The APACHE III prognostic system. Risk prediction of hospital mortality for critically ill hospitalized adults. Chest 1991, 100, 1619–1636. [Google Scholar] [CrossRef] [Green Version]
- Zimmerman, J.E.; Kramer, A.A.; McNair, D.S.; Malila, F.M. Acute Physiology and Chronic Health Evaluation (APACHE) IV: Hospital mortality assessment for today’s critically ill patients. Crit. Care Med. 2006, 34, 1297–1310. [Google Scholar] [CrossRef]
- Clermont, G.; Angus, D.C.; DiRusso, S.M.; Griffin, M.; Linde-Zwirble, W.T. Predicting hospital mortality for patients in the intensive care unit: A comparison of artificial neural networks with logistic regression models. Crit. Care Med. 2001, 29, 291–296. [Google Scholar] [CrossRef]
- Dybowski, R.; Weller, P.; Chang, R.; Gant, V. Prediction of outcome in critically ill patients using artificial neural network synthesised by genetic algorithm. Lancet 1996, 347, 1146–1150. [Google Scholar] [CrossRef]
- Ding, N.; Guo, C.; Li, C.; Zhou, Y.; Chai, X. An Artificial Neural Networks Model for Early Predicting In-Hospital Mortality in Acute Pancreatitis in MIMIC-III. Biomed. Res. Int. 2021, 2021, 6638919. [Google Scholar] [CrossRef] [PubMed]
- Zhai, Q.; Lin, Z.; Ge, H.; Liang, Y.; Li, N.; Ma, Q.; Ye, C. Using machine learning tools to predict outcomes for emergency department intensive care unit patients. Sci. Rep. 2020, 10, 20919. [Google Scholar] [CrossRef] [PubMed]
- Ribas, V.J.; López, J.C.; Ruiz-Sanmartin, A.; Ruiz-Rodríguez, J.C.; Rello, J.; Wojdel, A.; Vellido, A. Severe sepsis mortality prediction with relevance vector machines. Annu. Int. Conf. IEEE Eng. Med. Biol. Soc. 2011, 2011, 100–103. [Google Scholar] [CrossRef]
- Viton, F.; Elbattah, M.; Guérin, J.-L.; Dequen, G. Heatmaps for visual explainability of cnn-based predictions for multivariate time series with application to healthcare. In Proceedings of the 2020 IEEE International Conference on Healthcare Informatics (ICHI), Oldenburg, Germany, 30 November–3 December 2020; pp. 1–8. [Google Scholar]
- George, N.; Moseley, E.; Eber, R.; Siu, J.; Samuel, M.; Yam, J.; Huang, K.; Celi, L.A.; Lindvall, C. Deep learning to predict long-term mortality in patients requiring 7 days of mechanical ventilation. PLoS ONE 2021, 16, e0253443. [Google Scholar] [CrossRef]
- Allen, A.; Mataraso, S.; Siefkas, A.; Burdick, H.; Braden, G.; Dellinger, R.P.; McCoy, A.; Pellegrini, E.; Hoffman, J.; Green-Saxena, A.; et al. A Racially Unbiased, Machine Learning Approach to Prediction of Mortality: Algorithm Development Study. JMIR Public Health Surveill. 2020, 6, e22400. [Google Scholar] [CrossRef]
- Knox, D.B.; Lanspa, M.J.; Pratt, C.M.; Kuttler, K.G.; Jones, J.P.; Brown, S.M. Glasgow Coma Scale score dominates the association between admission Sequential Organ Failure Assessment score and 30-day mortality in a mixed intensive care unit population. J. Crit. Care 2014, 29, 780–785. [Google Scholar] [CrossRef] [Green Version]
- Cho, D.Y.; Wang, Y.C. Comparison of the APACHE III, APACHE II and Glasgow Coma Scale in acute head injury for prediction of mortality and functional outcome. Intensive Care Med. 1997, 23, 77–84. [Google Scholar] [CrossRef]
- Fuchs, P.A.; Czech, I.J.; Krzych, Ł.J. Mortality Prediction Using SOFA Score in Critically Ill Surgical and Non-Surgical Patients: Which Parameter Is the Most Valuable? Medicina 2020, 56, 273. [Google Scholar] [CrossRef]
- Akel, M.A.; Carey, K.A.; Winslow, C.J.; Churpek, M.M.; Edelson, D.P. Less is more: Detecting clinical deterioration in the hospital with machine learning using only age, heart rate, and respiratory rate. Resuscitation 2021, 168, 6–10. [Google Scholar] [CrossRef]
- Schork, A.; Moll, K.; Haap, M.; Riessen, R.; Wagner, R. Course of lactate, pH and base excess for prediction of mortality in medical intensive care patients. PLoS ONE 2021, 16, e0261564. [Google Scholar] [CrossRef] [PubMed]
- Branco, P.; Torgo, L.; Ribeiro, R.P. A Survey of Predictive Modeling on Imbalanced Domains. ACM Comput. Surv. (CSUR) 2016, 49, 31. [Google Scholar] [CrossRef]


| Variable (Score) | Dataset before Downsampling | Dataset after Downsampling | ||||
|---|---|---|---|---|---|---|
| Survived (60,693) | Dead (7055) | p | Survived (7055) | Dead (7055) | p | |
| Female 1 | 26,774 (44.1) | 3235 (45.9) | 0.006 | 3193 (45.3) | 3235 (45.9) | 0.488 |
| Age 3 | 64.37 ± 17.10 | 71.44 ± 15.23 | <0.001 | 64.25 ± 17.32 | 71.44 ± 15.23 | <0.001 |
| Weight 3 | 81.48 ± 26.00 | 77.34 ± 23.89 | <0.001 | 81.08 ± 26.33 | 77.34 ± 23.89 | <0.001 |
| Emergency 1 | 43,724 (72.0) | 6016 (85.3) | <0.001 | 5102 (72.3) | 6016 (85.3) | <0.001 |
| LODS 2 | 3.00 [2.00, 5.00] | 8.00 [5.00, 11.00] | <0.001 | 3.00 [2.00, 6.00] | 8.00 [5.00, 11.00] | <0.001 |
| Neurologic 2 | 0.00 [0.00, 1.00] | 1.00 [0.00, 3.00] | <0.001 | 0.00 [0.00, 1.00] | 1.00 [0.00, 3.00] | <0.001 |
| Cardiovascular 2 | 0.00 [0.00, 1.00] | 1.00 [0.00, 1.00] | <0.001 | 0.00 [0.00, 1.00] | 1.00 [0.00, 1.00] | <0.001 |
| Renal 2 | 1.00 [1.00, 3.00] | 3.00 [1.00, 5.00] | <0.001 | 1.00 [1.00, 3.00] | 3.00 [1.00, 5.00] | <0.001 |
| Pulmonary 2 | 0.00 [0.00, 1.00] | 1.00 [0.00, 3.00] | <0.001 | 0.00 [0.00, 1.00] | 1.00 [0.00, 3.00] | <0.001 |
| Hematologic 2 | 0.00 [0.00, 0.00] | 0.00 [0.00, 0.00] | <0.001 | 0.00 [0.00, 0.00] | 0.00 [0.00, 0.00] | <0.001 |
| Hepatic 2 | 0.00 [0.00, 1.00] | 1.00 [0.00, 1.00] | <0.001 | 0.00 [0.00, 1.00] | 1.00 [0.00, 1.00] | <0.001 |
| APS III 2 | 39.00 [29.00, 52.00] | 73.00 [53.00, 95.00] | <0.001 | 39.00 [29.00, 52.00] | 73.00 [53.00, 95.00] | <0.001 |
| Heart rate 2 | 1.00 [0.00, 5.00] | 5.00 [0.00, 7.00] | <0.001 | 1.00 [0.00, 5.00] | 5.00 [0.00, 7.00] | <0.001 |
| Mean pressure 2 | 9.00 [7.00, 15.00] | 15.00 [7.00, 15.00] | <0.001 | 9.00 [7.00, 15.00] | 15.00 [7.00, 15.00] | <0.001 |
| Temperature 2 | 0.00 [0.00, 0.00] | 0.00 [0.00, 2.00] | <0.001 | 0.00 [0.00, 0.00] | 0.00 [0.00, 2.00] | <0.001 |
| Respiratory rate 2 | 6.00 [6.00, 8.00] | 6.00 [6.00, 8.00] | <0.001 | 6.00 [6.00, 8.00] | 6.00 [6.00, 8.00] | 0.001 |
| PaO2-aadO2 2 | 0.00 [0.00, 0.00] | 0.00 [0.00, 0.00] | <0.001 | 0.00 [0.00, 0.00] | 0.00 [0.00, 0.00] | <0.001 |
| Hematocrit 2 | 3.00 [3.00, 3.00] | 3.00 [3.00, 3.00] | 0.670 | 3.00 [3.00, 3.00] | 3.00 [3.00, 3.00] | 0.735 |
| White blood count 2 | 0.00 [0.00, 0.00] | 0.00 [0.00, 1.00] | <0.001 | 0.00 [0.00, 0.00] | 0.00 [0.00, 1.00] | <0.001 |
| Creatinine 2 | 0.00 [0.00, 3.00] | 4.00 [0.00, 7.00] | <0.001 | 0.00 [0.00, 4.00] | 4.00 [0.00, 7.00] | <0.001 |
| Urine output 2 | 4.00 [0.00, 5.00] | 5.00 [4.00, 8.00] | <0.001 | 4.00 [0.00, 5.00] | 5.00 [4.00, 8.00] | <0.001 |
| Blood urea nitrogen 2 | 2.00 [0.00, 7.00] | 7.00 [7.00, 11.00] | <0.001 | 2.00 [0.00, 7.00] | 7.00 [7.00, 11.00] | <0.001 |
| Blood sodium 2 | 0.00 [0.00, 0.00] | 0.00 [0.00, 2.00] | <0.001 | 0.00 [0.00, 0.00] | 0.00 [0.00, 2.00] | <0.001 |
| Albumin 2 | 0.00 [0.00, 0.00] | 0.00 [0.00, 0.00] | <0.001 | 0.00 [0.00, 0.00] | 0.00 [0.00, 0.00] | <0.001 |
| Bilirubin 2 | 0.00 [0.00, 0.00] | 0.00 [0.00, 0.00] | <0.001 | 0.00 [0.00, 0.00] | 0.00 [0.00, 0.00] | <0.001 |
| Glucose 2 | 0.00 [0.00, 3.00] | 0.00 [0.00, 3.00] | <0.001 | 0.00 [0.00, 3.00] | 0.00 [0.00, 3.00] | <0.001 |
| Acid base 2 | 0.00 [0.00, 2.00] | 3.00 [0.00, 9.00] | <0.001 | 0.00 [0.00, 2.00] | 3.00 [0.00, 9.00] | <0.001 |
| Glasgow Coma Scale 2 | 0.00 [0.00, 3.00] | 3.00 [0.00, 29.00] | <0.001 | 0.00 [0.00, 3.00] | 3.00 [0.00, 29.00] | <0.001 |
| Hypertension 1 | 38,236 (63.0) | 4608 (65.3) | <0.001 | 4399 (62.4) | 4608 (65.3) | <0.001 |
| Ischemic heart disease 1 | 20,317 (33.5) | 2568 (36.4) | <0.001 | 2307 (32.7) | 2568 (36.4) | <0.001 |
| Diabetes 1 | 18,001 (29.7) | 2135 (30.3) | 0.301 | 2053 (29.1) | 2135 (30.3) | 0.136 |
| Chronic pulmonary disease 1 | 15,248 (25.1) | 1916 (27.2) | <0.001 | 1721 (24.4) | 1916 (27.2) | <0.001 |
| Cerebrovascular disease 1 | 8919 (14.7) | 1630 (23.1) | <0.001 | 1072 (15.2) | 1630 (23.1) | <0.001 |
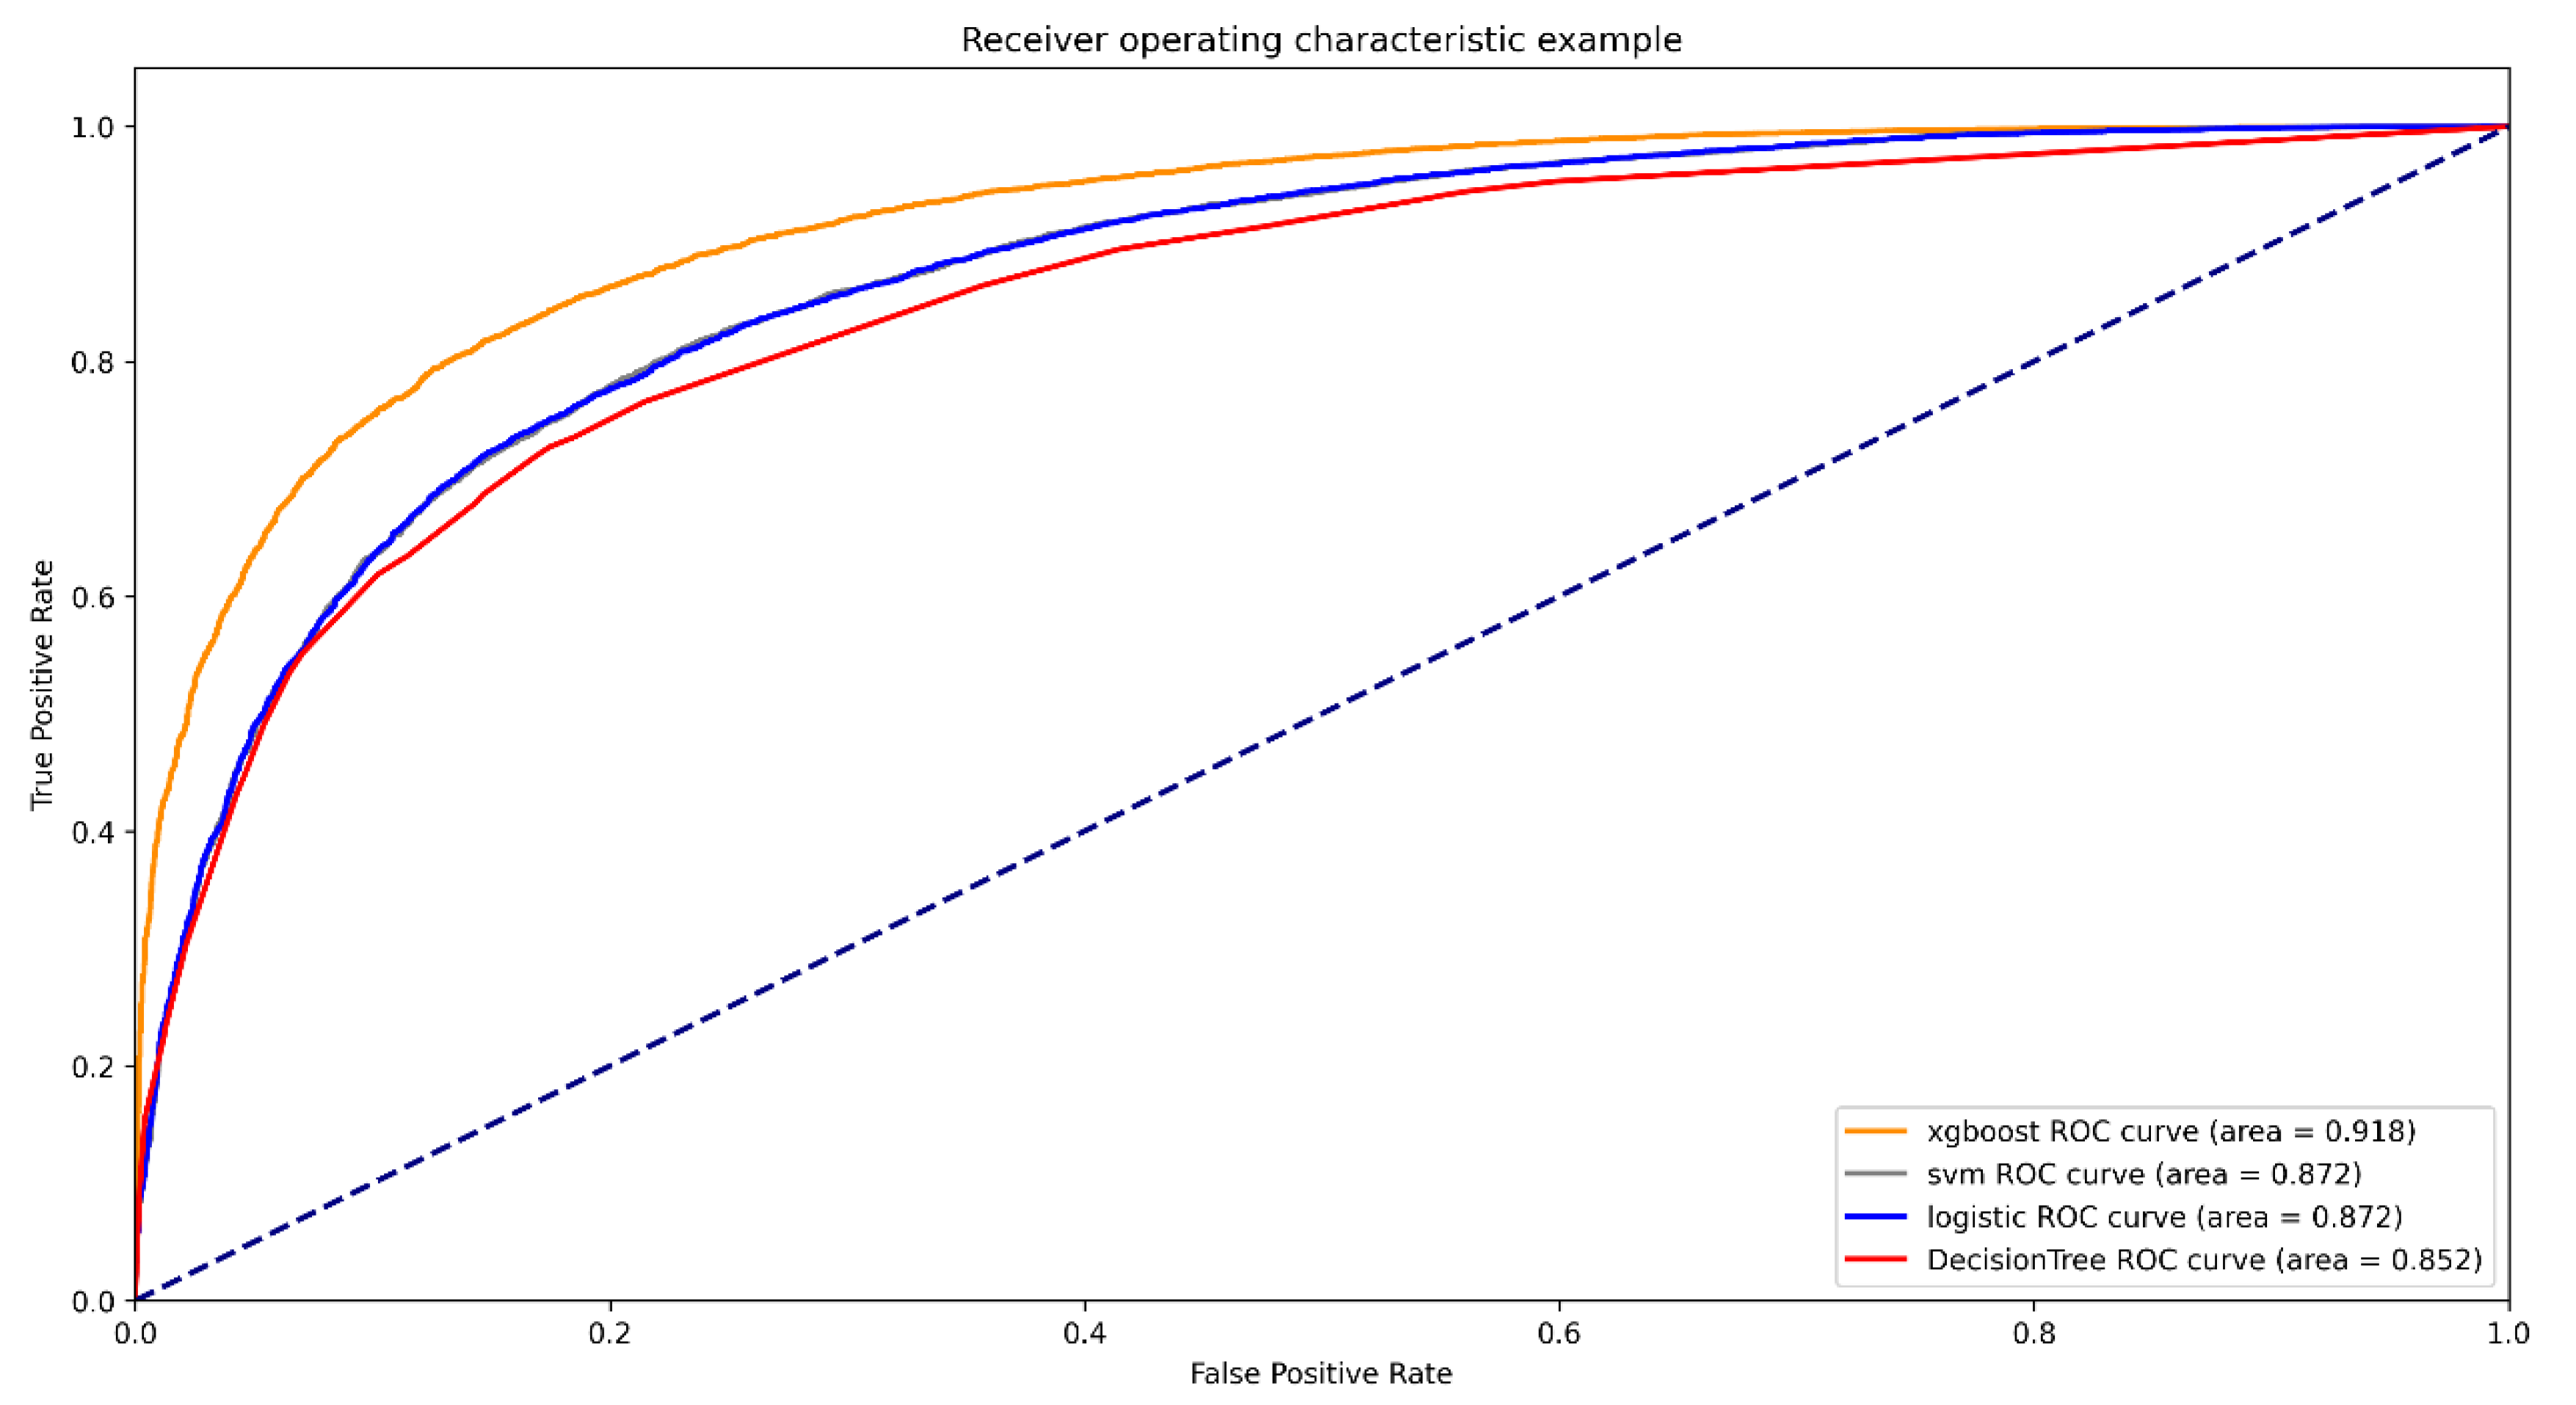
| Models | ROC (95%CI) | Accuracy | SEN | SPE | PPV | NPV |
|---|---|---|---|---|---|---|
| XGBOOST | 0.918 (0.915–0.922) | 0.834 | 0.822 | 0.846 | 0.842 | 0.826 |
| SVM | 0.872 (0.867–0.877) | 0.789 | 0.773 | 0.805 | 0.799 | 0.780 |
| Logistic regression | 0.872 (0.867–0.877) | 0.787 | 0.756 | 0.818 | 0.806 | 0.771 |
| Decision Tree | 0.852 (0.847–0.857) | 0.776 | 0.727 | 0.825 | 0.806 | 0.752 |
Publisher’s Note: MDPI stays neutral with regard to jurisdictional claims in published maps and institutional affiliations. |
© 2022 by the authors. Licensee MDPI, Basel, Switzerland. This article is an open access article distributed under the terms and conditions of the Creative Commons Attribution (CC BY) license (https://creativecommons.org/licenses/by/4.0/).
Share and Cite
Pang, K.; Li, L.; Ouyang, W.; Liu, X.; Tang, Y. Establishment of ICU Mortality Risk Prediction Models with Machine Learning Algorithm Using MIMIC-IV Database. Diagnostics 2022, 12, 1068. https://0-doi-org.brum.beds.ac.uk/10.3390/diagnostics12051068
Pang K, Li L, Ouyang W, Liu X, Tang Y. Establishment of ICU Mortality Risk Prediction Models with Machine Learning Algorithm Using MIMIC-IV Database. Diagnostics. 2022; 12(5):1068. https://0-doi-org.brum.beds.ac.uk/10.3390/diagnostics12051068
Chicago/Turabian StylePang, Ke, Liang Li, Wen Ouyang, Xing Liu, and Yongzhong Tang. 2022. "Establishment of ICU Mortality Risk Prediction Models with Machine Learning Algorithm Using MIMIC-IV Database" Diagnostics 12, no. 5: 1068. https://0-doi-org.brum.beds.ac.uk/10.3390/diagnostics12051068