
Comparison of Four Systems for SARS-CoV-2 Antibody at Three Time Points after SARS-CoV-2 Vaccination

 , ,
, ,
Abstract
:1. Introduction
2. Materials and Method
2.1. Samples
2.2. Assays
2.3. Data Analysis
3. Results
4. Discussion
Supplementary Materials
Author Contributions
Funding
Institutional Review Board Statement
Informed Consent Statement
Data Availability Statement
Acknowledgments
Conflicts of Interest
References
- WHO. COVID-19 Weekly Epidemiological Update. Available online: https://www.who.int/publications/m/item/weekly-epidemiological-update-on-covid-19---6-january-2022 (accessed on 10 January 2022).
- WHO. Status of COVID-19 Vaccines within WHO EUL/PQ Evaluation Process. Available online: https://extranet.who.int/pqweb/news/status-covid-19-vaccines-within-who-eulpq-evaluation-process-updated-1 (accessed on 10 January 2022).
- Anderson, E.J.; Rouphael, N.G.; Widge, A.T.; Jackson, L.A.; Roberts, P.C.; Makhene, M.; Chappell, J.D.; Denison, M.R.; Stevens, L.J.; Pruijssers, A.J.; et al. Safety and Immunogenicity of SARS-CoV-2 mRNA-1273 Vaccine in Older Adults. N. Engl. J. Med. 2020, 383, 2427–2438. [Google Scholar] [CrossRef] [PubMed]
- Walsh, E.E.; Frenck, R.W., Jr.; Falsey, A.R.; Kitchin, N.; Absalon, J.; Gurtman, A.; Lockhart, S.; Neuzil, K.; Mulligan, M.J.; Bailey, R.; et al. Safety and Immunogenicity of Two RNA-Based Covid-19 Vaccine Candidates. N. Engl. J. Med. 2020, 383, 2439–2450. [Google Scholar] [CrossRef] [PubMed]
- Polack, F.P.; Thomas, S.J.; Kitchin, N.; Absalon, J.; Gurtman, A.; Lockhart, S.; Perez, J.L.; Perez Marc, G.; Moreira, E.D.; Zerbini, C.; et al. Safety and Efficacy of the BNT162b2 mRNA Covid-19 Vaccine. N. Engl. J. Med. 2020, 383, 2603–2615. [Google Scholar] [CrossRef] [PubMed]
- Regev-Yochay, G.; Amit, S.; Bergwerk, M.; Lipsitch, M.; Leshem, E.; Kahn, R.; Lustig, Y.; Cohen, C.; Doolman, R.; Ziv, A.; et al. Decreased infectivity following BNT162b2 vaccination: A prospective cohort study in Israel. Lancet Reg. Health Eur. 2021, 7, 100150. [Google Scholar] [CrossRef]
- Voysey, M.; Clemens, S.A.C.; Madhi, S.A.; Weckx, L.Y.; Folegatti, P.M.; Aley, P.K.; Angus, B.; Baillie, V.L.; Barnabas, S.L.; Bhorat, Q.E.; et al. Safety and efficacy of the ChAdOx1 nCoV-19 vaccine (AZD1222) against SARS-CoV-2: An interim analysis of four randomised controlled trials in Brazil, South Africa, and the UK. Lancet 2021, 397, 99–111. [Google Scholar] [CrossRef]
- Haas, E.J.; Angulo, F.J.; McLaughlin, J.M.; Anis, E.; Singer, S.R.; Khan, F.; Brooks, N.; Smaja, M.; Mircus, G.; Pan, K.; et al. Impact and effectiveness of mRNA BNT162b2 vaccine against SARS-CoV-2 infections and COVID-19 cases, hospitalisations, and deaths following a nationwide vaccination campaign in Israel: An observational study using national surveillance data. Lancet 2021, 397, 1819–1829. [Google Scholar] [CrossRef]
- Bergwerk, M.; Gonen, T.; Lustig, Y.; Amit, S.; Lipsitch, M.; Cohen, C.; Mandelboim, M.; Levin, E.G.; Rubin, C.; Indenbaum, V.; et al. Covid-19 Breakthrough Infections in Vaccinated Health Care Workers. N. Engl. J. Med. 2021, 385, 1474–1484. [Google Scholar] [CrossRef]
- Shrotri, M.; Navaratnam, A.M.D.; Nguyen, V.; Byrne, T.; Geismar, C.; Fragaszy, E.; Beale, S.; Fong, W.L.E.; Patel, P.; Kovar, J.; et al. Spike-antibody waning after second dose of BNT162b2 or ChAdOx1. Lancet 2021, 398, 385–387. [Google Scholar] [CrossRef]
- Dan, J.M.; Mateus, J.; Kato, Y.; Hastie, K.M.; Yu, E.D.; Faliti, C.E.; Grifoni, A.; Ramirez, S.I.; Haupt, S.; Frazier, A.; et al. Immunological memory to SARS-CoV-2 assessed for up to 8 months after infection. Science 2021, 371, eabf4063. [Google Scholar] [CrossRef]
- Vanshylla, K.; Di Cristanziano, V.; Kleipass, F.; Dewald, F.; Schommers, P.; Gieselmann, L.; Gruell, H.; Schlotz, M.; Ercanoglu, M.S.; Stumpf, R.; et al. Kinetics and correlates of the neutralizing antibody response to SARS-CoV-2 infection in humans. Cell Host Microbe 2021, 29, 917–929.e914. [Google Scholar] [CrossRef]
- Khoury, D.S.; Cromer, D.; Reynaldi, A.; Schlub, T.E.; Wheatley, A.K.; Juno, J.A.; Subbarao, K.; Kent, S.J.; Triccas, J.A.; Davenport, M.P. Neutralizing antibody levels are highly predictive of immune protection from symptomatic SARS-CoV-2 infection. Nat. Med. 2021, 27, 1205–1211. [Google Scholar] [CrossRef] [PubMed]
- Indenbaum, V.; Koren, R.; Katz-Likvornik, S.; Yitzchaki, M.; Halpern, O.; Regev-Yochay, G.; Cohen, C.; Biber, A.; Feferman, T.; Cohen Saban, N.; et al. Testing IgG antibodies against the RBD of SARS-CoV-2 is sufficient and necessary for COVID-19 diagnosis. PLoS ONE 2020, 15, e0241164. [Google Scholar] [CrossRef] [PubMed]
- Legros, V.; Denolly, S.; Vogrig, M.; Boson, B.; Siret, E.; Rigaill, J.; Pillet, S.; Grattard, F.; Gonzalo, S.; Verhoeven, P.; et al. A longitudinal study of SARS-CoV-2-infected patients reveals a high correlation between neutralizing antibodies and COVID-19 severity. Cell Mol. Immunol. 2021, 18, 318–327. [Google Scholar] [CrossRef] [PubMed]
- Bewley, K.R.; Coombes, N.S.; Gagnon, L.; McInroy, L.; Baker, N.; Shaik, I.; St-Jean, J.R.; St-Amant, N.; Buttigieg, K.R.; Humphries, H.E.; et al. Quantification of SARS-CoV-2 neutralizing antibody by wild-type plaque reduction neutralization, microneutralization and pseudotyped virus neutralization assays. Nat. Protoc. 2021, 16, 3114–3140. [Google Scholar] [CrossRef] [PubMed]
- Tan, C.W.; Chia, W.N.; Qin, X.; Liu, P.; Chen, M.I.; Tiu, C.; Hu, Z.; Chen, V.C.; Young, B.E.; Sia, W.R.; et al. A SARS-CoV-2 surrogate virus neutralization test based on antibody-mediated blockage of ACE2-spike protein-protein interaction. Nat. Biotechnol. 2020, 38, 1073–1078. [Google Scholar] [CrossRef] [PubMed]
- Valcourt, E.J.; Manguiat, K.; Robinson, A.; Chen, J.C.; Dimitrova, K.; Philipson, C.; Lamoureux, L.; McLachlan, E.; Schiffman, Z.; Drebot, M.A.; et al. Evaluation of a commercially-available surrogate virus neutralization test for severe acute respiratory syndrome coronavirus-2 (SARS-CoV-2). Diagn. Microbiol. Infect. Dis. 2021, 99, 115294. [Google Scholar] [CrossRef]
- Kim, Y.; Lee, J.H.; Ko, G.Y.; Ryu, J.H.; Jang, J.H.; Bae, H.; Yoo, S.H.; Choi, A.R.; Jung, J.; Lee, J.; et al. Quantitative SARS-CoV-2 Spike Antibody Response in COVID-19 Patients Using Three Fully Automated Immunoassays and a Surrogate Virus Neutralization Test. Diagnostics 2021, 11, 1496. [Google Scholar] [CrossRef]
- Meyer, B.; Torriani, G.; Yerly, S.; Mazza, L.; Calame, A.; Arm-Vernez, I.; Zimmer, G.; Agoritsas, T.; Stirnemann, J.; Spechbach, H.; et al. Validation of a commercially available SARS-CoV-2 serological immunoassay. Clin. Microbiol. Infect. 2020, 26, 1386–1394. [Google Scholar] [CrossRef]
- Espejo, A.P.; Akgun, Y.; Al Mana, A.F.; Tjendra, Y.; Millan, N.C.; Gomez-Fernandez, C.; Cray, C. Review of Current Advances in Serologic Testing for COVID-19. Am. J. Clin. Pathol. 2020, 154, 293–304. [Google Scholar] [CrossRef]
- Gudbjartsson, D.F.; Norddahl, G.L.; Melsted, P.; Gunnarsdottir, K.; Holm, H.; Eythorsson, E.; Arnthorsson, A.O.; Helgason, D.; Bjarnadottir, K.; Ingvarsson, R.F.; et al. Humoral Immune Response to SARS-CoV-2 in Iceland. N. Engl. J. Med. 2020, 383, 1724–1734. [Google Scholar] [CrossRef]
- Mendrone-Junior, A.; Dinardo, C.L.; Ferreira, S.C.; Nishya, A.; Salles, N.A.; de Almeida Neto, C.; Hamasaki, D.T.; Facincani, T.; de Oliveira Alves, L.B.; Machado, R.R.G.; et al. Correlation between SARS-COV-2 antibody screening by immunoassay and neutralizing antibody testing. Transfusion 2021, 61, 1181–1190. [Google Scholar] [CrossRef] [PubMed]
- Nam, M.; Seo, J.D.; Moon, H.W.; Kim, H.; Hur, M.; Yun, Y.M. Evaluation of Humoral Immune Response after SARS-CoV-2 Vaccination Using Two Binding Antibody Assays and a Neutralizing Antibody Assay. Microbiol. Spectr. 2021, 9, e0120221. [Google Scholar] [CrossRef] [PubMed]
- Chodick, G.; Tene, L.; Rotem, R.S.; Patalon, T.; Gazit, S.; Ben-Tov, A.; Weil, C.; Goldshtein, I.; Twig, G.; Cohen, D.; et al. The effectiveness of the TWO-DOSE BNT162b2 vaccine: Analysis of real-world data. Clin. Infect. Dis. 2021, 74, 472–478. [Google Scholar] [CrossRef] [PubMed]
- De Carlo, A.; Lo Caputo, S.; Paolillo, C.; Rosa, A.M.; D’Orsi, U.; De Palma, M.; Reveglia, P.; Lacedonia, D.; Cinnella, G.; Foschino, M.P.; et al. SARS-COV-2 Serological Profile in Healthcare Professionals of a Southern Italy Hospital. Int. J. Environ. Res. Public Health 2020, 17, 9324. [Google Scholar] [CrossRef]
- Saffar, H.; Mousavi, S.J.; Saffar, H.; Parsaei, M.R.; Ghorbani, G.R.; Saffar, M.J. Seroconversion rates following 2 doses of measles- mumps- rubella vaccination given at the ages 12 and 18 months: Data for possible additional dose at older age. BMC Immunol. 2022, 23, 2. [Google Scholar] [CrossRef]
- The National SARS-CoV-2 Serology Assay Evaluation Group. Performance characteristics of five immunoassays for SARS-CoV-2: A head-to-head benchmark comparison. Lancet Infect. Dis. 2020, 20, 1390–1400. [Google Scholar] [CrossRef]
- Alter, G.; Seder, R. The Power of Antibody-Based Surveillance. N. Engl. J. Med. 2020, 383, 1782–1784. [Google Scholar] [CrossRef]
- von Rhein, C.; Scholz, T.; Henss, L.; Kronstein-Wiedemann, R.; Schwarz, T.; Rodionov, R.N.; Corman, V.M.; Tonn, T.; Schnierle, B.S. Comparison of potency assays to assess SARS-CoV-2 neutralizing antibody capacity in COVID-19 convalescent plasma. J. Virol. Methods 2021, 288, 114031. [Google Scholar] [CrossRef]
- Feinstein, A.R.; Cicchetti, D.V. High agreement but low kappa: I. The problems of two paradoxes. J. Clin. Epidemiol. 1990, 43, 543–549. [Google Scholar] [CrossRef]


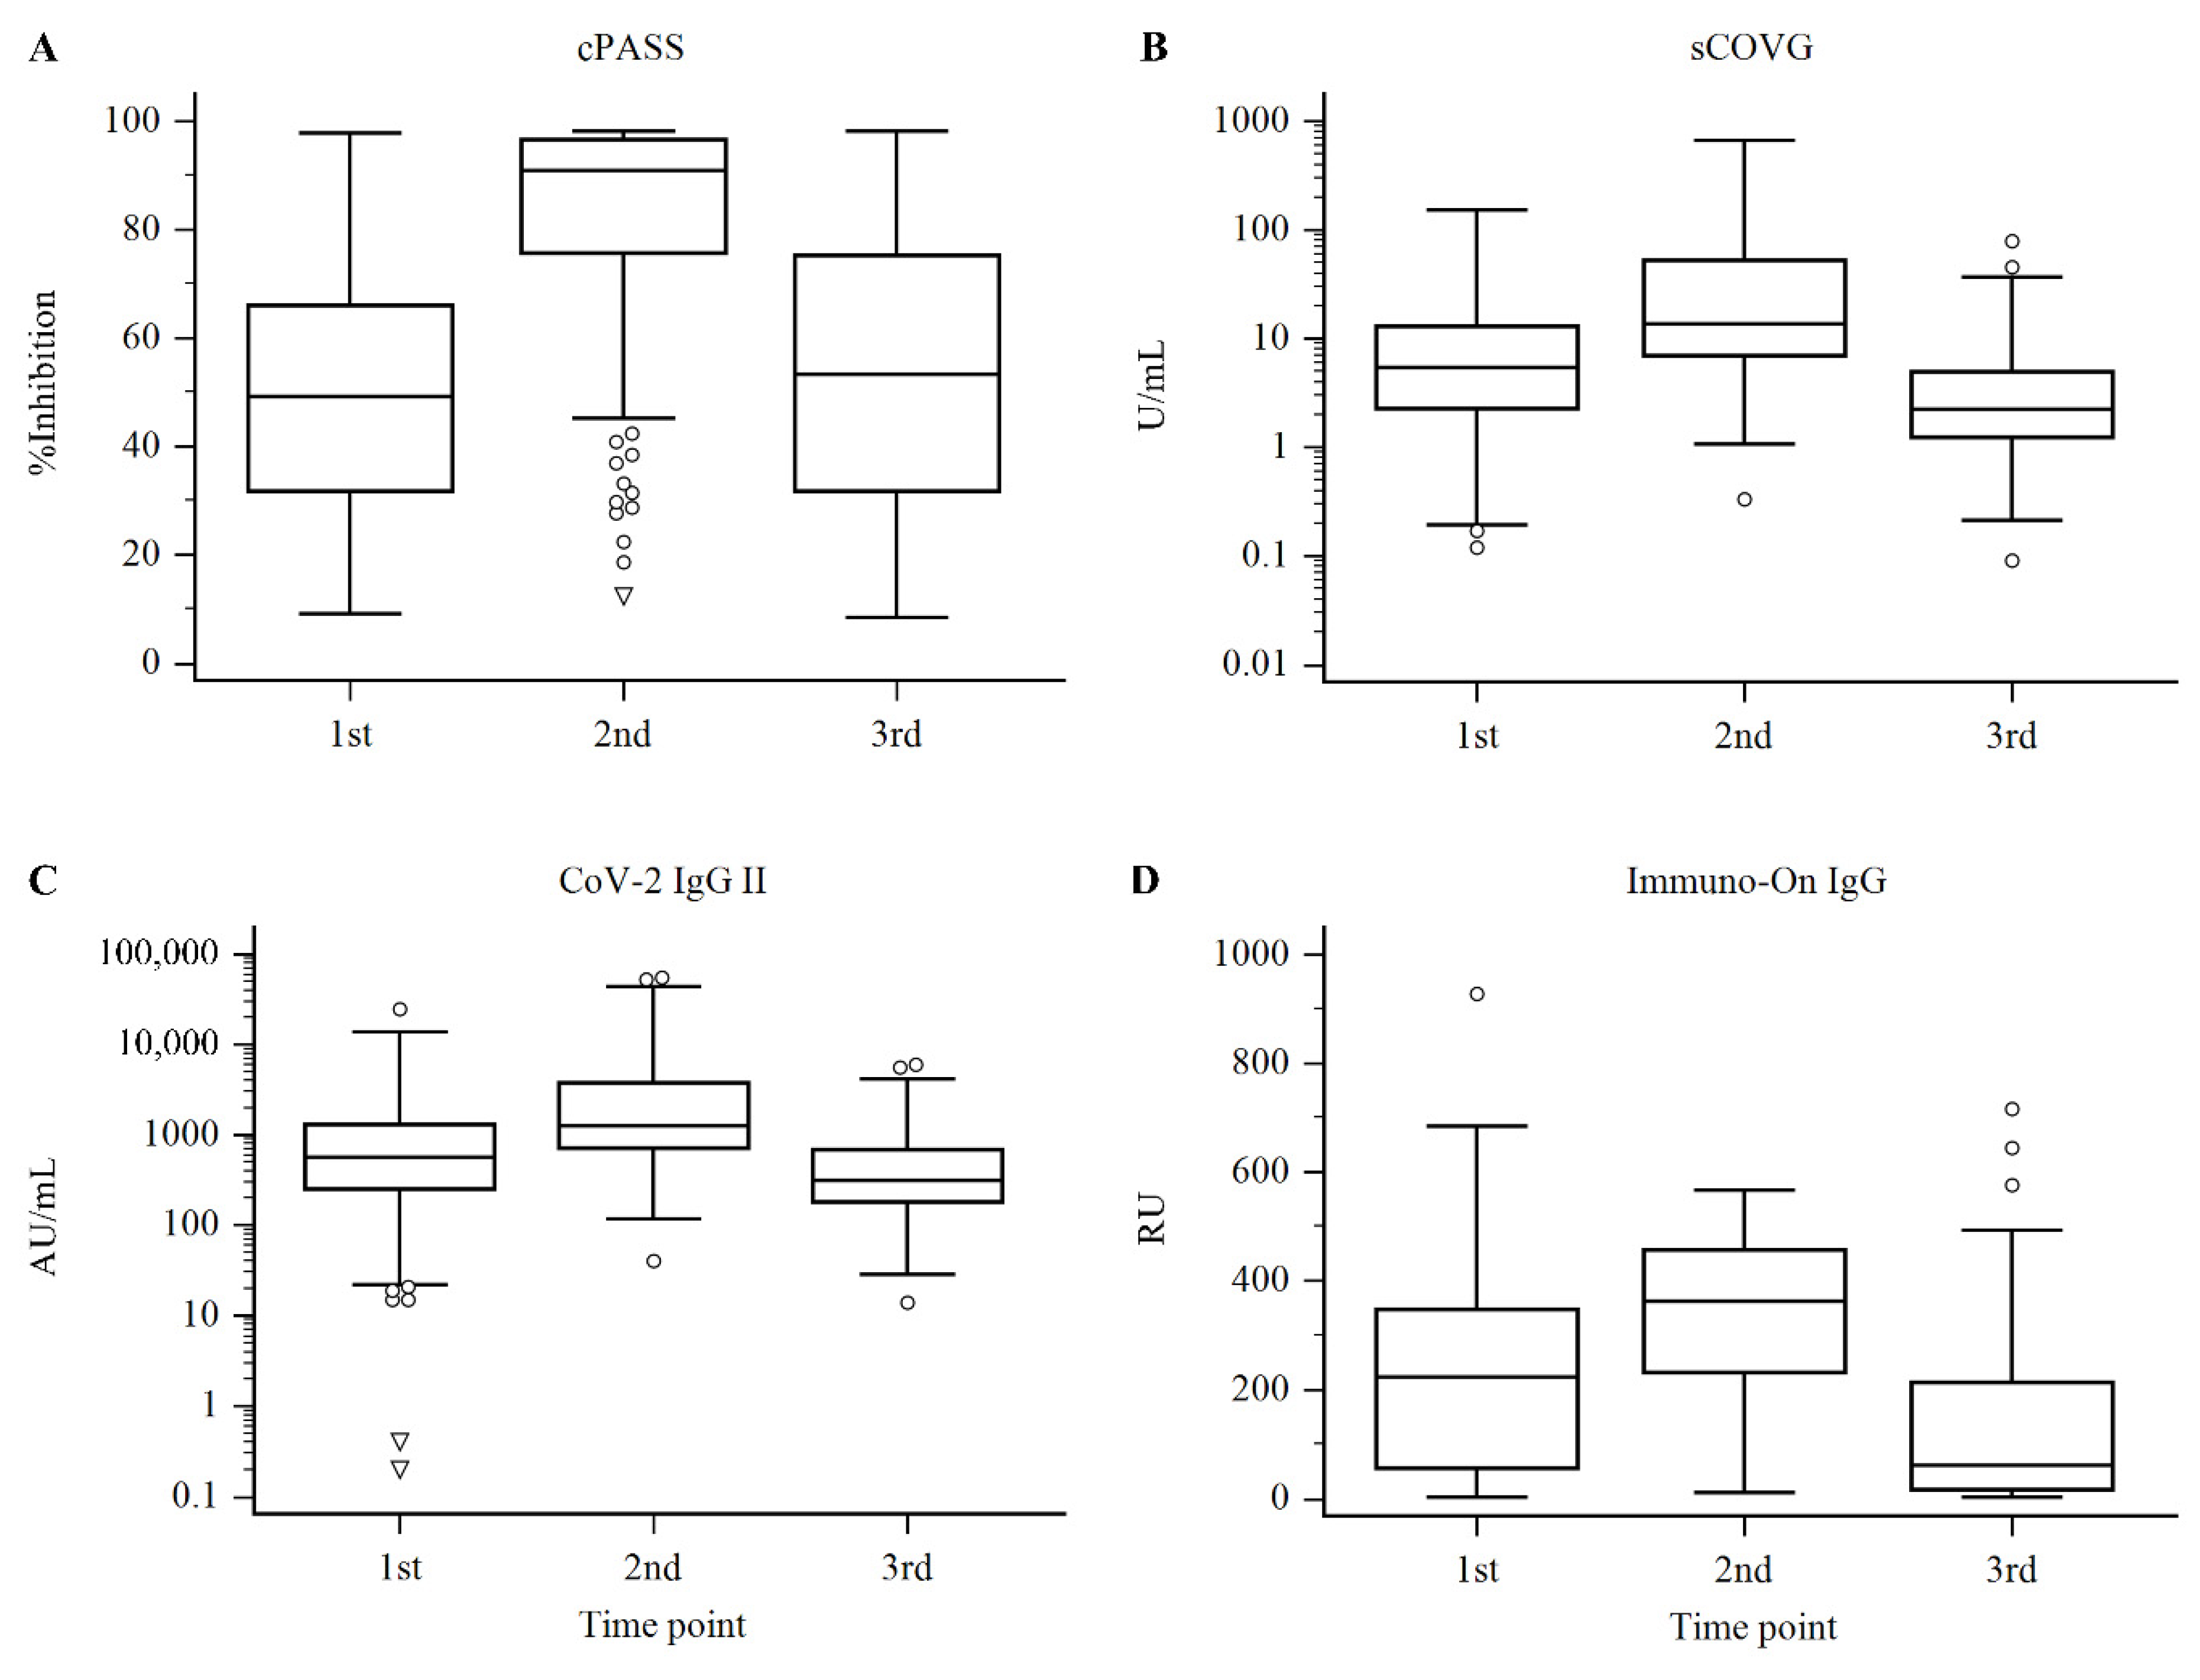
| System | Sample | n | Median and IQR | Decision * | |
|---|---|---|---|---|---|
| Positive | Negative | ||||
| cPASS | First | 183 | 49.31 (31.79–65.99) | 79.8% (146/183) | 20.2% (37/183) |
| (% inhibition) | Second | 315 | 90.87 (75.66–96.53) | 97.8% (308/315) | 2.2% (7/315) |
| Third | 253 | 53.38 (31.82–75.18) | 77.9% (197/253) | 22.1% (56/253) | |
| sCOVG | First | 344 | 5.39 (2.28–12.90) | 90.4% (311/344) | 9.6% (33/344) |
| (U/mL) | Second | 315 | 13.65 (6.97–53.17) | 99.7% (314/315) | 0.3% (1/315) |
| Third | 262 | 2.24 (1.25–4.94) | 81.3% (213/262) | 18.7% (49/262) | |
| CoV-2 IgG II | First | 344 | 570.25 (252.45–1308.20) | 96.2% (331/344) | 3.8% (13/344) |
| (AU/mL) | Second | 316 | 1279.65 (714.00–3764.60) | 99.7% (315/316) | 0.3% (1/316) |
| Third | 262 | 315.80 (181.40–682.50) | 96.6% (253/262) | 3.4% (9/262) | |
| Immuno-On IgG | First | 183 | 223.22 (56.71–347.30) | 88.0% (161/183) | 12.0% (22/183) |
| (RU) | Second | 315 | 362.20 (232.86–456.80) | 99.4% (313/315) | 0.6% (2/315) |
| Third | 253 | 62.20 (17.38–213.40) | 79.1% (200/253) | 20.9% (53/253) | |
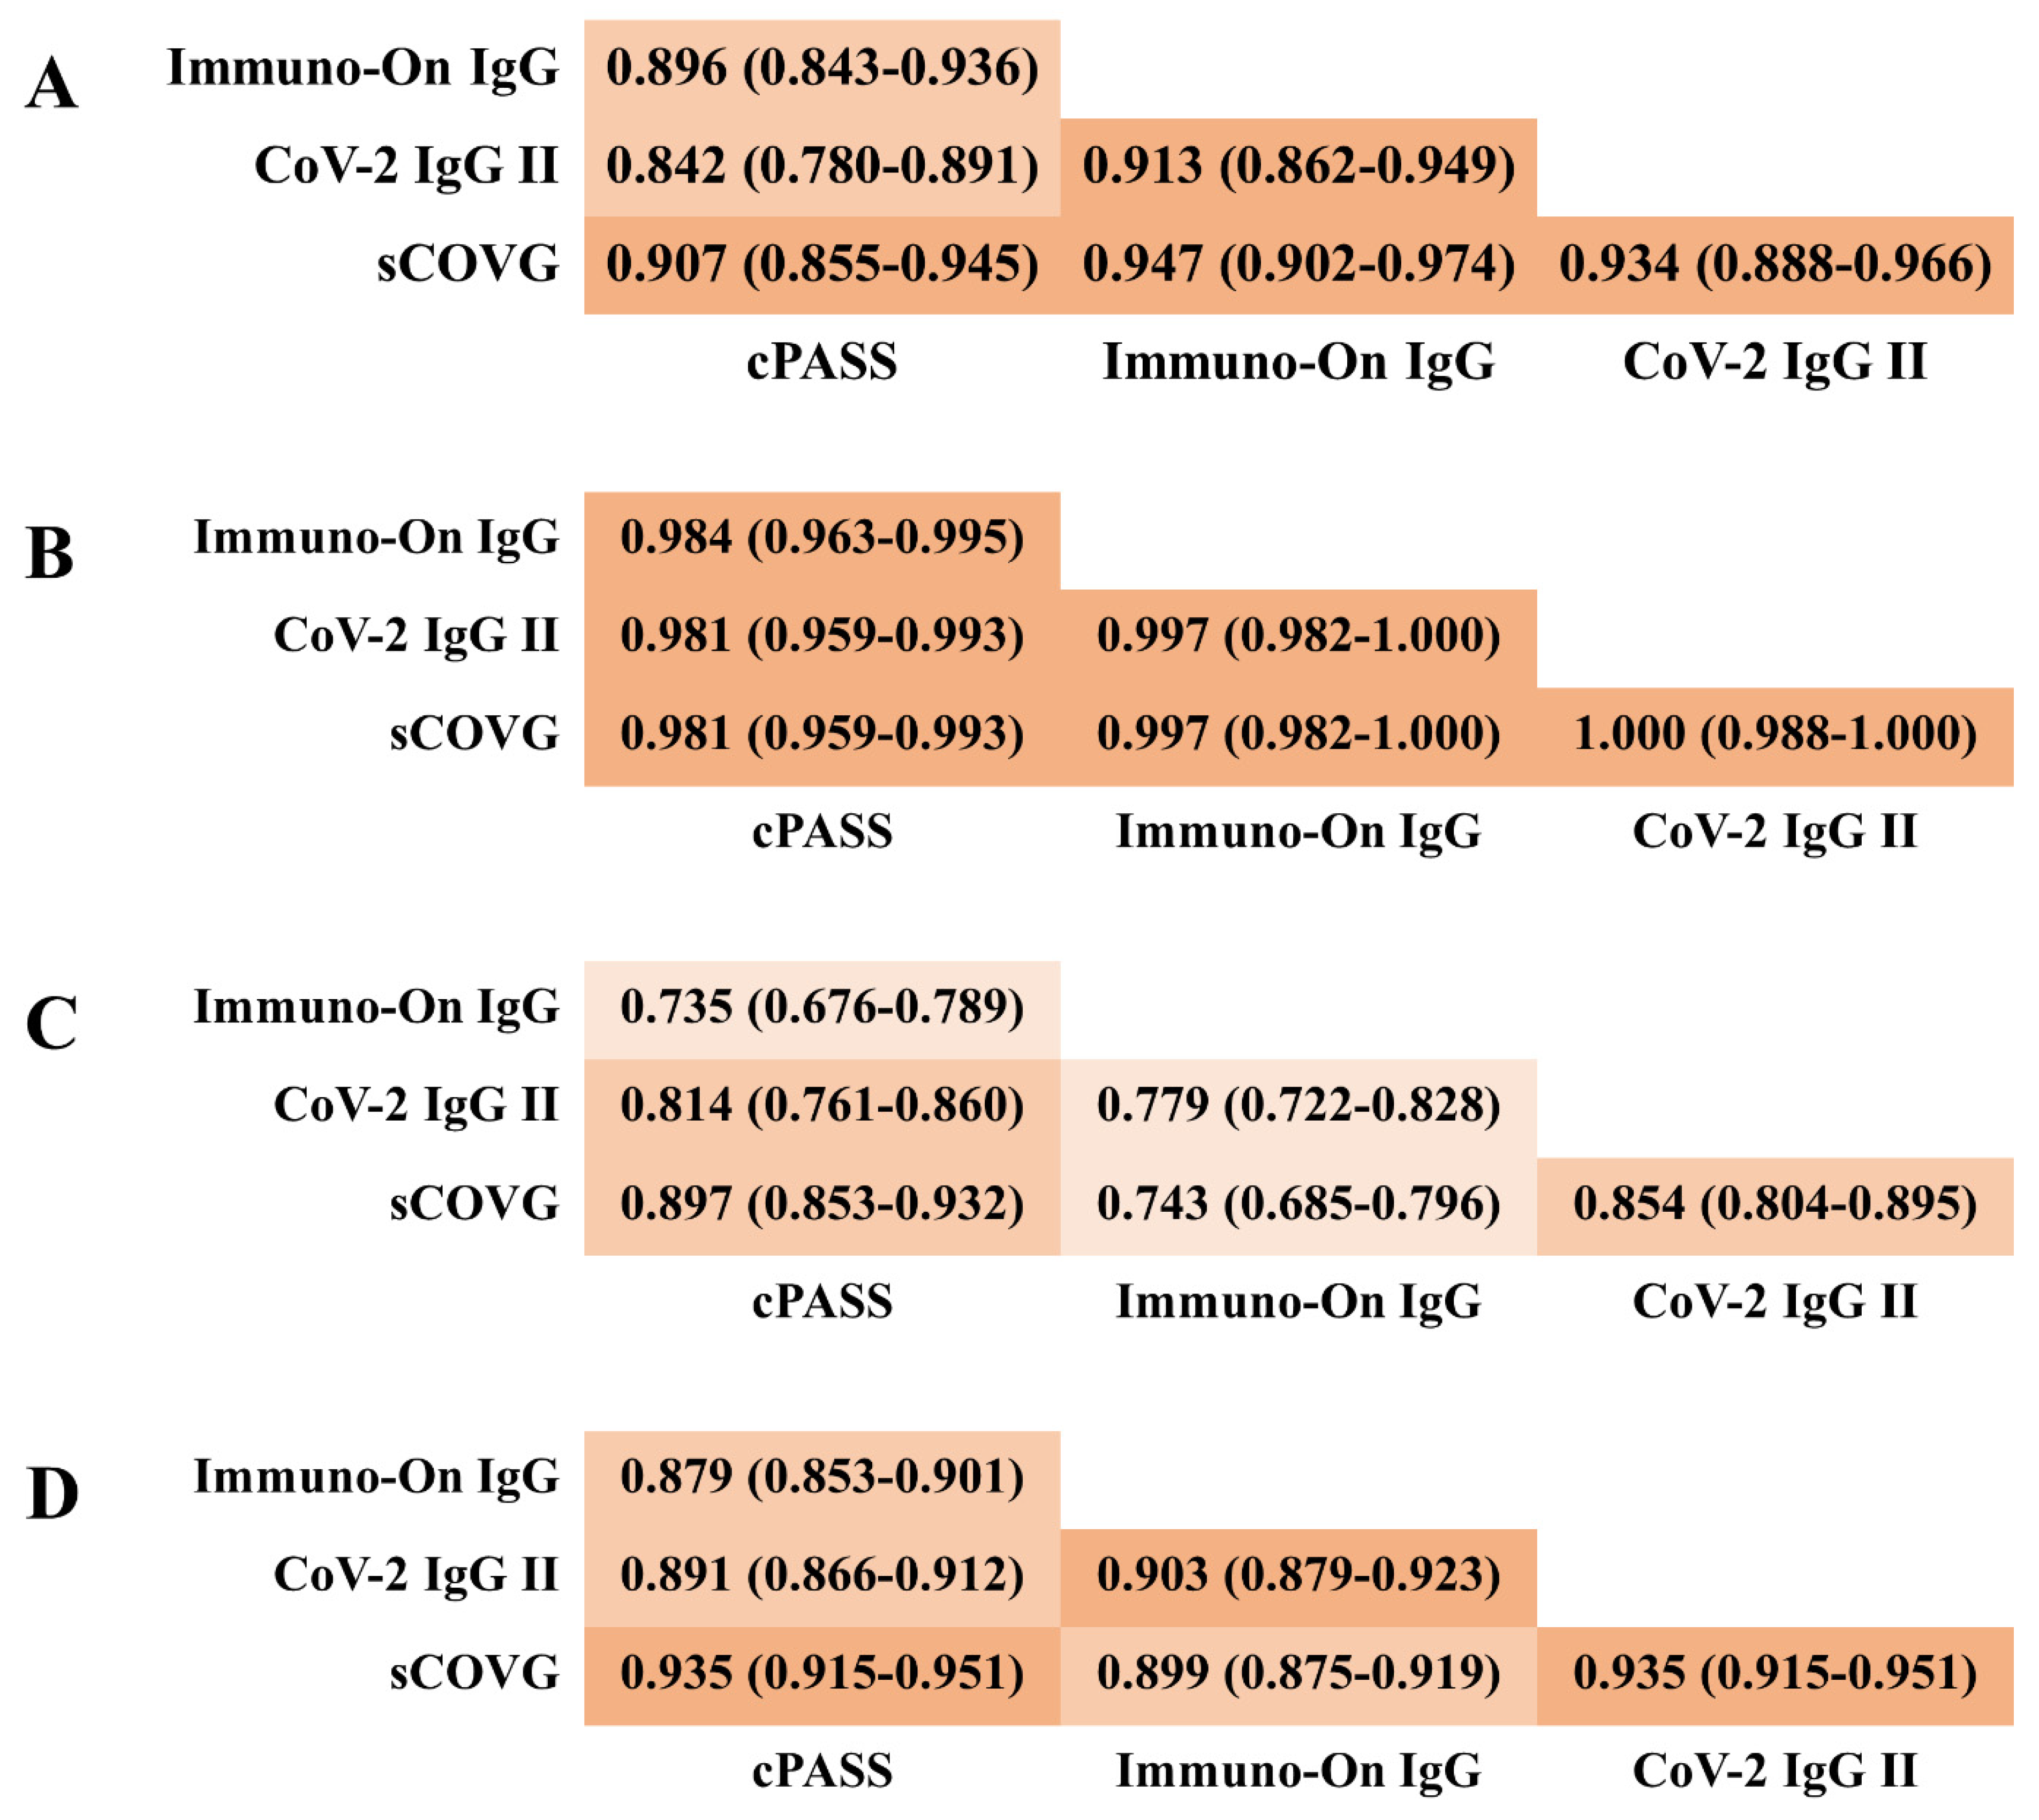
| AUC (95% CI *) | Cutoff | Trade-off | Sensitivity (95% CI) | Specificity (95% CI) | |
|---|---|---|---|---|---|
| sCOVG | 0.962 (0.945–0.974) | Claimed | ≥1.0 U/mL | 98.6 (97.4–99.4) | 59.0 (48.7–68.7) |
| Optimal | ≥2.02 U/mL | 87.2 (84.4–89.7) | 94.0 (87.4–97.8) | ||
| CoV-2 IgG II | 0.963 (0.947–0.976) | Claimed | ≥50.0 AU/mL | 100.0 (99.4–100.0) | 19.0 (11.8–28.1) |
| Optimal | ≥258.6 AU/mL | 88.2 (85.4–90.6) | 95.0 (88.7–98.4) | ||
| Immuno-On IgG | 0.845 (0.817–0.870) | Claimed | ≥14.9 RU | 94.8 (92.8–96.4) | 44.0 (34.1–54.3) |
| Optimal | ≥74.2 RU | 80.0 (76.7–83.0) | 80.0 (70.8–87.3) | ||
Publisher’s Note: MDPI stays neutral with regard to jurisdictional claims in published maps and institutional affiliations. |
© 2022 by the authors. Licensee MDPI, Basel, Switzerland. This article is an open access article distributed under the terms and conditions of the Creative Commons Attribution (CC BY) license (https://creativecommons.org/licenses/by/4.0/).
Share and Cite
Seo, J.D.; Nam, M.; Lee, T.H.; Ahn, Y.-S.; Shin, S.-H.; Han, H.Y.; Moon, H.-W. Comparison of Four Systems for SARS-CoV-2 Antibody at Three Time Points after SARS-CoV-2 Vaccination. Diagnostics 2022, 12, 1349. https://0-doi-org.brum.beds.ac.uk/10.3390/diagnostics12061349
Seo JD, Nam M, Lee TH, Ahn Y-S, Shin S-H, Han HY, Moon H-W. Comparison of Four Systems for SARS-CoV-2 Antibody at Three Time Points after SARS-CoV-2 Vaccination. Diagnostics. 2022; 12(6):1349. https://0-doi-org.brum.beds.ac.uk/10.3390/diagnostics12061349
Chicago/Turabian StyleSeo, Jong Do, Minjeong Nam, Tae Hwan Lee, Yeon-Sun Ahn, Seon-Hyeon Shin, Hye Young Han, and Hee-Won Moon. 2022. "Comparison of Four Systems for SARS-CoV-2 Antibody at Three Time Points after SARS-CoV-2 Vaccination" Diagnostics 12, no. 6: 1349. https://0-doi-org.brum.beds.ac.uk/10.3390/diagnostics12061349