Influence of Rheological Properties of Lithium Greases on Operating Behavior in Oscillating Rolling Bearings at a Small Swivel Angle


Abstract
:1. Introduction
2. Materials and Methods
2.1. Test Greases
2.2. Rheological Tests
2.2.1. Dynamic Viscosity
2.2.2. Rational Transient Flow
2.2.3. Viscoelastic Properties
2.2.4. Tack Test
2.2.5. Squeeze Test
2.3. Tribological Tests
2.3.1. Ball-Bearing Test
2.3.2. Experimental Conditions
2.3.3. Measurement Technique
3. Results and Discussion
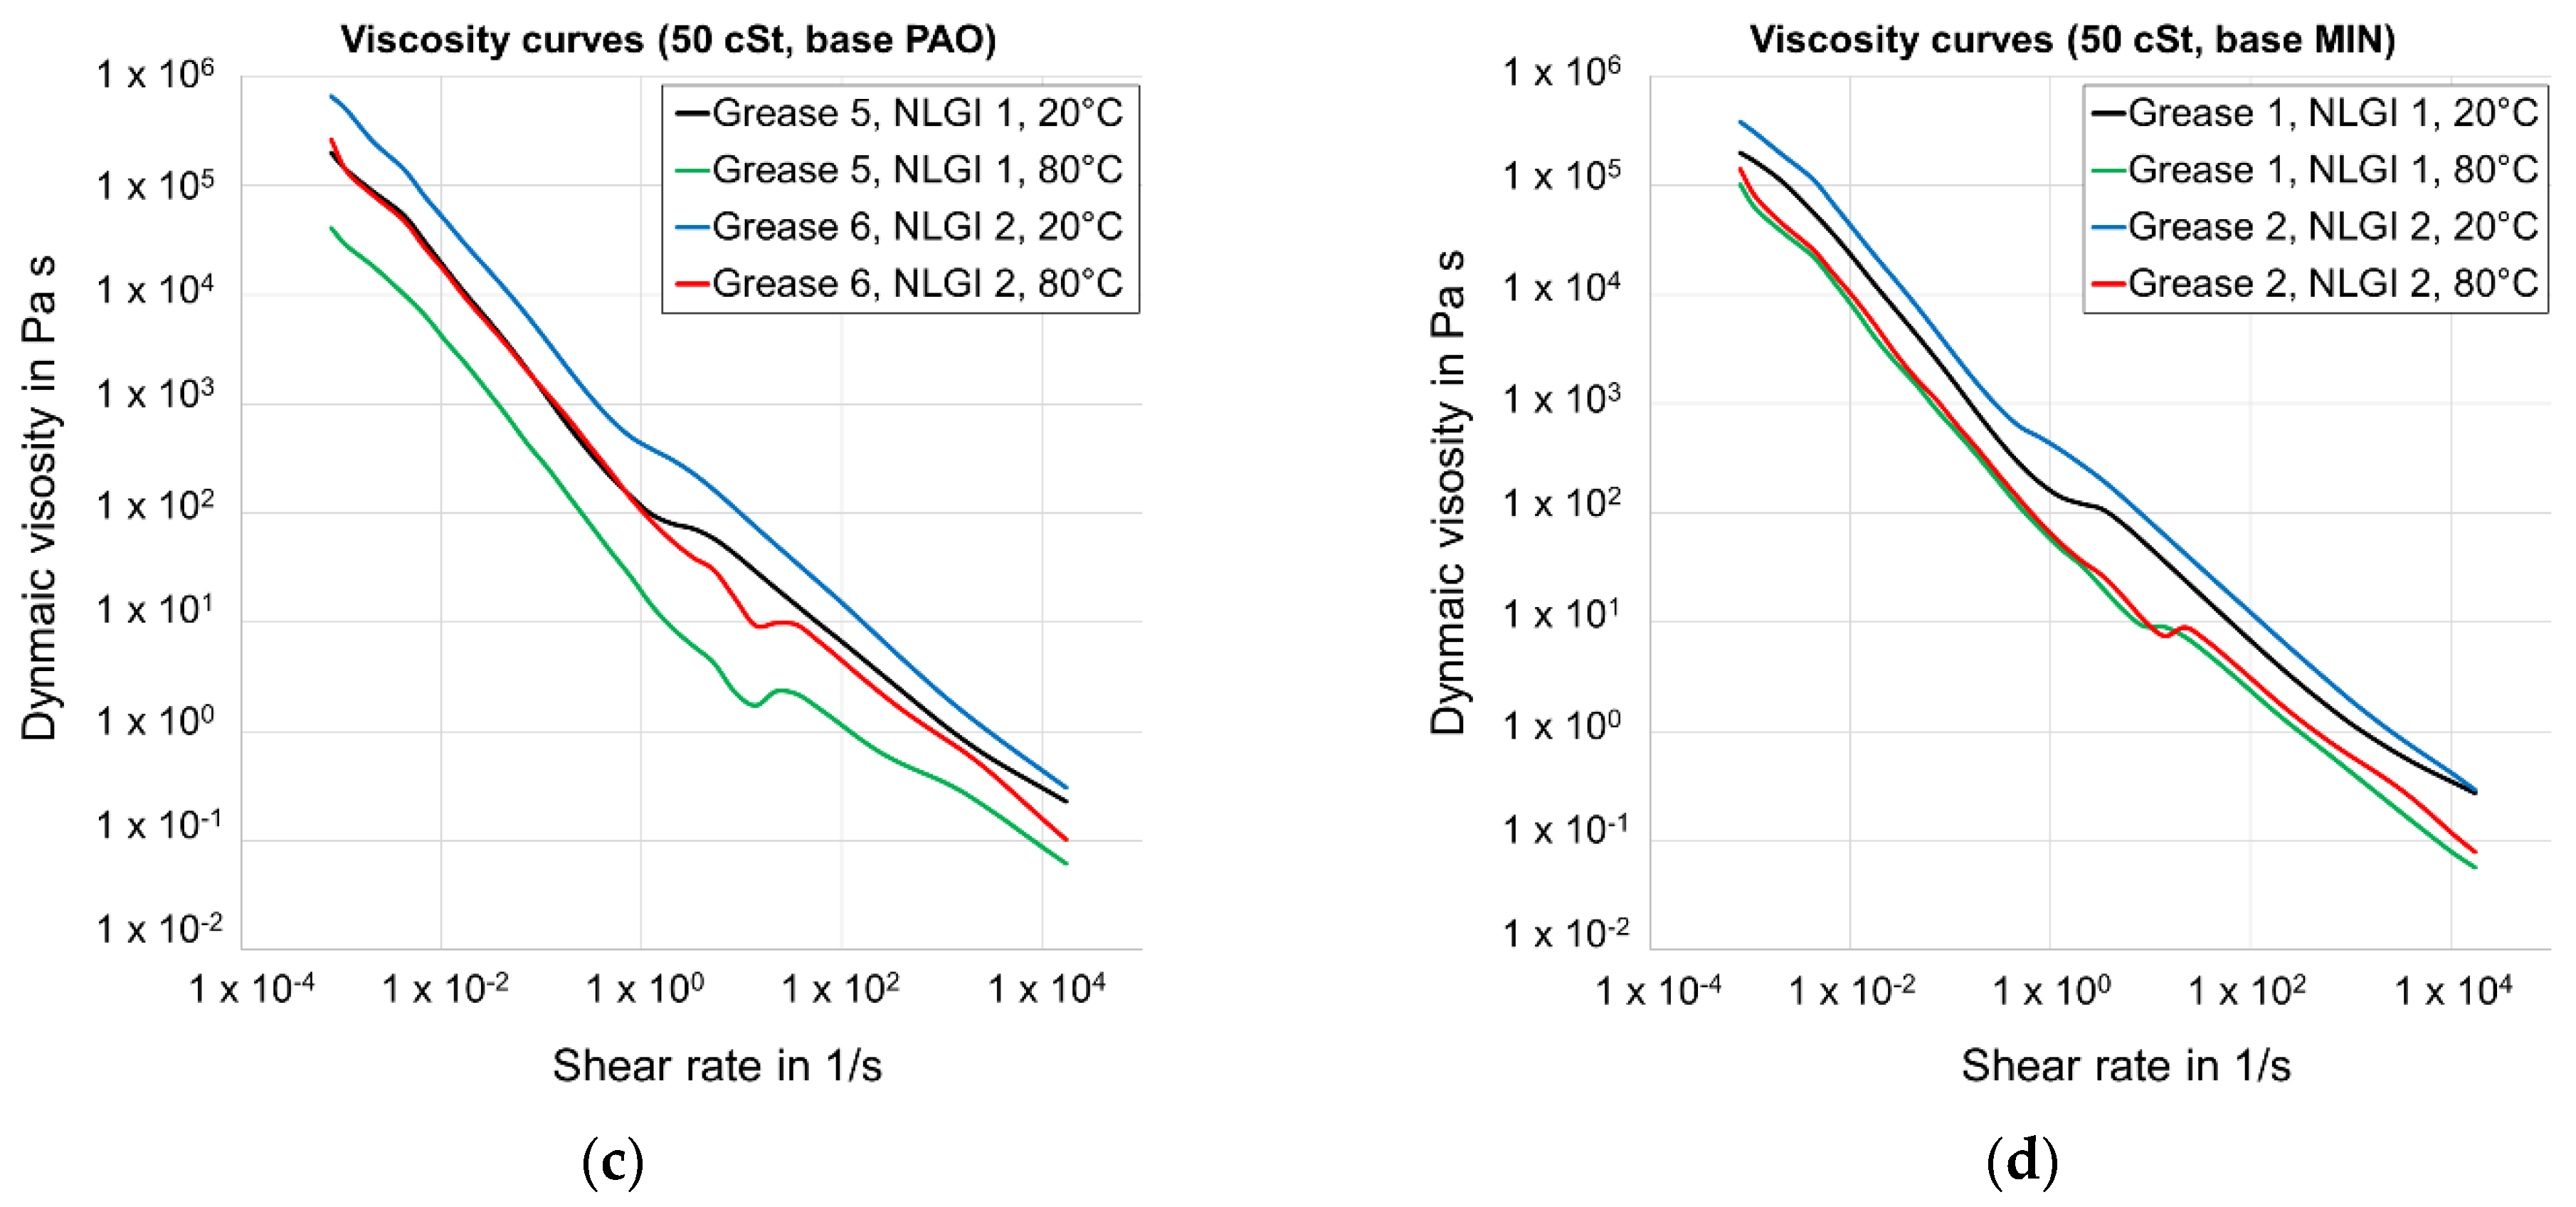
3.1. Dynamic Viscosity
3.2. Rational Transient Flow
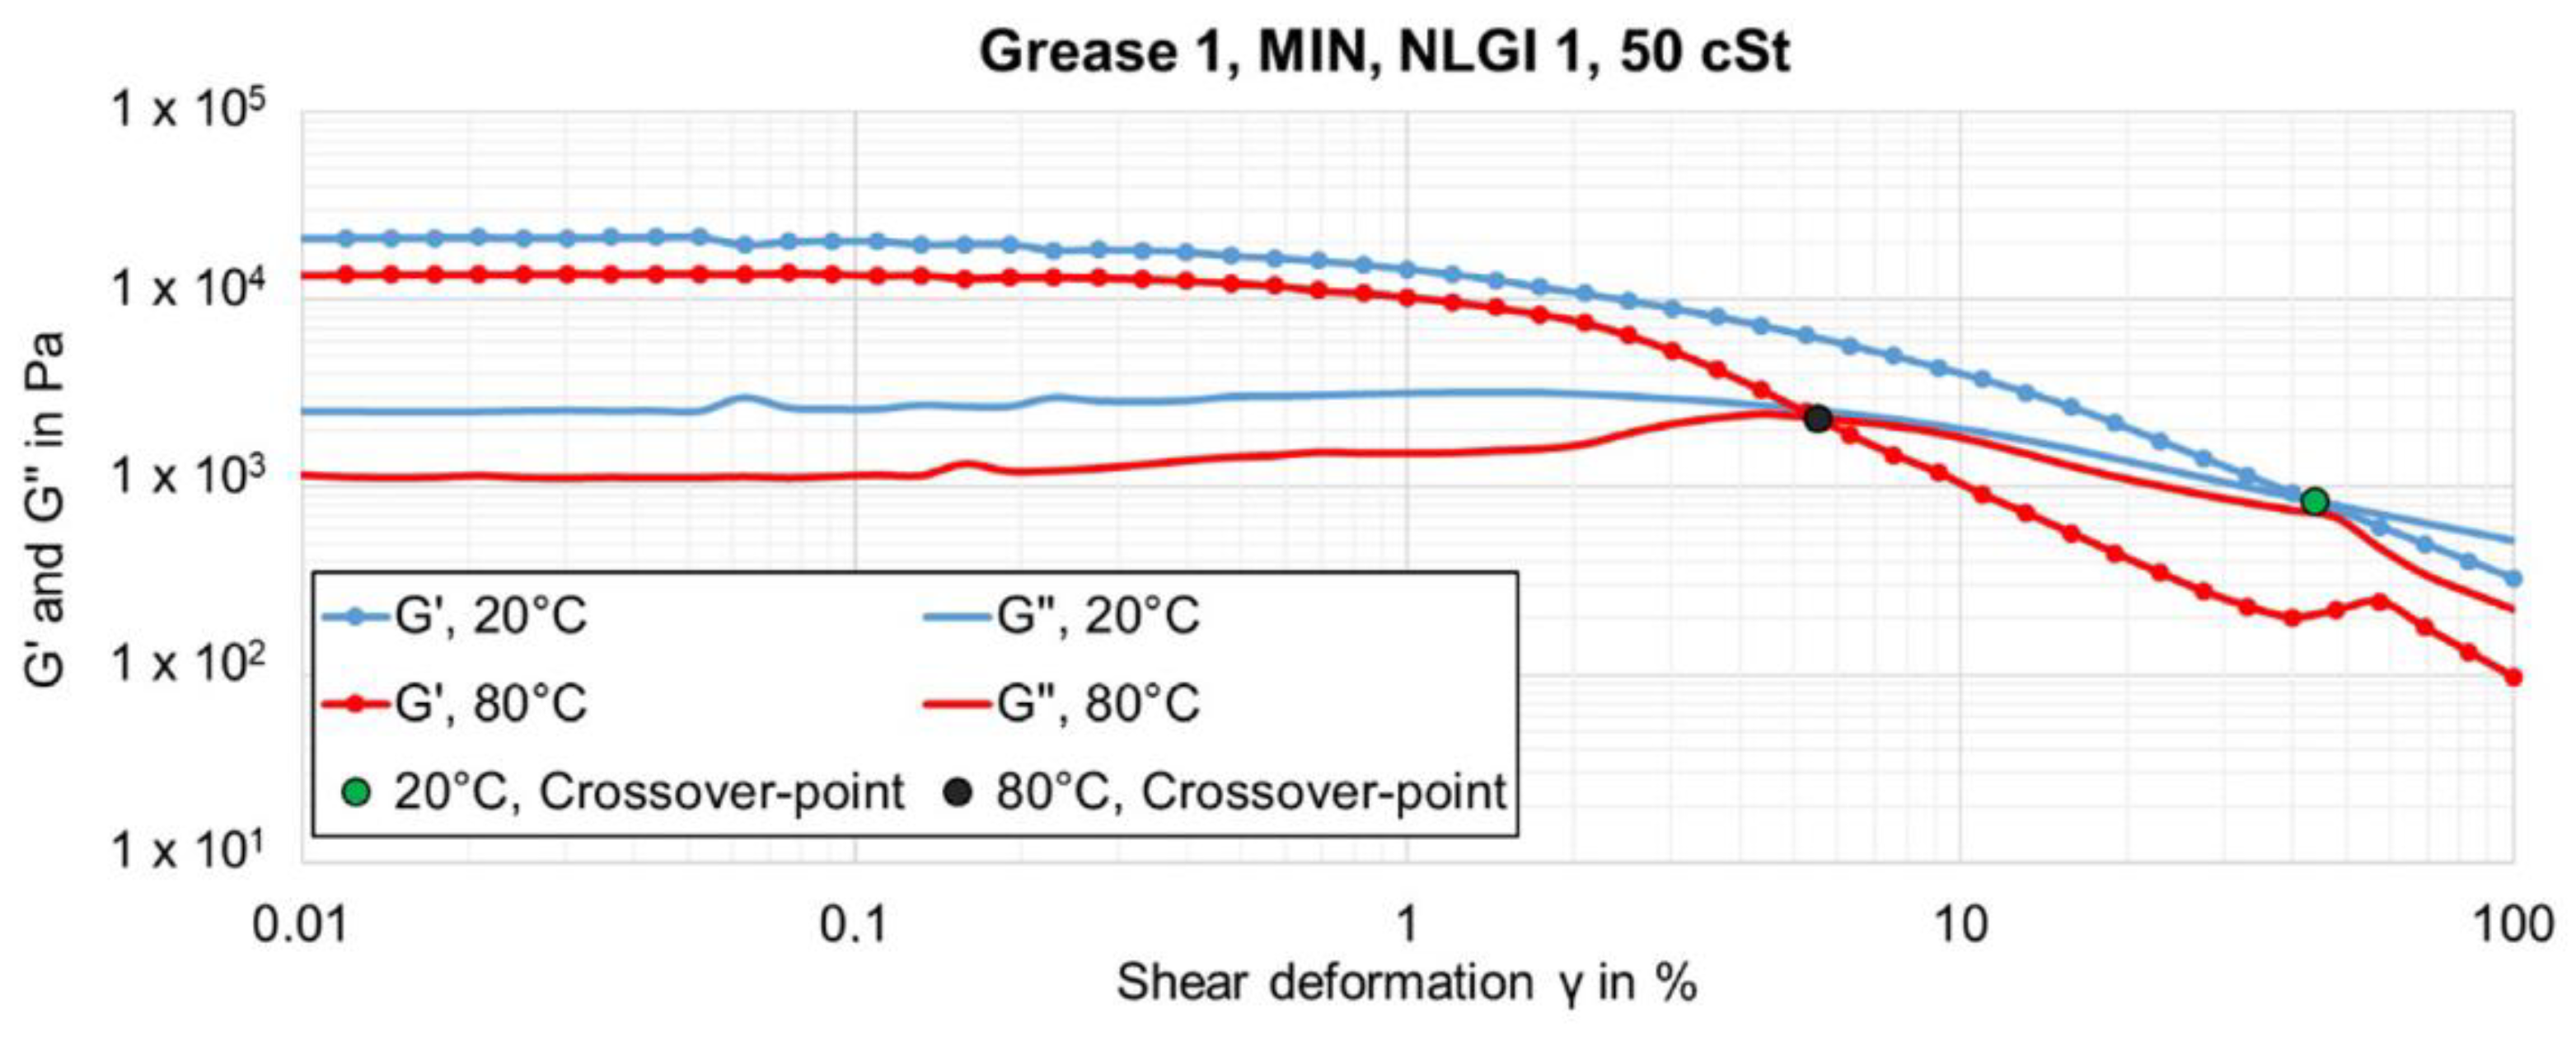
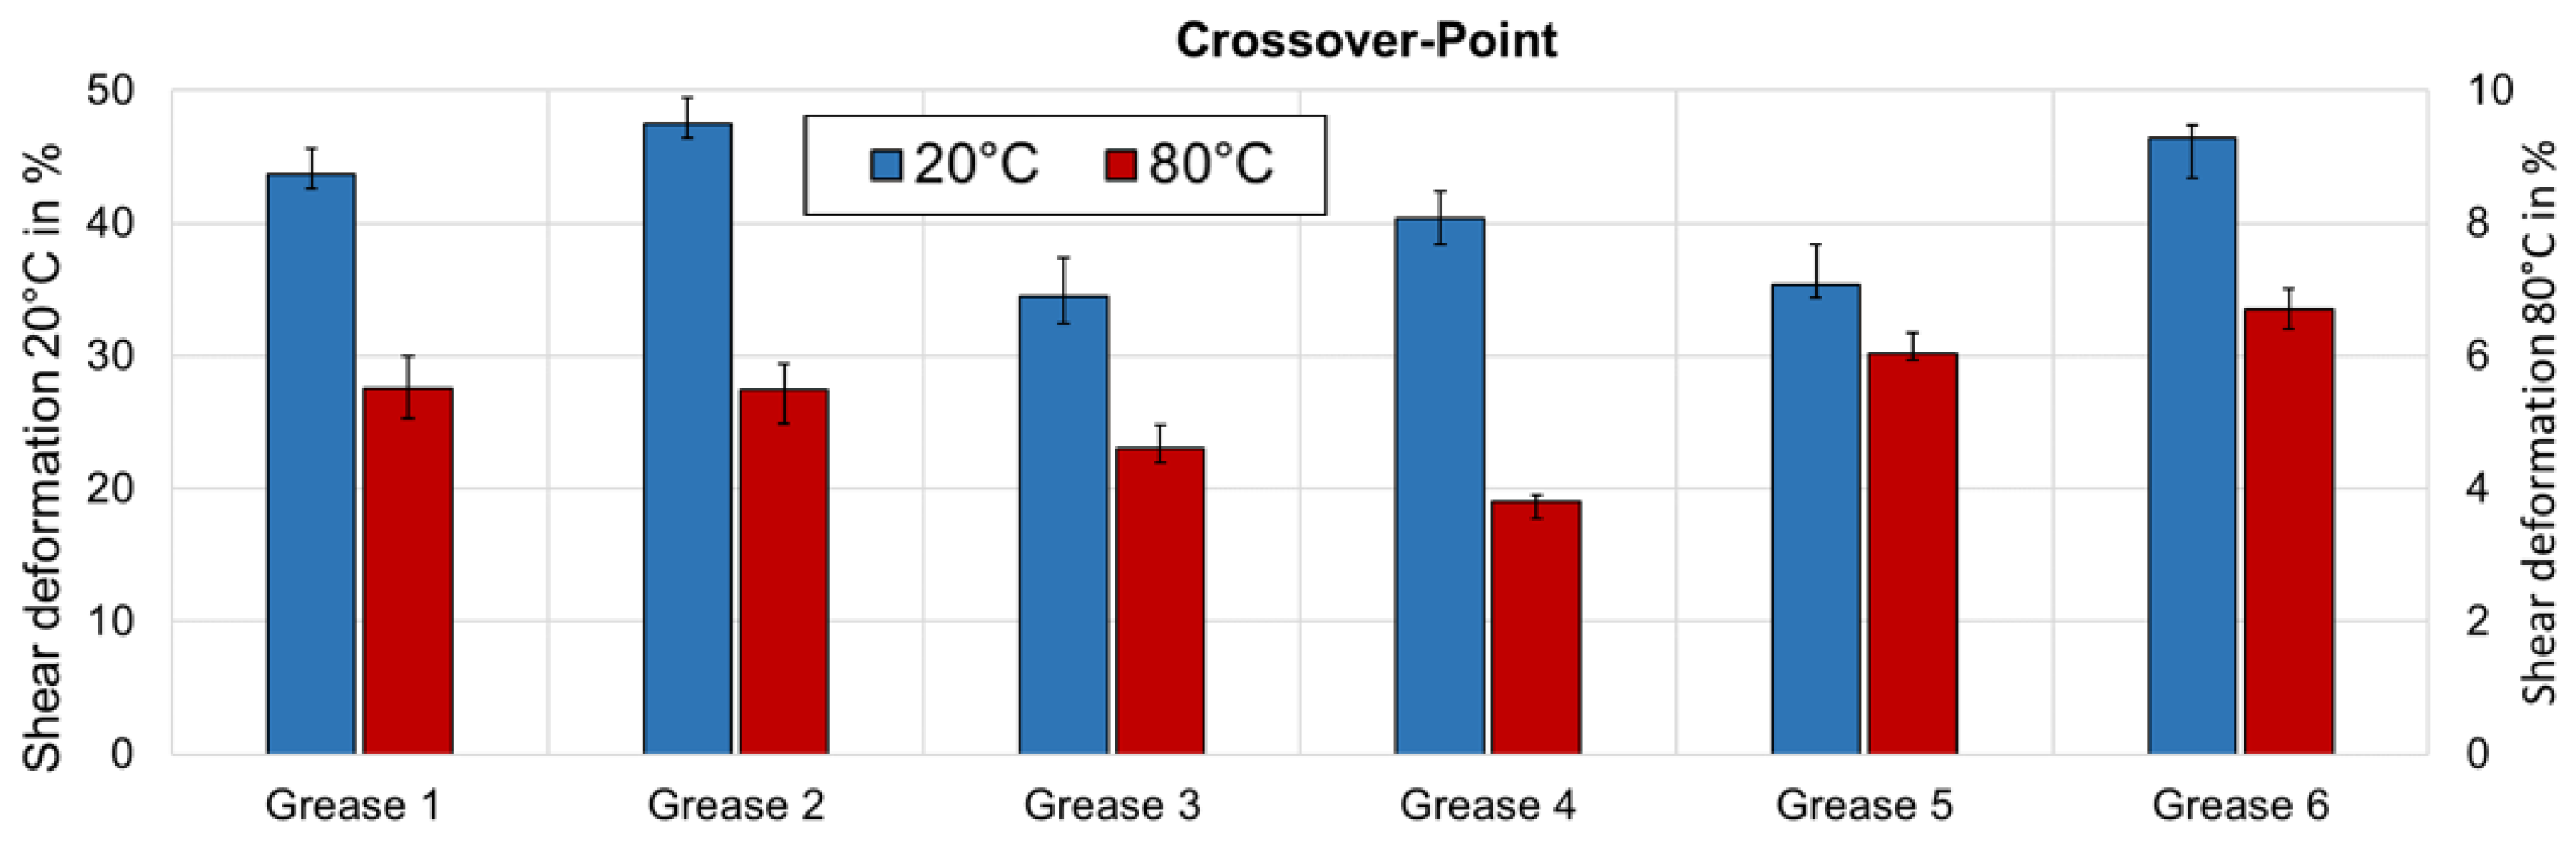
3.3. Viscoelastic Properties
3.4. Tack Test
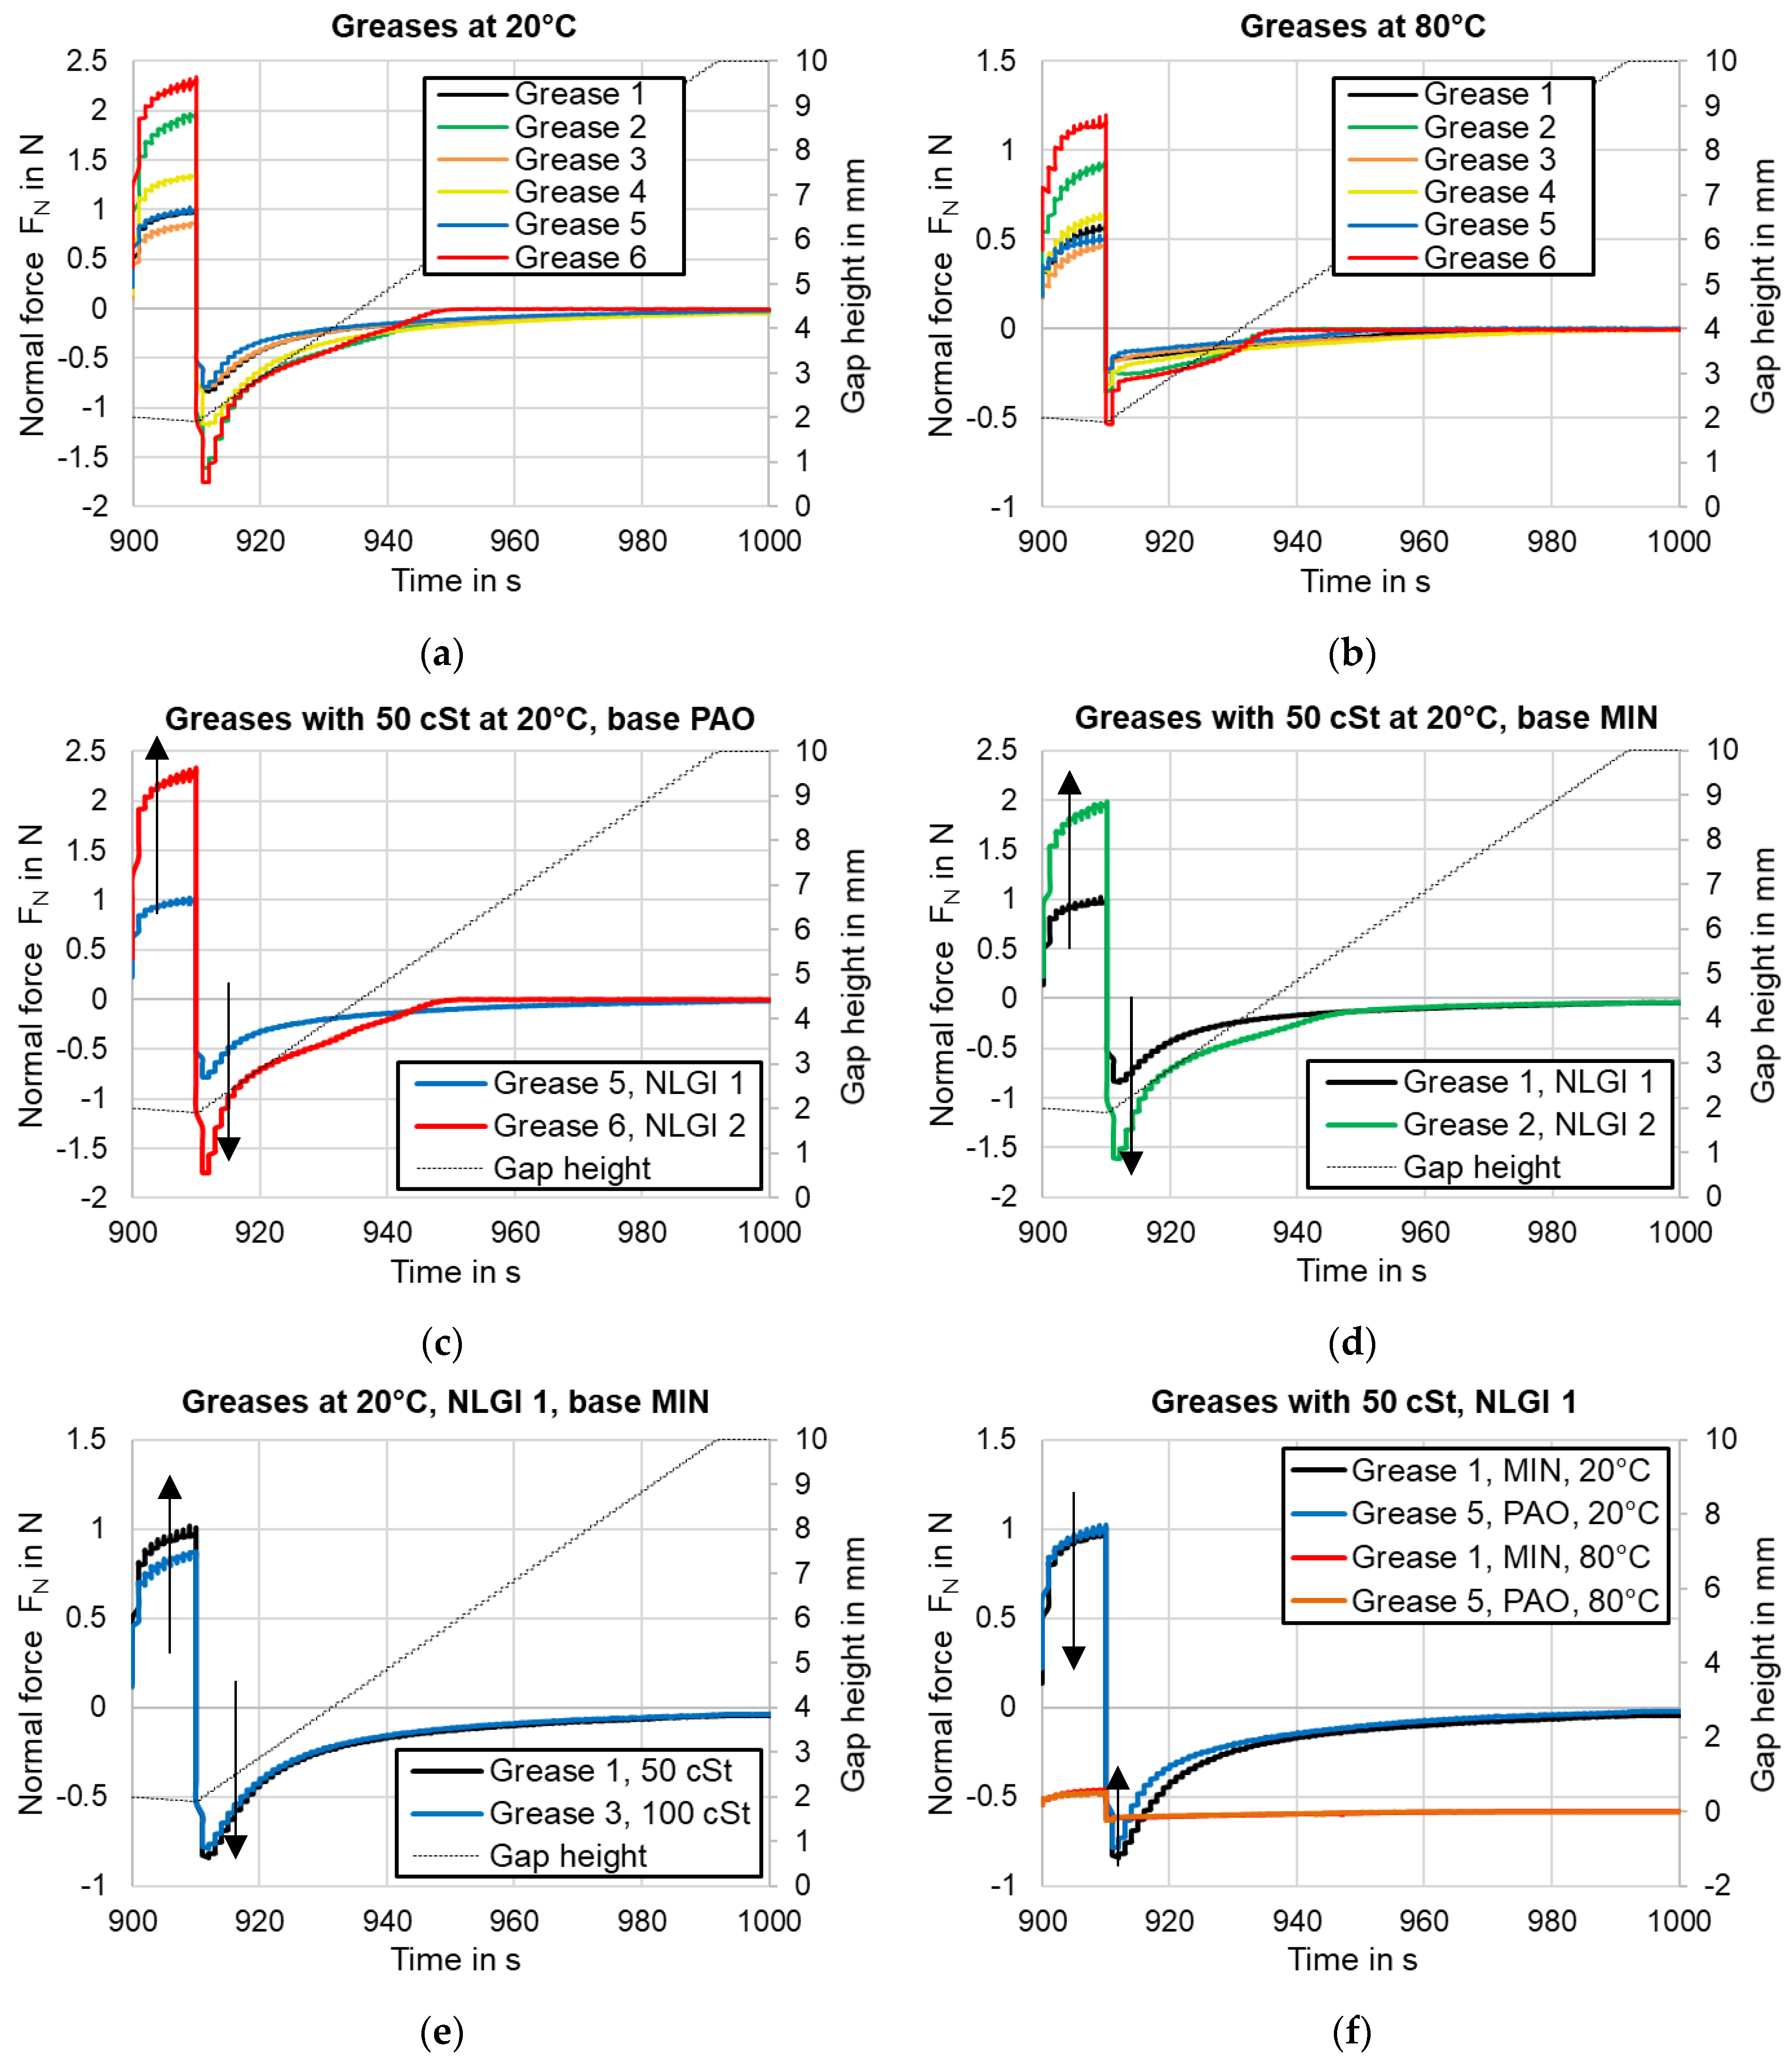
3.5. Squeeze Test
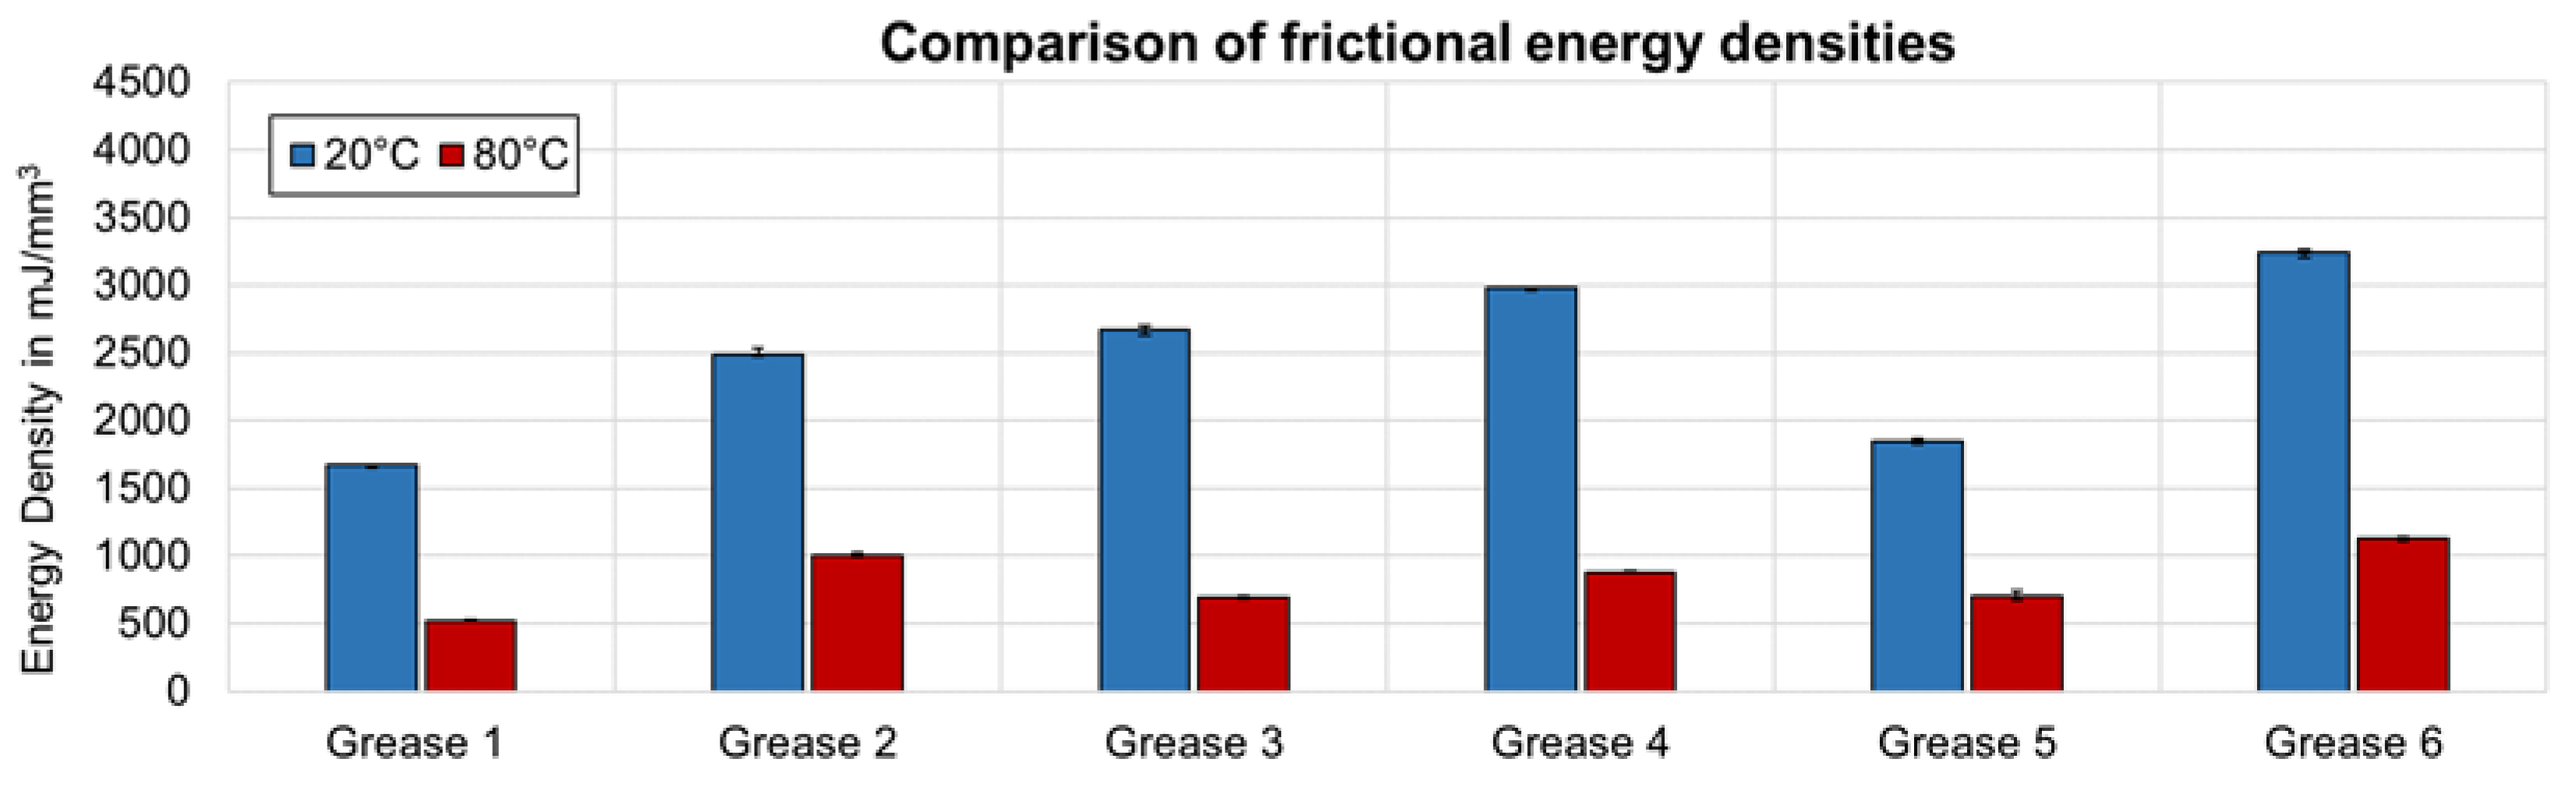
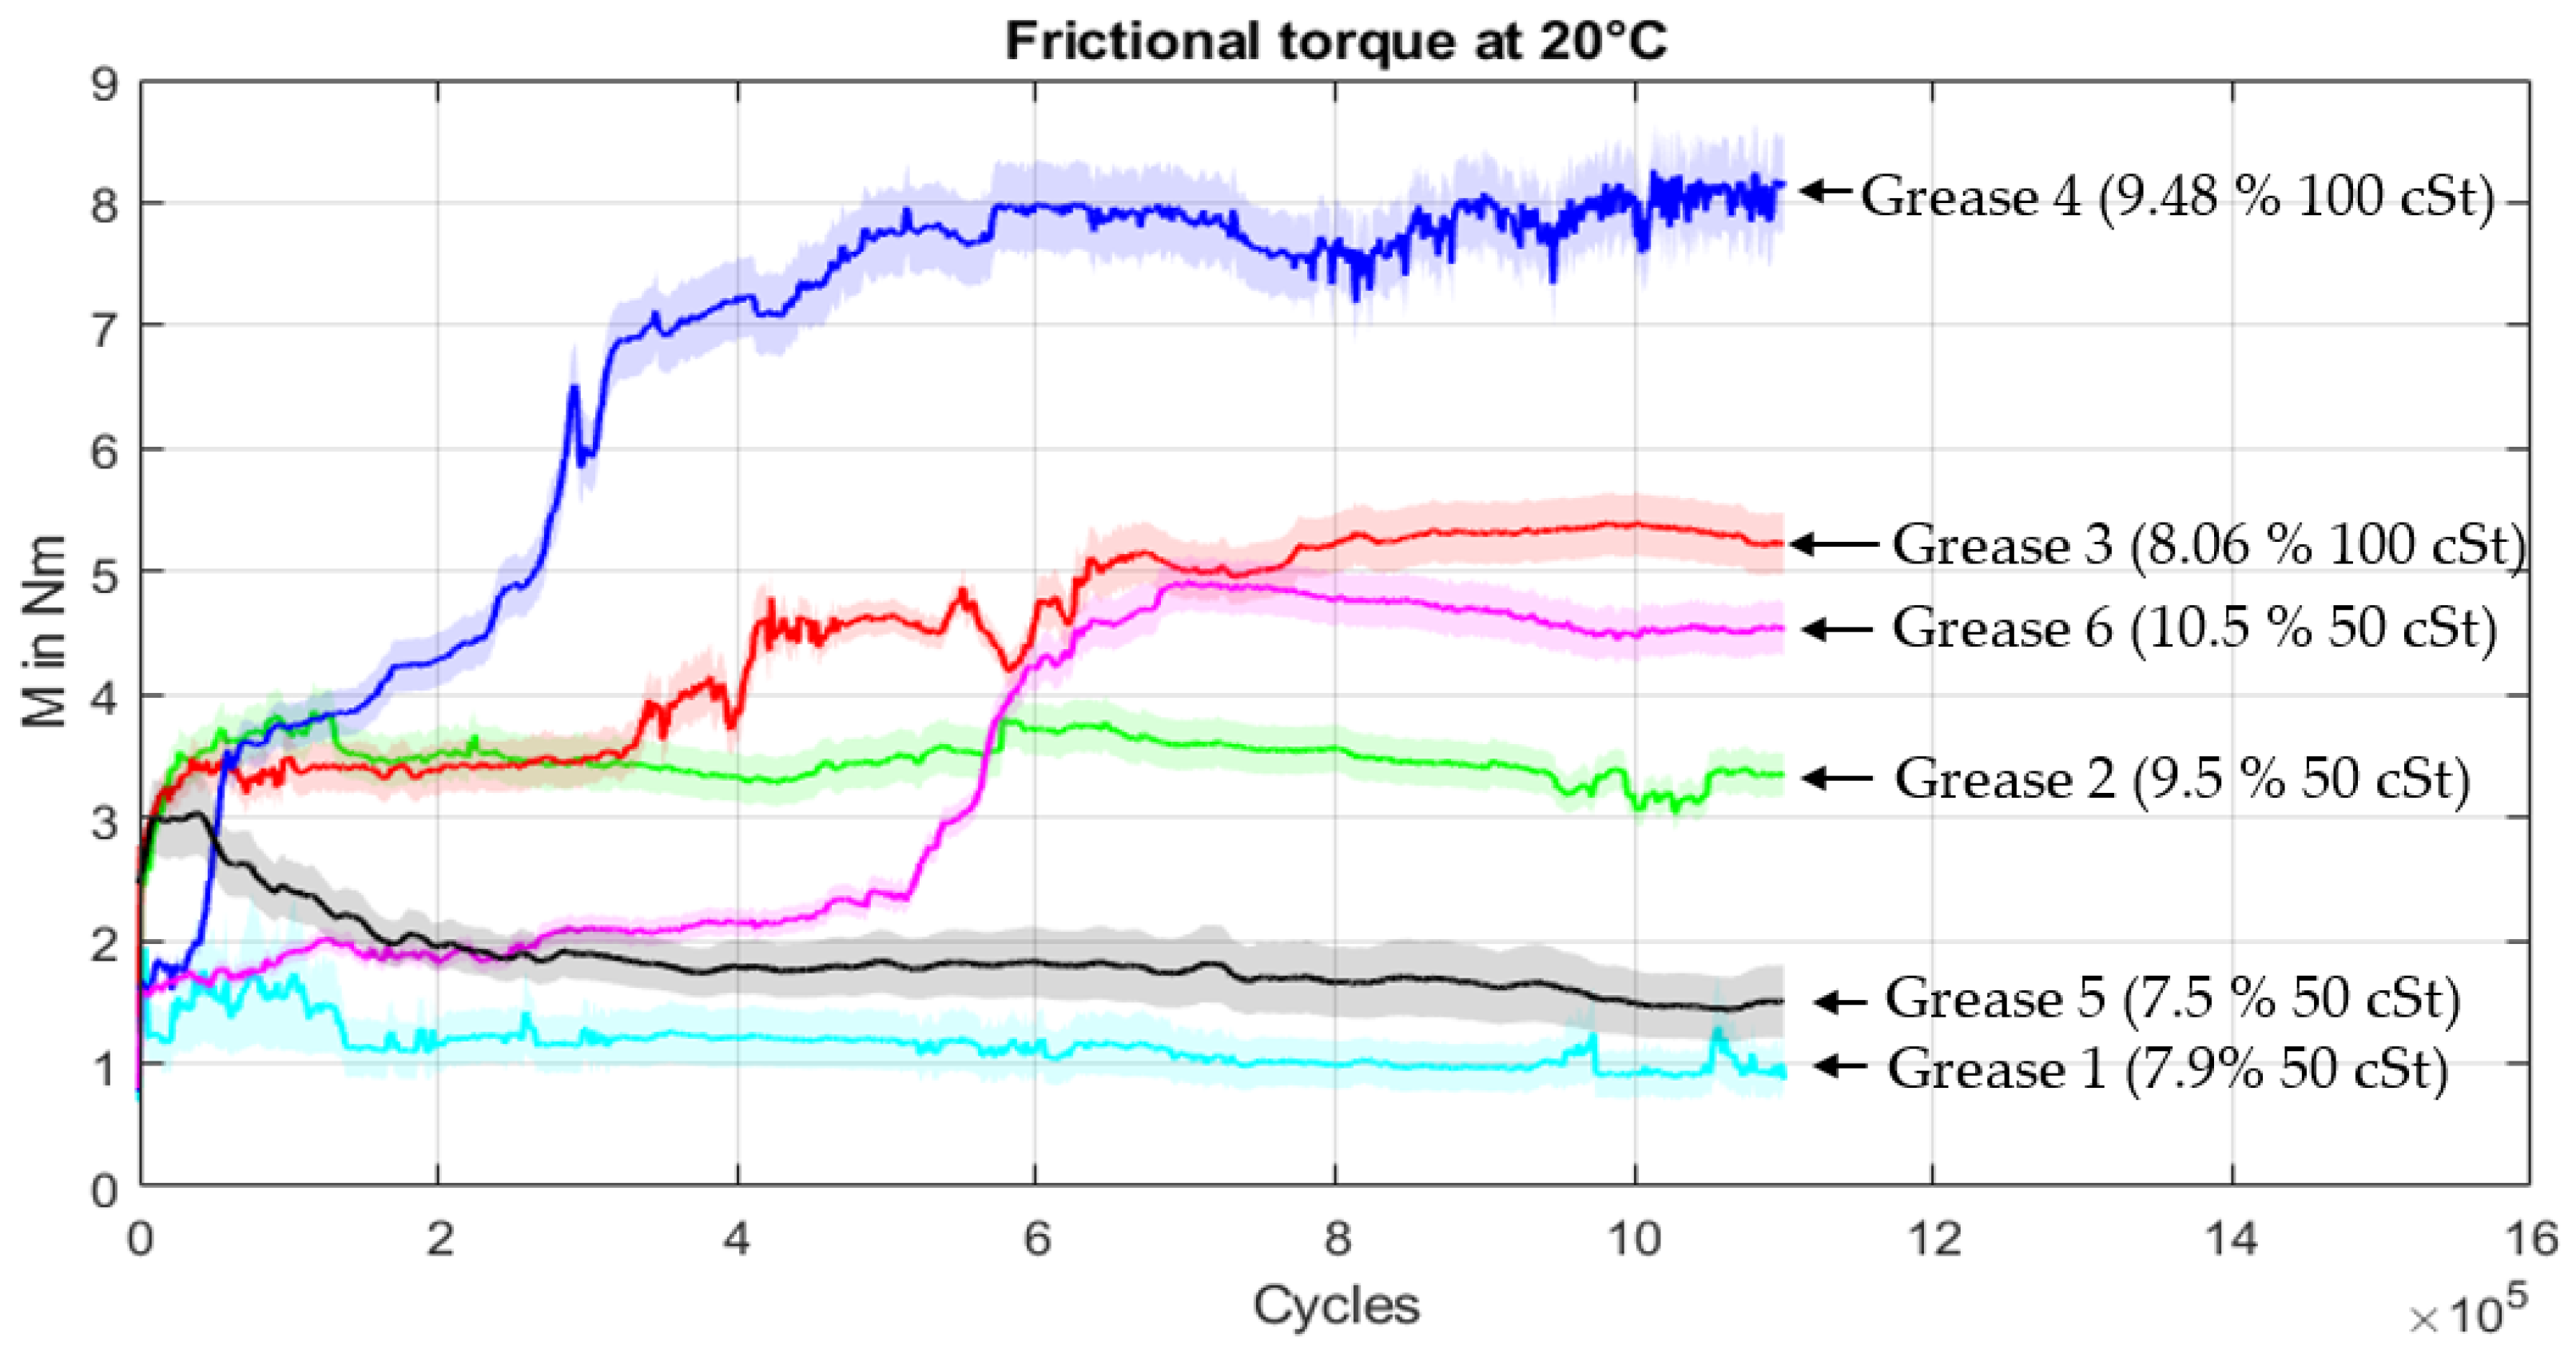
3.6. Bearing Test
3.7. Comparison of Fresh and Used Grease
4. Conclusions
Author Contributions
Funding
Data Availability Statement
Acknowledgments
Conflicts of Interest
Appendix A
| Grease Sample | Decrease (%) | |
| Shear Ratemin = 0.001 1/s | Shear Ratemax = 17,500 1/s | |
| 20–80 °C | 20–80 °C | |
| Grease 1 | 48.5 | 79.5 |
| Grease 2 | 62.9 | 72.9 |
| Grease 3 | 46.5 | 81.7 |
| Grease 4 | 40.9 | 80.1 |
| Grease 5 | 79.3 | 72.9 |
| Grease 6 | 59.9 | 67 |
Appendix B

Appendix C

References
- Gatzen, M. Wälzlagerschmierung mit Polymerhaltigen Fetten. Ph.D. Thesis, Gottfried Wilhelm-Leibniz-Universität Hannover, Hannover, Germany, 2010. [Google Scholar]
- Li, Y. Effect of temperature on rheological properties of lithium-based magnetorheological grease. Smart Mater. Struct. 2018, 28, 035002. [Google Scholar]
- Delgado, M.A.; Valencia, C.; Sánchez, M.C.; Franco, J.M.; Gallegos, C. Influence of soap concentration and oil viscosity on the rheology and microstructure of lubrication greases. Ind. Eng. Chem. Res. 2006, 45, 1902–1910. [Google Scholar] [CrossRef]
- Couronné, I.; Vergne, P.; Mazuyer, D.; Truong-Dinh, N.u.; Girodin, D. Effects of Grease Composition and Structure on Film Thickness in Rolling Contact. Tribol. Trans. 2003, 46, 31–36. [Google Scholar] [CrossRef]
- Xu, N.; Zhang, M.; Li, W. Insights into the rheological behaviors and tribological performances of lubricating grease: Entangled structure of a fiber thickener and functional groups of a base oil. New J. Chem. 2017, 42, 1484–1491. [Google Scholar] [CrossRef]
- Lovell, M.R.; Khonsari, M.M.; Marangoni, R.D. Experimental Measurements of the Rest-Slope and Steady Torque on Ball Bearings Experiencing Small Angular Rotations. Tribol. Trans. 2008, 37, 261–268. [Google Scholar]
- Dresel, W.H. Grundlegende Aspekte zukunftsorientierter Schmierfette. Tribol. Schmier. 1993, 40, 176–182. [Google Scholar]
- Kuhn, E. Experimentelle Untersuchungen zur Strukturveränderung bei Schmierfetten; GfT-Tagung: Göttingen, Germany, 2012. [Google Scholar]
- Cousseau, T.; Graca, B.; Campos, A.; Seabra, J. Influence of grease formulation on thrust bearings power loss. Proc. Inst. Mech. Eng. Part J J. Eng. Tribol. 2010, 224, 935–946. [Google Scholar] [CrossRef] [Green Version]
- Cousseau, T.; Graca, B.; Campos, A.; Seabra, J. Grease Aging Effects on Film Formation under Fully-Flooded and Starved Lubrication. Lubricants 2015, 3, 197–221. [Google Scholar] [CrossRef] [Green Version]
- Cousseau, T.; Graca, B.; Campos, A.; Seabra, J. Influence of grease rheology on thrust ball bearings friction torque. Tribol. Int. 2012, 46, 106–113. [Google Scholar] [CrossRef] [Green Version]
- Goncalves, D.; Graca, B.; Campos, A.; Seabra, J. Formulation, rheology and thermal aging of polymer greases. In Proceedings of the Symposium 21, Ponta Delgada/Azores, Portugal, 26–30 July 2015; Tribology Trends for Higher Efficiency and Reliability. 2015. [Google Scholar]
- Adhvaryu, A.; Sung, C.; Erhan, S.Z. Fatty acids and antioxidant effects on grease microstructures. Ind. Crops Prod. 2005, 21, 285–291. [Google Scholar] [CrossRef]
- Zhou, Y.; Bosman, R.; Lugt, P.M. A Model for Shear Degradation of Lithium Soap Grease at Ambient Temperature. Tribol. Trans. 2018, 61, 61–70. [Google Scholar] [CrossRef]
- Zhou, Y.; Lugt, P.; Bosman, R. An Experimental Study on Film Thickness in a Rolling Bearing for Fresh and Mechanically Aged Lubricating Greases. Tribol. Trans. 2019, 62, 557–566. [Google Scholar]
- Cyriac, F.; Lugt, P.M.; Bosman, R.; Padberg, C.J.; Venner, C.H. Effect of Thickener Particle Geometry and Concentration on the Grease EHL Film Thickness at Medium Speeds. In Tribology Letters; Springer: Berlin/Heidelberg, Germany, 2015. [Google Scholar]
- Kuhlmann, J. Tribologische Eigenschaften von Wälzlagerschmierfetten bei Dauerhaft Niedrigen Betriebstemperaturen. Doctoral Dissertation, Gottfried Wilhelm-Leibniz-Universität Hannover, Hannover, Germany, 2009. [Google Scholar]
- Komba, E.H.; Massi, F.; Bouscharain, N.; le Jeune, G. Experimental damage analysis in high loaded oscillating bearings. Tribol. Int. 2016, 102, 507–515. [Google Scholar] [CrossRef]
- Liu, M.; Slabka, I. DGMK-Forschungsbericht 810-Vorhersage der Eignung von Wälzlagerfetten in der Robotertechnik; DGMK e.V.: Hamburge, Germany, 2021; ISBN 978-3-947716-32-6. [Google Scholar]
- David, K.; Petr, S.; Jakub, C.; Petr, V.; Marian, P.; Ivan, K. Comparison of Grease and Solid Lubrication of Rolling Bearings Under Small-Stroke Reciprocation for Space Applications. Tribol. Ind. 2020, 42, 146–158. [Google Scholar] [CrossRef]
- Wandel, S.; Bader, N.; Schwack, F.; Glodowski, J.; Lehnhardt, B.; Poll, G. Starvation and Relubrication Mechanisms in Grease Lubricated Oscillating Bearings. Tribol. Int. 2022, 165, 107276. [Google Scholar] [CrossRef]
- DIN 51817; Prüfung von Schmierstoffen–Bestimmung der Ölabscheidung aus Schmierfetten unter Statischen Bedingungen. German Institute for Standardization, Beuth Verlag GmbH: Berlin, Germany, 2014.
- Nogi, T.; Soma, M.; Dong, D. Numerical Analysis of Grease Film Thickness and Thickener Concentration in elastohydrodynamic Lubrication of Point Contacts. Tribol. Trans. 2020, 63, 924–934. [Google Scholar] [CrossRef]
- Acar, N.; Kuhn, E.; Franco, J.M. Tribological and rheological characterization of new completely biogenic lubricating greases—A comparative experimental investigation. Lubricants 2018, 6, 45. [Google Scholar] [CrossRef] [Green Version]
- Kuhn, E. Zur Tribologie der Schmierfette-Eine Energetische Betrachtungsweise des Reibungs- und Verschleißprozesses, 2.; neu Bearbeitete und Erweiterte Auflage; Expert Verlag: Renningen, Germany, 2017. [Google Scholar]
- Mezger, T.G. The Rheology Handbook, 4th ed.; Vincentz-Network: Hannover, Germany, 2014. [Google Scholar]
- Rieling, T. Squeezetests and Tacktests-Raising Rheometry Applications for Lubricating Greases. In Proceedings of the 16th Arnold-Tross Colloquium, Hamburg, Germany, 11 June 2021. [Google Scholar]
- Georgiou, E.P.; Drees, D.; De Bilde, M.; Anderson, M.; Carlstedt, M.; Mollenhauer, O. Quantification of Tackiness of a Grease–The Road to a Method. Lubricants 2021, 9, 32. [Google Scholar] [CrossRef]
- Becker, D.; Rollman, J. Abschlussbericht-Reibkorrosionsverhalten von Schwenkend Betriebenen Großwälzlagern in Windenergieanlagen; Claustha: Zellerfeld, Germany, 2010. [Google Scholar]
- Cann, P.M.E.; Lubrecht, A.A. Bearing performance limits with grease lubrication: The interaction of bearing design, operating conditions and grease Properties. J. Phys. D Appl. Phys. 2007, 40, 18. [Google Scholar] [CrossRef]
- Lugt, P. A Review on Grease Lubrication in rolling Bearings. Tribol. Trans. 2009, 52, 470–480. [Google Scholar] [CrossRef]
- Litters, T.; Koch, B. Einfluss der Basisölpolarität auf das viskoelastische Verhalten von Schmierfetten; GfT-Tagung: Göttingen, Germany, 2008. [Google Scholar]


| Grease Sample | NLGI | Base Oil | Base Oil Viscosity in cSt | 30° 1 Hz 2 kN | 30° 5 Hz 2 kN | 90° 5 Hz 2 kN | 90° 1 Hz 2 kN |
|---|---|---|---|---|---|---|---|
| Grease 1 | 1 | MIN | 50 | + | − | + | + |
| Grease 2 | 2 | MIN | 50 | − | − | − | + |
| Grease 3 | 1 | MIN | 100 | + | − | + | + |
| Grease 4 | 2 | MIN | 100 | − | − | + | + |
| Grease 5 | 1 | PAO | 50 | + | − | + | + |
| Grease 6 | 2 | PAO | 50 | − | − | − | + |
| Grease Sample | Thickener (%) | NLGI | Base Oil | Base Oil Viscosity in cSt | Roll Stability (Difference 0.1 mm) | Oil Separation Rate [22] |
|---|---|---|---|---|---|---|
| Grease 1 | Li (7.9) | 1 | MIN | 50 | 106 | 2.342% |
| Grease 2 | Li (9.5) | 2 | MIN | 50 | 87 | 1.339% |
| Grease 3 | Li (8.06) | 1 | MIN | 100 | 135 | 1.549% |
| Grease 4 | Li (9.48) | 2 | MIN | 100 | 105 | 3.020% |
| Grease 5 | Li (7.5) | 1 | PAO | 50 | 75 | 5.608% |
| Grease 6 | Li (10.5) | 2 | PAO | 50 | 98 | 1.103% |
| Experimental Parameter | Parameter Value |
|---|---|
| Amplitude pulser-load (sine-wave shape) | ±23.3 kN (5 rolling elements) |
| Max contact pressure | around 3000 MPa in inner ring |
| Frequency of swing | 7 Hz (length of a test: 43 h) |
| Number of load cycles | 1.1 million |
| Operating temperature | 20 °C |
| Filling degree of grease | Full filling |
| Swing angle | ±4.6° |
Publisher’s Note: MDPI stays neutral with regard to jurisdictional claims in published maps and institutional affiliations. |
© 2022 by the authors. Licensee MDPI, Basel, Switzerland. This article is an open access article distributed under the terms and conditions of the Creative Commons Attribution (CC BY) license (https://creativecommons.org/licenses/by/4.0/).
Share and Cite
Slabka, I.; Henniger, S.; Kücükkaya, D.; Dawoud, M.; Schwarze, H. Influence of Rheological Properties of Lithium Greases on Operating Behavior in Oscillating Rolling Bearings at a Small Swivel Angle. Lubricants 2022, 10, 163. https://0-doi-org.brum.beds.ac.uk/10.3390/lubricants10070163
Slabka I, Henniger S, Kücükkaya D, Dawoud M, Schwarze H. Influence of Rheological Properties of Lithium Greases on Operating Behavior in Oscillating Rolling Bearings at a Small Swivel Angle. Lubricants. 2022; 10(7):163. https://0-doi-org.brum.beds.ac.uk/10.3390/lubricants10070163
Chicago/Turabian StyleSlabka, Iryna, Sören Henniger, David Kücükkaya, Michael Dawoud, and Hubert Schwarze. 2022. "Influence of Rheological Properties of Lithium Greases on Operating Behavior in Oscillating Rolling Bearings at a Small Swivel Angle" Lubricants 10, no. 7: 163. https://0-doi-org.brum.beds.ac.uk/10.3390/lubricants10070163