1. Introduction
To improve fuel economy and, in particular, the overall mechanical efficiency, the determination of the friction losses of combustion engines is a crucial topic in modern engine development. Based on current challenges for manufacturers including stricter CO2 emission limits from the legislative side, changing customer preferences (away from product towards function, e.g., car sharing and car rental) and a general focus on the environmental impact, it is nowadays crucial to develop highly efficient vehicles.
Especially for vehicles using internal combustion engines (ICE) which currently deal with bad public reputation due to the Diesel emission scandal, it is very important to present results on how to cut fuel consumption and to limit the exhaust gas emissions. The minimization of the mechanical losses provide a significant contribution to high efficiency vehicles nowadays as well as in the foreseeable future [
1]. Measures to reduce the mechanical losses also often show advantages in terms of financial investments compared to hybridization and subsequently increases the overall efficiency of hybrid vehicles [
2].
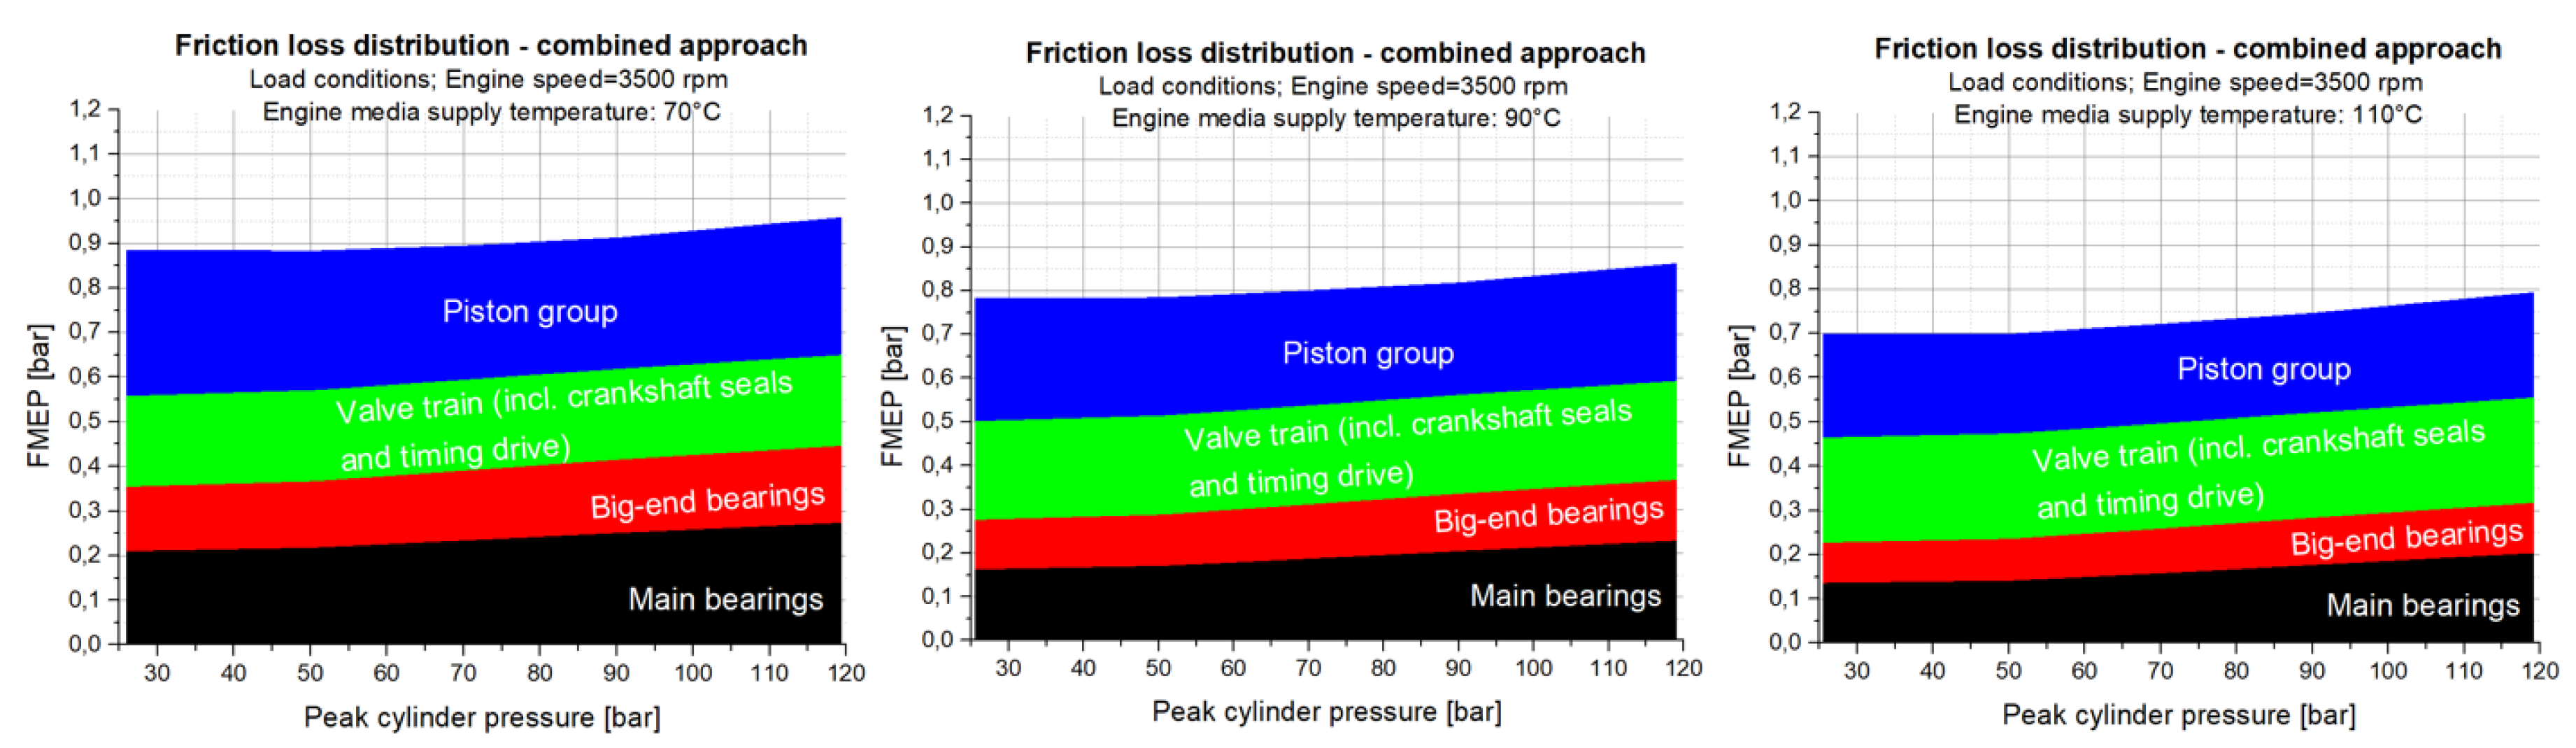
In internal combustion engines, the frictional losses of the base engine are generated by the subassemblies’ piston group, crankshaft journal bearings, valve train, timing drive, and shaft seals. This means that friction reduction on these key assemblies continue to represent a significant goal for the development of low-friction base engines. Also, for the first calculations in the concept phase of engine development using empirical friction models [
3,
4,
5], experimental data for the subassemblies, e.g., of the piston group, under realistic operation conditions is required. Furthermore, the need of advanced lubricant models including the non-Newtonian behaviour and of closer attention to the thermal conditions in the engine when developing engine friction models has been reported in the past [
6]. Nowadays, the assessment and assignment of the engine friction losses to the subassemblies is generally done by fired and motored friction tests. Each mentioned measuring method has its area of application with its corresponding advantages and challenges which are briefly described below.
While an engine friction measurement in a fired operation is ideal because of the conventional thermal boundary condition as well as the correct cylinder pressure phasing and gradient, it is challenging to maintain the stability of the engine operation and the repeatability which is required for accurate measurements. Due to the combustion process, one is faced with strongly varying cylinder pressures from cycle to cycle. Furthermore, the inherently high indicated power produces highly alternating torques at the crankshaft. Therefore, a torque transducer with a much larger measurement range is required for a fired operation compared to a motored operation. In References [
7,
8] an overall methodology is presented which covers a systematic testing procedure from the calibration of the measurement chain to the exact measurement workflows to gain the highest possible repeatability of the conducted tests. Nevertheless, cyclic variations and necessary bigger torque transducer measurement ranges have to be accepted. The developed and used friction measuring module in Reference [
8] needs to be specifically designed for the engines put to test. Furthermore, a fired engine operation also has an influence on the used pressure sensors of the cylinder pressure measurement system. Especially, the hysteresis effects during the conducted tests needs to be accounted [
8], and the usage of cooled pressure sensors is necessary.
Single-cylinder test beds using the floating-liner principle, on the other hand, are commonly used for direct friction force measurements on the cylinder liner caused by the piston group under fired conditions. One main drawback is the missing possibility to use the conventional crank train of multicylinder engines. The methodology also has to deal with different boundary conditions like limited cylinder pressures, vibrations disturbing the force measurement signals, and stronger cylinder bore distortions due to the design of the test rig. However, in the last years, improvements have been made regarding the sealing system between the floating liner and the cylinder head, and therefore, higher cylinder pressures can be reached. Also, the difference in bore distortions has been minimized in the past using complex measurement and specific honing processes to reach comparable cylinder profiles as in conventional engines [
9]. All improvements to enhance the function of the single-cylinder test bed result in high efforts on design and measurement requirements.
The application of conventionally motored (without external charging) engine tests results in a reduced complexity of the test rig due to the missing fuel system. However, very different thermal boundary conditions as well as the absence of a strong cylinder pressure acting on the pistons and bearings are affecting the friction results from these tests. External charging is able to create a mechanical load on the engine that is comparable to a fired operation as well as can be used to create thermal conditions in the engine that is more similar to a fired operation than it is for conventional motored tests. Although the basic principle of motoring friction tests with external charging is known from the past [
10,
11], it came up again recently and is currently investigated [
12]. Also, developments improving the thermal boundary conditions and reaching comparable load characteristics to a firing operation [
13] have been achieved [
14,
15].
The major advantages of pressurized motoring tests are a significantly higher measurement accuracy due to a strongly reduced indicated mean effective pressure (IMEP; about factor 4 in comparison to a fired operation) and highly stable testing boundary conditions. The cycle-to-cycle cylinder pressure variations in a charged motoring operation are insignificant compared to the fired operation. Therefore, torque transducers with a much smaller measurement range and, consequently, a much higher measurement accuracy can be realized. The external charging is generally realized by supplying pressurized air or inert gases (e.g., nitrogen) to the engine intake. Due to the intrinsic compression of the engine, peak cylinder pressures can be reached which correspond to a conventional fired operation. By using a pressure control valve, the peak cylinder pressure representing the load of the engine can be controlled in a highly variable way which represents an engine operation in part and full load conditions. In contrast to a fired operation, the following limitations are assigned with a pressurized motoring: On the one hand, the position of the maximum cylinder pressure is always very close to the top dead center position of the engine. However, for diesel engines at full load, the resulting position of the pressure maximum occurs about +10
CA (CA: Crank angle) after TDC (Top dead center) which results in a good agreement between the fired and charged motoring tests when a mechanical load is the dominating factor [
15]. On the other hand, the thermal boundary conditions are different for the motoring test due to the missing thermal energy of the combustion processes. This limitation affects the results in particular at part load conditions when comparing the results from friction measurements in fired and pressurized motoring operation [
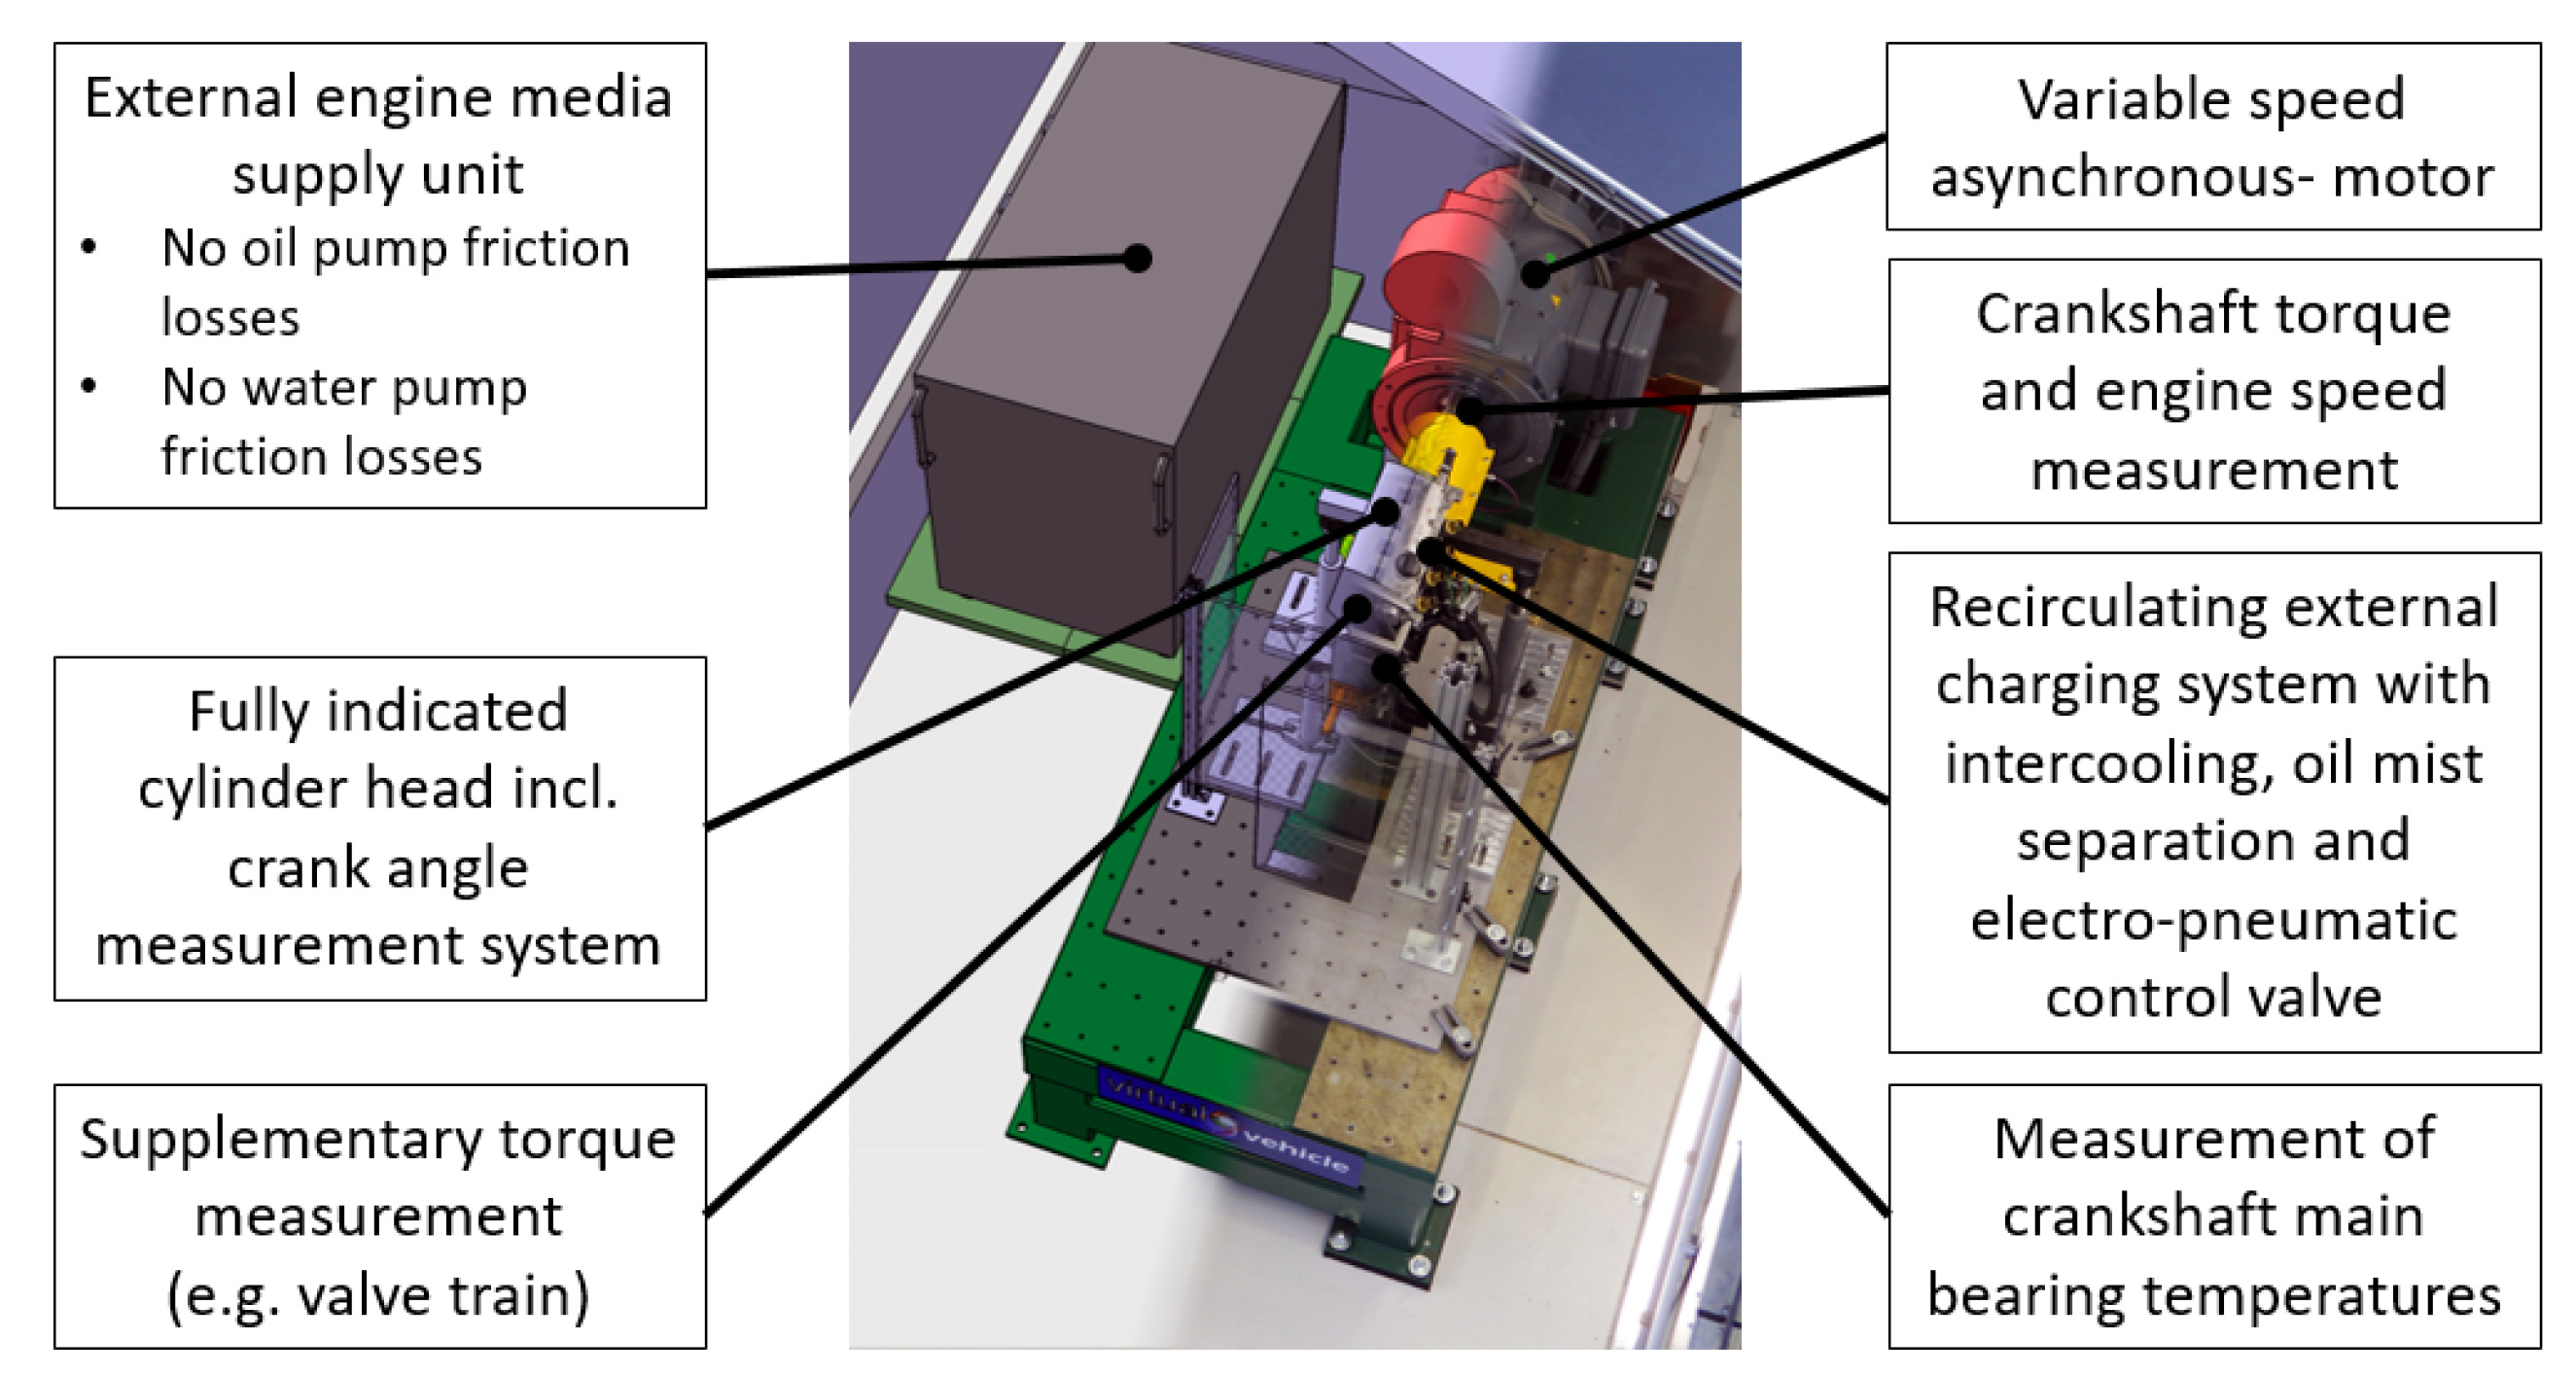
16]. To reduce the lack of thermal energy in the engine during the pressurized motoring test, the charging system can be designed as a recirculation system. Therefore, the engine exhaust is connected to the engine intake. This enables a great increase in the intake temperature of the pressurized air, which subsequently strongly increases the temperature during the compression stroke. This affects the thermal operating conditions especially for the piston group.
For the investigation of further friction reduction measures with the already good friction performance of today’s modern engines, methods and tools which can also dissolve and analyze small differences consistently over the operational range of the engines are necessary. To give an example, when analyzing the advantages of (ultra) low viscosity engine oils, deviations in the friction torque of 0.1 Nm have to be resolved over the entire engine operation range [
17]. The same can be stated when analyzing small contributors to the friction losses like the crankshaft seals. The highest requirements regarding measurement accuracy and testing workflow have to be met to achieve highly accurate results [
18].
Bringing together the advantages of both fields, simulation and testing, can result in new possibilities of analysing engine friction power losses. During the development process of a combined approach at the VIRTUAL VEHICLE Research Center, a friction analysis procedure has been defined which enables very good possibilities for comparisons of measures to reduce engine friction losses [
14,
15,
19]. The developed friction analysis approach combines the results of a detailed elasto-hydrodynamic journal-bearing simulation and charged motoring tests with air recirculation. Due to the combination of simulations and measurements, it is possible to analyses the friction performance of the crankshaft journal bearings, valve train, and piston assembly over the entire engine operation range.
This work presents the application of the developed combined approach using the analysis procedure to investigate the friction losses of a modern passenger-car diesel engine in great detail. The primary aim of the study is to analyse the friction losses of the base engine and its subassembly crankshaft journal bearings, valve train, and piston assembly for different thermal boundary conditions. Therefore, the supply temperatures of oil and cooling water are varied between 70 and 110 C. These additional investigations, in particular, at highest temperatures, allow for the potential identification of critical mixed lubrication in subassemblies. The secondary aim is a further breakdown of the friction losses by additional measurements. The individual contribution of the valve train, timing drive, crankshaft seals, and crankshaft main bearings are identified. The measurement of the crankshaft main bearings friction losses enable a verification of the utilization of the journal-bearing simulation approach in a crankshaft system which represents the tertiary aim of this work. The simulation approach was developed on the basis of journal-bearing test-rigs. In this study, the sole measurement of the journal-bearing losses enables a direct comparison with the journal-bearing simulation approach for the first time.
2. Friction Losses Analysing Procedure: A Combined Approach Using Experiments and Predictive Journal-Bearing Simulation
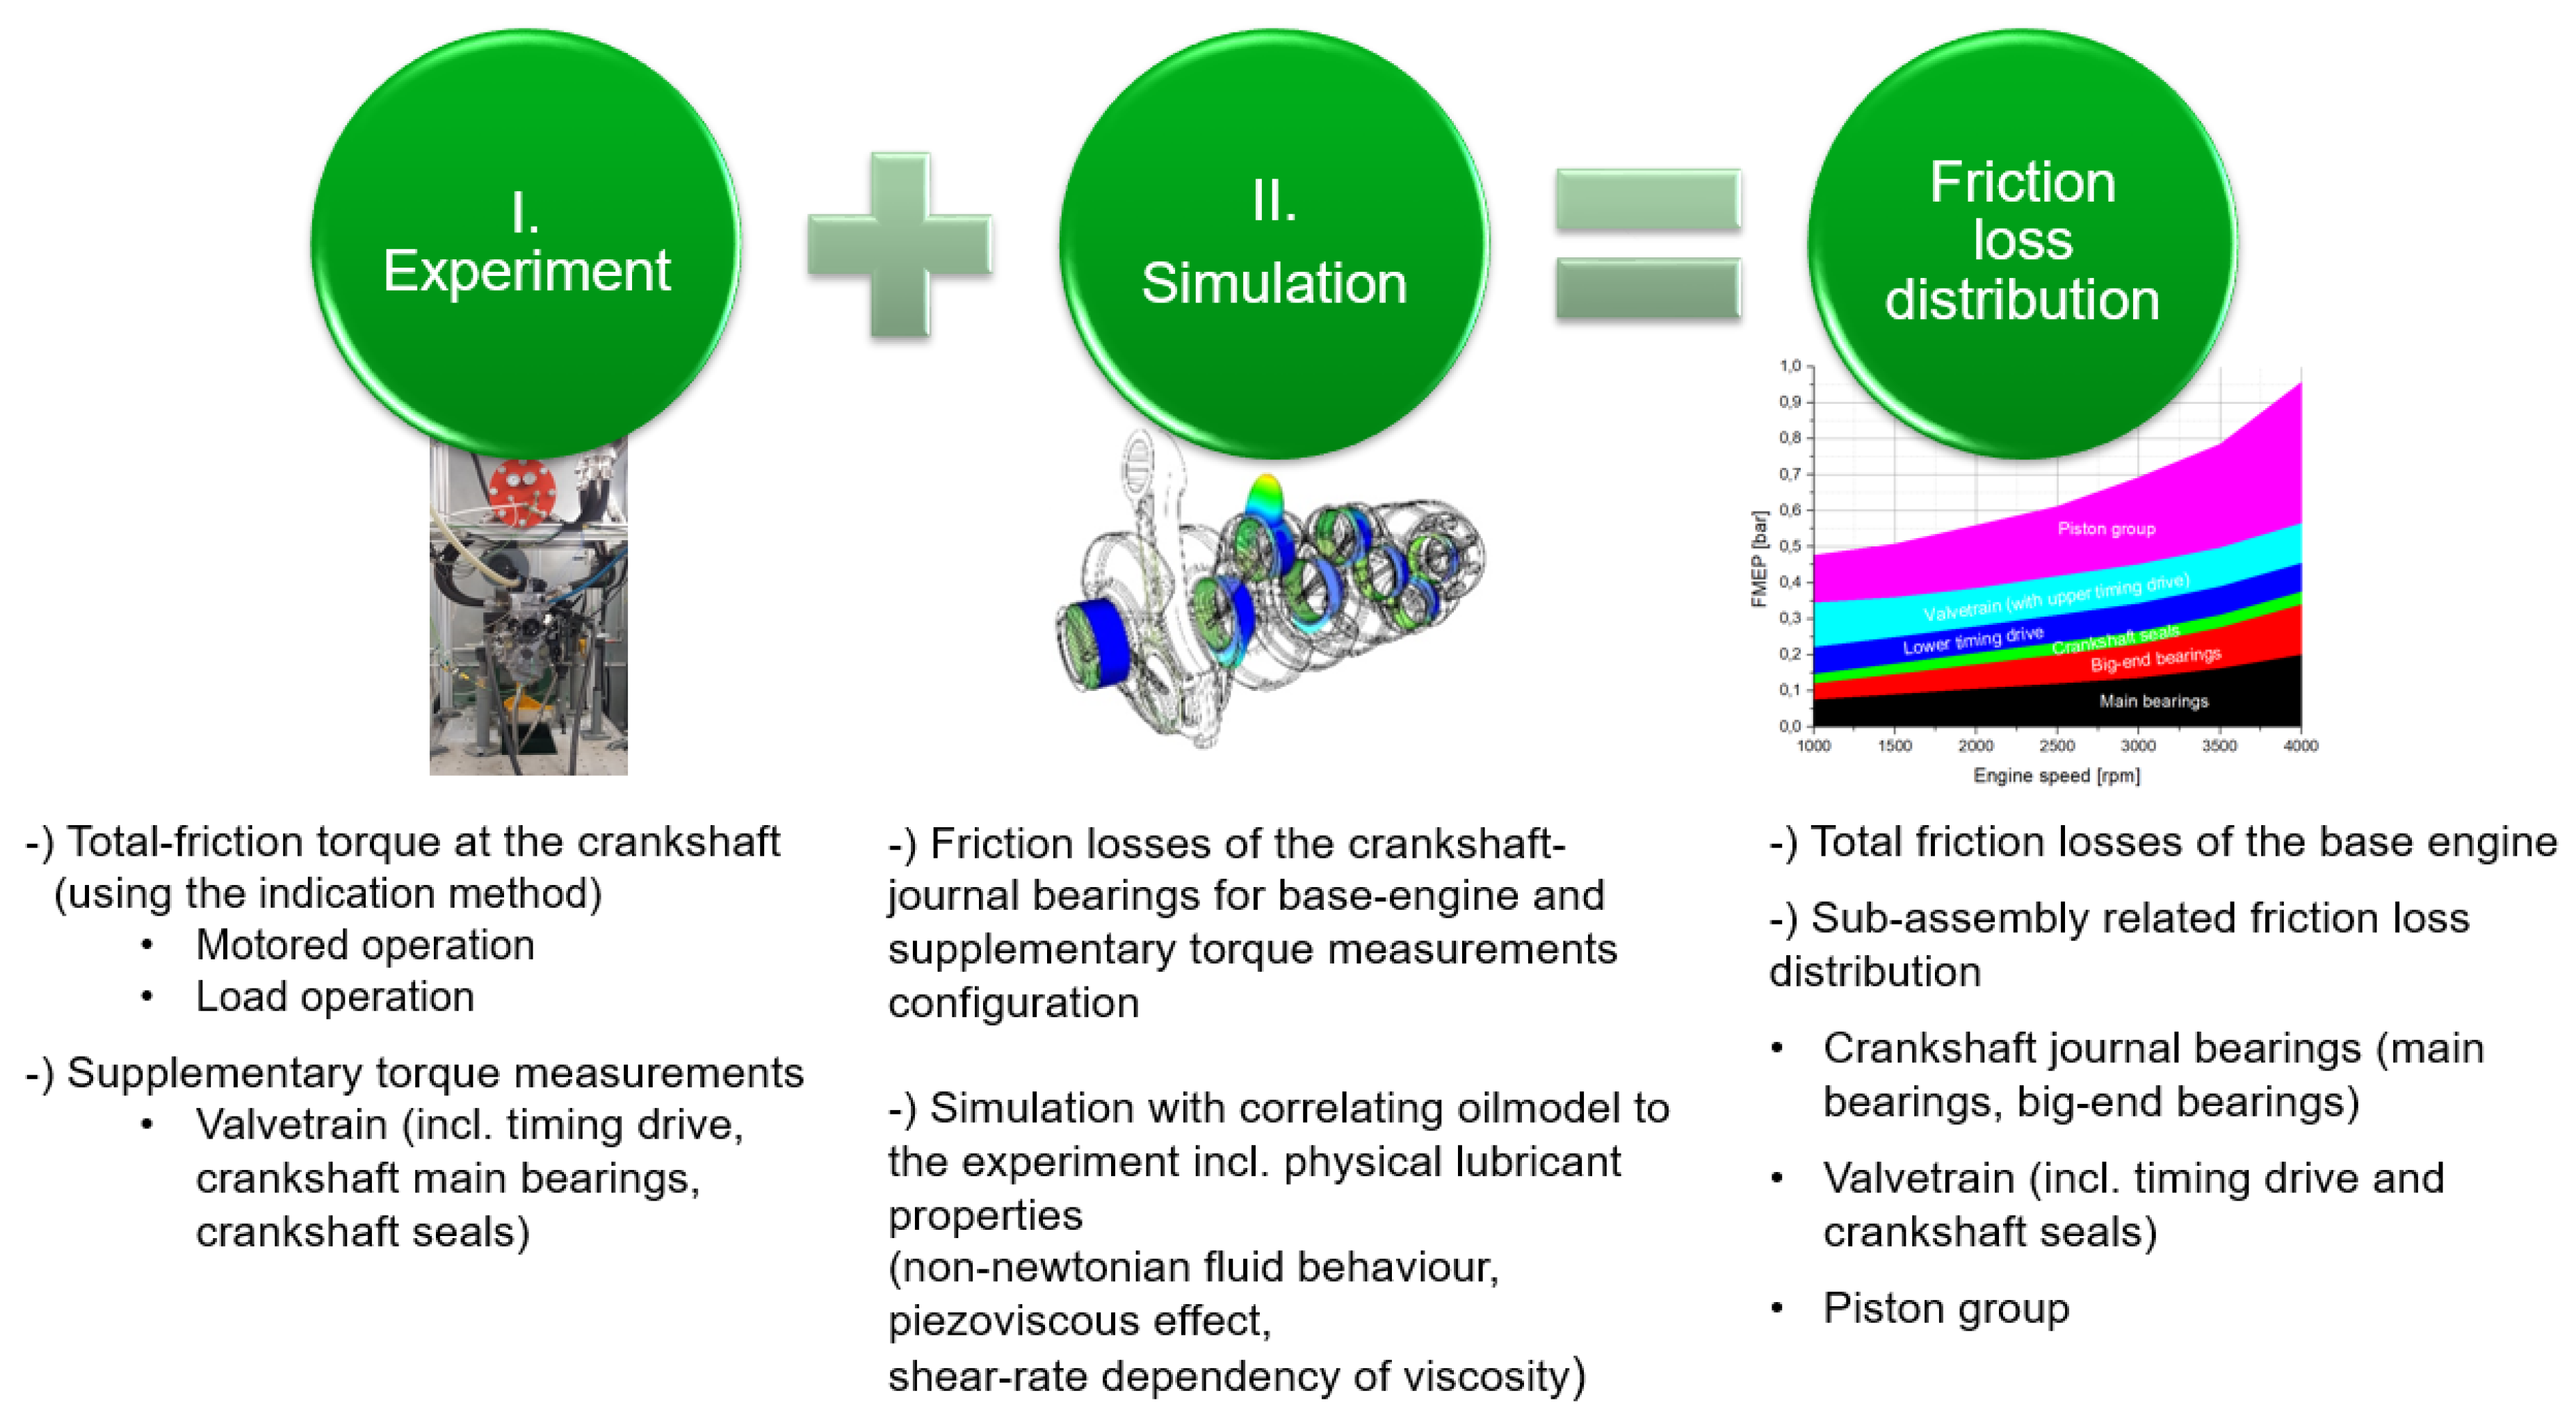
The aim of the developed friction loss analysis procedure is the determination of the friction power losses of the base engine for motored and load operations and the breakdown of these losses to the individual components’ crankshaft journal bearings, valve train (with timing drive and crankshaft seals), and piston group. For this purpose, an analysis approach combining motored engine test-bed measurements with external charging and a previously developed predictive and widely validated journal-bearing simulation method was developed. An overview of the developed approach is shown in
Figure 1.
The combined approach connects the experimental results with the calculated journal-bearing friction losses from simulation models. This results, on the one hand, in the determination of the base engine total friction losses and, on the other hand, in a subassembly resolved friction loss distribution over the full engine operation range (speed and load).
The measurements are conducted using the indication method (IMEP (Indicated mean effective pressure) method). By using the IMEP-method, the friction losses denoted as FMEP (Friction mean effective pressure) are determined by the subtraction of two similar sized large quantities, the IMEP and the BMEP (Brake mean effective pressure); see Equation (
1). For a motored operation, the signs of IMEP and BMEP are negative in comparison to a fired operation. The FMEP is, in comparison, a rather small quantity.
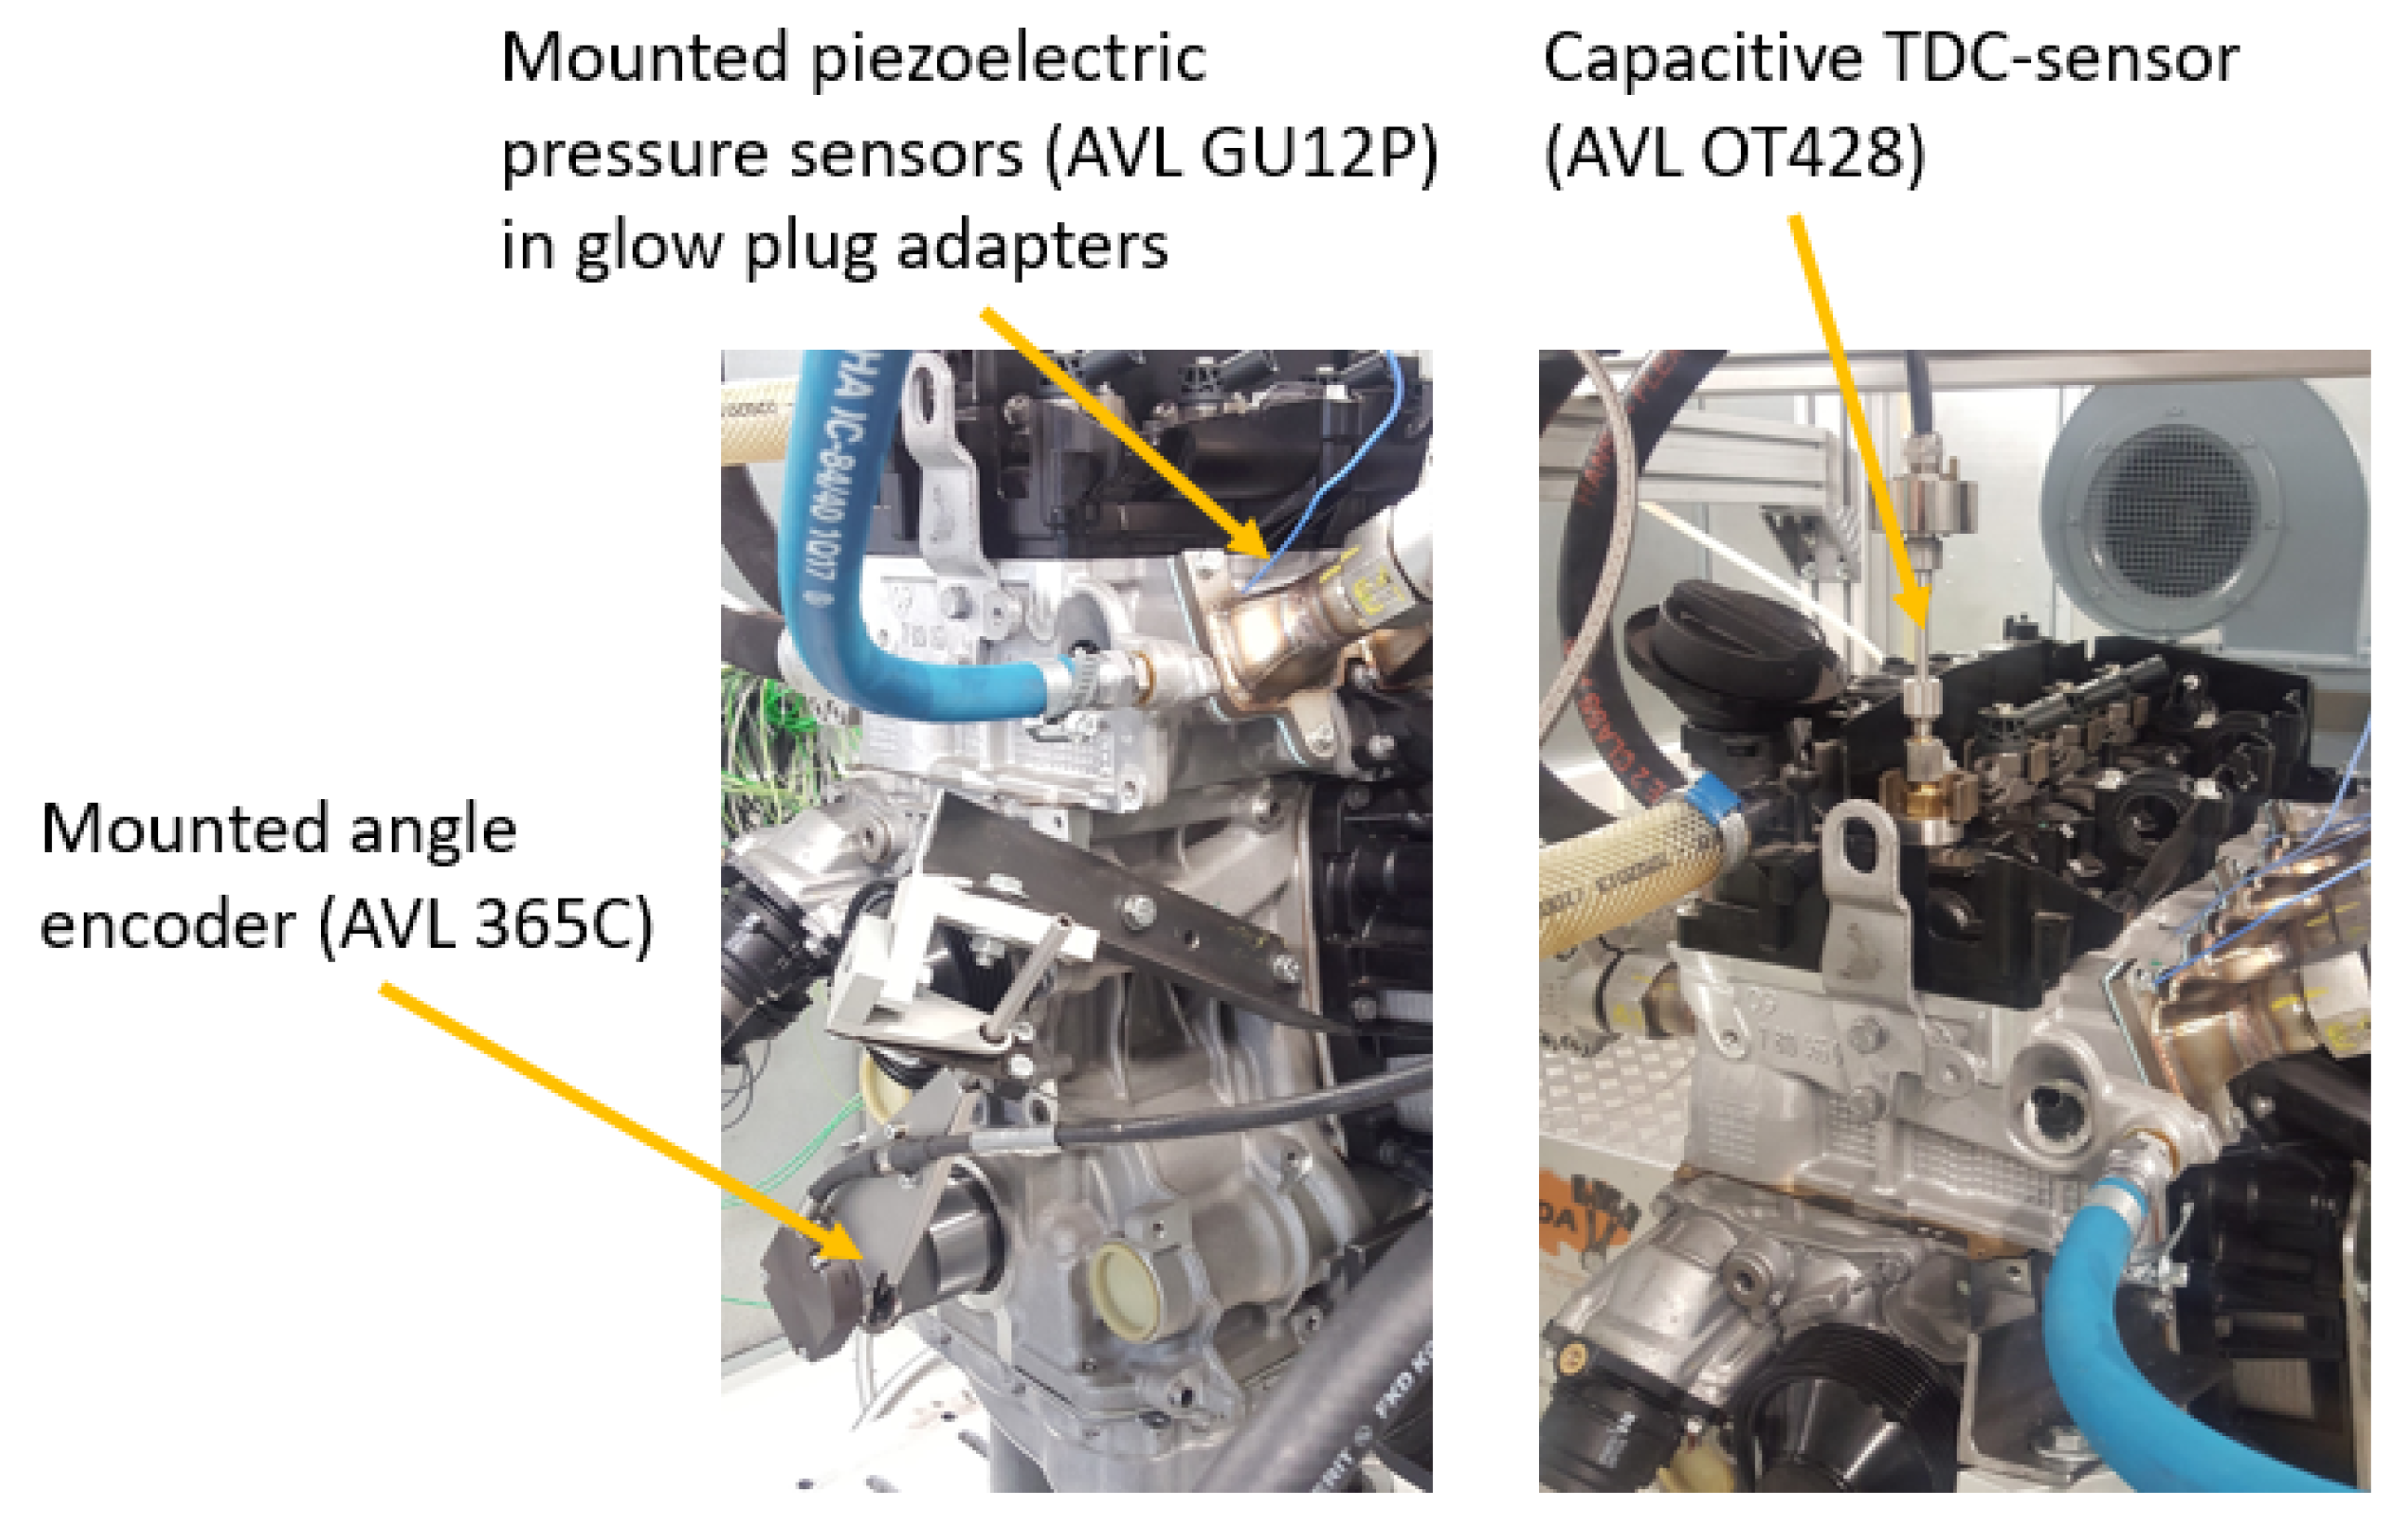
Therefore, great care needs to be taken in the determination of the IMEP and BMEP because any significant error in these large quantities can easily lead to a measurement error of the same magnitude as the calculated FMEP. The reduced IMEP (about factor 4 compared to the fired operation) when using charged motoring tests and insignificant cycle-to-cycle variations enable the usage of considerably smaller torque transducers and, therefore, an increased accuracy in BMEP determination. For an accurate IMEP determination, AVL List high-quality industry equipment for cylinder pressure measurements including a 720 ppr rotary encoder system is used. A corresponding calibration of the used measurement equipment is of great importance for reliable and accurate measurements.
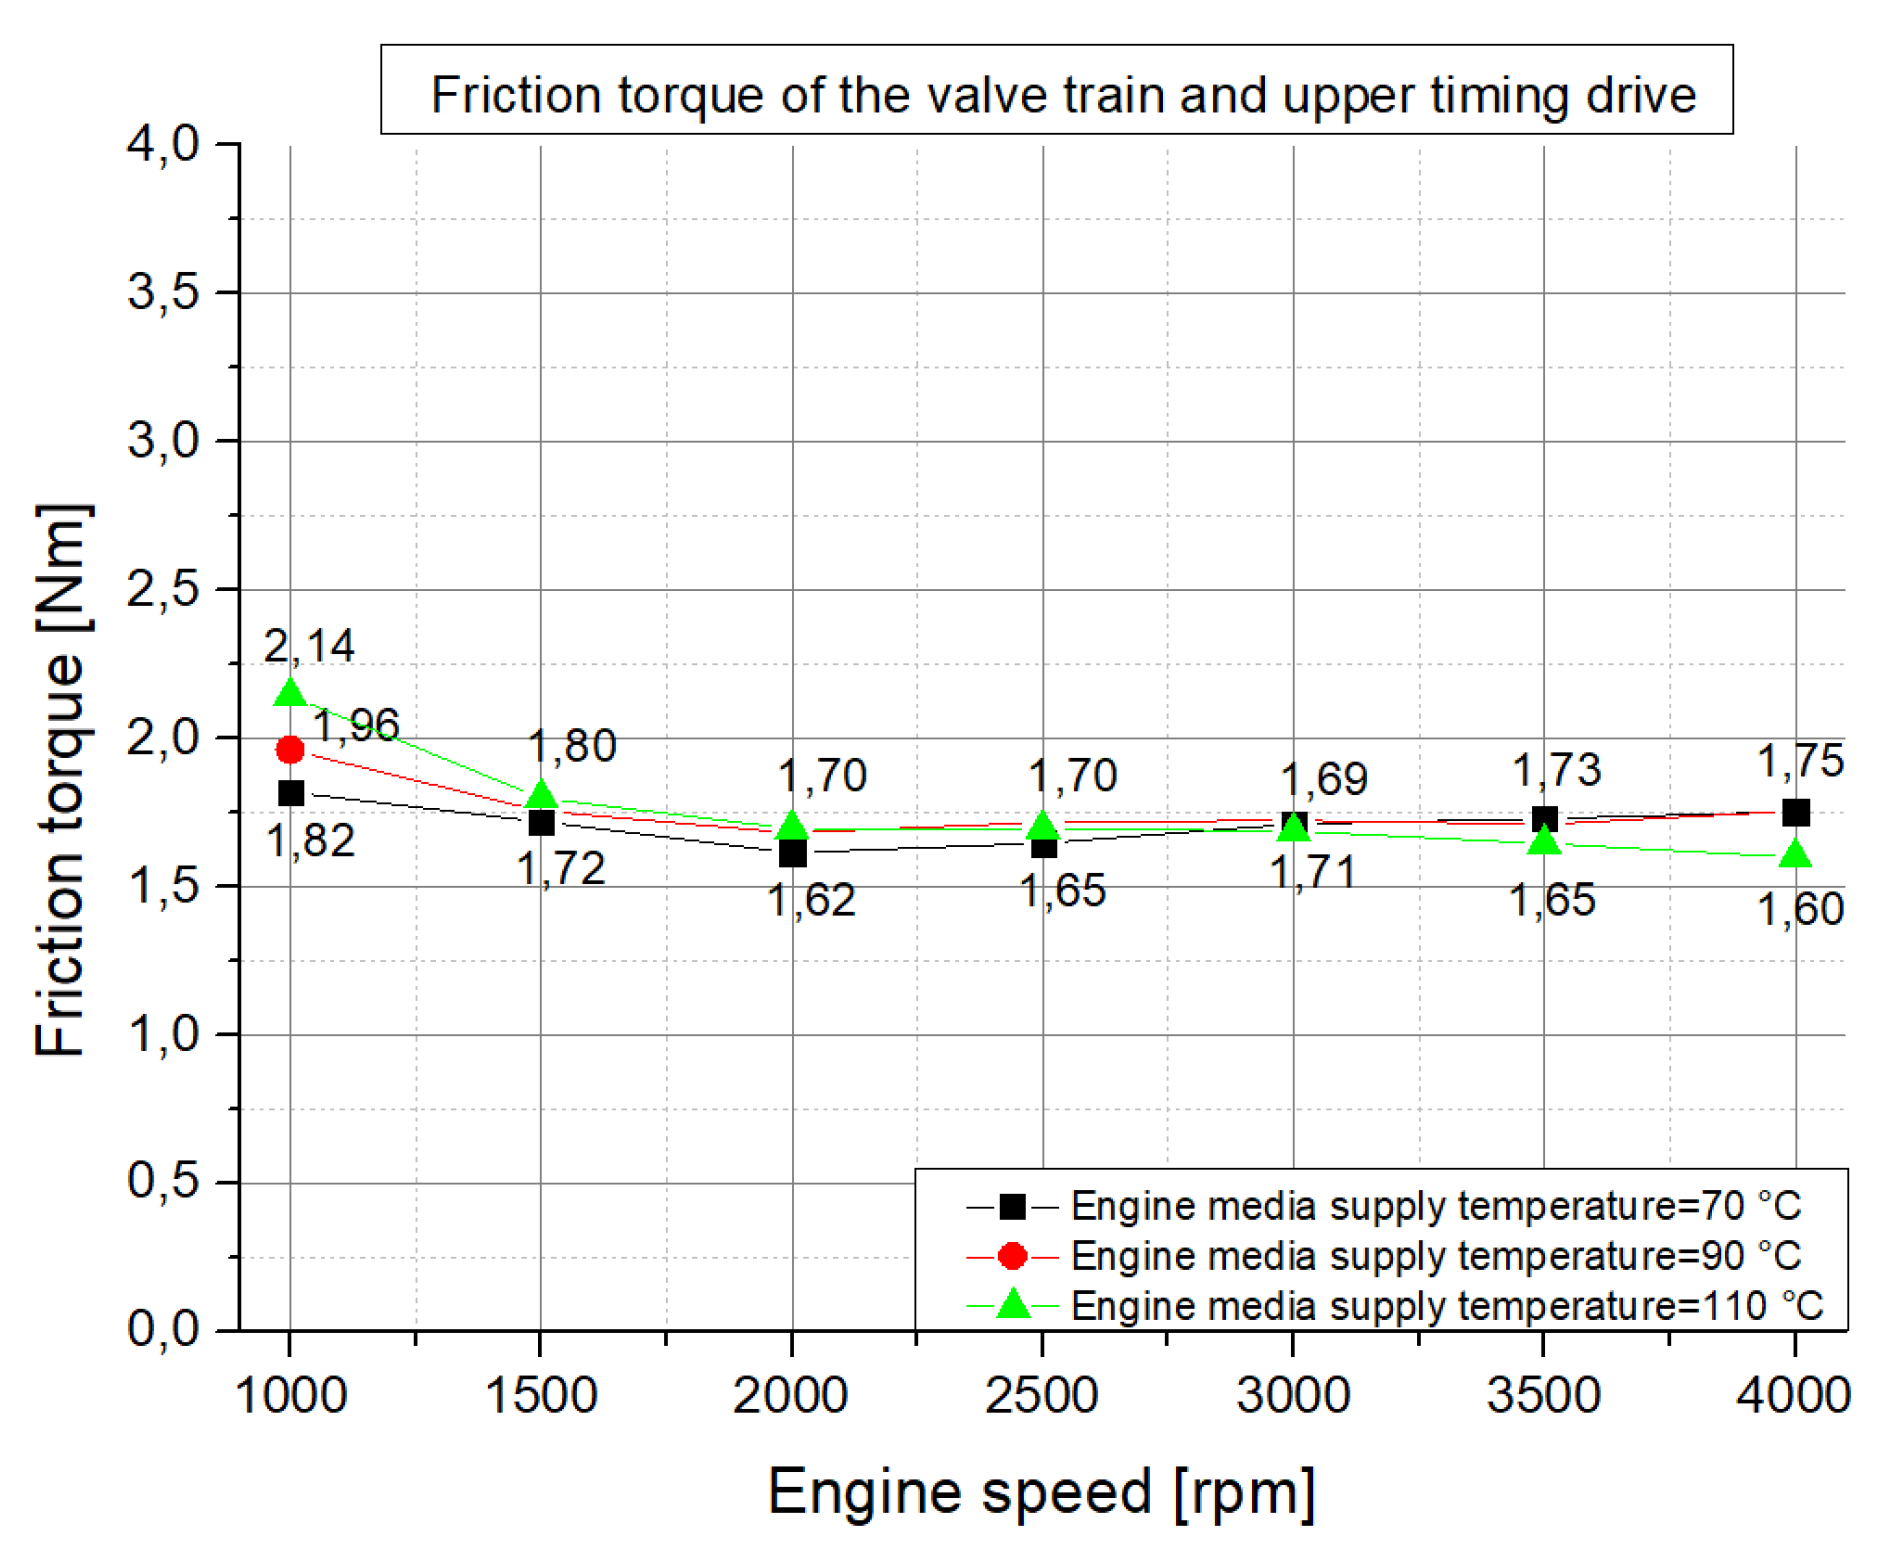
Valve train friction: In addition to the total base engine friction (FMEP) tests, supplementary friction measurements are done with removed pistons and conrods to obtain the friction torque of the valve train with timing drive and crankshaft seals.
The simulation of the journal bearing friction losses: The simulation method is discussed in detail in a later section (
Section 4). Here, only the basic applied scheme is outlined. The simulation is prepared in two steps: The first step uses the base-engine simulation model for the calculation of the main bearing and big-end bearing friction losses under the tested operating conditions. In the second step, a reduced engine model without pistons and conrods is used in combination with the supplementary torque measurements of the valve train friction. For detailed and accurate journal-bearing friction loss calculations, it is crucial to use lubricant models which correlate to the experiments and that describe closely the rheological properties of the used engine oil.
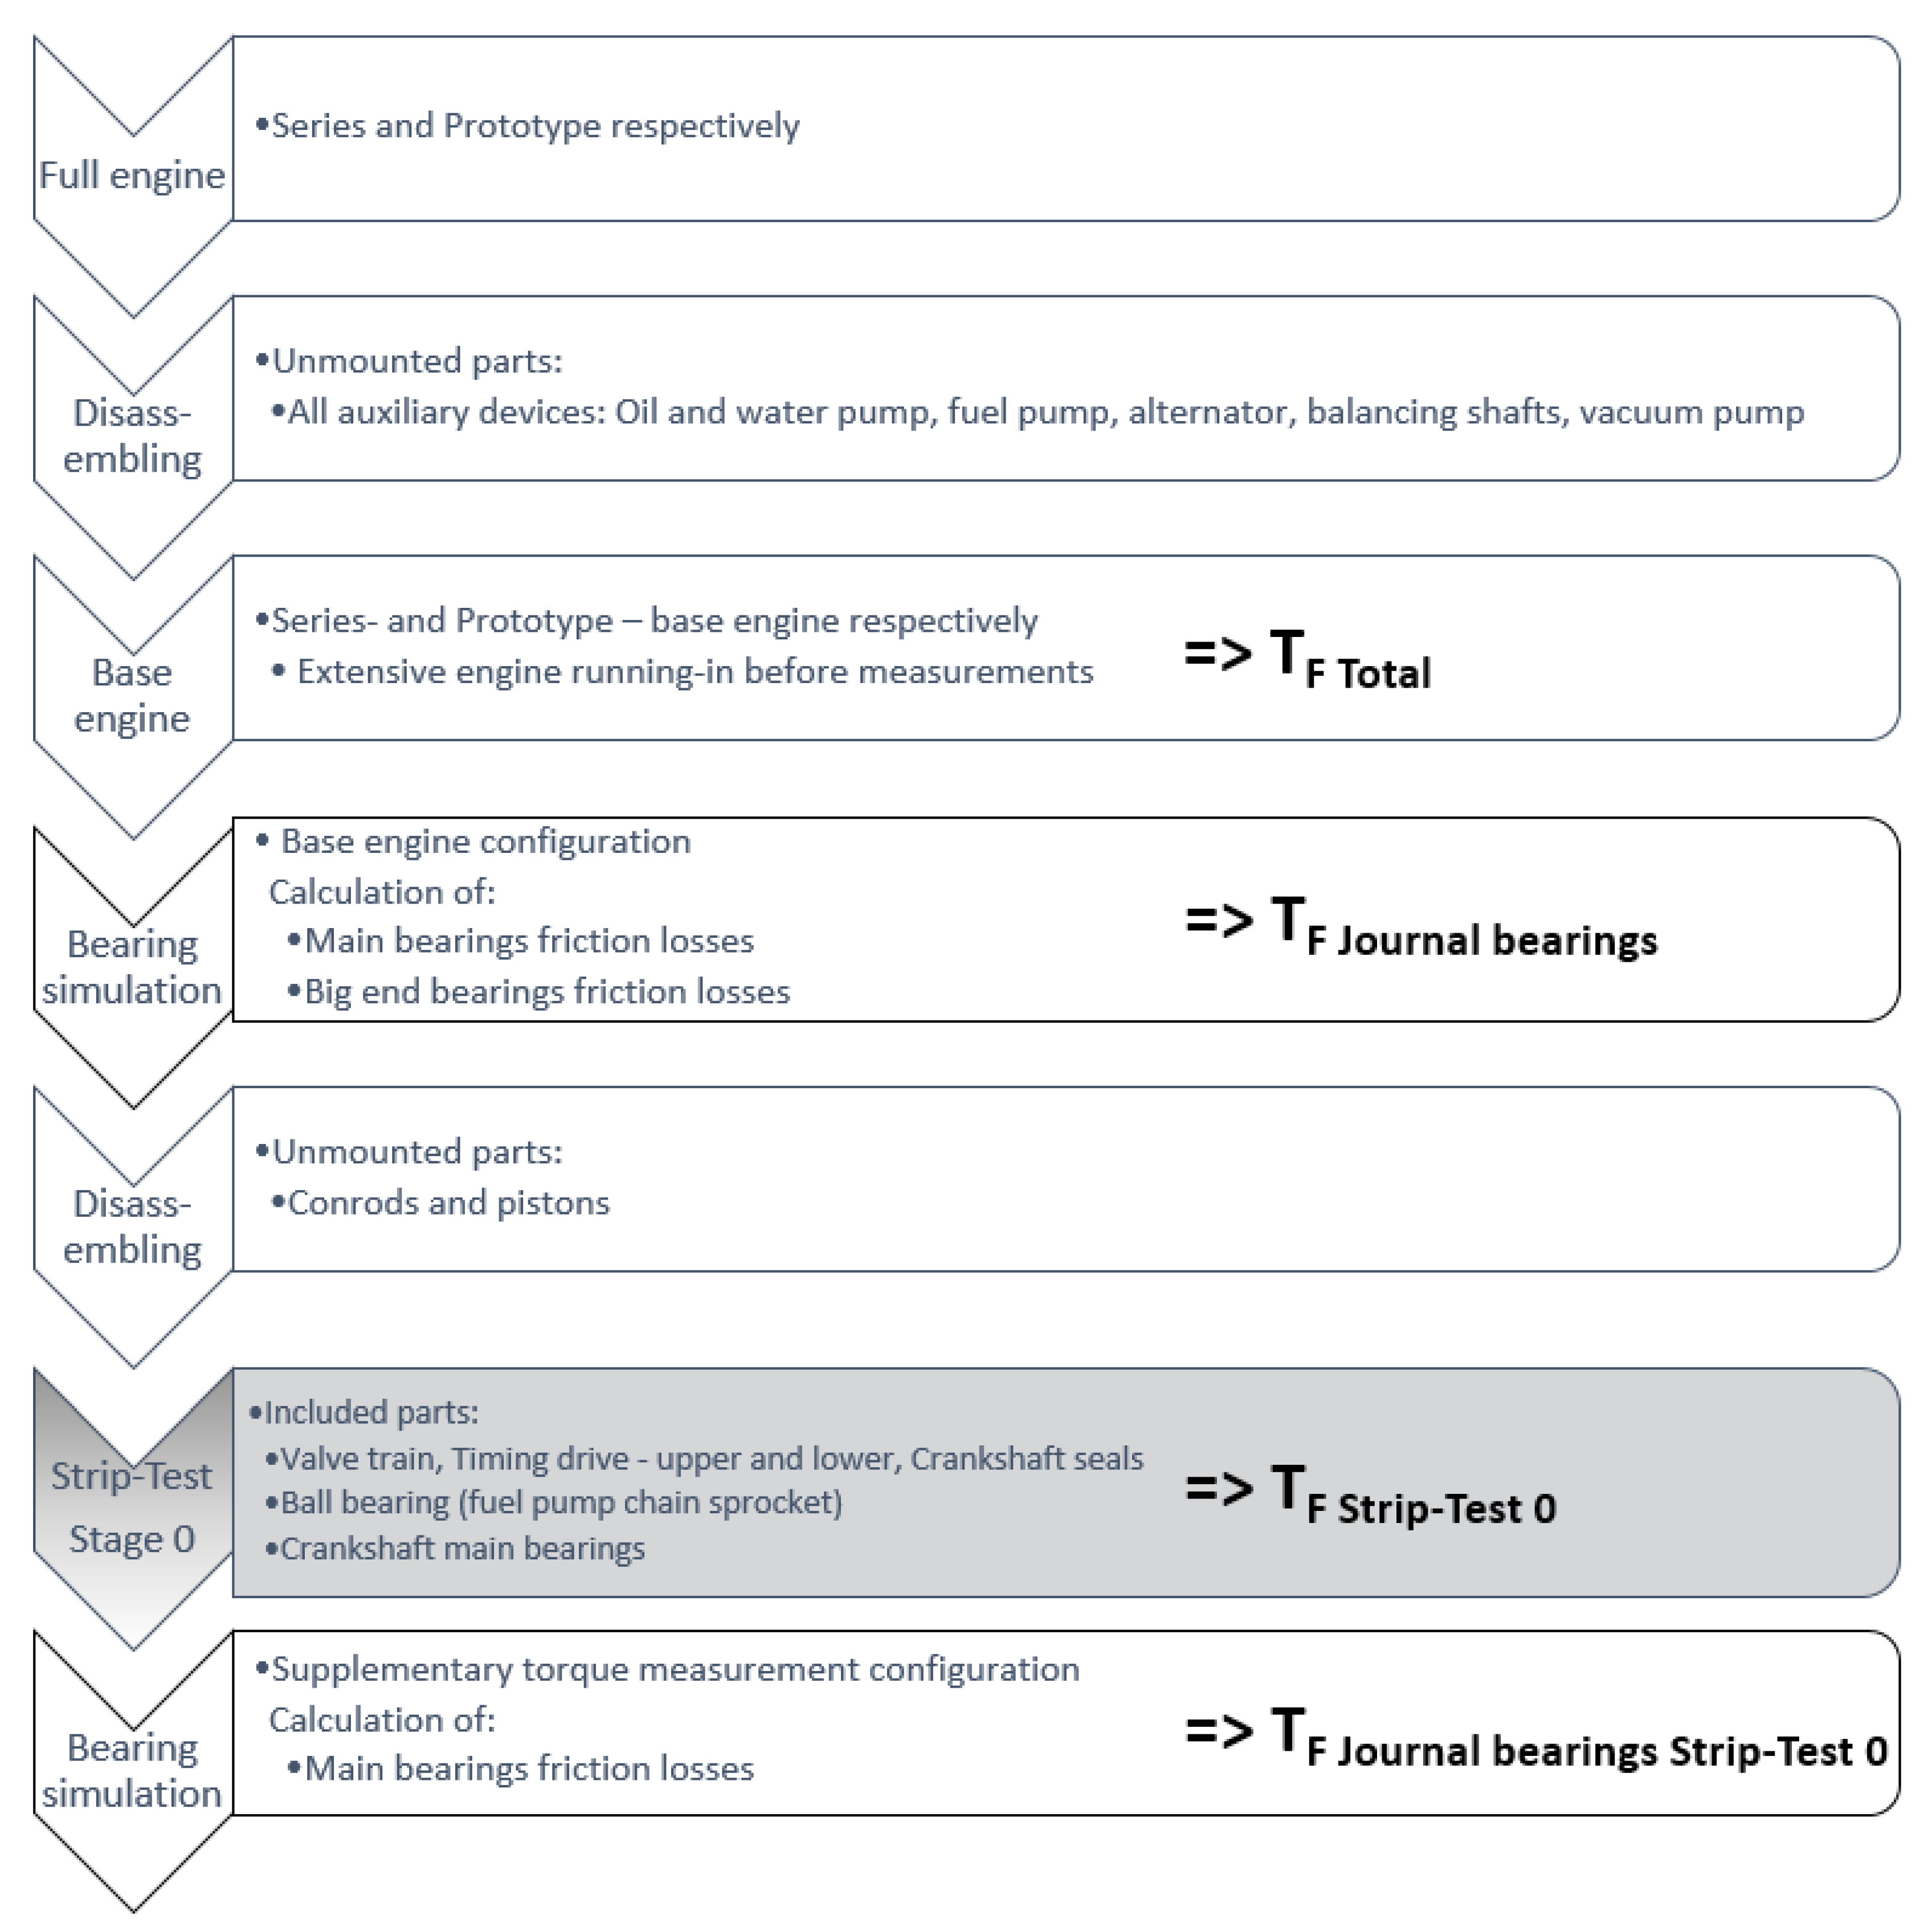
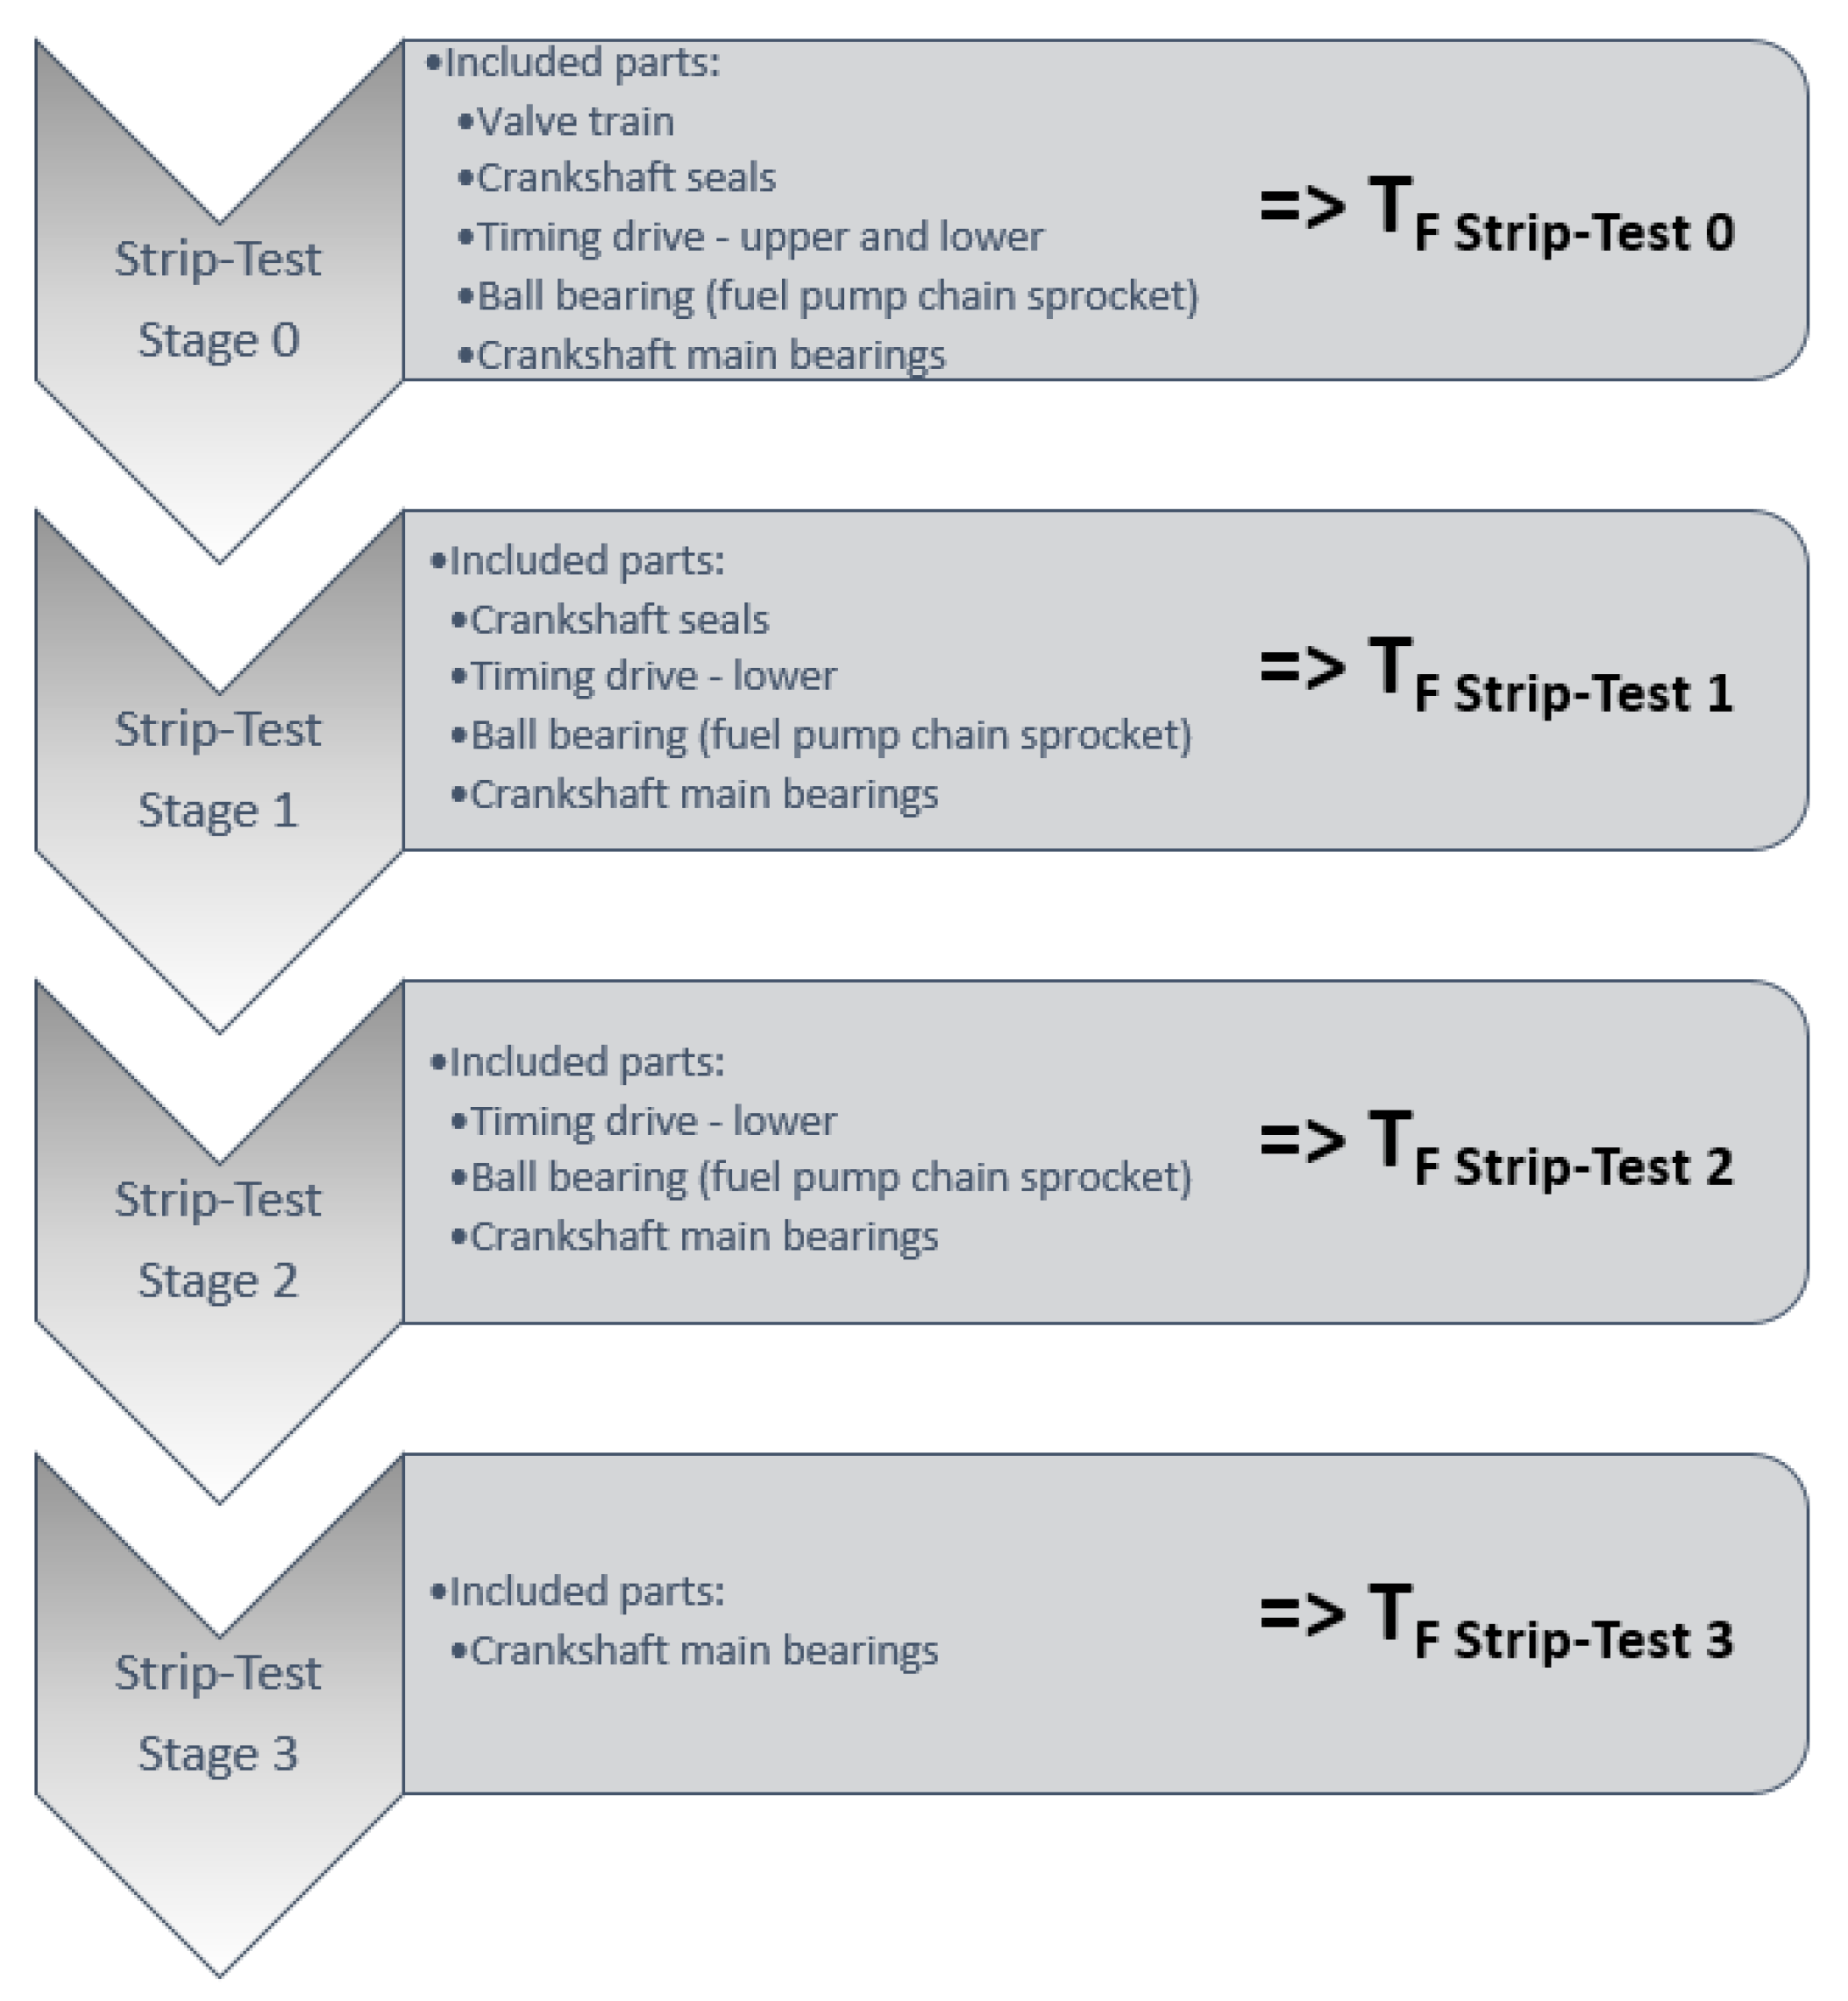
To determine the subassembly related friction loss distribution, the following workflow as shown in
Figure 2 is used.
The full engine is reduced to the base-engine configuration by removing or deactivating all engine auxiliary devices. This enables to full focus on the base engine friction losses during the friction loss investigations. Before the friction tests are conducted, an extensive running-in procedure is performed to account for the processes affecting the results [
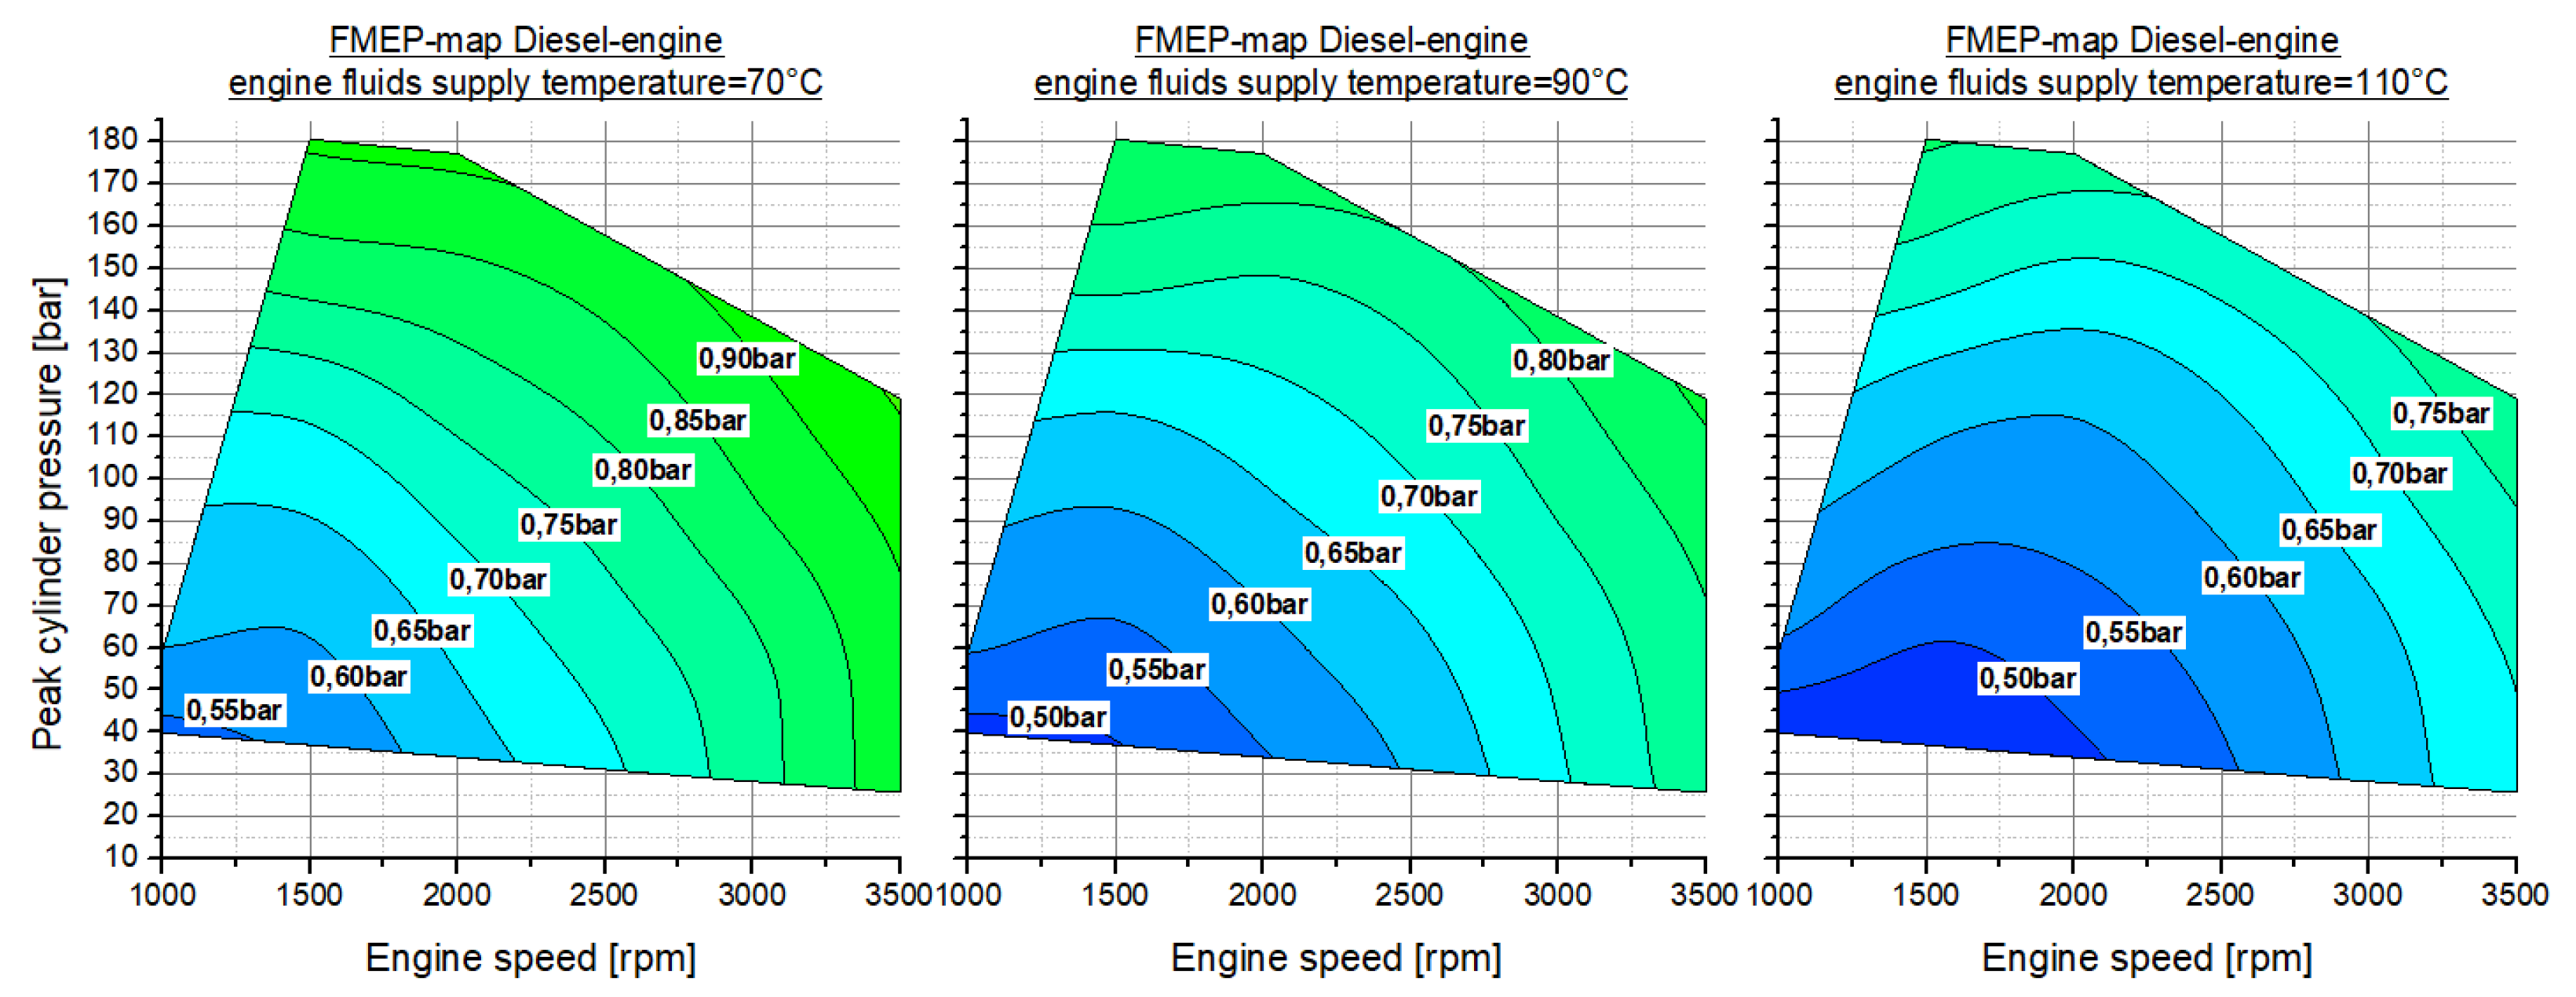
20]. The first measurements are then carried out on the base engine to obtain the engine friction map (
) over the entire load and speed range of interest. The engine friction map is typically measured at different engine media supply temperatures to analyse the influence of different thermal boundary conditions on the friction losses of the engine. Parallel to the experimental part, the journal-bearing simulation model of the base engine is created. Besides the detailed geometrical and mass data of the whole crank train, the interaction between the simulation model and the experiments consists of the cylinder pressure curves and engine speeds for the bearing load and the main bearing temperature measurement data for the journal-bearing simulation methodology. The total friction losses (hydrodynamic and asperity friction losses) of the crankshaft main- and big-end bearings are calculated (
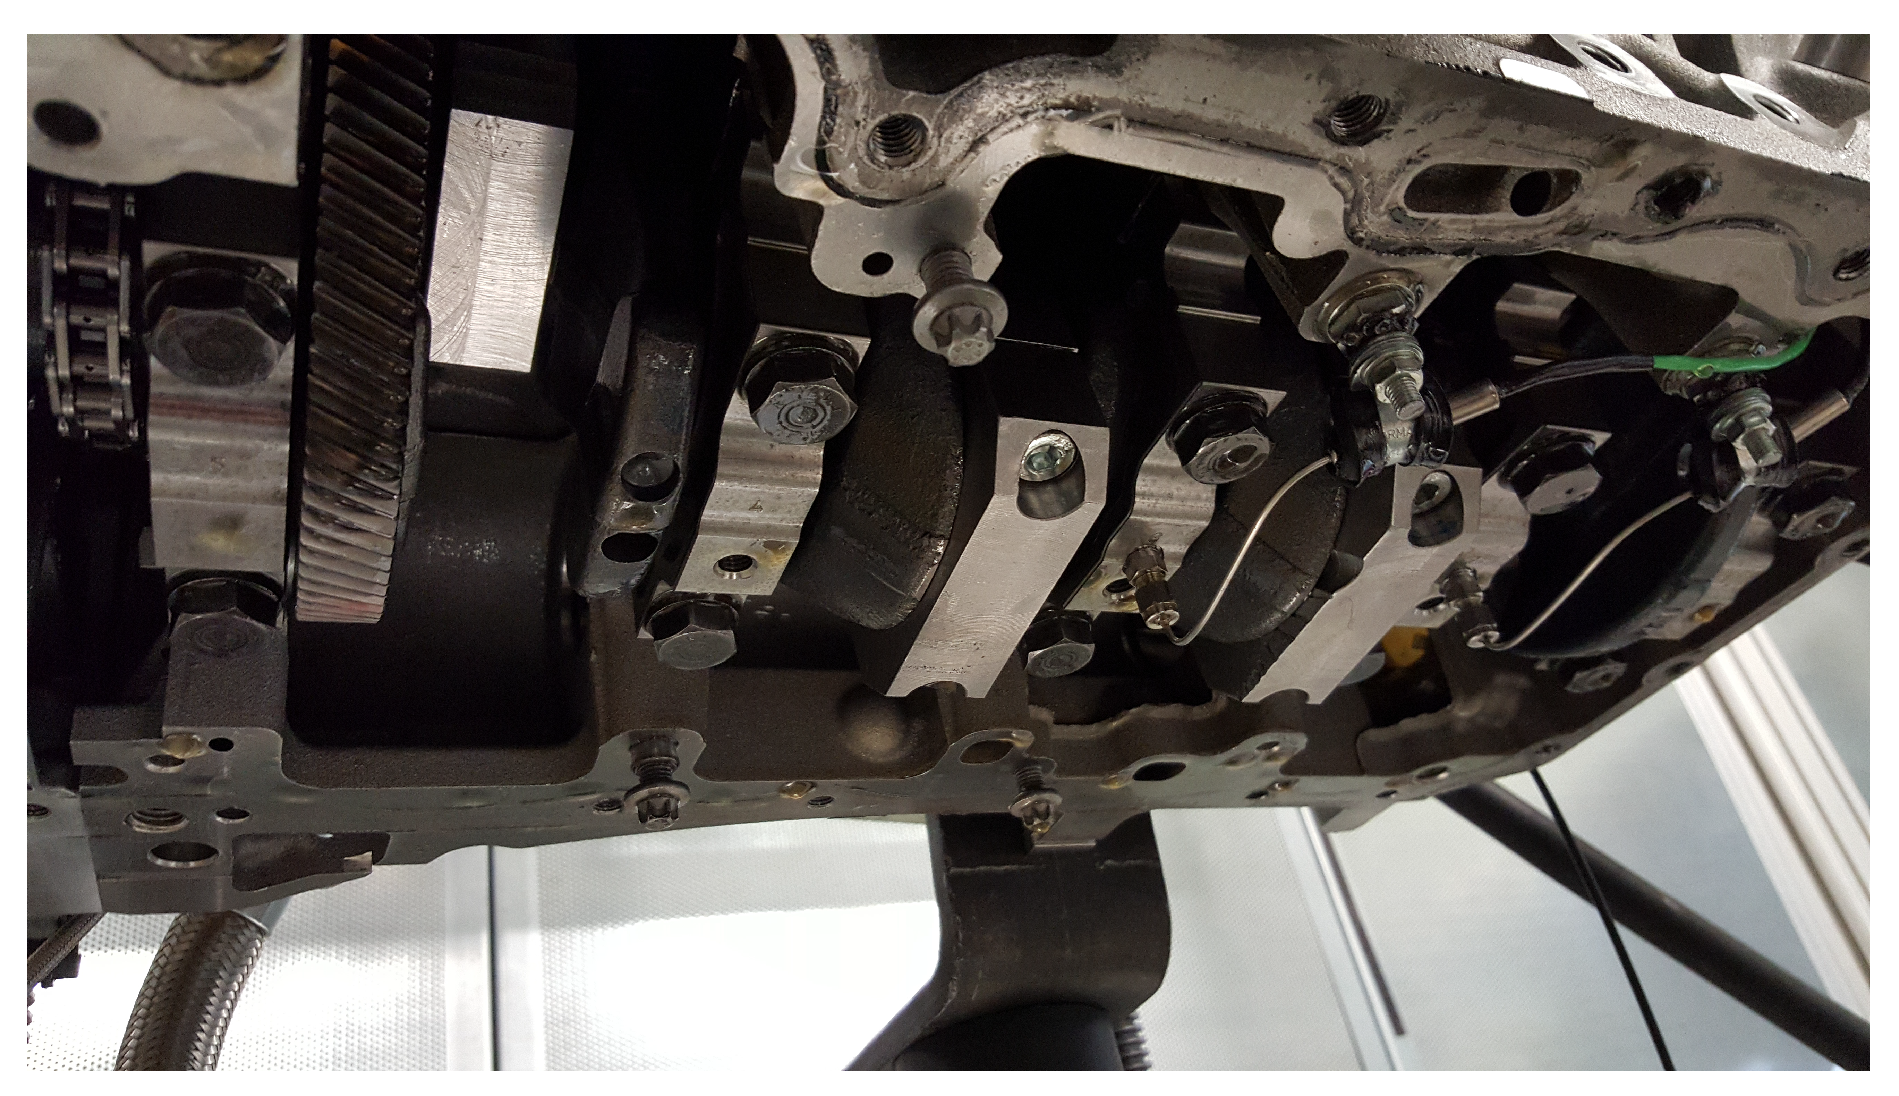
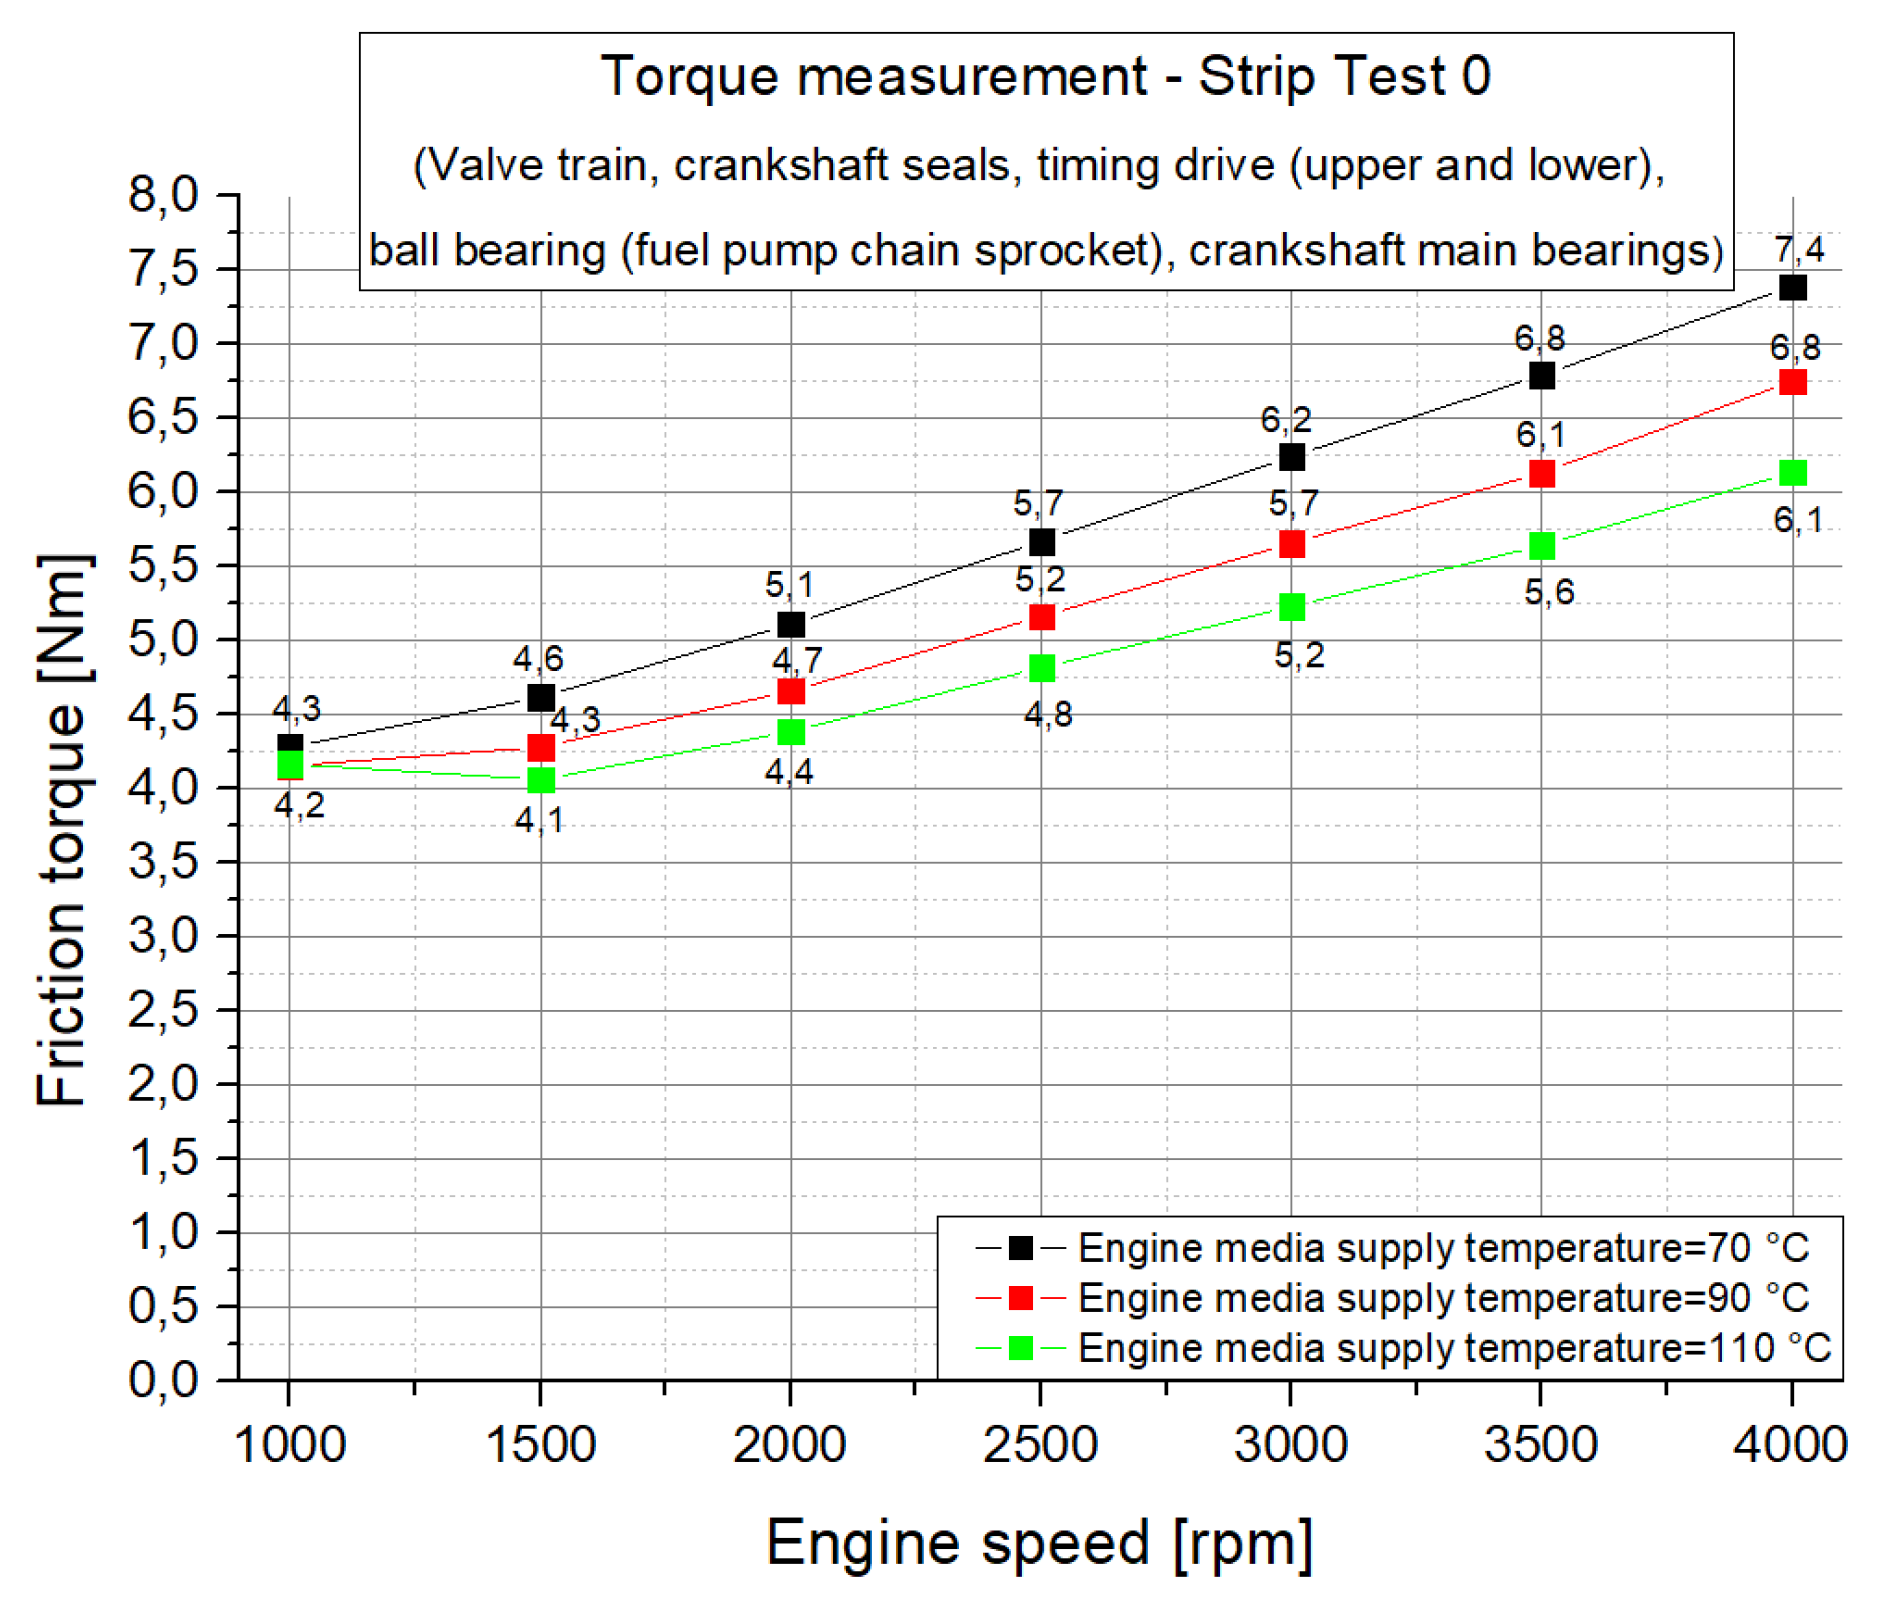
) for the same engine operation points as were used in the engine friction map measurements. After the engine friction map measurements are finished, the base-engine is stripped to engine strip-test stage 0 by removing the pistons and conrods. These so-called supplementary torque measurements (
) are then conducted at the same boundary conditions for the engine speed and engine media supply temperatures as were used for the engine friction map measurements. An additional journal-bearing simulation model in an engine strip-test stage 0 configuration is created to calculate and separate the main bearing friction losses for this strip stage (
). By subtracting the measured friction torque of the supplementary torque measurements (
) from the friction torque of the journal-bearing simulation correlating to the supplementary torque measurements (
), the valve train friction torque (
) is determined; see Equation (
2). Although for simplicity this friction torque is called the valve train friction torque in the following, it is important to note that the (comparatively smaller) friction losses of the timing drive and the crankshaft seal rings are included.
After the determination of the valve train friction losses (Equation (
2)), the friction losses of the piston group can be determined. The resulting friction torque of the piston group (
) is calculated from the measured total friction torque of the base engine (
) by subtraction of the calculated friction torque of the valve train (
) and the calculated friction torque of the crankshaft journal bearings of the base engine configuration (
); see Equation (
3).
With this combined approach, it becomes possible to determine the frictional losses of the subassembly piston group, valve train, and crankshaft journal bearings over the full range of engine operation conditions (entire engine speed and load range). This can be done for all kind of single- or multicylinder engines and prototypes, respectively, using conventional reciprocating crank trains. In addition, the cost benefits due to a reduced experimental effort arise, and a detailed insight in the tribological behaviour of the crankshaft main and big-end bearings becomes possible with the journal-bearing simulation results.
4. Journal-Bearing Friction Loss Simulation
The simulation approach for determining the friction losses of the crankshaft journal bearings consists basically of a elastic multi-body simulation with an isothermal description of the oil film using the Reynolds equation in combination with the approach of Greenwood and Tripp to describe the metal-to-metal contact. The simulation methodology was realised in numerous long-term research projects. It is capable of calculating the friction losses in journal bearings accurately as could be shown in a direct comparison to the experimental data [
23,
24]. In previous works, a wide range of aspects have been investigated and discussed like the extension of the simulation model to TEHD (Thermo elasto hydro dynamic) [
25] simulations under severe mixed lubrication [
26] or journal bearing simulations with new engine operation technologies like start/stop systems [
27]. Also, the investigation of friction reduction potentials using low viscosity lubricants as well as the resulting possible risks due to increased mixed lubrication regimes have been conducted in the past using the developed simulation methodology [
28,
29]. In the following, a short summary is reproduced here for brevity, and for a rather complete overview, we refer to References [
30,
31,
32]. To calculate the journal-bearing friction losses of the engine using the developed simulation approach, a engine model based on the MBS (Multi-body system) AVL Excite Power Unit (AVL EXCITE Power Unit Version 2017.1, AVL List GmbH, Advanced Simulation Technology, Hans-List-Platz 1, 8020 Graz, Austria,
www.avl.com.) was set up for the engine. The engine model consists of condensed FE (Finite element) structures of the crankshaft, main bearings, and connecting rods, with all bodies being elastically deformable and mass carried [
33,
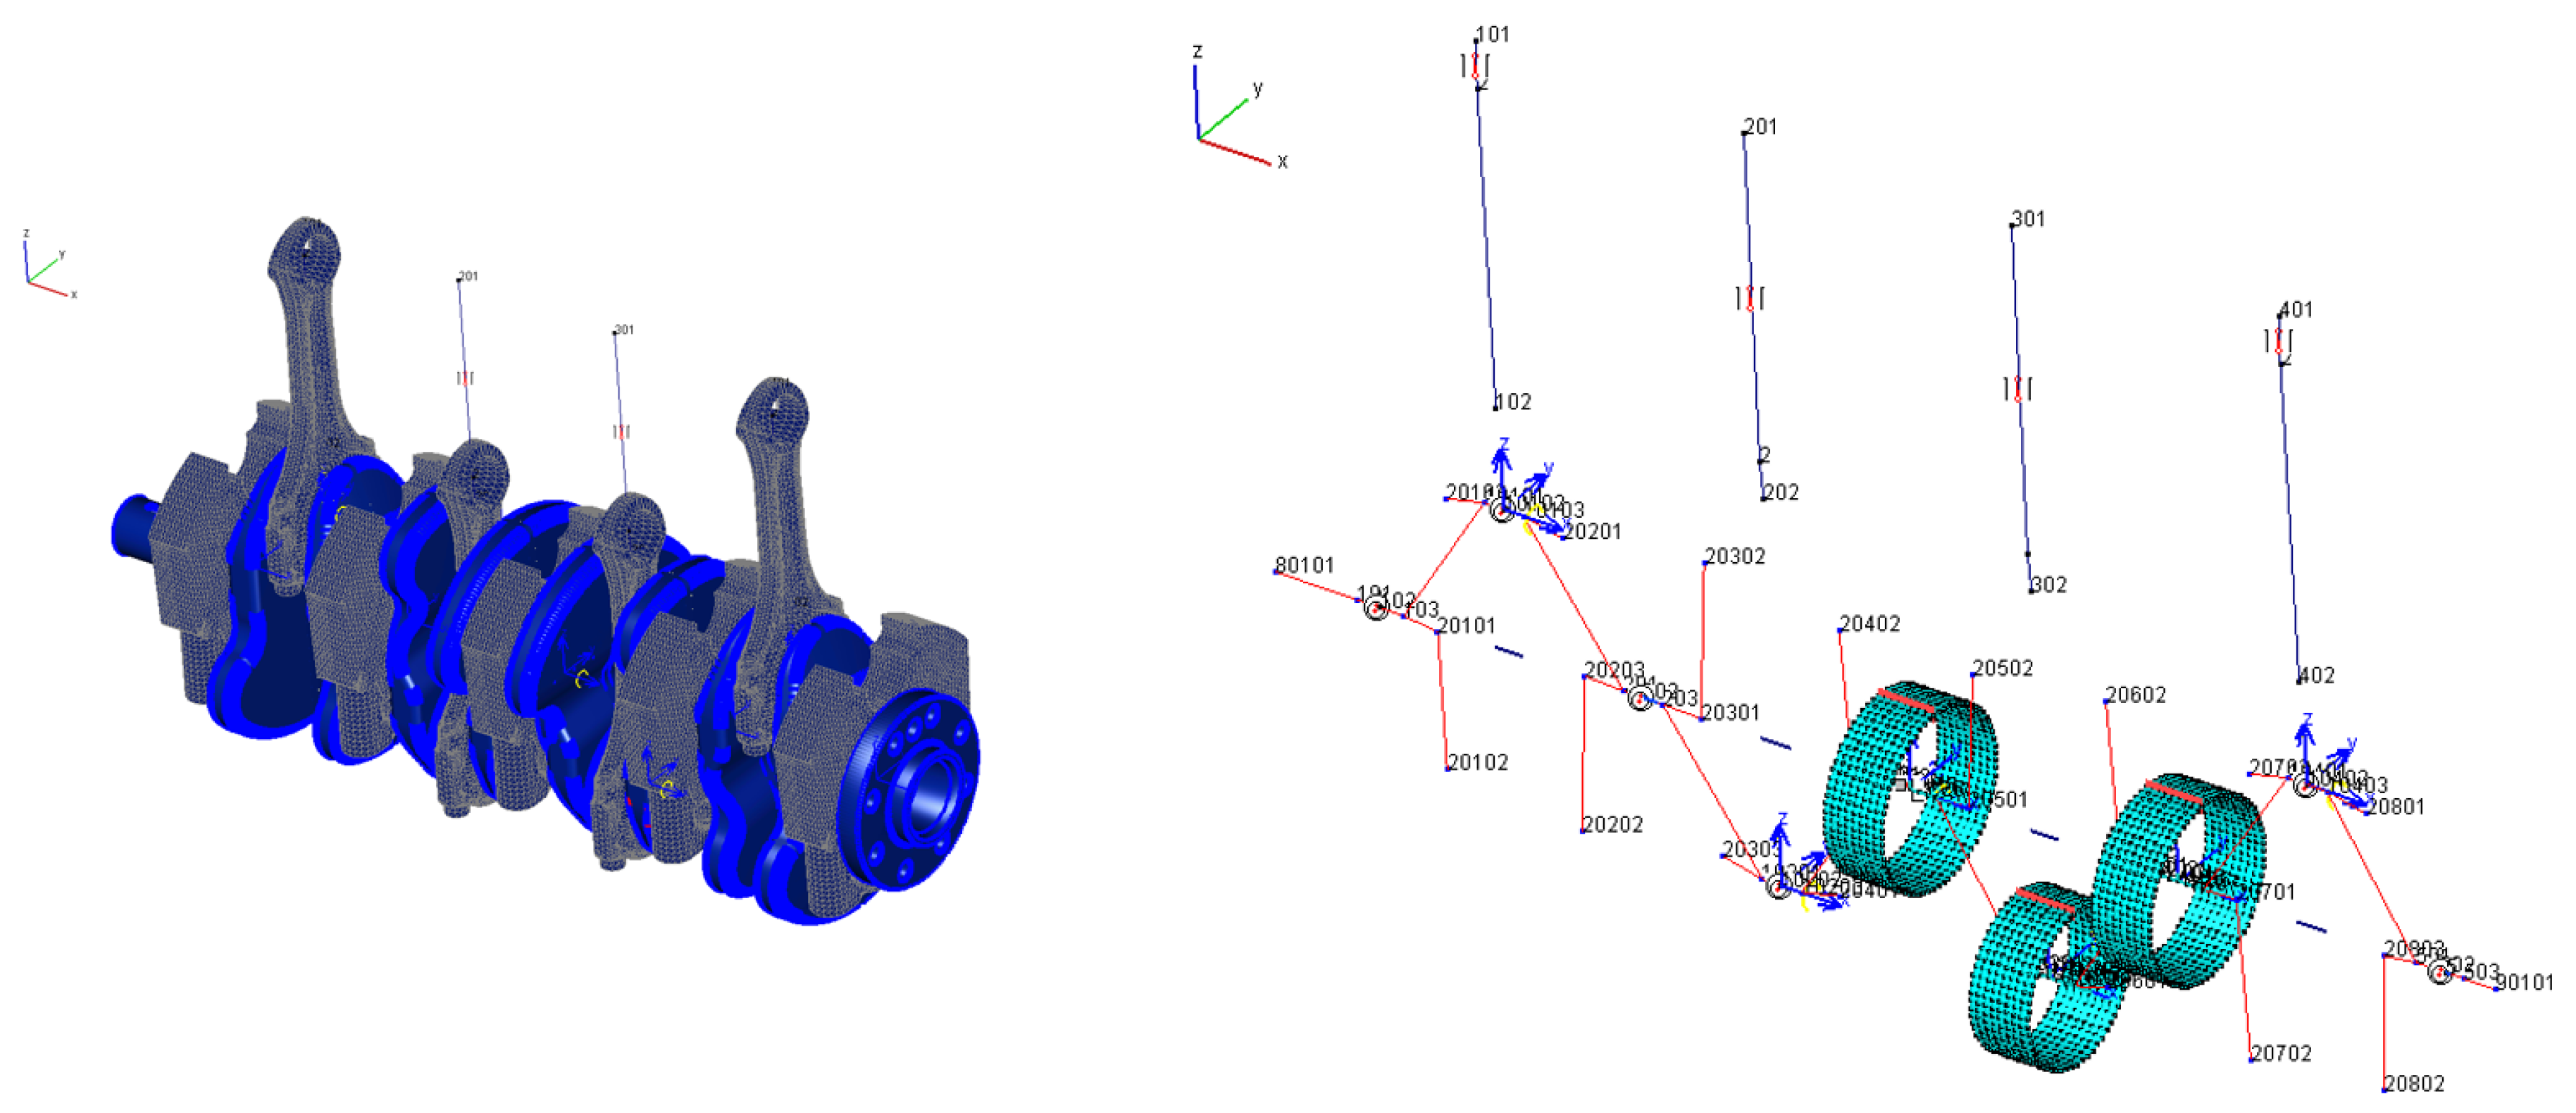
34]. The following
Figure 22 shows the schematic structure of the engine model for the journal-bearing simulations.
Besides the geometrical dimensions (macro- and micro-geometry), the required input data for the journal-bearing simulation model are the main and big-end bearing temperature, the lubricant supply temperature and pressure, the cylinder pressure profile over the crank angle, and the engine speed which are provided from the experimental investigations on the motored test rig. The basic physical properties of the SAE 5W30 lubricant used in this work are listed in
Table 2.
To describe the physical properties of the lubricant in the simulation model, an extensive rheological model is employed [
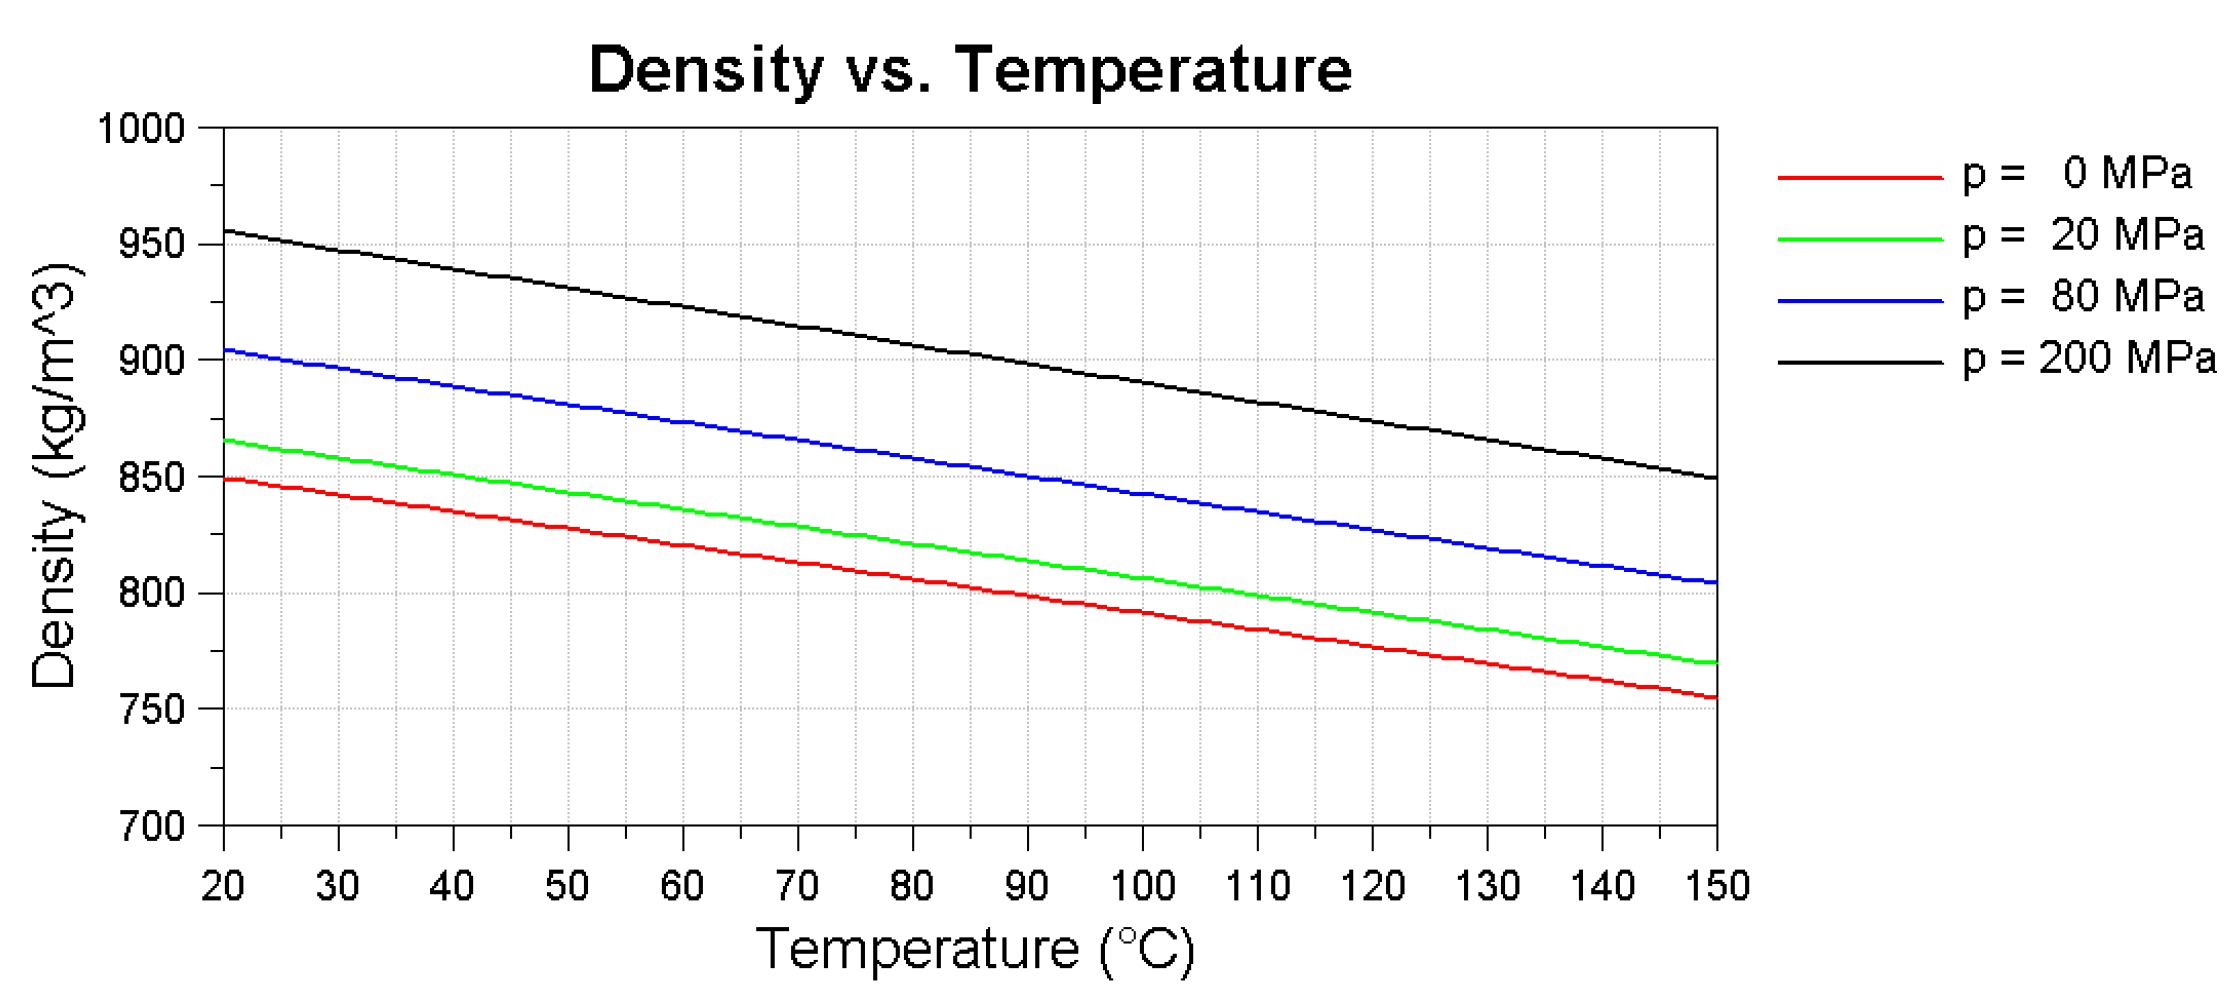
35]. For the description of the pressure- and temperature-dependent density, the widely used Dowson/Higginson equation is used (see Equation (
9)), applying the parameters listed in
Table 3.
Finally,
Figure 23 shows the calculated density vs. temperature relation of the lubricant for different contact pressures.
Besides the description of the density–pressure relation using Equation
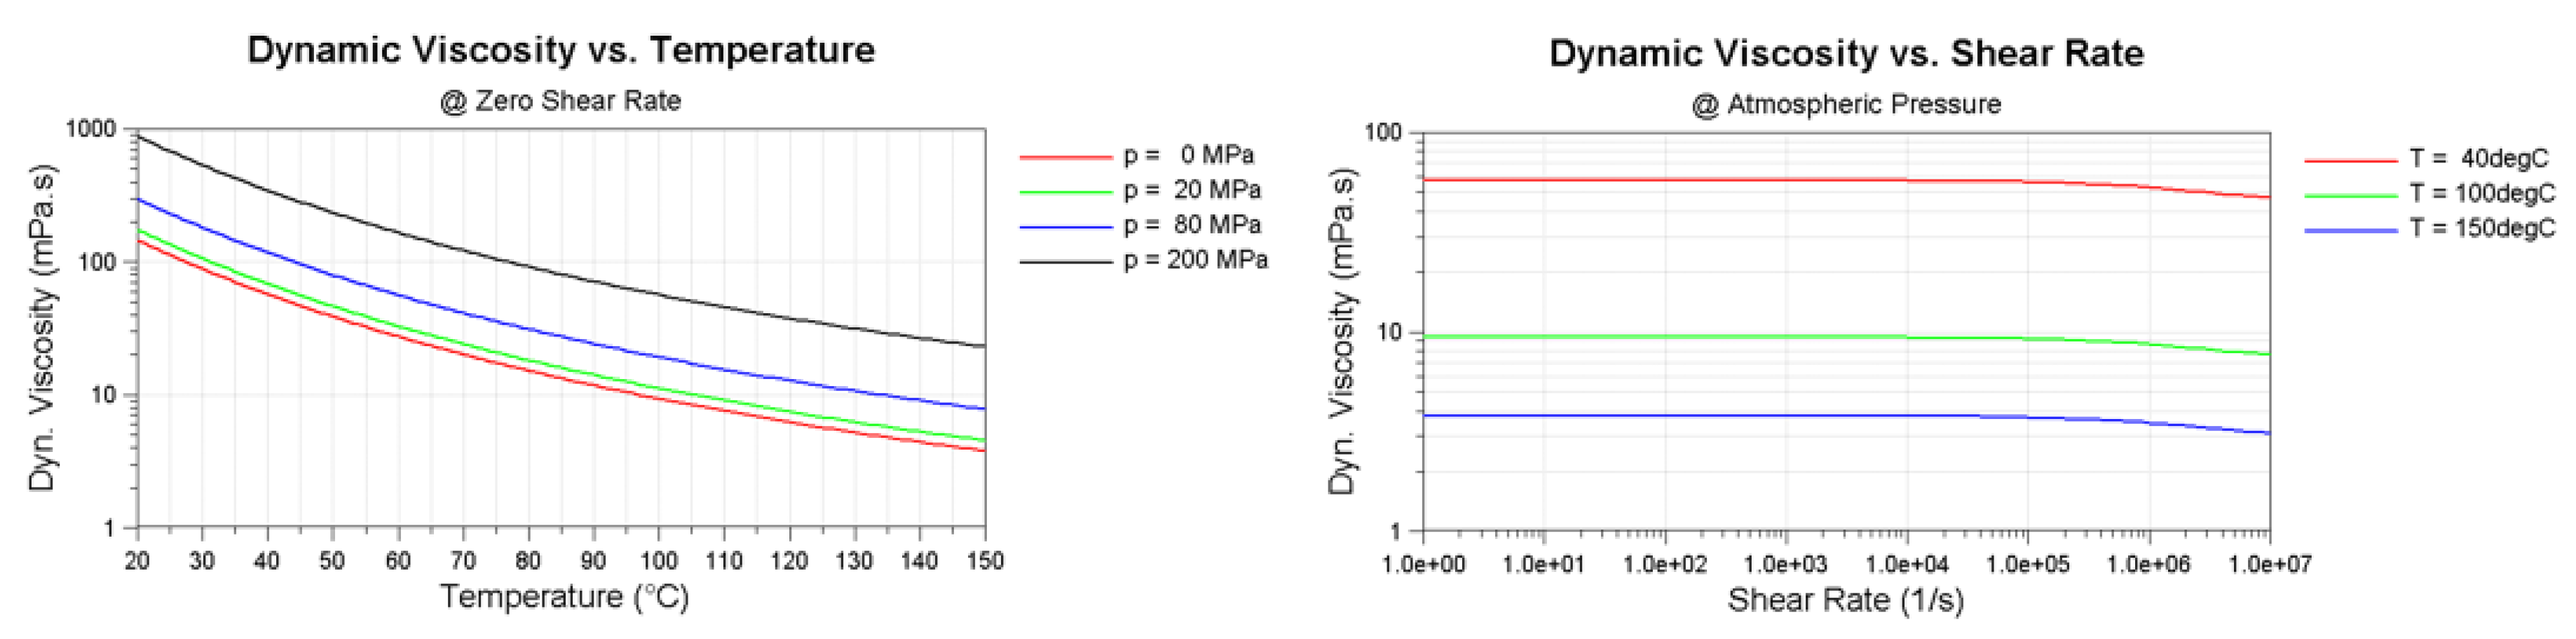
9, the description of the physical properties describing the influence on lubricant viscosity, the temperature dependence, the pressure dependence (piezoviscos effect), and the non-Newtonian behavior (the dependence of the viscosity on the local shear rate) of the modern multigrade lubricant is comprehensively taken into account in the calculation [
24,
36]. Using the Vogel equation [
37] for the dependence on the temperature (
T), the Barus equation [
38] for the piezoviscous behaviour (
p), and the Cross equation [
39] to describe the influence of the shear-rate (
), the influences on the viscosity (
) can be described using Equation (
10).
The applied parameters are listed in
Table 4 and are calculated using results from previously published work [
24] and from lubricant characteristics obtained from a conducted laboratory oil analysis.
The computed viscosity behaviour including the influences of the lubricant temperature, contact pressure, and shear-rates are plotted in
Figure 24.
As the simulation model is carried out as an EHD (Elasto hydro dynamic)-calculation, a global bearing temperature has to be defined, which represents a suitable compromise for the entire journal bearing (hot oil temperature in the high loaded zone and cooler oil temperature in the non-loaded zone). In recent projects, a methodology to calculate an equivalent temperature was developed [
24,
25]. Therefore, thermal processes and heat flows have been investigated [
25] using measurements and simulations. To describe the equivalent temperature of the journal bearing, measured temperatures (oil supply temperature and main bearing shell temperature) are used.
where
is the lubricant supply temperature and
is the temperature in the high load zone of the main bearing. Using Equation (
11) results in the equivalent temperature of the journal bearing.
and
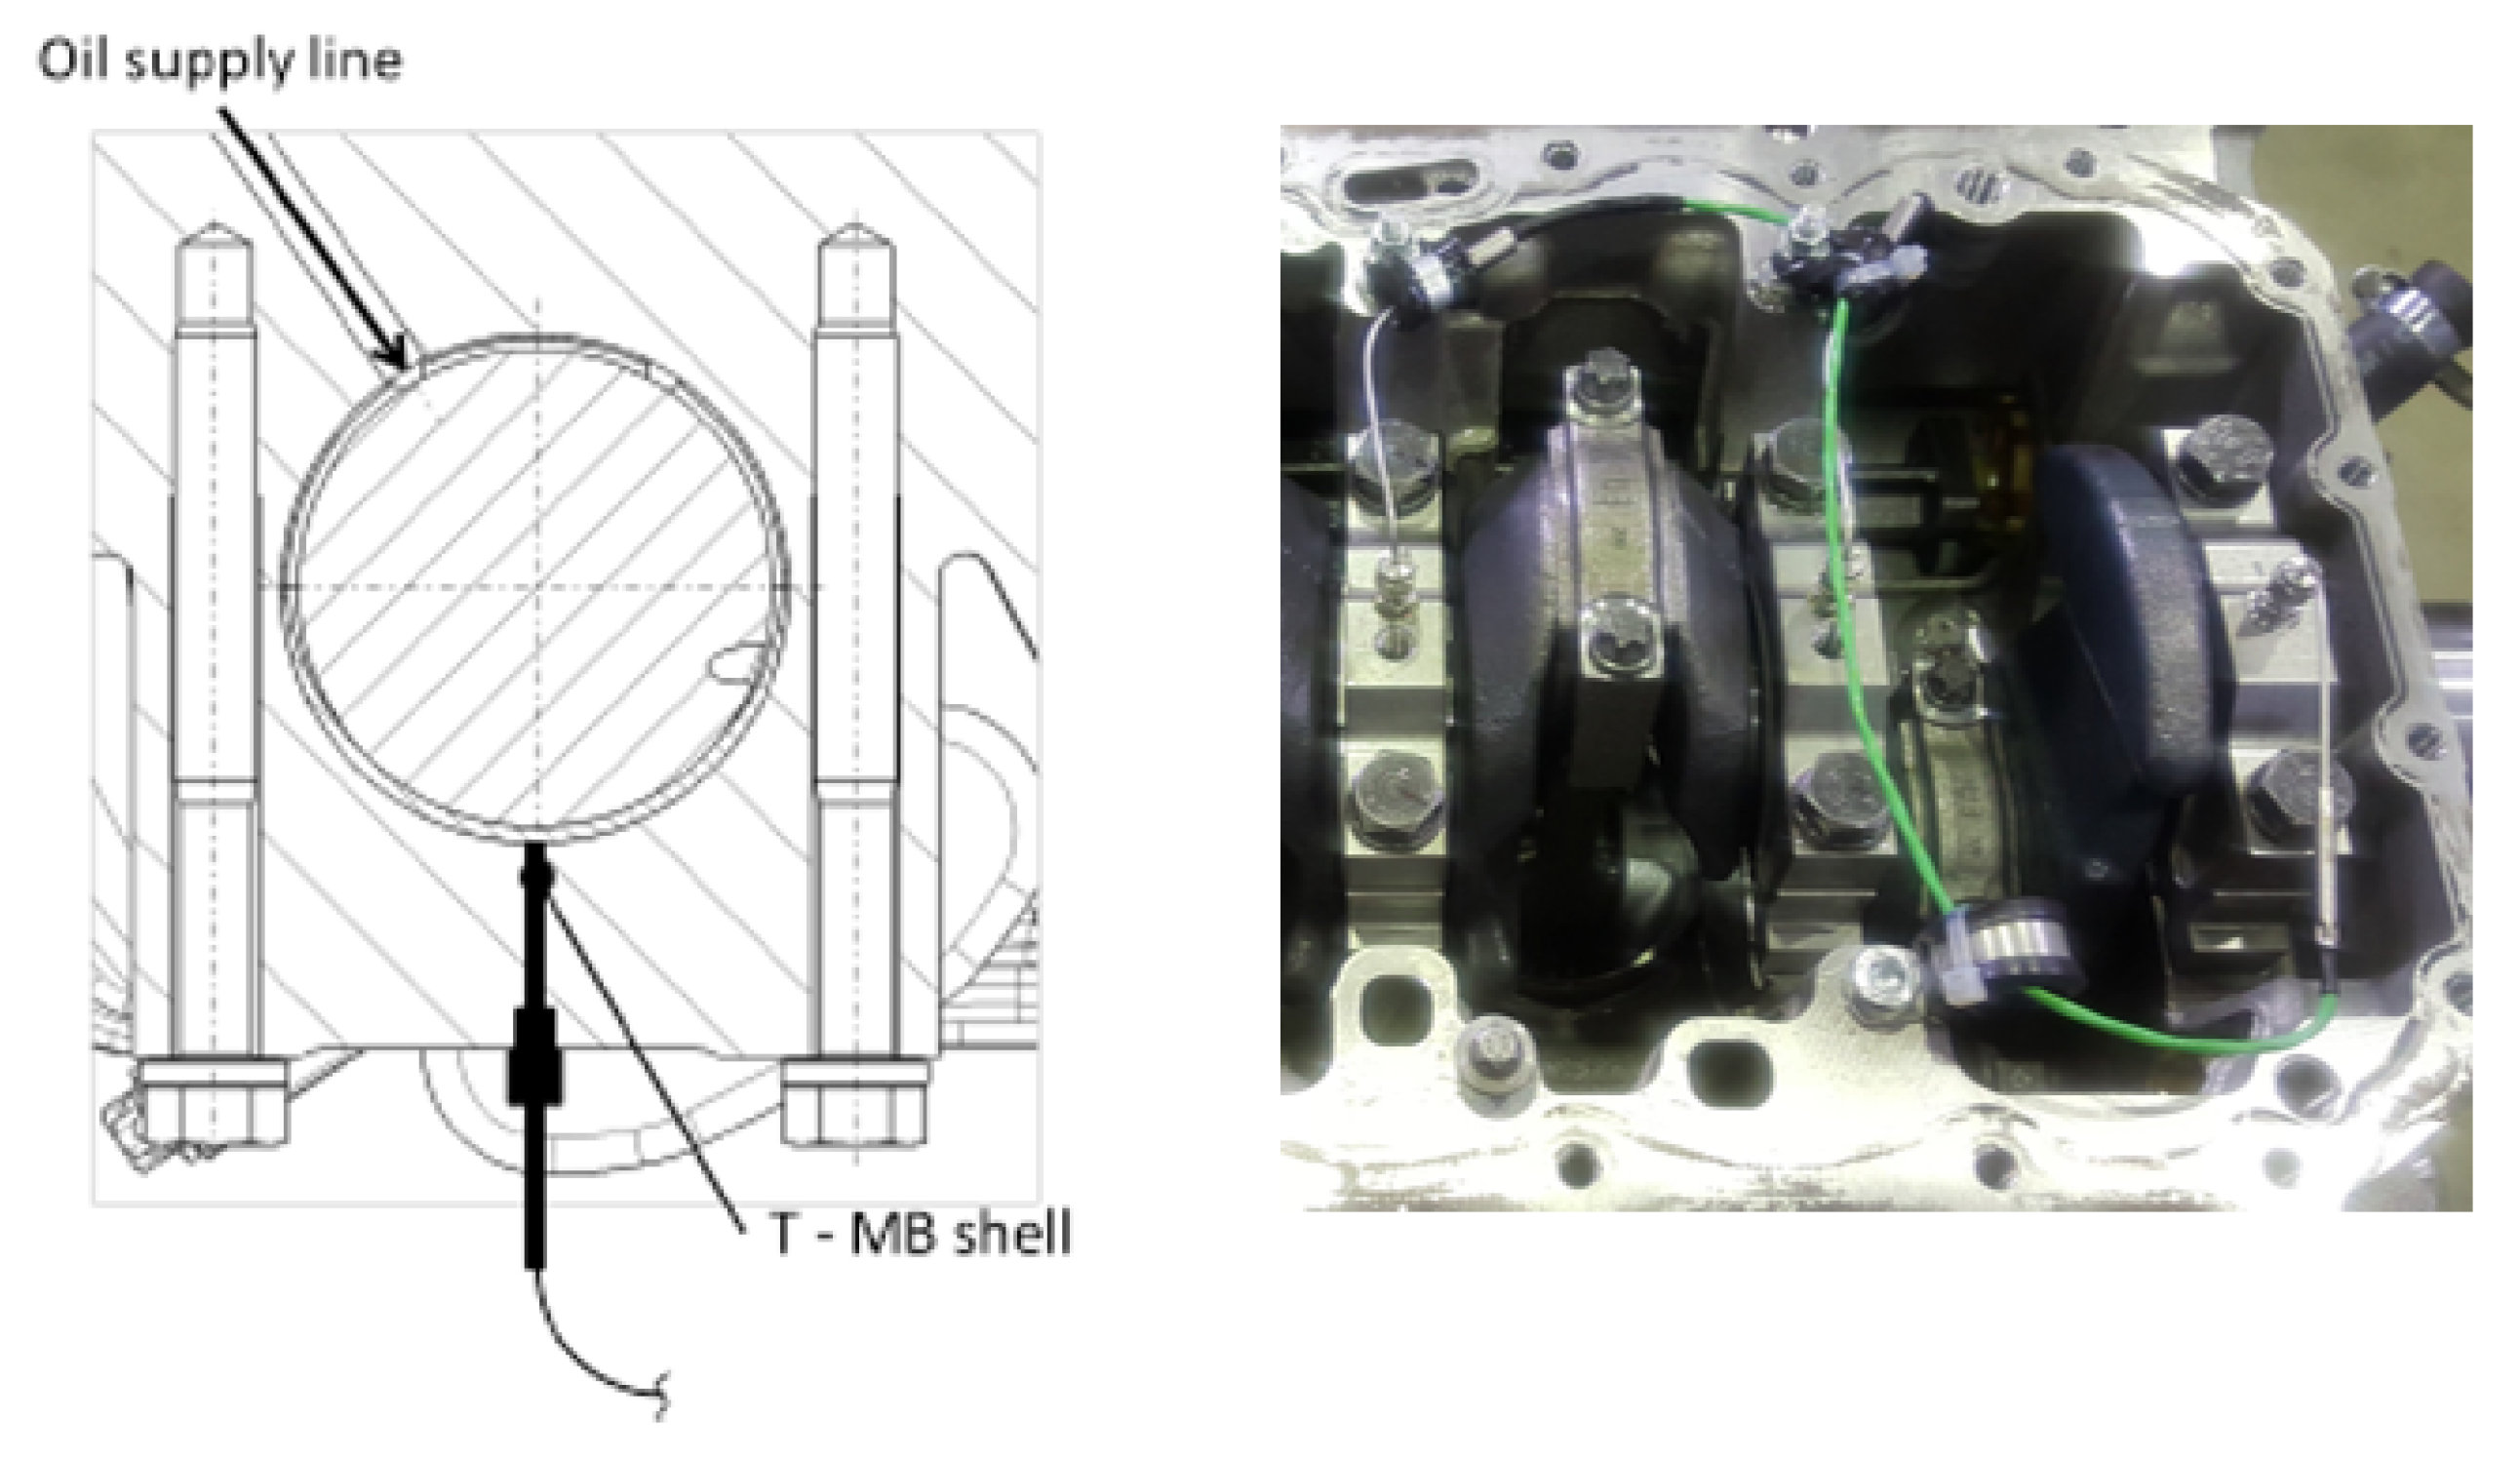
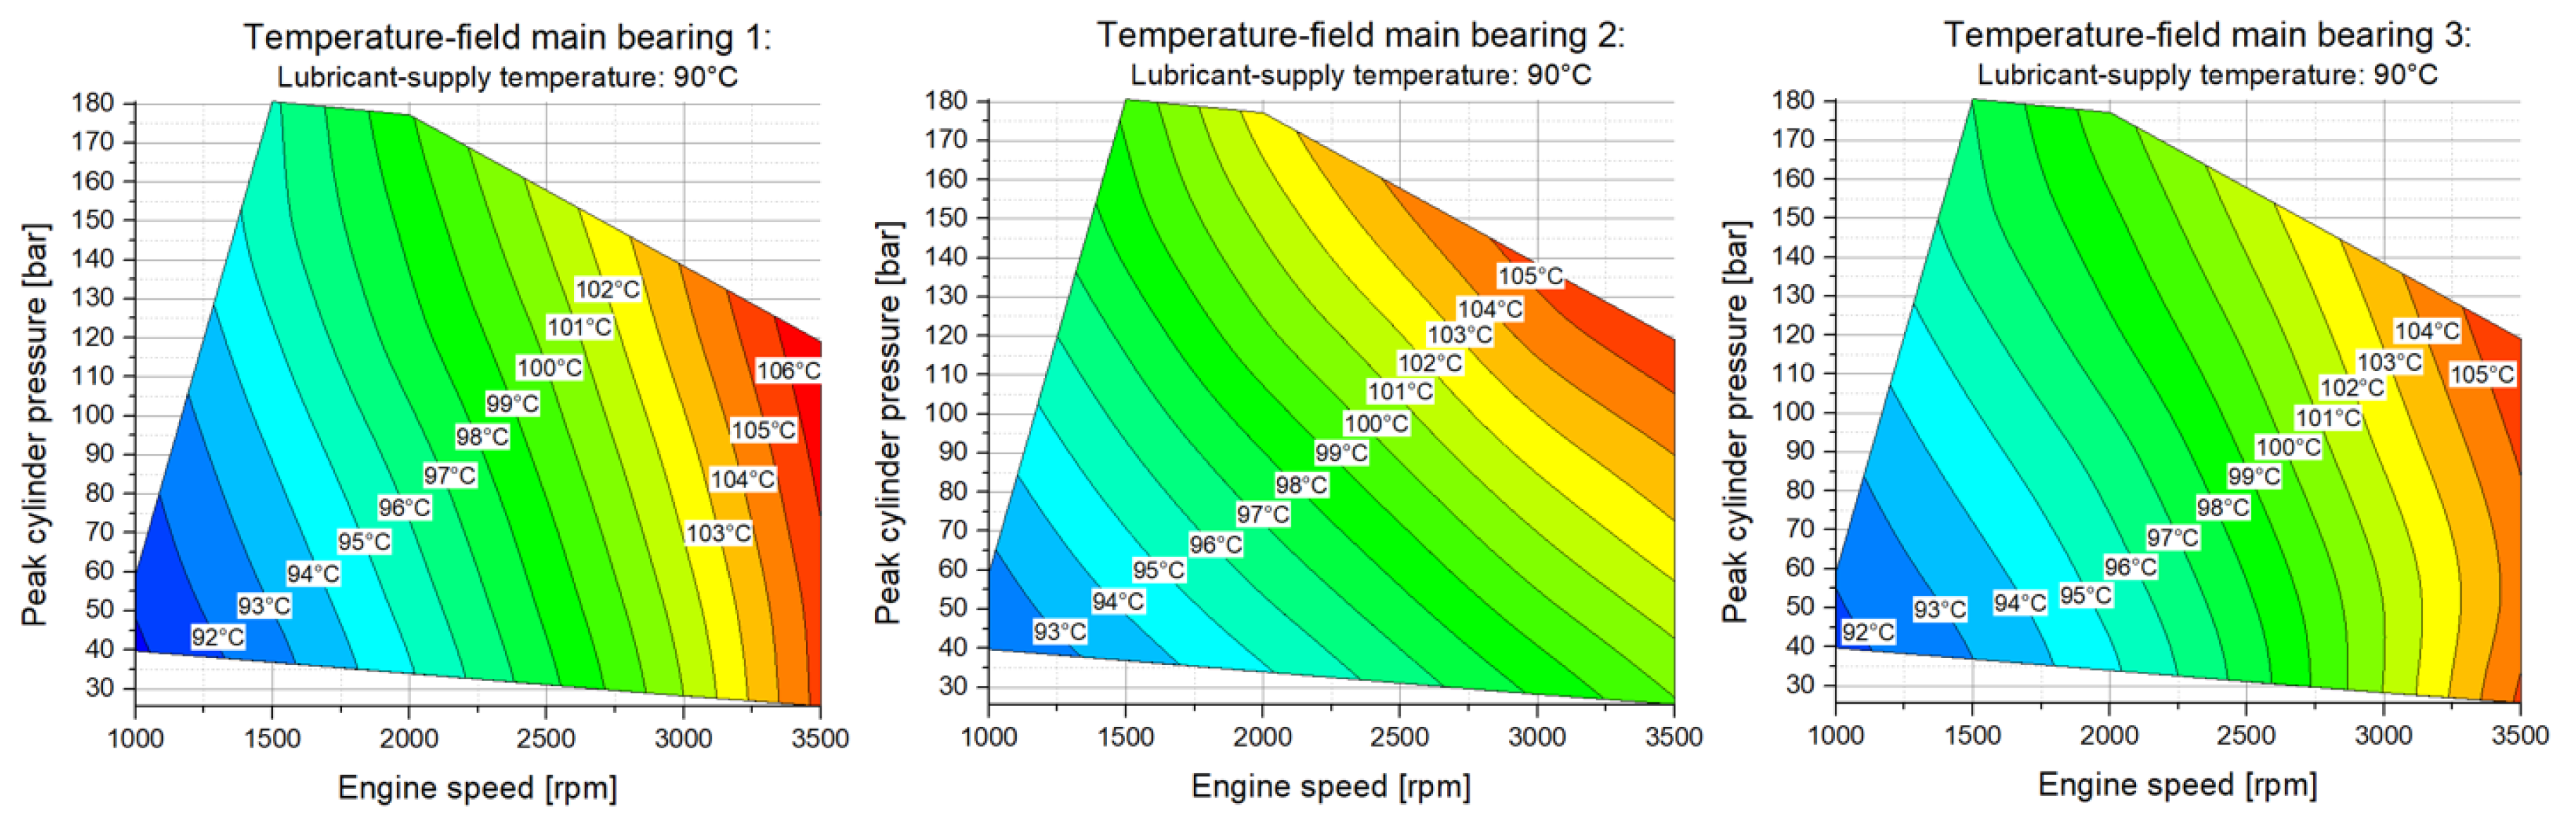
are provided from the experimental investigations on the motored test rig. By applying temperature sensors at the individual main bearings during the experiments (see
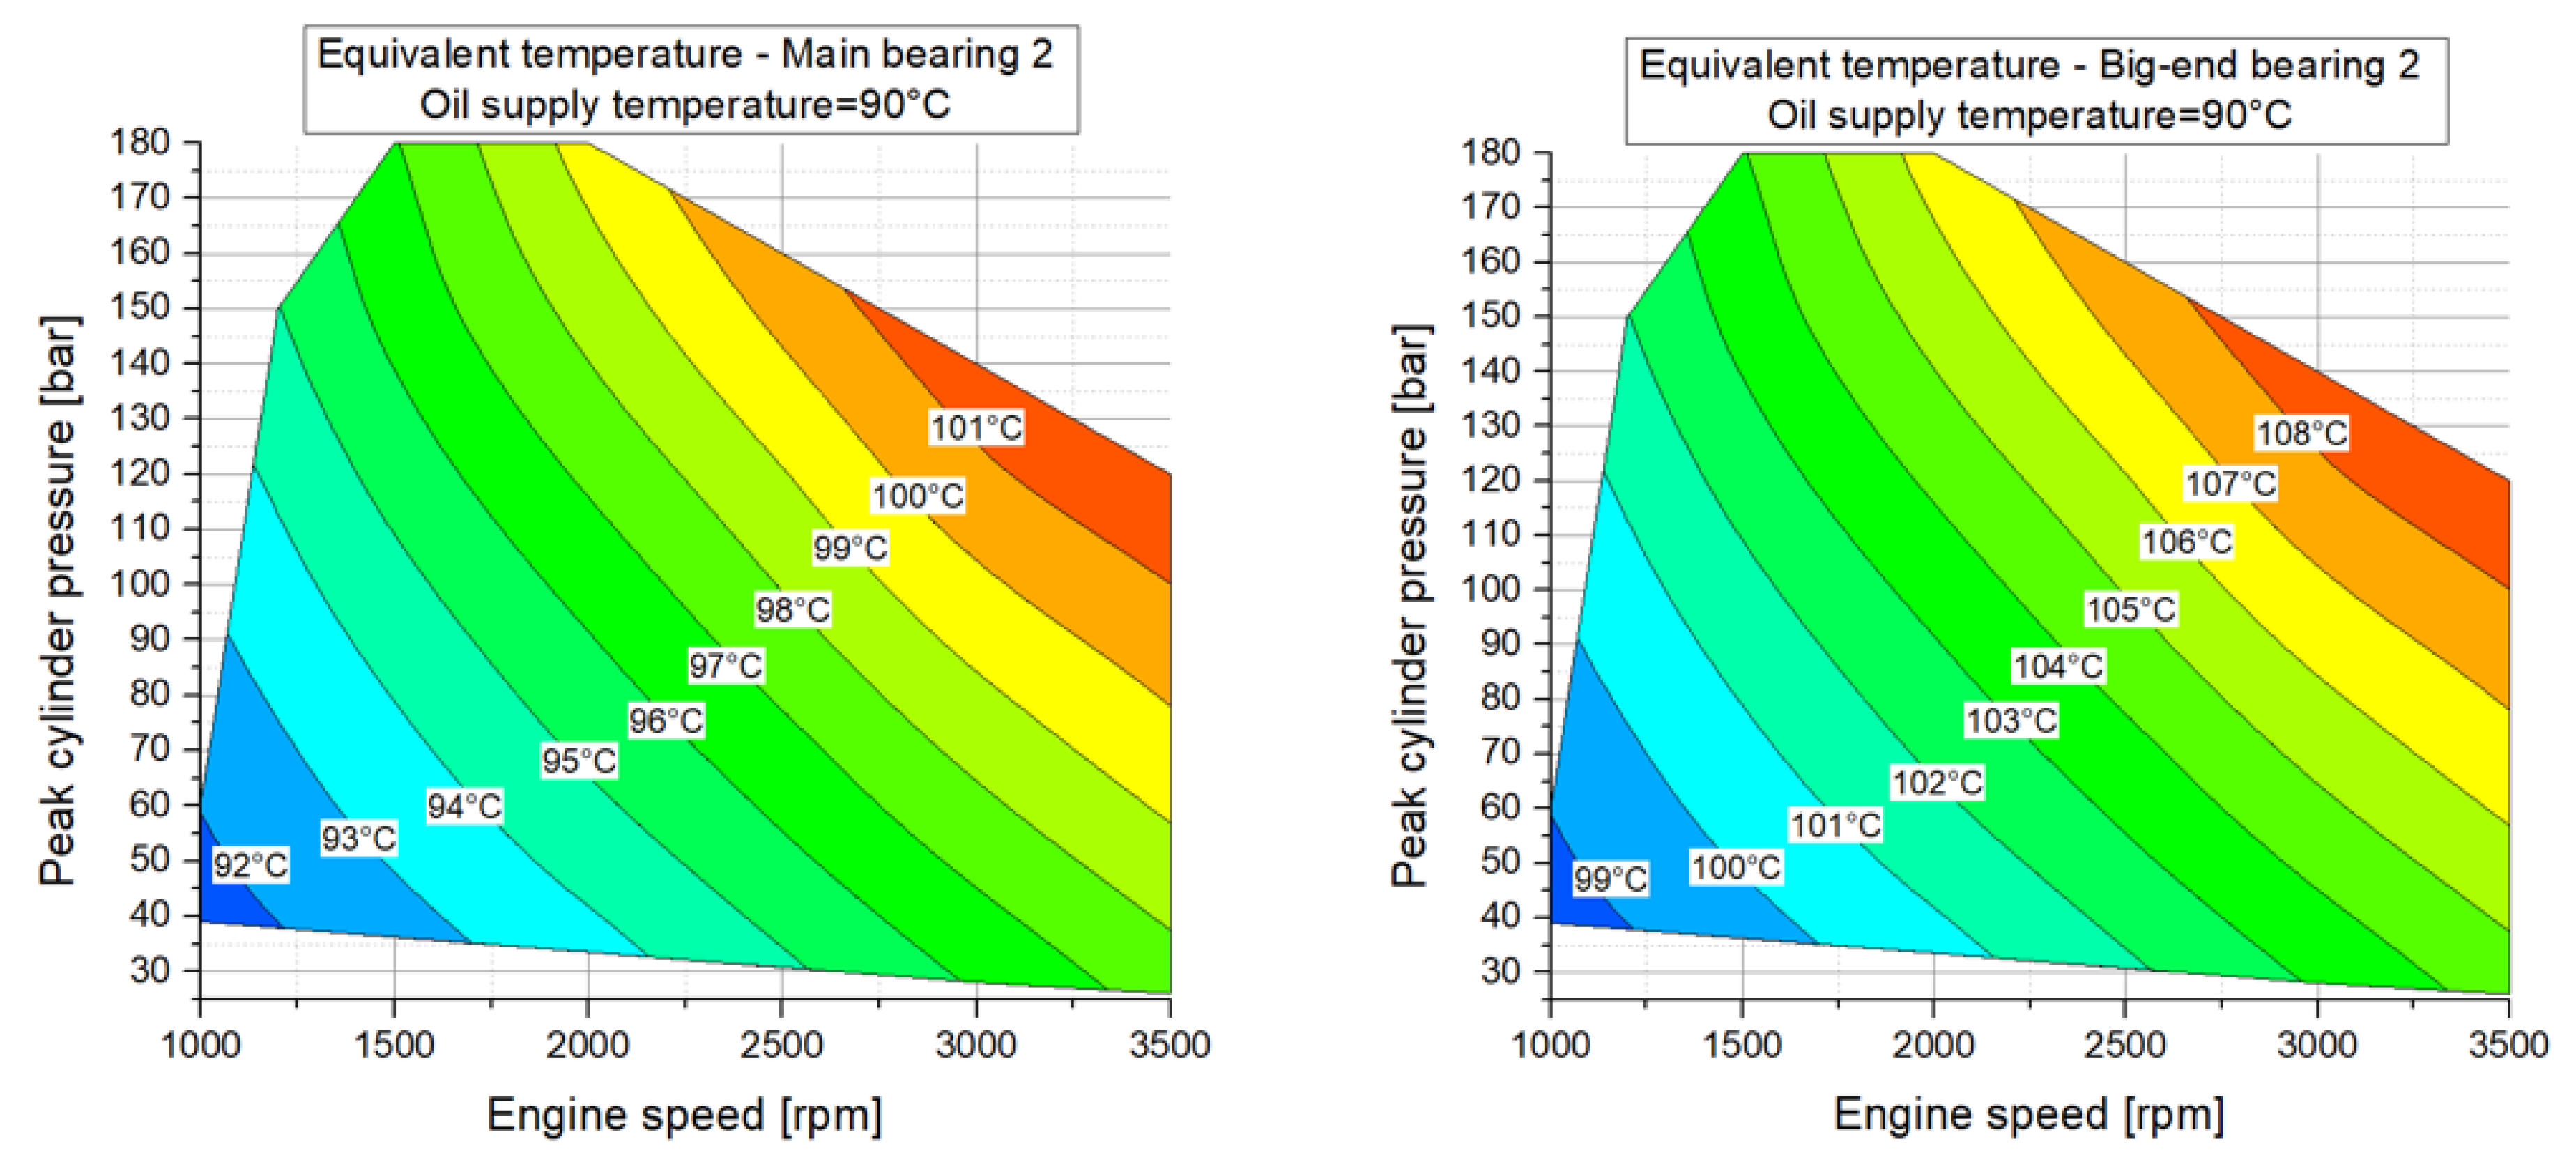
Figure 7), the equivalent main bearing temperatures of the individual main bearings can be calculated and provided to the journal-bearing simulation model. Due to the higher loads acting on the big-end bearings, they have to work at increased temperatures compared to the main bearings. Published experimental data show an increase in the big-end temperature at the bearing shell of about 3–5
C compared to the main bearings [
40]. Nowadays, modern diesel engines work under much higher bearing loads, and therefore, a further increase of the big-end bearing temperatures is expected. Recent results from measurements at journal-bearing test rigs confirm these expectations [
23,
24]. For that reason, the temperatures of the big-end bearings are approximated to be about 7
C higher than the calculated equivalent temperatures of the main bearings.
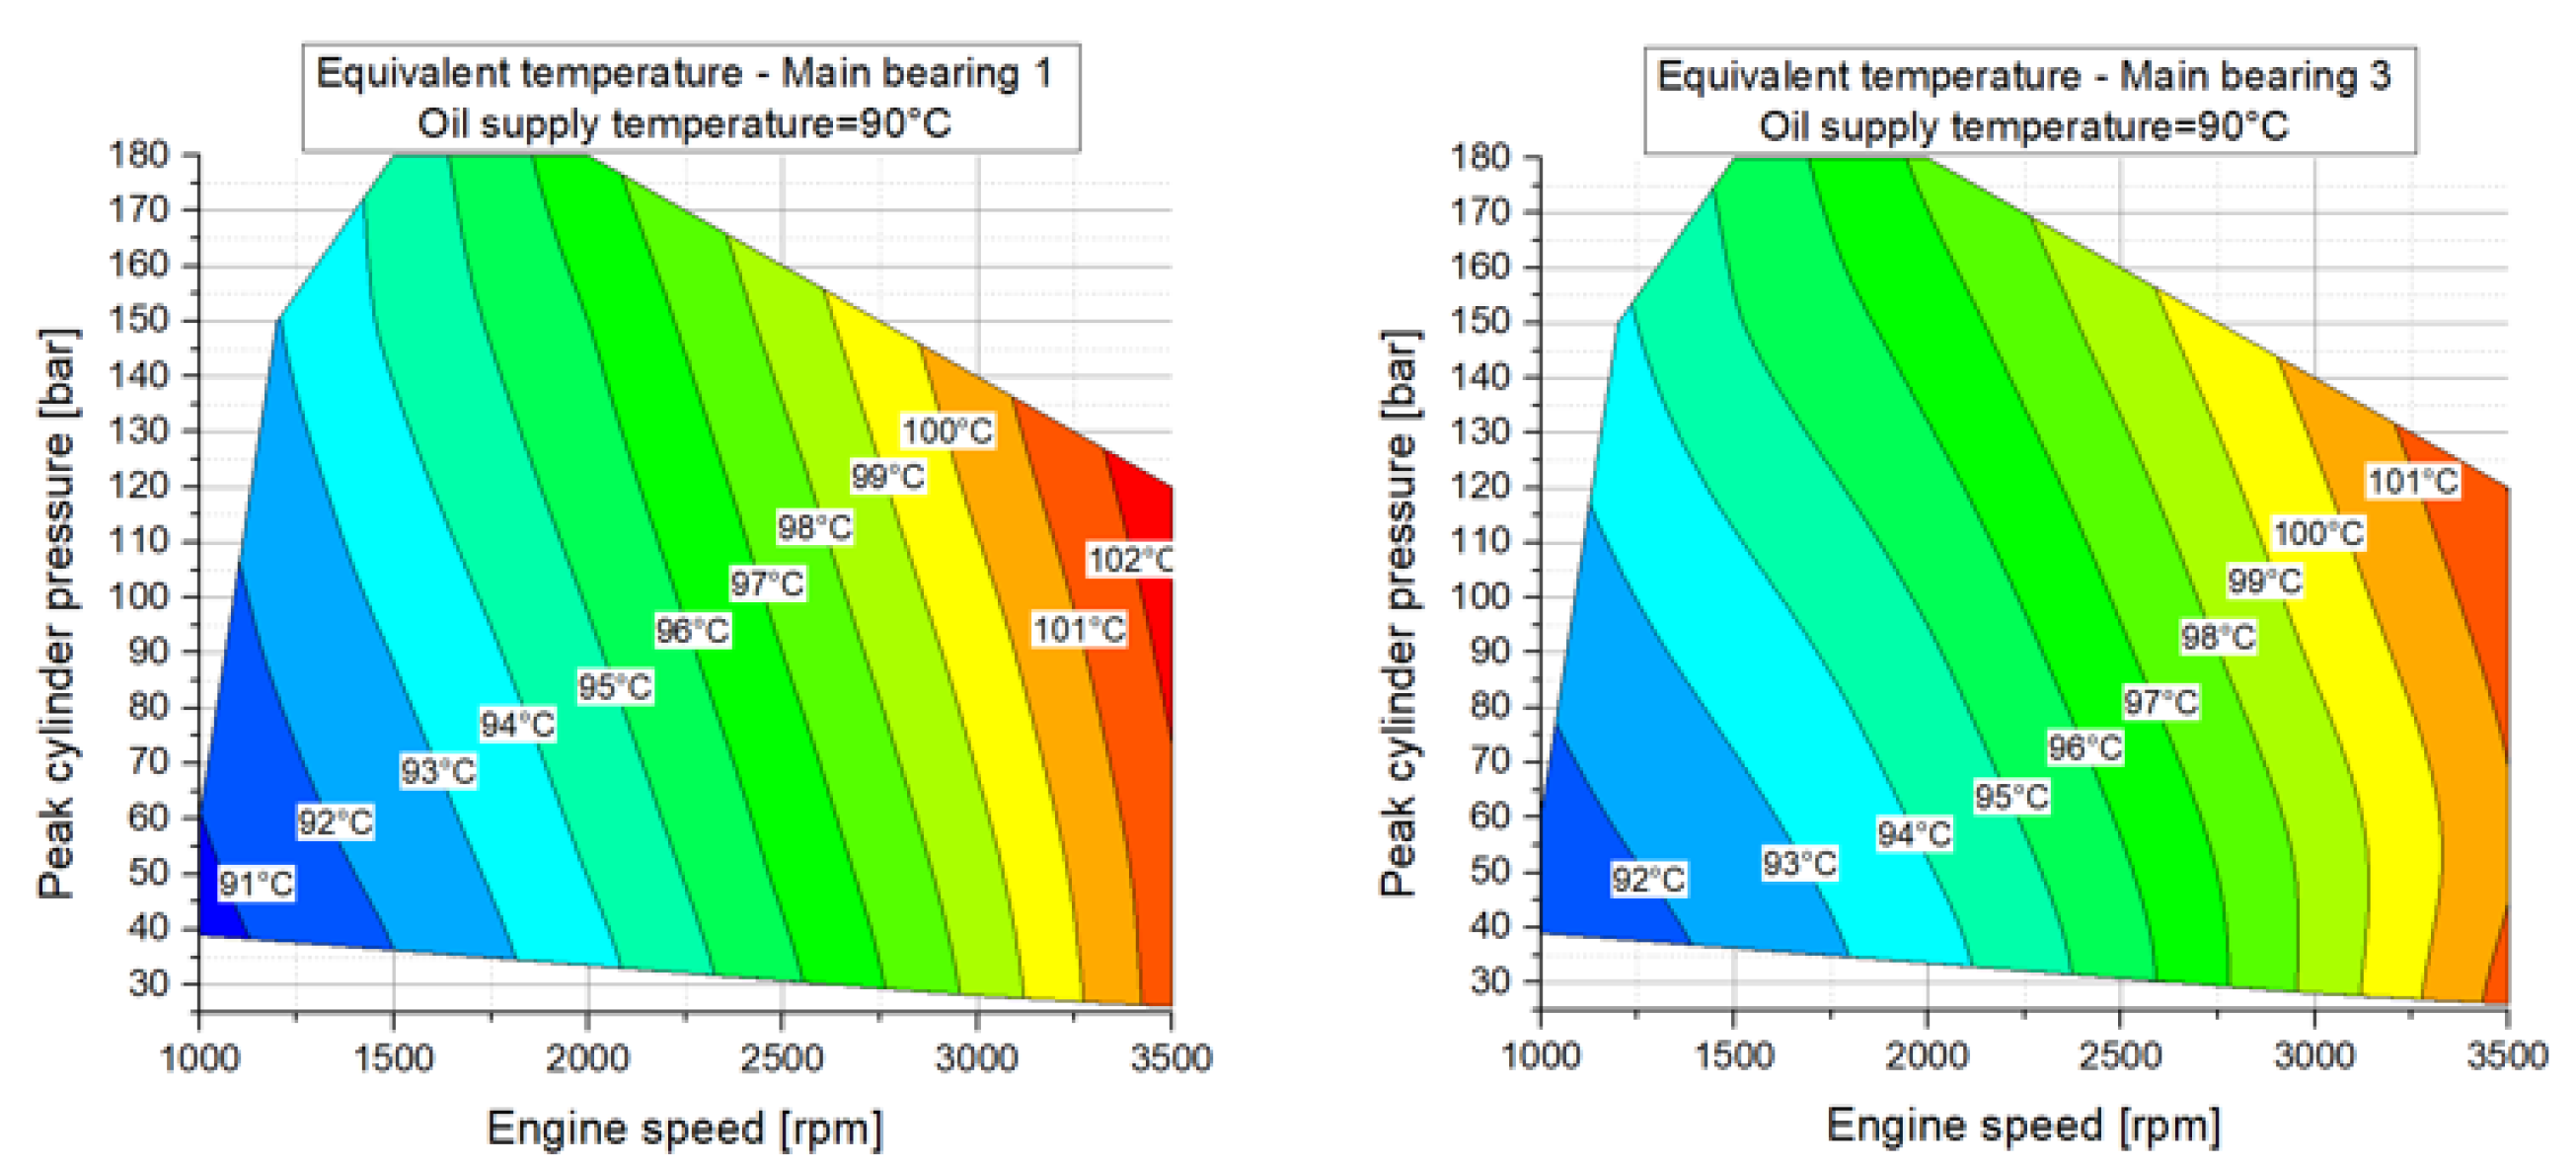
Figure 25 shows the resulting equivalent bearing temperature for main bearing 2 and the big-end bearing 2. For the sake of completeness, the calculated equivalent bearing temperatures for main bearing 1 and main bearing 3 are presented in
Appendix A in
Figure A5.
While the adjustment of a few single degree Celsius only has a marginal influence on the results, the usage of the measured main bearing shell temperatures is significant because the deviation between the oil supply temperature and bearing shell temperature can easily be above 20
C, resulting in major reductions of the lubricant viscosity (see
Figure 24). As can be seen from the shown temperatures, there is a strong dependence on the engine speed and load present that counteracts the increase in the friction power losses of the journal bearings at high engine speeds and loads.
4.1. Simulation Results
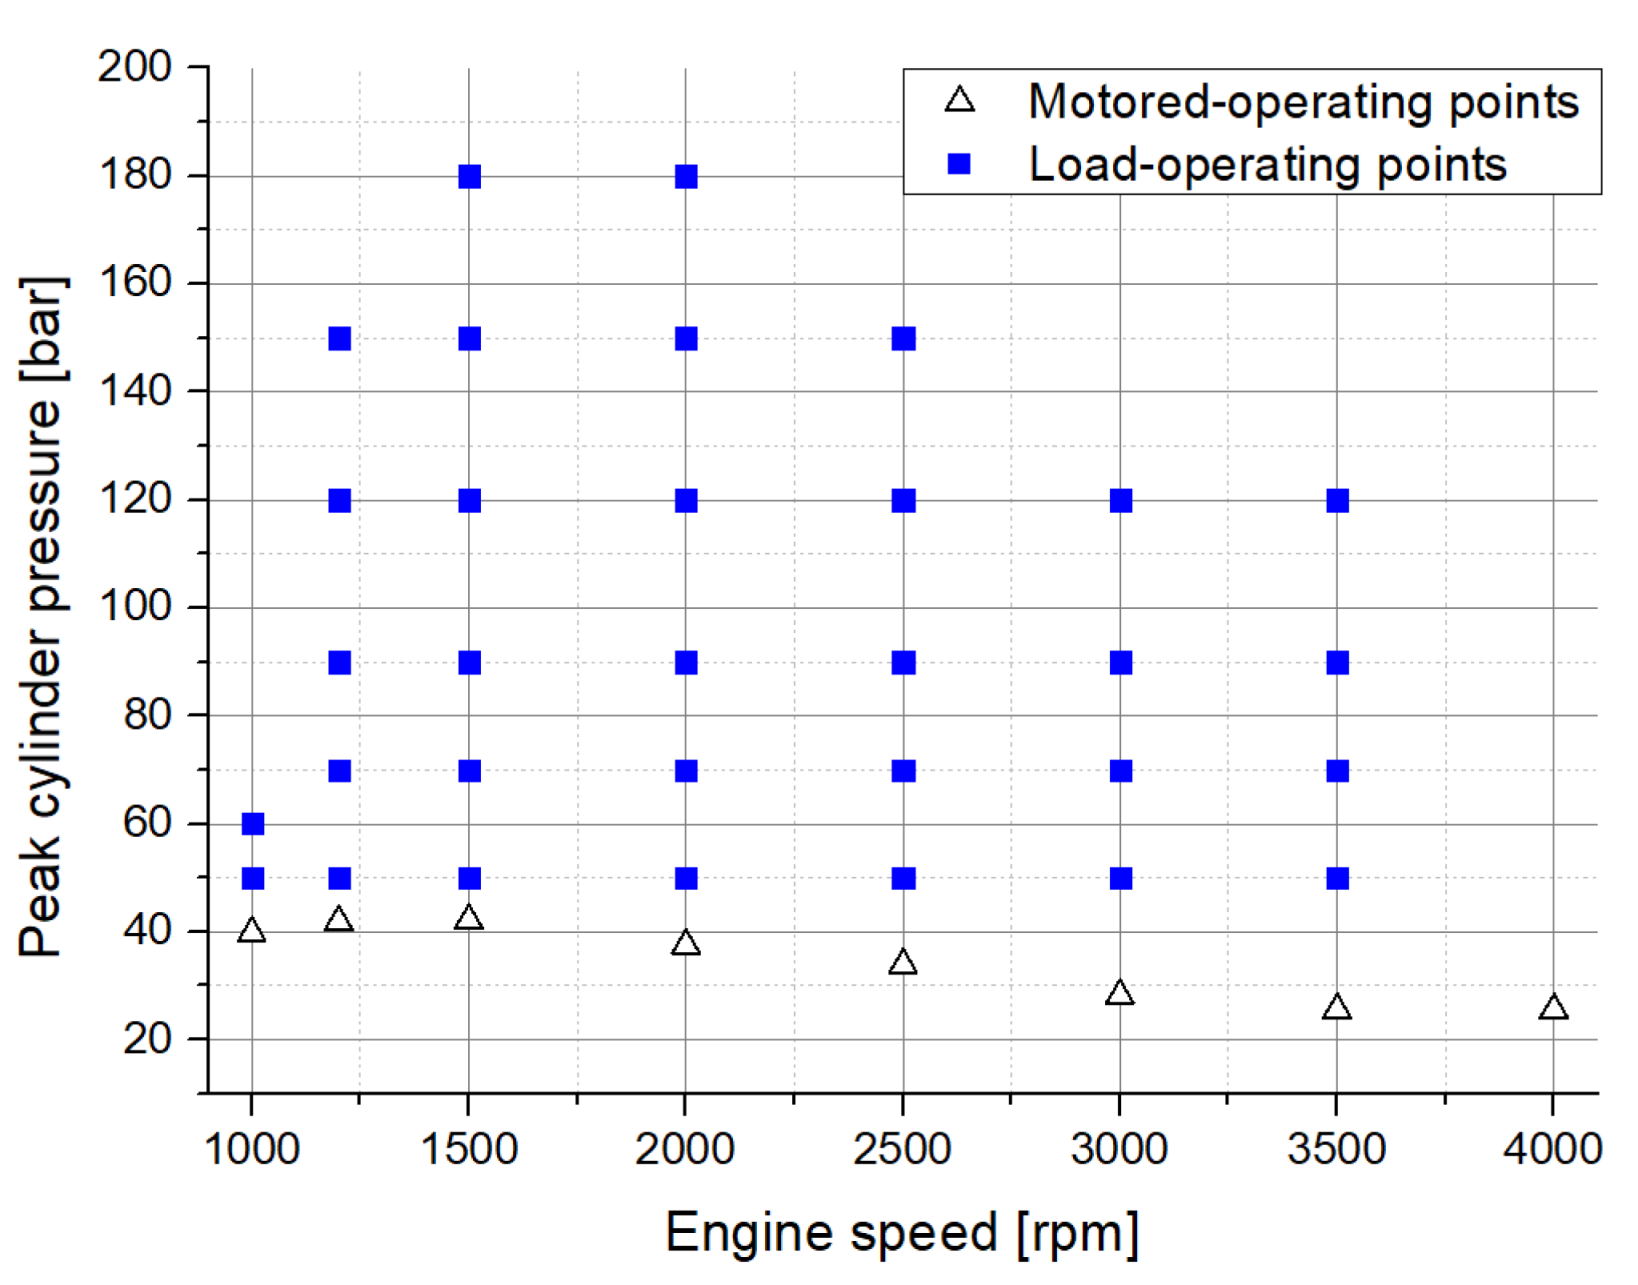
The calculation of the journal-bearing friction losses using the developed simulation methodology was carried out for the equal engine operation points of the measurement campaign (see
Figure 13) for three different engine media supply temperatures: 70
C, 90
C, and 110
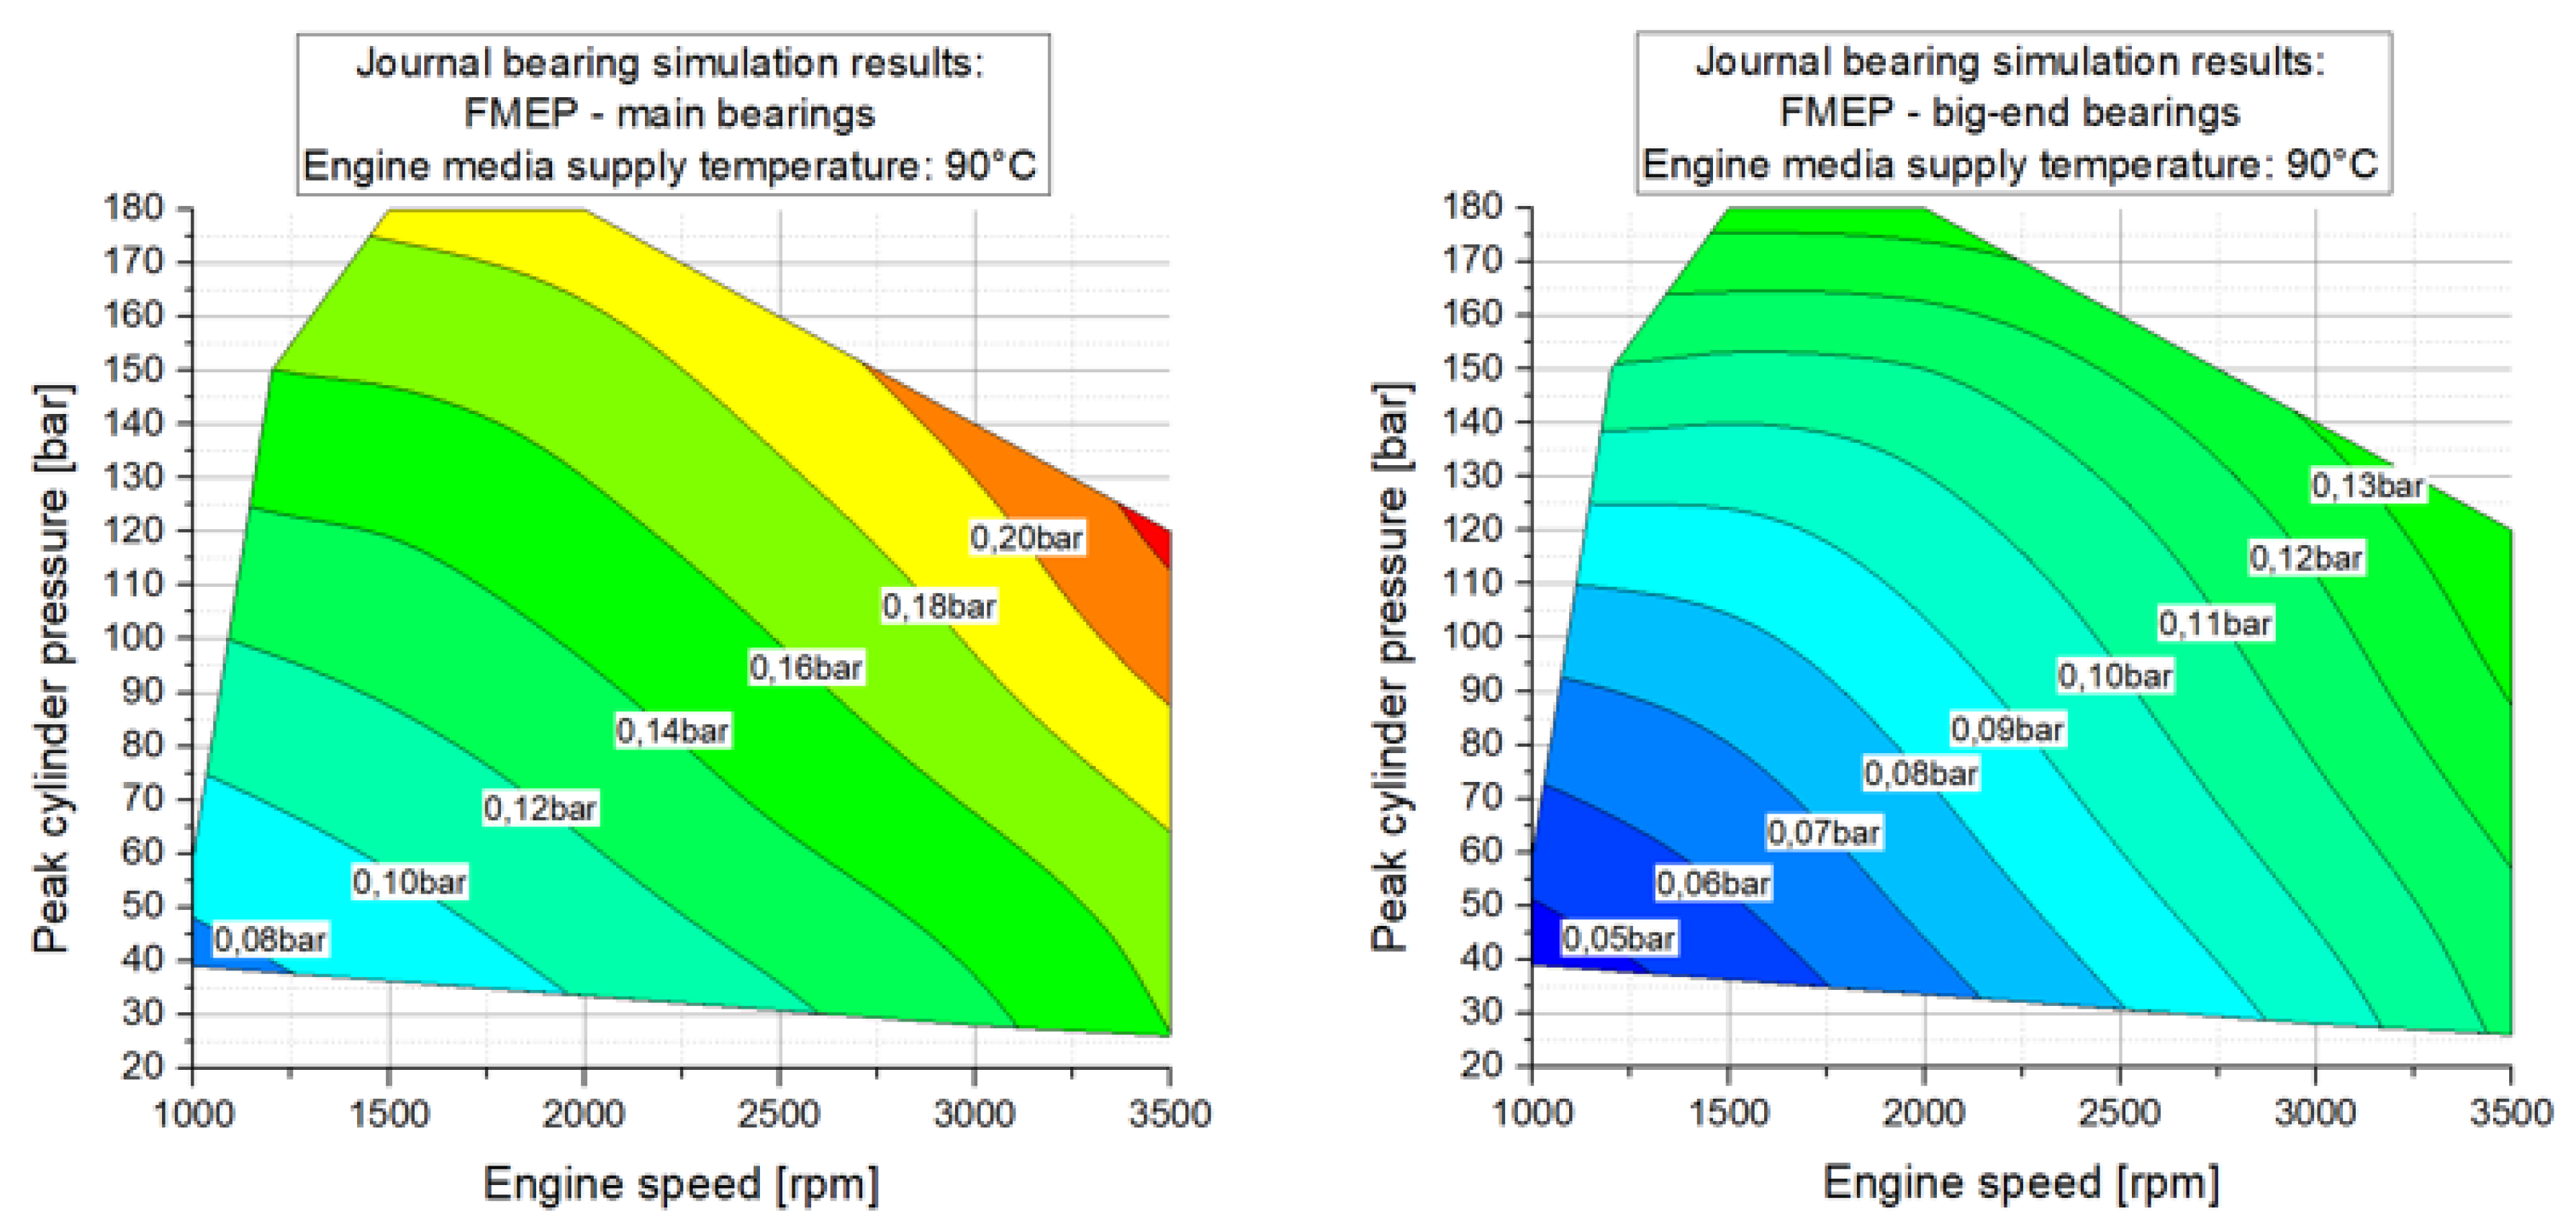
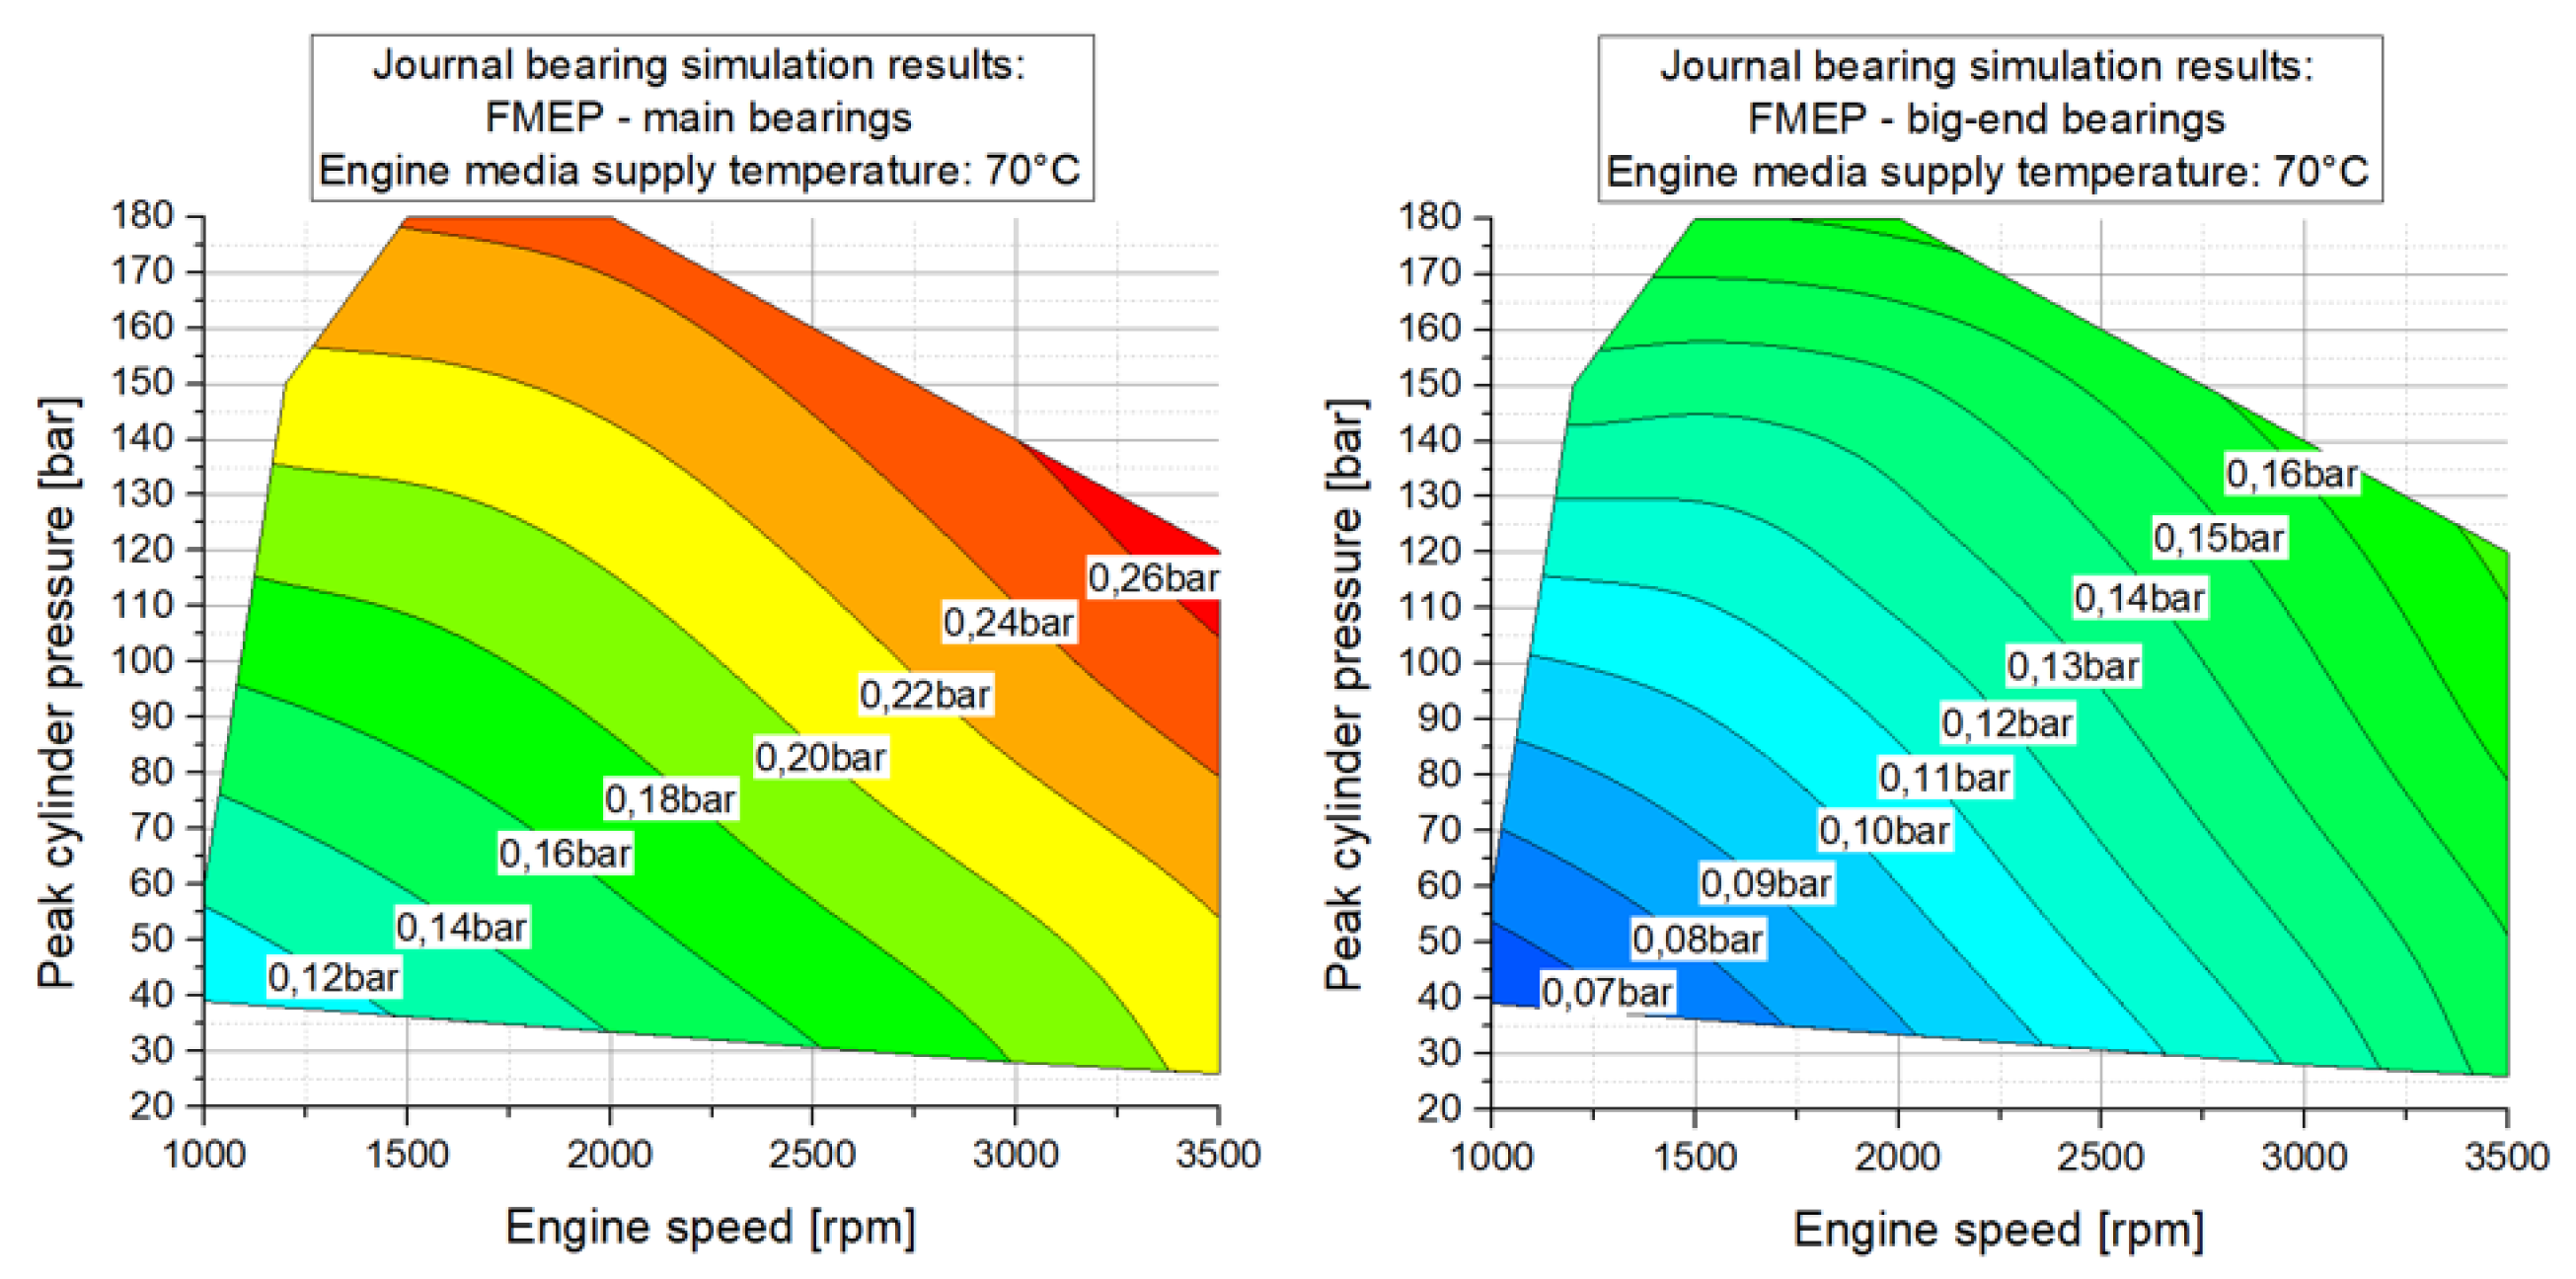
C. Consequently, 120 different engine operation points have been calculated to obtain the crankshaft journal-bearing friction losses. The resulting FMEP of the main- and big-end bearings for an engine media supply temperature of 90
C is shown in
Figure 26.
The results in
Figure 26 show the determined FMEP of the five main bearings ranging from 0.07 bar at an engine speed of n = 1000 rpm in a motored operation to 0.23 bar at an engine speed of n = 3500 rpm at an peak cylinder pressure of 120 bar. The friction losses of the four big-end bearings range from 0.04 bar at an engine speed of n = 1000 rpm in a motored operation to 0.14 bar at an engine speed of n = 3500 rpm at a peak cylinder pressure of 120 bar. The resulting FMEP of the main and big-end bearings at a lubricant supply temperature of 70
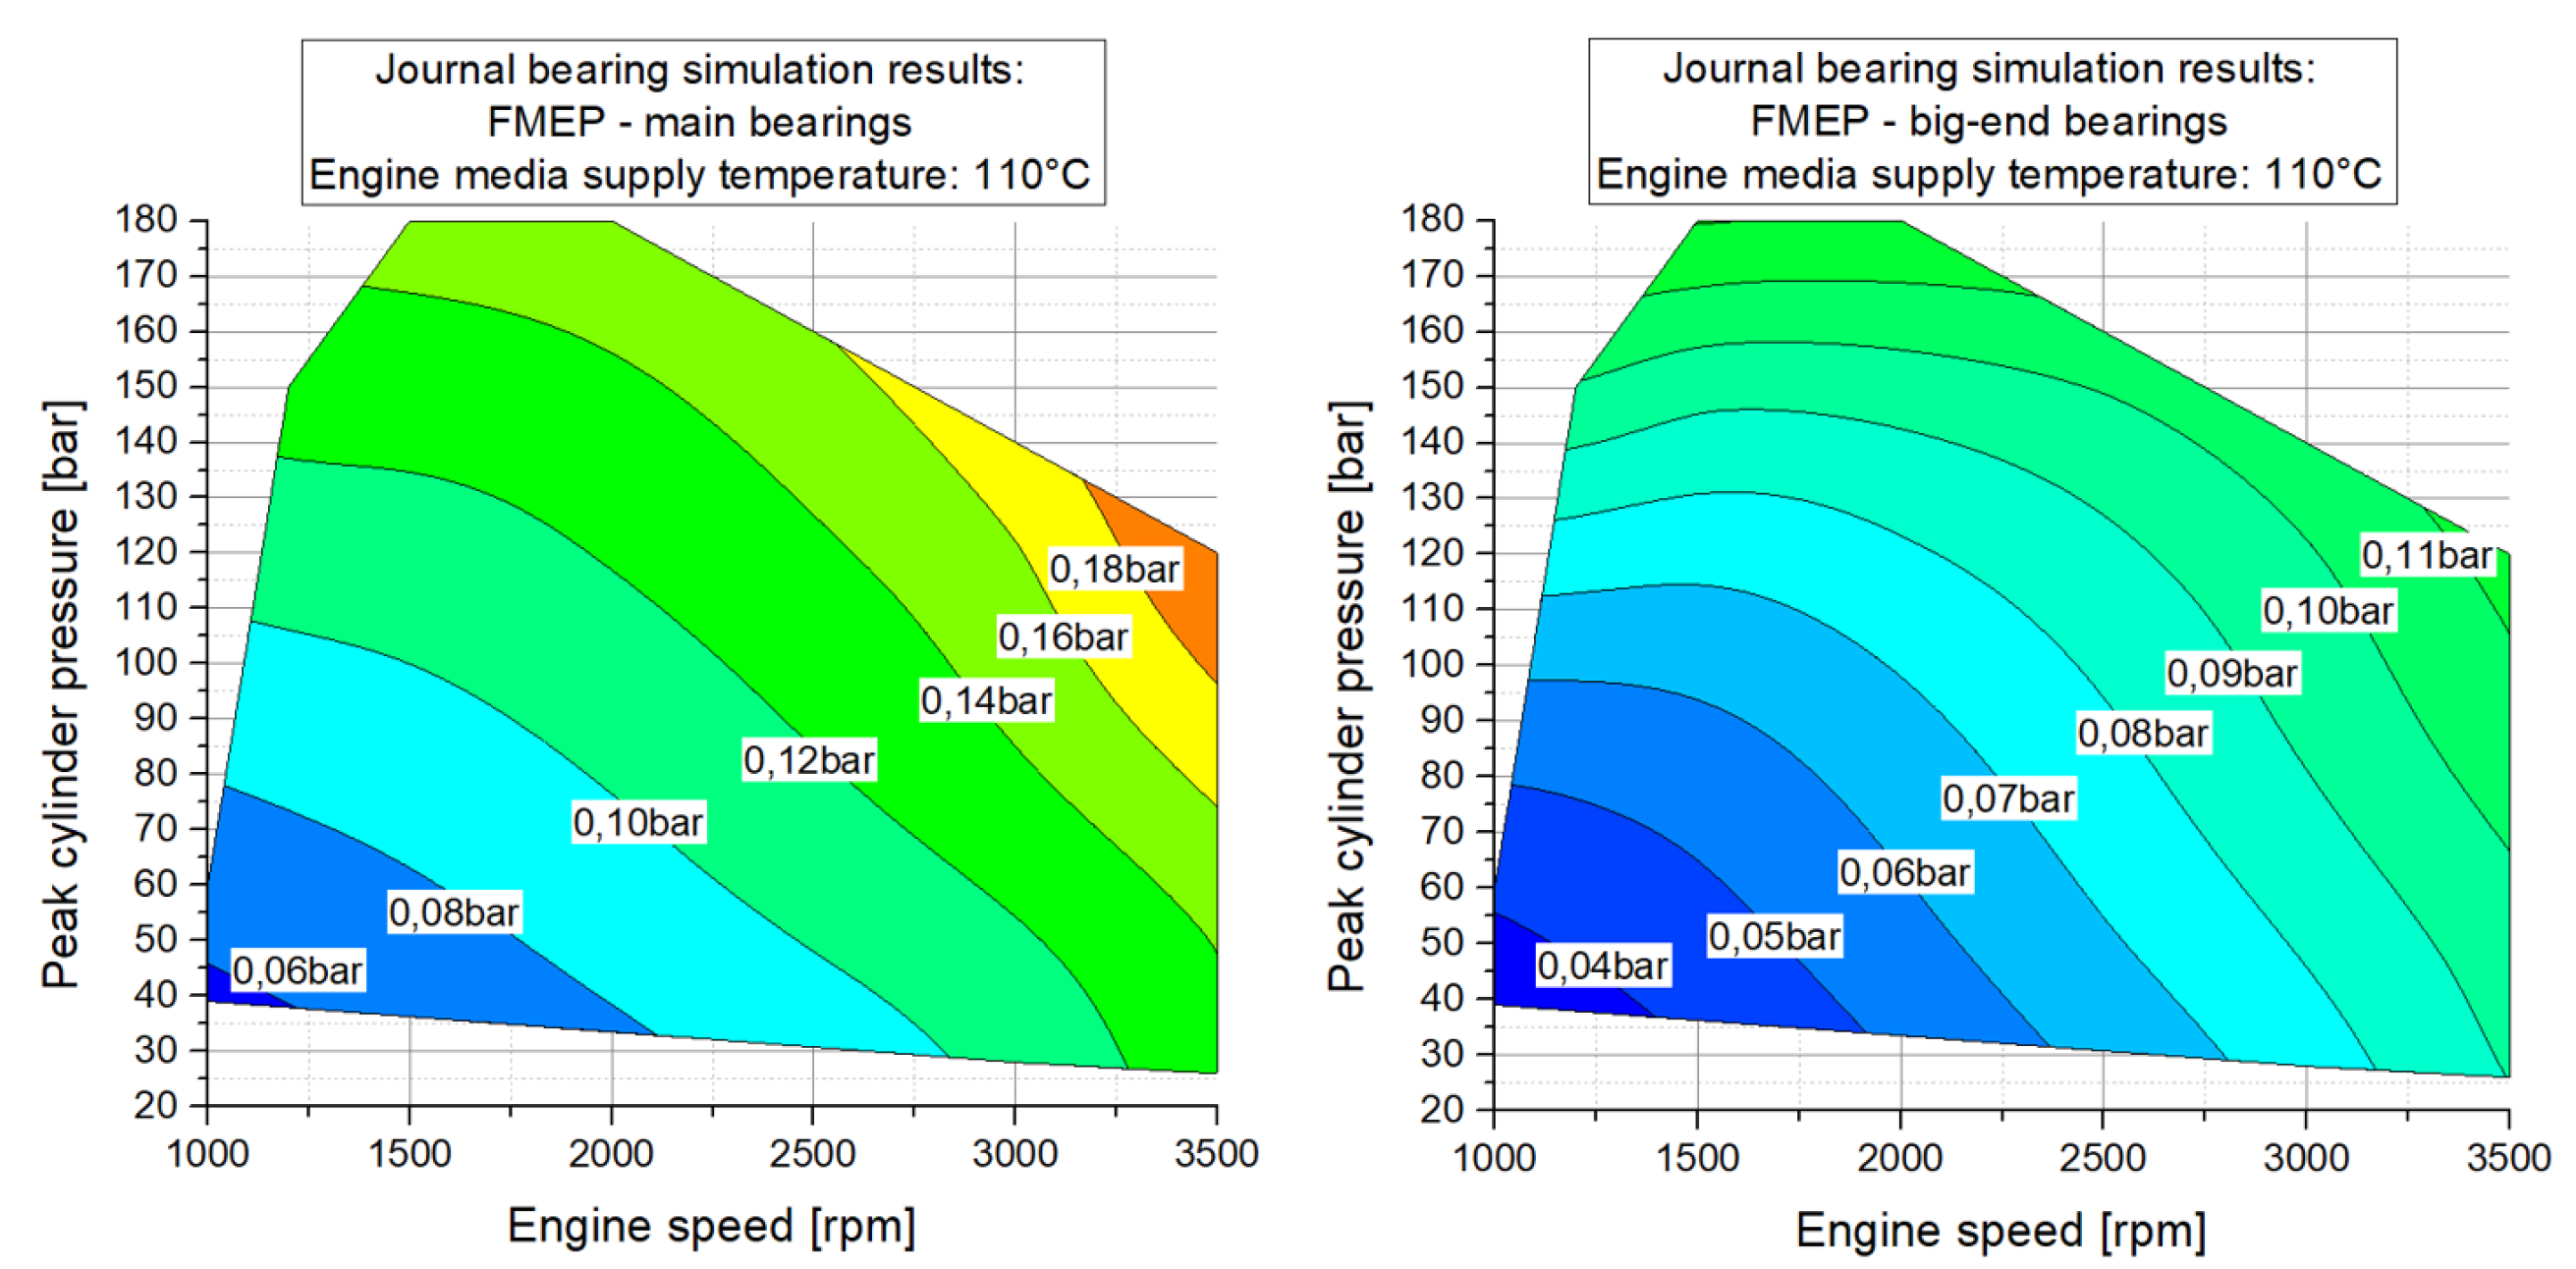
C and 110
C can be found in
Appendix A for the sake of completeness and are plotted in
Figure A6 and
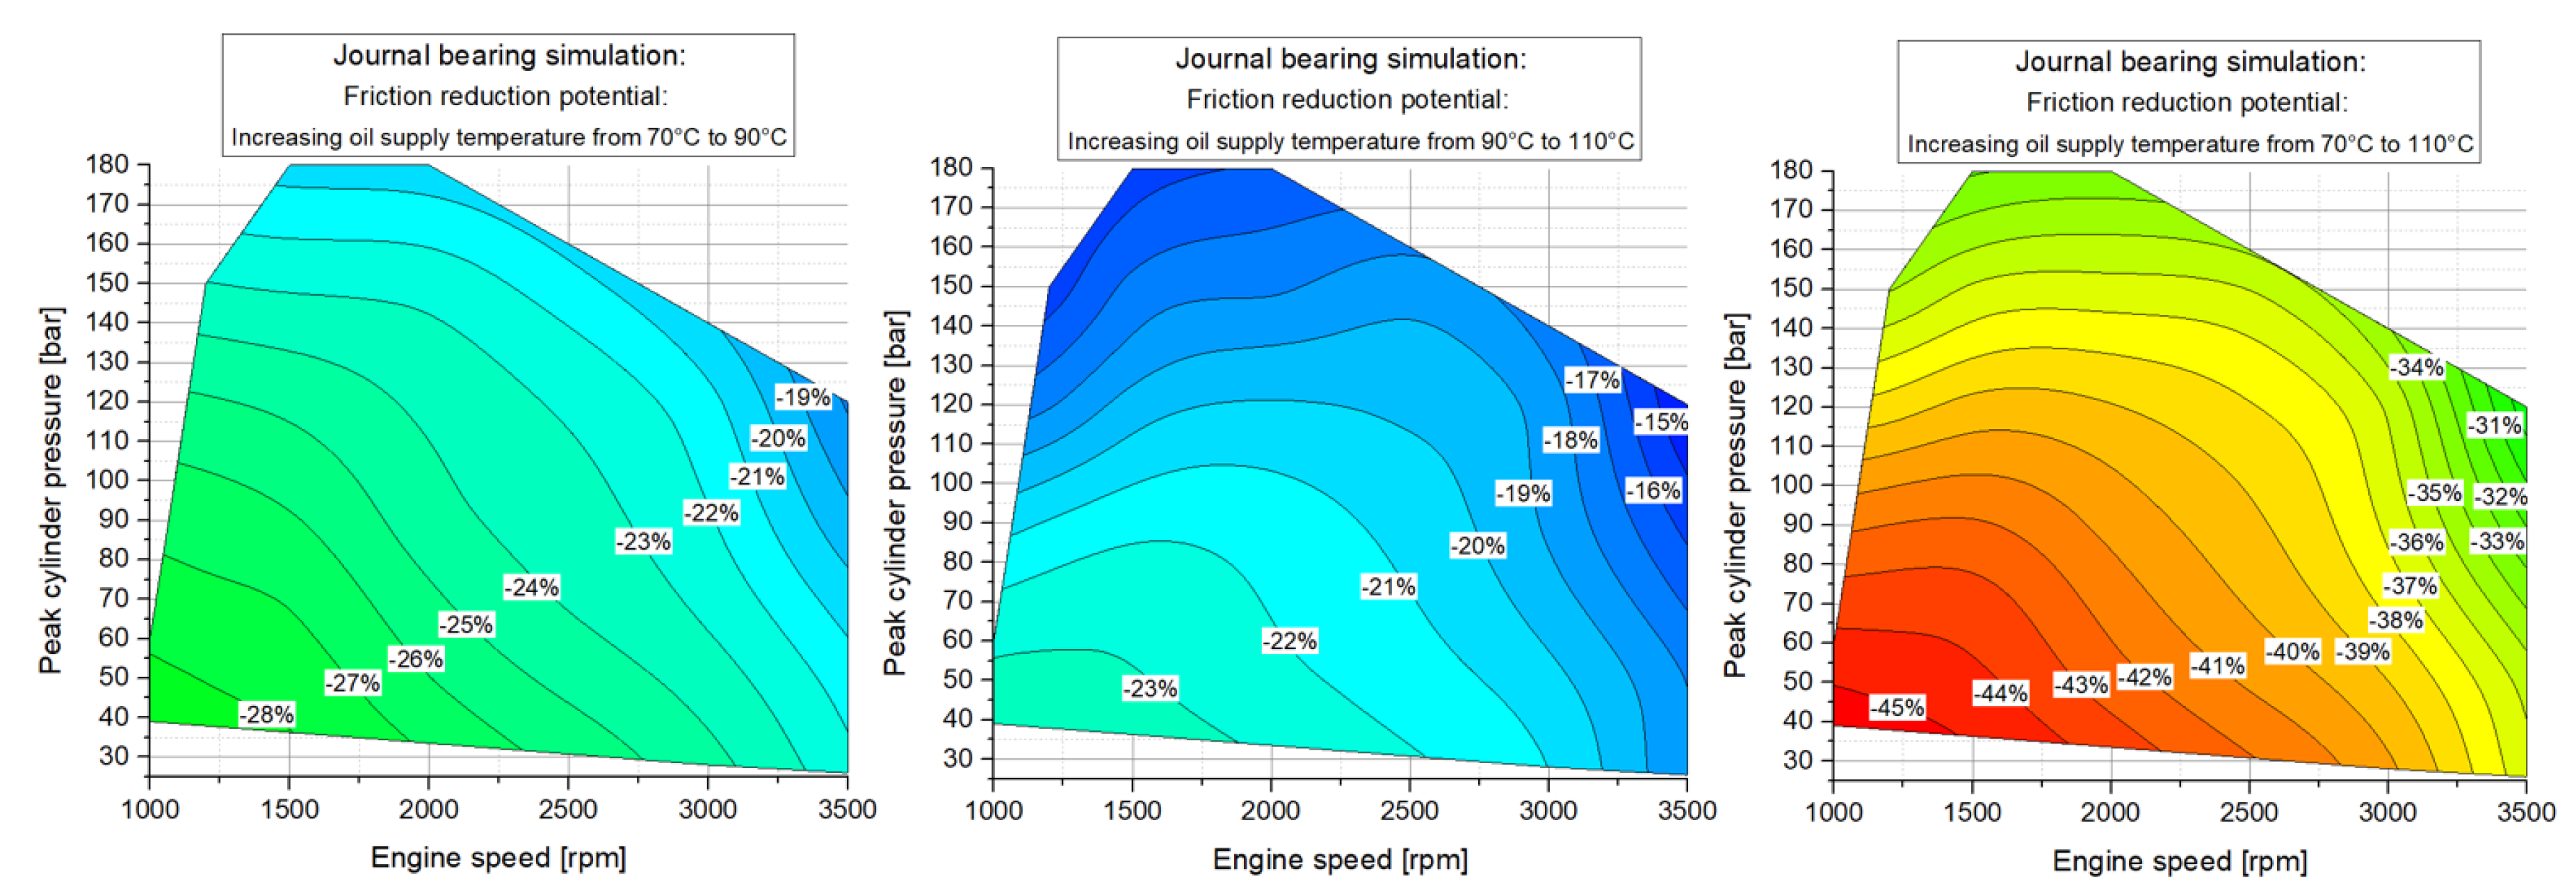
Figure A7. In addition, it is interesting to investigate the friction reduction potential when increasing the engine media supply temperature. Due to the calculation at different lubricant supply temperature levels, 70
C, 90
C, and 110
C, this was realized and the results are shown in
Figure 27.
The most significant friction reduction potential for the crankshaft journal bearings has been observed when the supply temperature is increased from 70 C to 110 C at engine speeds below n = 2000 rpm and at peak cylinder pressures smaller 80 bar. Here, the maximum friction reduction with more than 45% could be determined. It was further found that, at the crankshaft journal bearings, no mentionable mixed lubrication regime occurred over the entire investigated engine speed and load range.
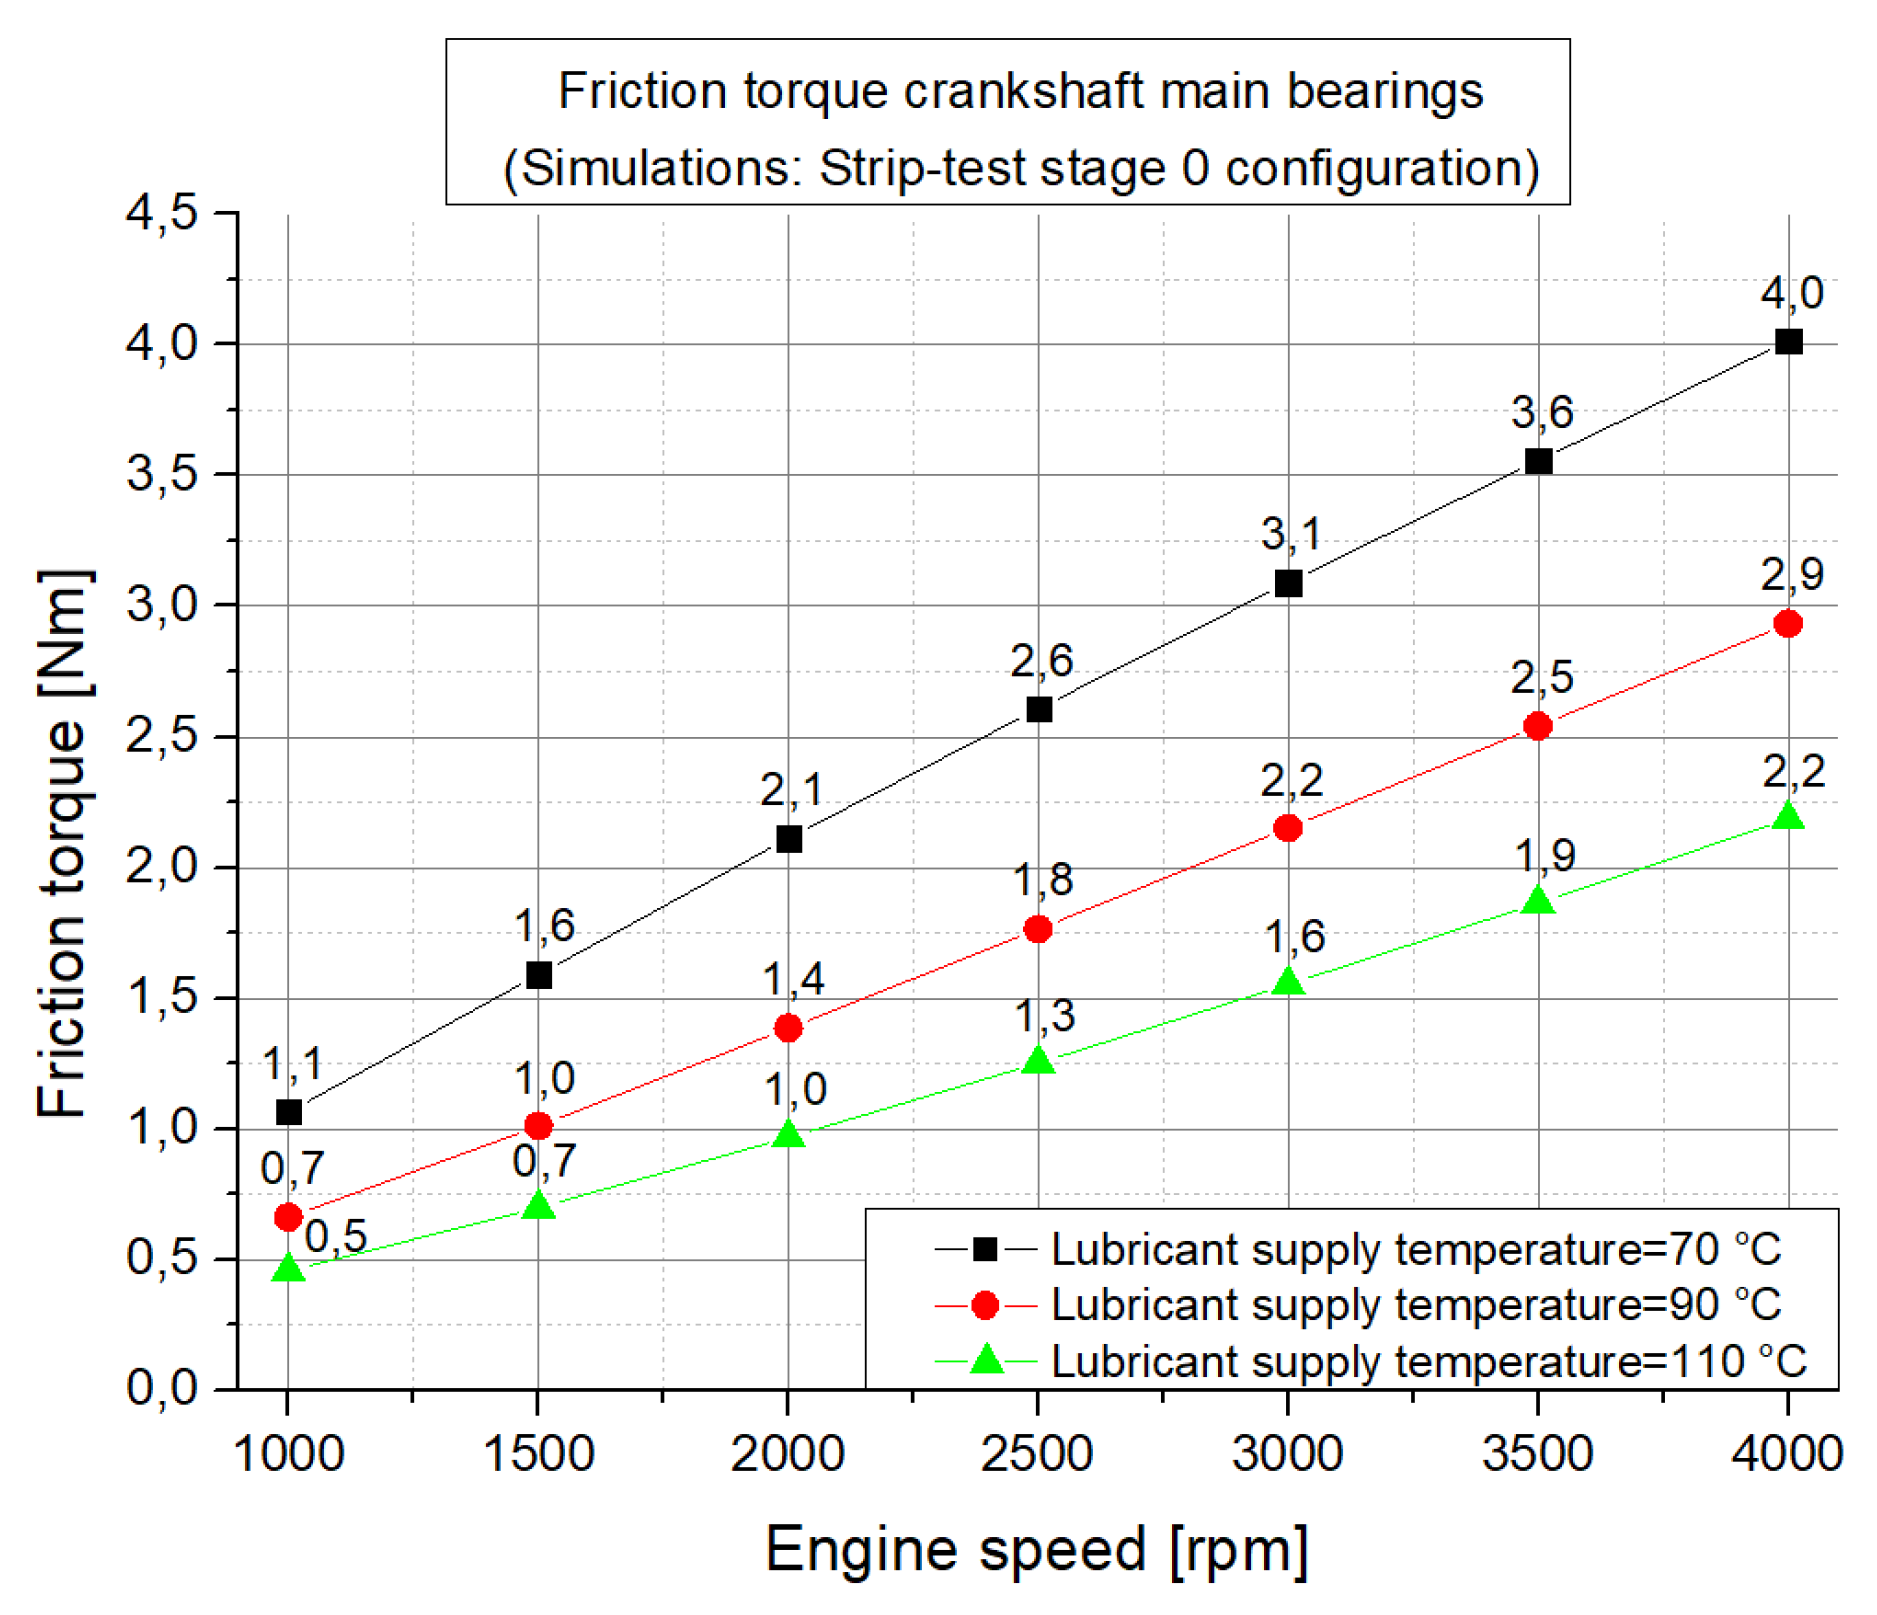
Simulation Results: Supplementary Torque Measurement Configuration (Strip-Test Stage 0)
To obtain the valve train friction losses using Equation (
2) of the developed combined friction break down approach, the journal-bearing friction losses at the engine configuration for strip-test stage 0 (without pistons and conrods but with the mass of the master weights at the crank pins) have been calculated. The resulting FMEP of the journal-bearing simulations in a strip-test stage 0 configuration is shown in
Figure 28 over the engine speed for different lubricant supply temperatures.
When comparing the calculated journal bearing friction losses to the results from the conventional base engine model, the strip-test stage 0 configuration shows a decreased FMEP level. This can be stated to the missing load transmitted by the pistons and conrods, which are not installed during the strip-test stage 0 investigations. Also, a clear temperature dependency is found in
Figure 28, where the highest friction losses occur at the lowest lubricant supply temperature and the lowest friction levels are investigated at the highest supply temperature. A possible explanation for this result is the decreasing viscosity of the lubricant with an increasing temperature (see
Figure 24), which yields a strong decrease of the hydrodynamic friction losses. In addition, high shear rates at high engine speeds are further responsible for a decreasing behaviour of the lubricant viscosity, which results in a continuing reduction of the journal-bearing friction losses as long as no severe mixed lubrication is present.
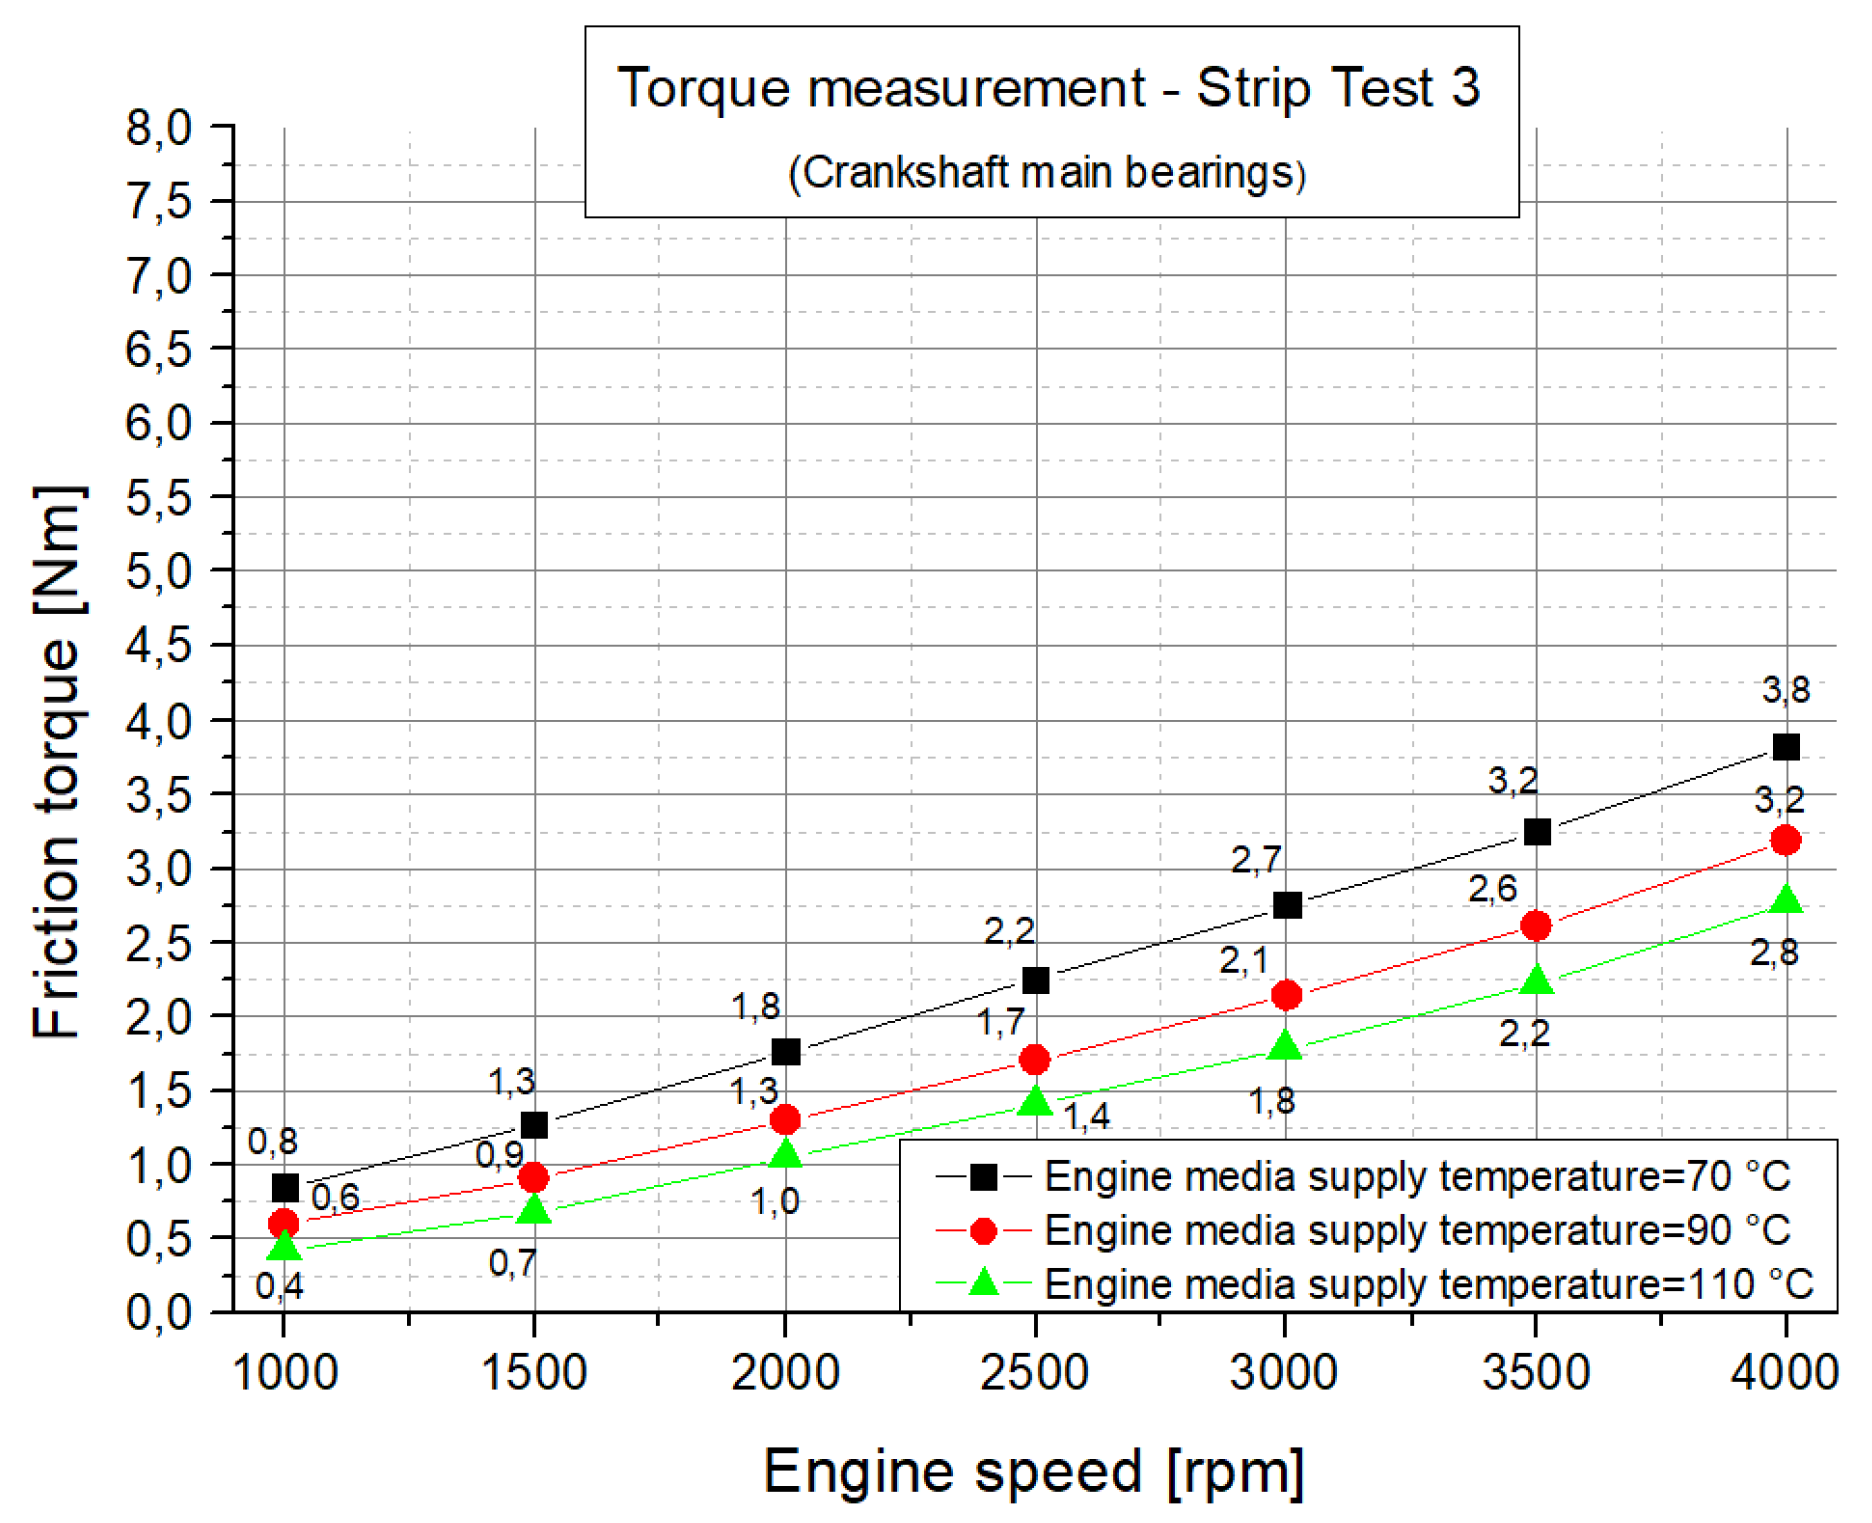
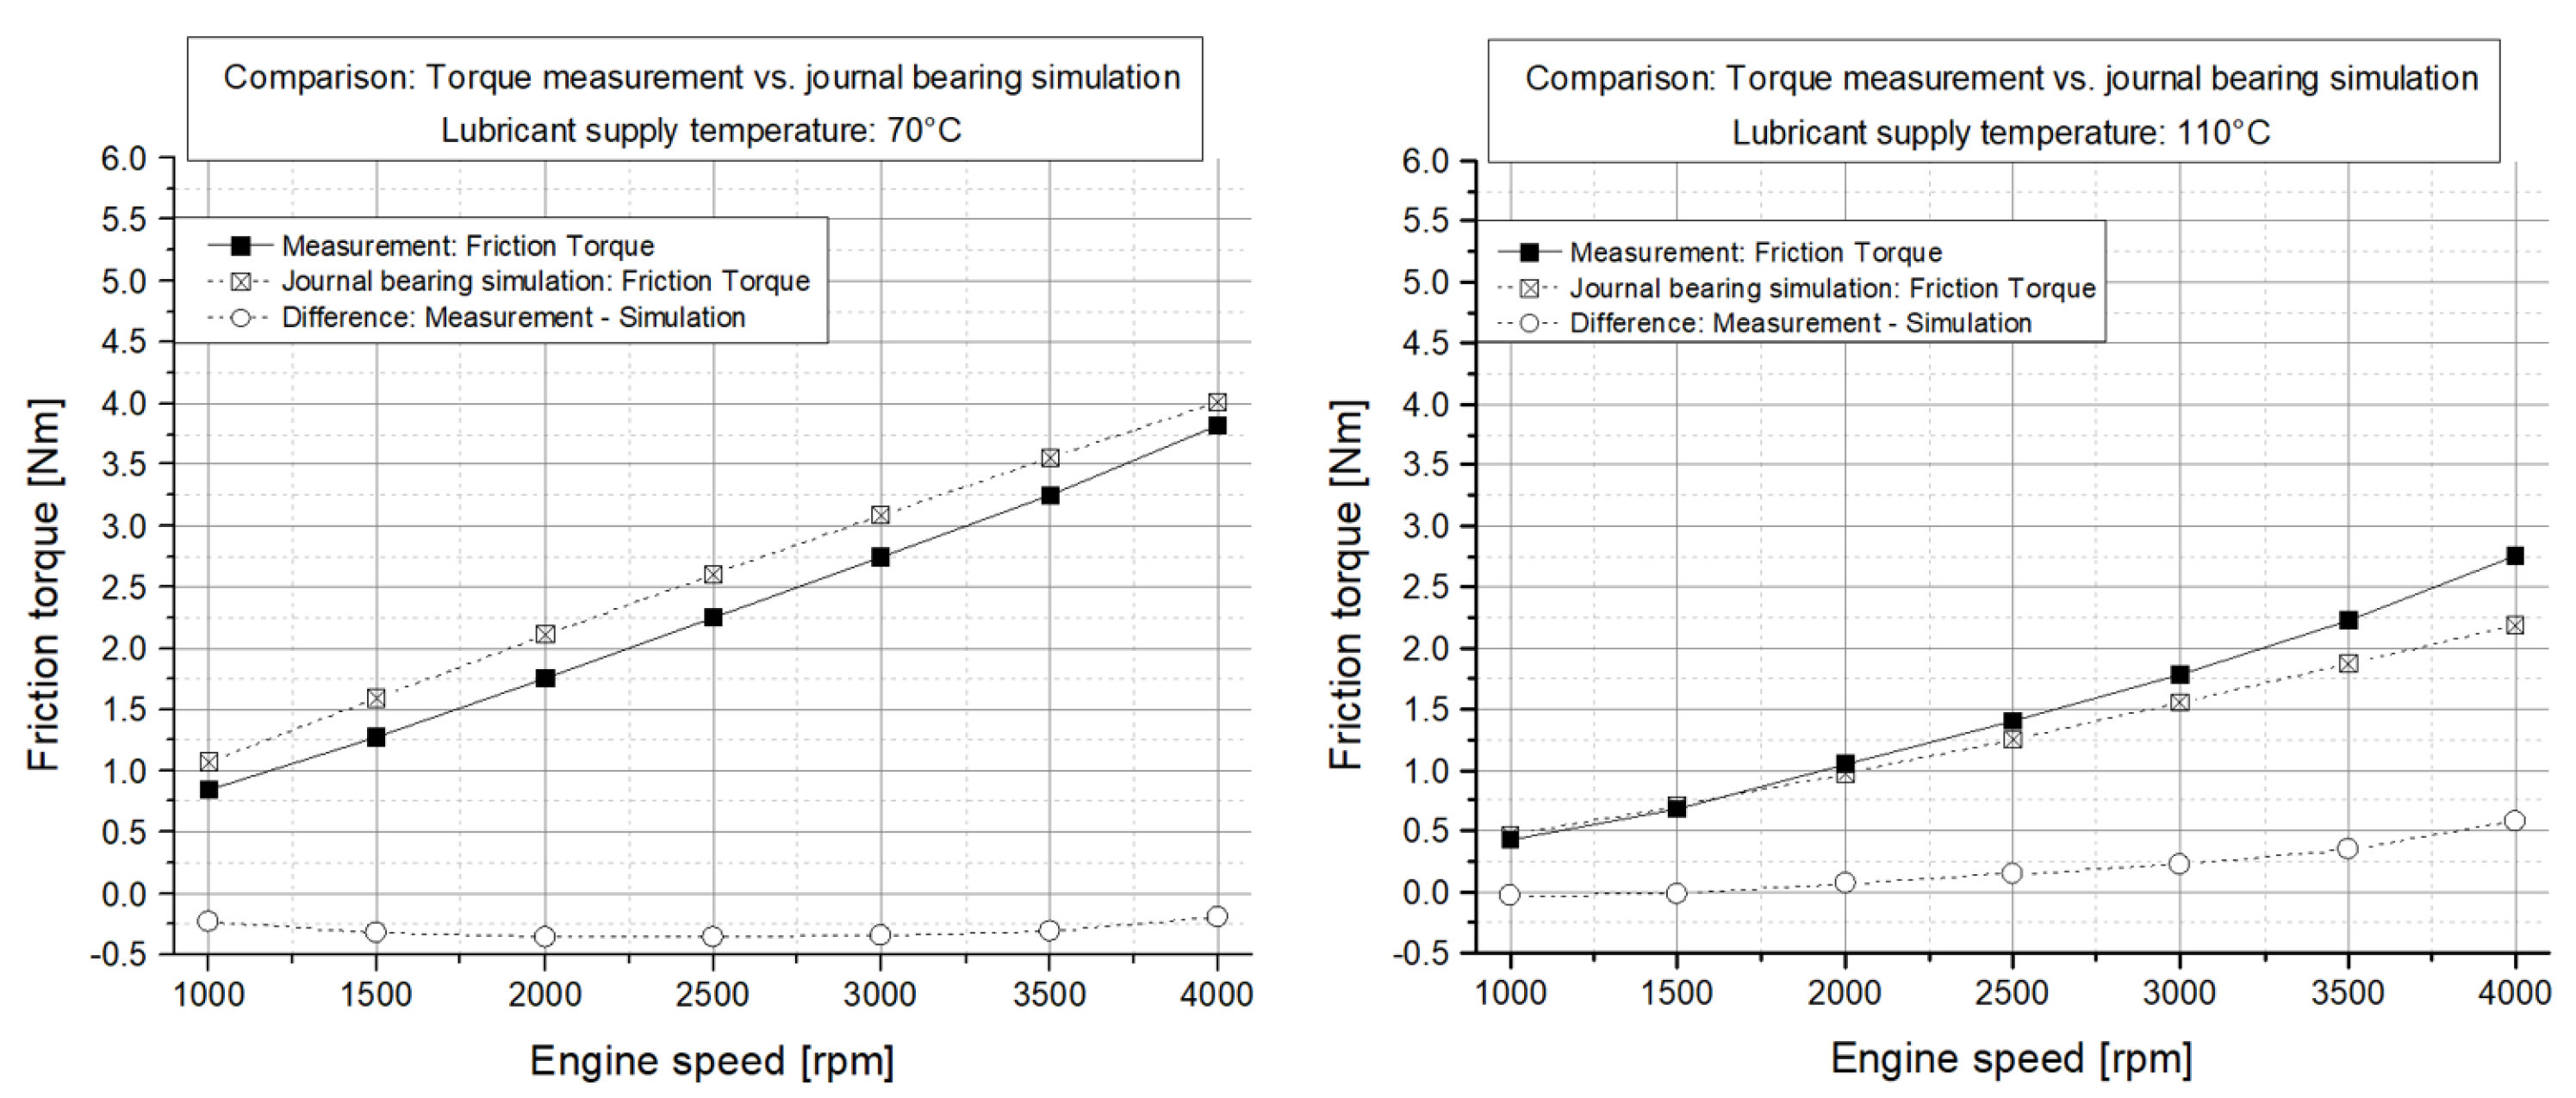
Another investigation using the calculated friction losses of the journal-bearing simulation can be conducted when performing comparisons to the conducted measurements. Therefore, the results of the calculations with the journal-bearing simulation model in the strip test stage 0 configuration (see
Figure 28) have been compared to the measurement results in the engine strip-test stage 3 configuration (see
Figure 21).
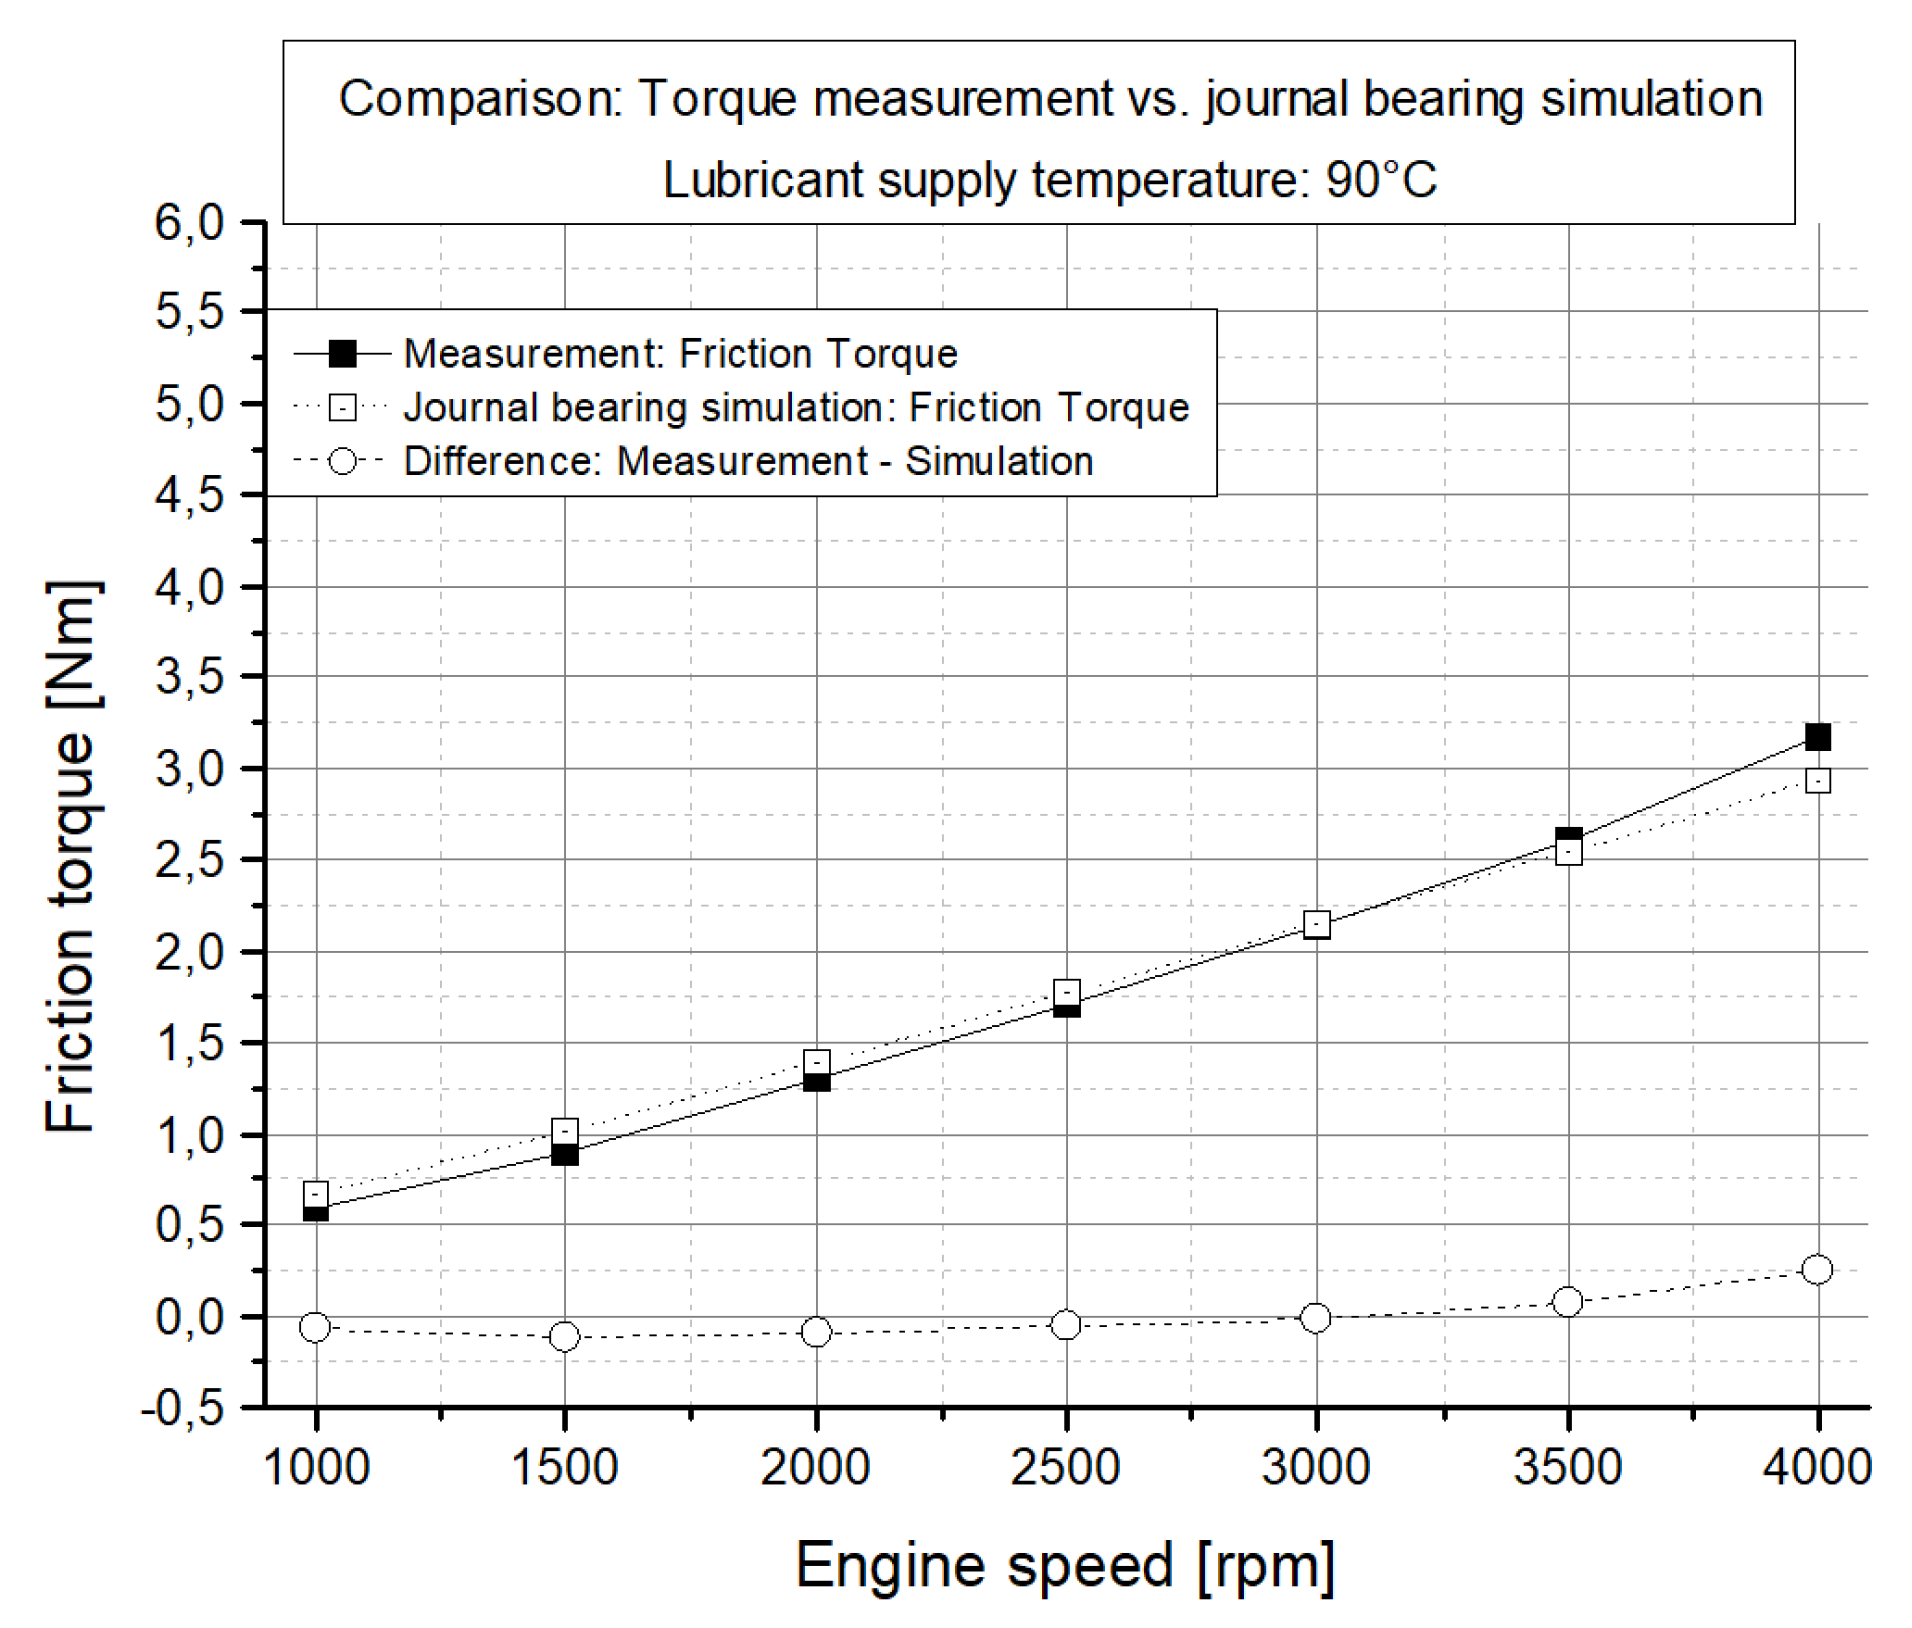
Figure 29 shows the comparison carried out for a lubricant supply temperature of 90
C.
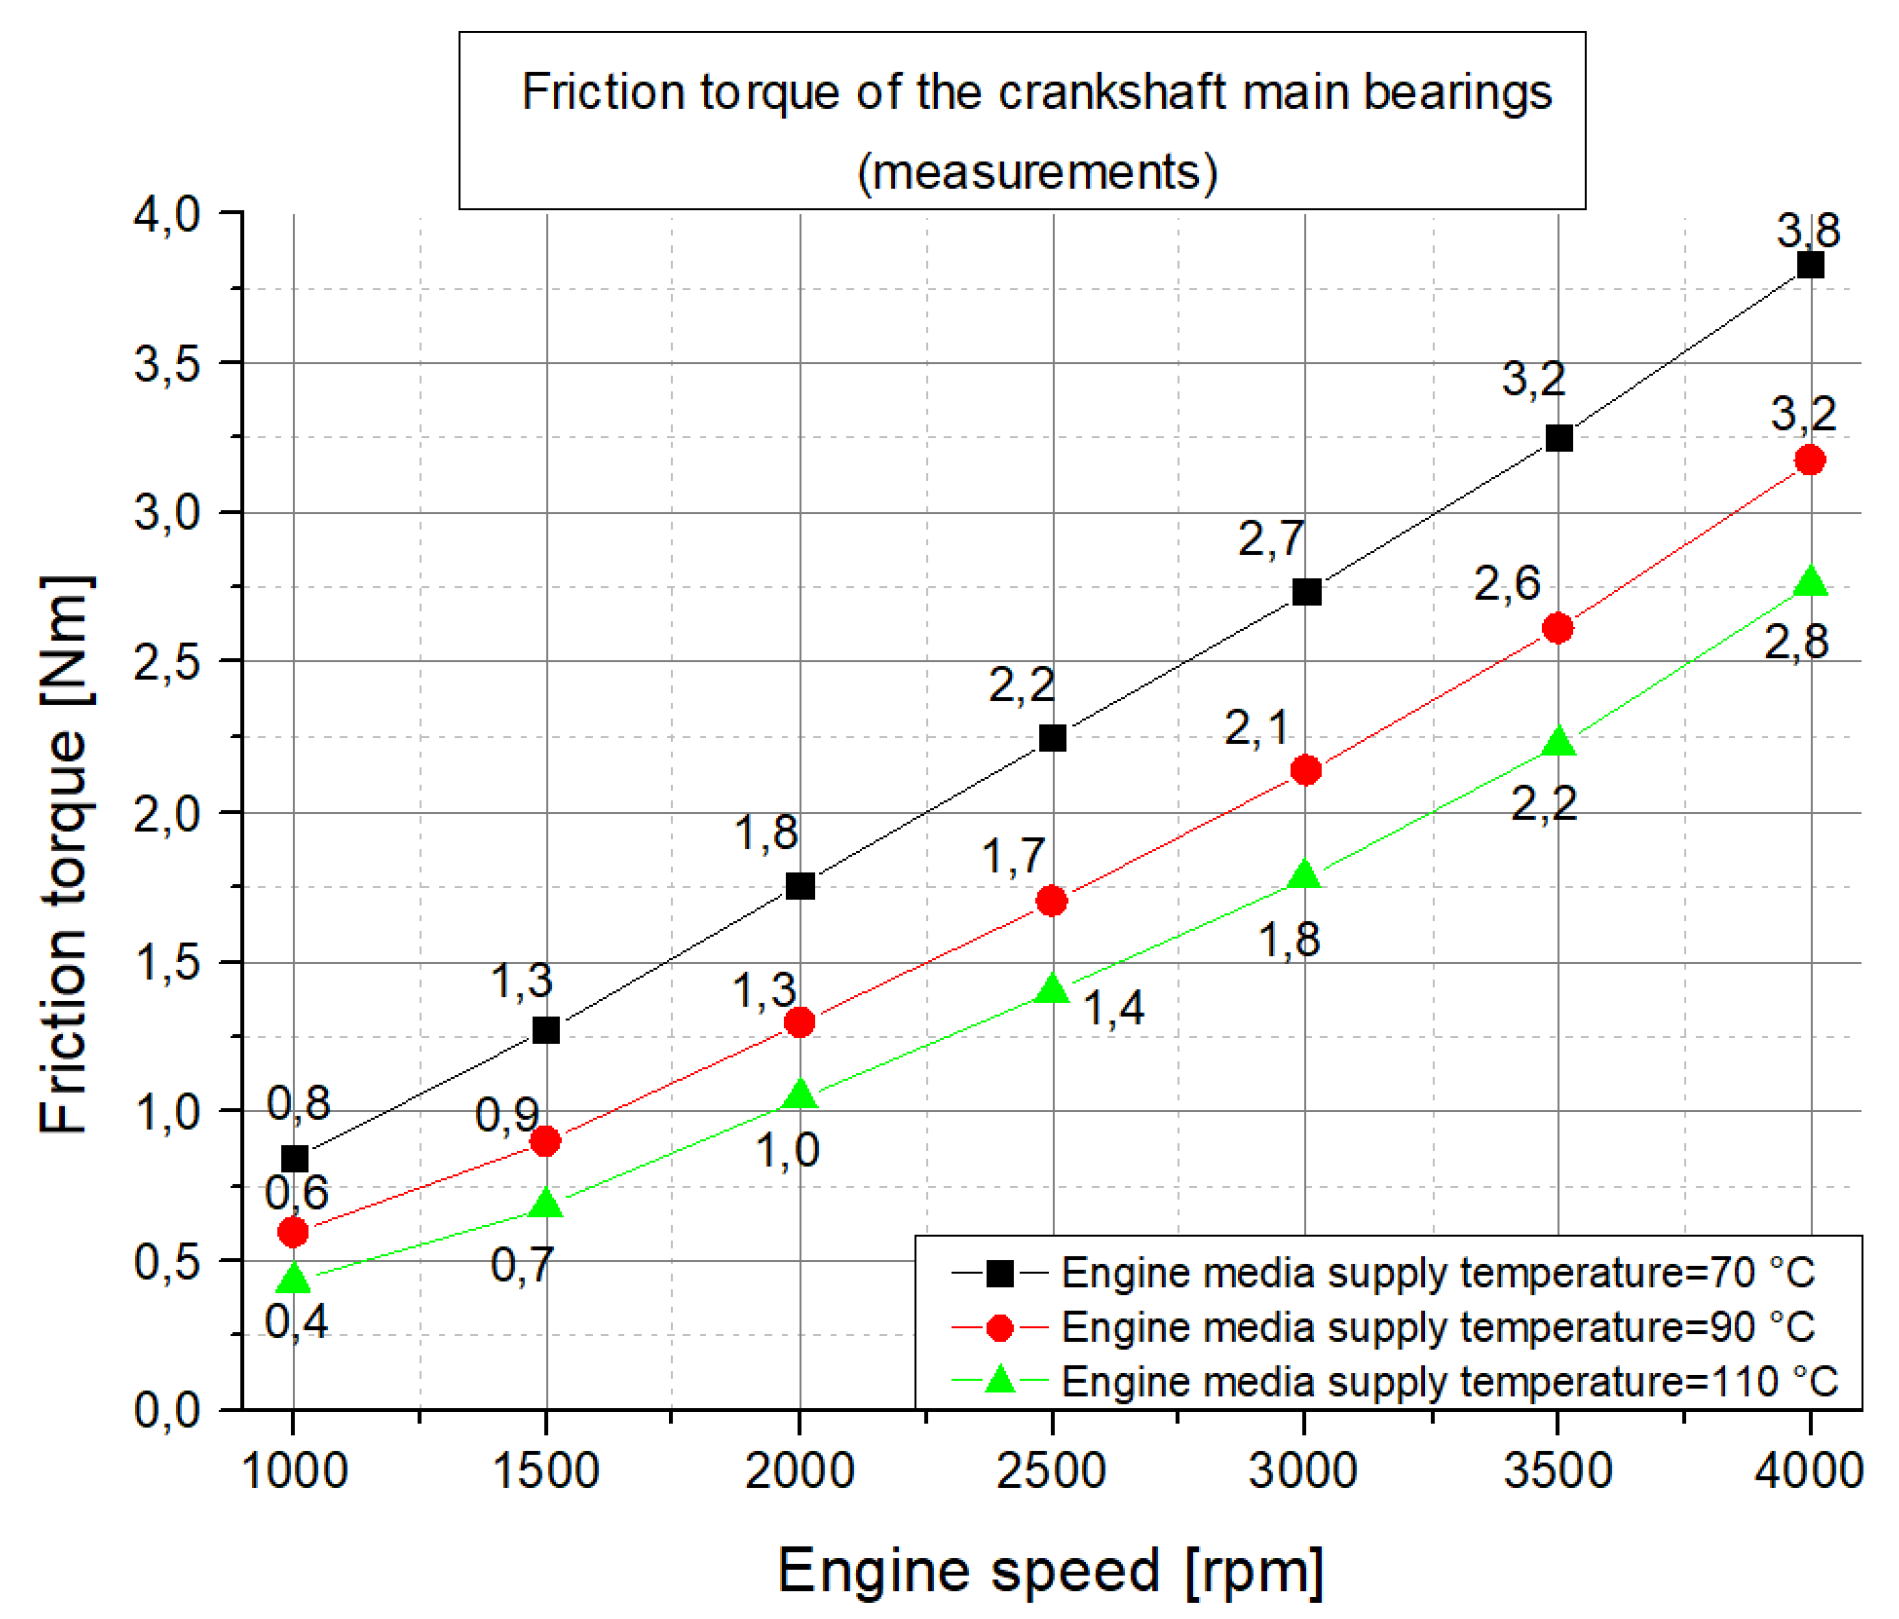
The comparison of the journal bearing simulation with the measurement data shows a good compliance over the investigated engine operation points. The deviation in friction torque between the measurement and simulation at an lubricant supply temperature of 90
C is within 0.1 Nm up to an engine speed of n = 3500 rpm and 0.24 Nm at n = 4000 rpm. It is important to mention that no specific matching between the developed simulation methodology and the measurement results has been conducted. For brevity, the comparison for a lubricant supply temperature of 70
C and 110
C are presented in
Appendix A in
Figure A8.
Summarizing, it is concluded that the conducted comparisons between the measurements in strip-test stage 3 and the journal-bearing simulation represent the worst case scenarios for the developed journal-bearing simulation methodology. The reason for that is that the validation process during the development of the journal-bearing simulation model has been performed with the experimental data from journal-bearing test-rig measurements where the bearing load is a dominant factor for the resulting journal-bearing friction losses. For that reason, it can be expected that the calculation results of the journal-bearing friction losses are significantly improved for load conditions using the simulation model of the base engine including the conventional crank train.
6. Conclusions
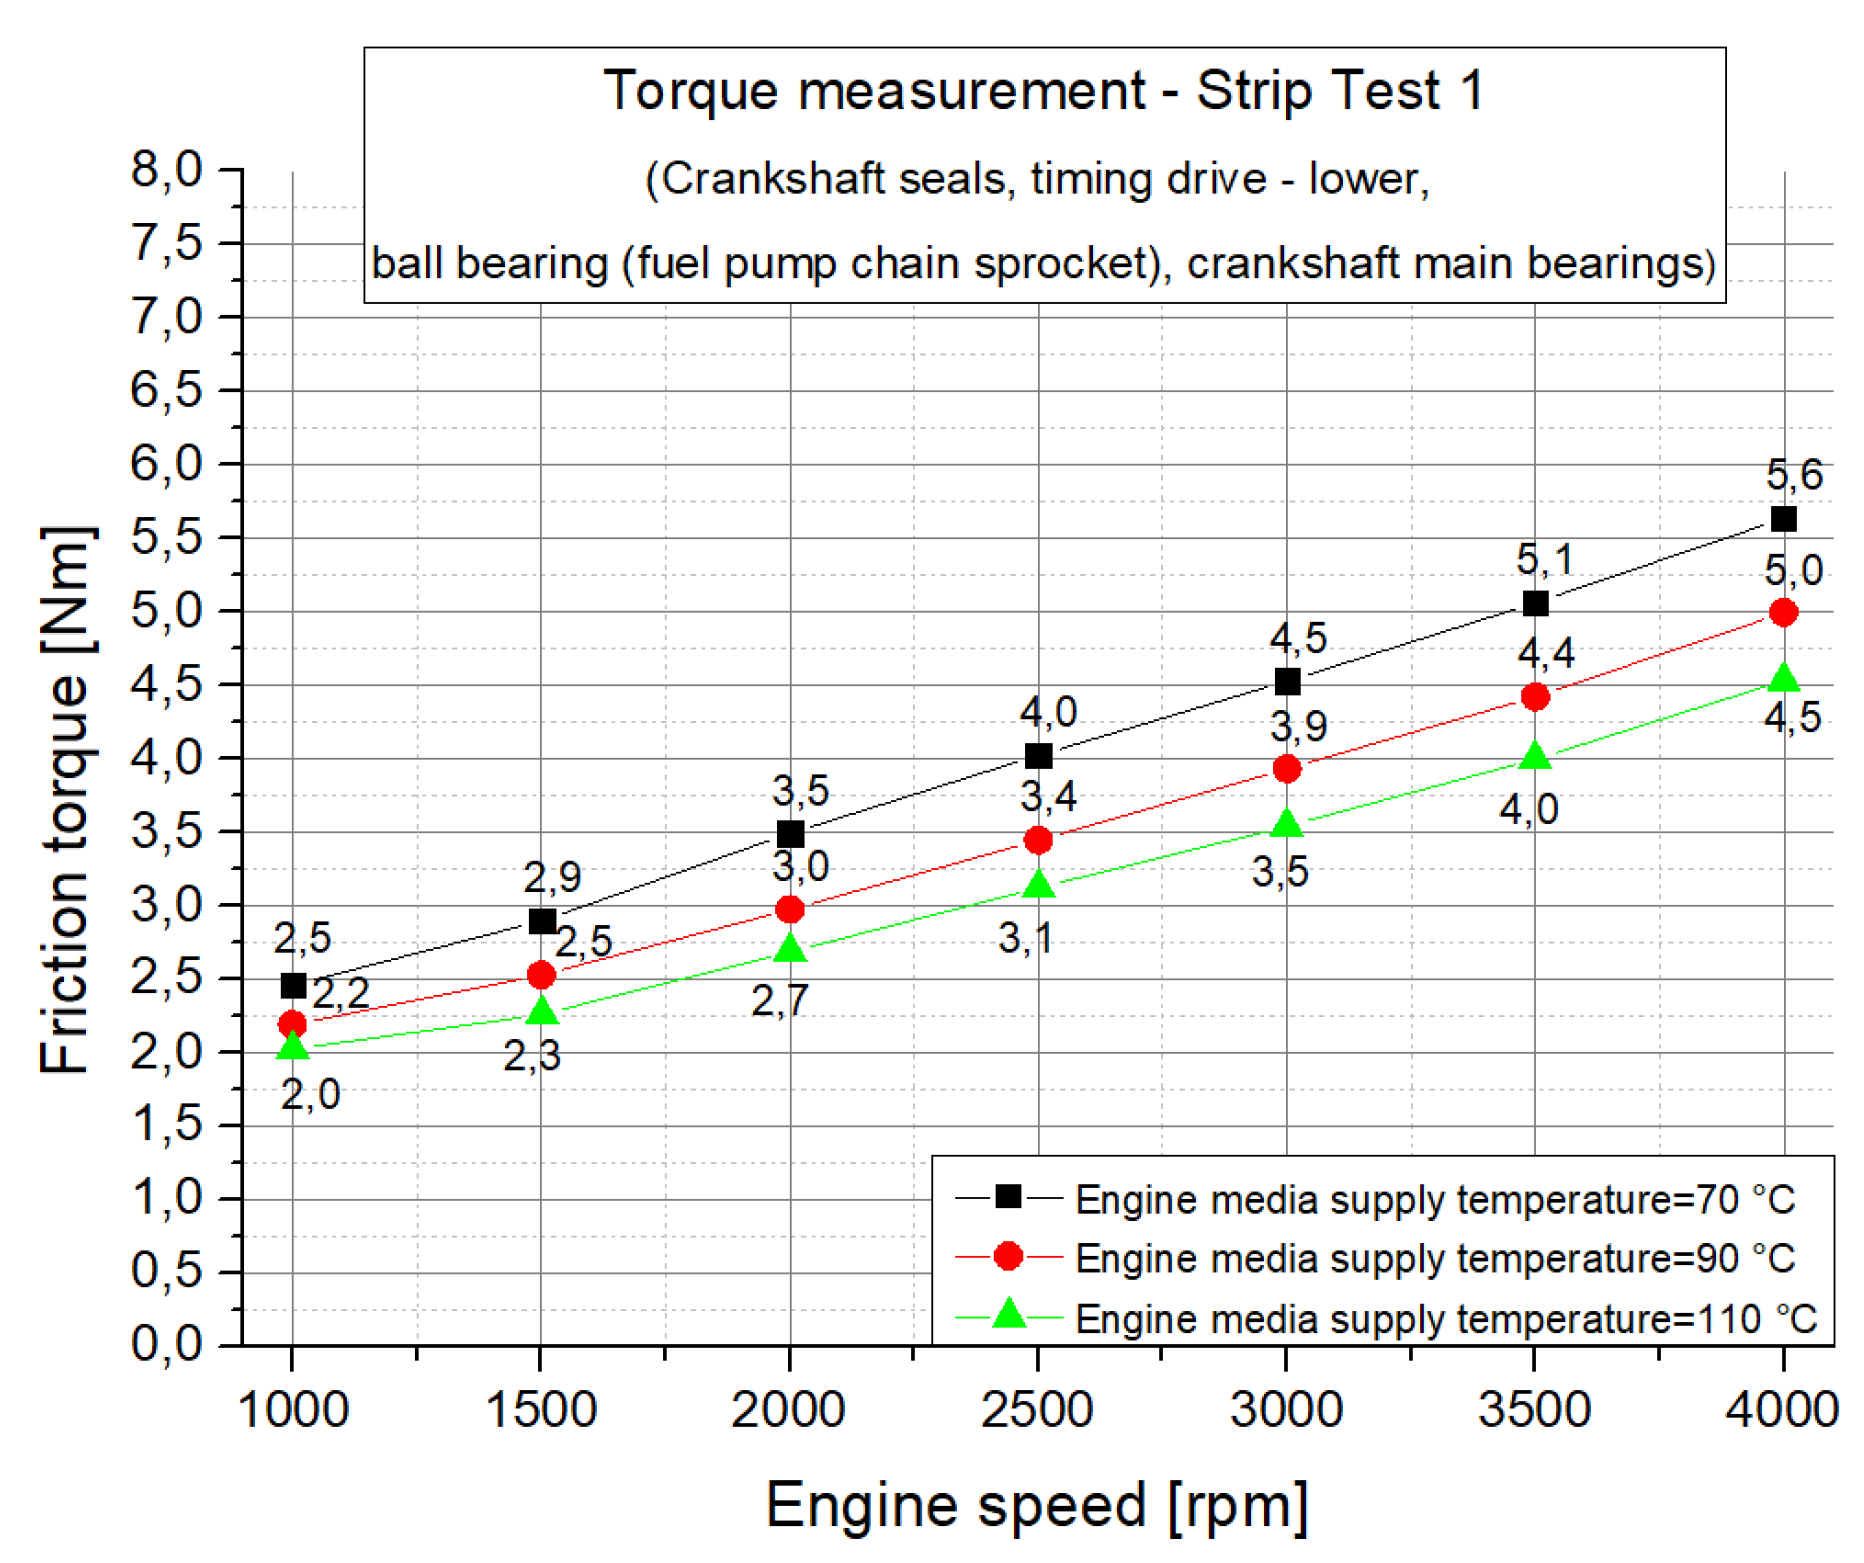
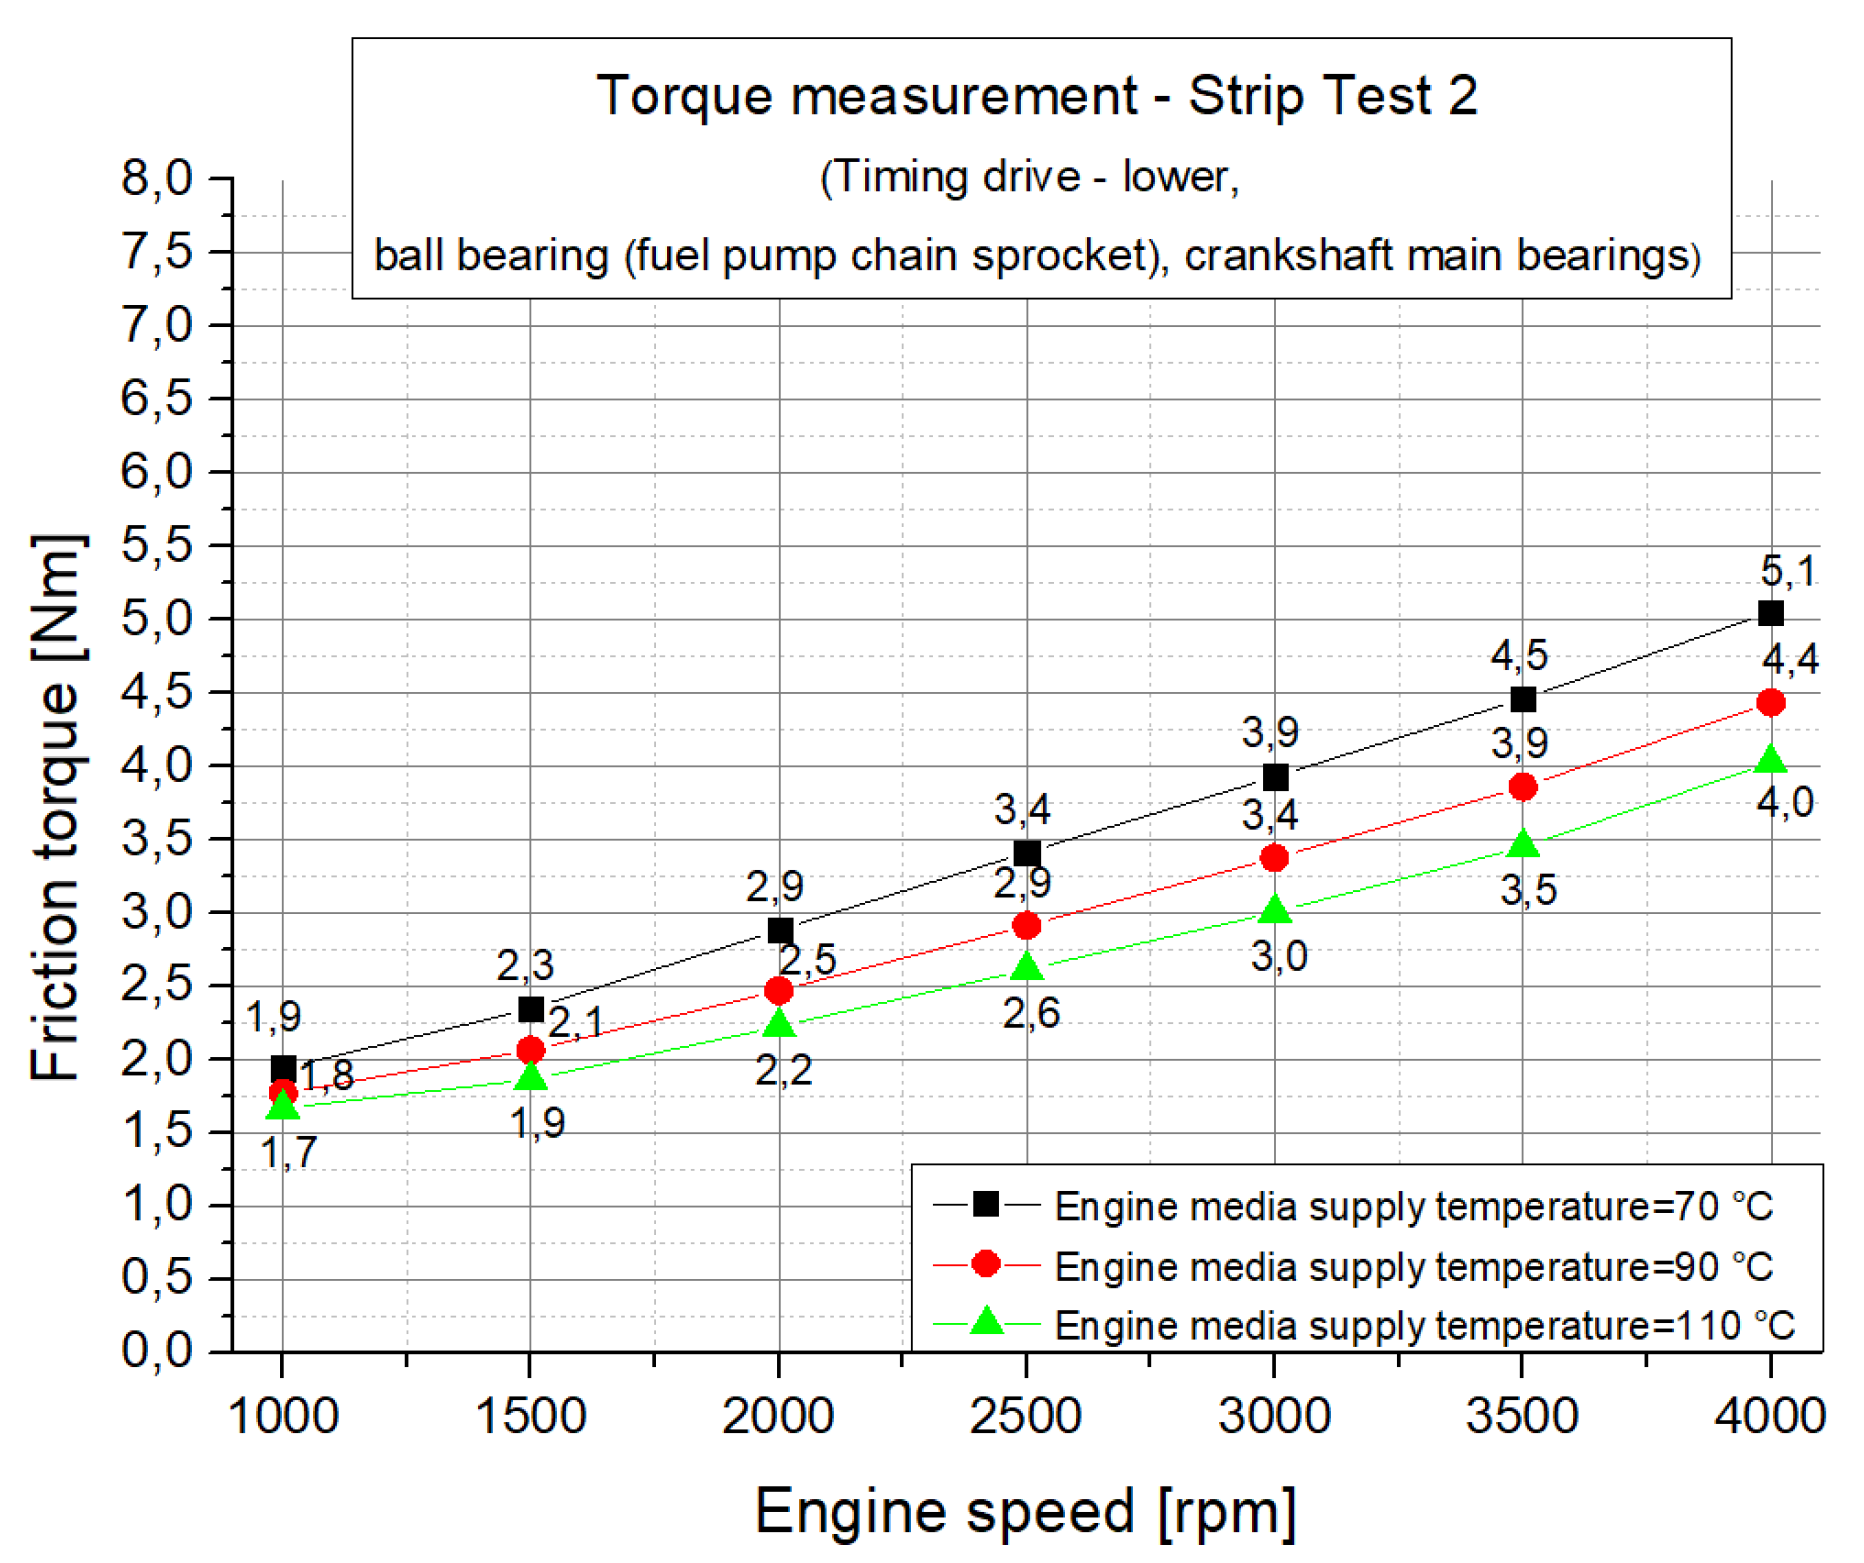
A combined approach using measurements and a simulation to determine the friction power losses of a modern passenger-car diesel engine was used to analyse the tribological behaviour of the base engine and its subassembly crankshaft journal bearings, valve train, and piston group over the entire engine speed and load operation conditions. The approach brought together the experimental data resulting from engine friction measurements and predictive journal bearing friction loss simulations. The experimental tests were conducted using a motored engine test bed with external charging and an air recirculation system to improve the thermal boundary conditions of the piston group. The measurements were performed for different engine media supply temperatures varying between 70 C and 110 C to determine the tribological engine performance under changing thermal boundary conditions. In addition, a four stage strip-measurement campaign was conducted for this engine to experimentally analyse the friction losses of the valve train (including upper timing drive), lower timing drive, crankshaft seals, and crankshaft main bearings.
For the simulation part, a simulation model of the engine was created using detailed geometry, surface, and lubricant data using the approach developed by the authors that is well-documented and has a proven accuracy.
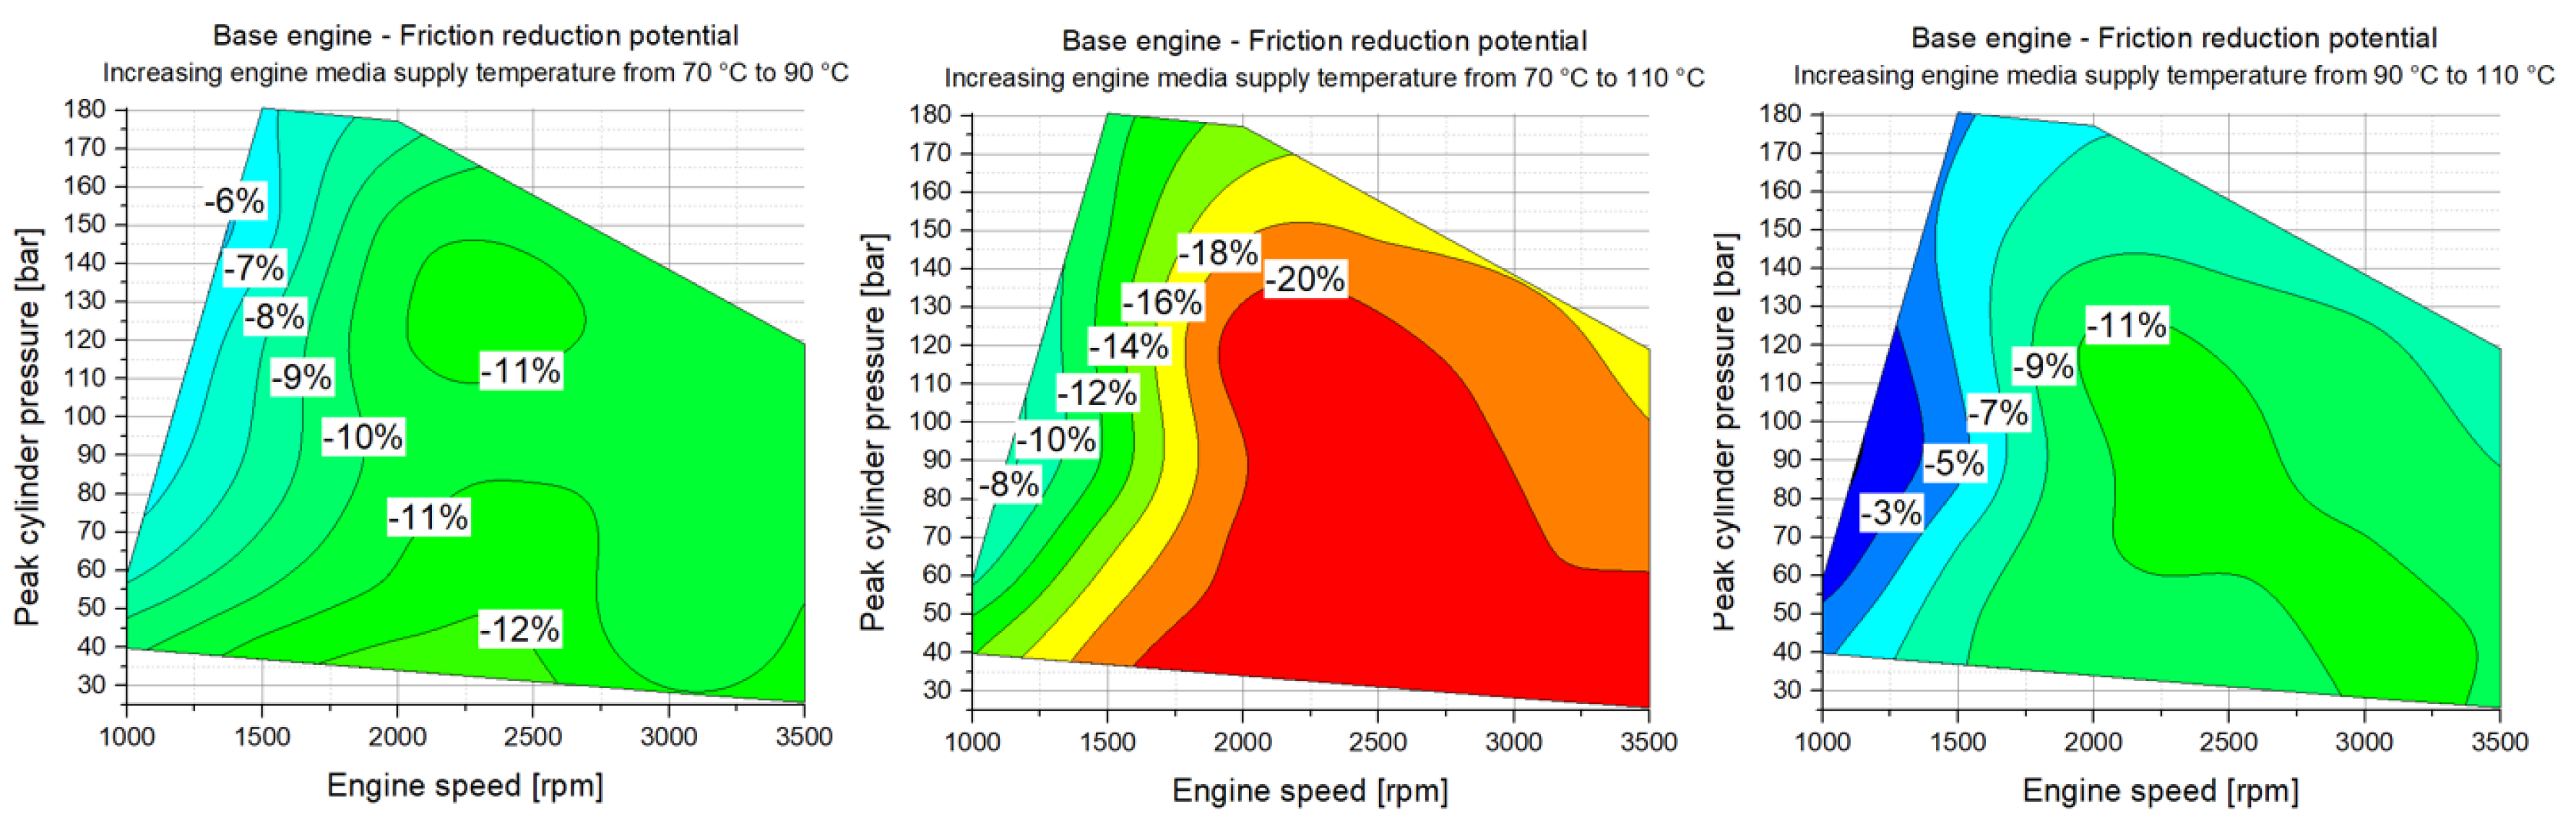
The experimental tests show that, for the entire base engine, a friction reduction potential above 20% could be realized by increasing the engine media supply temperatures from 70 C to 110 C. This showed that, especially for new engine modes of operation like start/stop systems and more advanced strategies like early engine stopping (e.g., at vehicle speeds below 30 km/h) using hybridization, challenges arise for the thermal management systems to keep oil temperatures at desired high levels to decrease the friction losses of the combustion engine and to maintain an optimal fuel economy. The usage of low viscosity lubricants could further improve the friction losses of the engine, especially when operating the engine at low lubricant temperatures. However, at the same time, care had to be taken regarding increased mixed lubrication in particular for low engine speeds and high lubricant supply temperatures.
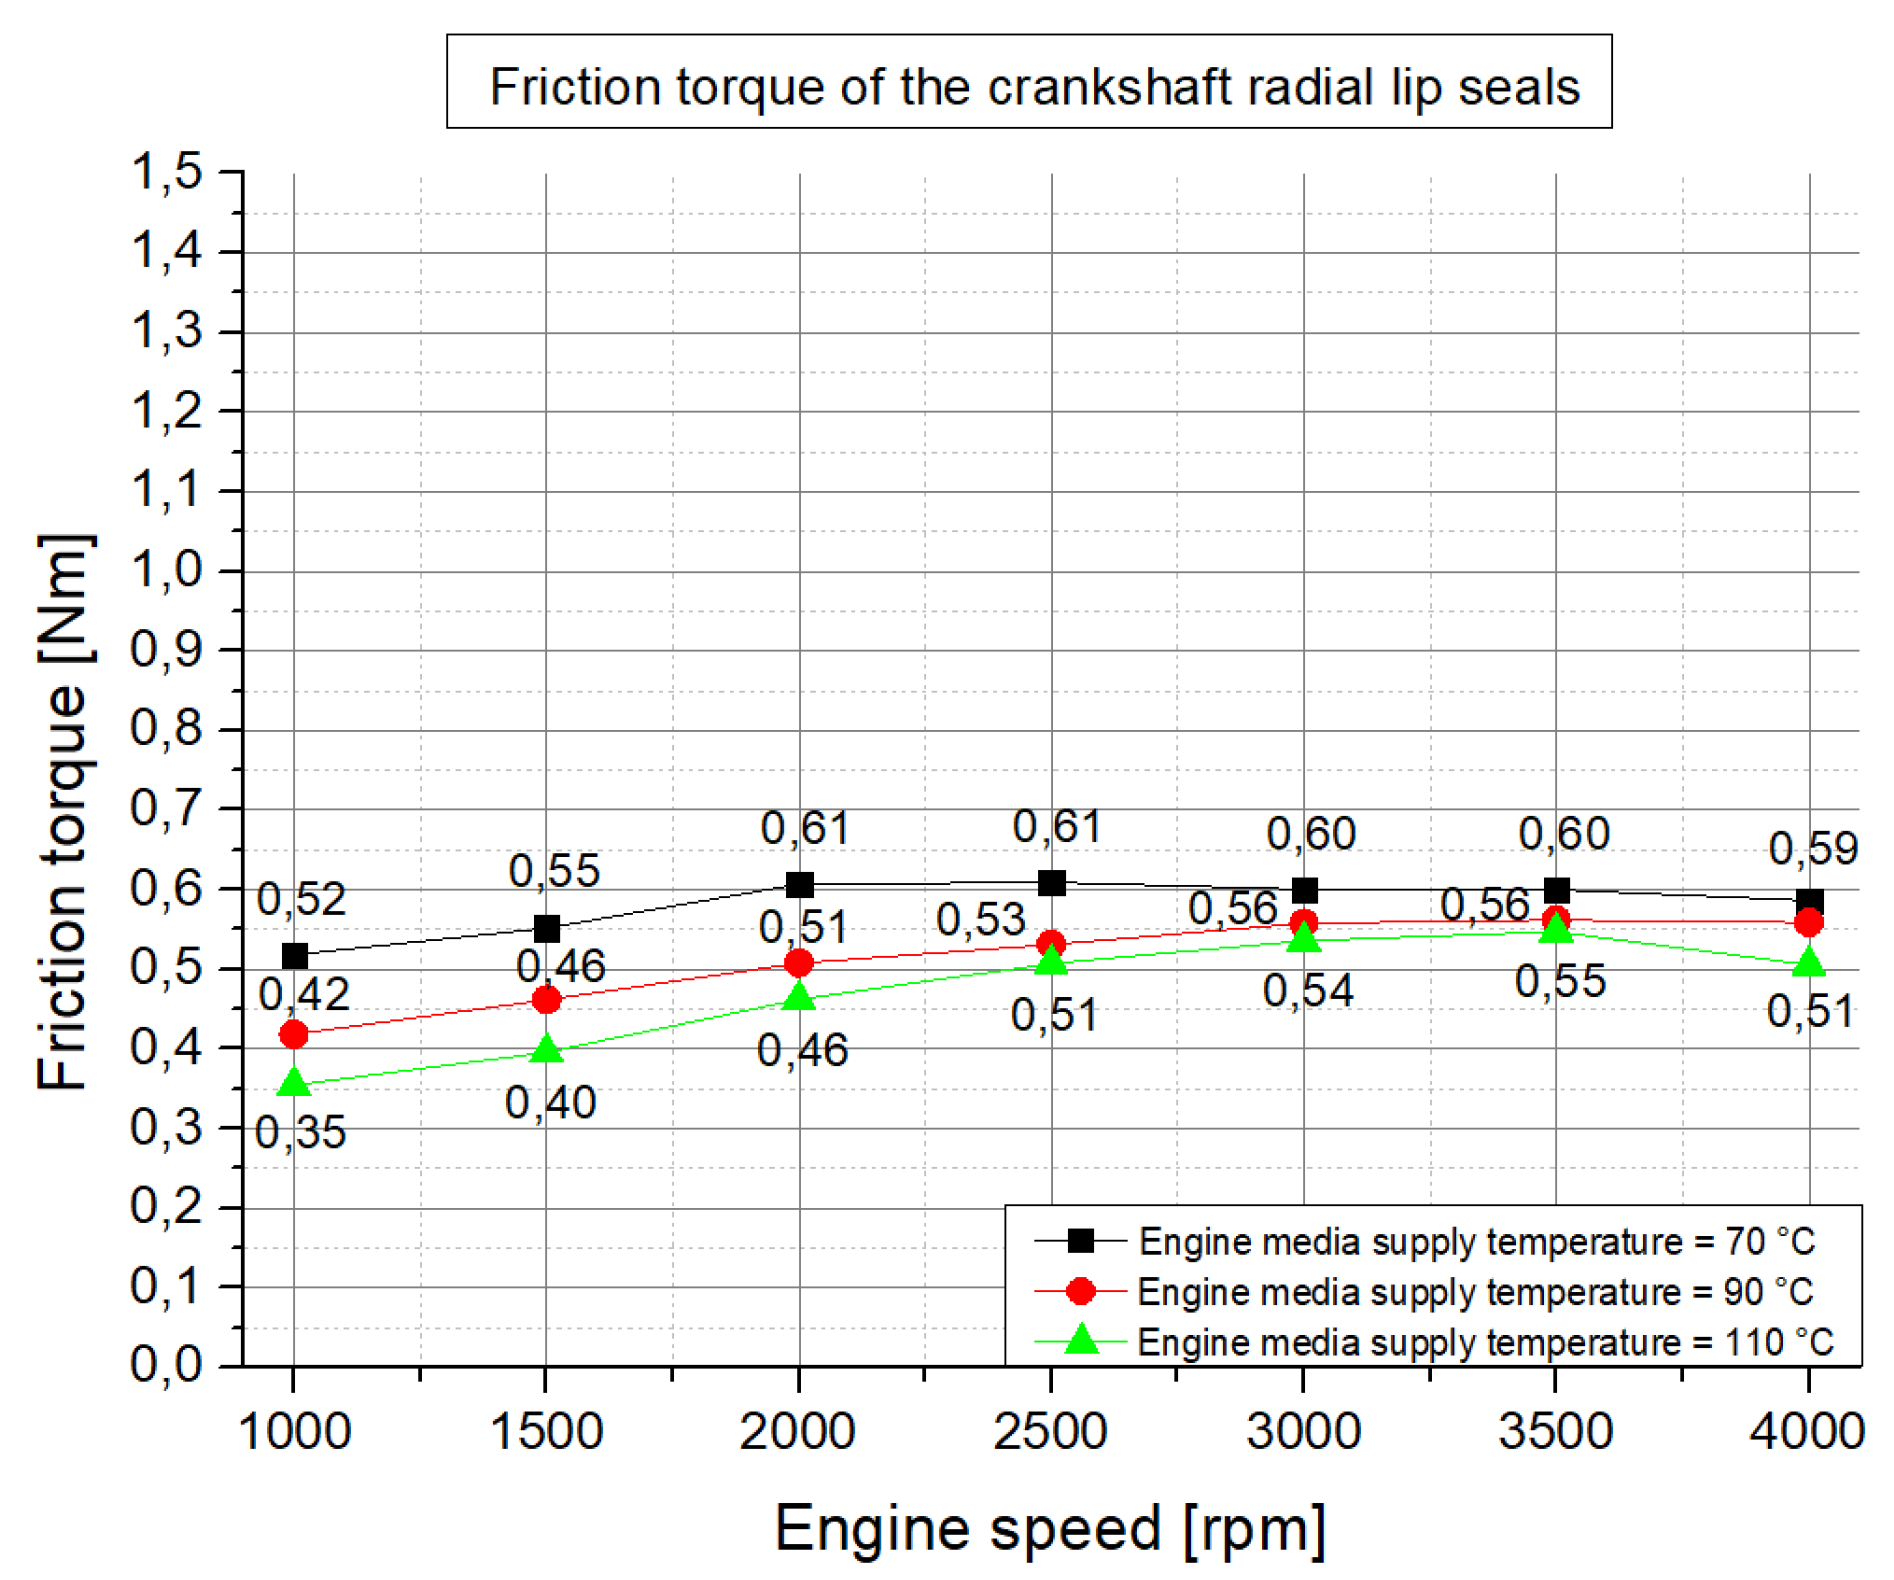
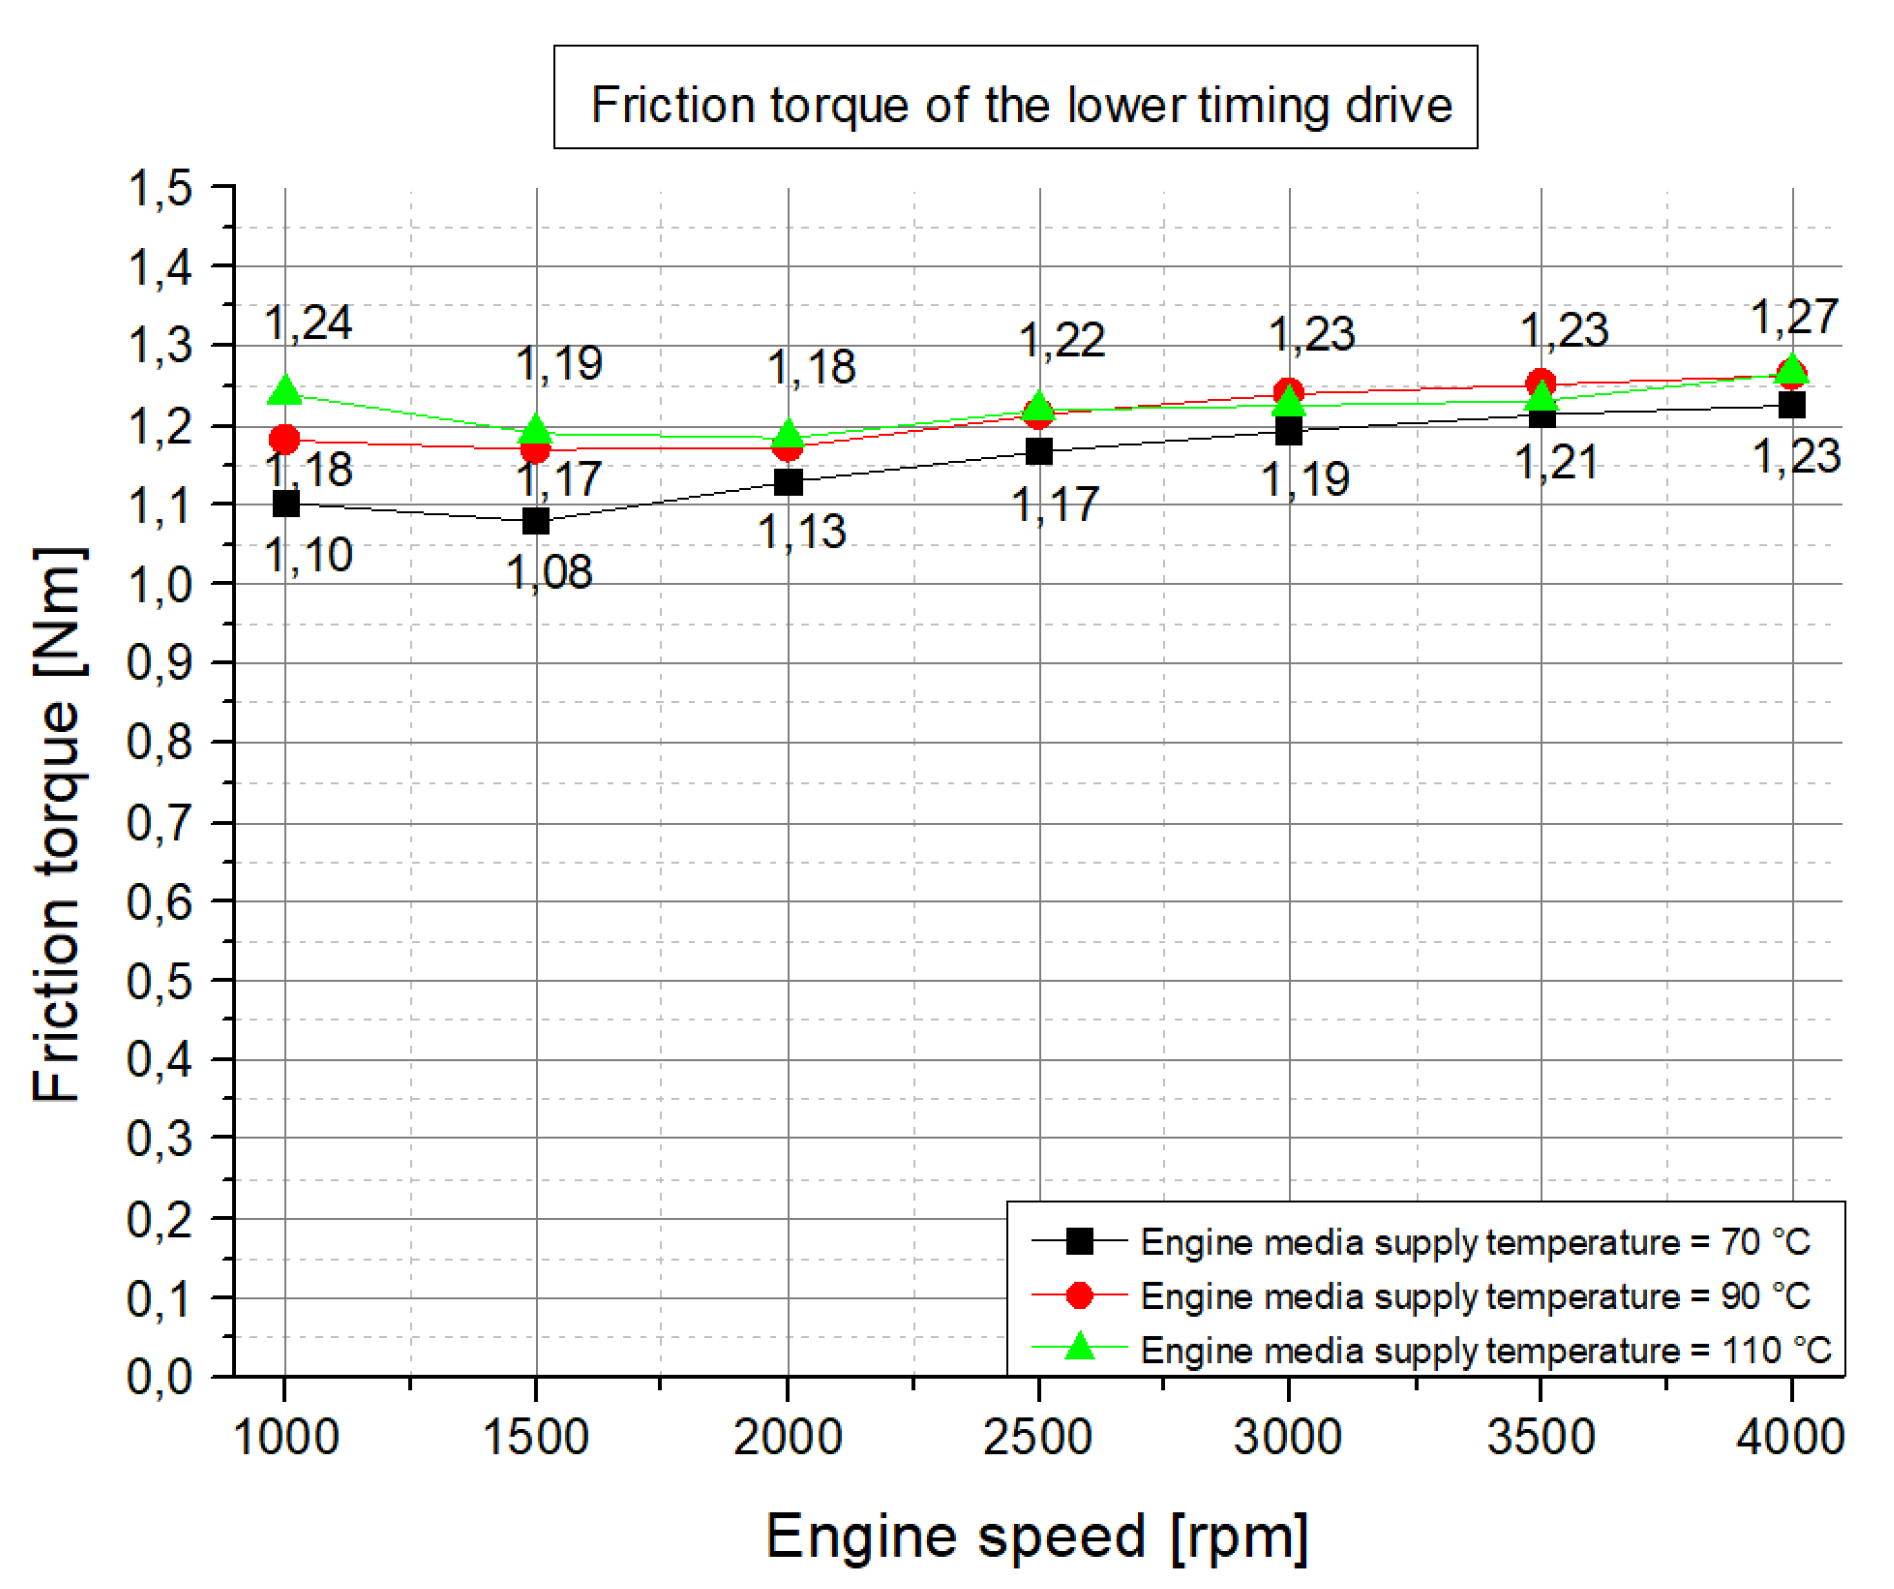
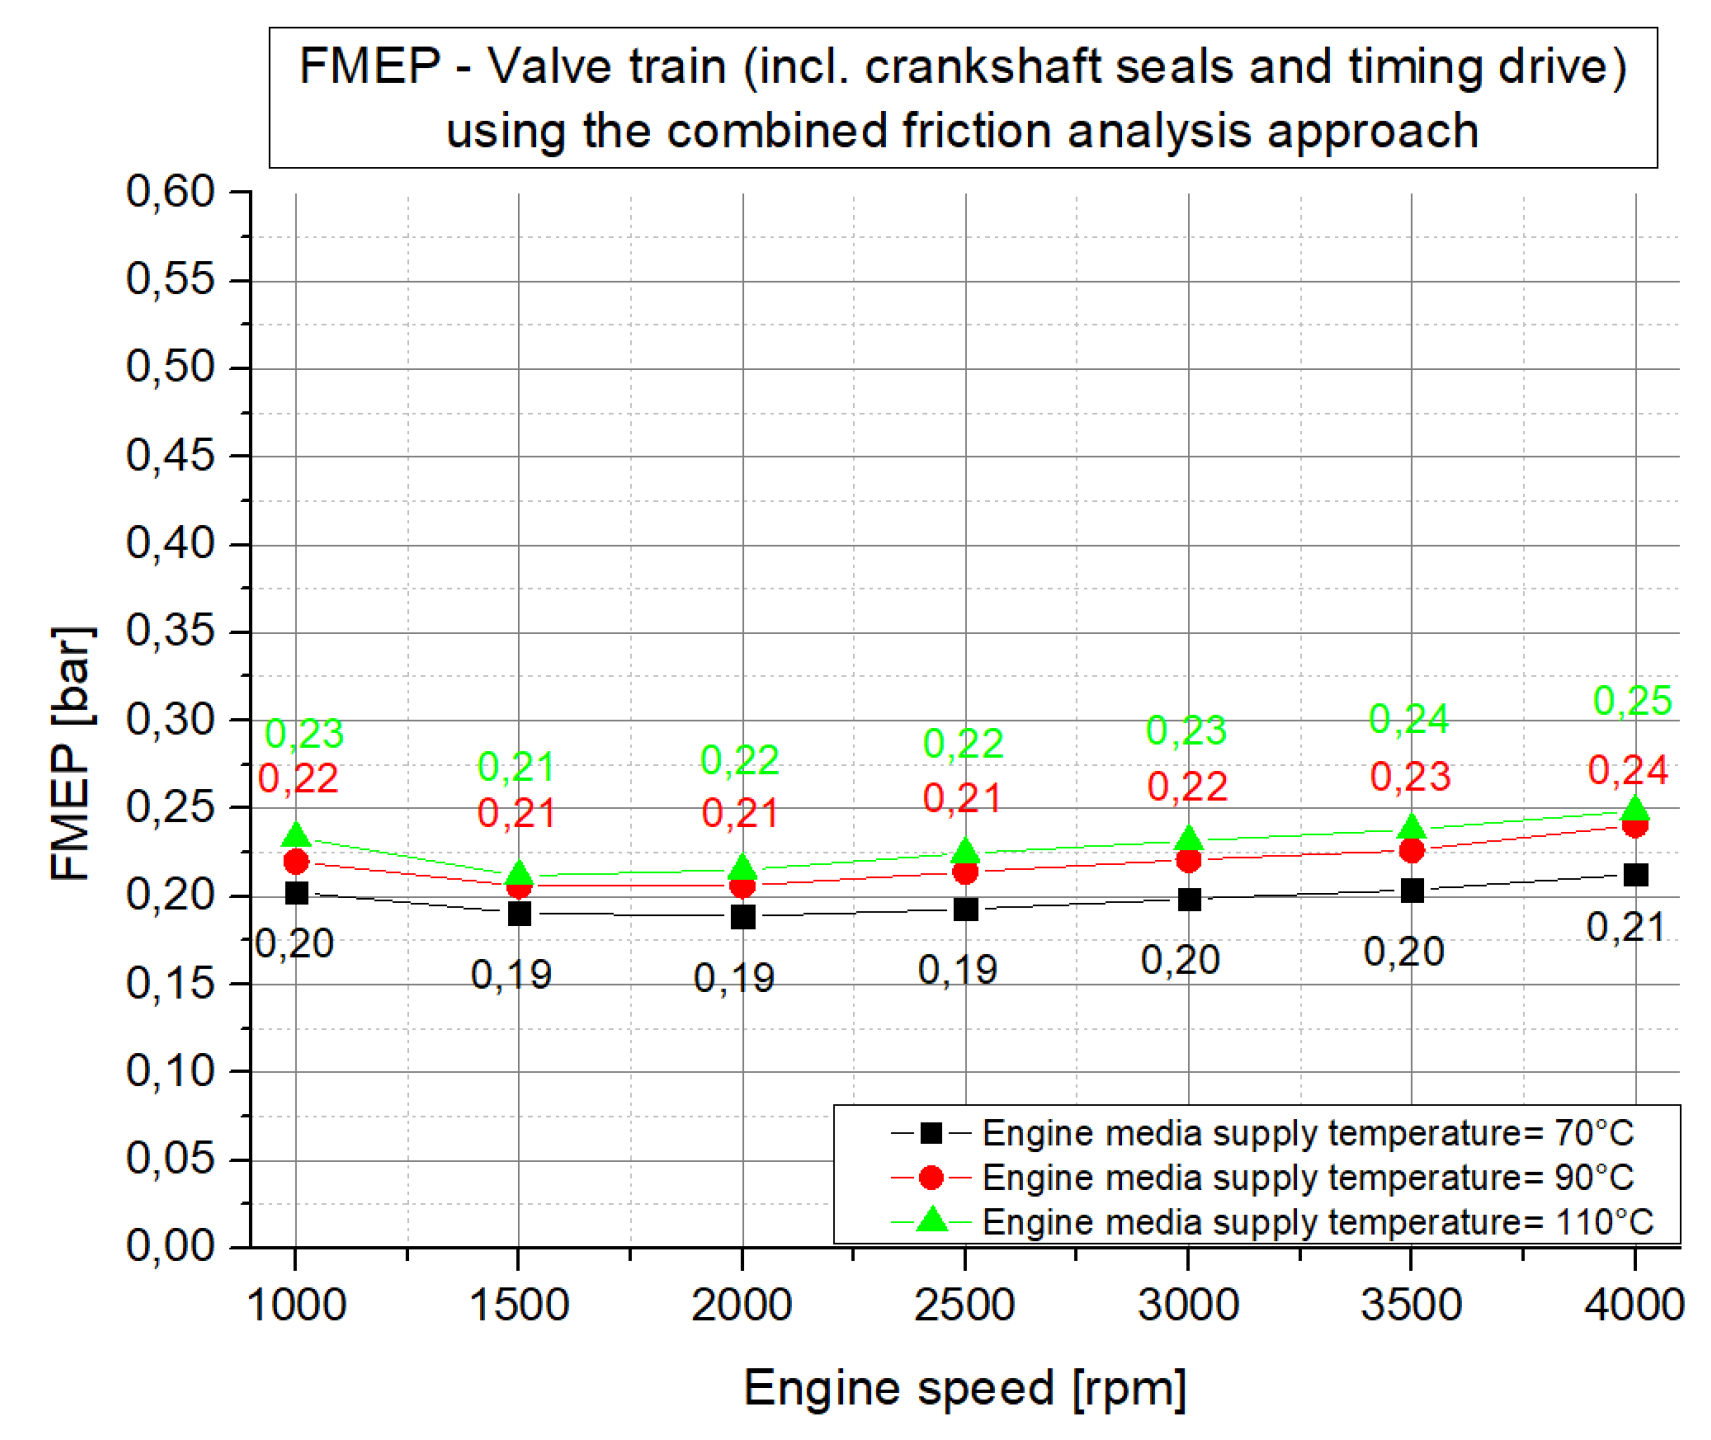
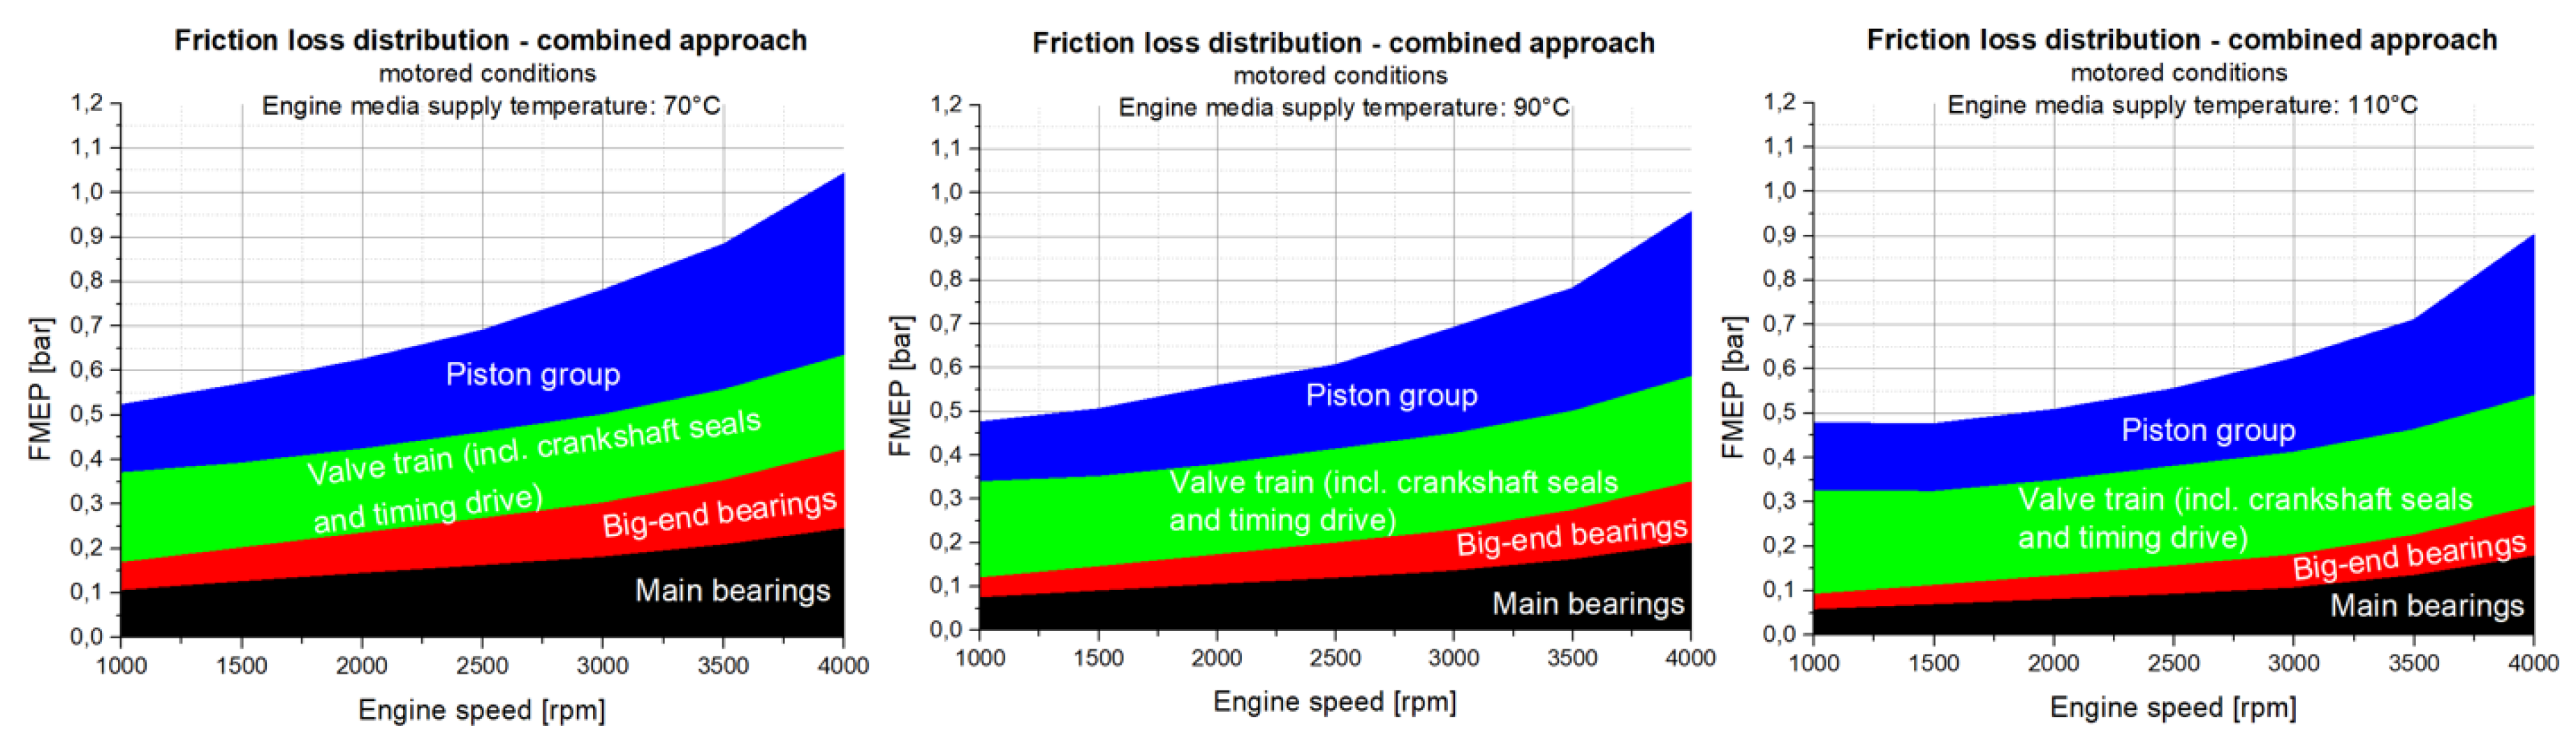
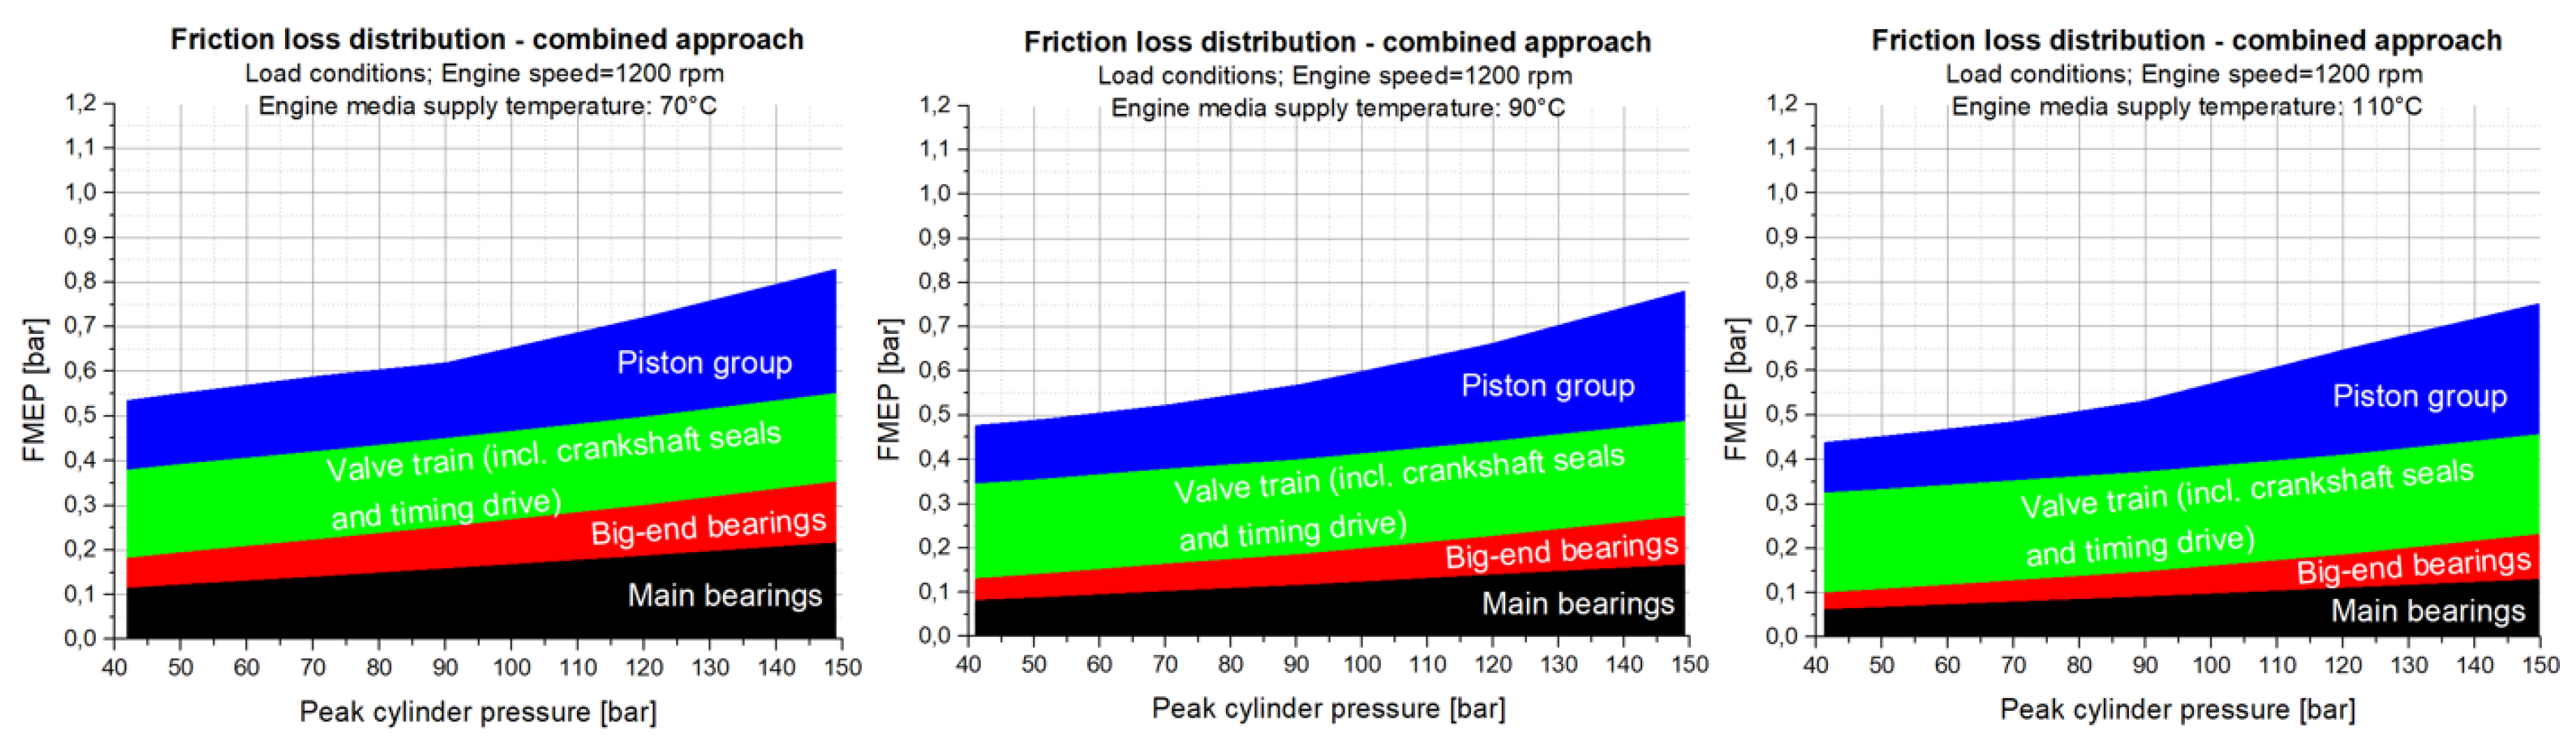
The assignment of friction reduction potentials to the base engine subassemblies was possible in great detail due to the usage of the combined numerical/testing approach and the conducted extensive strip-test campaign. The main subassemblies that showed decreasing friction losses with an increasing the engine media supply temperature were the crankshaft journal bearings and the piston group. The valve train as well as the lower timing drive and crankshaft seal rings showed a rather constant level of the friction losses at engine speeds higher than 2000 rpm. While the friction torque of the crankshaft seals was slightly decreasing for engine speeds lower than 2000 rpm when increasing the lubricant supply temperatures, the lower timing drive and the valve train showed a different behaviour. The friction torques of the lower timing drive and the valve train were increasing with an increasing lubricant supply temperature at engine speeds lower than 2000 rpm. The most significant increase could be observed at the lowest investigated engine speed of 1000 rpm. For these subassemblies, care needed to be taken regarding mixed lubrication regimes when further increasing the lubricant supply temperature and, in addition, decreasing the engine speed, resulting in low rotational shaft speeds (especially for the performance of the valve train which was working at half the speed of the crankshaft due to the required gear reduction for the timing of the engine control). Also, when considering the usage of low viscosity lubricants, the impact on the friction losses of the valve train and timing drive needed to be carefully investigated. Finally, it can be said that the piston group of the investigated diesel engine showed a very good tribological performance even under very high loads and high lubricant supply temperatures. A possible explanation for this result is that the piston group had been particularly well friction-loss-optimized by increasing the piston clearance while lowering the piston pin offset. In addition, shorter ring heights in combination with lower tangential forces of the piston rings and friction reducing the piston skirt coating had been used to optimize the crank train.
As expected for an engine that is commercially sold in the thousands, some results from the simulation were that the friction losses of the main bearings and big-end bearings were dominated by the hydrodynamic friction losses and that no severe mixed lubrication occurred for the journal bearings over the investigated engine operation range. In agreement with this result is that friction reduction potentials above 45% had been determined for the main and big-end journal bearings when increasing the lubricant supply temperatures from 70 C to 110 C.
The measurement of the crankshaft main bearings friction losses solely during the additionally conducted strip-test campaign enabled the verification of the utilization of the journal-bearing simulation approach in a crankshaft system for the first time. The verification between the measurement and simulation showed a good agreement of the results with a maximum deviation in the friction torque of 0.24 Nm at an engine speed of 4000 rpm and an engine media supply temperature of 90 C. At lower engine speeds, the results were within 0.1 Nm, which confirms the good applicability of the previously developed journal-bearing simulation method.
Summarizing, the combined approach used in this work can be applied to analyse in detail the friction losses of reciprocating engines and its subassemblies crankshaft journal bearings, valve train, and piston group. This analysis can be conducted over the entire engine speed and load range for different thermal boundary conditions with a high accuracy and enables the analysis of the influence of friction reduction measures like low viscosity oils, design parameter variants of the crank train components, or comparisons between different engine concepts.


