Experimental Investigation of the Mechanical and Surface Properties of Sub-Micron Carbon Spheres


1
Mechanical Engineering Department, College of Engineering and Petroleum, Kuwait University, P.O. Box 5969, Safat 13060, Kuwait
2
Davidson School of Chemical Engineering, Purdue University, 480 Stadium Mall Drive, West Lafayette, IN 47907-2100, USA
*
Author to whom correspondence should be addressed.
Lubricants 2020, 8(7), 77; https://0-doi-org.brum.beds.ac.uk/10.3390/lubricants8070077
Submission received: 12 June 2020
/
Revised: 11 July 2020
/
Accepted: 13 July 2020
/
Published: 15 July 2020
Abstract
:This study investigates the mechanical and surface properties of spherical carbon particles. Sub-micrometer carbon spheres were previously used as oil additives to improve the tribological performance of oils, and as anode material to enhance the storage of rechargeable lithium-ion batteries. In the current work, internal structure and chemical analysis of these carbon sphere particles was conducted via focus ion beam scanning electron microscopy, and the results revealed that the carbon sphere particles are pure carbon particles with a solid internal structure. Atomic force microscopy (AFM) and nano-indenter were utilized to explore the mechanical properties (hardness and elastic modulus) of carbon sphere particles. The obtained results showed that the carbon spheres have an elastic modulus in the range of 10 to 42 GPa, while their hardness is in the range of 0.5 to 2.6 GPa. Besides, the AFM scans confirmed that the carbon particles are entirely separated and devoid of agglomeration. These results support the viable use of carbon sphere particles in various engineering applications.
1. Introduction
Carbon-based nanomaterials have been shown to have superior properties that promote their use in various applications such as biomedical engineering [1], tribology [2], and environmental systems [3]. Thus, several research efforts have been devoted to investigating the nanomechanical properties of different carbon-based material. Carbon rods, with a diameter in the micro-scale, were found to have an elastic modulus in the range of 10 to 20 GPa [4]. Carbon nanotubes with a size less than 2 nm exhibited an elastic modulus of 9 to 57 GPa [5]. Micro-sized porous carbon spheres (400 to 600 μm) were shown to have an elastic modulus of about 0.5 GPa and Vickers hardness of 2.3 HV (23 MPa) [6]. A carbon film with one-micrometer thickness was observed to have an elastic modulus in the range of 15 to 35 GPa and a hardness of in the range of 1 to 3 GPa [7]. Spherical carbon particles, with a diameter between 2 to 10 μm, were reported to have an average tensile strength of 8.3 GPa [8].
In recent years, several research studies have focused on the viable use of sub-micrometer spherical carbon particles in different applications such as batteries [9], oil lubricants [10,11,12], additive manufacturing [13], and other fields. Yet, their mechanical properties are still not measured.
The tribological benefits of nanomaterials can be very crucial in the fluid lubricant industry. During machine operation, it is essential to guarantee appropriate lubrication to avoid wear damage and to limit energy loss. Wear triggered by friction is the leading cause of the productivity degradation of machines. Holmberg and Erdemir [14] showed that one-third of the fuel energy in an internal combustion engine is lost as a result of friction. Consequently, researchers and industries have been exploring different tribological solutions to minimize friction, such as developing better lubricants or reducing the frictional properties of contacting surfaces. The improvement of oil and grease lubricants can be achieved using anti-wear and anti-friction additives. Several solid nano- and micro-scale materials have been examined as anti-wear and anti-friction lubricant additives at different operating conditions [15,16,17,18]. The lubrication benefit of using these solid additives can be explained by (1) their ability to form a protective film on the surfaces and, therefore, minimize direct contact between sliding surfaces; or (2) their ability to roll between sliding surfaces.
In a previous work, Alazemi et al. [11,12] demonstrated that sub-micrometer spherical carbon particles could enhance the tribological behavior of engine oils. They confirmed via transmission electron microscopy (TEM) the smooth surface and round shape of the carbon particles, which are extremely beneficial for their tribological performance in oil lubricants. Tribological investigations of the effect of carbon particles in a base oil were conducted via a ball on a disk instrument. The tribological studies showed that carbon particles could assist in minimizing frictional loss (up to 25%) compared with the pure engine oil [11].
Although carbon particles were shown as viable engine oil anti-wear and anti-friction additives, the mechanical and surface properties of these carbon particles are still unexamined. The investigation of the mechanical and surface properties of carbon particles can help to understand their lubrication mechanism, to predict their physical stability under various operating conditions, and to advance their role as anti-wear and anti-friction lubricant additive. For example, the hardness of nanoparticles compared with the sliding surfaces in a lubricated contact determines whether the nanoparticles deform or indent into the sliding surface at high contact pressure [19]. Therefore, this work focuses on investigating the mechanical and surface properties of these carbon particles.
Exploring the internal structure of carbon particles can help to explain their lubrication method and enduring functionality as oil additives. In this study, focus ion beam scanning electron microscopy (FIB-SEM) was utilized to perform tomography analysis of carbon particles. The FIB-SEM system combines the SEM ability to use a focused electron beam to acquire an image of the specimen with the FIB ability to use a focused high beam current of ions for milling a precise section of the specimen. Thus, an SEM image is obtained after each layer removed from the specimen. This method of serial sectioning of a carbon particle creates a complete understanding of the 3D structure of carbon particles.
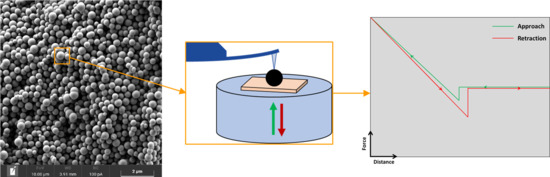
Atomic force microscope is an instrument to image the topography of solid surfaces at high resolution as well as to obtain valuable data on local material properties such as elasticity, hardness, and adhesion [20]. AFM was widely used to measure the mechanical properties of a broad range of nanomaterials, such as cellulose nanocrystals [21], carbon nanotubes [22], and graphene [23]. Therefore, AFM can be used to study the surface and mechanical properties of carbon particles. In the AFM instrument, the force sensor comprises a sharp tip located at the free end of a cantilever. The interaction force between the AFM tip and the examined sample is obtained as a function of the tip-sample distance. Subsequently, a contact model is fitted to the force–distance curve, and then the material properties of the sample can be estimated [20]. Nano-indenter is also a tool to conduct nano-indentation tests and to investigate the elastic modulus and hardness of a sample.
The main objective of the current study is to explore the mechanical and surface properties of sub-micrometer sized carbon particles. The FIB-SEM system is employed to study the morphology and 3D structure of the carbon particles. Furthermore, AFM and nano-indenter instruments are utilized to conduct adhesion and elasticity measurements for the carbon particles. The obtained results can help to explain the lubrication mechanism of carbon particles and ensure their long-lasting functionality as lubricants’ anti-friction and anti-wear additives.
2. Experimental Methods
2.1. Material Synthesis
Carbon particles used in the current investigation were synthesized in-house using our previously reported technique [11]. In short, accelerated copolymerization of resorcinol and formaldehyde solution with ultrasonic irradiation was used to create colloidal sphere-shaped polymer particles in less than 5 min. Afterward, the polymer particles are exposed to a controlled thermal treatment up to 900 °C for four hours in an argon environment (1 °C/min heating and cooling rates). Consequently, spherical carbon particles with a diameter below one micrometer are produced. TEM and Raman spectroscopy studies demonstrated an amorphous carbon structure, almost analogous mixture of sp2 and sp3 structured carbons [11,24]. The surface and inside carbon are the same amorphous disordered carbon structure.
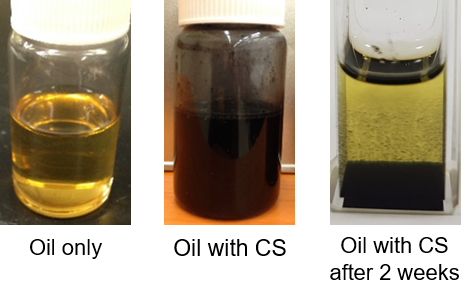
These carbon sphere (CS) particles were previously [11] shown to improve the tribological performance of engine oil (5W30) lubricant. Typically, the CS particles are dispersed in the oil via sonication to reach a homogeneous lubricant mixture. Visual inspection revealed that the CS particles maintained the dispersion stability in the engine oil for about 2 weeks, after which sedimentation of CS particles was observed (see Figure 1).
2.2. Characterization Techniques
The external and internal structures of the carbon particles were examined using a focus ion beam scanning electron microscopy (FIB-SEM), TESCAN AMBER, operating at an acceleration voltage of 2 kV. Furthermore, chemical analysis of carbon particles was explored using energy dispersive X-ray spectroscopy (EDS). To conduct this analysis, a dry powder of carbon spheres was scattered on a copper tape (on SEM sample stub).
Agilent 5420 SPM/atomic force microscopy (AFM) was utilized to study the topography, elasticity, and surface properties of the carbon particles. First, one wt.% concentration of carbon particles was dispersed in ethanol using sonochemical irradiation for about 3 min to achieve a uniform solution. Then, a drop of this uniform solution was deposited on a freshly cleaved mica sheet (or Si wafer) substrate, and it was left in an oven at 50 °C for 8 h to dry. This technique results in a uniform distribution of carbon particles on the surface of the substrate. Next, tapping-mode AFM scanning and force measurements were conducted at room temperature using rectangular cantilever AFM probes (NanoSensors, tip radius less than 10 nm, and a nominal length of 225 μm, mean width of 28 μm, and thickness of 3 μm). AFM was used to acquire 2D and 3D images of carbon particles, and then force–distance curves are obtained for an individual carbon particle. In the AFM experiments, multiple approach-retraction tests were performed on different carbon particles with different AFM tips using the same operating parameters.
Nano-indentation tests were conducted at room temperature using a Hysitron TI-700 Ubi nano-indenter equipped with a 50 nm three-sided pyramidal Berkovich diamond probe with a half-angle 65.30 and a maximum load of 500 µN. In nano-indentation experiments, samples are commonly embedded in epoxy resin medium to provide the mechanical support during tests, as the penetration of epoxy resin is very limited, and thus can be excluded as a possible source of error [25,26]. Therefore, to accomplish nano-indentation testing, carbon particles were mixed with epoxy (resins). Then, this mixture was filled in drilled holes on the mount and left overnight to dry. Finally, the prepared sample was polished to a 3 µm diamond suspension finish. In the calculation of elastic modulus of carbon particles, its Poisson′s ratio, ν, is assumed to be 0.3.
3. Results and Discussion
3.1. Scanning Electron Microscopy and EDS
Figure 2 depicts scanning electron microscopy (SEM) micrographs at different magnifications of the CS particles. The SEM micrographs reveal the perfectly spherical shape of carbon particles with a smooth peripheral surface. Additionally, it can be seen that the diameter of the CS particles is less than one micrometer (see Figure 2c). The size distribution of the CS particles was measured using a dynamic light scattering (DLS) instrument. As shown in Figure 2d, the size of the CS particles ranges from 200 to 700 nm. This spherical shape and the smooth peripheral surface of the carbon particles can be valuable when used in mechanical applications in diminishing friction and wear losses by acting as third body particles that can occupy the space between the asperities of contacting surfaces, and hence minimize the contact pressure. Figure 3 depicts the chemical analysis using EDS of two different CS particles. It can be seen from the energy dispersive X-ray spectrum that those CS particles consist purely of carbon element (more than 98% is carbon, and the rest is owing to the use of a copper tape on the SEM setup).
Although the carbon particles were shown to have a spherical external shape, their internal structure was not fully explored. To investigate the internal structure of CS particles, the FIB-SEM system was utilized to acquire a series of section images created through imaging, followed by removing a precise thin layer of CS particles. To perform this study, a cluster of CS particles was used as the starting sample, see Figure 4. Then, the FIB was utilized to mill a material layer away to a specific depth with every pass of the focused ion beam. This technique results in accurate sectioning of the CS particles by permanently removing a thin layer. Subsequently, the CS particles cluster is scanned with the SEM part of the FIB-SEM instrument to obtain an image of the sample. As a result, this method produces serial section images of the entire CS particle and provides us with its complete 3D structure. The in situ acquired video (see Supplementary Materials) was post-processed to obtain micrograph images for the CS particles during the sectioning cycle, see Figure 4. The results revealed the solid internal structure of the CS particles. This finding supports the viable use of CS particles as lubricant additives to act as third body particles that can fill the space within contacting surfaces and, accordingly, reduce the contact pressure. Moreover, the solid internal structure of CS particles indicates their potential role as sub-micrometer ball bearings to reduce friction within the system.
3.2. Atomic Force Microscopy
Previous tribological studies demonstrated the role of CS particles to enrich the tribological performance of the existing group of oil lubricants [11,27]. However, additional investigation of surface and mechanical properties of these CS particles using an atomic force microscope is necessary to identify their lubrication method and to ensure their long-lasting functionality.
AFM is a tool to generate a topographical image of solid surfaces at high resolution and to provide useful information on material properties such as friction, adhesion, and elasticity [20]. In this study, AFM is utilized to obtain a 2D and 3D topographical image of the CS particles. Moreover, force versus deformation curves are performed on the surface of the CS particle to get its adhesion and elasticity properties.
In AFM, a force¬–distance curve describes the change in the distance between the AFM tip and sample, while at the same time recording the deflection of the AFM cantilever. The deflection (d) in the AFM cantilever is multiplied by the cantilever normal spring constant (kn) to obtain the normal force (Fn), as follows:
These force–distance curves can be used to study surface forces, as well as offer some local material properties such as stiffness and adhesion.
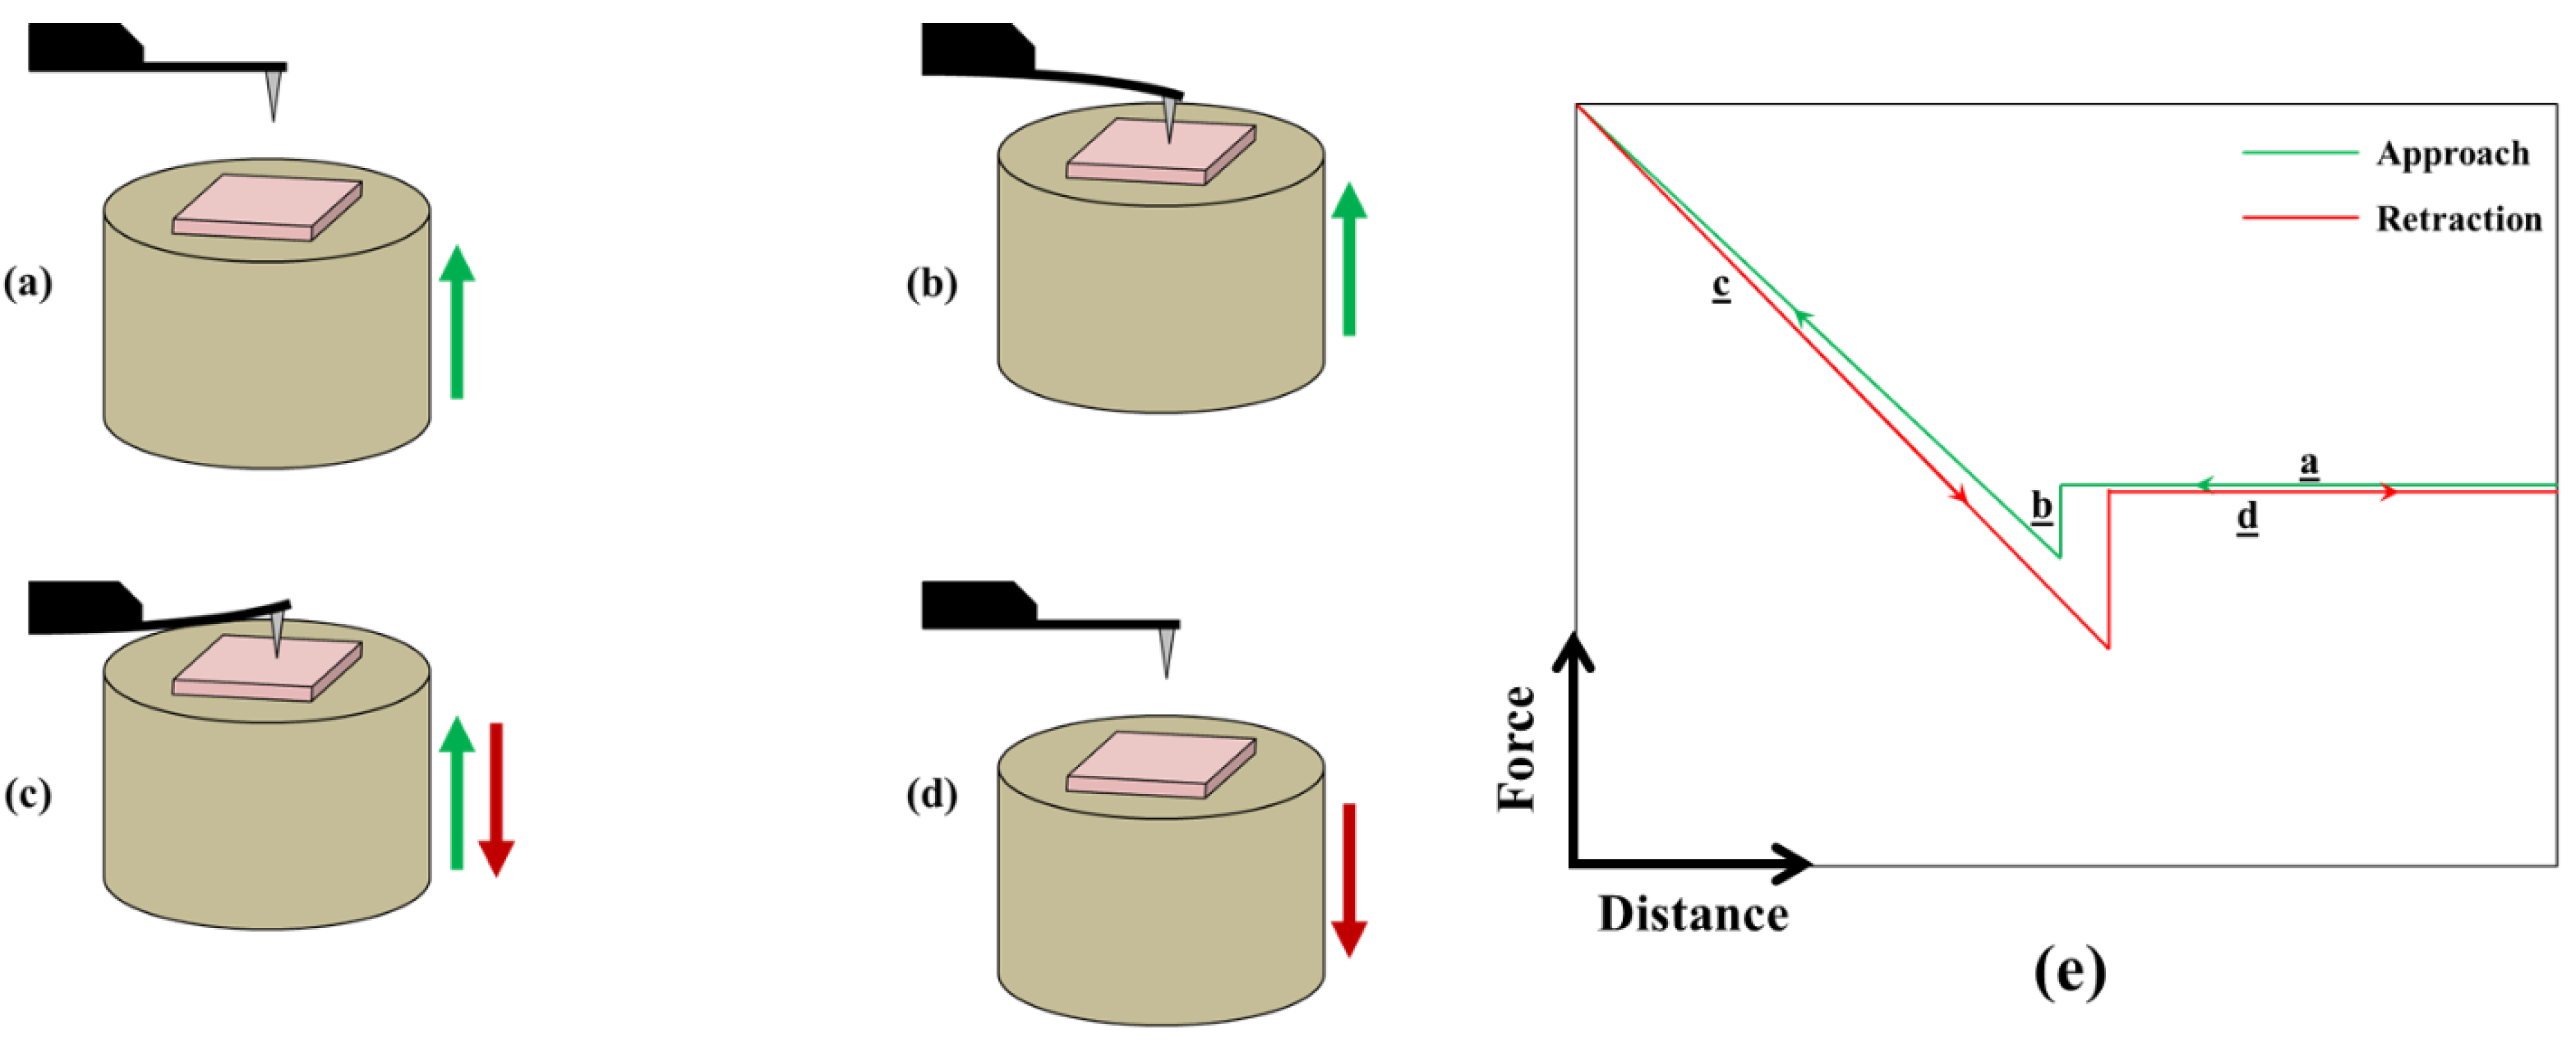
The AFM comprises a piezoelectric z-stage, the sample mounted on it, that is used to move the sample up and down by controlling the input voltage. Figure 5 provides a schematic illustration of the sample movement during the execution of an approach-retraction experiment. When performing a force–distance curve, the sample is moved upward to approach the AFM cantilever (see Figure 5a). When the sample is only a few nanometers away from the AFM cantilever, the attractive forces cause the AFM cantilever to jump into the sample, and the two surfaces are now in contact. As the piezo z-stage continues moving the sample upward, the force applied to the contact area increases and, as a result, contact surface deformation develops. Moreover, physical and chemical interaction due to the proximity between the contacting surfaces results in the presence of adhesion force. At some point and after applying the desired force, the piezo z-stage is moved downward away from the AFM cantilever, resulting in a decrease in applied force. However, typically, more force is needed to separate the surfaces in the vertical direction (known as adhesion force) before reaching complete separation with no applied force. During this experiment, the deflection of the AFM cantilever is measured and converted to force, as described in Equation (1). The force–distance is then obtained by plotting the cantilever force versus the distance traveled by the piezo z-stage, as shown in Figure 5e.
In the contact region of force–distance curves, during approach and in retraction, the elastic modulus of the sample can be extracted by measuring its elastic deformation. To determine the elastic modulus, a contact theory is fitted to the contact region of the force–distance curve. Different contact theories describe the elastic contacts between spherical bodies. Hertz theory [28] is one of the widely used models to describe the elastic contact between two surfaces. If a normal force (Fn) is applied on a sphere–sphere contact, the contact radius (a) anticipated by the Hertz theory is as follows:
where is the effective radius and Etot is the reduced Young′s modulus of the spheres, given by:
Here ν1, E1, ν2, and E2 are the Poisson′s ratio and the elastic moduli of spheres 1 and 2, respectively. In the current investigation, a silicon AFM tip with a radius of about 10 nm was used, and it has an elastic modulus in the range of 130 to 160 GPa and a Poisson′s ratio of 0.27 [29]. When two surfaces come in contact by a normal force, then surfaces deform to carry this load. The elastic deformation (δ) is given by Hertz theory as follows [30]:
In an approach-retraction experiment, the distance presented in the force–distance curves represents the vertical displacement input (Z) to the piezo z-stage in the AFM. However, when surfaces come into contact, deflection in the AFM cantilever (d) will occur and surfaces start deforming. A laser-photodiode system records the deflection of the AFM cantilever as the force applied to that contact. The amount of elastic deformation, that is, indentation depth, can be calculated as follows:
In the current study, tapping-mode AFM scanning was performed at room temperature using a rectangular cantilever AFM probe to obtain a topography scan of the sample. Figure 6a depicts a schematic illustration of an AFM cantilever scanning a CS particle. It should be noted that the height of the cantilever tip is the range of 10 to 15 μm, which is significantly higher than the size of a CS particle (less than a micrometer). Hence, the anticipated topography profile from the AFM scan of a CS particle is shown in the dashed green line in Figure 6a. Figure 6b depicts an optical image acquired from an optical microscope with a 50× objective for the mica sheet with CS particles scattered on its surface. An area with a proper distribution of CS particles was chosen to perform the AFM scan. First, a freshly cleaved mica sheet was scanned without any CS particles. Then, a mica sheet with CS particles deposited on it was scanned using AFM to demonstrate the topographical image of CS particles. Figure 7 shows 2D and 3D AFM images (scan area of 20 μm by 20 μm) for both clean mica sheet and mica sheet with CS particles. It is clear from Figure 7a that the mica sheet has an atomically smooth surface as expected, while Figure 7b reveals the spherical shape of the carbon particles with diameters mostly less than one micrometer. These AFM images support the results obtained from the SEM analysis. Moreover, the 3D AFM image of carbon particles (see Figure 7b) proved that there is no agglomeration between carbon particles, and they are entirely detached from each other. This observation is critical for the use of CS particles as oil additives to attain superior tribological performance by operating as sub-micrometer ball bearings.
In AFM, the force sensor involves a sharp tip (less than 10 nm in radius) positioned at the end of a rectangular cantilever. During operation, the sample is moved vertically at a constant speed towards the AFM tip until the AFM tip touches the sample. Subsequently, the force applied to the contact results in the deflection of the AFM cantilever, which is measured using a laser-photodiode system. Then, this deflection in the AFM cantilever is converted to force using the spring constant of the cantilever. The sensitivity of the AFM cantilever is found by acquiring a force–distance curve on a hard surface before doing the force measurements on the CS particle. In this investigation, a silicon (Si) wafer is used as the hard surface needed to obtain the sensitivity on the AFM cantilever.
To examine the stiffness of CS particles, a silicon wafer was used as a substrate to carry the CS particles. In a separate experiment, CS particles were deposited on the silicon wafer, and then scanned using AFM in tapping mode to obtain an image of a single CS particle. Figure 8 demonstrates the spherical shape of a carbon particle that has a diameter of about 350 nm. Now, the AFM tip was used to conduct an elastic deformation experiment by approaching, deforming, and then retracting from the CS particle. The main objective of this test is to monitor the force applied on the CS particle along with elastic deformation to extract the elastic modulus of the CS particle. The approach-retraction experiment was done on the center of the selected CS particle (see Figure 9). The piezo displacement controlled the amount of force applied to the CS particle, and, as a result, a force–distance curve is obtained. Following every force–distance experiment, the AFM tip was used to acquire an image of the sample, ensuring the occurrence of only elastic deformation without any permanent deformation.
Figure 9 depicts an example of force–distance curves performed on a CS particle compared with Si wafer. As the sample approaching the AFM cantilever, the force was zero until a negative force was sensed owing to the attractive force between the two surfaces followed by a sharp increase in the force indicating the initiation of surface contact deformation. After reaching the desired force, the AFM cantilever was moved away from the contact, and as a result, the force decreased; however, an extra force was required to separate the surfaces before the measured force reached zero. The force needed to pull-off the AFM cantilever away from the sample in the vertical direction is generally described as the adhesion force [20]. Force–distance curves were performed on Si wafer and the center of CS particle (see Figure 9b,c). It is clear that the CS particle has three times higher adhesion force with the AFM tip compared with the Si wafer. The high adhesion force of CS particles can be beneficial in lubricant applications. It can allow for the CS particles to be used as oil additives, adhere to the asperities of sliding surfaces, and thus reduce contact pressure by bearing some of the applied load. In post-processing, the distance was converted, according to Equation (5), to represent the surfaces elastic deformation, as shown in Figure 9d,e.
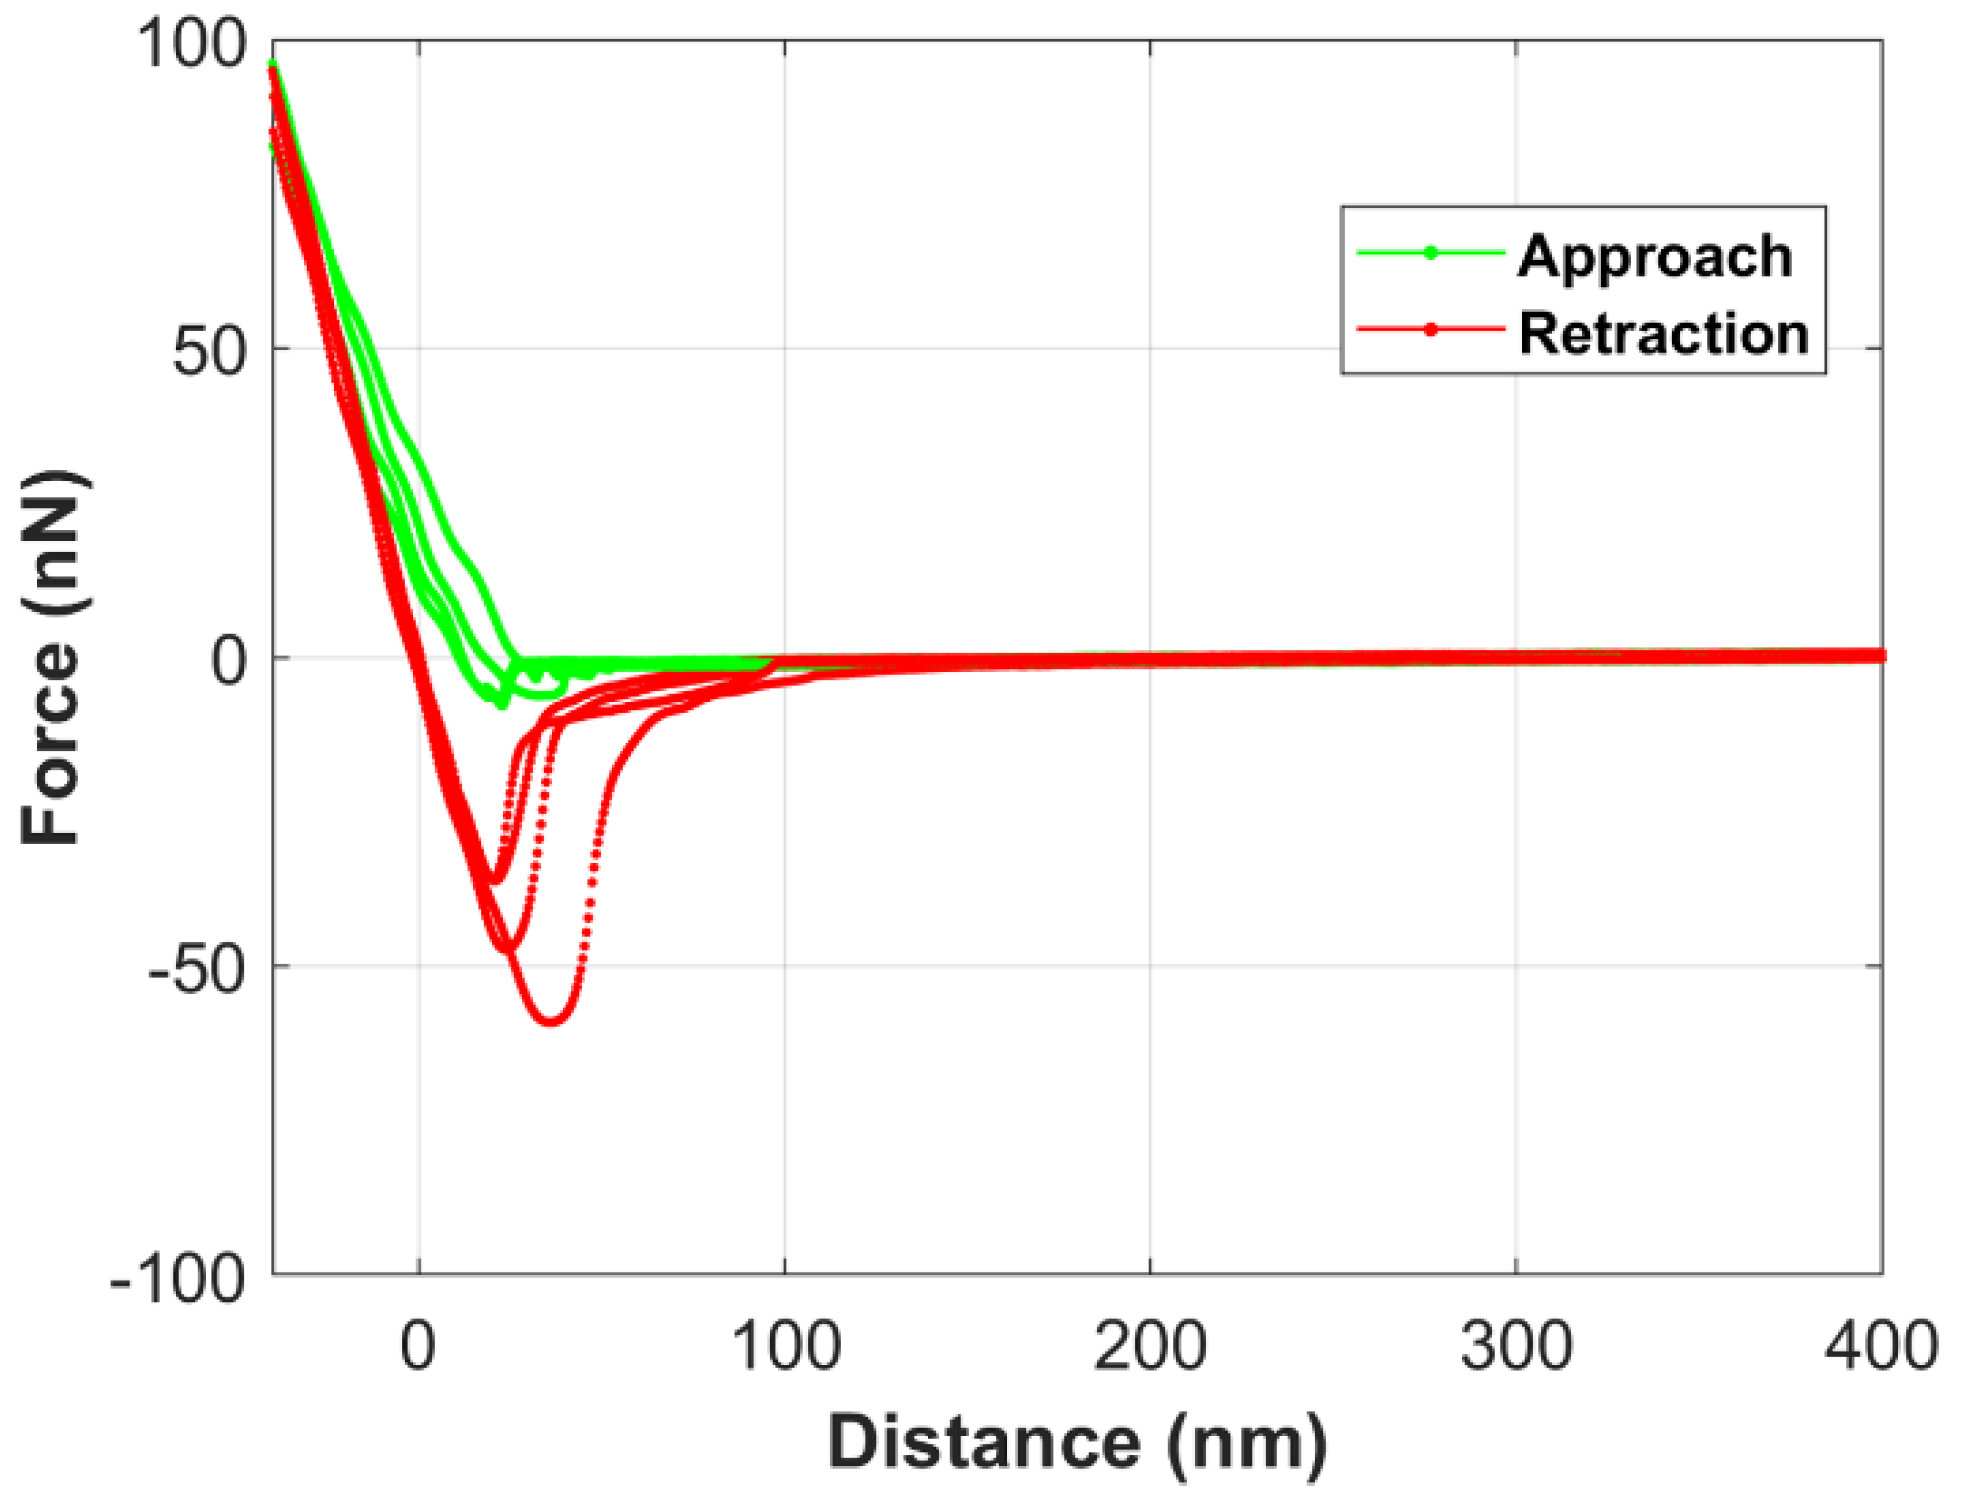
In this investigation, multiple approach-retraction experiments were performed on different CS particles to measure the adhesion force between the CS particle and the AFM tip. As shown in Figure 10, this adhesion force was in the range of 36 to 59 nN. Adhesion measurements were repeated several times on different CS particles on the Si substrate, and comparable results were observed and reproduced.
Multiple approach-retraction tests were performed on different CS particles. Then, Hertz theory was applied as described previously to extract the elastic modulus of the CS particles. Figure 11a shows the variation of force with the indentation depth from multiple approach-retraction tests compared with Hertz theory using elastic modulus of CS particle (ECS) of 15 and 42 GPa. Elastic modulus of CS particles is in the range of 15 to 42 GPa with a mean value of 24 GPa. The difference in the obtained values of ECS can be explained by the uncertainty in different parameters involved in the AFM experiment, such as the AFM tip diameter, the photodiode sensitivity, and the deflection of the AFM cantilever [21]. Figure 11b demonstrates the elastic modulus of CS particles as a function of indentation depth. It should be noted that ECS is unstable when the indentation depth is below 0.5 nm. Previous studies observed this unstable behavior of the elastic modulus at small indentation depth, and it is attributed to the disrupting attractive force gradient in the proximity of surfaces [29,31].
3.3. Nano-Indentation Experiments
Nano-indentation experiments were conducted at room temperature using a Berkovich diamond probe and with a maximum load of 500 µN. The standard load control test for an individual indent consisted of three segments: loading, holding at the peak, and unloading. Loading and unloading of this trapezoidal loading function lasted for 5 s, while the holding part lasted for 10 s. The system has a load and displacement resolution of 1 nN and 0.04 nm, respectively. Maximum indentation depths ranged between 63 and 162 nm.
Several areas that contain CS particles were selected visually via an optical microscope attached to the equipment. Figure 12 depicts an example of an optical image displaying the location of the nano-indentation test on the sample along with the force–displacement curve performed on a cluster of CS particles. Several nano-indentation tests were executed on that location, as well as on other sites on the sample. Later, hardness and reduced modulus of the sample were calculated from force–displacement curves.
The load versus displacement curves were used to calculate the reduced modulus and hardness of the sample. The reduced modulus, Er, is related to the elastic modulus of the CS particle (ECS) through the following equation:
For the standard diamond indenter probe used in this study, Eindenter is 1140 GPa, and νindenter is 0.07. From the above equation and using the value of reduced modulus, the elastic modulus of CS particles was calculated.
Hardness and elastic modulus of CS particles sample obtained from nano-indentation experiments at different contact depth are shown in Figure 13. It can be seen from Figure 13a that the hardness decreases with the increase of contact depth until it reaches a value of about 0.5 GPa. Similarly, at a small contact depth, the ECS has considerable variation, while at a large contact depth, the ECS is approximately 15 GPa (see Figure 13b). This variation in hardness and elastic modulus values at a small contact depth can be attributed to probing a cluster of CS particles as well as the spherical shape of carbon particles possibly causing deformation instability at a small contact depth. After performing the nano-indentation experiments several times in different regions of CS particles on the sample, the average values of hardness and elastic modulus of CS particles are summarized in Table 1. Table 1 presents the mean and standard deviation values of hardness, reduced modulus, and elastic modulus of CS particles obtained from nano-indentation experiments. The mean values are 1.2 GPa and 16.5 GPa for hardness and elastic modulus of CS particles, respectively. The mean value of ECS obtained from the nano-indentation experiments falls in the range of ECS obtained from AFM tests.
In the tribology field, the hardness to elastic modulus ratio is very crucial. For hard materials that have a high hardness/elastic ratio, high contact stresses are expected and, as a result, large stress concentrations developed near the tip of the indenter probe. Meanwhile, for soft materials that have a low hardness/elastic ratio, lower stresses with more even distribution within the contact are expected [7,32].
As shown in Figure 14, the hardness/elastic ratio is in the range of 10−1, which is comparable to metallic materials [7,33]. This relatively high ratio of hardness/elastic is suggesting good load-bearing capacity, durability, and wear resistance of the CS particles. These results support the viable use of CS particles as additives in liquid lubricants to help reduce friction and wear, especially in the boundary and mixed lubrication regimes by penetrating between surfaces asperities, bearing some of the applied load, and reducing the pressure on the contacting surfaces. Moreover, the spherical shape of these carbon particles combined with their good hardness/elastic ratio suggests that CS particles can act as sub-micrometer ball bearings within the system.
4. Conclusions
In the current work, the elastic properties of carbon sphere particles (less than a micrometer in diameter) are examined by AFM and nano-indentation tests. Furthermore, the FIB-SEM system is used to investigate the morphology, internal structure, and chemical composition of the carbon particles. The FIB-SEM analyses demonstrated that the carbon particles have a smooth spherical surface and sub-micrometer size. Moreover, the CS particle was found to be comprised of carbon element only with a solid internal structure. AFM was utilized to obtain 2D and 3D images of CS particles. The AFM results corroborated that there is no agglomeration between CS particles, and they are entirely detached from each other. Furthermore, the AFM was used to measure the adhesion force between the CS particle and the AFM tip, and it was found to be in the range of 36 to 59 nN. Moreover, AFM and nano-indentation experiments were performed on CS particles to explore their mechanical properties (elastic modulus and hardness). The obtained results showed that the CS particles have a mean elastic modulus and hardness of 16.5 GPa and 1.2 GPa, respectively. These outcomes demonstrate the excellent mechanical properties of the CS particles combined with the smooth exterior surface and solid internal structure. These results promote the use of CS particles in many applications such as tribological applications, specifically as oil additives, as well as in other applications that require spherical sub-micrometer particles with good mechanical properties.
Supplementary Materials
The following are available online at https://0-www-mdpi-com.brum.beds.ac.uk/2075-4442/8/7/77/s1.
Author Contributions
Conceptualization, A.A.A.; methodology, A.A.A.; investigation, A.A.A. and A.D.D.; resources, A.D.D. and V.G.P.; writing—original draft preparation, A.A.A. and V.G.P.; writing—review and editing, A.A.A. and V.G.P.; supervision, A.A.A.; project administration, A.A.A. and V.G.P. All authors have read and agreed to the published version of the manuscript.
Funding
This research received no external funding.
Acknowledgments
The authors gratefully acknowledging the support of Kuwait University General Facility (Grant No. GE 01/07 and GE 01/08). Electron microscopy and nano-indentation studies were conducted at KUNRF. Atomic force microscopy studies were performed at the KUSRF. The authors acknowledge Hana Tesařová from TESCAN for performing the FIB-SEM analysis. Also, we would like to acknowledge Maneesh Mathai from KUSRF for his assistance in conducting AFM experiments.
Conflicts of Interest
The authors declare no conflict of interest.
References
- Cha, C.; Shin, S.R.; Annabi, N.; Dokmeci, M.R.; Khademhosseini, A. Carbon-Based Nanomaterials: Multifunctional Materials for Biomedical Engineering. ACS Nano 2013, 7, 2891–2897. [Google Scholar] [CrossRef] [PubMed]
- Zhai, W.; Srikanth, N.; Kong, L.B.; Zhou, K. Carbon nanomaterials in tribology. Carbon 2017, 119, 150–171. [Google Scholar] [CrossRef]
- Mauter, M.S.; Elimelech, M. Environmental applications of carbon-based nanomaterials. Environ. Sci. Technol. 2008, 42, 5843–5859. [Google Scholar] [CrossRef] [PubMed]
- Lu, G.; Lu, G.M.; Xiao, Z.M. Mechanical properties of porous materials. J. Porous Mater. 1999, 6, 359–368. [Google Scholar] [CrossRef]
- Yang, Y.H.; Li, W.Z. Radial elasticity of single-walled carbon nanotube measured by atomic force microscopy. Appl. Phys. Lett. 2011, 98, 041901. [Google Scholar] [CrossRef]
- Cesano, F.; Cravanzola, S.; Brunella, V.; Scarano, D. Porous carbon spheres from poly (4-ethylstyrene-co-divinylbenzene: Role of ZnCl2 and KOH agents in affecting porosity, surface area and mechanical properties. Microporous Mesoporous Mater. 2019, 288, 109605. [Google Scholar] [CrossRef]
- Trompeta, A.F.A.; Koumoulos, E.P.; Kartsonakis, I.A.; Charitidis, C.A. Advanced characterization of by-product carbon film obtained by thermal chemical vapor deposition during CNT manufacturing. Manuf. Rev. 2017, 4, 7. [Google Scholar] [CrossRef] [Green Version]
- Pol, S.V.; Pol, V.G.; Sherman, D.; Gedanken, A. A solvent free process for the generation of strong, conducting carbon spheres by the thermal degradation of waste polyethylene terephthalate. Green Chem. 2009, 11, 448–451. [Google Scholar] [CrossRef]
- Etacheri, V.; Wang, C.; O’Connell, M.J.; Chan, C.K.; Pol, V.G. Porous carbon sphere anodes for enhanced lithium-ion storage. J. Mater. Chem. A 2015, 3, 9861–9868. [Google Scholar] [CrossRef]
- Fan, X.; Li, W.; Fu, H.; Zhu, M.; Wang, L.; Cai, Z.; Liu, J.; Li, H. Probing the function of solid nanoparticle structure under boundary lubrication. ACS Sustain. Chem. Eng. 2017, 5, 4223–4233. [Google Scholar] [CrossRef]
- Alazemi, A.A.; Etacheri, V.; Dysart, A.D.; Stacke, L.E.; Pol, V.G.; Sadeghi, F. Ultrasmooth submicrometer carbon spheres as lubricant additives for friction and wear reduction. ACS Appl. Mater. Interfaces 2015, 7, 5514–5521. [Google Scholar] [CrossRef] [PubMed]
- Alazemi, A.A.; Dysart, A.D.; Phuah, X.L.; Pol, V.G.; Sadeghi, F. MoS2 nanolayer coated carbon spheres as an oil additive for enhanced tribological performance. Carbon 2016, 110, 367–377. [Google Scholar] [CrossRef]
- Ivanova, O.; Williams, C.; Campbell, T. Additive manufacturing (AM) and nanotechnology: Promises and challenges. Rapid Prototyp. J. 2013, 19, 353–364. [Google Scholar] [CrossRef] [Green Version]
- Holmberg, K.; Erdemir, A. Global impact of friction on energy consumption, economy and environment. Fme Trans. 2015, 43, 181–185. [Google Scholar]
- Ren, B.; Gao, L.; Li, M.; Zhang, S.; Ran, X. Tribological properties and anti-wear mechanism of ZnO@ graphene core-shell nanoparticles as lubricant additives. Tribol. Int. 2020, 144, 106114. [Google Scholar] [CrossRef]
- Kotia, A.; Ghosh, G.K.; Srivastava, I.; Deval, P.; Ghosh, S.K. Mechanism for improvement of friction/wear by using Al2O3 and SiO2/Gear oil nanolubricants. J. Alloy. Compd. 2019, 782, 592–599. [Google Scholar] [CrossRef]
- Zhang, F.; Zhang, X.; Zhang, F.; Tang, G.; Li, C.; Xu, J. 3D/1D heterostructure of flower-like MoS2 nanospheres anchored on carbon nanotubes for enhanced friction and wear properties as oil additives. Mater. Res. Express 2020, 6, 1250f9. [Google Scholar] [CrossRef]
- Beheshti, A.; Huang, Y.; Ohno, K.; Blakey, I.; Stokes, J.R. Improving tribological properties of oil-based lubricants using hybrid colloidal additives. Tribol. Int. 2020, 144, 106130. [Google Scholar] [CrossRef]
- Akbulut, M. Nanoparticle-based lubrication systems. J. Powder Metall. Min. 2012, 1, 1–3. [Google Scholar] [CrossRef]
- Butt, H.J.; Cappella, B.; Kappl, M. Force measurements with the atomic force microscope: Technique, interpretation and applications. Surf. Sci. Rep. 2005, 59, 1–152. [Google Scholar] [CrossRef] [Green Version]
- Wagner, R.; Moon, R.; Pratt, J.; Shaw, G.; Raman, A. Uncertainty quantification in nanomechanical measurements using the atomic force microscope. Nanotechnology 2011, 22, 455703. [Google Scholar] [CrossRef] [PubMed]
- Wagner, R.; Moon, R.; Pratt, J.; Shaw, G.; Raman, A. Radial elasticity of multiwalled carbon nanotubes. Phys. Rev. Lett. 2005, 94, 175502. [Google Scholar]
- Lee, C.; Wei, X.; Kysar, J.W.; Hone, J. Measurement of the elastic properties and intrinsic strength of monolayer graphene. Science 2008, 321, 385–388. [Google Scholar] [CrossRef] [PubMed]
- Pol, V.G.; Shrestha, L.K.; Ariga, K. Tunable, Functional Carbon Spheres Derived from Rapid Synthesis of Resorcinol-Formaldehyde Resins. ACS Appl. Mater. Interfaces 2014, 6, 10649–10655. [Google Scholar] [CrossRef] [PubMed]
- Tze, W.; Wang, S.; Rials, T.; Pharr, G.; Kelley, S. Nanoindentation of wood cell walls: Continuous stiffness and hardness measurements. Compos. Part A Appl. Sci. Manuf. 2007, 38, 945–953. [Google Scholar] [CrossRef]
- Konnerth, J.; Gierlinger, N.; Keckes, J.; Gindl, W.; Gindl-Altmutter, W. Actual versus apparent within cell wall variability of nanoindentation results from wood cell walls related to cellulose microfibril angle. J. Mater. Sci. 2009, 44, 4399–4406. [Google Scholar] [CrossRef] [Green Version]
- Alazemi, A.A. Experimental Investigation of Friction Fundamentals at the Microscale; Purdue University: West Lafayette, IN, USA, 2017. [Google Scholar]
- Hertz, H. Ueber die Berührung fester elastischer Körper. J. Reine Angew. Math. 1882, 1882, 156–171. [Google Scholar]
- Guo, D.; Li, J.; Xie, G.; Wang, Y.; Luo, J. Elastic Properties of Polystyrene Nanospheres Evaluated with Atomic Force Microscopy: Size Effect and Error Analysis. Langmuir 2014, 30, 7206–7212. [Google Scholar] [CrossRef] [PubMed]
- Johnson, K.L.; Johnson, K.L. Contact Mechanics; Cambridge University Press: Cambridge, UK, 1987. [Google Scholar]
- Chizhik, S.A.; Huang, Z.; Gorbunov, V.V.; Myshkin, N.K.; Tsukruk, V.V. Micromechanical Properties of Elastic Polymeric Materials As Probed by Scanning Force Microscopy. Langmuir 1998, 14, 2606–2609. [Google Scholar] [CrossRef]
- Leyland, A.; Matthews, A. Design criteria for wear-resistant nanostructured and glassy-metal coatings. Surf. Coat. Technol. 2004, 177, 317–324. [Google Scholar] [CrossRef]
- Ashby, M.F.; Cebon, D. Materials selection in mechanical design. MRS Bull. 2005, 30, 995. [Google Scholar] [CrossRef] [Green Version]
Figure 1.
Photographic images of oil only, oil with carbon sphere (CS), and oil with CS after 2 weeks from sonication.
Figure 1.
Photographic images of oil only, oil with carbon sphere (CS), and oil with CS after 2 weeks from sonication.

Figure 2.
(a–c) Scanning electron microscopy (SEM) micrographs of carbon particles at different magnifications. (d) Size distribution of carbon particles performed using dynamic light scattering (DLS).
Figure 2.
(a–c) Scanning electron microscopy (SEM) micrographs of carbon particles at different magnifications. (d) Size distribution of carbon particles performed using dynamic light scattering (DLS).

Figure 3.
(a) SEM micrograph (b) chemical analysis using energy dispersive X-ray spectroscopy (EDS) of two different CS particles.
Figure 3.
(a) SEM micrograph (b) chemical analysis using energy dispersive X-ray spectroscopy (EDS) of two different CS particles.

Figure 4.
(a) SEM micrograph of a cluster of CS particles and (b) a section of CS particles after milling using focus ion beam (FIB).
Figure 4.
(a) SEM micrograph of a cluster of CS particles and (b) a section of CS particles after milling using focus ion beam (FIB).

Figure 5.
Schematic of the piezoelectric z-stage (a) approaching, (b) coming in contact, (c) applying force, and then (d) retracting from the atomic force microscopy (AFM) cantilever. (e) The corresponding force-distance curve.
Figure 5.
Schematic of the piezoelectric z-stage (a) approaching, (b) coming in contact, (c) applying force, and then (d) retracting from the atomic force microscopy (AFM) cantilever. (e) The corresponding force-distance curve.

Figure 6.
(a) Schematic illustration of AFM cantilever scanning a CS particle. (b) Optical image of CS particles deposited on mica sheet.
Figure 6.
(a) Schematic illustration of AFM cantilever scanning a CS particle. (b) Optical image of CS particles deposited on mica sheet.

Figure 7.
2D and 3D AFM images for (a) the mica sheet alone and (b) CS particles on the mica sheet.

Figure 8.
(a) 2D and (b) 3D AFM images of a single carbon sphere particle on Si wafer.

Figure 9.
(a) 2D AFM image indicating the location where (b,c) force-distance curves and (d,e) the corresponding force-separation curves performed, in the center of CS particle and on Si wafer, respectively.
Figure 9.
(a) 2D AFM image indicating the location where (b,c) force-distance curves and (d,e) the corresponding force-separation curves performed, in the center of CS particle and on Si wafer, respectively.

Figure 10.
Force-distance curves obtained from multiple approach-retraction experiments conducted on different CS particles.
Figure 10.
Force-distance curves obtained from multiple approach-retraction experiments conducted on different CS particles.

Figure 11.
AFM results of the variations of (a) force and (b) CS elastic modulus with the indentation depth. Solid lines represent the Hertz contact model at two different values of ECS.
Figure 11.
AFM results of the variations of (a) force and (b) CS elastic modulus with the indentation depth. Solid lines represent the Hertz contact model at two different values of ECS.

Figure 12.
Force versus displacement curve for CS particles. Inset: Optical image displaying the location of the nano-indentation test on the sample.
Figure 12.
Force versus displacement curve for CS particles. Inset: Optical image displaying the location of the nano-indentation test on the sample.

Figure 13.
(a) Hardness and (b) elastic modulus as a function of contact depth for CS particles obtained from nano-indentation experiments.
Figure 13.
(a) Hardness and (b) elastic modulus as a function of contact depth for CS particles obtained from nano-indentation experiments.

Figure 14.
Hardness/elastic modulus ratio of the CS particles as a function of contact depth obtained from nano-indentation experiments.
Figure 14.
Hardness/elastic modulus ratio of the CS particles as a function of contact depth obtained from nano-indentation experiments.


Table 1.
Mean and standard deviation values of hardness, reduced modulus, and elastic modulus of carbon sphere (CS) particles obtained from nano-indentation experiments.
Table 1.
Mean and standard deviation values of hardness, reduced modulus, and elastic modulus of carbon sphere (CS) particles obtained from nano-indentation experiments.
| Hardness, H (GPa) | Reduced Modulus, Er (GPa) | Elastic Modulus of CS, Ecs (GPa) | |
|---|---|---|---|
| Mean | 1.2 | 16.6 | 16.5 |
| Standard Deviation | 0.6 | 4.7 | 4.8 |
© 2020 by the authors. Licensee MDPI, Basel, Switzerland. This article is an open access article distributed under the terms and conditions of the Creative Commons Attribution (CC BY) license (http://creativecommons.org/licenses/by/4.0/).
Share and Cite
MDPI and ACS Style
Alazemi, A.A.; Dysart, A.D.; Pol, V.G. Experimental Investigation of the Mechanical and Surface Properties of Sub-Micron Carbon Spheres. Lubricants 2020, 8, 77. https://0-doi-org.brum.beds.ac.uk/10.3390/lubricants8070077
AMA Style
Alazemi AA, Dysart AD, Pol VG. Experimental Investigation of the Mechanical and Surface Properties of Sub-Micron Carbon Spheres. Lubricants. 2020; 8(7):77. https://0-doi-org.brum.beds.ac.uk/10.3390/lubricants8070077
Chicago/Turabian StyleAlazemi, Abdullah A., Arthur D. Dysart, and Vilas G. Pol. 2020. "Experimental Investigation of the Mechanical and Surface Properties of Sub-Micron Carbon Spheres" Lubricants 8, no. 7: 77. https://0-doi-org.brum.beds.ac.uk/10.3390/lubricants8070077
Note that from the first issue of 2016, this journal uses article numbers instead of page numbers. See further details here.