Article

Experimental Analysis of Friction and Wear of Self-Lubricating Composites Used for Dry Lubrication of Ball Bearing for Space Applications

1
Department of Applied Mechanics, Institute CNRS/UFC/ENSMM/UTBM, Univ. Bourgogne Franche-Comté FEMTO-ST, 24 rue de l’Epitaphe, F-25000 Besançon, France
2
Laboratoire de Mécanique des Contacts et des Structures, Université de Lyon, INSA-Lyon, CNRS UMR5259, F-69621 LaMCoS, France
3
Centre National des Etudes Spatiales, 18 avenue Edouard Belin, CEDEX 9, 314001 Toulouse, France
4
Department of Mechanical & Industrial Engineering, The University of Toronto, 5 King’s College Road, Toronto, ON M5S 3G8, Canada
5
Aerospace & Advanced Composites GmbH, Viktor-Kaplan-Strasse 2, 2700 Wiener Neustadt, Austria
*
Author to whom correspondence should be addressed.
Submission received: 2 November 2020 / Revised: 9 March 2021 / Accepted: 1 April 2021 / Published: 3 April 2021
(This article belongs to the Special Issue Tribology of Space Mechanisms)

Abstract

:
Lubricating space mechanisms are a challenge. Lubrication must be sustained in different environments, for a very long period of time, and without any maintenance possible. This study focuses on the self-lubricating composite used in the double transfer lubrication of ball bearing. Ball/races contacts are lubricated via the transfer of materials from the cage that is made of the composite. A dedicated tribometer has been designed for the study. A specificity of the tribometer is to not fully constrain the composite sample but to let it move, as the cage would do in the bearing. Four composites (PTFE, MoS2, glass or mineral fibers) where tested in ultrahigh vacuum and humid air environments. Transfer was achieved with morphologies and composition similar to what is observed on real bearings. Adhesion measurements performed on composite materials before and after friction allowed one to explain the differences in tribological behaviors observed (transfer quality and contact instabilities). Beyond strengthening the composites, fibers are shown to be critical in trapping mechanically and chemically the transferred material to lubricate and prevent instabilities. Equilibrium between internal cohesion of transferred material, and adhesion to counterparts must be satisfied. Mass spectrometry showed that water appears also critical in the establishment of stable transfer film, even in vacuum.

1. Introduction

Lubricating space mechanisms is a difficult task as the mechanisms sees multiple environments on the ground (UHV, humid air and dry nitrogen) and in space (low Earth orbit and deep space). Many mechanisms are expected to last multiple years, leading to very long wear life of the tribological components, up to hundreds of millions of rotations for a ball bearing [1,2]. In numbers of applications, for example where bearings are operating in the boundary condition, solid lubrication is preferred to fluid and grease lubrication [2,3]. Coatings and composites materials are the solutions extensively used, sometimes in combination [2,3]. This study is focusing on investigating the tribological behavior of four self-lubricating polymer matrix composite materials, two commercially available and two under development, used or intended to be used to lubricate ball bearing. A vast panel of polymer–matrix composites materials have been developed to lubricate sliding contact [4,5,6,7,8,9,10,11]. Self-lubricating materials are well known to provide low friction and low wear in a wide range of sliding speed [7,11,12,13], temperatures [7,14,15] and humidity [7,8,16]. Related applications targeted in this study are spacecraft components whose service temperatures are in a low range within −55 to +50 °C [17]. Consequently, extreme temperatures such as those encountered in cryogenic applications are not of interest in this study. However, it has been shown that such composites can be successfully used in such cases [18].
The transfer lubrication (Figure 1d), also called double transfer lubrication, is an example of “useful wear” because the lubrication is made by a sacrificial cage material. Indeed, this lubrication process relies on the production of wear particles at the ball/cage interface by sliding motion [19,20,21,22,23,24,25]. Particles are formed during sliding at the ball/cage contact interface (step 1). The particles, once formed, either fall on the inner race, or form a cluster at the exit of the contact. Minimal pressure of few MPa is sufficient to ensure cage wear [4]. Then (step 2), the particles adherent to the ball surface are transported to the ball/outer race due to the rolling motion of the ball on the race. They enter and circulate inside the contact to be crushed and compacted. As the ball keeps rolling, some particles are transferred to the outer race surface and form a layer on the surface, while others still adhere to the ball surface. At the end of step 2, particles and layers of compacted particles are formed on both the ball and the outer race. Eventually, at step 3 the same process takes place at the ball/inner race interface. It should be noted that the particles that have fallen on the inner race after being formed at the ball/cage interface during step 1 could enter inside the ball/inner race contact at step 3. At the end of step 3, particles and layers of compacted particles are formed on the inner race. Thus, there is an initial transfer of lubricating particles from the cage to the ball and a second transfer from the ball to the races.
Once the transfer films are formed, the wear rate of the cage must be almost null and any new particles formed must ensure the renewal of the films. Cage’s wear is critical to the success of the ball bearing lubrication but it must be kept low to maintain ball to pocket clearances throughout bearing lifetime [2]. In brief, successfully formulating composites requires controlling wear particle flows from the cage, their circulation and reuse, and the mechanisms by which they can form a transfer film and remain adherent to surfaces.
During decades Duroïd 5813 (PTFE matrix, glass fiber and MoS2 particles) has been widely used as cage composite material. Following the cessation of the Duroïd 5813 manufacturing in the 1990s [3], PGM-HT has been identified by the European Space Tribology Laboratory (ESTL) and the European Space Agency (ESA) as the best candidate to replace it as the self-lubricating material for space application, providing some specific requirements on its fabrication and use [4,26,27]. However, discussions remain on its lubrication performances in ball bearings, especially on its capability to transfer material on both the balls and the races without damaging them to ensure good lubrication [1,28]. To avoid lubrication failure, it has been recommended to coat both the balls and the races with MoS2 [27]. However, in some cases it is primarily the coating that is lubricating the contacts and not the composite [29].
Consequently, the uncertainties and limitations of the PGM-HT urge the development of new material. On the European side, numerous studies at ESTL, Aerospace & Advanced Composites GmbH (AAC), the French Space Agency (CNES) and ESA mainly investigated the materials on Pin-On-Disc (POD) or bearing testers [1,26,28,30] and compared the performances of materials (friction coefficient and wear) depending on the nature of their constituents using PGM-HT and Duroïd as references. From Pin-On-Disc to bearing a big gap exists due to the differences in the emulated kinematics. The literature [31,32,33] shows that the degrees of freedom of the system applying the contact conditions have a big impact on the creation and the distribution of the 3rd body inside the contact, which may lead to the opposite results if the tests are conducted on different tribometers, even if similar contact conditions are applied. The 3rd body is essentially composed of the particles detached from the materials initially in contact (called 1st bodies) and circulating inside the contact [34,35]. Here the 3rd body is eventually becoming the transfer films on both balls and races, and it carries loads and accommodates velocity at the contact. The 3rd body has its own mechanical, physical and chemical properties, which make it a different material as compared to the materials initially in contact.
For this study, a dedicated double transfer test bench (DTTB) [36] to study more fundamentally the double transfer mechanisms encountered in the dry lubrication of ball-bearing has been designed and manufactured (Figure 1). This unique setup (further described in Section 2) fully emulates the cage/ball/race system through a two-contact configuration. It is able to tackle current limitations of POD, and bearing testers in the study of transfer lubrication. The aim is to highlight more quantitative criteria to test/validate and ideally design new materials.
The 2015 ESMATS communication reports the results of the eight composites tested [36], here the paper focuses on the four main ones with extended morphological and chemical analysis of surfaces and adhesion measurements to further explain the different tribological behaviors. Adhesion is characterized at the nanoscale using atomic force microscope (AFM), but using cantilevers with stainless steel microbeads fixed in-house on them. Consequently, the adhesion is probed directly with the relevant tribological materials, such an approach was only used on coating in a previous study [29,37].
Consequently, the DTTB and the associated analysis will help to understand the 3rd body creation, its circulation inside the contact and ultimately its arrangement to form the transfer film. In other words, such a unique global understanding approach will help understand the friction and wear processes governing the double transfer lubrication, and consequently the associated tribological behavior observed in space mechanisms.

2. Materials and Methods

2.1. Composite Materials

Four composite materials are studied. Among them, 2 reference materials: 1 that was commercially available (Duroïd 5813) and widely used but whose production ceased decades ago, and the now recommended composite that is commercially available (PGM-HT). Table 1 gives detailed information regarding the composites tested. AAC-C1 and AAC-C9 are the result of a previous study during which several materials were tested on a common POD test configuration in different environments to identify the most promising formulation [5]. For those 2 composites, dimensions of both the fibers (in diameter) and the MoS2 particles lie between those of Duroïd 5813 and PGM-HT. To our knowledge, in AAC-C1, AAC-C9 and PGM-HT, fibers are dispersed in the matrix with random orientations in accordance with decades old recommendations [20]. Duroïd 5813 differs in that it is a bidirectional composite with 2/3 of the fibers oriented in one direction, 1/3 in the orthogonal direction, none oriented along the third direction [12]. PGM-HT exist with different preconditioning and the tested PGM-HT is preconditioned in vacuum at 240 °C for 24 h as recommended by ESA in 2012 [4,27].

2.2. Friction Tests

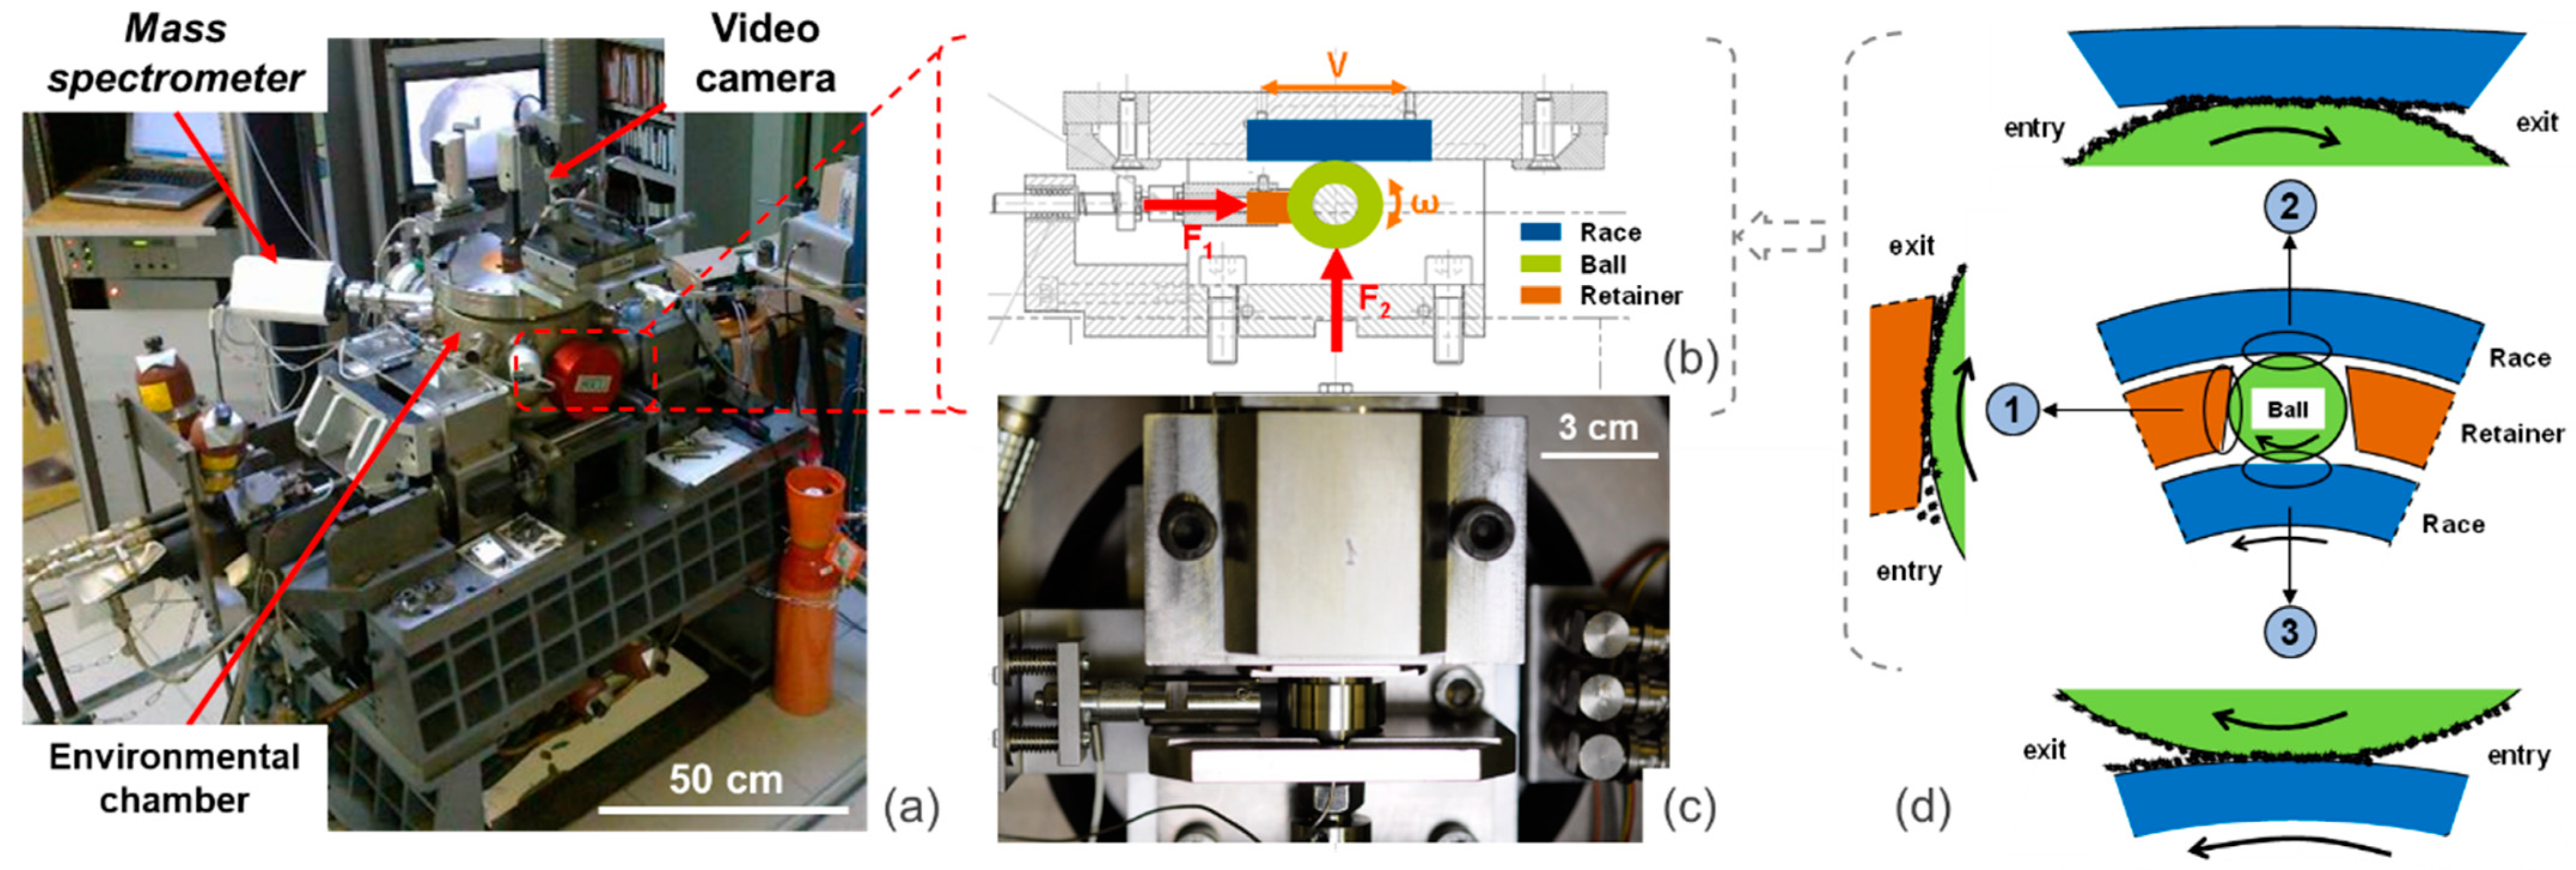
2.2.1. The Double Transfer Test Bench (DTTB)

The double transfer test bench (DTTB) (Figure 1), specifically designed and manufactured for the study, can simulate both cage/ball and ball/race contacts at once. It operates in a fully equipped environmental chamber. As shown on Figure 1, the bearing is simulated with 3 samples:
  • A barrel shaped roller (Ø 25 mm, roundness Ø 1000 mm) whose motion is only rotation. A drawing of the specimen is given in Supplementary Materials (SM),
  • A plate sample (l = 109 mm, w = 10 mm, t = 14 mm) whose motion is only translation,
  • A pad sample (Ø 8 mm) made of the composite to be tested to emulate the cage.
The motion control of the roller and the plate is done via the PID feedback loop in a master/slave configuration, the master being the ball. It allows performing both pure rolling and rolling with sliding kinematics. Normal and tangential forces between the roller and the plate are measured through a XYZ piezoelectric sensor on which the motor is rigidly fixed. The plate sample is mounted on a structure moving in the x direction. Both the roller (motor) and the composite pad are mounted on the same bottom plate that moves vertically to make contact between the roller and the plate, and apply F2. The roller can be in contact with the composite pad only or with both the composite pad and the plate. The composite pad is mounted on a sensor measuring the force F1 with a sensitivity of ±0.01 N. The sensor allows monitoring the variations of the load all along the test. The contact load F1 between the sample simulating the cage and the ball is applied via two compression springs. The assembly is guided in the support due to two roller guides. As it is shown in Figure 1, the assembly is a long-suspended structure that gives the freedom to its end (basically the surface in contact with the ball) to slightly move around its center position. Such freedom was chosen as the contact between the ball and the cage in a bearing is far from being rigidly fixed.
The ball and plate samples are made of AISI440C with a roughness Ra < 0.1 µm. Prior to experiments, samples are cleaned with respect to a protocol recommended by CNES [40]. Composite samples are machined with respect to the machining process of the real bearing cages to get a similar surface finish of the socket surface. Finally, no MoS2 coatings are deposited on samples in order to study only the capability of the materials to double transfer on the ball and on the race.

2.2.2. Contact Conditions

The kinematic is an alternative motion. The displacement amplitude of the plate sample is 75 mm in total, which covers approximately 95% of the roller perimeter. Therefore, there is no overlapping of the track ends. The linear speed of the ball is 100 mm/s and representative of space mechanisms’ bearings, such as those used in the STD and Polder [1]. It is also the sliding speed used to preselect the composites C1 and C9 in [30], and to test other composite compositions [4].
Contact loads are 1.5 N at the contact pad/roller (around 10 MPa of max Hertz theoretical initial contact pressure) and 125 N at the contact roller/race (0.5 GPa of max Hertz contact pressure). Experiments are conducted in UHV (10−7 mbar) and in air 50%RH (relative humidity). Experiments are done in 3 phases of 5000 cycles each to emulate different working conditions:
  • A—Running in with only the roller/composite pad contact to emulate the gentle run in;
  • B—Rolling without sliding with both roller/composite pad and roller/plate contacts;
  • C—Rolling with 0.5% sliding with both contacts to emulate severe working conditions.
One cycle gathers both the back and forth motions. All 3 phases are not performed during each test, which allows one to better study the friction and wear behavior of the materials in contact. To understand what happens at each step, some materials can see only phase A or the phases A and B. Experiments containing only phase A allow top view visualization of the ball. Procurement of materials has been difficult for PGM-HT and Duroïd 5813 samples with only very limited quantity. Phases A and B allowed for reproducibility assessment of the tests. Consequently, a video camera was used to study the friction track on the ball.

2.2.3. Real Time and Post Tribological Tests Analysis

A quadrupole mass spectrometer (QMS 200, Pfeiffer Vacuum) was used to continuously monitor the composition of the vacuum environment and the adsorption/desorption triggered by friction. Such monitoring allows tracking the degradation of the materials in contact during a friction test, determining which of the material is mostly stressed, and detecting if molecules from the vacuum environment are used by the contact [41,42,43,44,45]. Focus is on the masses relevant to the degradation and wear of PTFE, stainless steel and MoS2 [45,46,47,48]. Interest is also given to gaseous species known to affect the tribological behavior of the different constitutive elements of the composites (water, oxygen, carbon monoxide and dioxide and nitrogen). Numerous atomic masses are taken into consideration for each gas molecules of interest (Table 2). Molecules are fragmented during the measurement process. The relative abundance of each fragment as compared to the main one allows determining which molecule is detected. As can be seen in Table 2 one atomic mass can be representative of multiple molecules.
For a test in which only phase A was performed, live video of the test was recorded to monitor the transfer of composite material from the pad to the roller. High-definition video (1920 × 1200) was recorded due to a Nikon D5000 camera whose shutter is maintained open to get a continuous live view recording on the computer via USB3 connection.
A post-test morphological and chemical analysis was performed. The Keyence VHX-2000 digital optical microscope was used to study the morphology of the friction tracks. Eventually, detailed morphological analyses of the friction tracks were conducted under scanning electron microscopy (SEM) (FEI Quanta 600) in low partial pressure mode (130 Pa) to not melt the composite material and avoid charging. Chemical elemental analyses are also conducted using energy dispersive spectroscopy (EDS) (Oxford Instrument) analysis.

2.3. Adesion Measurements

Adhesion measurements were conducted on an Asylum Research MFP-3D AFM mounted on active damping system to filter out vibration coming from the building. The whole AFM + active damping system was installed in an acoustic chamber to isolate it from the room and associated noise.
Parameters used in the adhesion measurement are presented in Table 3. Measurements were conducted in humid air (50% RH) at room temperature (25 °C). All measurements were done using the same approach and retract speeds, and dwell time (time during which the bead stays in contact with the surface at the defined load). Multiple loading forces were used following a defined loading pattern (Table 3). Loading was repeated 6 times in row at each load, which led to 6 adhesion force values at each load. Six repetitions were performed to make sure 5 data points per load could be considered. On each sample, adhesion forces were measured using the same implemented procedure:
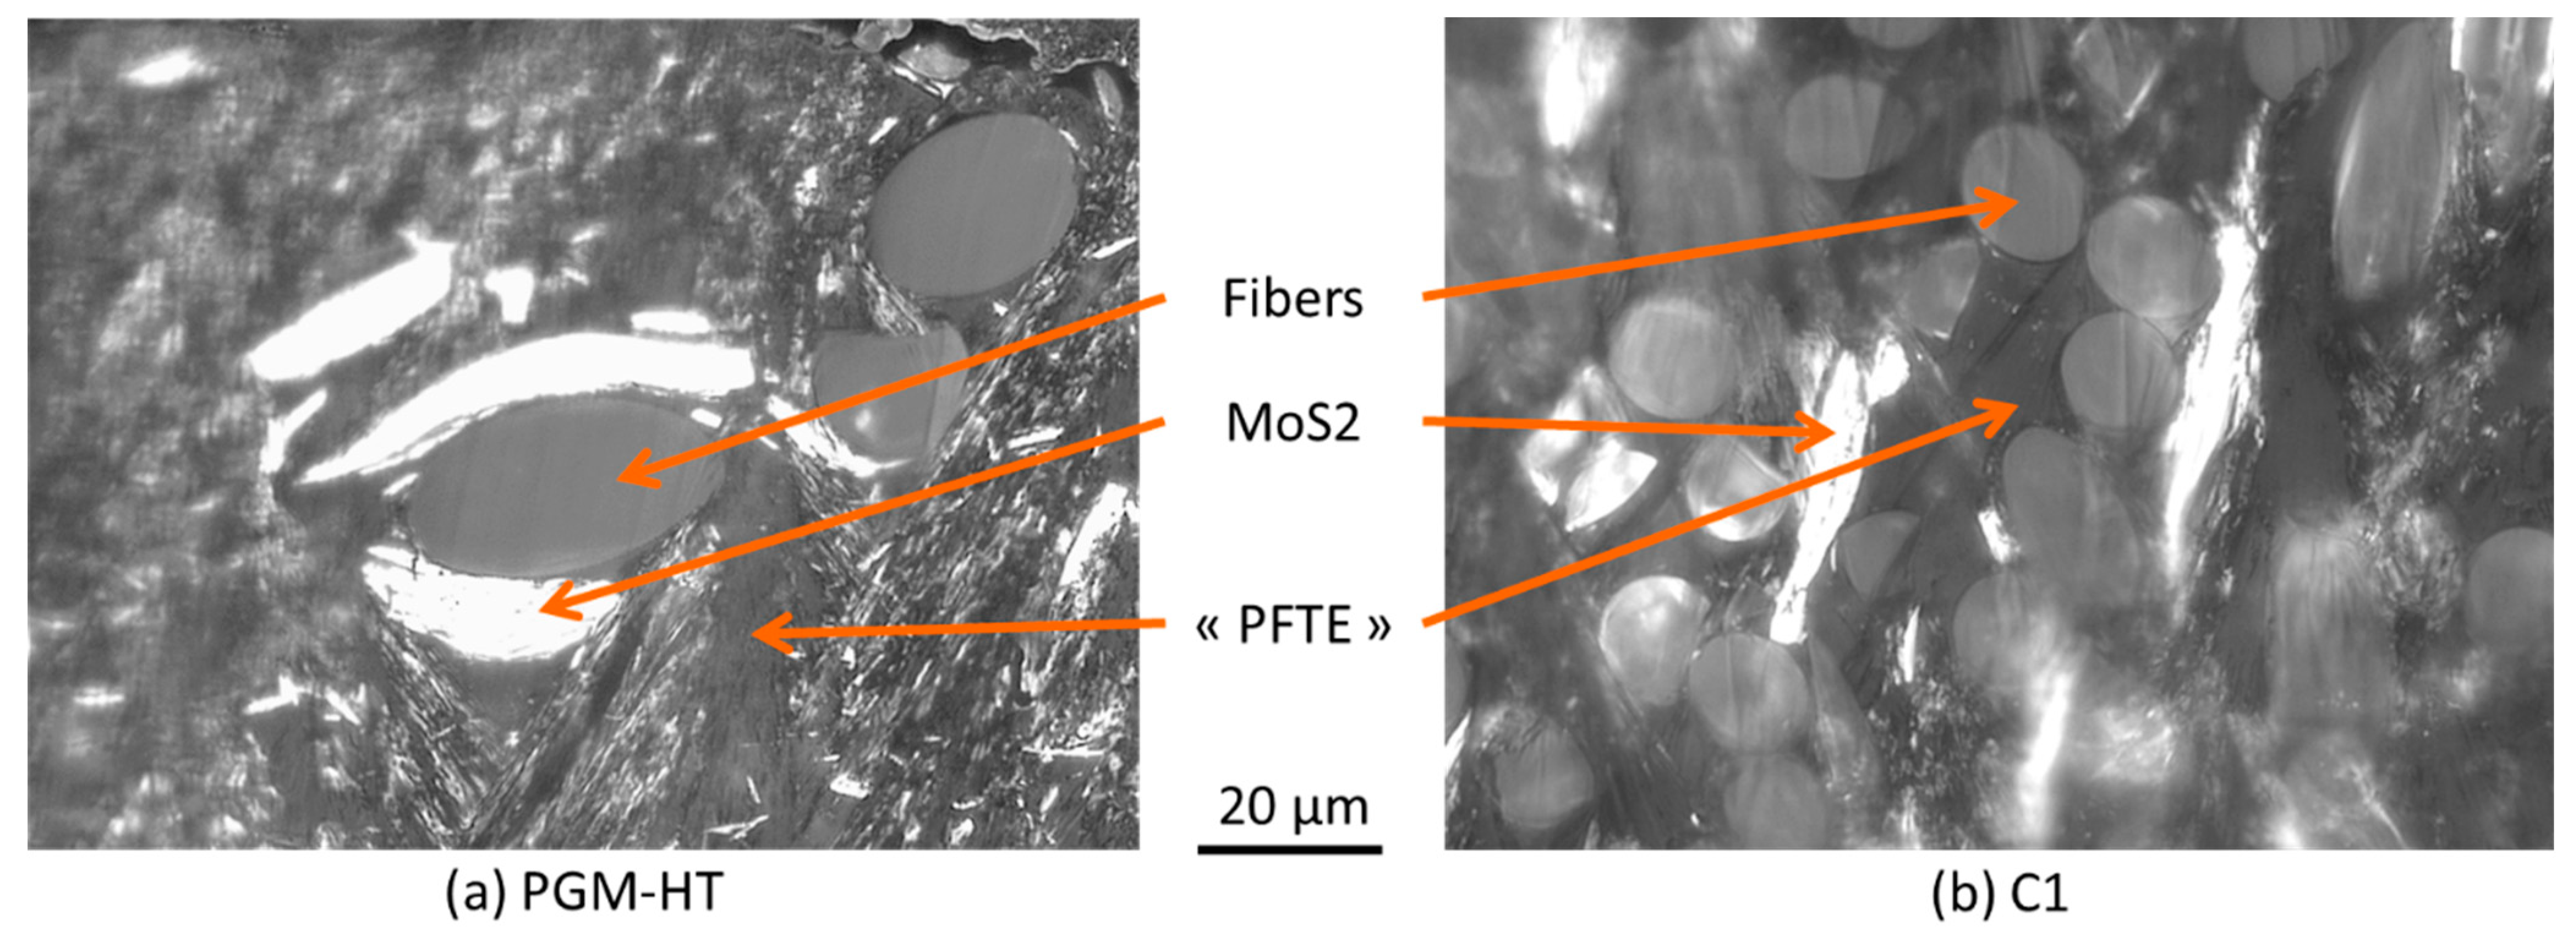
  • High resolution image of the 70 × 70 µm² region of interest (ROI): Prior to the full adhesion measurement and to make sure the ROI are gathering the 3 main constitutive elements of the composites (glass fiber, MoS2 particles and PTFE matrix) and 3rd body particles (for samples that underwent friction). NanoWorld AG NCHR sharp tip Si cantilevers (42 N/m stiffness) were used for high-resolution imaging of regions of interest. Using high resolution images allows for confident surface pattern recognition after scanning with the Ø 20 µm beads prior adhesion measurement. Images appear blurrier, which can mislead the localization of the constitutive elements. SEM images of those ROI are also used to fully grasp their morphologies and link them to adhesion.
  • Mounting of the beaded cantilever and stabilization of the environment. Cantilever is approached towards the surface, put in contact and then retracted just above the surface to make sure the system reached both an equilibrium temperature and the required humidity prior doing measurements.
  • Tapping mode image of the ROI with the beaded cantilever.
Adhesion measurements: 3–6 locations of measurement were selected on each constitutive elements of the composite, which led to 9–18 locations on a single ROI. They were selected far enough from the borders of each component to avoid disturbances on the measures. Selected locations were randomly distributed and chosen between all components to make sure any transfer of material from one component to the bead could be detected. Such transfer to the probe might impede the subsequent measures and must be avoided. Eventually, adhesion measurements were performed twice on the first location, at the beginning and at the end of the round of measurement, to check if adhesion changed, which would indicate changes on the bead surface.
Composites studied in this section were PGM-HT and AAC-C1 composite pads after complete test (phases A, B and C) in UHV. C9 and Duroïd 5813 had fibers that were thin and dispersed everywhere, but that can also be found as bundles (Appendix B Figure A2). The bead was too large to confidently characterize the adhesion with one single element. Due to the roughness of the samples, smaller bead made it impossible to image the surface because the cantilever was repeatedly hitting walls. That led to cantilever breakage or bead removal.
The objective of the adhesion measurement is to characterize the adhesion between the composite materials with the sliding/rolling counterparts, and to characterize as much as possible the adhesion between composite internal components when fragments are created during friction. The selected materials were AISI440C and borosilicate. Ideally, glass fiber fragments should have been used but geometries were too erratic, borosilicate composition was similar to the glass fiber except for the sizing that was not known. However, under friction, fragments were created and overall exposed bulk fiber surface became greater than the sizing covered surfaces. Table 4 presents the interfaces whose adhesion was characterized experimentally during the study.
As mentioned previously, adhesion measurement was performed using beaded cantilevers. Tipless NANOSENSORSTM TL-NCH cantilevers (42 N/m stiffness) modified in-house with Ø 20 mm AISI 440C stainless steel beads (Sandvik Osprey Ltd, Halesowen, UK.) were used for adhesion measurements. The AISI 440C beads were cleaned of contaminants using a Bransonic1 M1800H ultrasonic cleaner in acetone and ethanol for 5 min each, and then dried in an oven (Cole-Parmer1 Model 281A) for 30 min at 45 ± 5 °C. They were glued to the cantilevers using PC-Super Epoxy. To remove any contamination covering the interacting surface of the bead, the cantilevers were submerged in acetone for 1 min, then in ethanol for 1 min to wash away the acetone and any other residues.
Considering the limitation of AFM measurements towards the sample roughness, adhesion measurements have been done on both original bulk material to have reference values of adhesion prior to friction, and to compare the results with adhesion measured after friction. The friction track on the composite pad exhibits an elliptic shape surrounded by a contour comprised of particles and debris that have been ejected outside the contact. Adhesion is measured in the center of the ellipse and in the periphery where the center meets the contour. The reference samples were prepared by ion milling (IM) using a Hitachi IM400-Plus and Ar gas. Adhesion measurements on the IM prepared samples were done immediately after milling to minimize surface contamination and related impact on adhesion forces.

3. Results and Discussion

The results will focus on the variations of the normal load F1 at the contact between the composite pad and the roller, the mass spectrometry (only for UHV tests), and on the post-test analyses. F1 is the only force discriminating the different composites as explained in Appendix A. The significant events such as big particle detachment or circulation inside the contact can be clearly detected on F1 due to the degrees of freedom intentionally given to the pad (cf. Figure 2 and Section 3.1.1). Instabilities inside the roller/pad contact are also observable on F1 due to the activation of a resonance frequency of the system. It is believed that the combination of suspended assembly and the springs greatly amplifies the magnitude of displacement, hence allowing detection of those instability events during the friction life of the contact. Changes in the transfer film properties and composition, even in two contact configurations, directly affect the behavior of the roller/pad contact. Consequently, F1 efficiently helps to discriminate the materials and link their behavior to the composite, the friction tracks, and 3rd body compositions and morphologies. Those are studied with SEM and EDS after the test. The evaluation of both the transfer capabilities of materials and the 3rd body morphology is qualitative.

3.1. Tests in UHV Environment

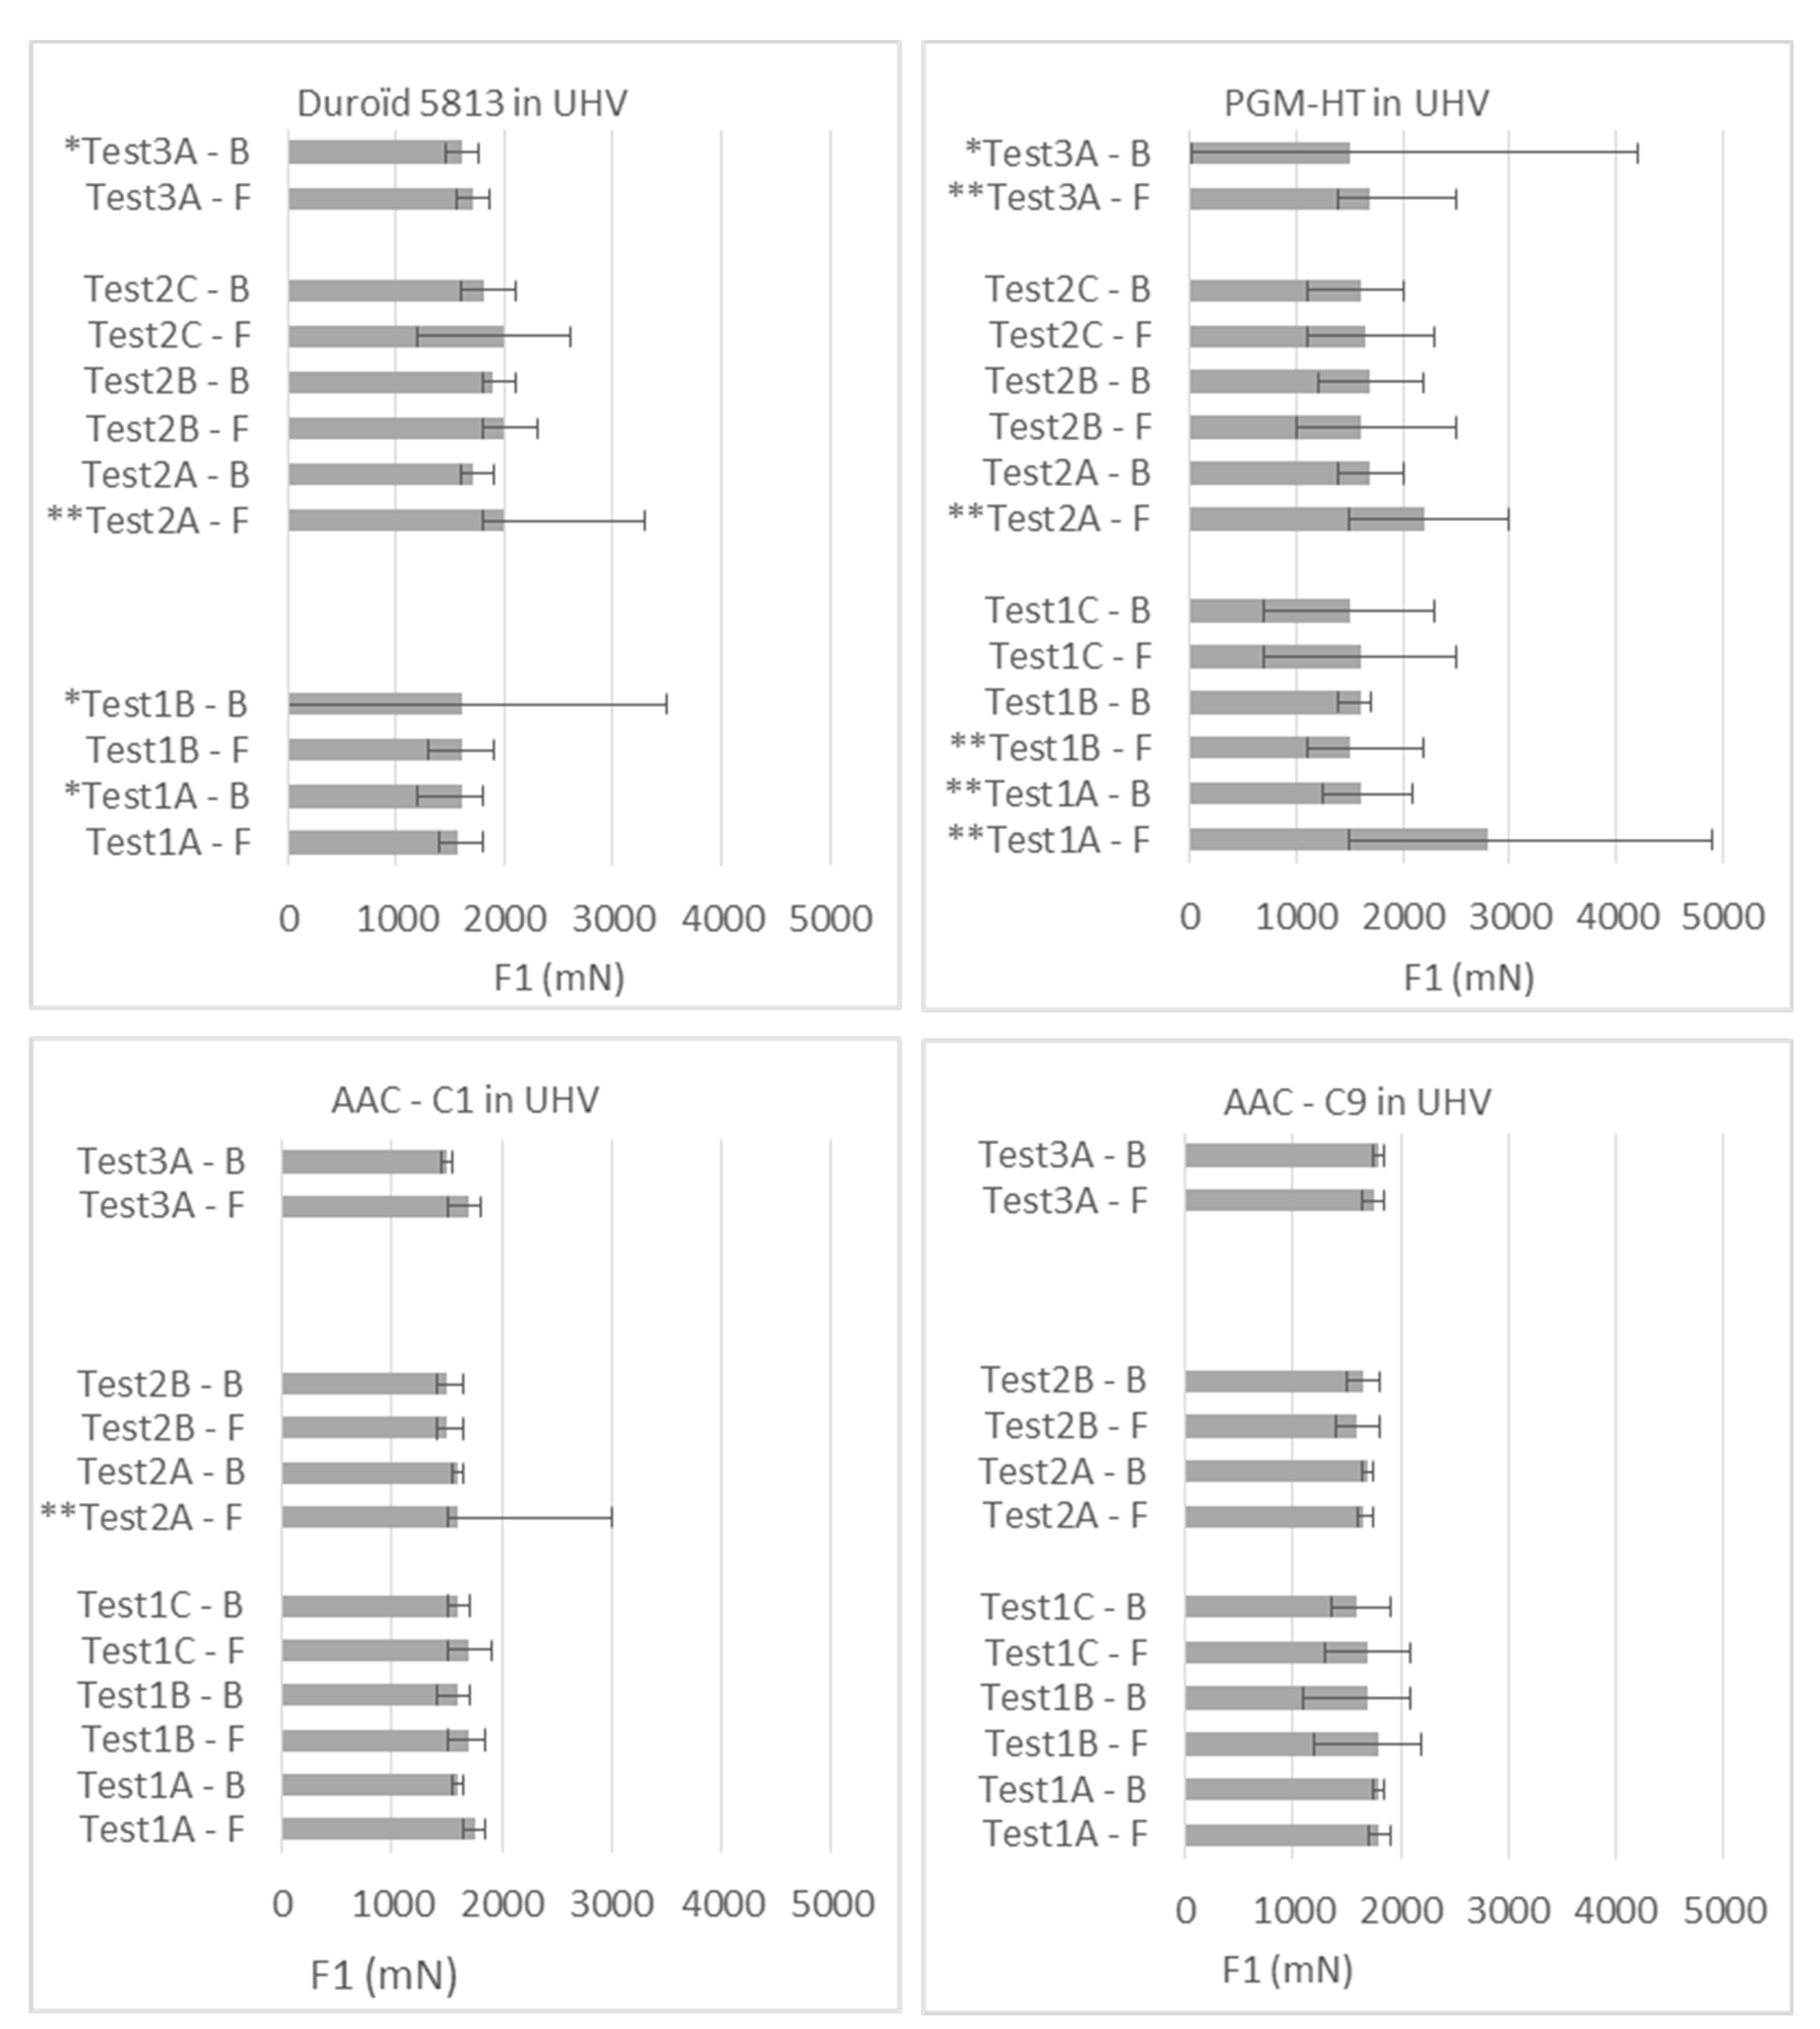
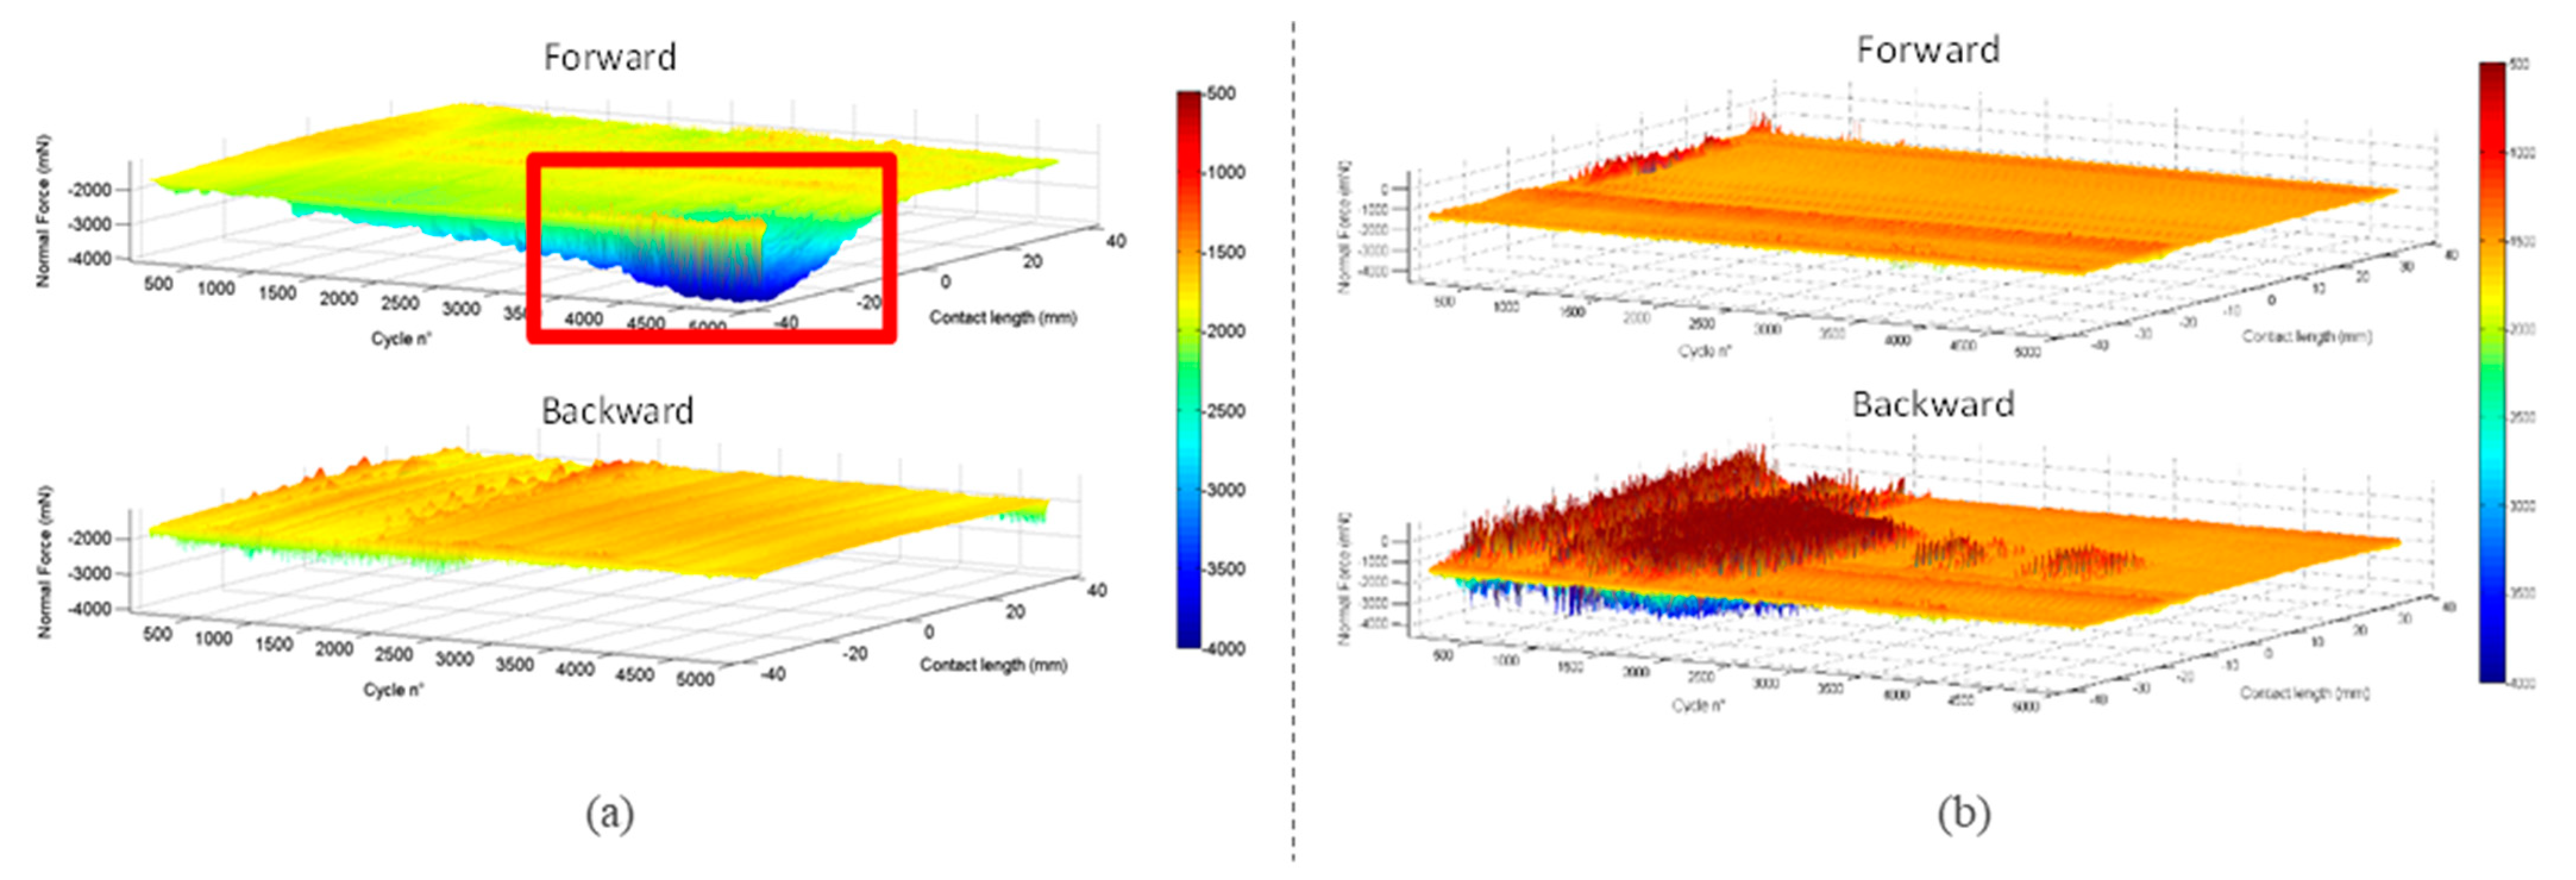
3.1.1. Friction Force

Figure 2 displays the mean friction force F1, and its mean and max values measured as depicted in Appendix A. AAC-C1 displays the most stable F1 force, except for the significantly high maximum force during Test2A-F due to the circulation of the 3rd body particles inside the contact, which pushes the pad backward leading to an increase of the force magnitude. Such big particle circulation was also detected with Duroïd 5813 (Figure 3a) and PGM-HT. All significant occurrences were in phase A of the tests, which makes sense as all particles were squeezed when entering the roller/plate contact in phases B and C. Nonetheless, such big particle circulation was occurring more often with PGM-HT. PGM-HT was also the composite that exhibited the greatest variations in F1. Such medium high amplitudes of variations might be the result of 3rd body particles hard enough not to be completely flattened in the roller/plate contact, and consequently large enough to be detected by the force measurement. All 3D representations of F1 as a function of cycle number and track length can be found in SM Figure S2.
Overall, PGM-HT performed the worst and exhibited the highest range of variation around the mean values. Multiple events of big particle generation happened in phase A for all tests, which may explain the high variations observed in phases B and C. Duroïd 5813 exhibited a rather stable (low variation) but sporadically noisy behavior. Instabilities were indeed observed with Duroïd 5813, mostly during Test1B-B, but only during a limited period of time and over a portion of the track length (Figure 3b and Figure S1). It might be that a run-in was needed to stabilize the interface and the transfer film on the roller to bring the F1 back to almost constant without significant fluctuations. AAC-C9 composite exhibited a very similar behavior to AAC-C1, it was also closer to Duroïd 5813 from F1 variations. Instabilities were almost inexistent with both AAC-C1 and AAC-C9. Except for Test2 A-F where big particle detachment was detected, variation of F1 around the mean value was lower than what was observed for AAC-C9, particularly when stresses increased at the roller/plate contact (phases B and C). Consequently, under vacuum, the composite AAC-C1 was the best candidate among the four composites studied here.

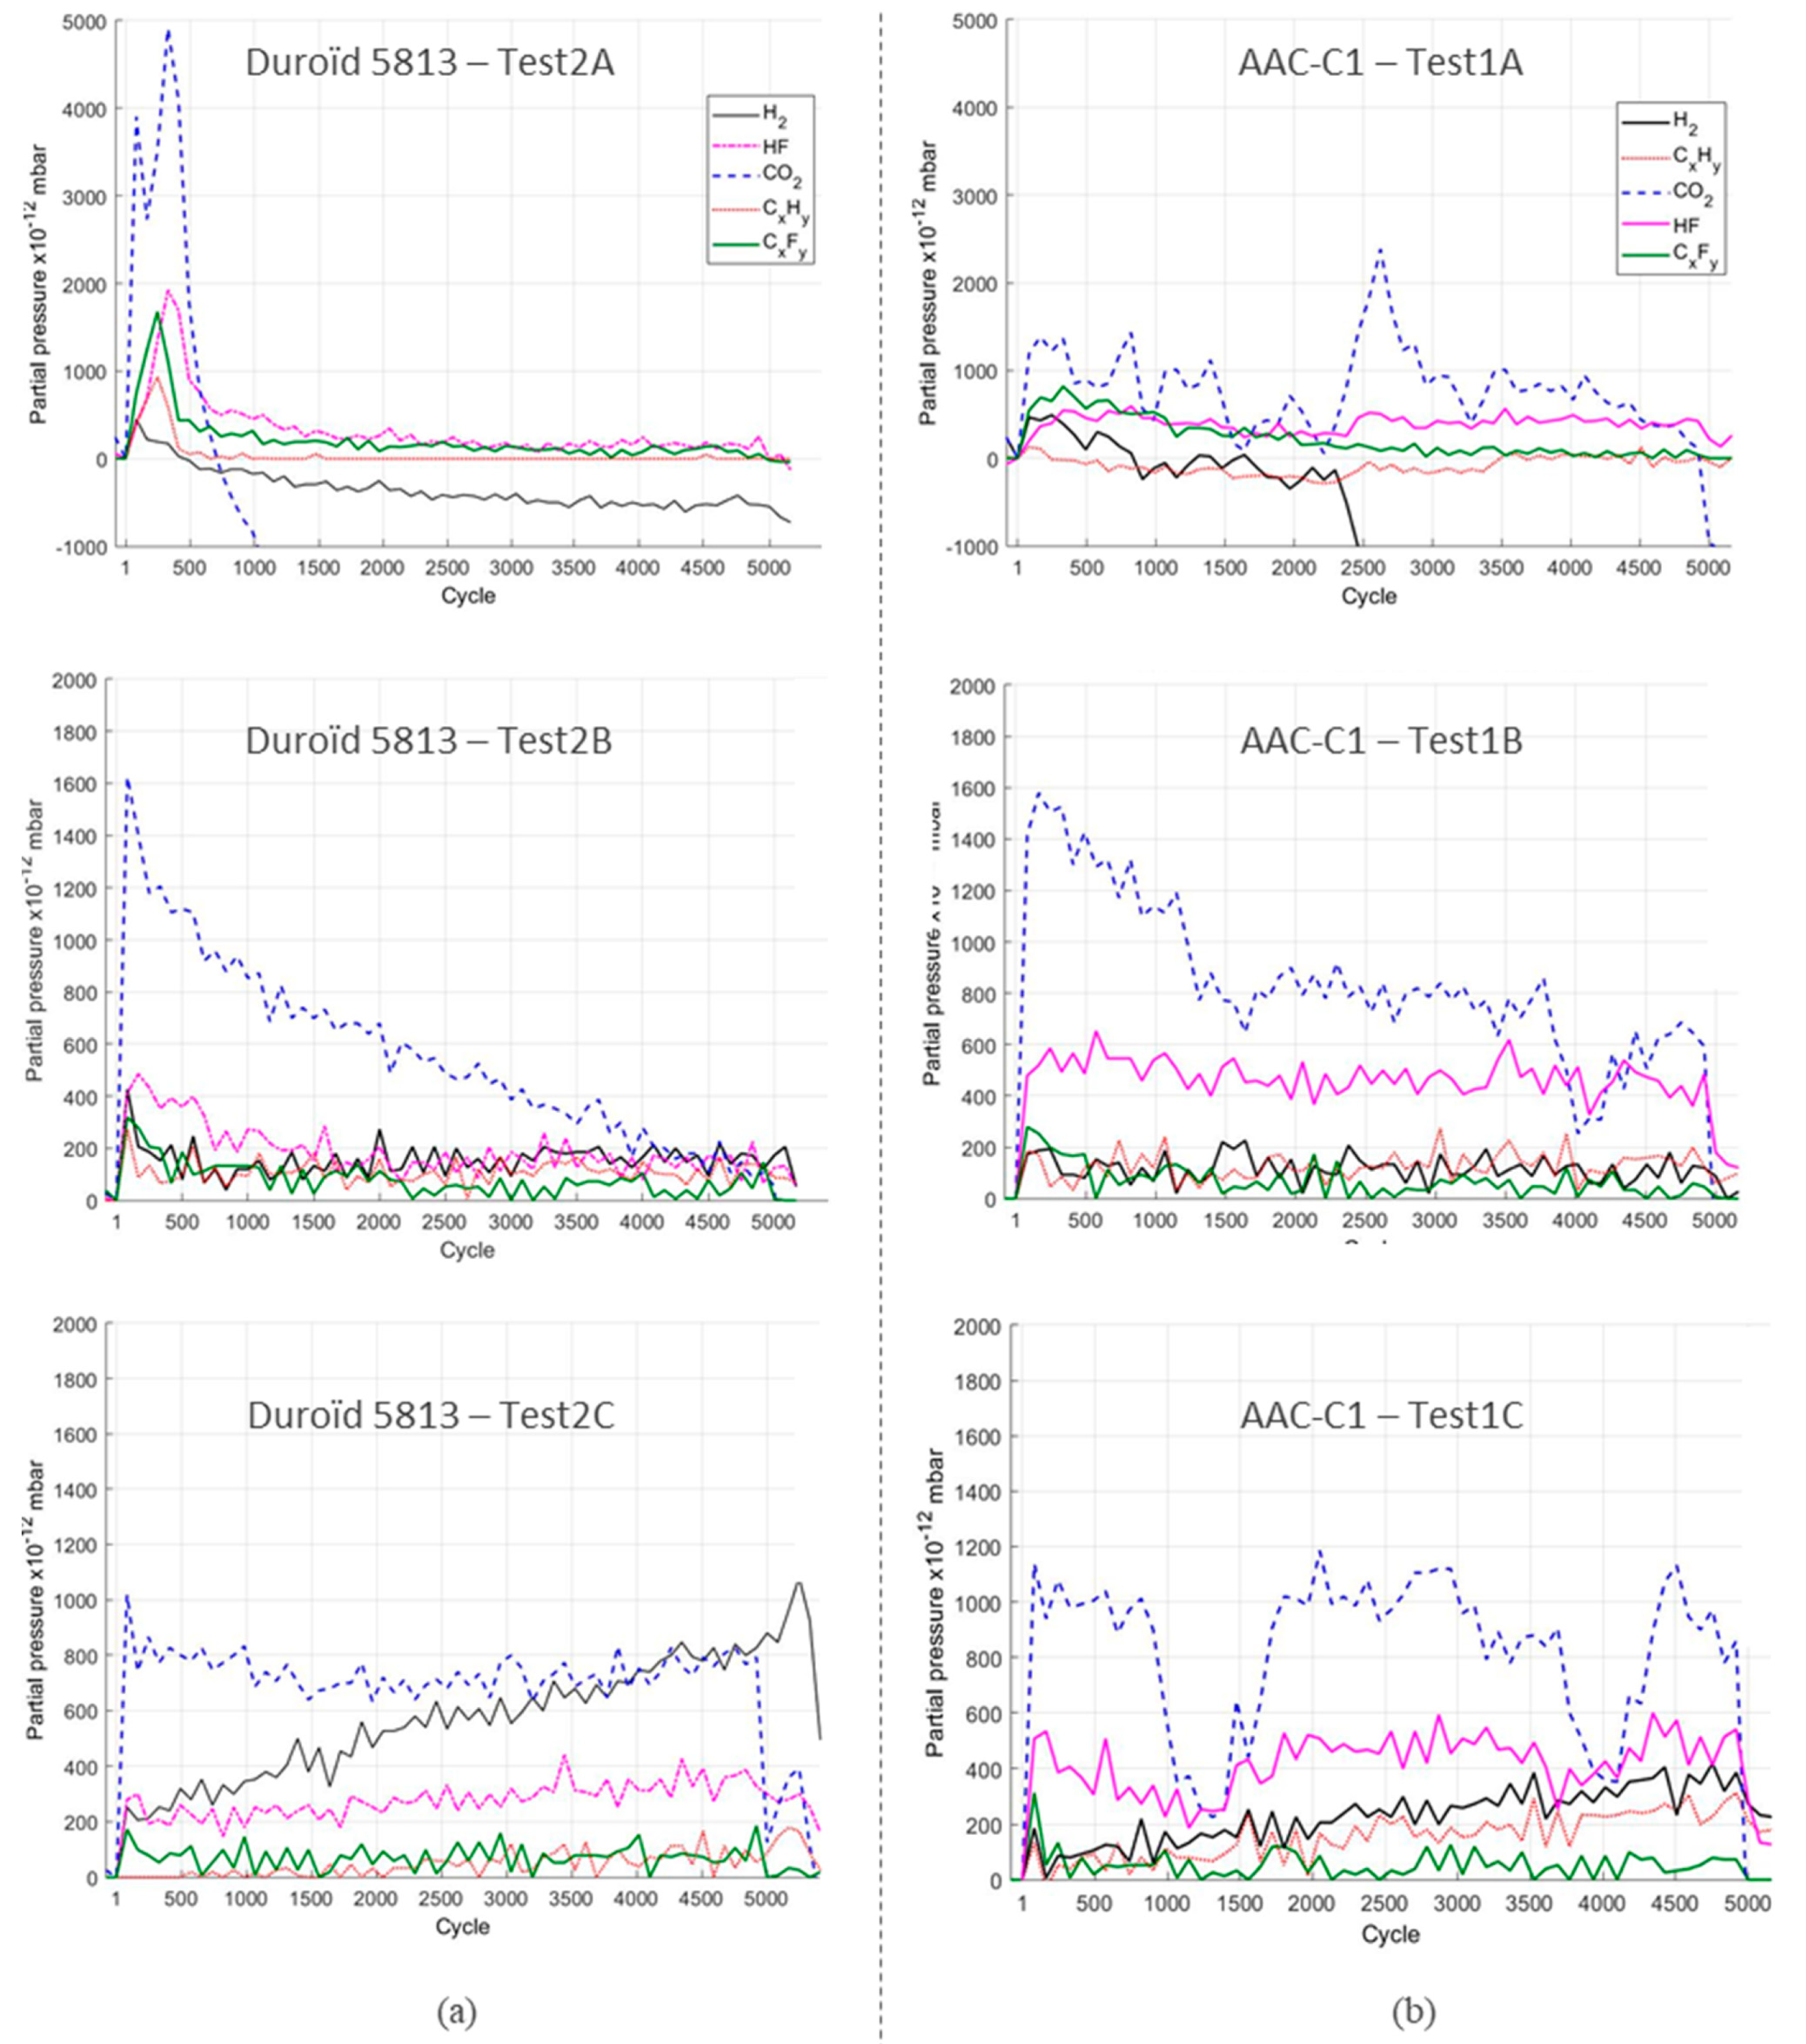
3.1.2. Mass Spectrometry

Figure 4 displays typical mass spectra obtained during the friction tests and it is mainly showing the degradation of the composite material. For the sake of clarity, and to highlight levels of the friction induced desorption, all offsets were removed. Focus is on F based molecules (HF, CxFy), which can be related to the PTFE matrix of the composite [48], on both hydrocarbons (CxHy) and CO2 that can be related to MoS2 [45,50], and on H2, which is a typical desorption product of stainless steel under tribological stress [46,50,51]. H2 desorption can also be related to MoS2 to a lower extent [50,52]. Water desorption is not shown because it is observed on all composite and without any specific trends in its variation, except for AAC-C1 in phase A. In the latter case, spectra including water are presented in SI.5, they show adsorption of water during friction in phase A. In all other cases, it appeared that the water trapped inside the composite material was being continuously desorbed during friction. Figure 4 displays mass spectra obtained with Duroïd 5813 and AAC-C1 composites, mass spectra from PGM-HT and AAC-C9 can be found in supplementary material SI.4.
Duroïd 5813 and PGM-HT show similar behavior. The desorption of F containing ions directly demonstrates that they are both consumed/solicited for a defined period of time during phases A and B. Note that during phase A, PGM-HT degradation, in terms of desorption, was barely detected (Figure S4). To the contrary, Duroïd was significantly stressed during the first 1000 cycles in phase A, and during the first 2000 cycles in phase B, as degradation was detected. A similar trend was observed for PGM-HT in phase B (Figure S4). However, for PGM-HT, there was a large peak of H2 desorption during the first cycles of phase B, which may be linked to the stainless steel undergoing significant stress [46,51]. That is a reasonable assumption as the absence of degradation of the composite in phase A may be related to ineffective transfer, and consequently related to the absence of lubrication of the roller/plate contact. It also supports well the observation of debris comprised of steel in ball bearings solely lubricated by PGM-HT [1]. In Phase C, both composites appeared to be degraded/stressed throughout the entire test duration. This might be related to the need of a higher quantity of transferred material to properly lubricate the roller/plate contact that is under the severe rolling + sliding condition.
Composites C1 and C9, on the other hand, demonstrated degradation/stress of the composite throughout the entire test duration for all phases A, B and C (Figure 4 and Figure S5). The partial pressure elevation detected in the chamber by the mass spectrometer was 2–3 times lower for C1 as compared to C9. However, the friction induced desorption of C1 was within the same range as compared to Duroïd 5813, while C9 show desorption levels close to that observed for PGM-HT. This is somewhat counter intuitive as C1 composition was closer to PGM-HT and C9 composition was closer to Duroïd. However, AAC-C1 adsorbed water during friction (Figure S5), which may contribute to increased friction stability due to the creation of carboxylate groups on PTFE to anchor the transfer film on the steel surface [16].
Regarding the variations of the CO2 desorption levels, it is interesting to note that they were following the trends of CxHy and CxFy for Duroïd, and for AAC-C1 but only in phase C. For AAC-C1 it indeed appeared that there were different sequences in desorption, such variation could be an image of phases of 3rd body production to create and/or refill the transfer films to ensure lubrication. Over the 3 phases, CO2 desorption dropped much faster with Duroïd than with AAC-C1. A similar observation can be made with AAC-C9 as compared to AAC-C1, while PGM-HT was closer to Duroïd 5813. It can consequently be assumed that MoS2 is continuously and constantly stressed during friction. CO2 is known to be a common contaminant of MoS2 [45,53], its desorption under friction can therefore be linked to MoS2 being stressed. If MoS2 is more stressed, it may consequently create a more lubricious transfer film, which in turn would explain why F1 was more stable with both AAC-C1 and AAC-C9 as compared to both Duroïd and PGM-HT (Figure 2), particularly in phases B and C. This is in line with Khedkar [11] that reports that MoS2 is very effective in improving wear resistance of composites in the presence of glass fibers as the strengthening phase. H2 desorption levels were approximately the same for all composite in phases A and B, except for PGM-HT that was exhibiting a peak during the first 200 cycles. In phase C, H2 was more desorbed with Duroïd than it was with AAC-C1, AAC-C9 and PGM-HT. Trends of H2 desorption was mostly following desorption trends of CxHy and CxFy, which might link it to the composite rather than to the stainless steels, except for PGM-HT at the beginning of phase B. However, another assumption could be that the steel surface needs to be activated to enhance the transfer of material to the roller and plate surfaces and allow lubricious layer build up.
At this stage, post-test analyses of the surfaces are required to state on the wear level of the material.

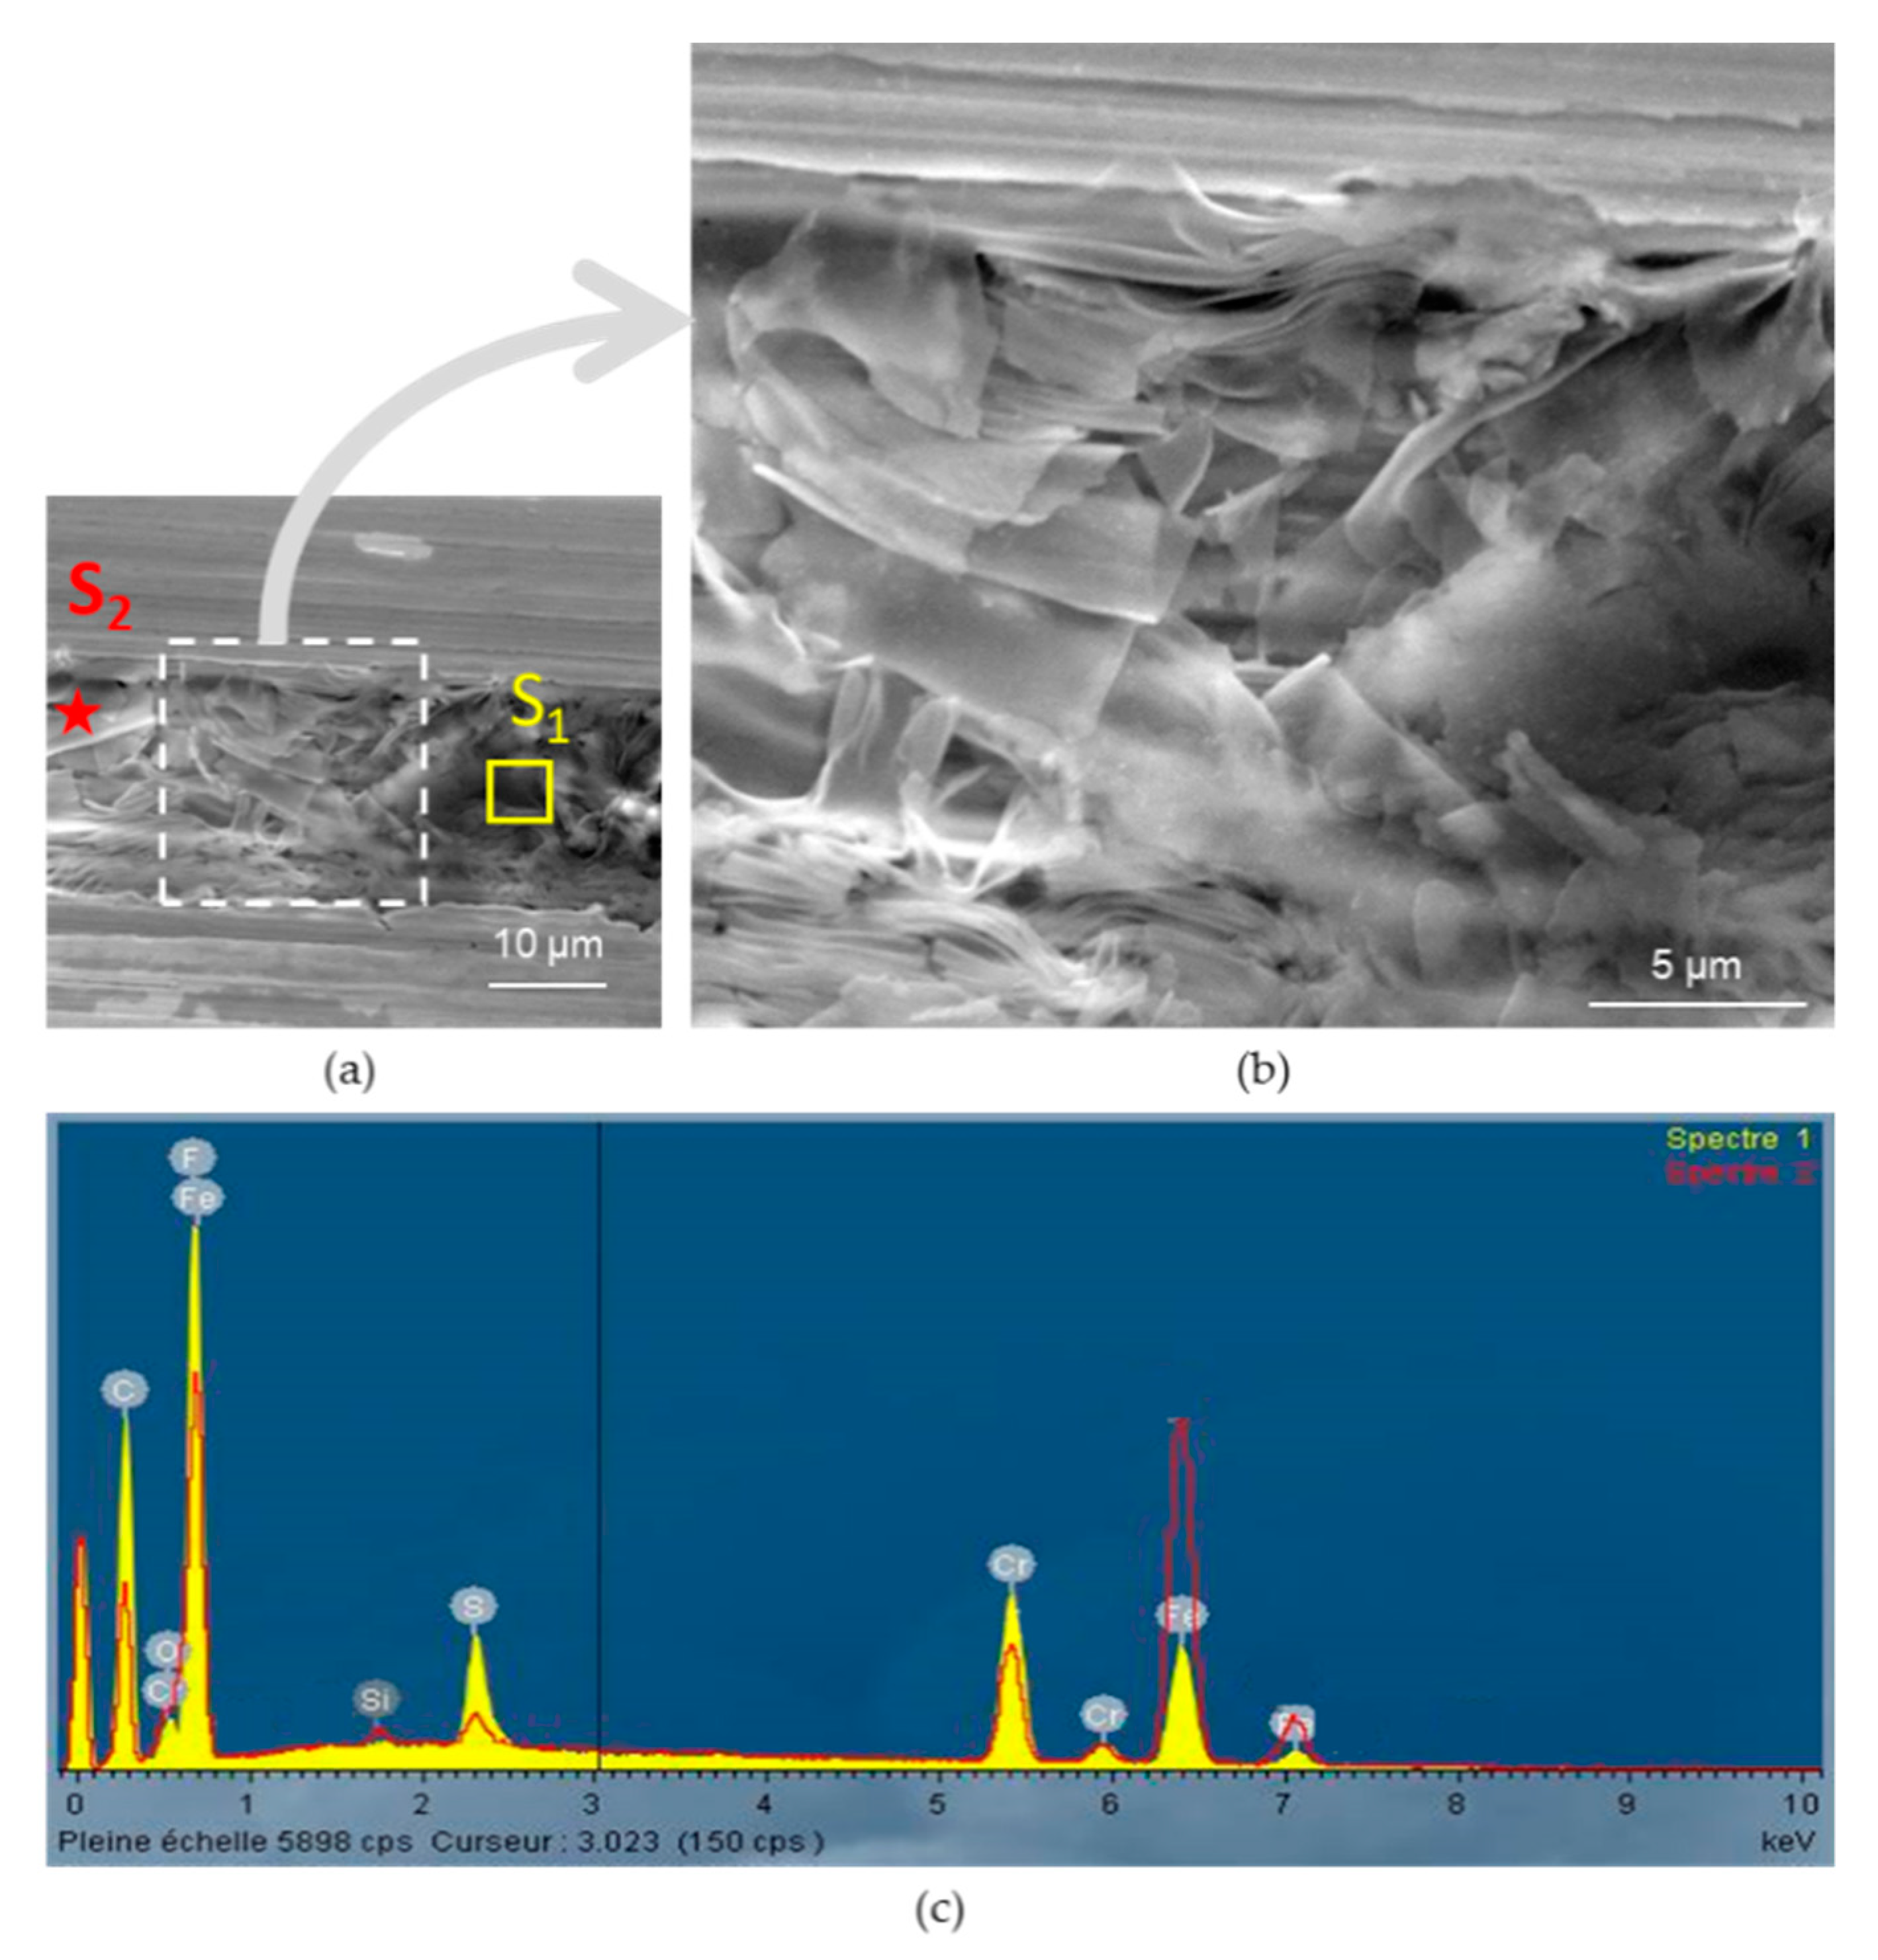
3.1.3. Surface Analysis

Table 5 and Table 6 show overall images of the contact ellipse on the self-lubricating pad and the raceway on the flat specimen after a complete test, i.e., after the 3 phases A, B and C. The roller is not shown because the track had the same appearance and morphology as the raceway on the plate specimen. Optical images of the roller surface after running phase A of the test are shown in Figure S4.
The two tables show that double transfer was effective with all materials. However, the qualitative evaluation of the transfer shows that:
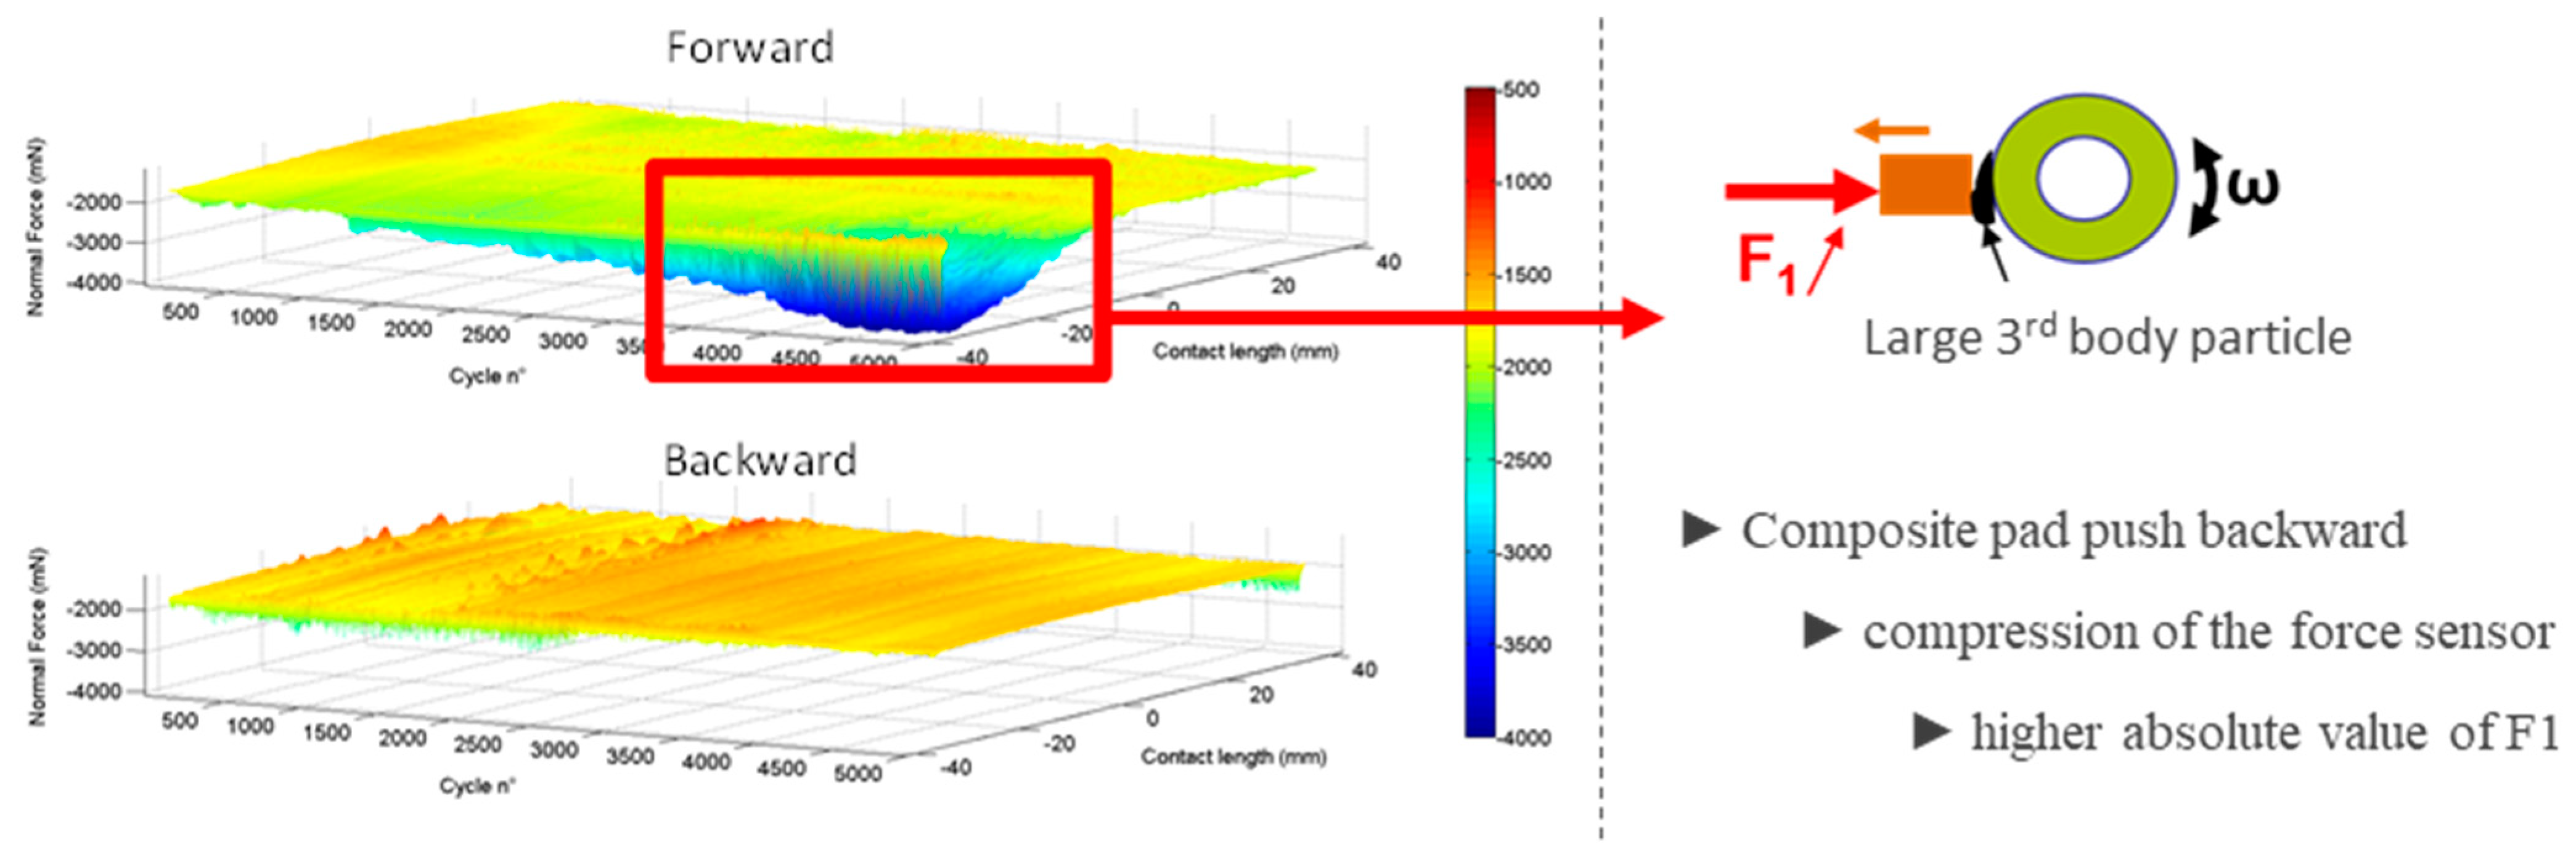
PGM-HT transferred very little in phase A but produced some large clusters (Figure S4). It transferred very moderately in phase B as well. In phase C, the transfer was active but remained relatively low while particle production remained at average. That agreed well with the MS measurements (Figure S5), which shows no desorption during phase A, desorption of PTFE and MoS2 related molecules during a short period of time in phase B, desorption of the same species during all phase C. Note that in phase B there was a peak of H2 prior to CxFy, HF and CO2 desorption. That could be related to stainless steel stress and activation of the surface to initiate transfer as hypothesized earlier. At the end of the three phases, PGM-HT transferred very little but produced a rather large number of particles, which were mainly ejected near the contact ellipse on the pad. The layer of transferred 3rd body on the roller and the plate is comprised of a very thin and almost transparent layer with relatively large but homogeneously distributed clusters on top of it. Production of large particles forming clusters agreed well with the variations observed in F1.
Duroïd, like PGM-HT, transferred very little in phase A (Figure S3). However, it produced few particles, at least of large size (i.e., detectable on F1 measurement). In phase B, the transfer and production of particles detectable in the F1 measurement remained low. It is in phase C that the transfer was significantly activated. That agreed well with MS measurements, in phase A desorption of PTFE and MoS2 related molecules is seen during a short period of time. Note that there was no peak of H2 desorption meaning that the surface needed less activation to initiate particle detachment and transfer from the composite to the steel surface. In phase B, desorption was higher and lasted longer, which is in line with better transfer, and desorption occurred during all phase C. At the end of the three phases, the transfer was correctly carried out, the transferred material, although forming “patches” (smaller than those formed with PGM-HT) and smoother areas, was homogeneously distributed. A few particles can be discerned around the racetrack and in and around the ellipse. The 3rd body patches demonstrated elevated parts (SEM images in Table 6) as if it sticks to the counter surface, which brings them up. A sticky 3rd body could explain instabilities observed on F1 (Figure S1 and Figure 2) via the stick-slip phenomenon. In total, the volume of particles appeared to be smaller than that produced by PGM-HT.
AAC-C1 transferred more than Duroïd in all phases and produced significantly fewer particles (much less ejection around the contact ellipse and the raceway). It is important to note that unlike Duroïd 5813, PGM-HT and AAC-C9, AAC-C1 transferred significantly in phase A, the transfer film on the roller was visible at naked eyes (Figure S4). Such observation an agreed well with the MS measurements that shows equal level desorption of PTFE and MoS2 related molecules over the entire durations of the three phases A, B and C. H2 was not significantly desorbed, which was in line with no specific damage of the steel, and that consequently confirmed the capability of the composite to transfer efficiently low volume of material and provide stable friction (cf. F1 variations in Figure S1 and Figure 2). The distribution of the material transferred to the raceway on the plane appeared homogeneous. No elevated parts of patches were observed, contrary to Duroïd 5813. That could mean lower stickiness, which was in line with the absence of instabilities in F1. That shows that even during smooth run-in, lubrication could be effective very quickly.
AAC-C9 appeared to have transferred more than C1 when the test included all phases A, B and C. It is interesting to note that C9 transferred very little in phase A, but it produced a larger volume of particles. This goes against what could be expected considering the high level of desorption as compared to AAC-C1, which transferred material in phase A. Consequently, high desorption did not univocally mean high transfer but only high degradation. In phase B, AAC-C9 transfers moderately, then it transferred more in phase C. Overall, the transfer capability of AAC-C9 was very similar to PGM-HT. Nonetheless, at the end of phase C, the transferred material seemed to have a homogeneous distribution on the raceway but was thicker than what was observed with the other three composites. The volume of particles ejected in the vicinity of the contact ellipse on the pad was close to what was observed with Duroïd 5813.
All four composites considered, a significant volume of 3rd body particles remained trapped in the contact ellipse where friction takes place. Fibers were playing an important role in the trapping, especially the large fibers comprising PGM-HT and AAC-C1 composites. Indeed, a layer of powdery 3rd body was surrounding the fiber and appeared to isolate it from the rest of the matrix. This clustering of particle around the fibers could be enhanced by the opening of the interface due to delamination resulting from friction [12], the corner edge phenomenon observed with biphasic composites materials [54]. Both may lead to breakage of the fibers and the creation of fiber-based particles. Here, fibers however appear to be strongly bounded to the matrix as fibers are cleaved or abraded during friction without completely removing them from the matrix. Glass fibers have indeed been shown to poorly resist abrasion during sliding of PTFE composites as reported by Khedkar [11]. The layer of particles surrounding the fibers in the contact ellipse may also act as a “buffer layer” to help accommodate stresses around the fibers and limit abrasion of the counter surface by the glass fibers. Nonetheless, PGM-HT exhibited a larger amount of fibers aligned parallel to the sliding direction. Such an alignment has been shown to be detrimental and increase wear [12], which may explain why PGM-HT had large particle creation and circulation inside the contact. AAC-C1 also exhibited some fibers aligning parallel to the sliding direction but the reaction with water might mitigate the risk of wear due to better PTFE and MoS2 transfer.
MoS2 particles initially incorporated in the composite also appeared to be strongly bounded to the matrix, as only few and small fragments were detected in the 3rd body. The 3rd body in the pad contact ellipse was mostly powdery and was a mixture of PTFE, MoS2 and fiber fragments (glass for PGM-HT, Duroïd 5813, C1 and mineral for C9). In some places in the contact ellipse, the 3rd body forms a compacted patch of material, but such patches appeared marginal as compared to the powdery one. However, those compacted patches exhibited morphology similar to the morphology of the transferred materials on the roller and the plate.
The 3rd body transferred to the plate mostly exhibited a compacted and ductile morphology (Table 6). Some particles (powdery 3rd body) could also be detected but only sporadically, big patches were frequent and around the edge of the friction track. Those patches were 3–6 times bigger than those encountered in the friction track. Small particles were seen in the transferred films. They were believed to be fiber and MoS2 small particles (cf. EDS analysis of 3rd body agglomerate in Figure S5). One specific feature was observed in the transferred film originating from AAC-C1, it is the stacking of a lamellar material (Figure 5). Small particles can be seen inside each lamella (Figure 5b), similarly to what was observed in all transferred films. The EDS analysis demonstrated that the specific layered material created from AAC-C1 was mostly comprised of PTFE and MoS2 particles as evidenced by C, F and S detection. Cr and Fe were fairly detected, this is the contribution of the steel substrate to the analysis because the transferred film was thin and the electrons went through it revealing the steel. Si small detection can be both due to the steel contribution and the presence of tiny fiber fragments. Those extremely small fragments may help strengthen the film and help reduce wear similarly to the Al2O3 nanoparticles from the PTFE/Al2O3 composites [6] and hard fillers [10]. Furthermore, SiO2 has been shown to be a beneficial filler to significantly decrease wear of PTFE, maintain low friction and help improve adhesion of the transfer film [9]. The presence of tiny fragments of glass fibers in the transfer film that is mostly comprised of PTFE may hence help explain the stability of friction and low wear observed.
It is important to note that 3rd body morphologies, such as those encountered on the pad, the roller and the plate, were observed on bearings lubricated only by a PGM-HT cages and that they have been operated in “real” conditions on a bearing test set up [36].
Finally, EDS analyses show that in some cases, traces of Fe iron can be found in the contact ellipse, especially with PGM-HT. This seems to be in agreement with other studies [1,20], which state that the size of the fibers can influence/increase the abrasion of the metal counter surface and consequently the detachment of material from the latter.

3.2. Tests in Air 50%RH Environment

For each material, only one test gathering the three phases A, B and C was carried out under air due to very limited number of samples. However, the stability of the friction all over the test duration makes it worth presenting them in this section. All 3D representations of F1 as a function of cycle number and track length can be found in supplementary information SI.2.

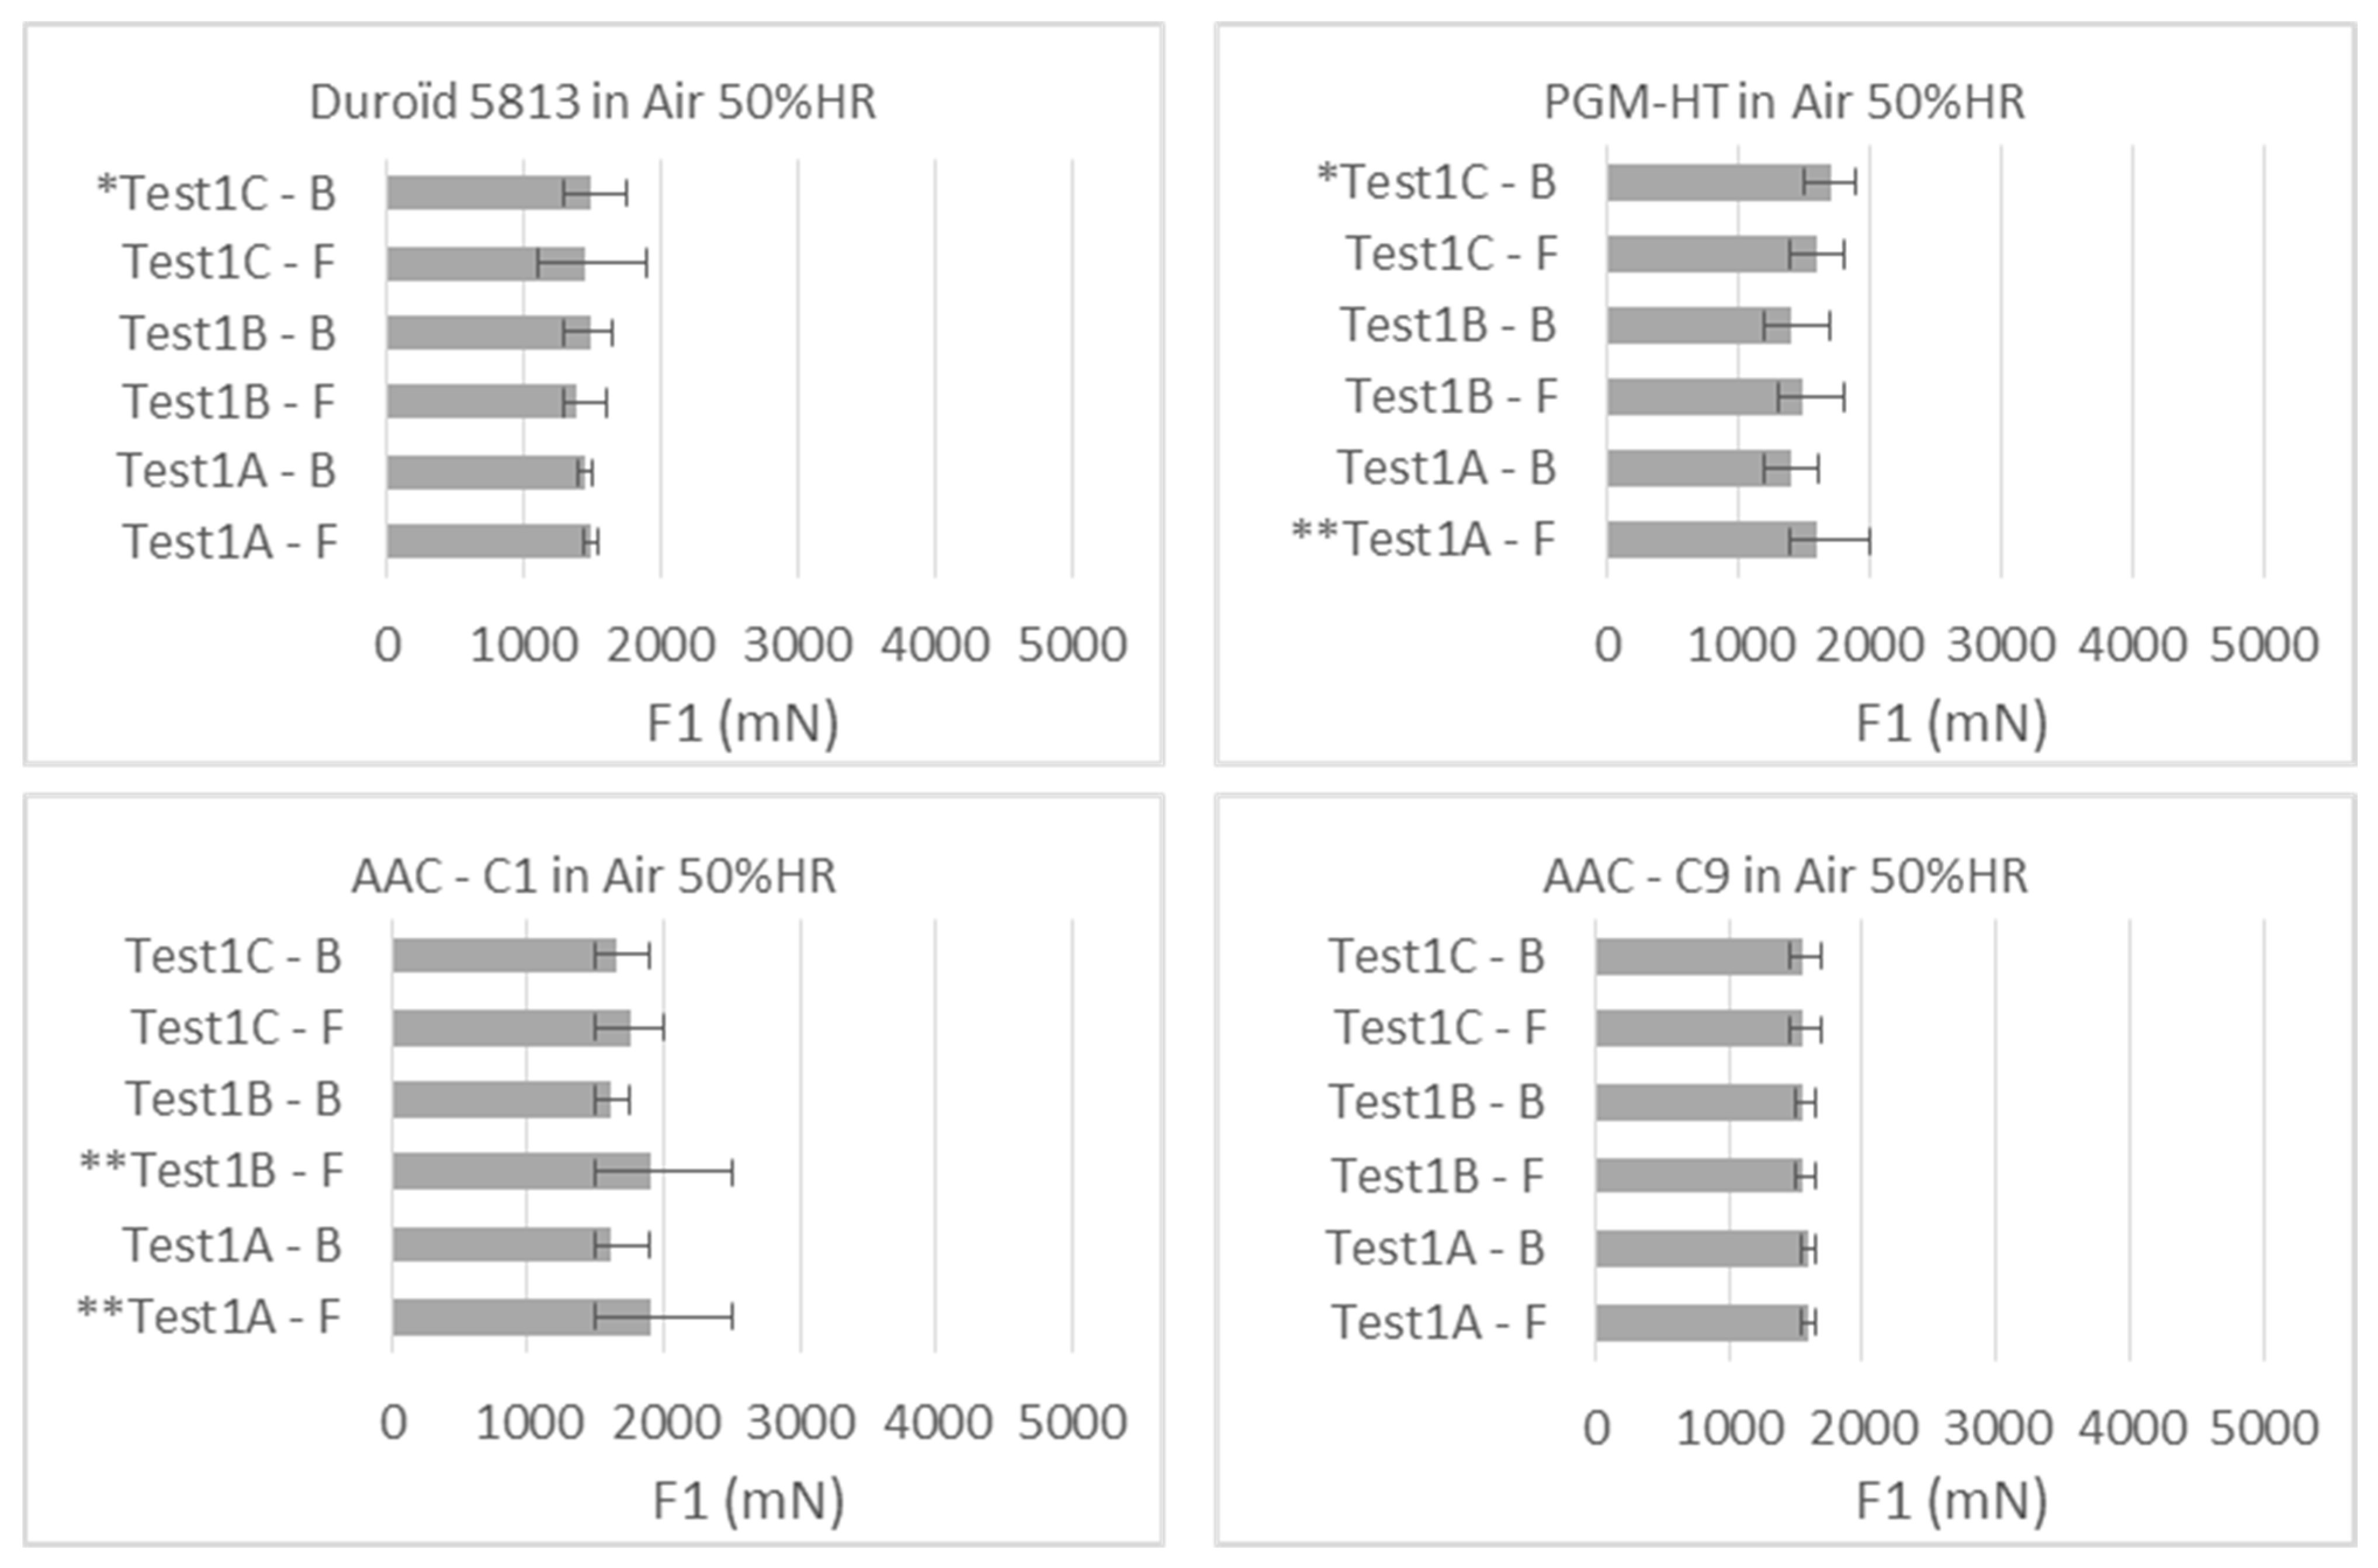
3.2.1. Friction Force

Contrary to the tests under UHV, the variations in F1 in air 50%RH (Figure 6) exhibit an extremely low amplitude of variation and the absence of noise, for all composites. PGMT-HT is much more stable than in the UHV environment. Nonetheless, it shows big particle circulation inside the contact in phase A, and little noise in phase C. Duroïd 5813 was also very stable and exhibited little noise in phase C similarly to PGM-HT. The AAC-C9 composite exhibited the most stable behavior out of the three composites. It shows very high stability and better tribological behavior (F1 force wise) than the Duroïd 5813, PGM-HT and AAC-C1 composites. The AAC-C1 composite exhibited variations that were similar to those observed for Duroïd 5813 and PGM-HT composites. Its behavior nonetheless stays close to what was observed in UHV in Figure 2.

3.2.2. Surface Analysis

The test consisted of three phases A, B and C. It is difficult to make a clear statement on the evolution of the transfer during each phase, although regular eye inspection of the samples was done through a side glass window while the tests were running. The qualitative evaluation of the transfer presented in the section was therefore done over the three phases.
Duroïd 5813 presents the “coarsest” transferred layer. It is made up of “patches/clusters” of material whose size was significantly larger than what was observed under UHV. Patches’ distribution nevertheless appeared relatively homogeneous. PGM-HT demonstrated similar morphologies with some big patches. For both PGM-HT and Duroïd 5813, the volume of particles ejected from the contact on the pad seemed less important than that observed under UHV. However, the ejected material appeared rather compact.
AAC-C1 presents a transferred layer with a granular aspect, less “smooth” than what was observed after the tests under UHV. The distribution and size of the patches appeared similar to what was observed after test in UHV. It was formed of “patches/clusters” of material whose size was smaller than that observed under air 50%RH with PGM-HT and Duroïd 5813. It is interesting to note that although it demonstrated the creation of large particle on F1 variations (Figure 6), no large patches were observed on the wear tracks as compared to the three other composites (Table 7). On the pad, the volume of particles ejected seemed close to that observed under UHV and seemed to be between that observed under air 50%RH for Duroïd 5813 and PGM-HT.
AAC-C9 was very similar to AAC-C1. Indeed, it presents a transferred layer with a granular aspect, less “smoothed” than that observed after the tests under UHV. It is formed of both large “patches/clusters” of material whose size was smaller than that observed under air with PGM-HT and Duroïd 5813, and of a small cluster evenly distributed across the friction track. The small cluster was much smaller than those created by AAC-C1, but the big ones were bigger than the biggest observed with AAC-C1. The contact ellipse was fairly homogeneous with a few particles ejected in the vicinity of the contact. However, the volume of particles ejected seemed less important than that observed under UHV and seemed to be close to that observed under air for Duroïd 5813. AAC-C9 was exhibiting the lowest volume of particles.
Overall, Table 7 shows that the transferred material observed on the plate was coarser than what was observed after test in UHV, for all composite materials. The distribution of material seemed nevertheless relatively homogeneous. The contact ellipse on the pad was fairly homogeneous with a few particles ejected in the vicinity of the contact. A smaller ejection distance of the particle away from the contact was not unique to the composites. It can be observed for MoS2 lubricated bearing tests between UHV and N2 [55]. Interestingly, PGM-HT, Duroïd 5813, and AAC-C9 exhibited a lower volume of ejected particles as compared to the UHV test. AAC-C9 was the composite exhibiting the lowest volume of particles. AAC-C1 did not exhibit significant changes in term of particle creation and ejection as compared to UHV tests. Krick [56] observed smaller debris created from PTFE material sliding in the humid environment as compared to the dry environment. AAC-C1 demonstrated the capability to adsorb residual water from the vacuum chamber. That may explain the absence of significant changes for AAC-C1, and the changes observed for the three other composites when tested in UHV and in humid air. The presence of water consequently appeared favorable to PGM-HT, Duroïd and AAC-C9, and most likely helps in anchoring the PTFE based transfer film [16]. However, dark field light microscopy images show some coloration of the 3rd body with brown-orange and yellowish colors, particularly visible with Duroïd 5813 and PGM-HT. This color could indicate molybdenum oxide formation. Humidity and molybdenum oxides are known to impede MoS2 to reduce friction and wear [53,57]. Better anchorage of PTFE may help mitigate the negative impact of MoS2 oxidation.
Therefore, the differences observed in F1 variations between tests conducted in UHV and in air for PGM-HT, Duroïd 5813 and AAC-C9 in general are most likely due to delamination [12] and big particles circulation inside the contact, and the lack of water that prevent sufficient adhesion of the transfer film to the substrate [16,56]. Nonetheless, the oxidation possibly related to MoS2 observed in air, particularly visible with Duroïd 5813 and PGM-HT, both of which exhibited noise in phase C, might impede the improved transfer when significant shear stress is applied to the transfer film. Noise could also be related to stick-slip and/or material stiffness that may not dampen the vibrations emanating from the contact.
Considering the quality and distribution of the transfer layer and the stability of F1, AAC-C9 appeared to be a good candidate and AAC-C1.

3.3. Adhesion Measurement

An adhesion measurement was first carried out on both the bulk and friction track (from double transfer experiments) of PGM-HT and AAC-C1 composites and thus under laboratory conditions (laboratory humid air and room temperature). For the most promising composite AAC-C1, a dedicated study was conducted to evaluate the influence of both environment and temperature on adhesion.

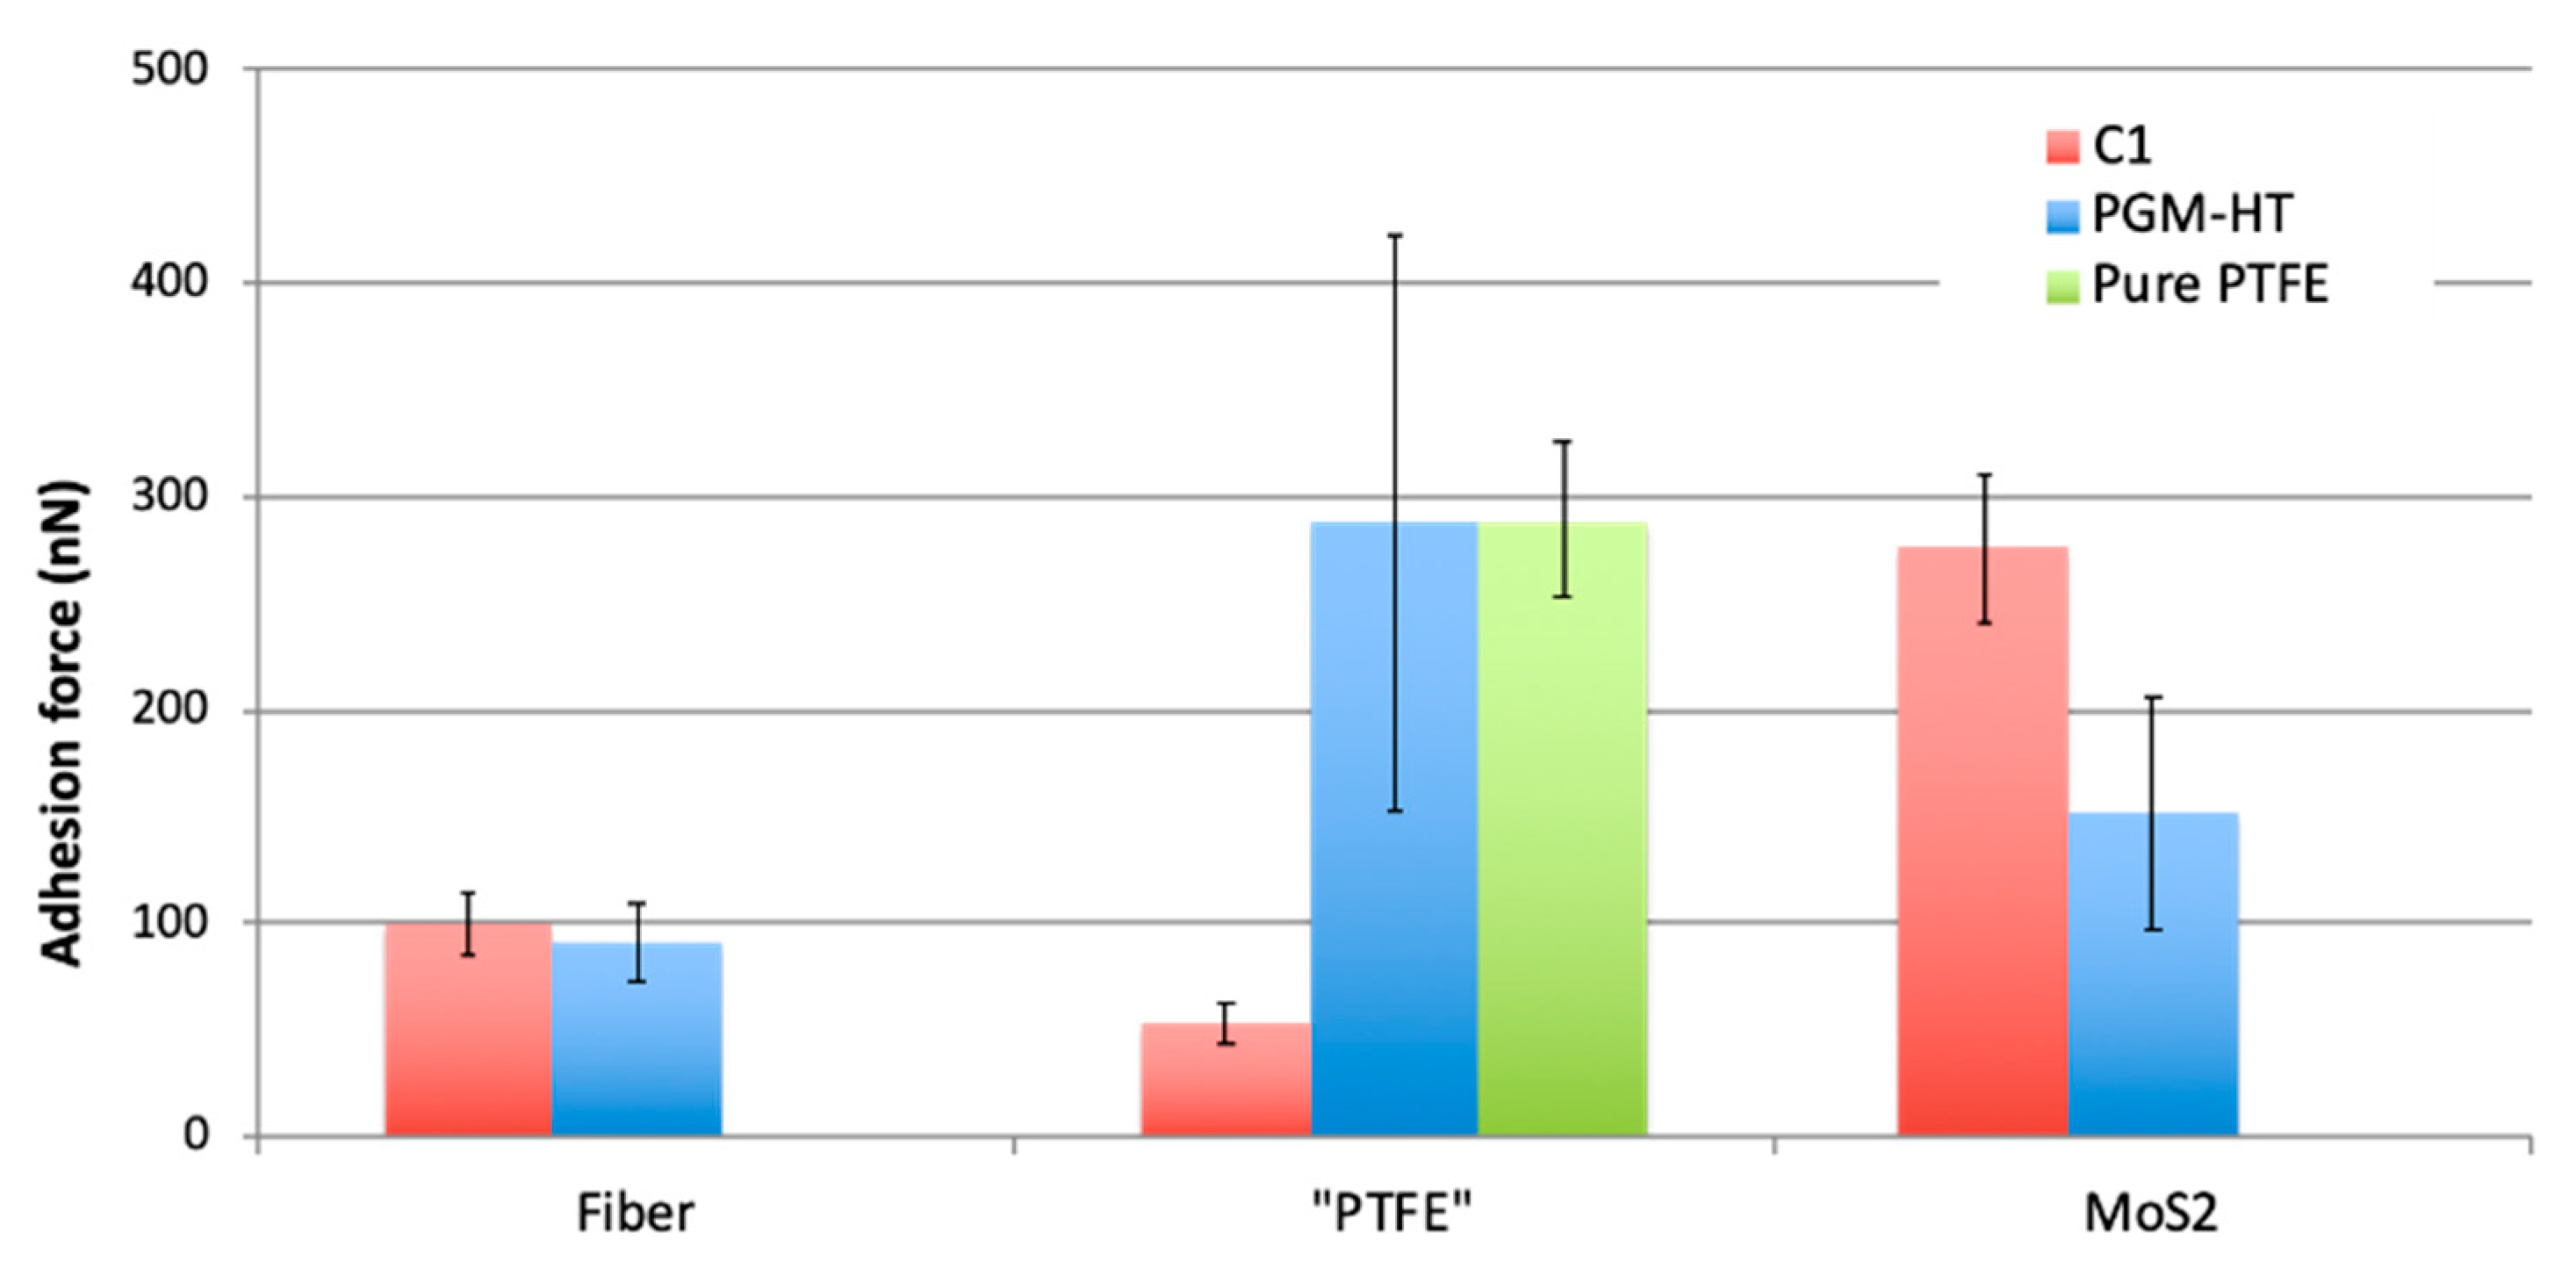
3.3.1. Adhesion between Bulk Composite Material and AISI440C Bead under Laboratory Conditions

Elementary components of both composites are easily distinguishable on Figure 7. Bright areas are MoS2 particles, light grey elliptical areas are fibers, and mixed bright/dark areas are the “PTFE” matrix, which surround MoS2 and fibers. Those optical observations, coupled with SEM using the Z-contrast mode when necessary, were used to help positioning the cantilever of the AFM and interpreting AFM images. Such an approach allowed to clearly associate adhesion measurement with the material of interest, i.e., MoS2, PTFE and fiber.
Adhesion forces measured on the different locations and for each normal load were gathered in Figure 8. Overall, the adhesion force measured was not significantly sensitive to the applied load except, for the PTFE of the PGM-HT whatever the area considered. If the reason for such an observation was the softness of PTFE (it was the softest material out of the three components of the composite) similar behavior would have been observed with AAC-C1, unless the PTFE stiffness was significantly different between both composites. Stress concentration at the contact between the bead and the PTFE might induce mechanically activated reaction with water and create bounding between the bead and the PTFE. Further investigation was needed to fully understand such behavior.
To compare the general trends of adhesion respectively to each component for both composites, the mean value and the standard deviation of the pull of force measured on each and every component were computed and displayed on Figure 9. Fibers from both composites exhibited similar adhesion to AISI440C steel with an adhesion force evaluated around 100 nN. Furthermore, the standard deviation shows that dispersion in the measurement was very low across both composites (Figure 8 and Figure 9). For MoS2 and PTFE, the opposite trend was observed. Even considering the large dispersion in the measure (high standard deviation), the adhesion force obtained on the PTFE from the PGM-HT remained between 3 and 8 times higher than for the one obtained with AAC-C1. Note that the mean value of PTFE adhesion from the PGM-HT was close to the one measured on a sample of pure PTFE from the reference sample. Within a smaller range, the opposite was highlighted for MoS2 where the mean adhesion force was nearly twice as higher for AAC- C1 than for PGM-HT.
Consequently, the adhesion between the components of the composites and the AISI440C steel was in favor of a greater transfer of MoS2 to the contacting surface for composite AAC-C1, which may participate to the creation of a more tribologically efficient 3rd body layer. The proportion of MoS2 within the 3rd body (presence evidenced in Figure 5, spectrum S1) could indeed be higher and help lubrication in UHV. To the contrary, in air, it may impede the friction, which would partly explain the highest variability of F1 in air as compared to UHV (Figure 2 and Figure 6).

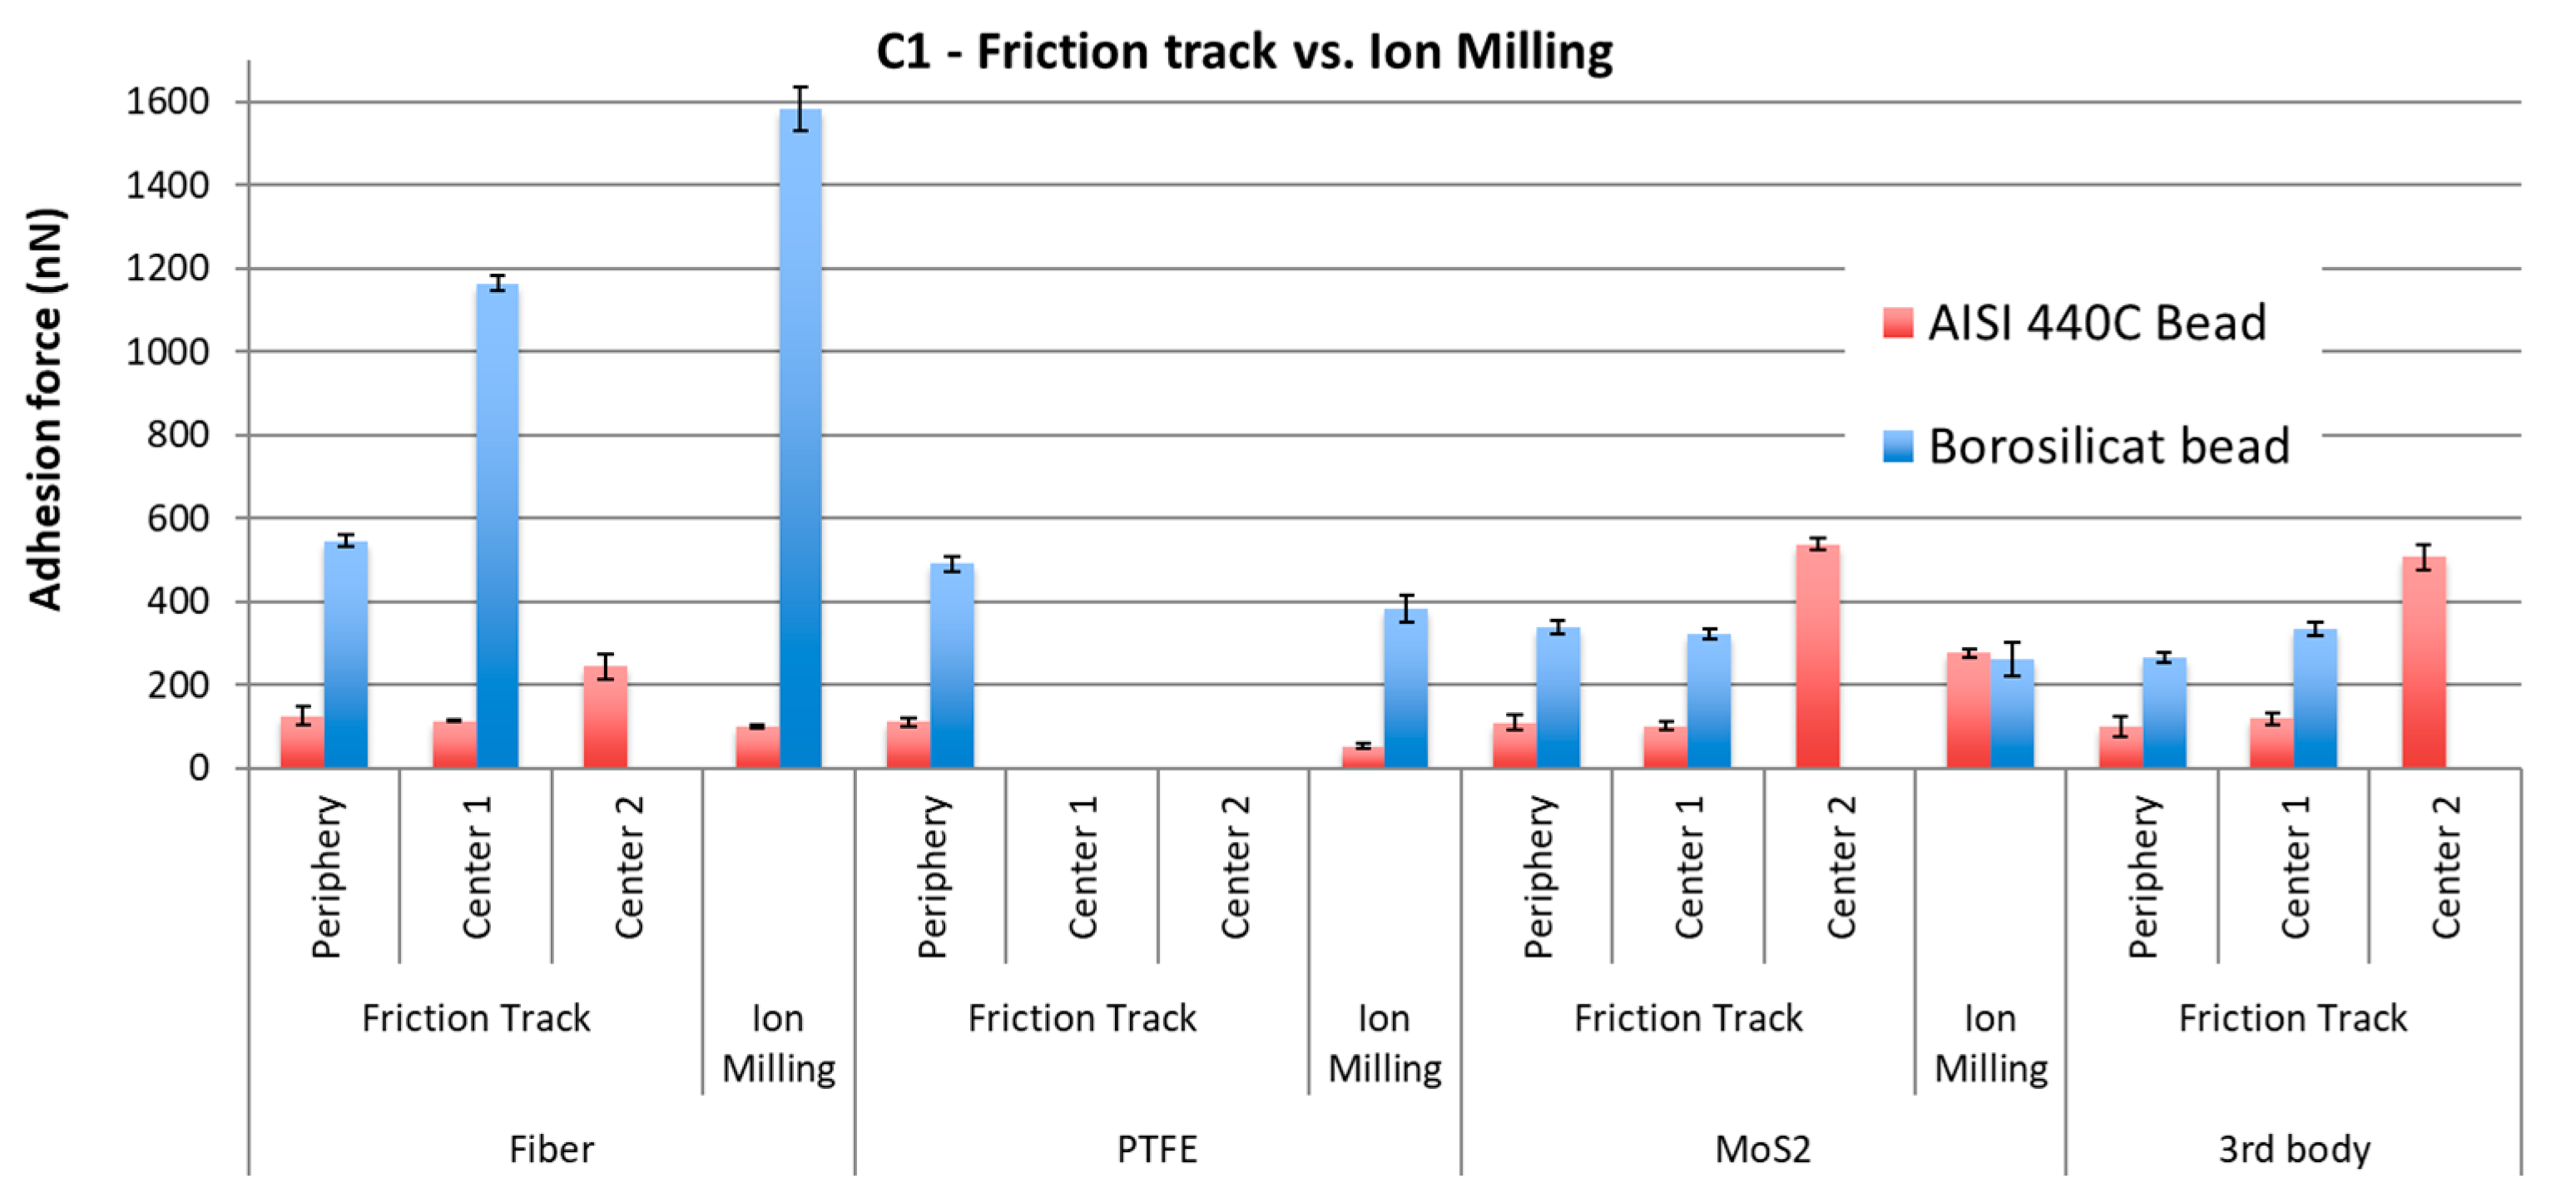
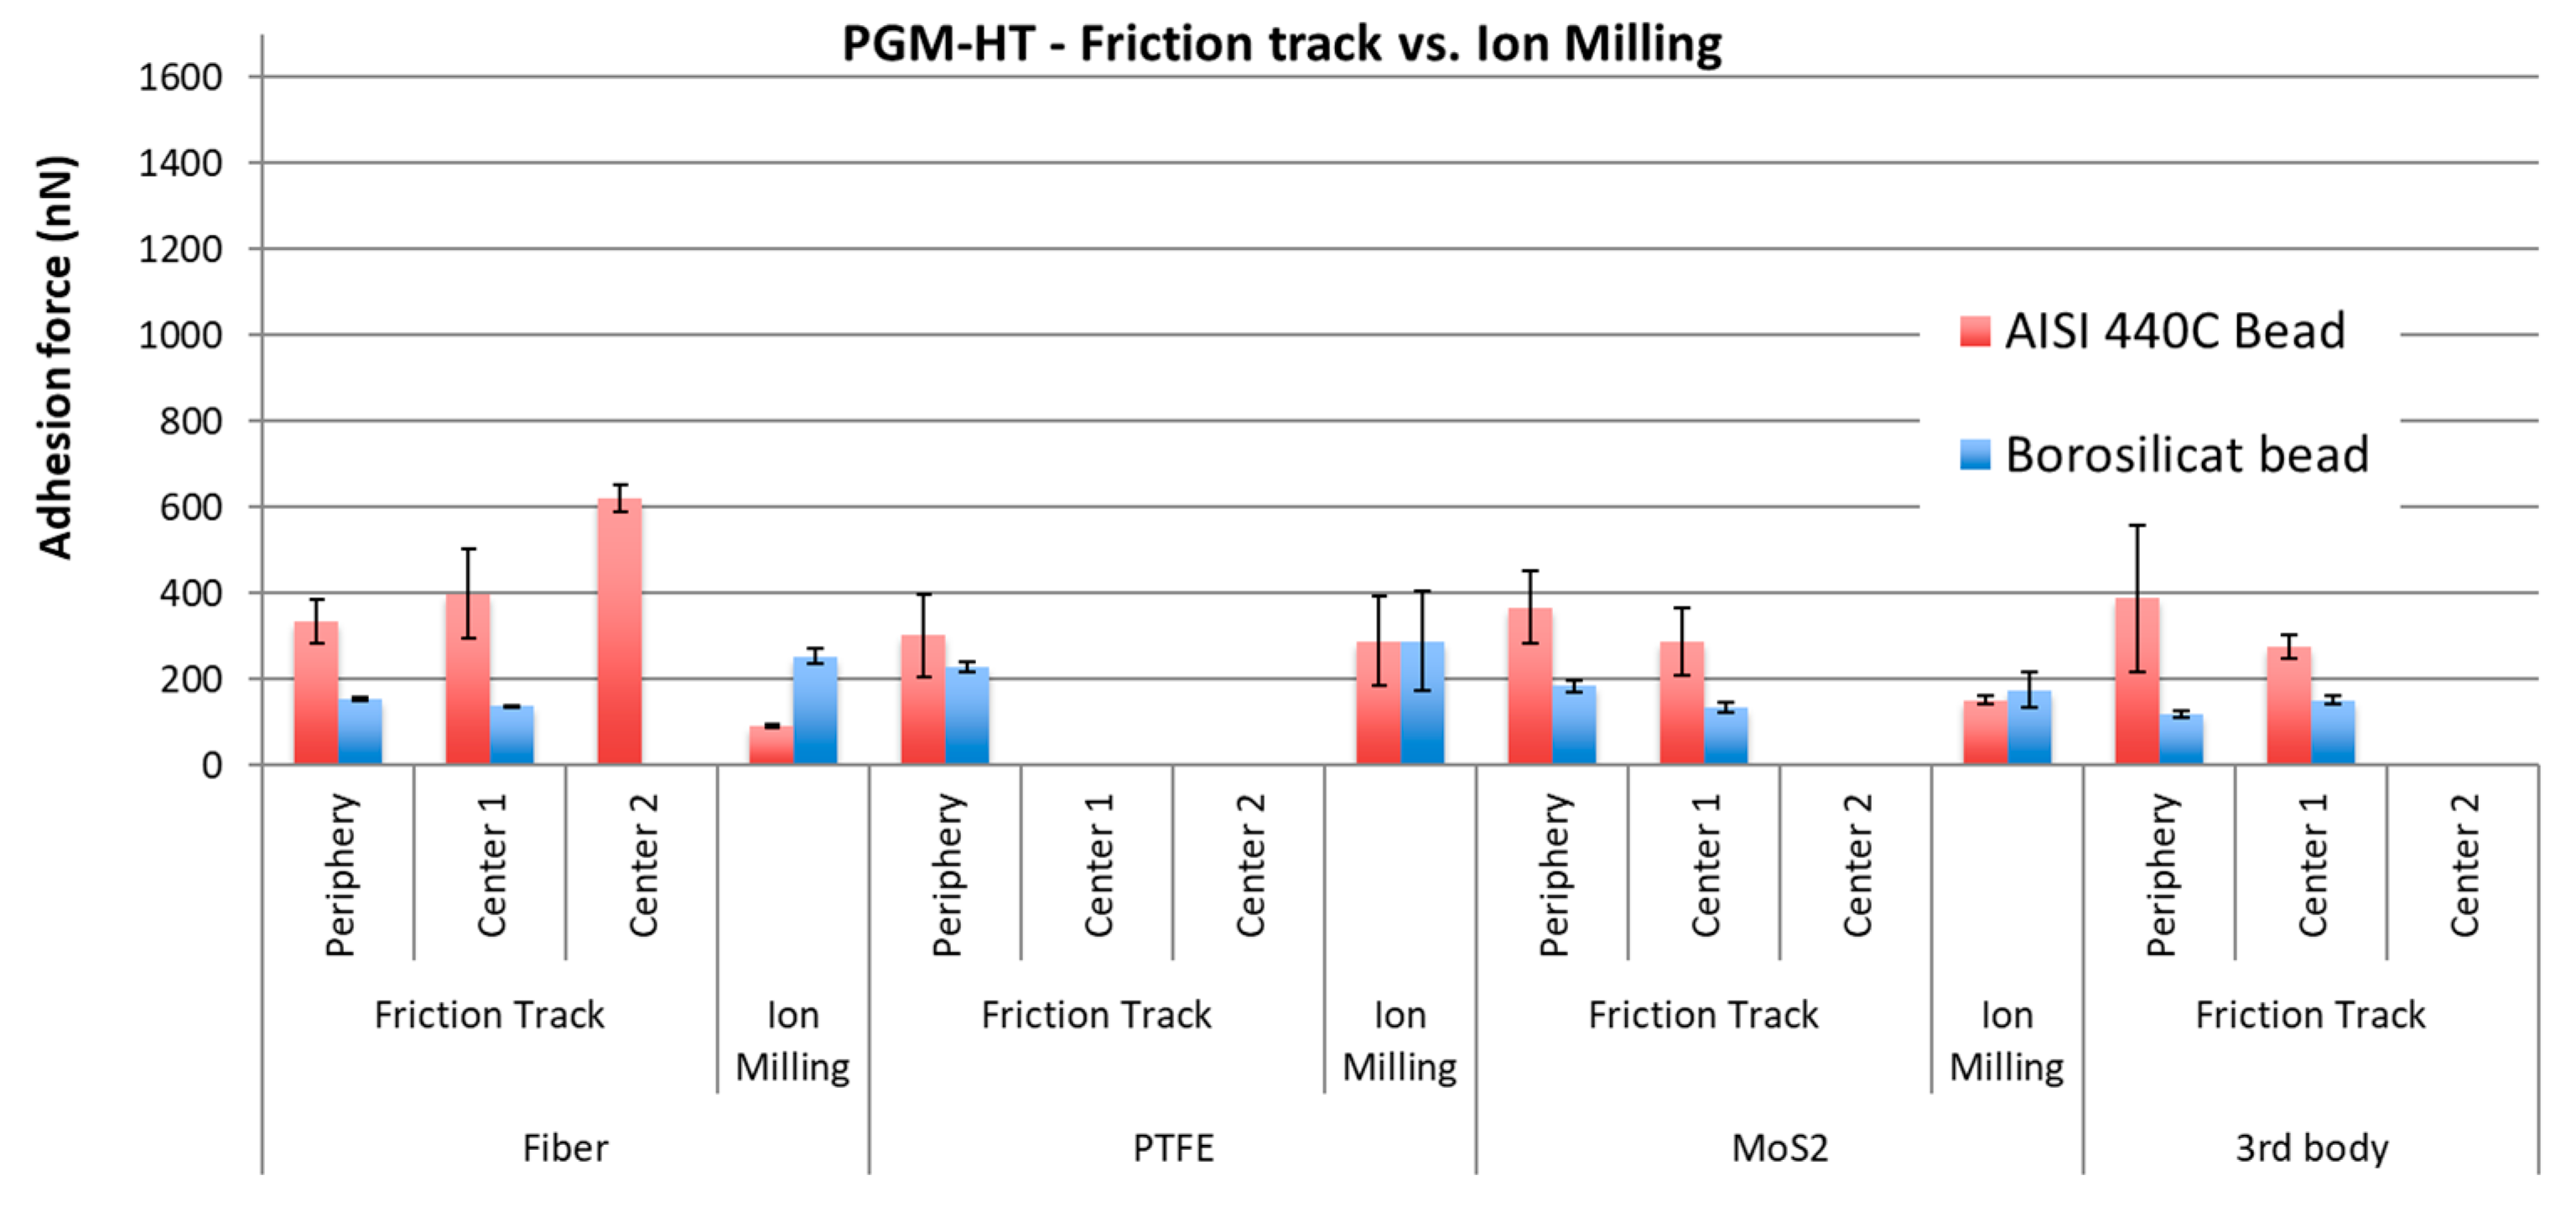
3.3.2. Adhesion between Friction Tracks of Composite Material and AISI440C Bead under Laboratory Conditions

Adhesion measurements have also been done on AAC-C1 and PGM-HT composites after complete (phases A, B and C) double transfer tests (see Section 2.2.1). Optical microscope images of the friction tracks of both composites are shown on Figure 10. Two distinct regions are defined: the contact periphery and the contact center. The latter corresponded to the contact ellipse. Their main difference to differentiate both regions lay in the higher presence of 3rd body particles at the periphery of the contact than at its center.
Multiple locations were selected in both regions on each composite. However, the bar graph representations could not help dissociating components. It was chosen to plot the adhesion force as a function of the indentation depth (Figure 11). Such representation gives access to a qualitative comparison of the stiffness of the materials where the adhesion force is measured. The higher the value of indentation depth is, the lower is the stiffness of the tested material. As MoS2 and fiber were stiffer than the PTFE, it could be expected that indentation depth helps dissociating materials and that clusters of adhesion forces will be identified. Note that the 3rd body is a mix of several materials and so its stiffness will be very variable; its composition cannot be reliably determined through the indentation depth measurement.
Finally, the surfaces studied were real friction surfaces. A thin layer of 3rd body transparent to light might exist on top of each material even if it looks like the pristine one (especially for fibers or MoS2 particles). A difference might consequently appear on both indentation depth and adhesion force measured in comparison to the one measured on IM prepared bulk material. To preserve the contact characteristics, the choice has been made not to ion mill or clean the friction surface.
Figure 11 shows two distinct distributions between the periphery and the center regions of the contact for both composites. Note that in the center of the contact, no PTFE data is presented. The size of the bead and the surface geometry made it impossible to be certain the PTFE region was confidently characterized.
For PGM-HT, the periphery of the contact was characterized by values of adhesion forces mostly in the range of 250–450 nN, which corresponded to the range of PTFE related adhesion forces in the bulk (Figure 9). Interestingly, the PTFE at the periphery exhibited pull-forces in the higher range of the forces measured on the bulk. Compared to the center region, the fiber and MoS2 materials appeared soft, the indentation depth went up to 10 nm and 6 nm respectively while it as in the range of 0–3 nm in the center. That is in line with PTFE coverage. The 3rd body demonstrated highly dispersed values of adhesion force with three clusters in the ranges from 200 to 250 nN, around 350 nN and 500 to 600 nN irrespective of the normal force applied for the measures. In the center, the fibers demonstrated two clusters of adhesion force values, one in the range 200–420 nN and one in the range 600–670 nN. All other materials were undistinguishable and were clustered in the 200–350 nN range, which was in the range of PTFE related adhesion forces in the bulk (Figure 9), but in a much narrower distribution as compared to the periphery. Indentation depth was also very low and below 5 nm. It seems that in the center of the contact the material was very stiff. A first set of data shows that MoS2, fibers and the 3rd body exhibited similar adhesion than PTFE from the bulk, which suggest the center of the contact is covered with thin PTFE based material. It also has exposed fibers that exhibited very high adhesion with AISI440C (600–700 nN). The stiff contact may be prone to enhanced propagation of instabilities with low transfer (thin PTFE layer) as depicted in previous sections. Moreover, if the relatively high stiffness of the PTFE (as suggested by the indentation depth) may contribute to excessive damage in the composite, particularly at the fiber/PTFE interface and promote the creation of large fiber based debris [58]. The stickiness of the fiber may further contribute to a higher risk of excessive wear of the steel counterpart or of the composite itself as it may increase the risk of delamination. This is particularly true when it is colinear to the sliding direction [12]. If the fiber is orthogonal to the contact, then it might benefit from the adhesion and be further eroded to create small particles that would enhance the transfer film properties [6,9,10]. In the case of PGM-HT, a large number of fibers are aligned colinear to the sliding direction. The matrix stiffness, the stickiness of fiber to steel and the fibers alignment, altogether explain the torque noise during the bearing test and steel particle presence inside and around the bearing [1], and the detection of Fe inside the contact ellipse on the pad (cf. Section 3.1.3).
For C1, the periphery of the contact is characterized by a narrower range of adhesion forces centered on lower values than for the PGM-HT. The range extended from 80 to 180 nN. Such a range was in good agreement with the values of adhesion forces measured on PTFE and fibers on the bulk material (Figure 8). MoS2 corresponding values were 3 times lower as compared to the bulk material, meaning potential coverage by PTFE. Indentation depth were in good agreement with the materials: PTFE exhibited high indentation depths that were increasing with increasing normal loads, fibers and MoS2 were exhibiting indentation depth in the range of 2–5 nm, which was in line with a much stiffer material. The 3rd body material lay between MoS2/fiber and PTFE clusters in term of indentation depth, which makes sense considering it is a mixture of all three components. The adhesion force value made it however closer to PTFE, which may indicate a high proportion of PTFE in it. This is in line with the matrix stiffness compared to PGM-HT, and with the large proportion of fibers orthogonal to the contact, both inducing lower risk of delamination and large fiber fragment detachment [12,58]. The center of the contact was very different and adhesion values could be divided into two groups. The first one was located around 100 nN adhesion force value. In that group fiber, MoS2 and 3rd body were found to exhibit very close adhesion values. MoS2 and the fiber were clustered with adhesion force values mostly around 90 nN for MoS2 and 110 nN for the fiber. The indentation depth associated to both of them as in the range from 3 to 9 nm, which was wider than in the periphery. The indentation depth was also increasing with increasing normal load. The 3rd body was mostly distributed along 110 nN adhesion force value but in the range of 5–40 nm indentation depth irrespective of the normal load. In the first group the material appeared soft and exhibited adhesion forces in the range representative of the fibers in the bulk material, which suggests the presence of a PTFE/fiber-based material in the locations where the measurements were made.
The second group is orthogonal to the first one with mostly low indentation depth (below 8 nN) but a wide range of adhesion forces from 200 to 580 nN. This group gathered the fiber, MoS2 and the 3rd body. However, it could be subdivided into two other subgroups. The first subgroup was solely comprised of fiber related data. Fibers were very stiff (indentation depth below 3 nm) but quite adhesive (200–300 nN adhesion force). Interestingly, in this subgroup, adhesion forces were mostly within the range representative of MoS2 with regards to the bulk material (Figure 9). The second subgroup was comprised of MoS2 and 3rd body related data, it was located in the high range of adhesion forces (450–550 nN). They dissociated the materials very well. MoS2 related data in the 510–550 nN range with indentation depth running from 2 to 5 nm, both adhesion forces and indentation depth increased with increasing normal load. The 3rd body related data was in the 480–550 nN adhesion force range and in the 3–8 nm indentation depth range. The latter was increasing with the normal load, while the former jumps from 480 to 550 nN when the normal load increased from 2 to 3 µN. MoS2 and the 3rd body related materials were stiff and might be covered with PTFE based material (indentation depth increasing with increasing normal load), however it must be very thin. It might also be a different compaction level as compared to the less adhesive first group, such as the observed materials on the plate (Figure 5 and Table 6). The high values of adhesion forces can be related to a possible activation of the surface by friction. In the second group fibers were more adhesive than on the bulk, which was similar to what was observed with PGM-HT. It is, however, interesting to note that the most adhesive materials were the 3rd body and the MoS2, and that the least adhesive was the fiber whose adhesion forces was in the range of MoS2 values measured on the bulk. That might mean that the activation of surfaces by friction induced high adhesion of MoS2, which transferred easily to get mixed with PTFE and fibers, and took over the adhesion behavior. That would consequently reduce further the risk of detachment of fiber. Which would be in line with the assumption made from F1 variations and surfaces analysis. In parallel, such high adhesion and transfers helps create a softer and less adhesive group of materials (1st group) that most likely contain PTFE considering the high indentation depth. Numbers of data points between the two groups is almost equal for all material. The lubrication might thus be equally supported by both groups with enhanced contribution of MoS2 in the creation of the 3rd body and therefore the lubrication. PTFE may help in the 3rd body creation to soften it and help in the damping. The small fragment of fiber (the composite hard filler) may help modulating this behavior by modulating the mechanical properties of the transfer film [6,10]. Finally, the observed reactivity of AAC-C1 towards water may help the 3rd body to adhere to still and to stabilize friction and wear [16].

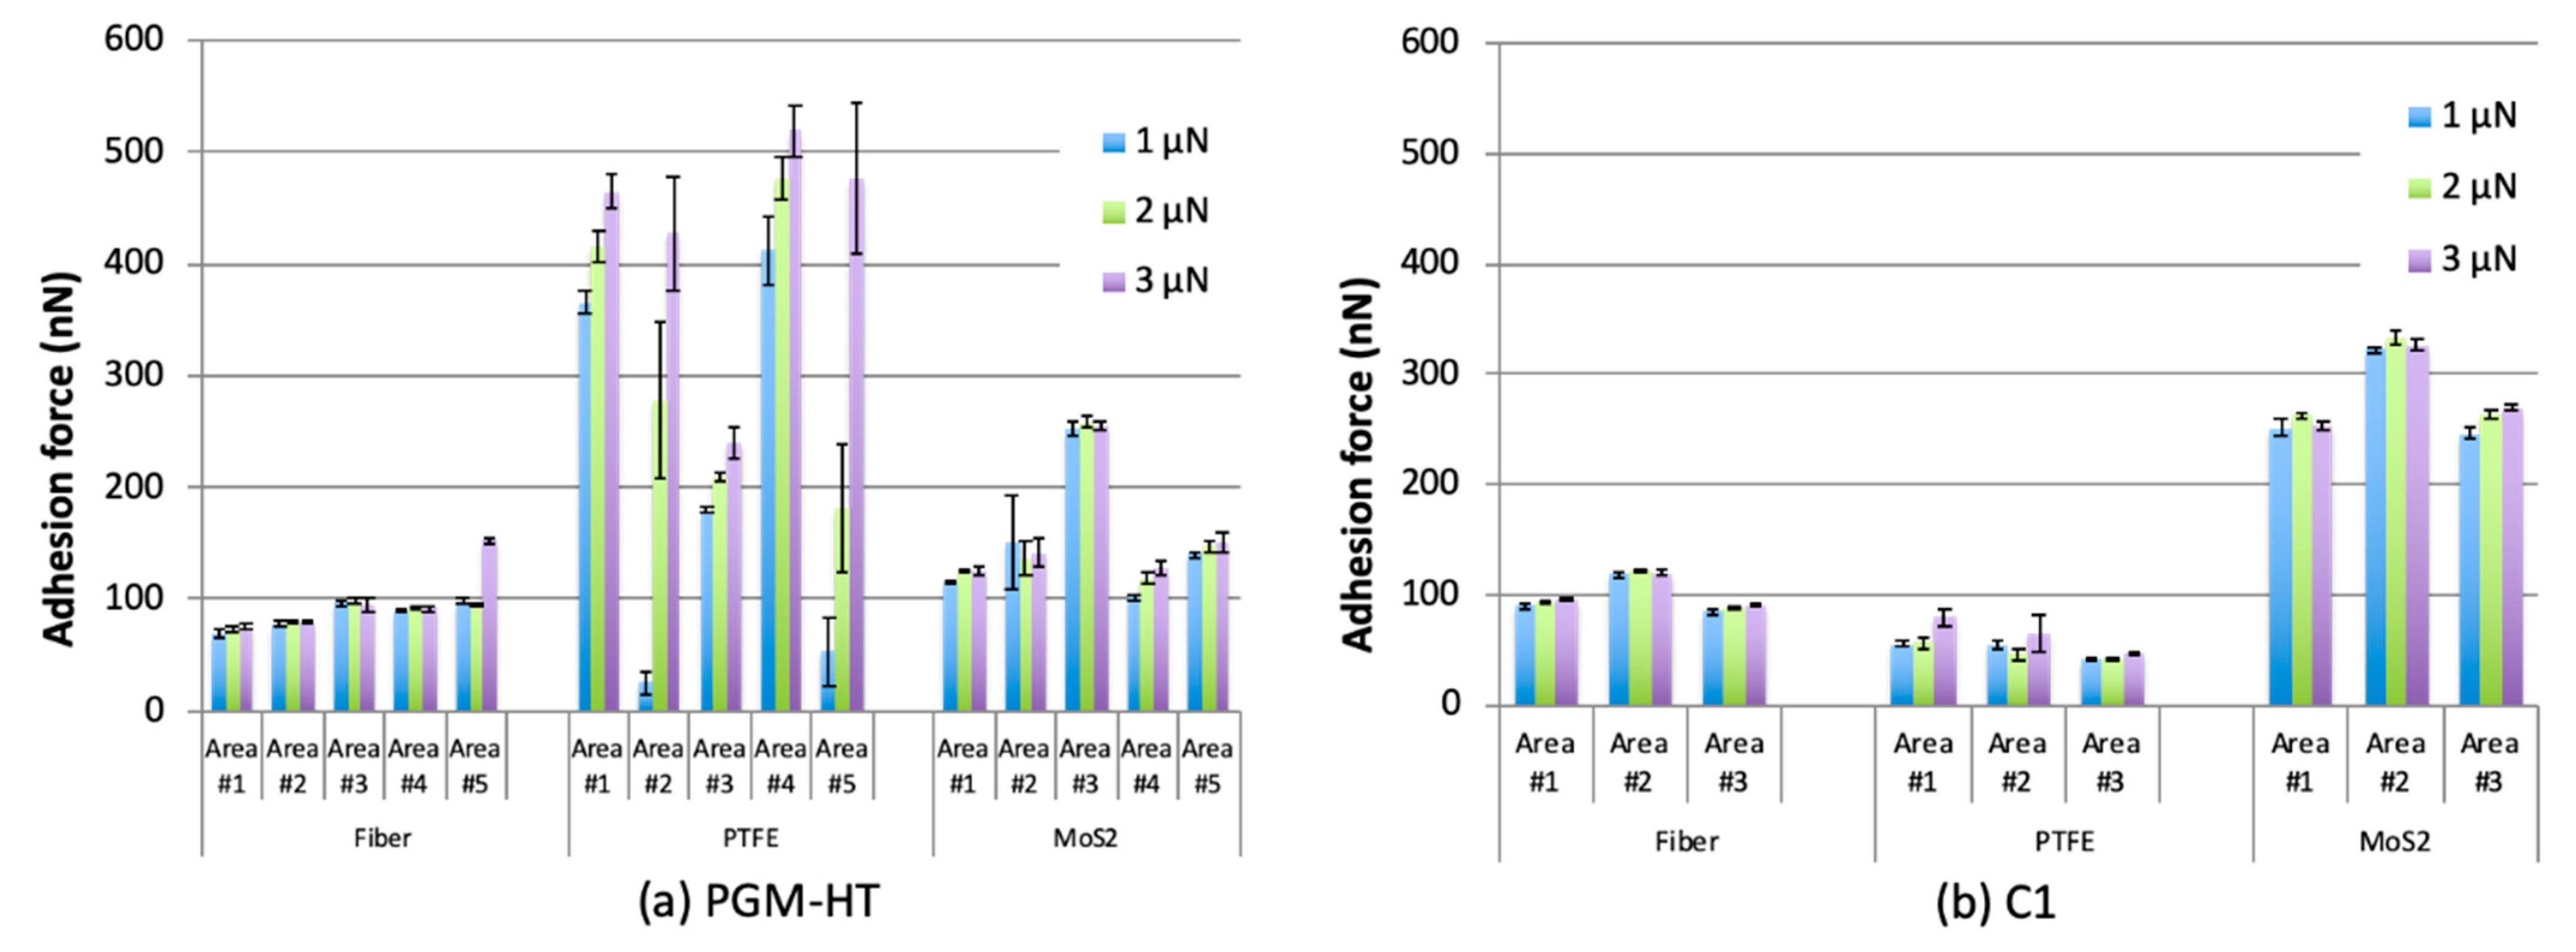
3.3.3. Adhesion of Borosilicate Beads with Composites Materials before and after Friction

Fibers are suggested to play an important role in the stability of friction and in the mechanical properties of the 3rd body layer. To get better insight into how significant the fiber’s contribution in the building up of 3rd body layer is, an adhesion measurement was conducted using a borosilicate bead. Fiber’s composition appeared very close to borosilicate. Figure 12 and Figure 13 show the comparisons between the adhesion forces measured with both borosilicate and AISI 440C steel beads on both the composites AAC1 and PGM-HT. Measures were performed on bulk material after ion milling, and after friction. Note that there were not two groups in the center of the contact contrary to what was observed with AISI440C steel. Center 1 and Center 2 corresponded to the groups identified in the center of the contact and displayed on Figure 11.
As expected, the borosilicate bead was very adhesive to the fiber for C1 and it was exhibiting very high adhesion as compared to the AISI 440C steel. Overall, the borosilicate was more adhesive to the PTFE, MoS2 and to the 3rd body, as compared to the AISI 440C steel. Adhesion to AISI 440C steel was higher than the adhesion to borosilicate for the MoS2 and 3rd body that were located in the center of the friction track. Although significantly lower than the adhesion to the borosilicate, the adhesion of fiber to AISI 440C steel was higher in Center 2 than in Center 1. Consequently, the fiber may (1) easily and quickly retain PTFE and MoS2 particles on its surface, which can form a protective lubricious layer to slide against the steel counterparts; and (2) be a binder to build a 3rd body layer with MoS2 and PTFE. Fibers will, however, not impede the transfer of MoS2 and 3rd body to the steel counterpart’s surface considering adhesion magnitudes can be very high in the center of the contact, which is the region where the materials are the most stressed. Such an observation was also consistent with the composition of the transferred layer that was shown (cf. Section 3.1.3) to be mostly comprised of PTFE and MoS2 based materials.
Surprisingly, the trend was completely the opposite with PGM-HT. The borosilicate was not exhibiting high adhesion with the fiber as compared to AISI 440C steel, except after IM. Magnitude of adhesion was not varying much across the materials after friction, and across both the periphery and the center of the contact. It is believed that a chemical component, maybe the sizing of the fiber, may be spread all over the contact by friction and induce a homogenization of the adhesion behavior towards borosilicate material and AISI 440C steel materials. The higher adhesion of the fiber to AISI 440C steel as compared to borosilicate for MoS2 and the 3rd body during friction could impede the creation of a protective lubricious layer on top of the fiber. Considering that the fibers were stiff and hard as compared to PTFE and the 3rd body, the contact fiber/AISI 440C (the roller) might impede the transfer via mechanical removal of the material during friction. This added to the stiff matrix, and to the alignment of fibers colinear to the sliding direction, would in turn explain (i) the lower capability of PGM-HT to transfer material to the sliding counterparts as compared to AAC-C1 and (ii) its higher propensity to generate large debris [12,58]. That overcomes the fact that the 3rd body created appeared more adhesive to steel than the 3rd body created from AAC-C1. There was a competition between the fibers and the other tribological materials towards steel that appeared to be in favor of the fiber, leading to lower performances. It would also confirm why PGM-HT was more subjected to instabilities, and maybe Duroïd 5813 too. Noise was indeed detected for PGM-HT (Test 3A-B) and Duroïd 5813 (Test1A-B, Test1B-B, Test3A-B) in UHV (Figure 2), and during tests Test1C-B for both PGM-HT and Duroïd 5813 in air (Figure 6). Adhesion might be exacerbated in UHV due to the absence of water molecules that might accumulate on the surfaces and react with PTFE to anchor it to the steel and form the lubricious transfer film [16]. That would also explain why instabilities are not significant in humid air. Further detailed analysis would be necessary to fully understand the mechanisms involved.
Fibers have been shown to play a role of mechanical trap to retain 3rd body particles within the contact (cf. Section 3.1.3). This section now demonstrated that it can play a role of “adhesion driven trap” to retain lubricious materials via their adhesion on the fiber’s surface. Good tribological performances are found to be able to have equilibrium between both actions.

4. Summary and Conclusions

Four different self-lubricating materials were studied and their capability to lubricate ball bearing for space applications was investigated. Among the four composites, one was commercially available and fabricated until the mid-1990s (Duroïd 5813), one was commercially available and recommended for such application (PGM-HT) and the remaining two were prototype composites (AAC-C1 and AAC-C9) to be investigated as potential alternative to PGM-HT. PGM-HT indeed demonstrated some limitations and new composites offering more stable performances are required. All composites were made of PTFE, MoS2 particles and glass (Duroïd 5813, PGM-HT and AAC-C1) or mineral (AAC-C9) fibers. A dedicated tribometer that allowed us to simulate the double transfer lubrication was designed for the study. The decision made to give degrees of freedom to the composite pad to allow it to move around its central position was decisive in reproducing transfer in terms of particle and layers morphologies. Such freedom is believed to reproduce the ball bearing cage’s freedom when it is in contact with the ball during ball bearing use.
A test in UHV and in the air environment allowed one to demonstrate that AAC-C1 could be a good candidate to replace both Duroïd 5813 and PGM-HT. The tribological behavior was indeed very good (good transfer capability and stable friction). The tribological tests coupled with mass spectrometry measurements, and AFM based adhesion measurements on the bulk materials on the worn and unworn materials showed that the reasons for AAC-C1 to perform the best as compared to PGM-HT were:
  • The mass spectrometry measurement showed that one important element was the continuous transfer of material all along the test, without damaging or wearing down too much of the composite. It can be compared to smooth erosion rather than abrasion.
  • The low delamination issue due to fiber orientation was mostly orthogonal to the contact. That led to stronger capabilities of smooth erosion of fiber, which in turn led to nanoparticle creation that was mixing to the transferred material. That helped to provide relevant mechanical properties to the transfer film to accommodate velocities, even during severe rolling plus sliding configuration.
  • Lower matrix stiffness, which reduced the risk of volume damage and the creation of large debris (mostly from fibers), and the possible occurrences of instabilities
  • Adsorption of residual water inside the vacuum chamber in phase A, gentle running, which is believed to lead to better transfer and anchorage of the transferred material. That can constitute a big advantage during the first months, even the first year of service in orbit for the satellite. Due to surface and material outgassing, the vacuum level is low and the atmosphere comprised of a high level of water [59,60,61]. Such water can help in producing the proper transfer film.
  • High adhesion of MoS2 towards steel and high adhesion of fiber towards PTFE, which were both in favor of the formation of lubricious transfer film. Fibers played an important role in trapping the particles inside the contact on the pad surface, to ultimately create a lubricious material. PGM-HT exhibited primarily high adhesion of fiber towards steel, which further increased the risk of the abrasion of both steel and the transferred material.
  • Equilibrium between internal cohesion of transferred material, and adhesion to counterparts must be satisfied
To further highlight the underlying physical, chemical and mechanical mechanisms driving the tribological behaviors of the composites, complementary investigations were needed. The effect of mineral fibers (AAC-C9 case) as compared to glass fibers could be of particular interest. The complementary investigations include further adhesion/cohesion investigation in different environments, the effect of the sizing of the fiber, and numerical modeling of the contacts to get insight of the tribological behavior by entering virtually inside the contact.

Supplementary Materials

The following are available online at https://0-www-mdpi-com.brum.beds.ac.uk/article/10.3390/lubricants9040038/s1, Figure S1: drawing of the roller specimen, Figure S2: Friction forces F1 during test in UHV, Figure S3: Friction force F1 during tests in Air 50%RH, Figure S4: Picture and optical microscope images of the roller after Phase A test in UHV, Figure S5: Mass Spectra of PGM-HT, AAC-C9 composites, and AAC-C1 with water variation, S6: Probable error sources of the experimental data.

Author Contributions

Test on the DTTB, analysis of the results and post-test characterization of the samples, G.C. under the supervision of A.S. and Y.M.; discussion of the tribological test results, G.C., A.S., A.M., Y.M.; adhesion test conceptualized by G.C., A.S., and T.F., performed by A.S., and G.C., analyzed by A.S., G.C., and T.F; composite designed and provided by A.M. Overall discussion of the results and preparation of the paper by all co-authors. All authors have read and agreed to the published version of the manuscript.

Funding

This research was funded by multiple funding from the French Space Agency CNES (R&T R-S10/TG-0002-009 and DCT/TV/MS—NT.2010- 10096), from the European Space Agency (“EU Self Lubricating materials SLPMC2”, Contract No. 4000115464/15/UK/ND), and from Canada (CFI and NSERC).

Institutional Review Board Statement

Not applicable.

Informed Consent Statement

Not applicable.

Data Availability Statement

Data is contained within the article and supplementary materials.

Acknowledgments

The authors are very grateful to Simo Pajovic (summer student at the University of Toronto) who helped in the gluing of AISI 440C beads on the cantilevers, to Matthew Daly (PhD student at the time in the Material Science and Engineering department of the University of Toronto) and Sal Boccia (Engineer at the OCCAM, University of Toronto) for their help in the ion milling of the composite samples), to Claude Godeau (Engineer at LaMCoS, Lyon) who helped conducting the experiments on Pedeba tribometer and to Yves Berthier (CNRS Research Director, LaMCoS, Lyon) for their contribution in the discussion of the results.

Conflicts of Interest

The authors declare no conflict of interest.

Appendix A

The significant events such as big particle detachment or circulation inside the contact (cf. Figure 2 and Figure A1) increases in motor torque noise (related to current consumption) were strongly amplified in the normal load F1. Consequently, F1 efficiently helped to discriminate the materials and link their behavior to both the composite and the 3rd body constitutions, morphology, etc. The motor’s current consumption was indeed approximately the same for each material, and the tangential force measured at the contact between the roller and the plate. For the latter, the measured force was extremely low (close to the lower limit of measuring range) due to the rolling motion. A significant increase implies high adhesion, if not cold-welding, at the contact, i.e., failure of lubrication.
Figure A1. Schematic of the effect of particle circulation on the F1 measure.
Lubricants 09 00038 g0a1

Appendix B

Figure A2. SEM image of the bulk of the Duroïd 5813 composite material. It shows the fibers gathered as bundles and clusters within the Duroïd 5318.
Lubricants 09 00038 g0a2

References

  1. Sicre, J.; Michel, Y.; Videira, E.; Nicollet, L.; Baud, D. PGM-HT as RT/Duroïd 5813 replacement? Lifetime results on STD earth scanning sensor and polder bearing shaft. In Proceedings of the 13th European Space Mechanisms and Tribology Symposium—ESMATS 2009’, Vienna, Austria, 23–25 September 2009. [Google Scholar]
  2. Roberts, E.W. Space Tribology Handbook, 5th ed.; European Space Tribology Laboratory: Warrington, UK, 2013. [Google Scholar]
  3. Lince, J.R. Effective Application of Solid Lubricants in Space Mechanims. Lubricants 2020, 8, 74. [Google Scholar] [CrossRef]
  4. Buttery, M.; Wardzinski, B.; Houton, K.; House, W.; Park, B. Modern self-lubricating composites for space applications: PGM-HT and Sintimid 15M. In Proceedings of the 14th European Space Mechanisms & Tribology Symposium—ESMATS 2011, Constance, Germany, 28–30 September 2011; pp. 87–94. [Google Scholar]
  5. Theiler, G.; Gradt, T. Friction and wear of PEEK composites in vacuum environment. Wear 2010, 269, 278–284. [Google Scholar] [CrossRef]
  6. Krick, B.A.; Pitenis, A.A.; Harris, K.L.; Junk, C.P.; Sawyer, W.G.; Brown, S.C.; Rosenfeld, H.D.; Kasprzak, D.J.; Johnson, R.S.; Chan, C.D.; et al. Ultralow wear fluoropolymer composites: Nanoscale functionality from microscale fillers. Tribol. Int. 2016, 95, 245–255. [Google Scholar] [CrossRef]
  7. Khare, H.S.; Moore, A.C.; Haidar, D.R.; Gong, L.; Ye, J.; Rabolt, J.F.; Burris, D.L. Interrelated Effects of Temperature and Environment on Wear and Tribochemistry of an Ultralow Wear PTFE Composite. J. Phys. Chem. C 2015, 119, 16518–16527. [Google Scholar] [CrossRef]
  8. Johansson, P.; Marklund, P.; Björling, M.; Shi, Y. Effect of humidity and counterface material on the friction and wear of carbon fiber reinforced PTFE composites. Tribol. Int. 2021, 157, 106869. [Google Scholar] [CrossRef]
  9. Bahadur, S.; Tabor, D. The wear of filled polytetrafluoroethylene. Wear 1984, 98, 1–13. [Google Scholar] [CrossRef]
  10. Deli, G.; Qunji, X.; Hongli, W. Physical models of adhesive wear of polytetrafluoroethylene and its composites. Wear 1991, 147, 9–24. [Google Scholar] [CrossRef]
  11. Khedkar, J.; Negulescu, I.; Meletis, E.I. Sliding wear behavior of PTFE composites. Wear 2002, 252, 361–369. [Google Scholar] [CrossRef]
  12. Nak-Ho, S.; Suh, N.P. Effect of fiber orientation on friction and wear of fiber reinforced polymeric composites. Wear 1979, 53, 129–141. [Google Scholar] [CrossRef]
  13. Qu, S.; Lo, K.H.; Wang, S.S. Effect of Transfer Films on Friction of PTFE/PEEK Composite. J. Tribol. 2021, 143, 1–11. [Google Scholar] [CrossRef]
  14. Cui, W.; Raza, K.; Zhao, Z.; Yu, C.; Tao, L.; Zhao, W.; Chen, W.; Peng, S.; Xu, Q.; Ma, L.; et al. Role of transfer film formation on the tribological properties of polymeric composite materials and spherical plain bearing at low temperatures. Tribol. Int. 2020, 152, 106569. [Google Scholar] [CrossRef]
  15. McCook, N.L.; Burris, D.L.; Dickrell, P.L.; Sawyer, W.G. Cryogenic friction behavior of PTFE based solid lubricant composites. Tribol. Lett. 2005, 20, 109–113. [Google Scholar] [CrossRef] [Green Version]
  16. Campbell, K.L.; Sidebottom, M.A.; Atkinson, C.C.; Babuska, T.F.; Kolanovic, C.A.; Boulden, B.J.; Junk, C.P.; Krick, B.A. Ultralow Wear PTFE-Based Polymer Composites—The Role of Water and Tribochemistry. Macromolecules 2019, 52, 5268–5277. [Google Scholar] [CrossRef]
  17. Birur, G.C.; Siebes, G.; Swanson, T.D. Spacecraft Thermal Control. In Encyclopedia of Physical Science and Technology; Elsevier: Amsterdam, The Netherlands, 2003; pp. 485–505. [Google Scholar]
  18. Neugebauer, C.; Falkner, M.; Schermann, R.; Weidlich, K.; Demaret, C. High precision duplex bearing with thermal off-load device for the nirspec wheel support mechanisms. In Proceedings of the 12th European Space Mechanisms & Tribology Symposium, Liverpool, UK, 19–21 September 2007; Volume 2007, pp. 19–21. [Google Scholar]
  19. Roberts, E.W. Space Tribology Handbook, 4th ed.; ESR Technology: Warrington, UK, 2007. [Google Scholar]
  20. Martin, C.; Sailleau, J.; Pesenti, P. La Recherche Spatiale; 1974; pp. 20–24. [Google Scholar]
  21. Conley, P.L. Space Vehicle Mechanisms: Elements of Successful Design; Conley, P.L., Ed.; John Wiley and Sons: Hoboken, NJ, USA, 1998; ISBN 978-0-471-12141-1. [Google Scholar]
  22. Jones, J.R. Lubrication, Friction, and Wear NASA/SP-8063; NASA: Washington, DC, USA, 1971.
  23. Gardos, M.N. Self-lubricating composites for extreme environment applications. Tribol. Int. 1982, 15, 273–283. [Google Scholar] [CrossRef]
  24. Fusaro, R.L. Self-lubricating polymer composites and polymer transfer film lubrication for space applications. Tribol. Int. 1990, 23, 105–122. [Google Scholar] [CrossRef] [Green Version]
  25. Roussel, M.; Martin, C.; Sailleau, J. Matériaux composites autolubrifiants pour utilisations spatiales. In Proceedings of the 1st European Space Tribology Symposium—ESA SP-111, Fracscati, Italy, 9−11 April 1975. [Google Scholar]
  26. Anderson, M.J. Tribometer Characterisation Tests and Definition of Bearings Screening Plan. ESA-ESTL-TM-226 01; ESTL, ESR Technology Ltd.: Warrington, UK, 1999. [Google Scholar]
  27. Palladino, M. Report on ESA Recommendations Regarding PGM-HT Use for Space Applications; ESA, ESTEC: Noordwijk, The Netherlands, 2012. [Google Scholar]
  28. Buttery, M.; Cropper, M.; Roberts, E.W. Thermally Conditioned PGM-HT—ESA-ESTL-TM-0069; ESTL, ESR Technology Ltd: Warrington, UK, 2011. [Google Scholar]
  29. Colas, G.; Pajovic, S.; Saulot, A.; Renouf, M.; Cameron, P. Adhesion Measurements in MoS2 Dry Lubricated Contacts to Inform Predictive Tribological Numerical Models: Comparison between Laboratory-Tested Samples and Ball Bearings from The NIRISS Mechanism. In Proceedings of the Conference 17th European Space Mechanisms & Tribology Symposium, Hatfiel, UK; 2017. Available online: http://esmats.eu/esmatspapers/pastpapers/pdfs/2017/colas.pdf (accessed on 25 April 2020).
  30. Macho, C.; Merstallinger, A.; Bodrowski-Hanemann, G.; Palladino, M.; Pambaguian, L. SLPMC - Self Lubricating Polymer Matrix Composites. In Proceedings of the 15th European Space Mechanisms & Tribology Symposium—ESMATS 2013’, Noordwijk, The Netherlands, 25–27 September 2013. [Google Scholar]
  31. Kohen, I.; Play, D.; Godet, M. Effect of machine rigidity or degrees of freedom on the load-carrying capacity of wear debris. Wear 1980, 61, 381–384. [Google Scholar] [CrossRef]
  32. Czichos, H.; Becker, S.; Lexow, J. The Versailles Project on Advanced Materials and Standards (VAMAS ) on wear test methods is one of the rapidly growing suite of projects initiated as a result of decisions following the 1982 Versailles Summit Meeting of the Heads of State or Governments. J. Vac. Sci. Technol. A Vac. Surf. Film. 1987, 114, 109–130. [Google Scholar]
  33. Renouf, M.; Nhu, V.-H.; Saulot, A.; Massi, F. First-Body Versus Third-Body: Dialogue Between an Experiment and a Combined Discrete and Finite Element Approach. ASME J. Tribol. 2014, 136, 021104. [Google Scholar] [CrossRef] [Green Version]
  34. Berthier, Y. Experimental evidence for friction and wear modelling. Wear 1990, 139, 77–92. [Google Scholar] [CrossRef]
  35. Berthier, Y. Third-Body Reality—Consequences and use of the Third-Body Concept to Solve Friction and Wear Problems. In Wear—Materials, Mechanisms and Practice; John Wiley & Sons Ltd: Chichester, UK, 2005; pp. 291–317. ISBN 978-0-470-01628-2. [Google Scholar]
  36. Colas, G.; Saulot, A.; Descartes, S.; Michel, Y.; Berthier, Y. Double Transfer Experiments To Highlight Design Criterion for Future Self-Lubricating Materials. In Proceedings of the 16th European Space Mechanisms & Tribology Symposium, Bilbao, Spain, 23–25 September 2015. [Google Scholar]
  37. Pajovic, S.; Colas, G.; Saulot, A.; Renouf, M.; Filleter, T. Work of Adhesion Measurements of MoS2 Dry Lubricated 440C Stainless Steel Tribological Contacts. Adv. Eng. Mater. 2017, 19, 1700423. [Google Scholar] [CrossRef] [Green Version]
  38. Villavicencio, M.D.; Renouf, M.; Saulot, A.; Michel, Y.; Mahéo, Y.; Colas, G.; Filleter, T.; Berthier, Y. Self-lubricating composite bearings: Effect of fiber length on its tribological proporties by DEM modelling. Tribol. Int. 2017, 113, 362–369. [Google Scholar] [CrossRef] [Green Version]
  39. Lewis, S.D.; Anderson, M.J.; Haslehurst, A. Recent developments in performance and life testing of self-lubricating bearings for long-life applications. In Proceedings of the 12th European Space Mechanisms & Tribology Symposium, Liverpool, UK, 19–21 September 2007; Volume 2007. [Google Scholar]
  40. Cordier, C. Procedure de Nettoyage de Pieces Mecaniques, Metalliques, Plastiques, Composites Ou Ceramiques Applique Au Laboratoire de DCT/TV/MS. DCT-TV-MS-2009-6283-1.0; CNES: Paris, France, 2009.
  41. Gouider, M.; Berthier, Y.; Jacquemard, P.; Rousseau, B.; Bonnamy, S.; Estrade-Szwarckopf, H. Mass spectrometry during C/C composite friction: Carbon oxidation associated with high friction coefficient and high wear rate. Wear 2004, 256, 1082–1087. [Google Scholar] [CrossRef]
  42. Theiler, G.; Gradt, T. MoS2 -Filled PEEK Composite as a Self-Lubricating Material for Aerospace Applications. In Proceedings of the 40th Aerospace Mechanisms Symposium, NASA Kennedy Space Center; 2010; pp. 347–352. Available online: https://ntrs.nasa.gov/archive/nasa/casi.ntrs.nasa.gov/20100021916.pdf (accessed on 25 April 2020).
  43. Nevshupa, R.; Caro, J.; Arratibel, A.; Bonet, R.; Rusanov, A.; Ares, J.R.; Roman, E. Evolution of tribologically induced chemical and structural degradation in hydrogenated a-C coatings. Tribol. Int. 2019, 129, 177–190. [Google Scholar] [CrossRef]
  44. Igartua, A.; Berriozabal, E.; Zabala, B.; Pagano, F.; Minami, I.; Doerr, N.; Gabler, C.; Nevshupa, R.; Roman, E.; Nielsen, L.P.; et al. Lubricity and Tribochemical Reactivity of Advanced Materials Under High Vacuum. In Proceedings of the 16th European Space Mechanisms and Tribology Symposium 2015’, Bilbao, Spain, 23–25 September 2015; Volume 2015, pp. 23–25. [Google Scholar]
  45. Colas, G.; Saulot, A.; Bouscharain, N.; Godeau, C.; Michel, Y.; Berthier, Y. How far does contamination help dry lubrication efficiency? Tribol. Int. 2013, 65, 177–189. [Google Scholar] [CrossRef]
  46. Nevshupa, R.A.; De Segovia, J.L.; Deulin, E.A. Outgassing of stainless steel during sliding friction in ultra-high vacuum. Vacuum 1999, 53, 295–298. [Google Scholar] [CrossRef]
  47. Buckley, D.H.; Johnson, R.L. Degradation of Polymeric Compositions in Vacuum to 10-9 mm Hg in Evaporation and Sliding Friction Experiments. Polym. Eng. Sci. 1964, 4, 306–314. [Google Scholar] [CrossRef] [Green Version]
  48. Wilkens, W.; Kranz, O. The formation of gases due to the sliding friction of teflon on steel in ultrahigh vacuum. Wear 1970, 15, 215–227. [Google Scholar] [CrossRef]
  49. NIST NIST Chemistry Webbook. Available online: https://webbook.nist.gov/chemistry/ (accessed on 3 April 2016).
  50. Kragelsky, I.V.; Alisin, V.V. Tribology: Lubrication, Friction and Wear; Kragelsky, I.V., Alisin, V.V., Eds.; Professional Engineering Publishing Ltd.: Bury St Edmunds, UK, 2005; ISBN 978-1-86058-288-2. [Google Scholar]
  51. Nevshupa, R.A.; De Segovia, J.L. Outgassing from stainless steel under impact in UHV. Vacuum 2002, 64, 425–430. [Google Scholar] [CrossRef]
  52. Colas, G.; Saulot, A.; Philippon, D.; Berthier, Y.; Leonard, D. Time-of-Flight Secondary Ion Mass Spectroscopy investigation of the chemical rearrangement undergone by MoS2 under tribological conditions. Thin Solid Film. 2015, 588, 67–77. [Google Scholar] [CrossRef]
  53. Winer, W.O. Molybdenum disulfide as a lubricant: A review of the fundamental knowledge. Wear 1967, 10, 422–452. [Google Scholar] [CrossRef] [Green Version]
  54. Champagne, M.; Renouf, M.; Berthier, Y. Modeling Wear for Heterogeneous Bi-Phasic Materials Using Discrete Elements Approach. J. Tribol. 2014, 136, 021603. [Google Scholar] [CrossRef]
  55. Fleischauer, P.D.; Didziulis, S.V.; Lince, J.R. Friction and Wear Properties of MoS2 Thin Film Lubricants; Aerospace Corporation: El Segundo, CA, USA, 2002. [Google Scholar]
  56. Krick, B.A.; Ewin, J.J.; Blackman, G.S.; Junk, C.P.; Gregory Sawyer, W. Environmental dependence of ultra-low wear behavior of polytetrafluoroethylene (PTFE) and alumina composites suggests tribochemical mechanisms. Tribol. Int. 2012, 51, 42–46. [Google Scholar] [CrossRef]
  57. Matsumoto, K.; Suzuki, M. Tribological Performance of sputtered MoS2 films in various environment. In Proceedings of the 8th European Space Mechanisms & Tribology Symposium, Toulouse, France; 1999. Available online: http://www.esmats.eu/esmatspapers/pastpapers/pdfs/1999/matsumoto.pdf (accessed on 25 April 2020).
  58. Villavicencio, M.D.; Renouf, M.; Saulot, A.; Michel, Y.; Mahéo, Y.; Colas, G.; Filleter, T. Self-Lubricating Polymer Composites: Using Numerical Tribology To Hightlight Their Design Criterion. In Proceedings of the 17th European Space Mechanisms & Tribology Symposium, Hatfiel, UK; 2017. Available online: http://esmats.eu/esmatspapers/pastpapers/pdfs/2017/villavicencio.pdf (accessed on 25 April 2020).
  59. Hässig, M.; Altwegg, K.; Balsiger, H.; Calmonte, U.; Jäckel, A.; Schläppi, B.; Sémon, T.; Wurz, P.; Berthelier, J.J.; De Keyser, J.; et al. Spacecraft outgassing, a largely underestimated phenomenon. In Proceedings of the 2011 2nd International Conference on Space Technology, Athens, Greece, 15–17 September 2011; pp. 1–4. [Google Scholar]
  60. Green, B.D. Satellite Contamination and Materials Outgassing Knowledgebase-An Interactive Database Reference. NASA STI/Recon Tech. Rep. 2001, 1. [Google Scholar] [CrossRef] [Green Version]
  61. Robbins, E. Tribology tests for satellite application: Simulation of the space environment. In Proceedings of the Proceeding of the 1st European Space Tribology Symposium (ESA SP-111), Fracscati, Italy, 9−11 April 1975. [Google Scholar]
Figure 1. Double transfer test bench (DTTB): (a) full tribometer: (b) cross section view of the DTTB; (c) top view of the contact between the cage and the ball and (d) schematic of the double transfer lubrication.
Lubricants 09 00038 g001
Figure 2. Variation of normal force F1 at the contact between the composite pad and the roller. B and F refer to backward and forward motion of the alternative sliding direction. Errors bars represent the min/max amplitude of F1 during the test. * Refers to high min/max variations originating from noise, and ** originating from big particles circulation inside the contact.
Lubricants 09 00038 g002
Figure 3. Force F1 as a function of track length and cycle number from Duroïd 5813 during (a) test2A and (b) test1B. The red square shows how significant the effect of particle circulation can be on F1. Note that force values are negative because the sensor is in compression.
Lubricants 09 00038 g003
Figure 4. Typical mass spectra obtained during friction tests with Duroïd 5813 (a) and AAC-C1 (b) composites materials.
Lubricants 09 00038 g004
Figure 5. SEM images of the uncompacted 3rd body trapped inside scars in the friction track on the plate (a) and a zoomed-in image showing its layered structure in more detail (b). EDS analysis of the 3rd body, spectrum S2, is conducted over the identified square area. (c) AAC-C1 Test1 after the test, end of phase C.
Lubricants 09 00038 g005
Figure 6. Variation of normal force F1 at the contact between the composite pad and the roller after test in Air 50%RH. B and F refer to backward and forward motion of the alternative sliding direction. Errors bars represent the min/max amplitude of F1 during the test. * Refers to high min/max variations originating from noise, and ** originating from big particles circulation inside the contact.
Lubricants 09 00038 g006
Figure 7. Optical observation of local composition and morphology of bulk of (a) PGM-HT and (b) AAC-C1 after ion milling.
Lubricants 09 00038 g007
Figure 8. Local measurement of adhesion force after different loading values for each component of (a) PGM-HT and (b) AAC-C1.
Lubricants 09 00038 g008
Figure 9. Mean adhesion force and associated standard deviation (black lines) for each component of pure PTFE, PGM-HT and AAC-C1.
Lubricants 09 00038 g009
Figure 10. Optical observation of local composition and morphology of friction tracks of (a) PGM-HT and (b) C1.
Lubricants 09 00038 g010
Figure 11. Comparison of the adhesion forces between the center of the friction track and its periphery for PGM-HT ((a) periphery; (b) center) and C1 ((c) periphery/(d) center).
Lubricants 09 00038 g011
Figure 12. Comparison of adhesion between AISI 440C steel and borosilicate on the contact materials, for the AAC-C1 composite bulk after ion milling and after friction.
Lubricants 09 00038 g012
Figure 13. Comparison of adhesion between AISI 440C steel and borosilicate on the contact materials, for the AAC-C1 composite bulk after ion milling and after friction.
Lubricants 09 00038 g013
Table 1. Composites designation, compositions and mechanical properties. * Measured through X-ray tomography [38].
CompositeSupplierCompositionManufacturing ProcessYoung’s Modulus (GPa)
Duroïd 5813Rogers Corp. (USA)PTFE matrix
18% MoS2 Ø10 µm *
19% glass fiber Ø3 µm *
Unknown6.1 [39]
PGM-HTJPM Mississippi (USA)PTFE matrix
10% MoS2 Ø100 µm *
24% glass fiber Ø20 µm *
Hot compression molding
preconditioned in vacuum
1.1 [39]
AAC-C1Formulation by AAC, produced by ENSINGER SINTIMID GmbHPTFE matrix
10% MoS2 particles
25% glass fiber Ø13 µm
Hot compression molding-
AAC-C9Formulation by AAC, produced by ENSINGER SINTIMID GmbHPTFE
10% MoS2 particles
15% mineral fiber Ø3 µm
Hot compression molding-
Table 2. Gas molecules of interest and the associated atomic masses in the gas analysis conducted by mass spectrometry analysis [49]. It was chosen to present hydrocarbon molecules as CxHy molecules because the resolution of the mass spectrometer vs. the measurement speed is not high enough to confidently dissociate different hydrocarbons.
MoleculesCorresponding Atomic MassesMoleculesCorresponding Atomic Masses
H2O18, 17, 16, 1H22, 1
O232, 16F19
CO28, 16, 12HF20
CO244, 28, 22, 16, 12CF470, 69, 45, 31, 19
N228, 14C2F4100, 81, 69, 50, 31, 29, 19, 12
H2S34, 33, 32C2F6(119), 69, 50, 31, 29, 19
SO264, 48, 32, 16CXHY46, 45, 44, 43, 42, 41, 39, 31, 30, 29, 28, 27, 26, 19, 16, 15, 12, 1
Ar40, 20
Table 3. Parameters used in the adhesion forces measurement. * Beaded cantilevers with borosilicate bead are commercially available, AISI 440C bead are glued in-house on tipless cantilevers and are measured. The closest to 20 µm in diameter was chosen for the study.
ParameterValue
Loading Pattern (µN)1, 2, 3, 2, 1
Measures at each load6
Approach speed (µm/s)1.98
Dwell time (s)1
EnvironmentHumid air (50% RH)
TemperatureRoom temperature (25 °C)
Beads materials and diameter *Borosilicate (Ø20 µm)
AISI440C (Ø19.5 µm)
Studied compositesC1 after Ion Milling
C1 after friction: center and periphery of the track
PGM-HT after Ion Milling
PGM-HT after friction: center and periphery of the track
Pure PTFE for reference
Table 4. Interface whose adhesion is characterized experimentally during the study.
CompositePTFEGlass FiberMoS23rd Body
PTFE---
Glass Fiber
MoS2---
3rd body---
AISI440C
Table 5. Optical images of the contact area on the composite pad and detailed SEM images of the surfaces. A—fiber; b—MoS2 particle; c—PTFE matrix; d: third body. Zoomed in image of the white framed region of Duroïd shows the sharp transition (dotted line) between the friction track and debris.
Duroïd 5813PGM-HTAAC-C1AAC-C9
O.M Lubricants 09 00038 i001 Lubricants 09 00038 i002 Lubricants 09 00038 i003 Lubricants 09 00038 i004
SEM Lubricants 09 00038 i005 Lubricants 09 00038 i006 Lubricants 09 00038 i007 Lubricants 09 00038 i008
Lubricants 09 00038 i009 Lubricants 09 00038 i010 Lubricants 09 00038 i011 Lubricants 09 00038 i012
Table 6. Optical images of the friction track on the plate sample and detailed SEM images of the surfaces.
Duroïd 5813PGM-HTAAC-C1AAC-C9
O.M Lubricants 09 00038 i013 Lubricants 09 00038 i014 Lubricants 09 00038 i015 Lubricants 09 00038 i016
SEM Lubricants 09 00038 i017 Lubricants 09 00038 i018 Lubricants 09 00038 i019 Lubricants 09 00038 i020
Lubricants 09 00038 i021 Lubricants 09 00038 i022 Lubricants 09 00038 i023 Lubricants 09 00038 i024
Table 7. Optical images of the contact area on the composite pad and the plate samples.
Duroïd 5813PGM-HTAAC-C1AAC-C9
Pad Lubricants 09 00038 i025 Lubricants 09 00038 i026 Lubricants 09 00038 i027 Lubricants 09 00038 i028
Lubricants 09 00038 i029 Lubricants 09 00038 i030 Lubricants 09 00038 i031 Lubricants 09 00038 i032
Plate Lubricants 09 00038 i033 Lubricants 09 00038 i034 Lubricants 09 00038 i035 Lubricants 09 00038 i036
Lubricants 09 00038 i037 Lubricants 09 00038 i038 Lubricants 09 00038 i039 Lubricants 09 00038 i040
Publisher’s Note: MDPI stays neutral with regard to jurisdictional claims in published maps and institutional affiliations.

