Article

Anopheles albimanus (Diptera: Culicidae) Ensemble Distribution Modeling: Applications for Malaria Elimination

by
Charlotte G. Rhodes
1,
Jose R. Loaiza
2,3,
Luis Mario Romero
4,
José Manuel Gutiérrez Alvarado
5,
Gabriela Delgado
5,
Obdulio Rojas Salas
6,
Melissa Ramírez Rojas
7,
Carlos Aguilar-Avendaño
5,
Ezequías Maynes
8,
José A. Valerín Cordero
9,
Alonso Soto Mora
10,
Chystrie A. Rigg
11,
Aryana Zardkoohi
7,
Monica Prado
12,
Mariel D. Friberg
13,14,
Luke R. Bergmann
15,
Rodrigo Marín Rodríguez
5,7,
Gabriel L. Hamer
1 and
Luis Fernando Chaves
7,11,*
1
Department of Entomology, Texas A&M University, College Station, TX 77843, USA
2
Instituto de Investigaciones Científicas y Servicios de Alta Tecnología, Ciudad de Panama Apartado Postal 0816-02593, Panama
3
Programa Centroamericano de Maestría en Entomología, Universidad de Panamá, Ciudad de Panama Apartado Postal 0816-02593, Panama
4
Departamento de Patología, Escuela de Medicina Veterinaria, Universidad Nacional, Heredia Apartado Postal 304-3000, Costa Rica
5
Oficina Central de Enlace, Programa Nacional de Manejo Integrado de Vectores, Ministerio de Salud, San José, San Jose Apartado Postal 10123-1000, Costa Rica
6
Programa Nacional de Manejo Integrado de Vectores, Región Huetar Norte, Ministerio de Salud, Muelle de San Carlos, San Carlos, Alajuela Código 21006, Costa Rica
7
Vigilancia de la Salud, Ministerio de Salud, San José, San Jose Apartado Postal 10123-1000, Costa Rica
8
Programa Nacional de Manejo Integrado de Vectores, Región Huetar Caribe, Ministerio de Salud, Sixaola, Talamanca, Limon Código 70402, Costa Rica
9
Coordinación Regional, Programa Nacional de Manejo Integrado de Vectores, Región Pacífico Central, Ministerio de Salud, Puntarenas, Puntarenas Código 60101, Costa Rica
10
Coordinación Regional, Programa Nacional de Manejo Integrado de Vectores, Región Brunca, Ministerio de Salud, San Isidro del General, Pérez Zeledón, San Jose Código 11901, Costa Rica
11
Instituto Conmemorativo Gorgas de Estudios de la Salud, Ciudad de Panama Apartado Postal 0816-02593, Panama
12
Unidad de Investigación en Plasmodium, Centro de Investigación en Enfermedades Tropicales (CIET), Facultad de Microbiología, Universidad de Costa Rica, San Pedro, San Jose Apartado Postal 11501-2060, Costa Rica
13
Earth System Science Interdisciplinary Center (ESSIC), University of Maryland, College Park, MD 20740, USA
14
NASA Goddard Space Flight Center, Greenbelt, MD 20771, USA
15
Department of Geography, University of British Columbia, Vancouver, BC V6T 1Z2, Canada
*
Author to whom correspondence should be addressed.
Submission received: 7 January 2022 / Revised: 15 February 2022 / Accepted: 21 February 2022 / Published: 22 February 2022
(This article belongs to the Special Issue Vector-Borne Diseases in a Changing World)

Abstract

:

Simple Summary

Costa Rica is near malaria elimination. However, sporadic outbreaks still occur, and while control strategies have been focused on delivering efficient treatments for infected patients, an open question is whether control measures targeting the dominant vector, Anopheles albimanus, are appropriately designed given their ecology and distribution. Here, we illustrate the use of an ensemble species distribution model (SDM) as a tool to assess the potential exposure to An. albimanus in palm and pineapple plantations, and to also assess the potential involvement of this mosquito vector in transmission foci where entomological surveillance is not feasible. We found that both oil palm and pineapple plantations are very likely to harbor An. albimanus. By contrast, environments at the Crucitas open-pit gold mine, the epicenter of malaria transmission in 2018 and 2019, have low suitability for this mosquito species. Our results suggest that medium to high resolution SDMs can be used to plan vector control activities. Finally, we discuss the high suitability of oil palm and pineapple plantations for An. albimanus in reference to recently developed social science theory about the Plantationocene.

Abstract

In the absence of entomological information, tools for predicting Anopheles spp. presence can help evaluate the entomological risk of malaria transmission. Here, we illustrate how species distribution models (SDM) could quantify potential dominant vector species presence in malaria elimination settings. We fitted a 250 m resolution ensemble SDM for Anopheles albimanus Wiedemann. The ensemble SDM included predictions based on seven different algorithms, 110 occurrence records and 70 model projections. SDM covariates included nine environmental variables that were selected based on their importance from an original set of 28 layers that included remotely and spatially interpolated locally measured variables for the land surface of Costa Rica. Goodness of fit for the ensemble SDM was very high, with a minimum AUC of 0.79. We used the resulting ensemble SDM to evaluate differences in habitat suitability (HS) between commercial plantations and surrounding landscapes, finding a higher HS in pineapple and oil palm plantations, suggestive of An. albimanus presence, than in surrounding landscapes. The ensemble SDM suggested a low HS for An. albimanus at the presumed epicenter of malaria transmission during 2018–2019 in Costa Rica, yet this vector was likely present at the two main towns also affected by the epidemic. Our results illustrate how ensemble SDMs in malaria elimination settings can provide information that could help to improve vector surveillance and control.

1. Introduction

Species distribution models (hereafter SDMs) predict species distribution ranges in a space defined by coordinates (hereafter G-space). This concept is commonly confused with environmental niche models (hereafter ENMs), which attempt to depict the species distribution across a series of environmental gradients, or an environmental space (hereafter E-space) [1,2]. These approaches use georeferenced occurrence points and associated environmental information, plus computer algorithms, to generate models of the probabilistic distribution of a species in a E-space that becomes projected into a G-space, while reducing errors regarding species distribution [3,4].
Based on both SDMs and ENMs, populations can be conceived as occupying environmental niches that are similar (‘niche similarity’; Peterson et al. [5]) or identical (‘niche equivalency’; Graham et al. [6]). While the first is relevant for testing broad biogeographic and evolutionary hypotheses, the latter is useful for testing the transferability of niche models in space and over relatively short periods of time [7]. In other words, SDMs overcome the limitations of traditional approaches, such as the widely implemented “Extents of Occurrence” [1,8,9], for depicting the spatial range of a species as they are not based on opinions but quantitative relations. SDMs and ENMs can help to forecast trends in biodiversity loss driven by changing environmental conditions to forecast biological invasions and resolve questions about ecological and evolutionary diversification in response to environmental changes [5,10,11,12,13,14].
Mosquitoes in the genus Anopheles (Diptera: Culicidae) include several vectors of human malaria [15]. Successful malaria control efforts have been largely based on vector reduction [16]. However, anthropogenic changes to the landscape and vector control activities have been accompanied by shifts in major anopheline vector species, which can be assessed employing information from SDMs and ENMs. To take several examples, dominant vector species can adapt and expand into new geographic areas and habitats, become resistant to insecticides, or be displaced by other species, whose genetics and behavior are unknown. Additionally, unidentified anopheline taxa within cryptic species complexes may represent incipient evolutionary units, whose ability to adapt to climate change and transmit Plasmodium spp. parasites to humans vary with respect to isolated populations of the same species [17]. All of this evolutionary complexity occurs against a backdrop of environmental alteration driven by human activity, which in turn influences mosquito distribution, species composition and density. The result of these interactions is highly focal and often leads to idiosyncratic malaria transmission patterns that are poorly characterized, and where standard interventions are not well adapted to reduce transmission, as has been observed in the Anopheles gambiae complex from Africa [18,19,20]. Hence, there is a critical need to characterize the link between anopheline mosquitoes and the environment, especially in malaria endemic areas where SDMs and ENMs can help to design and implement precise control activities across the suitable habitat of local malaria vectors [21,22,23]. In Mesoamerica, the dominant vector species across the region is Anopheles albimanus Wiedemann [24,25]. An. albimanus primarily occurs below 500 m [24,25], although it has been observed at higher elevations [26]. This mosquito species is crepuscular, zoophilic and exophagic, with exophilic resting behavior. Larvae and adults have been found over a wide variety of ecological contexts [27]. Prior SDMs for An. albimanus in Mesoamerica have been performed at relatively coarsely grained spatial scales between 1 and 8 km [21,27,28], and these efforts have relied on the use of single algorithms, including boosted regression trees [27] and MAXENT [21,28], which have not been evaluated as part of ensembles, which are known to increase the precision and accuracy of SDMs [29].
In Mesoamerica, malaria is still an important vector-borne disease. However, Costa Rica is on the verge of eliminating the disease. This malaria elimination is the result of several control efforts, where elimination has been accelerated following changes in the treatment coupled with mass drug administration campaigns [30,31] and housing quality improvement [32]. Nevertheless, since 2016, malaria cases re-emerged given the transboundary movements of pineapple plantation workers from Nicaragua [30], and illegal gold mining in the Crucitas district of San Carlos county [33]. In the malaria elimination context, SDMs are of great value as they can help to quickly evaluate the potential presence of a vector in an area with malaria transmission, but without entomological information. For example, in Costa Rica, the most recent malaria outbreaks have been controlled during the dry season [31] when it is difficult to collect vector samples [34,35]. Using an SDM, for example, it can be quickly assessed if a dominant vector, such as An. albimanus, is, or was, likely to be present in areas with transmission, thus allowing the planning of precise control interventions for the rainy season when the mosquito is more abundant [35]. Similarly, SDMs can be used to determine whether dominant vector species are likely to be present in areas where vulnerable populations migrate for economic reasons. From the perspective of vector control operations, however, SDMs even at 1 km are limited in their ability to help plan precise control operations. Given the current capacities in the national vector control program of Costa Rica [36], fine- and ultra-fine-resolution SDMs will more effectively guide the identification of larval habitats and/or the implementation of insecticide applications following the detection of malaria cases, following current protocols for malaria outbreak mitigation [37].
Here, we use mid-resolution spatial data, at 250 m, where we incorporate several layers derived from remotely sensed and locally measured environmental variables to create an ensemble SDM for An. albimanus. This SDM, which combines predictions from an ensemble of several quantitative methodologies, is a robust approximation to the distribution of this major malaria vector, which we use to retrospectively assess the possibility that this vector was present in the transmission foci associated with malaria epidemics in 2018 and 2019 [31,38] and in landscapes used for pineapple production, where some malaria outbreaks have been recurrently observed over recent years.

2. Materials and Methods

2.1. Mosquito Occurrence Records

We assembled a dataset of An. albimanus occurrences with records from collections made largely by the vector control program of the Costa Rican Ministry of Health during surveillance and control activities for vector-borne diseases [39]. Additional occurrence data were obtained from the Global Biodiversity Information Facility (GBIF—https://www.gbif.org/ accessed on 20 February 2021) by searching the terms “Anopheles albimanus” for species and “Costa Rica” for country. For the GBIF, we did not restrict the time frame for the search, which allowed us to consider a larger collection of occurrence points. Only occurrences that were georeferenced were selected. We also included records from molecular population genetic studies on An. albimanus from southern Mesoamerica, which encompassed extensive mosquito sampling across Costa Rica [28,40,41]. Records from the genetic studies and the vector control program were collected after 2000. Occurrence records used in this study are available online at https://osf.io/acjyg/.

2.2. Occurrence Data Quality Control

Occurrence data (Figure 1) were checked for duplicates and records with incomplete location information. When found, these records were removed. Surveillance data commonly suffer from spatial bias for a variety of reasons, including site accessibility and uneven sampling efforts. This clustering of occurrence points can result in the overrepresentation of certain areas and, subsequently, model overfit [42]. As such, occurrence records occurring within 0.5 km of each other were removed using the spThin function from the R package “spThin” [43], which is described in [44]. We started with 227 records and ended with 110 occurrence records after thinning the dataset.

2.3. Pseudoabsence Points

While it is possible to fit species distribution models with presence-only data, using presence–absence data has been shown to have superior performance [6]. However, true absence points are rare and particularly difficult to confirm for mobile species [47]. Without true absence points, we rely on an artificial set of absence points, termed pseudoabsence points [47,48]. There are many different strategies for generating these points, so we refer to the suggestions by Barbet-Messin et al. [47], who detail the best sampling method based on the SDM algorithms used. Pseudoabsences were generated using the “SRE” method in the biomod2 package. This method uses a surface range envelope (SRE) model to identify a range of suitable environmental conditions [49]. Pseudoabsence points are then sampled randomly outside of that area, as they are considered to be environmentally dissimilar from the location of presence points.

2.4. Environmental Data

We created a multilayer raster that included several variables that have been associated with the occurrence of An. albimanus. Table 1 shows all the covariates included in the multilayer raster, whose sources and processing are described in the Data Sources and Processing subsection.

2.5. Data Sources and Processing

When building our multilayer raster, we used surfaces for the enhanced (EVI) and normalized difference vegetation indices (NDVI) from moderate resolution imaging spectroradiometer (MODIS) images [50,51] as the basis grid. EVI and NDVI are commonly used as vegetation growth proxies [52], with EVI being more appropriate for measuring differences in areas with high canopy and dense vegetation [51]. We also included other raster layers from MODIS, including data for surface temperature [53], as well as a forest/non-forest land use classification based on advanced land observing satellite (ALOS) phased arrayed L-band synthetic aperture radar (PALSAR) images [54]. The PALSAR forest classification is based on identified forests with an area larger than 0.5 ha, with over 10% forest coverage in accordance with the Food and Agriculture Organization (FAO) definition [54]. We also included data for population density from the Gridded Population of the World, Version 4 (GPWv4) with the Population Density Adjusted to Match 2015 Revision of UN WPP Country Totals dataset [55]. Data from the NASADEM_HGT v001 digital elevation model were also included [56].
All raster data were downloaded from Google Earth Engine (GEE) using javascript code available on the GEE website [57]. For MODIS and PALSAR variables that had time series of images, we estimated median, standard deviation, kurtosis and maximum and minimum composite images using the javascript reducer function in GEE. The downloaded data were warped, i.e., re-projected and re-sampled [58], using the bicubic spline algorithm and the EVI/NDVI grid as a template, using the command sf_warp from the “stars” package of R. We chose the bicubic spline algorithm, given that it has the best performance in terms of precision and accuracy when compared with other algorithms used to resample raster images [59]. The resulting 250 m digital elevation model was further processed to estimate slope, aspect and roughness using the terrain function of the “raster” package for R. Slope and aspect were measured in radians. Briefly, slope is the rate of elevational change of the landscape measured in the steepest direction at any point, while the aspect is the direction in which the slope is measured (where 0 is north, π/2 is east, π is south and 3π/2 is west) [60]. Meanwhile, roughness at a given pixel is the largest elevation difference within the set of nine pixels composed by that given (‘focal’) pixel and its eight surrounding neighbor cells in the rectangular raster grid [61].
We also included rainfall [62] and temperature [63,64,65] data from the Costa Rican National Meteorological Institute and data about the built environment based on a coupled photogrammetric and cadastral record analysis [45]. These data were vector files [45,62,63,64,65], and were rasterized over the 250 m grid of EVI and NDVI raster layers using the command sf_rasterize of the R package “stars”.
All the raster layers were then stacked into a multilayer raster brick with the commands stack and brick from the “raster” package using R. The resulting multilayer raster, with a resolution of 250 m, is available online at https://osf.io/acjyg/.

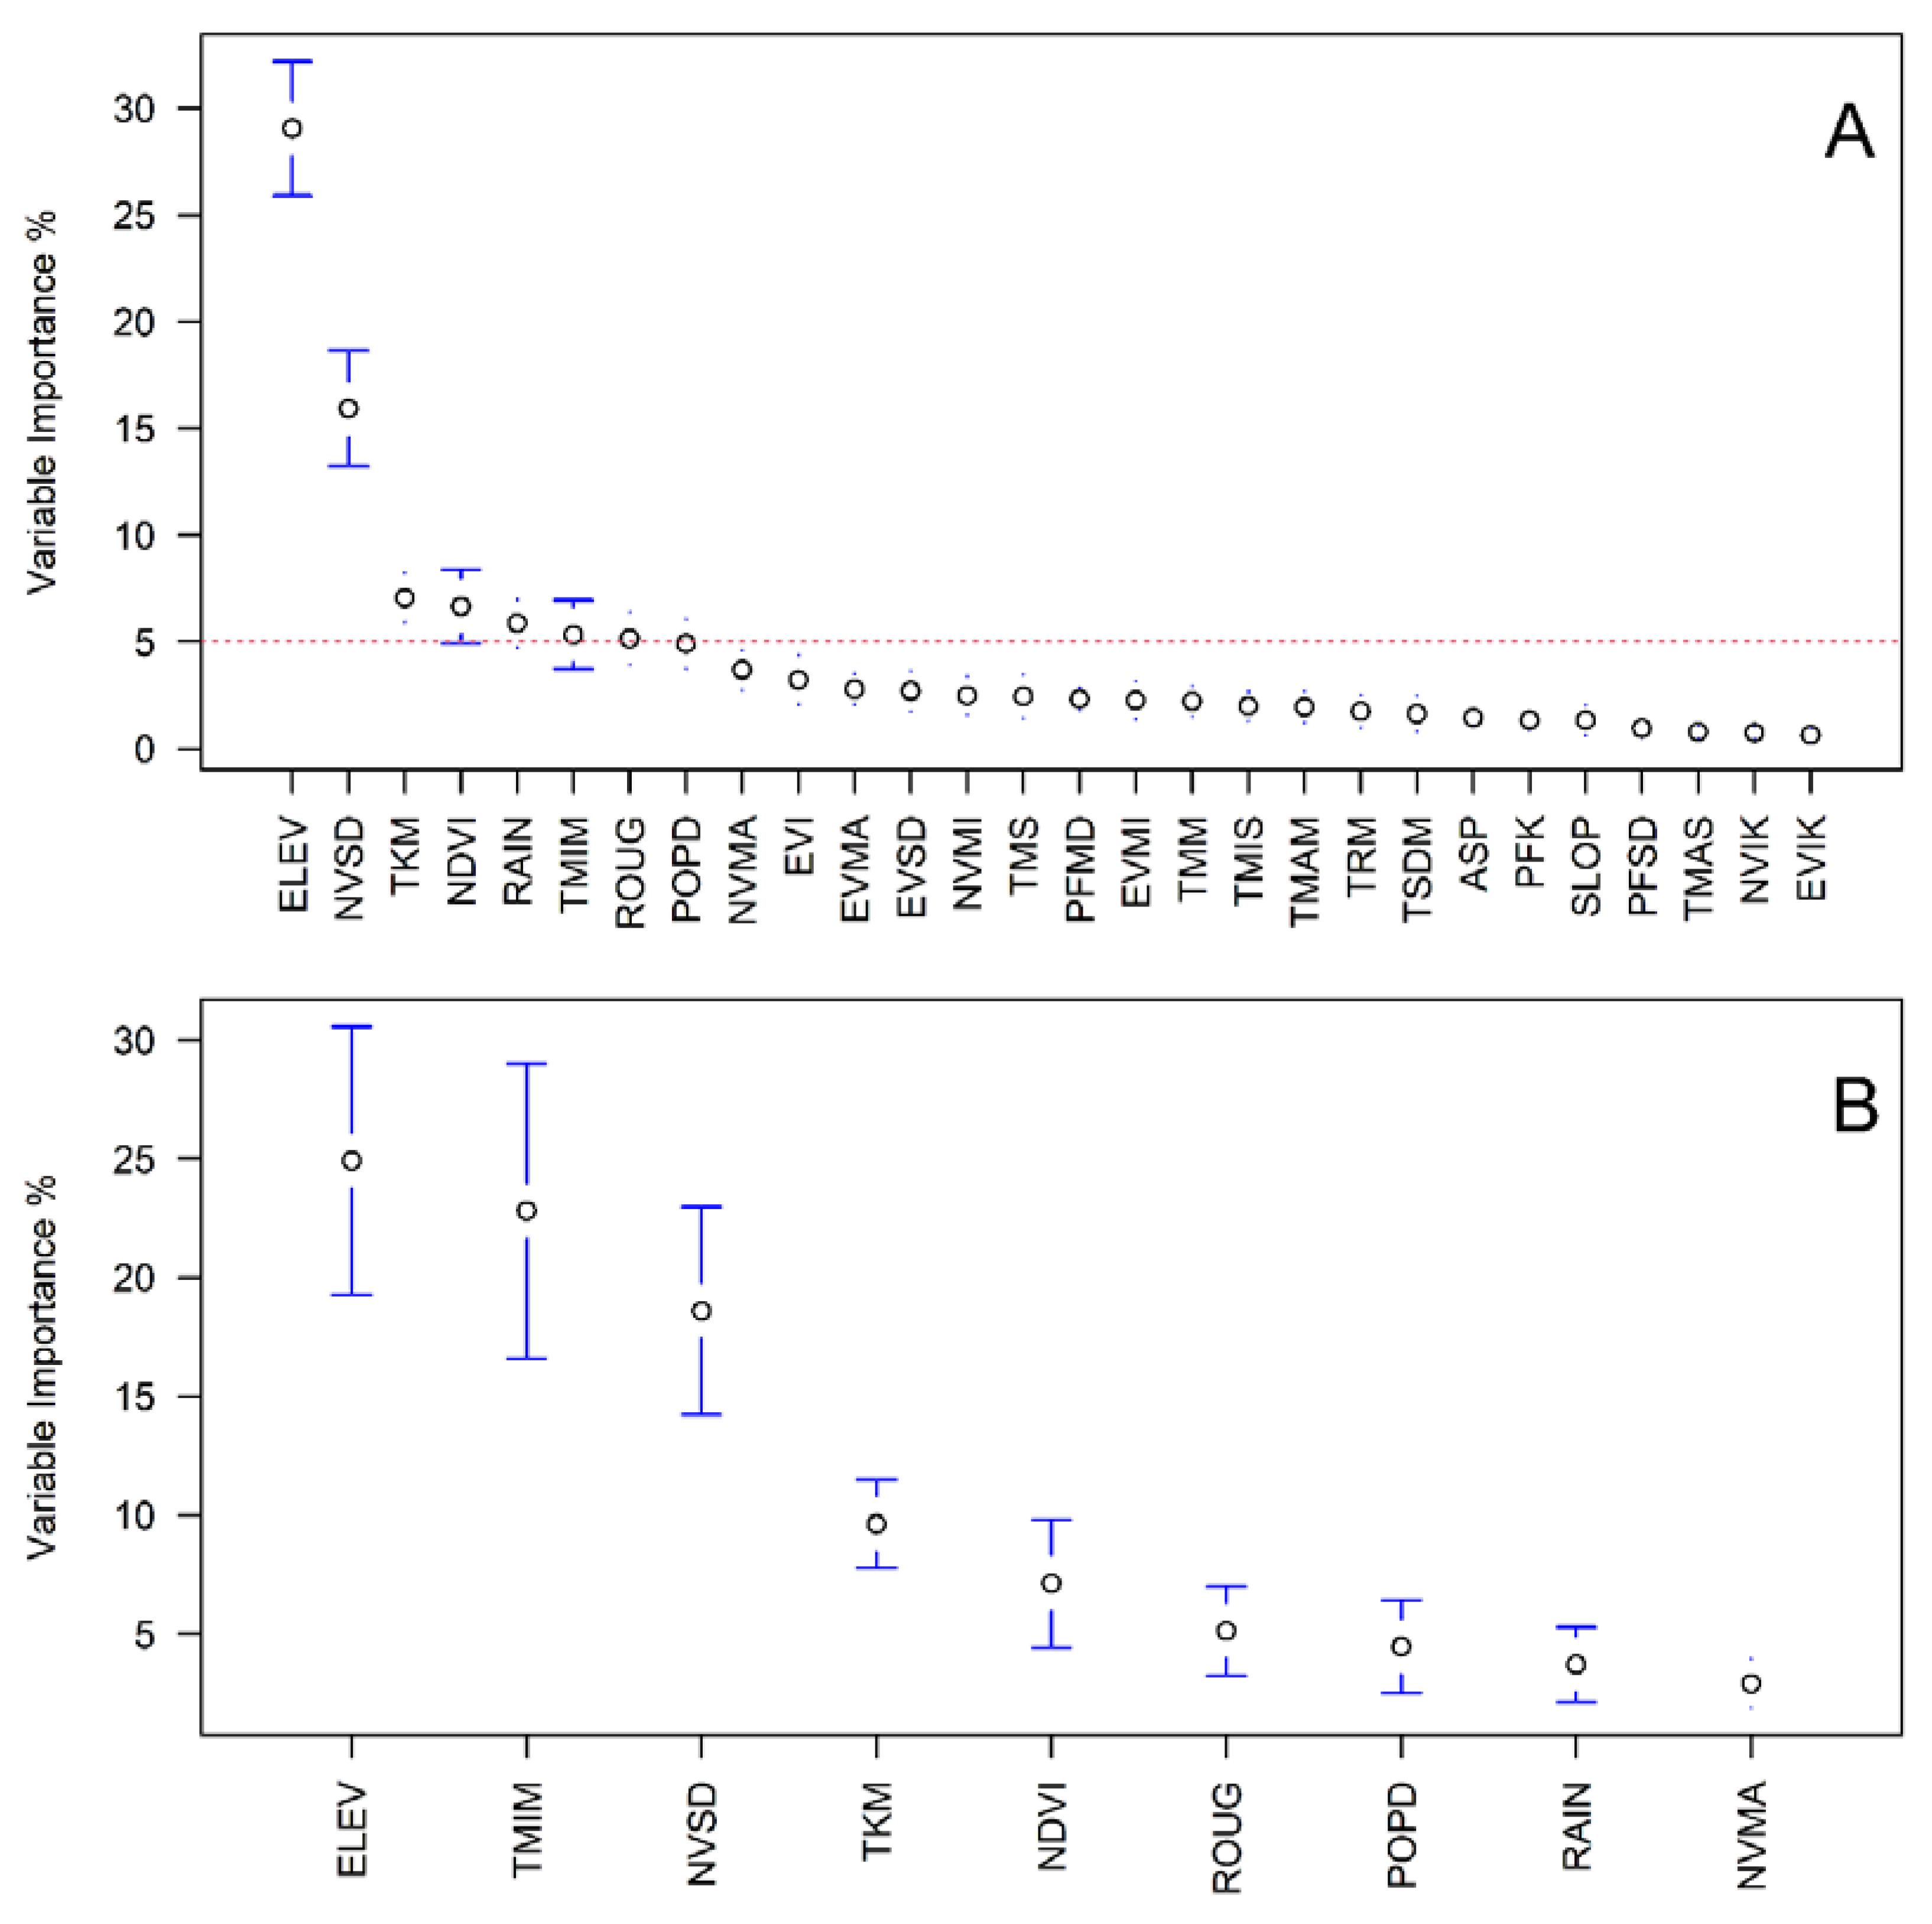
2.6. Parametric Models, Machine Learning Algorithms and Variable Selection

We employed a parametric model for SDM, the logistic generalized linear model (L-GLM), which can predict the presence and absence of a species based on a linear combination of variables [66]. We also employed the following six machine learning algorithms to produce models that estimate habitat suitability: classification and regression tress (CAT), generalized boosted regression models (GBM) [67], random forests (RF) [68], artificial neural networks (ANN) [68], the multiple adaptive regression splines (MARS) and MAXENT [1,2,3]. GBM and RF are based on the use of CAT, which are computational tools that iteratively find thresholds and other non-linearities in the association of covariates with a response [69]. In the case of GBM, trees are boosted, meaning that simpler trees are combined to improve the accuracy of predictions [67]. In RF, trees are built for resampled datasets in a fashion similar to the one used for building a bootstrap [68,70]. Meanwhile, ANN are models that incorporate non-linearities in the association of variables by using nonlinear functions that combine the information from several variables (called ‘inputs’ in ANN terminology) in layers of neurons, which become combined (‘activated’) to generate a prediction (‘output’) [68]. MARS is a technique that uses spline fitting to find piecewise linear basis functions that accommodate non-linear relationships between the environmental covariates and presence probability of a species [71]. Finally, MAXENT maximizes an entropy function that separates the distribution of environmental variables from pixels where the species has been recorded from the background distribution of the same variables where the studied species has not been sampled, taking into account the constraints derived from environmental conditions [3].
For variable selection, we generated 10 sets of 110 pseudoabsence points, as the process of data cleaning left us with 110 occurrences and machine learning algorithms work best with symmetric datasets [47,68], i.e., with the same number of occurrence and pseudoabsences in this case. Pseudoabsence points were generated using the surface range envelope algorithm described in Section 2.3, where points are chosen at random from areas considered to be environmentally dissimilar from the locations of presence points [47]. We then ran each one of the seven methods mentioned above three times, and each of the three times, we included 100 permutations for each covariate at a time to estimate variable importance, a measurement of the drop in explained variance or prediction accuracy. Based on this preliminary analysis, we chose all variables whose importance was above 5%. Once a reduced number of covariates was selected, we generated an additional pseudoabsence dataset of 110 locations, which was run ten times with each one of the seven models, including 100 permutations for each covariate to assess their importance. We used the resulting values to generate an ensemble SDM map that weighted all the resulting 70 projected predictions for An. albimanus habitat suitability, using the ROC value from each individual model.
Evaluation strip plots were employed to visualize the probability of occurrence response curve for each covariate in the final model. The strip plots are generated by producing a prediction from a model using a new dataset in which only one variable is allowed to vary in a sequence between the minimum and maximum, while the other variables are fixed at their median values [72].
All analyses were completed using the biomod2 package [49,73] for R [74]. This package was selected for its ability to incorporate several techniques and for its reproducibility. Five folds were created with 10 repetitions, and each data partition contained approximately the same number of presence points. The BIOMOD_Modeling function was used for model generation, and a total of 280 individual models were fit for variable selection, and 70 additional models were fit to generate the SDM map. As mentioned above, models were evaluated using k-fold cross-validation, and the evaluation statistics returned were area under the curve (AUC) and the true skill statistic (TSS). The AUC statistic estimates the model’s likelihood to correctly differentiate between presence and absence locations, with a value of 0.5 suggesting that model performance is no better than random chance. The TSS statistic works similarly and is equal to the sum of model sensitivity and specificity minus one. A final ensemble model was fit to include all models with an AUC score of 0.7 or higher, and each model was weighted proportionally to its AUC score. We only consider AUC scores of 0.7 and above, as they are considered to demonstrate high model performance [75].

2.7. Applications for SDMs in the Context of Malaria Elimination

We used the resulting ensemble SDM for An. albimanus to investigate its probable presence in the productive landscapes of Costa Rica, i.e., areas with plantations of commodity crops for export. We also retrospectively evaluated if An. albimanus was likely to be present in the 2018–2019 malaria outbreak associated with open-pit gold mining in Crucitas [31].

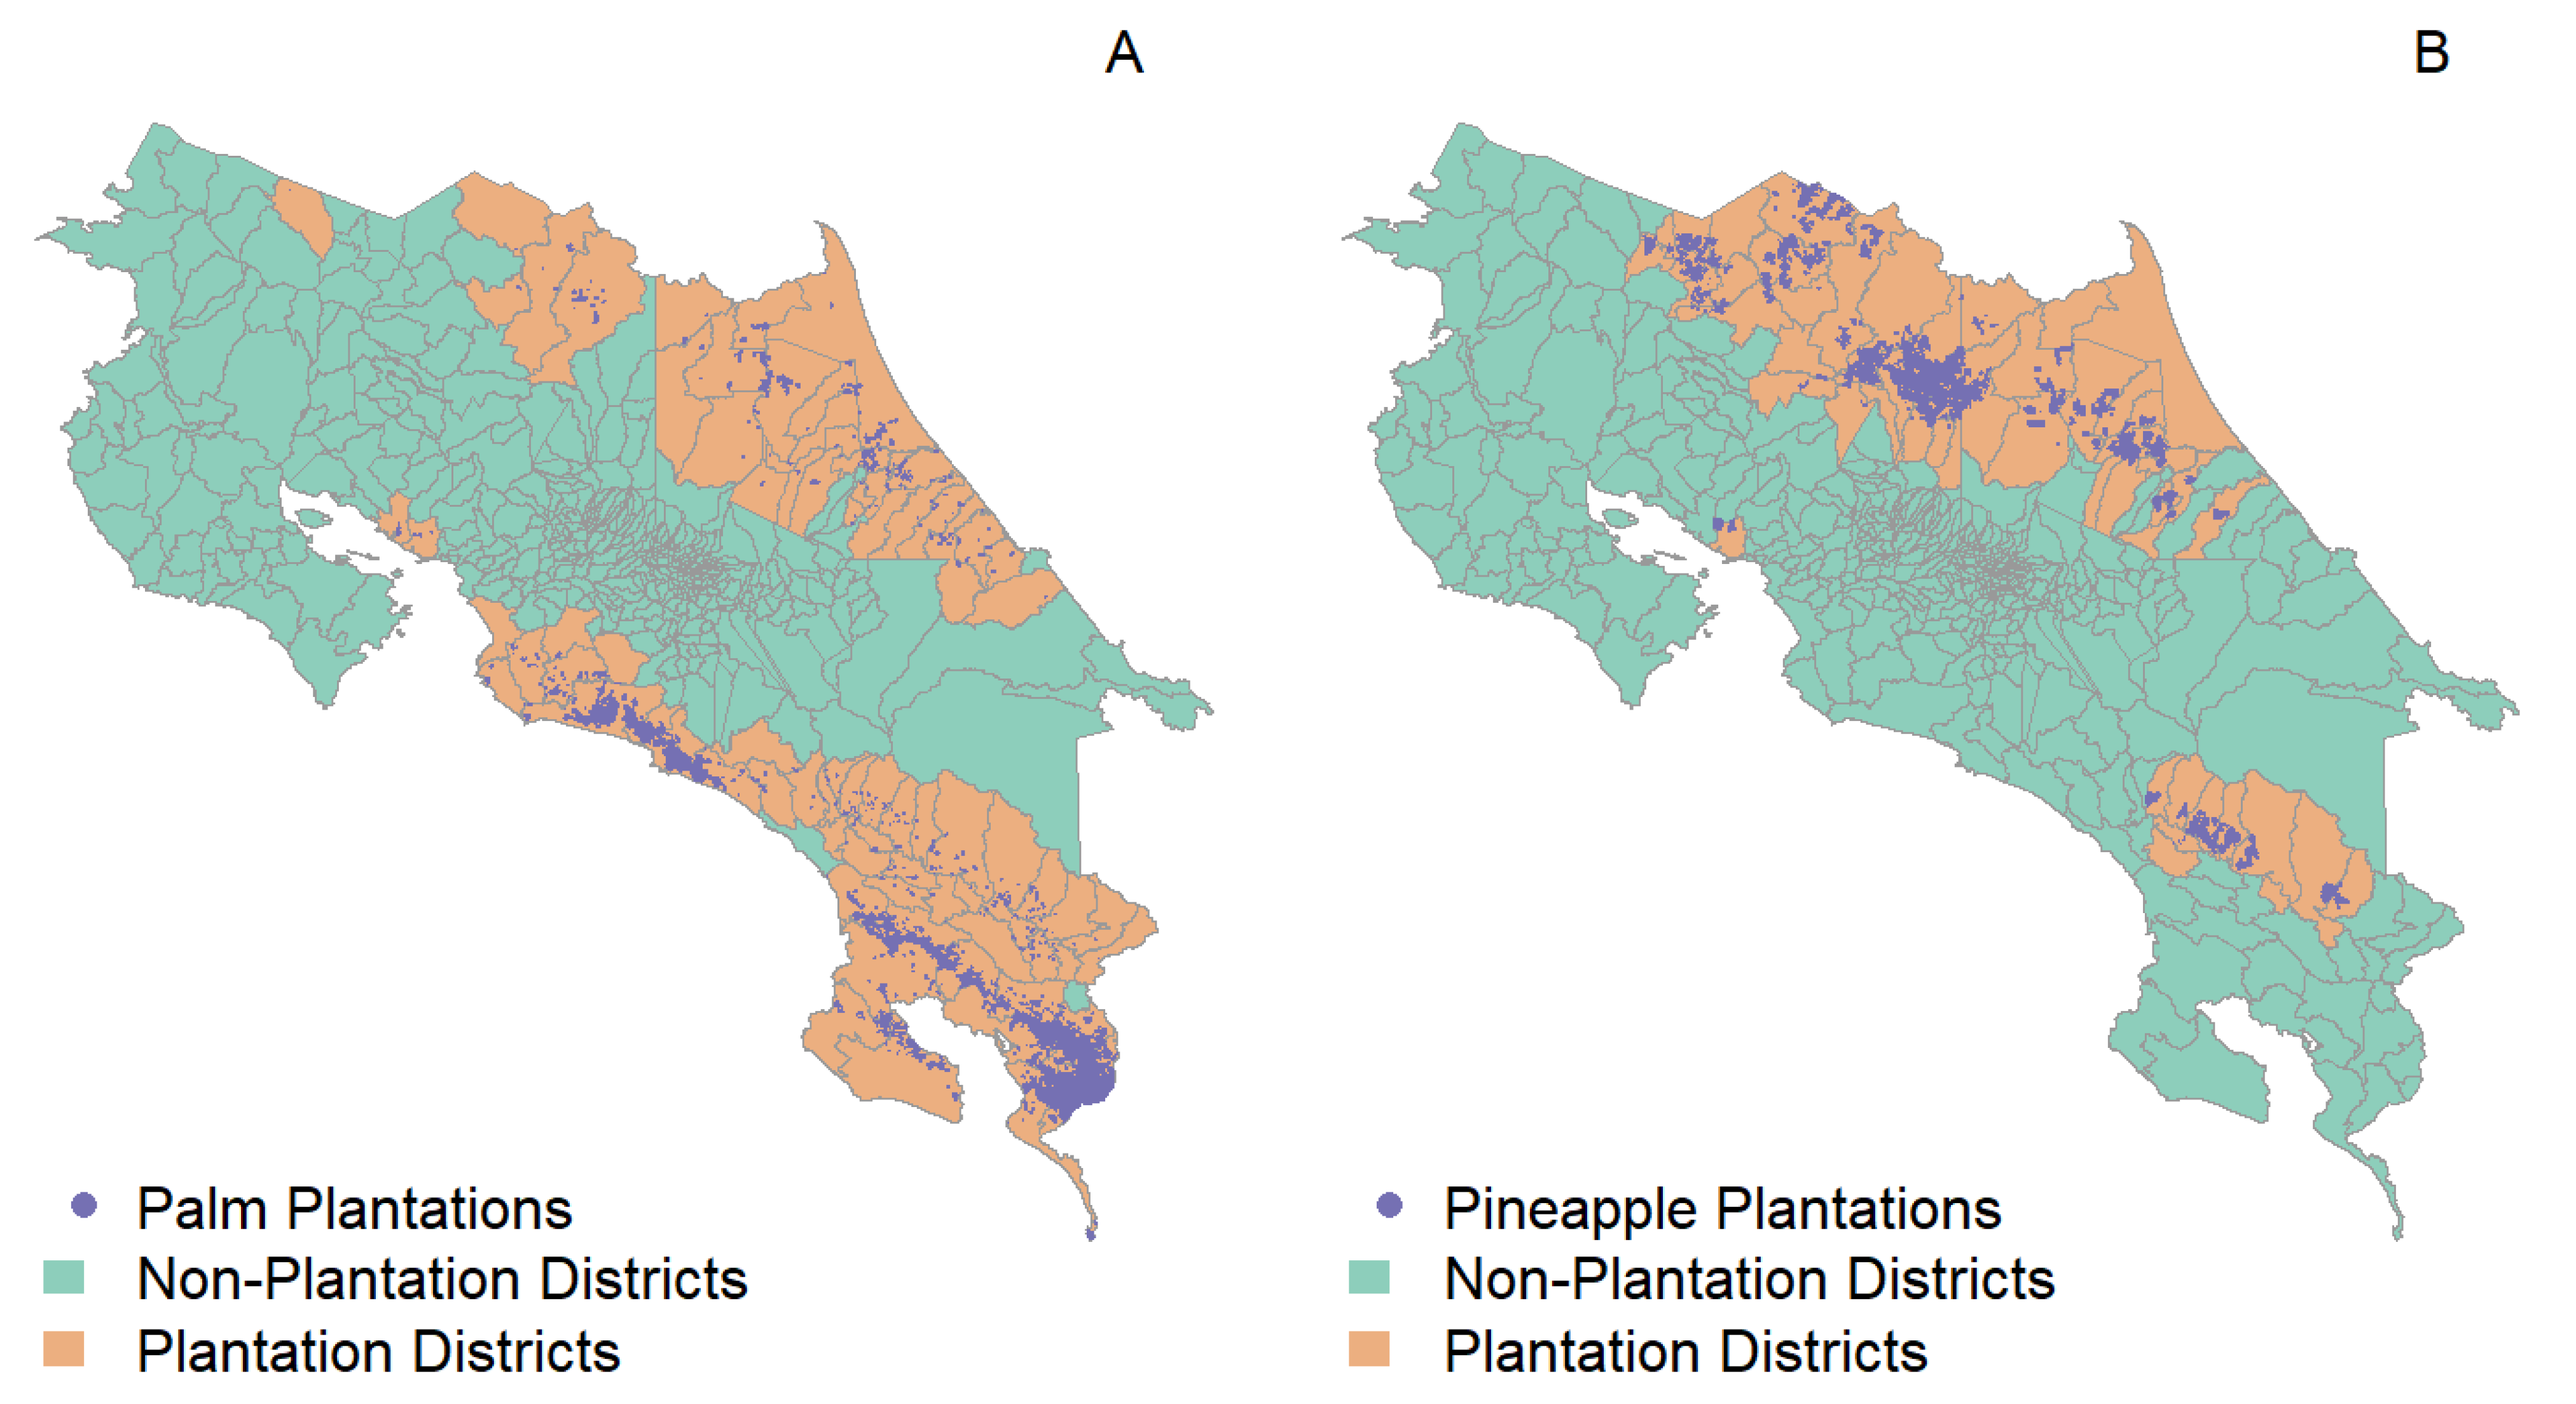
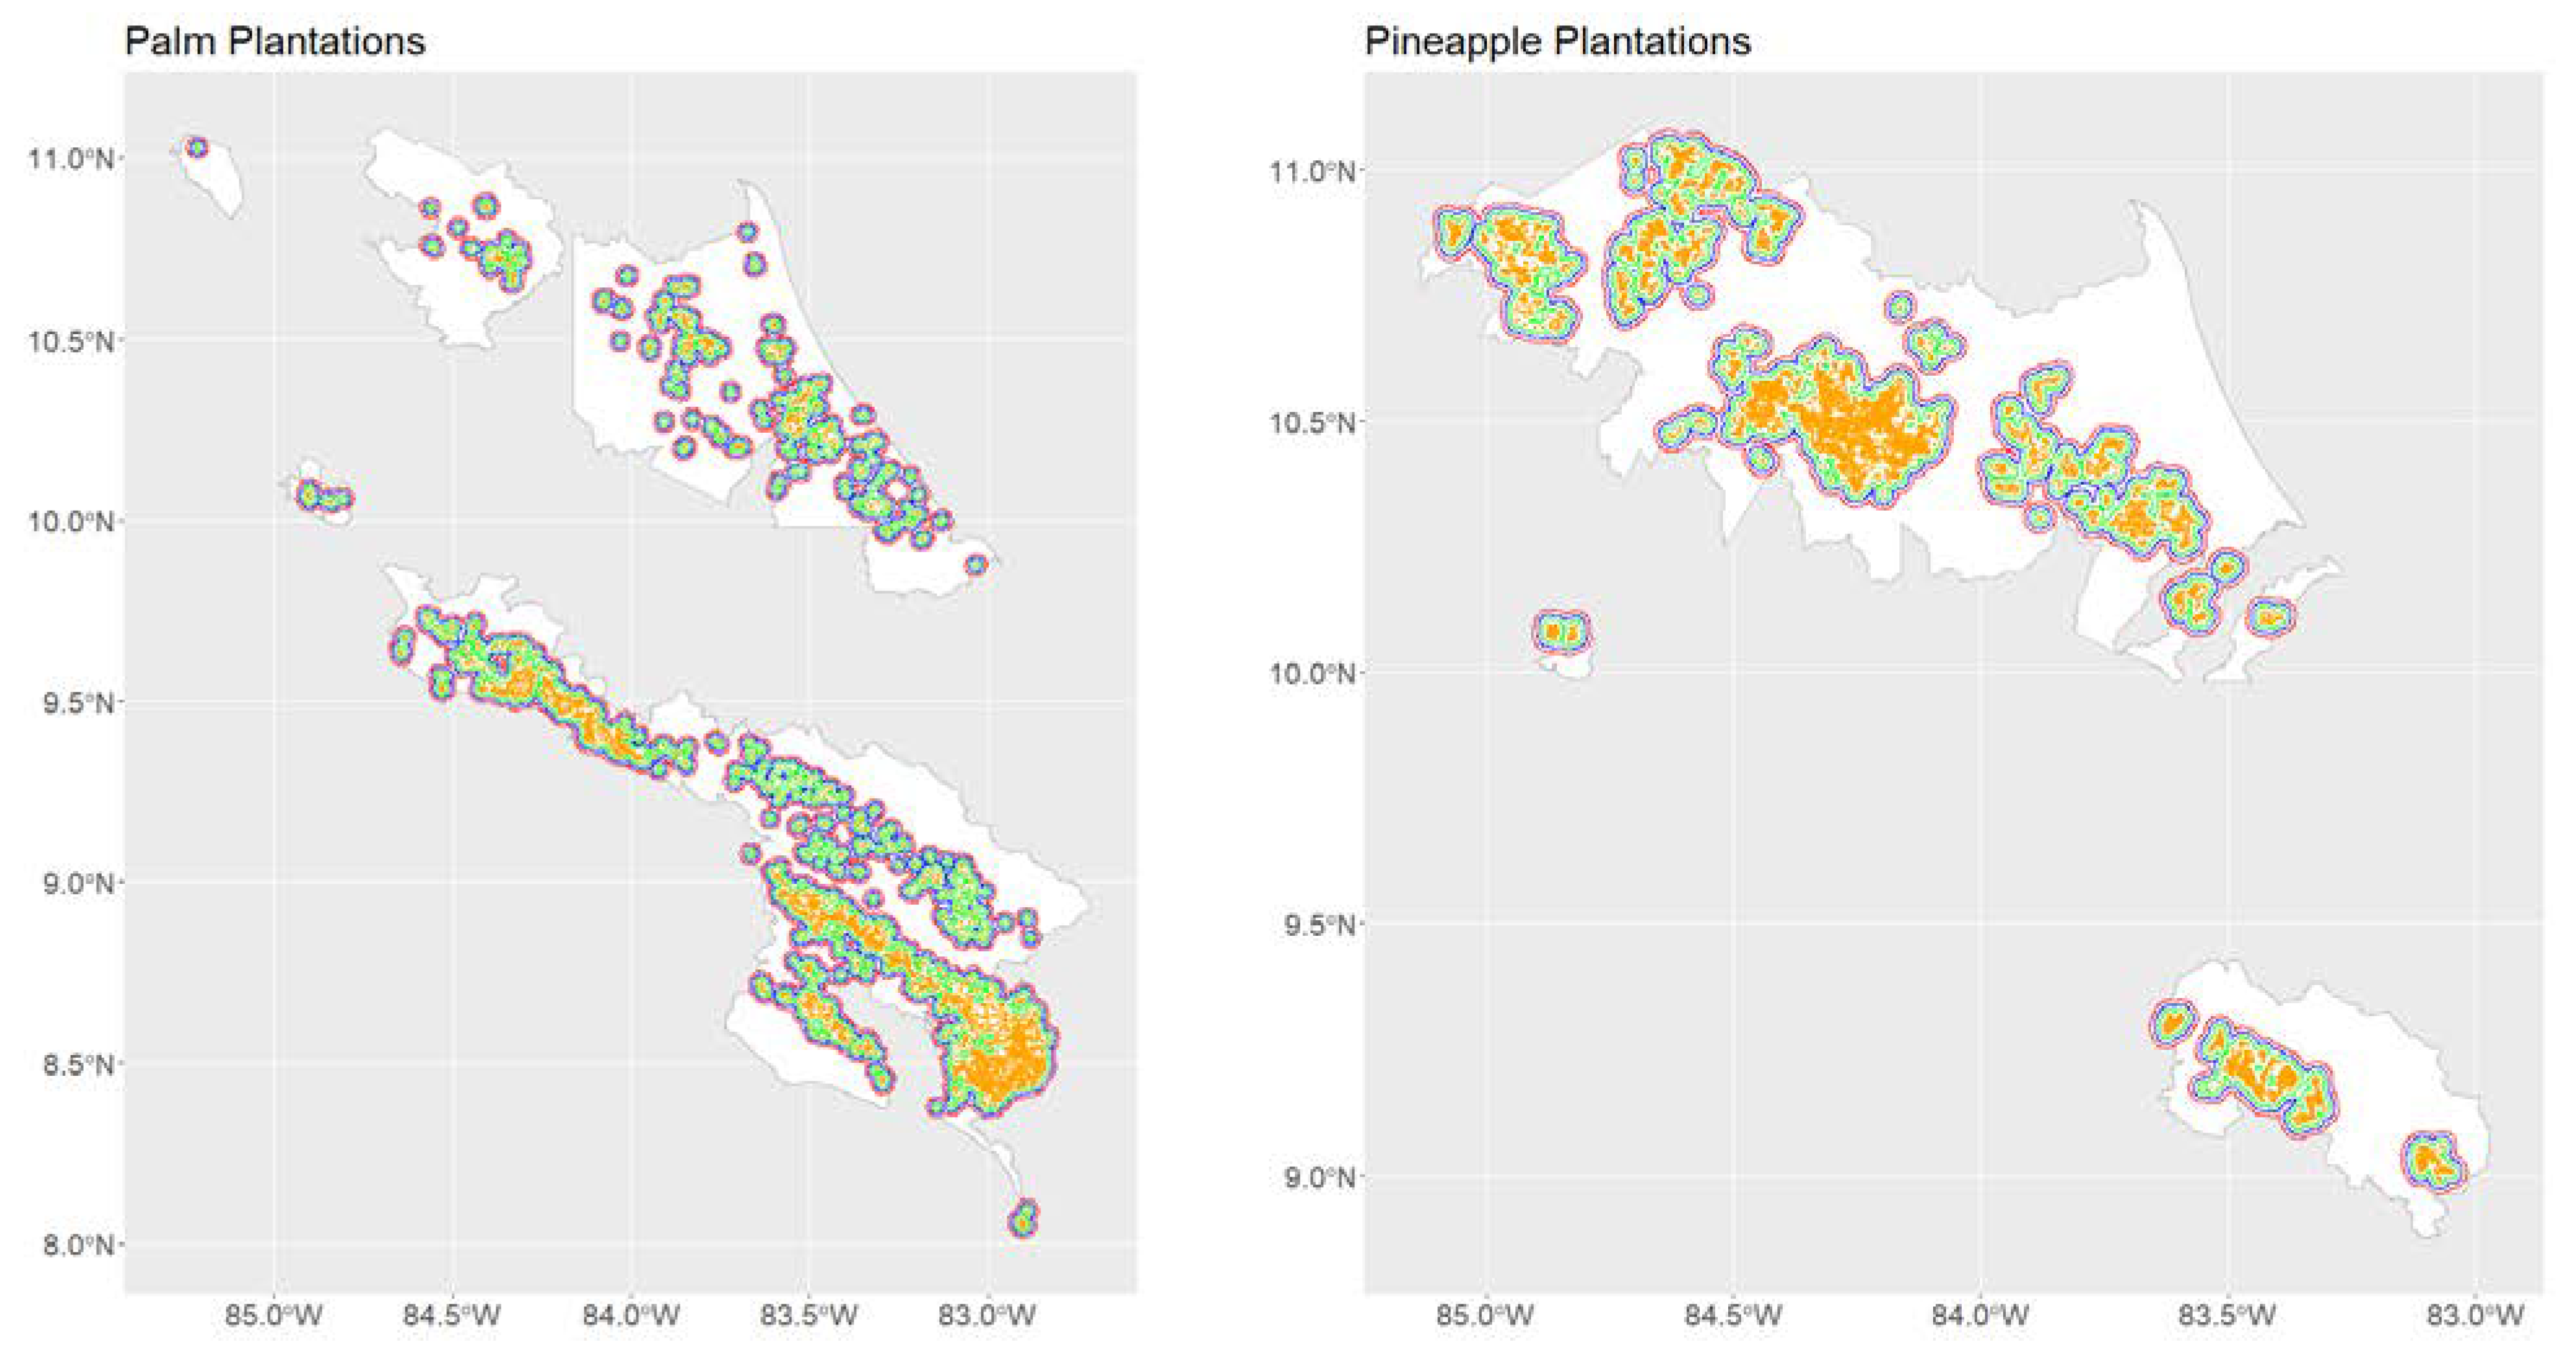
2.7.1. Background Information about Productive Landscapes in Costa Rica

In Costa Rica, oil palm has been a major commodity crop for export since the 1940s, with the country producing around 190,000 metric tons of crude oil per year [76,77]. As of 2019, Costa Rica has 73,900 hectares in oil palm plantations [78]. Another common commodity crop is pineapple. An interesting feature of pineapple plantations in Costa Rica is that their total area has been increasing in recent years, rising from approximately 13,300 ha in 2000 to 65,400 ha in 2019 [79]. This substantial shift in land use, central to the development of the northern border in the country, has occurred as pineapple has become a major commodity crop for markets in Europe and North America [80]. Currently, Costa Rica is the main global producer of pineapples, reporting revenues close to USD one billion per year [81]. Figure 2 shows the location and extent of palm oil (Figure 2A) and pineapple (Figure 2B), which are present, respectively, in 80 and 51 districts out of 487 districts in the country, according to estimates for 2019.

2.7.2. Anopheles albimanus in Productive Landscapes of Costa Rica

Oil palm plantations (Figure 2A) are common throughout Costa Rica, but have not been associated with malaria outbreaks. A major characteristic of oil palm plantations is the use of residues as compost, which is managed in a way that reduces the abundance of Anopheles spp. mosquitoes [82,83]. By contrast, a common feature of many recent malaria outbreaks in Costa Rica has been their apparent association with pineapple plantations [38]. In the context of malaria elimination, it is important to understand the entomological risk associated with the landscapes used to grow these two major commodity crops. As a proof of concept, we compared An. albimanus habitat suitability, measured as a probability, in land used for palm (Figure 2A) and pineapple (Figure 2B) plantations with that of the remaining land in the plantation districts. Based on estimates for An. albimanus dispersal, which has been recorded as occurring in distances of up to 3 km [84,85], we also compared the suitability in the plantations plus buffers of 1, 2 and 3 km with that of the remaining plantation-surrounding land in the plantation districts (Figure 3).

2.7.3. Anopheles albimanus in the Crucitas Outbreak of 2018–2019
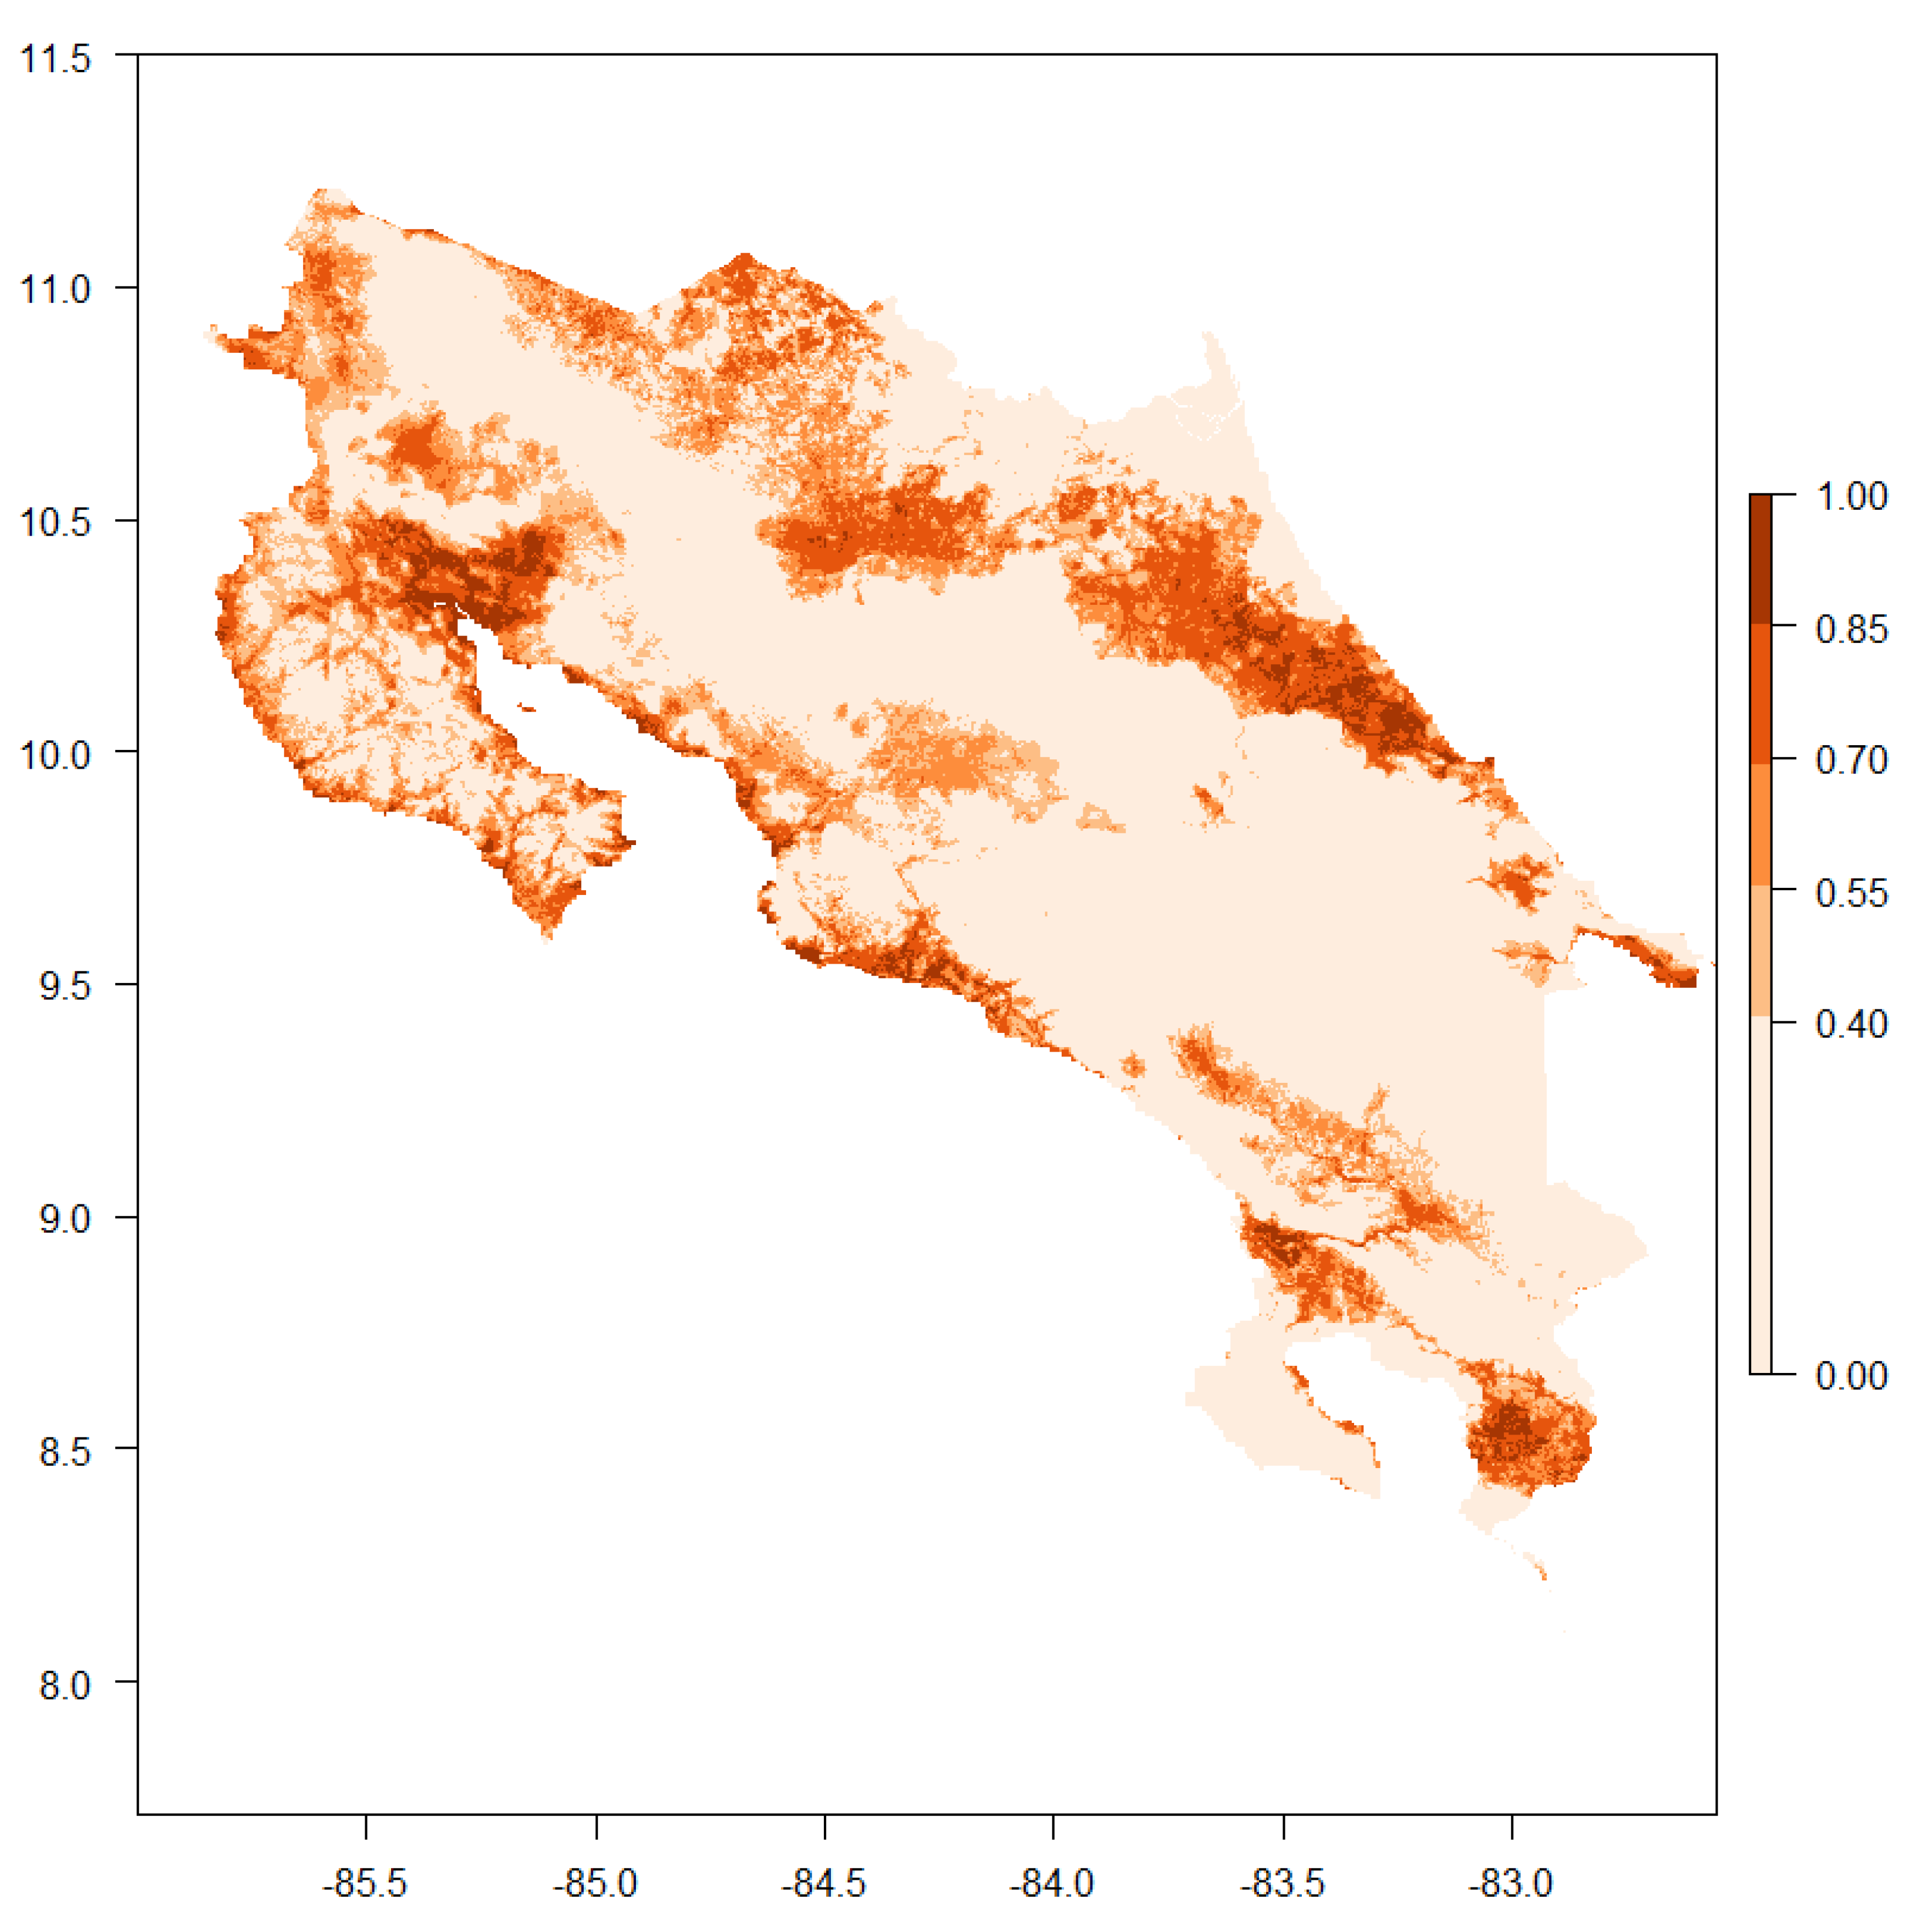
We also used the resulting An. albimanus ensemble distribution model to investigate if the 2018–2019 malaria outbreak observed in locations within the Cutris and Pocosol districts of San Carlos county (Canton San Carlos in Spanish) [31] occurred in areas with high suitability for An. albimanus. We evaluated the suitability of An. albimanus in circular areas of 3, 5 and 7 km from the population center in the Crucitas open-pit gold mine and the towns of Llano Verde and Boca Arenal.

3. Results

We obtained 227 occurrence points for An. albimanus. Following data cleaning, 110 records remained, most of which were generally located around the perimeter of Costa Rica (Figure 1). Figure 4 shows the correlations of the different covariates at the pixels with points where An. albimanus has been collected.
Pearson’s correlation matrix (Figure 4) reveals clusters of high correlations (absolute value of Pearson’s r > 0.6). Particularly for the MODIS-based temperature variables, station-based temperature, EVI and NDVI, measures of variability (kurtosis and standard deviation), as well as minimum, maximum and average values. These patterns of association called for a process of variable selection based on variable importance, whose results are presented in Figure 5. Of the twenty-eight environmental variables initially investigated, only nine were selected for inclusion in the final ensemble model. During model selection, variable importance was over 5% for only nine environmental covariates (Figure 5A). Elevation and standard deviation of NDVI were the two most important variables, being prescribed 29% and 16% variable importance, respectively. Of the nine remaining, the most important environmental covariates were elevation, minimum temperature and standard deviation of NDVI (Figure 5B). Using seven different algorithms, a total of 70 models were generated to estimate habitat suitability. AUC and TSS scores for each algorithm, reported in Table 2, indicate universally strong model performance.
RF and MAXENT demonstrated the strongest performance with AUC scores of 0.92 ± 0.04 and TSS scores of 0.76 ± 0.10. Classification and regression trees demonstrated good performance, but comparatively were the worst performing algorithm (AUC = 0.79 ± 0.07, TSS = 0.58 ± 0.13). From the 70 models created, a single final weighted ensemble model was created (Figure 6).
Habitat suitability ranged across Costa Rica from 0 to 1, with a score of 1 representing a habitat where An. albimanus should be present. There is some variation in the classification of these scores, but we consider scores ranging from 0 to 0.3 to have poor suitability, 0.3 to 0.5 to be moderately suitable, 0.5 to 0.7 to have good habitat suitability and 0.7 to 1 to be a highly suitable environment [75]. The ensemble model estimates the lowest suitability for An. albimanus to be across the central mountain range of the country, the Cordillera Central, with areas of higher suitability patchily distributed throughout the country lowlands and concentrated along the perimeter of the country (Figure 6). Areas of particularly high suitability (probability > 0.7) include a patch in the southeastern portion of the country in the Pacific basin, including regions bordering with Panamá, two strips along the southern border and a patch just below the middle of the northern border; all these patches are concentrated in the Atlantic basin of Costa Rica. The contribution of the different environmental variables in shaping the ensemble SDM for An. albimanus can be seen in Figure 7.
The probability of occurrence decreases as elevation increases, but drops dramatically once elevation exceeds 1000 m according to all the algorithms studied (Figure 7A). The probability of occurrence is not largely affected by NDVI (Figure 7B) or maximum NDVI (Figure 7C), with probabilities just decreasing for extreme large values. For most model types, a standard deviation of NDVI (Figure 7D) is negatively correlated with probability of occurrence, especially once the value is greater than 0.2. However, very little correlation is observed when the ANN and classification trees algorithms were used. Suitability only changed with population density (Figure 7E) for the L-GLM, where it decreased for extremely high densities. Rain (Figure 7F) did not have an impact on suitability for most models, the only exception being the L-GLM and MAXENT, where suitability monotonically decreased as rainfall increased. Meanwhile a non-monotonic decrease in habitat suitability was observed with ANN as rainfall increased. Roughness increases (Figure 7G) where mainly associated with a monotonic decrease in An. albimanus suitability, according to MAXENT. The kurtosis of MODIS-based land surface temperature (Figure 7H) suggests that more platykurtic environments, i.e., those with low kurtosis, increased habitat suitability for An. albimanus, with the exception of ANN and RF, which where insensitive to changes in kurtosis. Generally, minimum temperature (Figure 7I) has a positive correlation with the probability of occurrence. However, when temperatures begin to increase past 30 degrees, the correlation becomes negative. Only when these variables reach the upper values of their distribution, do we tend to see a decline in the probability of occurrence.
A comparison between the presence of plantations (Figure 2) and habitat suitability for An. albimamus (Figure 6) suggests that there is a strong relationship between the two. This correlation is further confirmed by a comparison of habitat suitability in plantations and non-plantation landscapes (Figure 8).
For both oil palm (Figure 8A–D) and pineapple plantations (Figure 8E–H), the habitat suitability is significantly greater compared to non-plantation areas in plantation districts. The addition of spatial buffers decreases the difference in habitat suitability between plantation and non-plantation landscapes, but at all spatial buffers, habitat suitability is still overwhelmingly greater around both oil palm and pineapple plantations.
When considering the relationship between habitat suitability and the 2018–2019 malaria outbreak, areas with a suitability over 0.7 are seen in the two outbreak districts examined (Figure 9A). The majority of Crucitas has low habitat suitability, but near the southwestern portion of the district, there is a small region of moderate-to-high suitability (Figure 9B). Suitability is very low, around 10% at 3km, and increases as the radius of the area considered increases from the center of the open-pit gold mine, up to 17% at 7 km (Table 3). Ranges of habitat distribution in Llano Verde are patchy (Figure 9C); however, suitability was slightly above 30% across the buffer (Table 3). Boca Arenal has the most consistently high habitat suitability (Figure 9D), with 70% suitability at 3 km, a value that slightly decreased as the buffer radius increased (Table 3).

4. Discussion

Our results suggest that mid-to-high spatial resolution SDMs could become an essential part of the toolkit used in routine vector control program operations. The first interesting feature of our ensemble model was that seven out of the nine variables employed as covariates to produce the SDMs were from remotely sensed data, which has the potential to streamline SDMs that automatically update predictions as new data become available. All the remotely sensed variables that were in the models used for the ensemble have been reported to be associated with An. albimanus presence and abundance. The most important variable was elevation, accounting for 25 to 30% of variability in the SDMs, which had a robust pattern across the different models, with all models suggesting that habitat suitability decreased as elevation increased. This pattern can reflect two things. Firstly, it reflects the known association between elevation and temperature, where the latter increases and the former decreases [20]. Secondly, it could also be related to landscape features, as lowlands have concentrations of wetlands and other habitats that are known to harbor large densities of An. albimanus [87,88,89,90]. This suggestion is also supported by the decrease in suitability with roughness for a subset of the models and increasing minimum temperature. An. albimanus population dynamics studies have shown a negative relationship between increased rainfall and abundance [34,35], which could in turn translate into those areas consistently receiving more rainfall as being less likely to be suitable for An. albimanus, as observed in the models where rainfall was an important covariate. Similarly, suitability decreases at very high NDVI values and reflects the ecology of An. albimanus, as the species prefers sunlit habitats [27,87], and similar patterns of occurrence, where the mosquito is not present in land with near-saturation NDVI values or the dense vegetation cover it is associated with, have been observed elsewhere in Mesoamerica [88,91,92,93,94,95]. Increasing population density per km2 was only associated with a decrease in suitability for L-GLM models, and this result could reflect the lack of larval habitats for An. albimanus in more urbanized landscapes, while also highlighting the importance of making SDMs with ensembles of models, since the possibility to incorporate information from different covariates increases, as they can be incorporated with different functional forms [29,73].
A novel result from our study is the association of habitat suitability with measures of higher order of variability in the environmental variables. Across most models, habitat suitability decreased as the variance of NDVI increased, suggesting that An. albimanus occurrence is associated with landscapes that are relatively stable in terms of vegetation change. However, the association with MODIS-based temperature kurtosis indicates that habitats with low kurtosis, i.e., having platykurtic distributions, are where covariates are relatively more variable towards the mean than the extremes [96,97]. A significant association with kurtosis and the SD of environmental variables illustrates how An. albimanus distribution is sensitive both to average environmental conditions and their patterns of variability, following Schmalhausen’s law [98], the ecological principle that indicates that sensitivity to different environmental variables could increase as the limits of tolerance to any environmental variable are reached, and that organisms are, therefore, sensitive to changes in the different statistical moments of environmental factors shaping their abundance and distribution [20].
The resulting ensemble SDM has an increased resolution when compared with previous efforts that have generated SDMs for the territory of Costa Rica, and ranged between 1 and 8 km [21,27,28]. This increased resolution, at 250 m, could potentially help optimize field activities by highlighting areas needing entomological surveillance. We illustrate this with the two applications that we developed in this study.
In the first application, we compared the An. albimanus habitat suitability in plantations of two major commodity crops in Costa Rica. One has been long established, as is the case for oil palms, and the other is an emerging global commodity crop, where Costa Rica is the main global producer [81], as is the case with pineapples. Interestingly, in both cases, the suitability was increased in the plantations when compared with surrounding areas in districts where plantations are located, a result robust to different assumptions about the area of influence of a plantation, assuming a maximum 3 km dispersal for An. albimanus [84]. The environmental homogenization driven by monocultures [99,100] such as oil palm and pineapple plantations provides new habitats for An. albimanus to thrive in Costa Rica’s lowlands. An open canopy for sunlit man-made irrigation habitats, ground wheel tracks created by vehicles used in commodity crop production and transportation and microclimatic conditions that could enhance mosquito reproduction and survival are a few examples of conditions that can enhance the fitness of An. albimanus in light of what we know about its life history and ecology [87]. Nevertheless, little research has been conducted into An. albimanus in oil palm and pineapple plantations as a malaria transmission risk factor.
Furthermore, some recent malaria outbreaks have been associated with pineapple plantations [30,31], and we are not aware of entomological studies in such plantations. In contrast, for oil palm plantations, a few entomological studies have shown that such plantations lead to decreases in anopheline abundance when compared with the previous vegetation type [82,83]. These studies suggest that decreases in anopheline mosquitoes might be related to water management practices that reduce the likelihood of Anopheles spp. larval habitats [82,83]. Although some ecological conditions are present for the development of An. albimanus, little malaria has been observed in the area of Costa Rica dominated by oil palm plantations, and part of that could be related to a decrease in the entomological risk of transmission. However, part of the difference could also be related to historical patterns in the social development of southwestern Costa Rica. This area, where oil palm plantations are concentrated, has historically seen low malaria transmission [32,38]. The development and settlement of oil palm plantations occurred when the Costa Rican state was engaged in the development of a social welfare state where plantation workers had access to decent housing, i.e., housing built of materials, and with characteristics, that reduce exposure to mosquito bites [32] and access to basic healthcare and other services [101], which seems privileged when compared with current working conditions at pineapple plantations in northern Costa Rica, which have been promoted by a neoliberal economic context [80] whose tendencies to impose austerity in public health investment have been associated with the emergence and re-emergence of vector-borne diseases globally [99]. This possibility is further re-enforced when looking at historical malaria patterns in Costa Rica. The disease used to be concentrated in the Caribbean basin when the United Fruit Company (UFCo) started a commodity crop economy with banana plantations [38] that imposed extremely detrimental working and living conditions for the workers, as exposed in the literary work of Carlos Luis Fallas [102] and Joaquin Gutiérrez [103], who vividly described the heavy toll of tropical diseases on plantation workers. Beyond these literary depictions, the large numbers of cases and deaths were even recorded by the UFCo itself [104]. Recent developments in social scientific theories have described this association between plantations and depauperated social, environmental and health conditions as the Plantationocene [105]. Our results suggest that incorporating the model of social and economic relations imposed by the Plantationocene might be key to understanding the differences between oil palm and pineapple plantations in terms of the generation of malaria outbreaks in Costa Rica. Beyond this study, examining the role of the Plantationocene in generating spatial patterns in diseases is an important research question to prevent the emergence of infectious diseases beyond the need of ecological research on mosquito abundance and infection in both types of plantations.
Our second application asked if habitat suitability for An. albimanus implied that this was the main vector during the 2018–2019 malaria outbreak associated with illegal open pit-gold mining in Crucitas [31]. Our results suggest that the likelihood of Anopheles albimanus being present at the mine itself was very low, with a suitability of only 10%. And this result unlikely reflects “out of date” land cover data, as we considered environmental information that overlapped with the time of the Crucitas malaria outbreak, having ourselves processed a time series of satellite-derived images that included images taken as the outbreak was happening. However, the mosquito was likely present at the two main towns also affected by the epidemic. This result highlights that as malaria cases become rarer following elimination efforts, additional secondary vector species of Anopheles could be responsible for transmission. In principle, this calls for improved entomological surveillance in the field. In that sense, we think that SDMs could be extremely useful to prioritize areas needing entomological surveillance following malaria outbreaks, especially as An. albimanus has been observed in mining areas of Colombia [24], but our model does not indicate that the Crucitas environment is suitable for its development. This notwithstanding, other vector species might be potentially present in the Crucitas open-pit gold mine, with possibilities including Anopheles vestitipennis Dyar & Knab and Anopheles punctimacula Dyar & Knab, as these species thrive in recently disturbed environments and commonly co-occur with An. albimanus in Mesoamerica [106,107]. Similarly, Anopheles darlingi Root, has been predicted to be present in the area with SDMs [108] and has been reported in Panamá [109], but has not yet been detected in Costa Rica.
Finally, this study clearly shows the advantages of developing finely grained SDMs for vectors, as they produce information that could help guide research, surveillance and control efforts for vector-borne diseases as part of efforts for more precise [110,111] public health practice.

Author Contributions

Conceptualization, C.G.R., R.M.R., L.R.B. and L.F.C.; methodology, C.G.R., J.R.L., G.L.H., L.R.B. and L.F.C.; software, M.D.F. and L.R.B.; validation, L.M.R., M.R.R. and M.P.; formal analysis, C.G.R., L.R.B. and L.F.C.; resources, M.P., C.A.R., M.R.R. and R.M.R.; data curation, J.R.L., L.M.R., J.M.G.A., G.D., O.R.S., C.A.-A., E.M., J.A.V.C., A.S.M., A.Z. and C.A.R.; writing—original draft preparation, C.G.R., J.R.L., L.M.R., L.R.B. and L.F.C.; writing—review and editing, all authors; visualization, C.G.R., M.D.F., L.R.B. and L.F.C.; supervision, R.M.R., G.L.H., L.R.B. and L.F.C.; project administration, L.F.C.; funding acquisition, L.R.B. and L.F.C. All authors have read and agreed to the published version of the manuscript.

Funding

This research was funded by Costa Rica’s Ministry of Health. Additional support came from the Canada Foundation for Innovation, WestGrid and Compute Canada. We would also like to thank the support of NASA and Goddard Space Flight Center (GSFC) Applied Science Programs. L.R.B. acknowledges funding from the Canada Research Chairs Program. C.G.R. acknowledges funding from a Texas A&M University diversity fellowship.

Institutional Review Board Statement

Not applicable.

Informed Consent Statement

Not applicable.

Data Availability Statement

All data are freely available at the following repository: doi:10.17605/OSF.IO/ACJYG.

Acknowledgments

We thank all members of the Costa Rican national vector control program that made possible this research. Paolo Ramoni-Perazzi provided valuable comments in early stages of this research. Alejandra Obando (Vigilancia de la Salud) helped with compiling the mosquito occurrence dataset. We also thank Dong L. Wu for enabling access to the NASA High-End Computing (HEC) Program through the NASA Center for Climate Simulation (NCCS) at GSFC.

Conflicts of Interest

The authors declare no conflict of interest. The funders had no role in the design of the study; in the collection, analyses, or interpretation of data; in the writing of the manuscript, or in the decision to publish the results.

References

  1. Elith, J.; Leathwick, J.R. Species distribution models: Ecological explanation and prediction across space and time. Annu. Rev. Ecol. Evol. Syst. 2009, 40, 677–697. [Google Scholar] [CrossRef]
  2. Peterson, A.T.; Soberón, J. Species distribution modeling and ecological niche modeling: Gettng the concepts right. Nat. Conserv. 2012, 10, 1–6. [Google Scholar] [CrossRef]
  3. Jiménez-Valverde, A. Insights into the area under the receiver operating characteristic curve (AUC) as a discrimination measure in species distribution modeling. Glob. Ecol. Biogeogr. 2012, 21, 498–507. [Google Scholar] [CrossRef]
  4. Mendes, P.; Velazco, S.J.E.; Alves de Andrade, A.F.; De Marco, P.J. Dealing with overprediction in species distribution models: How adding distance constraints can improve model accuracy. Ecol. Model. 2020, 431, 109180. [Google Scholar] [CrossRef]
  5. Peterson, A.T.; Soberón, J.; Sánchez-Cordero, V. Conservatism of ecological niches in evolutionary time. Science 1999, 285, 1265–1267. [Google Scholar] [CrossRef]
  6. Elith, J.; Graham, C.H.; Anderson, R.P.; Dudík, M.; Ferrier, S.; Guisan, A.; Hijmans, R.J.; Huettmann, F.; Leathwick, J.R.; Lehmann, A.; et al. Novel methods improve prediction of species’ distributions from occurrence data. Ecography 2006, 29, 129–151. [Google Scholar] [CrossRef] [Green Version]
  7. Hu, J.; Broennimann, O.; Guisan, A.; Wang, B.; Huang, Y.; Jiang, J. Niche conservatism in Gynandropaa frogs on the southeastern Qinghai-Tibetan Plateau. Sci. Rep. 2016, 6, 32624. [Google Scholar] [CrossRef] [Green Version]
  8. Mainali, K.; Hefley, T.; Ries, L.; Fagan, W.F. Matching expert range maps with species distribution model predictions. Conserv. Biol. 2020, 34, 1292–1304. [Google Scholar] [CrossRef]
  9. Syfert, M.M.; Joppa, L.; Smith, M.J.; Coomes, D.A.; Bachman, S.P.; Brummitt, N.A. Using species distribution models to inform IUCN Red List assessments. Biol. Conserv. 2014, 177, 174–184. [Google Scholar] [CrossRef]
  10. Torres, U.; Godsoe, W.; Buckley, H.L.; Parry, M.; Lusting, A.; Worner, S.P. Using niche conservatism information to prioritize hotspots of invasion by non-native freshwater invertebrates in New Zealand. Divers. Distrib. 2018, 24, 1802–1815. [Google Scholar] [CrossRef]
  11. Lavergne, S.; Evans, M.E.K.; Burfield, I.J.; Jiguet, F.; Thuiller, W. Are species’ responses to global change predicted by past niche evolution? Philos. Trans. R. Soc. B Biol. Sci. 2013, 368, 20120091. [Google Scholar] [CrossRef] [PubMed]
  12. Wiens, J.J.; Graham, C.H. Niche Conservatism: Integrating Evolution, Ecology, and Conservation Biology. Annu. Rev. Ecol. Evol. Syst. 2005, 36, 519–539. [Google Scholar] [CrossRef] [Green Version]
  13. Wiens, J.J.; Ackerly, D.D.; Allen, A.P.; Anacker, B.L.; Buckley, L.B.; Cornell, H.V.; Damschen, E.I.; Davies, T.J.; Grytnes, J.-A.; Harrison, S.P.; et al. Niche conservatism as an emerging principle in ecology and conservation biology. Ecol. Lett. 2010, 13, 1310–1324. [Google Scholar] [CrossRef] [PubMed]
  14. Peterson, A.T. Ecological niche conservatism: A time-structured review of evidence. J. Biogeogr. 2011, 38, 817–827. [Google Scholar] [CrossRef]
  15. Ross, R. The Prevention of Malaria, 2nd ed.; John Murray: London, UK, 1911. [Google Scholar]
  16. Chaves, L.F. The dialectics of malaria bednet use in sub-Saharan Africa. In The Whole Is the Truth: Essays in Honor of Richard Levins; Awerbuch, T., Clark, M.S., Taylor, P.J., Eds.; The Pumping Staiton: Arlington, MA, USA, 2018; pp. 56–80. [Google Scholar]
  17. Tene Fossog, B.; Ayala, D.; Acevedo, P.; Kengne, P.; Ngomo Abeso Mebuy, I.; Makanga, B.; Magnus, J.; Awono-Ambene, P.; Njiokou, F.; Pombi, M.; et al. Habitat segregation and ecological character displacement in cryptic African malaria mosquitoes. Evol. Appl. 2015, 8, 326–345. [Google Scholar] [CrossRef] [Green Version]
  18. White, G.B. Anopheles gambiae complex and disease transmission in Africa. Trans. R. Soc. Trop. Med. Hyg. 1974, 68, 278–301. [Google Scholar] [CrossRef]
  19. Derua, Y.A.; Alifrangis, M.; Hosea, K.M.; Meyrowitsch, D.W.; Magesa, S.M.; Pedersen, E.M.; Simonsen, P.E. Change in composition of the Anopheles gambiae complex and its possible implications for the transmission of malaria and lymphatic filariasis in north-eastern Tanzania. Malar. J. 2012, 11, 188. [Google Scholar] [CrossRef] [Green Version]
  20. Chaves, L.F.; Koenraadt, C.J.M. Climate Change and Highland Malaria: Fresh Air for a Hot Debate. Q. Rev. Biol. 2010, 85, 27–55. [Google Scholar] [CrossRef] [Green Version]
  21. Fuller, D.O.; Ahumada, M.L.; Quiñones, M.L.; Herrera, S.; Beier, J.C. Near-present and future distribution of Anopheles albimanus in Mesoamerica and the Caribbean Basin modeled with climate and topographci data. Int. J. Health Geogr. 2012, 11, 13. [Google Scholar] [CrossRef] [Green Version]
  22. Padilla, O.; Rosas, P.; Moreno, W.; Toulkeridis, T. Modeling of the ecological niches of the Anopheles spp. in Ecuador by the use of geo-informatic tools. Spat. Spatio-Temporal Epidemiol. 2017, 21, 1–11. [Google Scholar] [CrossRef]
  23. Carvalho, B.M.; Rangel, E.F.; Vale, M.M. Evaluation of the impacts of climate change on disease vectors through ecological niche modelling. Bull. Entomol. Res. 2017, 107, 419–430. [Google Scholar] [CrossRef] [PubMed] [Green Version]
  24. Montoya-Lerma, J.; Solarte, Y.A.; Giraldo-Calderon, G.I.; Quiñones, M.L.; Ruiz-López, F.; Wilkerson, R.C.; González, R. Malaria vector species in Colombia: A review. Mem. Inst. Oswaldo Cruz 2011, 106, 223–238. [Google Scholar] [CrossRef] [PubMed]
  25. Rubio-Palis, Y.; Zimmerman, R.H. Ecoregional classification of malaria vectors in the neotropics. J. Med. Entomol. 1997, 34, 499–510. [Google Scholar] [CrossRef] [PubMed]
  26. Pinault, L.L.; Hunter, F.F. New highland distribution records of multiple Anopheles species in the Ecuadorian Andes. Malar. J. 2011, 10, 236. [Google Scholar] [CrossRef] [Green Version]
  27. Sinka, M.E.; Rubio-Palis, Y.; Manguin, S.; Patil, A.P.; Temperley, W.H.; Gething, P.W.; Van Boeckel, T.; Kabaria, C.W.; Harbach, R.E.; Hay, S.I. The dominant Anopheles vectors of human malaria in the Americas: Occurrence data, distribution maps and bionomic precis. Parasites Vectors 2010, 3, 72. [Google Scholar] [CrossRef]
  28. Loaiza, J.R.; Miller, M.J. Historical and contemporary forces combine to shape patterns of genetic differentiation in two species of Mesoamerican Anopheles mosquitoes. Biol. J. Linn. Soc. 2018, 126, 146–157. [Google Scholar] [CrossRef]
  29. Pearson, R.G.; Thuiller, W.; Araújo, M.B.; Martinez-Meyer, E.; Brotons, L.; McClean, C.; Miles, L.; Segurado, P.; Dawson, T.P.; Lees, D.C. Model-based uncertainty in species range prediction. J. Biogeogr. 2006, 33, 1704–1711. [Google Scholar] [CrossRef]
  30. Marin Rodriguez, R.; Chaves, L.F. Parasite Removal for Malaria Elimination in Costa Rica. Trends Parasitol. 2019, 35, 585–588. [Google Scholar] [CrossRef]
  31. Chaves, L.F.; Huber, J.H.; Rojas Salas, O.; Ramirez Rojas, M.; Romero, L.M.; Gutierrez Alvarado, J.M.; Perkins, T.A.; Prado, M.; Rodriguez, R.M. Malaria Elimination in Costa Rica: Changes in Treatment and Mass Drug Administration. Microorganisms 2020, 8, 984. [Google Scholar] [CrossRef]
  32. Chaves, L.F.; Ramírez Rojas, M.; Delgado Jiménez, S.; Prado, M.; Marín Rodríguez, R. Housing quality improvement is associated with malaria transmission reduction in Costa Rica. Socio-Econ. Plan. Sci. 2021, 74, 100951. [Google Scholar] [CrossRef]
  33. Villalobos, J.A. El Oro Que Contemplan Los Gusanos, Que Lo Disfruten Los Humanos”. Crucitas y La Disputa Por El Desarrollo En Costa Rica. Anu. De Estud. Centroam. 2016, 42, 133–157. [Google Scholar] [CrossRef] [Green Version]
  34. Rigg, C.A.; Hurtado, L.A.; Calzada, J.E.; Chaves, L.F. Malaria infection rates in Anopheles albimanus (Diptera: Culicidae) at Ipetí-Guna, a village within a region targeted for malaria elimination in Panamá. Infect. Genet. Evol. 2019, 69, 216–223. [Google Scholar] [CrossRef] [PubMed]
  35. Hurtado, L.A.; Rigg, C.A.; Calzada, J.E.; Dutary, S.; Bernal, D.; Koo, S.I.; Chaves, L.F. Population dynamics of Anopheles albimanus (Diptera: Culicidae) at Ipetí-Guna, a willage in a region targeted for malaria elimination in Panamá. Insects 2018, 9, 164. [Google Scholar] [CrossRef] [PubMed] [Green Version]
  36. Grupo Técnico Nacional de Enfermedades Vectoriales. Plan de Eliminación de la Malaria en Costa Rica, 2015–2020; Ministerio de Salud de Costa Rica: San José, Costa Rica, 2015; p. 16. [Google Scholar]
  37. Grupo Técnico Nacional de Enfermedades Vectoriales. Norma de Malaria; Llorca, F., Ed.; Ministerio de Salud de Costa Rica: San José, Costa Rica, 2016; p. 60. [Google Scholar]
  38. Chaves, L.F.; Ramírez Rojas, M.; Prado, M.; Garcés, J.L.; Salas Peraza, D.; Marín Rodríguez, R. Health policy impacts on malaria transmission in Costa Rica. Parasitology 2020, 147, 999–1007. [Google Scholar] [CrossRef]
  39. Chaves, L.F.; Valerín Cordero, J.A.; Delgado, G.; Aguilar-Avendaño, C.; Maynes, E.; Gutiérrez Alvarado, J.M.; Rojas, M.R.; Romero, L.M.; Rodríguez, R.M. Modeling the association between Aedes aegypti ovitrap egg counts, multi-scale remotely sensed environmental data and arboviral cases at Puntarenas, Costa Rica (2017–2018). Curr. Res. Parasitol. Vector-Borne Dis. 2021, 1, 100014. [Google Scholar] [CrossRef]
  40. Loaiza, J.R.; Scott, M.E.; Bermingham, E.; Sanjur, O.I.; Rovira, J.R.; Dutari, L.C.; Linton, Y.-M.; Bickersmith, S.; Conn, J.E. Novel genetic diversity within Anopheles punctimacula s.l.: Phylogenetic discrepancy between the Barcode cytochrome c oxidase I (COI) gene and the rDNA second internal transcribed spacer (ITS2). Acta Trop. 2013, 128, 61–69. [Google Scholar] [CrossRef] [Green Version]
  41. Loaiza, J.R.; Scott, M.E.; Bermingham, E.; Sanjur, O.I.; Wilkerson, R.; Rovira, J.; Gutiérrez, L.A.; Correa, M.M.; Grijalva, M.J.; Birnberg, L.; et al. Late Pleistocene environmental changes lead to unstable demography and population divergence of Anopheles albimanus in the northern Neotropics. Mol. Phylogenet. Evol. 2010, 57, 1341–1346. [Google Scholar] [CrossRef] [Green Version]
  42. Boria, R.A.; Olson, L.E.; Goodman, S.M.; Anderson, R.P. Spatial filtering to reduce sampling bias can improve the performance of ecological niche models. Ecol. Model. 2014, 275, 73–77. [Google Scholar] [CrossRef]
  43. Aiello-Lammens, M.E.; Boria, R.A.; Radisavljevic, B.V.; Anderson, R.P.; Bjornson, R.; Weston, S. spThin: Functions for Spatial Thinning of Species Occurrence Records for Use in Ecological Models; R Package Version 0.1.0; 2014. [Google Scholar]
  44. Aiello-Lammens, M.E.; Boria, R.A.; Radosavljevic, A.; Vilela, B.; Anderson, R.P. spThin: An R package for spatial thinning of species occurrence records for use in ecological niche models. Ecography 2015, 38, 541–545. [Google Scholar] [CrossRef]
  45. Instituto Geográfico Nacional. IGN Cartografía 1:5mil: Urbano 1:5mil: Sistema Nacional de Información Territorial. 2014. Available online: https://geos.snitcr.go.cr/be/IGN_5/wfs? (accessed on 10 August 2020).
  46. USNPS. Data Sources & Accuracy for National Park Service Maps. 2020. Available online: https://www.nps.gov/hfc/carto/data-sources.cfm (accessed on 31 August 2020).
  47. Barbet-Massin, M.; Jiguet, F.; Albert, C.H.; Thuiller, W. Selecting pseudo-absences for species distribution models: How, where, and how many? Methods Ecol. Evol. 2012, 3, 327–338. [Google Scholar] [CrossRef]
  48. Monaghan, A.J.; Eisen, R.J.; Eisen, L.; Mcallister, J.; Savage, H.M.; Mutebi, J.-P.; Johansson, M.A. Consensus and uncertainty in the geographic range of Aedes aegypti and Aedes albopictus in the contiguous United States: Multi-model assessment and synthesis. PLoS Comput. Biol. 2019, 15, e1007369. [Google Scholar] [CrossRef] [PubMed]
  49. Thuiller, W.; Lafourcade, B.; Engler, R.; Araújo, M.B. Package Biomod2; 2016. [Google Scholar]
  50. Didan, K. MOD13Q1: MODIS/Terra Vegetation Indices 16-Day L3 Global 250 m SIN Grid V006 2015. Available online: https://lpdaac.usgs.gov/products/mod13q1v006/ (accessed on 8 October 2018).
  51. Zhang, X.; Friedl, M.A.; Schaaf, C.B.; Strahler, A.H.; Hodges, J.C.F.; Gao, F.; Reed, B.C.; Huete, A. Monitoring vegetation phenology using MODIS. Remote Sens. Environ. 2003, 84, 471–475. [Google Scholar] [CrossRef]
  52. Pettorelli, N.; Vik, J.O.; Mysterud, A.; Gaillard, J.-M.; Tucker, C.J.; Stenseth, N.C. Using the satellite-derived NDVI to assess ecological responses to environmental change. Trends Ecol. Evol. 2005, 20, 503–510. [Google Scholar] [CrossRef] [PubMed]
  53. Wan, Z.; Hook, S.; Hulley, G. MOD11A1 MODIS/Terra Land Surface Temperature/Emissivity Daily L3 Global 1km SIN Grid V006. 2015, Distributed by NASA EOSDIS Land Processes DAAC. Available online: https://lpdaac.usgs.gov/products/mod11a1v006/ (accessed on 29 August 2020).
  54. Shimada, M.; Itoh, T.; Motooka, T.; Watanabe, M.; Shiraishi, T.; Thapa, R.; Lucas, R. New global forest/non-forest maps from ALOS PALSAR data (2007–2010). Remote Sens. Environ. 2014, 155, 13–31. [Google Scholar] [CrossRef]
  55. Center for International Earth Science Information Network—CIESIN—Columbia University. Gridded Population of the World, Version 4 (GPWv4): Population Density Adjusted to Match 2015 Revision UN WPP Country Totals, Revision 11 Palisades, NY: NASA Socioeconomic Data and Applications Center (SEDAC). 2018. Available online: https://sedac.ciesin.columbia.edu/data/set/gpw-v4-population-density-adjusted-to-2015-unwpp-country-totals-rev11 (accessed on 10 August 2021).
  56. NASA JPL. NASADEM Merged DEM Global 1 arc Second V001. Distributed by NASA EOSDIS Land Processes DAAC. 2020. Available online: https://lpdaac.usgs.gov/products/nasadem_hgtv001/ (accessed on 10 August 2021).
  57. Google. Earth Engine Data Catalog. 2020. Available online: https://developers.google.com/earth-engine/datasets (accessed on 1 November 2020).
  58. Brunsdon, C.; Comber, L. An introduction to R for Spatial Analysis and Mapping; Sage Publications LTD: London, UK, 2015; p. 343. [Google Scholar]
  59. Parker, J.A.; Kenyon, R.V.; Troxel, D.E. Comparison of Interpolating Methods for Image Resampling. IEEE Trans. Med. Imaging 1983, 2, 31–39. [Google Scholar] [CrossRef] [PubMed]
  60. Chaves, L.F.; Moji, K. Density Dependence, Landscape, and Weather Impacts on Aquatic Aedes japonicus japonicus (Diptera: Culicidae) Abundance Along an Urban Altitudinal Gradient. J. Med. Entomol. 2018, 55, 329–341. [Google Scholar] [CrossRef]
  61. Wilson, M.F.; O’Connell, B.; Brown, C.; Guinan, J.C.; Grehan, A.J. Multiscale terrain analysis of multibeam bathymetry data for habitat mapping on the continental slope. Mar. Geod. 2007, 30, 3–35. [Google Scholar] [CrossRef] [Green Version]
  62. Instituto Meteorologico Nacional. Precipitación Anual 1960–2013: Sistema Nacional de Información Territorial. 2014. Available online: http://ceniga.go.cr/geoserver/IMN/wfs? (accessed on 10 August 2020).
  63. Instituto Meteorologico Nacional. Temperatura Media Costa Rica 1960_2013: Sistema Nacional de Información Territorial. 2014. Available online: http://ceniga.go.cr/geoserver/IMN/wfs? (accessed on 10 August 2021).
  64. Instituto Meteorologico Nacional. Temperatura Mínima Costa Rica 1960_2013: Sistema Nacional de Información Territorial. 2014. Available online: http://ceniga.go.cr/geoserver/IMN/wfs? (accessed on 10 August 2021).
  65. Instituto Meteorologico Nacional. Temperatura Máxima Costa Rica 1960_2013: Sistema Nacional de Información Territorial. 2014. Available online: http://ceniga.go.cr/geoserver/IMN/wfs? (accessed on 10 August 2021).
  66. Guisan, A.; Edwards, T.C.; Hastie, T. Generalized linear and generalized additive models in studies of species distributions: Setting the scene. Ecol. Model. 2002, 157, 89–100. [Google Scholar] [CrossRef] [Green Version]
  67. Elith, J.; Leathwick, J.R.; Hastie, T. A working guide to boosted regression trees. J. Anim. Ecol. 2008, 77, 802–813. [Google Scholar] [CrossRef]
  68. Kuhn, M.; Johnson, K. Applied Predictive Modeling; Springer: New York, NY, USA, 2013; p. 600. [Google Scholar]
  69. Olden, J.D.; Lawler, J.J.; LeRoy-Poff, N. Machine Learning Methods Without Tears: A Primer for Ecologists. Q. Rev. Biol. 2008, 83, 171–193. [Google Scholar] [CrossRef] [Green Version]
  70. Ruiz, M.O.; Chaves, L.F.; Hamer, G.L.; Sun, T.; Brown, W.M.; Walker, E.D.; Haramis, L.; Goldberg, T.L.; Kitron, U.D. Local impact of temperature and precipitation on West Nile virus infection in Culex species mosquitoes in northeast Illinois, USA. Parasites Vectors 2010, 3, 19. [Google Scholar] [CrossRef] [PubMed] [Green Version]
  71. Leathwick, J.; Elith, J.; Hastie, T. Comparative performance of generalized additive models and multivariate adaptive regression splines for statistical modelling of species distributions. Ecol. Model. 2006, 199, 188–196. [Google Scholar] [CrossRef]
  72. Elith, J.; Ferrier, S.; Huettmann, F.; Leathwick, J. The evaluation strip: A new and robust method for plotting predicted responses from species distribution models. Ecol. Model. 2005, 186, 280–289. [Google Scholar] [CrossRef]
  73. Thuiller, W. BIOMOD—A platform for ensemble forecasting of species distributions. Ecography 2009, 32, 369–373. [Google Scholar] [CrossRef]
  74. Team, R.C. R: A Language and Environment for Statistical Computing; R Foundation for Statistical Computing: Vienna, Austria, 2021. [Google Scholar]
  75. Guisan, A.; Thuiller, W.; Zimmermann, N.E. Habitat Suitability and Distribution Models: With Applications in R; Cambridge University Press: Cambridge, UK, 2017. [Google Scholar]
  76. Torres, R.; Acosta, Á.; Chinchilla, C. Proyecto comercial de compostaje de los desechos agroindustriales de la palma aceitera. Rev. Palmas 2004, 25, 377–387. [Google Scholar]
  77. Escobar, E.; Peralta, F. La industria de la palma aceitera en Costa Rica. ASD Oil Palm Pap. 2007, 31, 21–24. [Google Scholar]
  78. PRIAS. Monitoreo de Cambio de Uso en Paisajes Productivos—Palma. 2021. Available online: https://monitoreo.prias.cenat.ac.cr/geoserver/MonitoreoPalma/wfs? (accessed on 14 December 2021).
  79. PRIAS. Monitoreo de Cambio de Uso en Paisajes Productivos—Piña. 2021. Available online: https://monitoreo.prias.cenat.ac.cr/geoserver/MonitoreoPina/wfs? (accessed on 14 December 2021).
  80. León Araya, A. Desarrollo Geográfico Desigual en Costa Rica. El Ajuste Estructural Visto Desde la Región Huétar Norte (1985–2005); Editorial Universidad de Costa Rica: San Josè, Costa Rica, 2015; p. 204. [Google Scholar]
  81. CANAPEP. Estadísticas. 2021. Available online: https://canapep.com/estadisticas/ (accessed on 14 December 2021).
  82. Chang, M.; Hii, J.; Buttner, P.; Mansoor, F. Changes in abundance and behaviour of vector mosquitoes induced by land use during the development of an oil palm plantation in Sarawak. Trans. R. Soc. Trop. Med. Hyg. 1997, 91, 382–386. [Google Scholar] [CrossRef]
  83. Young, K.I.; Buenemann, M.; Vasilakis, N.; Perera, D.; Hanley, K.A. Shifts in mosquito diversity and abundance along a gradient from oil palm plantations to conterminous forests in Borneo. Ecosphere 2021, 12, e03463. [Google Scholar] [CrossRef]
  84. Hobbs, J.; Lowe, R.; Schreck, C. Studies of flight range and survival of Anopheles albimanus Wiedemann in El Salvador. I. Dispersal and survival during the dry season. Mosq. News 1974, 34, 389–393. [Google Scholar]
  85. Lowe, R.E.; Schreck, C.; Hobbs, J.; Dame, D.; Lofgren, C. Studies on flight range and survival of Anopheles albimanus Wiedemann in El Salvador. II. Comparisons of release methods with sterile and normal adults in wet and dry seasons. Mosq. News 1975, 35, 160–168. [Google Scholar]
  86. Welch, B.L. The generalization of Student’s problem when several different population variances are involved. Biometrika 1947, 34, 28–35. [Google Scholar] [CrossRef] [PubMed]
  87. Machado-Allison, C.; Bown, D.N.; Nelson, M. Biología y ecología de Anopheles albimanus Wiedemann en Centroamérica. Bol. Oficina Sanit. Panam. 1996, 121, 189–220. [Google Scholar]
  88. Grieco, J.P.; Johnson, S.; Achee, N.L.; Masuoka, P.; Pope, K.; Rejmankova, E.; Vanzie, E.; Andre, R.; Roberts, D. Distribution of Anopheles albimanus, Anopheles vestitipennis, and Anopheles crucians associated with land use in northern Belize. J. Med. Entomol. 2006, 43, 614–622. [Google Scholar] [CrossRef] [PubMed]
  89. Vargas, M. Algunas observaciones sobre los hábitos de Anopheles (N.) albimanus y Anopheles (A.) punctimacula adultos, en la localidad de Matapalo (Puntarenas) Costa Rica. Rev. De Biol. Trop. 1961, 9, 153–170. [Google Scholar]
  90. Vargas, V.M.; Vargas, C.J.V. Male and mosquito larvae survey at the Arenal-Tempisque irrigation project, Guanacaste, Costa Rica. Rev. Biol. Trop. 2003, 51, 759–762. [Google Scholar]
  91. Rejmankova, E.; Roberts, D.; Harbach, R.; Pecor, J.; Peyton, E.; Manguin, S.; Krieg, R.; Polanco, J.; Legters, L. Environmental and regional determinants of Anopheles (Diptera: Culicidae) larval distribution in Belize, Central America. Environ. Entomol. 1993, 22, 978–992. [Google Scholar] [CrossRef] [Green Version]
  92. Rejmankova, E.; Savage, H.; Rejmanek, M.; Arredondo-Jimenez, J.; Roberts, D. Multivariate analysis of relationships between habitats, environmental factors and occurrence of anopheline mosquito larvae Anopheles albimanus and A. pseudopunctipennis in southern Chiapas, Mexico. J. Appl. Ecol. 1991, 28, 827–841. [Google Scholar] [CrossRef]
  93. Rejmankova, E.; Savage, H.; Rodriguez, M.; Roberts, D.; Rejmanek, M. Aquatic vegetation as a basis for classification of Anopheles albimanus Weideman (Diptera: Culicidae) larval habitats. Environ. Entomol. 1992, 21, 598–603. [Google Scholar] [CrossRef]
  94. Rodriguez, A.D.; Rodriguez, M.H.; Hernandez, J.E.; Dister, S.W.; Beck, L.R.; Rejmankova, E.; Roberts, D.R. Landscape surrounding human settlements and Anopheles albimanus (Diptera: Culicidae) abundance in Southern Chiapas, Mexico. J. Med. Entomol. 1996, 33, 39–48. [Google Scholar] [CrossRef]
  95. Hernandez, J.E.; Epstein, L.D.; Rodriguez, M.H.; Rodriguez, A.D.; Rejmankova, E.; Roberts, D.R. Use of generalized regression tree models to characterize vegetation favoring Anopheles albimanus breeding. J. Am. Mosq. Control Assoc. 1997, 13, 28–34. [Google Scholar]
  96. Chaves, L.F.; Friberg, M.D. Aedes albopictus and Aedes flavopictus (Diptera: Culicidae) pre-imaginal abundance patterns are associated with different environmental factors along an altitudinal gradient. Curr. Res. Insect Sci. 2021, 1, 100001. [Google Scholar] [CrossRef]
  97. Chaves, L.F.; Morrison, A.C.; Kitron, U.D.; Scott, T.W. Nonlinear impacts of climatic variability on the density-dependent regulation of an insect vector of disease. Glob. Change Biol. 2012, 18, 457–468. [Google Scholar] [CrossRef]
  98. Chaves, L.F. Climate change and the biology of insect vectors of human pathogens. In Invertebrates and Global Climate Change; Johnson, S., Jones, H., Eds.; Wiley: Chichester, UK, 2017; pp. 126–147. [Google Scholar]
  99. Wallace, R.; Chaves, L.F.; Bergmann, L.; Ayres Lopes, C.f.J.; Hogerwerf, L.; Kock, R.; Wallace, R.G. Clear-Cutting Disease Control: Capital-Led Deforestation, Public Health Austerity, and Vector-Borne Infection; Springer: New York, NY, USA, 2018; 72p. [Google Scholar]
  100. Wallace, R.G.; Bergmann, L.; Kock, R.; Gilbert, M.; Hogerwerf, L.; Wallace, R.; Holmberg, M. The dawn of Structural One Health: A new science tracking disease emergence along circuits of capital. Soc. Sci. Med. 2015, 129, 68–77. [Google Scholar] [CrossRef]
  101. Palmer, S. From Popular Medicine to Medical Populism: Doctors, Healers, and Public Power in Costa Rica, 1800–1940; Duke University Press Books: Durham, NC, USA, 2003; p. 352. [Google Scholar]
  102. Fallas, C.L. Mamita Yunai; Edit: San José, Costa Rica, 2013. [Google Scholar]
  103. Gutiérrez, J. Puerto Limón; Edit: San José, Costa Rica, 1977. [Google Scholar]
  104. Aliano, D. Curing the Ills of Central America: The United Fruit Company´s Medical Department and Corporate America´s Mission to Civilize (1900–1940). Estud. Interdiscip. Am. Lat. Y Caribe 2006, 17, 35–60. [Google Scholar]
  105. Wolford, W. The Plantationocene: A Lusotropical Contribution to the Theory. Ann. Am. Assoc. Geogr. 2021, 111, 1622–1639. [Google Scholar] [CrossRef]
  106. Pinault, L.L.; Hunter, F.F. Characterization of Larval Habitats of Anopheles albimanus, Anopheles pseudopunctipennis, Anopheles punctimacula, and Anopheles oswaldoi s.l. Populations in Lowland and Highland Ecuador. J. Vector Ecol. 2012, 37, 124–136. [Google Scholar] [CrossRef]
  107. Loyola, E.G.; Arredondo, J.I.; Rodríguez, M.H.; Brown, D.N.; Vaca-Marin, M.A. Anopheles vestitipennis, the probable vector of Plasmodium vivax in the Lacandon forest of Chiapas, México. Trans. R. Soc. Trop. Med. Hyg. 1991, 85, 171–174. [Google Scholar] [CrossRef]
  108. Hiwat, H.; Bretas, G. Ecology of Anopheles darlingi Root with respect to vector importance: A review. Parasites Vectors 2011, 4, 177. [Google Scholar] [CrossRef] [Green Version]
  109. Loaiza, J.; Scott, M.; Bermingham, E.; Rovira, J.; Sanjur, O.; Conn, J.E. Anopheles darlingi (Diptera: Culicidae) in Panama. Am. J. Trop. Med. Hyg. 2009, 81, 23–26. [Google Scholar] [CrossRef] [Green Version]
  110. Ramaswami, R.; Bayer, R.; Galea, S. Precision medicine from a public health perspective. Annu. Rev. Public Health 2018, 39, 153–168. [Google Scholar] [CrossRef] [Green Version]
  111. Galea, S.; Abdalla, S.M. Precision medicine approaches and the health of populations: Study design concerns and considerations. Persp. Biol. Med. 2018, 61, 527–536. [Google Scholar] [CrossRef] [PubMed]
Figure 1. Map showing the distribution of Anopheles albimanus record locations; divisions indicate the districts of Costa Rica. The inset histogram shows the distribution of elevations from locations where An. albimanus has been sampled. The inset legend indicates symbols and color coding for the presence of An. albimanus. The vector file for the districts of Costa Rica is from Costa Rica’s National Geographical Institute [45]. The map used a public domain map from the US National Park Service as its base [46]. An. albimanus has been recorded in all seven provinces of Costa Rica, in 28 out of 83 counties and in 55 out of 487 districts.
Insects 13 00221 g001
Figure 2. Major plantation landscapes of Costa Rica for (A) oil palm and (B) pineapple. In both panels, the inset legends indicate the location of the plantations, and districts are colored according to the presence of plantations. Estimates are for 2019 and based on estimates from the PRIAS lab at the Centro Nacional de Alta Tecnología, CENAT [78,79].
Insects 13 00221 g002
Figure 3. Plantation districts (in white) and plantations (in orange), and the different spatial buffers, 1 km (yellow), 2 km (blue) and 3 km (red), used for comparing Anopheles albimanus habitat suitability between plantations and surrounding land in plantation districts. As indicated by the inset titles, the left panel shows the spatial buffers for oil palm plantations, and the right panel shows those for pineapple plantations.
Insects 13 00221 g003
Figure 4. Pairwise Pearson’s correlation between environmental variables at the occurrence points for Anopheles albimanus in Costa Rica. Correlations have been clustered to ease the visualization of groups of highly correlated variables.
Insects 13 00221 g004
Figure 5. Variable importance in species distribution models of Anopheles albimanus (A) used for model selection (the dashed line indicates the 5% importance threshold) and (B) in the models used for the final ensemble prediction.
Insects 13 00221 g005
Figure 6. Ensemble distribution model for Anopheles albimanus in Costa Rica. Color indicates habitat suitability measured as a probability from 0 to 1 as presented in the legend; the Y axis is the latitude, and the X axis is the longitude. The AUC (mean ± SD) for this ensemble model was 0.983 ± 0.001 and the TSS (mean ± SD) was 0.833 ± 0.007, outperforming all individual models presented in Table 2. These raster results are available at https://osf.io/acjyg/.
Insects 13 00221 g006
Figure 7. Strip plots of the predicted probability of Anopheles albimanus occurrence as function of the covariates considered in the ensemble of best models. In the plots, each line represents the mean for the replicated runs of each model. Model methodologies are color-coded (see bottom of the figure). Covariates included (A) elevation, (B) NDVI, (C) maximum NDVI, (D) SD of NDVI, (E) population density per km2, (F) rainfall measured in mm, (G) landscape roughness, (H) MODIS-based temperature kurtosis and (I) MODIS-based minimum temperature in °C.
Insects 13 00221 g007
Figure 8. Boxplots comparing Anopheles albimanus habitat suitability in plantations and non-plantation landscapes from plantation districts for oil palms (A) without a spatial buffer, t = 170.01, df = 13,879, p-value < 2.2 × 10⁻¹⁶, (B) with a 1 km spatial buffer, t = 200.54, df = 99,252, p-value < 2.2 × 10⁻¹⁶, (C) with a 2 km spatial buffer, t = 204.02, df = 209,115, p-value < 2.2 × 10⁻¹⁶ and (D) with a 3 km spatial buffer, t = 210.34, df = 298,572, p-value < 2.2 × 10⁻¹⁶; and for pineapples (E) without a spatial buffer, t = 177.12, df = 14,391, p-value < 2.2 × 10⁻¹⁶, (F) with a 1 km spatial buffer, t = 242.18, df = 107,952, p-value < 2.2 × 10⁻¹⁶, (G) with a 2 km spatial buffer, t = 262.72, df = 172,789, p-value < 2.2 × 10⁻¹⁶ and (H) with a 3 km spatial buffer, t = 278.23, df = 208,638, p-value < 2.2 × 10⁻¹⁶. In all panels, the boxplots show the median for the distribution of pixel values, while the boxes represent the 25th and 75th percentiles of the data. For each boxplot comparison, we report t values for two-sample Welch’s t tests, a statistic used to compare means between two groups, in this case plantation vs. non-plantation pixels. We chose Welch’s t test for the comparison because it accounts for heterogeneous variances in the compared groups [86].
Insects 13 00221 g008
Figure 9. Ensemble distribution model for Anopheles albimanus in (A) Cutris and Pocosol districts, where symbols indicate the locations associated with the 2018–2019 Crucitas malaria outbreak (for details, refer to the inset legend), and in (B) Crucitas, (C) Llano Verde and (D) Boca Arenal. In all panels, color indicates habitat suitability quantified by probabilities from 0 to 1, as presented in the legend of panel (A). In all panels, the Y axis is the latitude and the X axis is the longitude. In all panels, each pixel is a 250 m square, and in panels B, C and D, the circular areas have a 7 km radius.
Insects 13 00221 g009
Table 1. Environmental covariates considered for Anopheles albimanus species distribution modeling in Costa Rica. * Geological feature, ** vector files.
CovariateRaster Original Spatial Resolution (Covariate Units)Frequency (Period Sampled)Derived Layers (Abbreviation)
MODIS—Enhanced Vegetation Index (EVI)250 m (Adimensional Ratio)16 days
(2000-02-24 to
2019-12-31)
Standard Deviation, SD (EVSD)
Kurtosis (EVIK)
Maximum (EVMA)
Minimum (EVMI)
Median (EVI)
MODIS—Normalized Difference Vegetation Index (NDVI)250 m (Adimensional Ratio)16 days
(2000-02-24 to
2019-12-31)
SD (NVSD)
Kurtosis (NVIK)
Maximum (NVMA)
Minimum (NVMI)
Median (NDVI)
MODIS—Land Surface Temperature1000 m (° Kelvin)Daily
(2000-02-24 to
2019-12-31)
SD (TSDM)
Kurtosis (TKM)
Maximum (TMAM)
Minimum (TMIM)
Range (TRM)
Median (TMM)
PALSAR—Forest/Non-Forest 25 m (1 = Forest, 2 = Non-forest, 3 = Water)Annual (2007–2019) Mode (PFC)
SD (PFSD)
Kurtosis (PFK)
NASA—Digital Elevation Model30 m (Meters Above Sea Level)2000 s *Elevation (ELEV)
Aspect (ASP)
Roughness (ROUG)
Slope (SLOP)
GPWv4—Population Density1000 m (Population Density)2015Population Density (POPD)
INM—Rainfall1:5000 (mm) **Annual average based on daily records (1963-01-01 2013-12-31)Rainfall (RAIN)
INM—Temperature 1:5000 (°C) **Annual average based on daily records (1963-01-01 2013-12-31)Mean (TMS)
Minimum (TMIS)
Maximum (TMAS)
Table 2. Mean area under curve (AUC) and true skill statistic (TSS) values, with standard deviation (±SD), based on the 10 model repetitions per algorithm that were used to build the ensemble distribution model for Anopheles albimanus in Costa Rica. Abbreviations: L-GLM, logistic generalized linear model; MARS, multiple adaptive regression spline; CAT, classification and regression trees; RF, random forest; GBM, generalized boosting model; ANN, artificial neural networks; MAXENT, maximum entropy.
AlgorithmAUCTSS
L-GLM0.91 ± 0.050.75 ± 0.11
MARS0.89 ± 0.040.68 ± 0.09
CAT0.79 ± 0.070.58 ± 0.13
RF0.92 ± 0.040.76 ± 0.10
GBM0.91 ± 0.050.72 ± 0.10
ANN0.85 ± 0.070.63 ± 0.12
MAXENT0.92 ± 0.040.76 ± 0.10
Table 3. Anopheles albimanus mean habitat suitability (HS) probability around the three locations of the 2018–2019 malaria outbreak associated with illegal open-pit gold mining in Crucitas, Costa Rica.
LocationSpatial Buffer Radius (HS Mean ± S.D.)
3 km5 km7 km
Crucitas0.10 ± 0.040.12 ± 0.090.17 ± 0.15
Llano Verde0.33 ± 0.180.33 ± 0.190.31 ± 0.19
Boca Arenal0.70 ± 0.050.69 ± 0.060.67 ± 0.09
Publisher’s Note: MDPI stays neutral with regard to jurisdictional claims in published maps and institutional affiliations.

