
Production of Ti–1.5Al–1Mn Titanium Alloy Butt Joints by Friction Stir Welding
by
 , , and
Alexander Eliseev
* ,
,
Alihan Amirov
*,
Tatyana Kalashnikova
*,
Andrey Vorontsov
* and
Evgeny Kolubaev
* Institute of Strength Physics and Materials Science of the Siberian, Branch of the Russian Academy of Sciences, pr. Akademicheskii, 2/4, 634055 Tomsk, Russia
*
Authors to whom correspondence should be addressed.
Metals 2021, 11(10), 1566; https://0-doi-org.brum.beds.ac.uk/10.3390/met11101566
Submission received: 20 August 2021
/
Revised: 24 September 2021
/
Accepted: 27 September 2021
/
Published: 30 September 2021
(This article belongs to the Special Issue Light Metals and Their Composites)
Abstract
:A focus towards industrial energy efficiency explains the current interest in light and high-strength materials and welding and processing technologies. Among the latest popular materials are titanium alloys, which are difficult to process and weld. The problem of joining can be solved by friction stir welding. In the present paper, the mechanical properties and structure of a friction stir welded Ti–1.5Al–1Mn titanium alloy were studied. Alloy behavior in friction stir welding is poorly known; therefore, special attention was paid to the welding process—process modes, torque, and axial force. For the first time, Ti–1.5Al–1Mn joints with 92% of their base metal strength were produced by friction stir welding. Additionally, the important role of the axial load in welding was demonstrated. Axial load increases adhesion and mass transfer. A tool made of ZhS32 nickel heat-resistant superalloy received low wear after 1.5 m of welding. A layer with coarse grains was first found in the subsurface of the stir zone—this layer results from repeated recrystallization behind the tool due to the thermal effect of the shoulders and the low thermal conductivity of the material.
1. Introduction
Since Kroll patented a simple magnesium–thermal method of reduction of metallic titanium from its tetrachloride in 1940 [1], titanium alloys have been widely used in production. Now they are used in the aerospace, military, chemical, medical, and shipbuilding industries. This is due to a number of useful properties, such as corrosion and heat resistance, high specific strength, and biocompatibility. Titanium alloys are classified into high-strength (consisting of β phases), medium-strength (consisting of α + β phases), and highly ductile alloys (containing only α and sometimes α’ phases).
The latter group is easily deformable and refers to alloys that are workable despite their relatively low strength. For example, the nominal ultimate tensile strength of the Ti–1.5Al–1Mn alloy used in this work is about 590 MPa, while the known α + β Ti–6Al–4V alloy and commercially pure titanium have, respectively, tensile strengths of 950 and 450 MPa [2]. These alloys (α + α’) are intended mainly for the production of sheets, thin-walled pipes, profiles, and other semi-finished products. The main feature of the Ti–1.5Al–1Mn alloy is easy deformability, which facilitates structure production. In addition, the alloy is not thermally hardened, which also facilitates production. A special feature of this group of alloys is a relatively low constant content of the β stabilizer (manganese). The required strength is achieved by changing the aluminum content, which greatly simplifies blending and disposal of waste [3].
The Ti–1.5Al–1Mn alloy has been used in both civil aircrafts, and in the military field for body armor and cruising missiles [4]. However, titanium alloys have a number of disadvantages, including active chemical interactions, grain growth, and phase transformations at high temperatures, which present difficulties for production processes—for example, during fusion welding. Electron beam welding and laser welding are usually used for titanium alloy welding. In the first case, a vacuum is required, which makes it difficult to weld large sheets. Electron-beam welding leads to grain growth and requires heat treatment, as shown on a similar near-α titanium alloy [4]. Additionally, high residual stresses were found in α + β alloys after welding [5]. Laser welding also causes grain growth and requires heat treatment; this is shown in the Ti–6Al–4V alloy [6]. In addition to grain growth, laser welding leads to the formation of a heat-affected zone in commercially pure titanium [7]. FSW can avoid these disadvantages, although it also has its disadvantages; nevertheless, the interest in FSW titanium has grown a lot in recent years, judging by the number of publications. A separate problem is the production of aluminum–titanium and titanium–steel bimetals, as their welding results in brittle intermetallic compounds [8,9]. This problem can be solved by employing solid-phase methods, among which is friction stir welding (FSW). This is a well-established, highly efficient welding technology that allows production of high-quality and high-performance welds and holds great industrial promise. During FSW, no metal melting occurs, so the method is free of the disadvantages of fusion welding: high residual stresses, grain growth, gas pores, and shrinkage. This method is often employed for soft metals, such as aluminum, magnesium, and copper alloys, but it has limited application to titanium alloys or steels due to the high requirements imposed on the welding tool [10,11]. Thus, in FSW of titanium, the weld metal is heated up to a temperature of 1200 °C [12], and the tool experiences high axial loads up to 4 t. Adhesive friction under such conditions at a velocity of 1 m/s leads to the rapid destruction of the tool. For example, a tungsten carbide tool is significantly worn out after only 10 cm of welding [13]. Advances in tool manufacturing over the past few years stimulated an interest in friction stir welding of titanium, making the problem of tool wear of current interest. Given harsh operating conditions, FSW tools are typically made of refractory materials, including alloys based on tungsten, cobalt, molybdenum, and polycrystalline boron nitride [14]. Each of these materials has both advantages and disadvantages; for example, Su et al. [15] showed that a W–1.1% La2O3 tool can produce Ti–6Al–4V titanium alloy welds with a strength no less than that of the base material. However, according to another work of these authors the tool receives critical wear after a weld length of 43 mm [16]. Tools from durable tungsten alloys doped with rhenium allow production of high-quality joints [17], but they are extremely expensive and difficult to manufacture. Therefore, the search for the optimum material continues. In a recent study [18], a heat-resistant ZhS6U alloy based on nickel was suggested as a tool material. This alloy has been successfully employed in the production of turbine blades operating at elevated temperatures and mechanical loads since the 1960s. It was also used to weld TiNi alloys [19]. The welding experiments on the Ti–1.5Al–1Mn alloy showed that tools made of this alloy can endure high temperatures and loads [4], though the resulting joints were of low quality. All weld joints had defects, since the welding mode was selected based on the modes obtained previously for commercially pure titanium. Welding of Ti–1.5Al–1Mn alloy requires the axial load to be increased and the rotation rate to be decreased to fall into the window of acceptable parameters. This may be due to adhesion conditions. A change in the friction velocity and axial load changes both the friction coefficient and heat input, as well as adhesion, which is responsible for mass transfer during friction. For example, a model experiment on “pin-on-disk” friction revealed a window of parameters for mass transfer [20]. The aim of this paper is to choose suitable process parameters for producing high-quality welds in Ti–1.5Al–1Mn alloys and to investigate their mechanical properties and structure.
2. Experimental Procedure
2.1. Materials and Experimental Set-Up
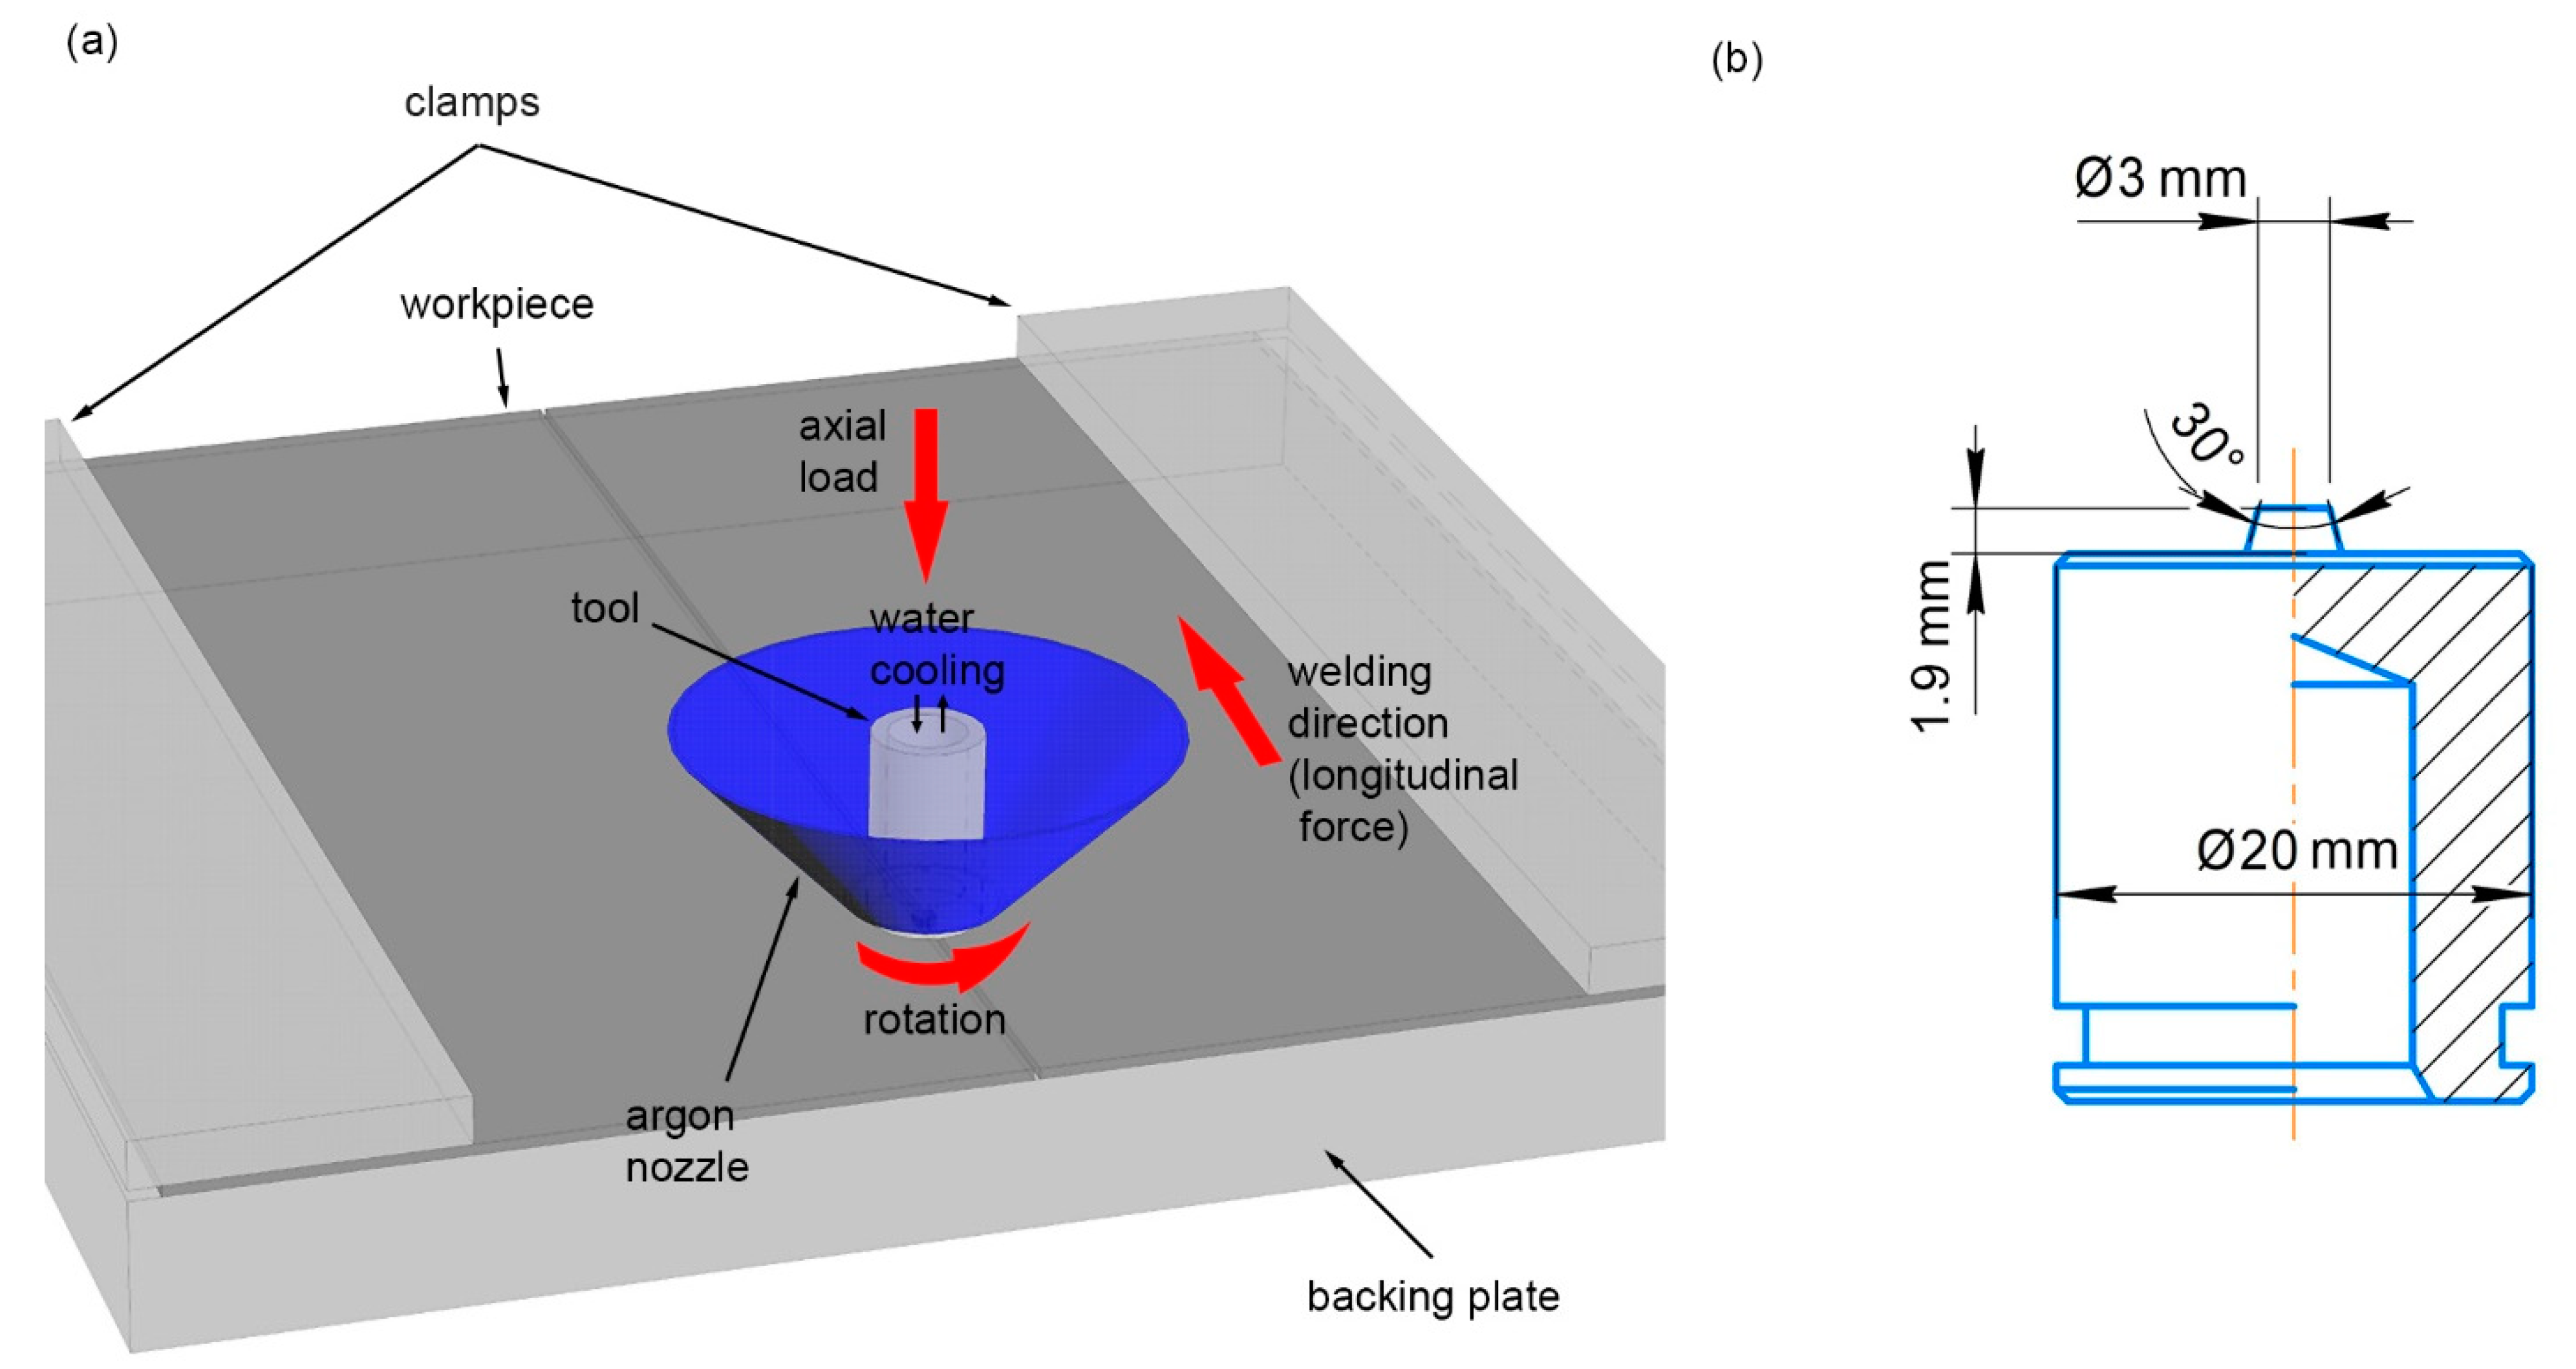
Friction stir welding of Ti–1.5Al–1Mn titanium alloy 2 mm-thick plates was carried out on butt workpieces. The commercial alloy was shipped in a rolled condition. The melting point of the alloy is about 1670 °C. This alloy was chosen because it has not been investigated in the context of FSW. The alloy has no analogues in ASTM standards. A similar Japanese ST–A90 alloy is known. The tool was made of as-cast ZhS32 nickel superalloy (Ni–4.5Cr-5.5Al–1Mo–8W–9Co-4Re–4Ta–1.5Nb–CB). This alloy was used for the first time in friction stir welding. It is similar to the ZhS6U alloy in terms of characteristics and structure but is more durable at high temperatures. Thus, the alloy was chosen with the expectation of achieving greater durability of the tool. The diameter of the tool shoulders was 20 mm, the pin height was 1.8 mm, the tip diameter of the conical pin was 3 mm, and the cone angle was 30°. Welding was carried out in an argon atmosphere at a flow rate 4 L/min to prevent the titanium alloy from oxidating. The process of welding was accompanied by internal water cooling of the tool. The coolant flow rate was 2.5 L/min. The choice of welding process parameters was based on visual defects, and current values of torque and force along the OX axis aligned with the processing direction. Visual defects bore witness to underheating or overheating, and instability of torque and longitudinal force during welding pointed to an unbalanced mode of friction stir welding. The torque and longitudinal force were controlled by a welding unit. Temperature during friction stir welding was evaluated with a FLIR A665SC thermal imaging camera (FLIR Systems Inc., Wilsonville, OR, USA). Figure 1 presents a friction stir friction welding diagram and tool diagram.
Process parameters of friction stir welding are given in Table 1. Thermal and mechanical effects were controlled via rotation rate ω (from 400–1000 RPM), feed rate (from 90–160 mm/min), and axial load P (from 1000–2800 kg). This set of modes allowed tracing of the influence of each parameter on the welding process.
2.2. Methods of Testing
An electrical discharge machine was used to cut test specimens from the weld joints. Tensile and three-point bending tests were performed using a UTC 110M-100 testing machine (Test systems, Ivanovo, Russia) at room temperature at a rate of 1 mm/s and 5 mm/min, respectively. The bending tests were carried out with the root turned upward to identify incomplete penetration. Fatigue tests were carried out using a BiSS UTM-100 testing machine (Bangalore Integrated System Solutions (P) Ltd., Bangalore, India) at a frequency of 20 Hz and at 60% stress of the ultimate strength of the base metal. For each welding mode, at least 3 samples were tested for each type of test. All mechanical test specimens were cut across the weld. Microhardness of the specimens was measured using a Duramin5 microhardness tester (Struers, Ballerup, Denmark) at an indentation load of 100 g and a time of 10 s. The microhardness was measured using the Vickers method.
Macro- and microstructural analysis was performed on cross sections of the weld ground with 2000 grit abrasive paper and polished with diamond paste. The polished surface was chemically etched for 30 s in a reagent with the following composition: 30 mL C3H8O3, 10 mL HNO3, and 10 mL HF. The structure of the specimens was viewed through an Altami MET-1C metallographic microscope (Altami, St Petersburg, Russia) and a Microtrac SM3000 scanning electron microscope (Nikkiso Co. Ltd., Tokyo, Japan).
3. Results and Discussion
3.1. Influence of Process Parameters on the Welding Process
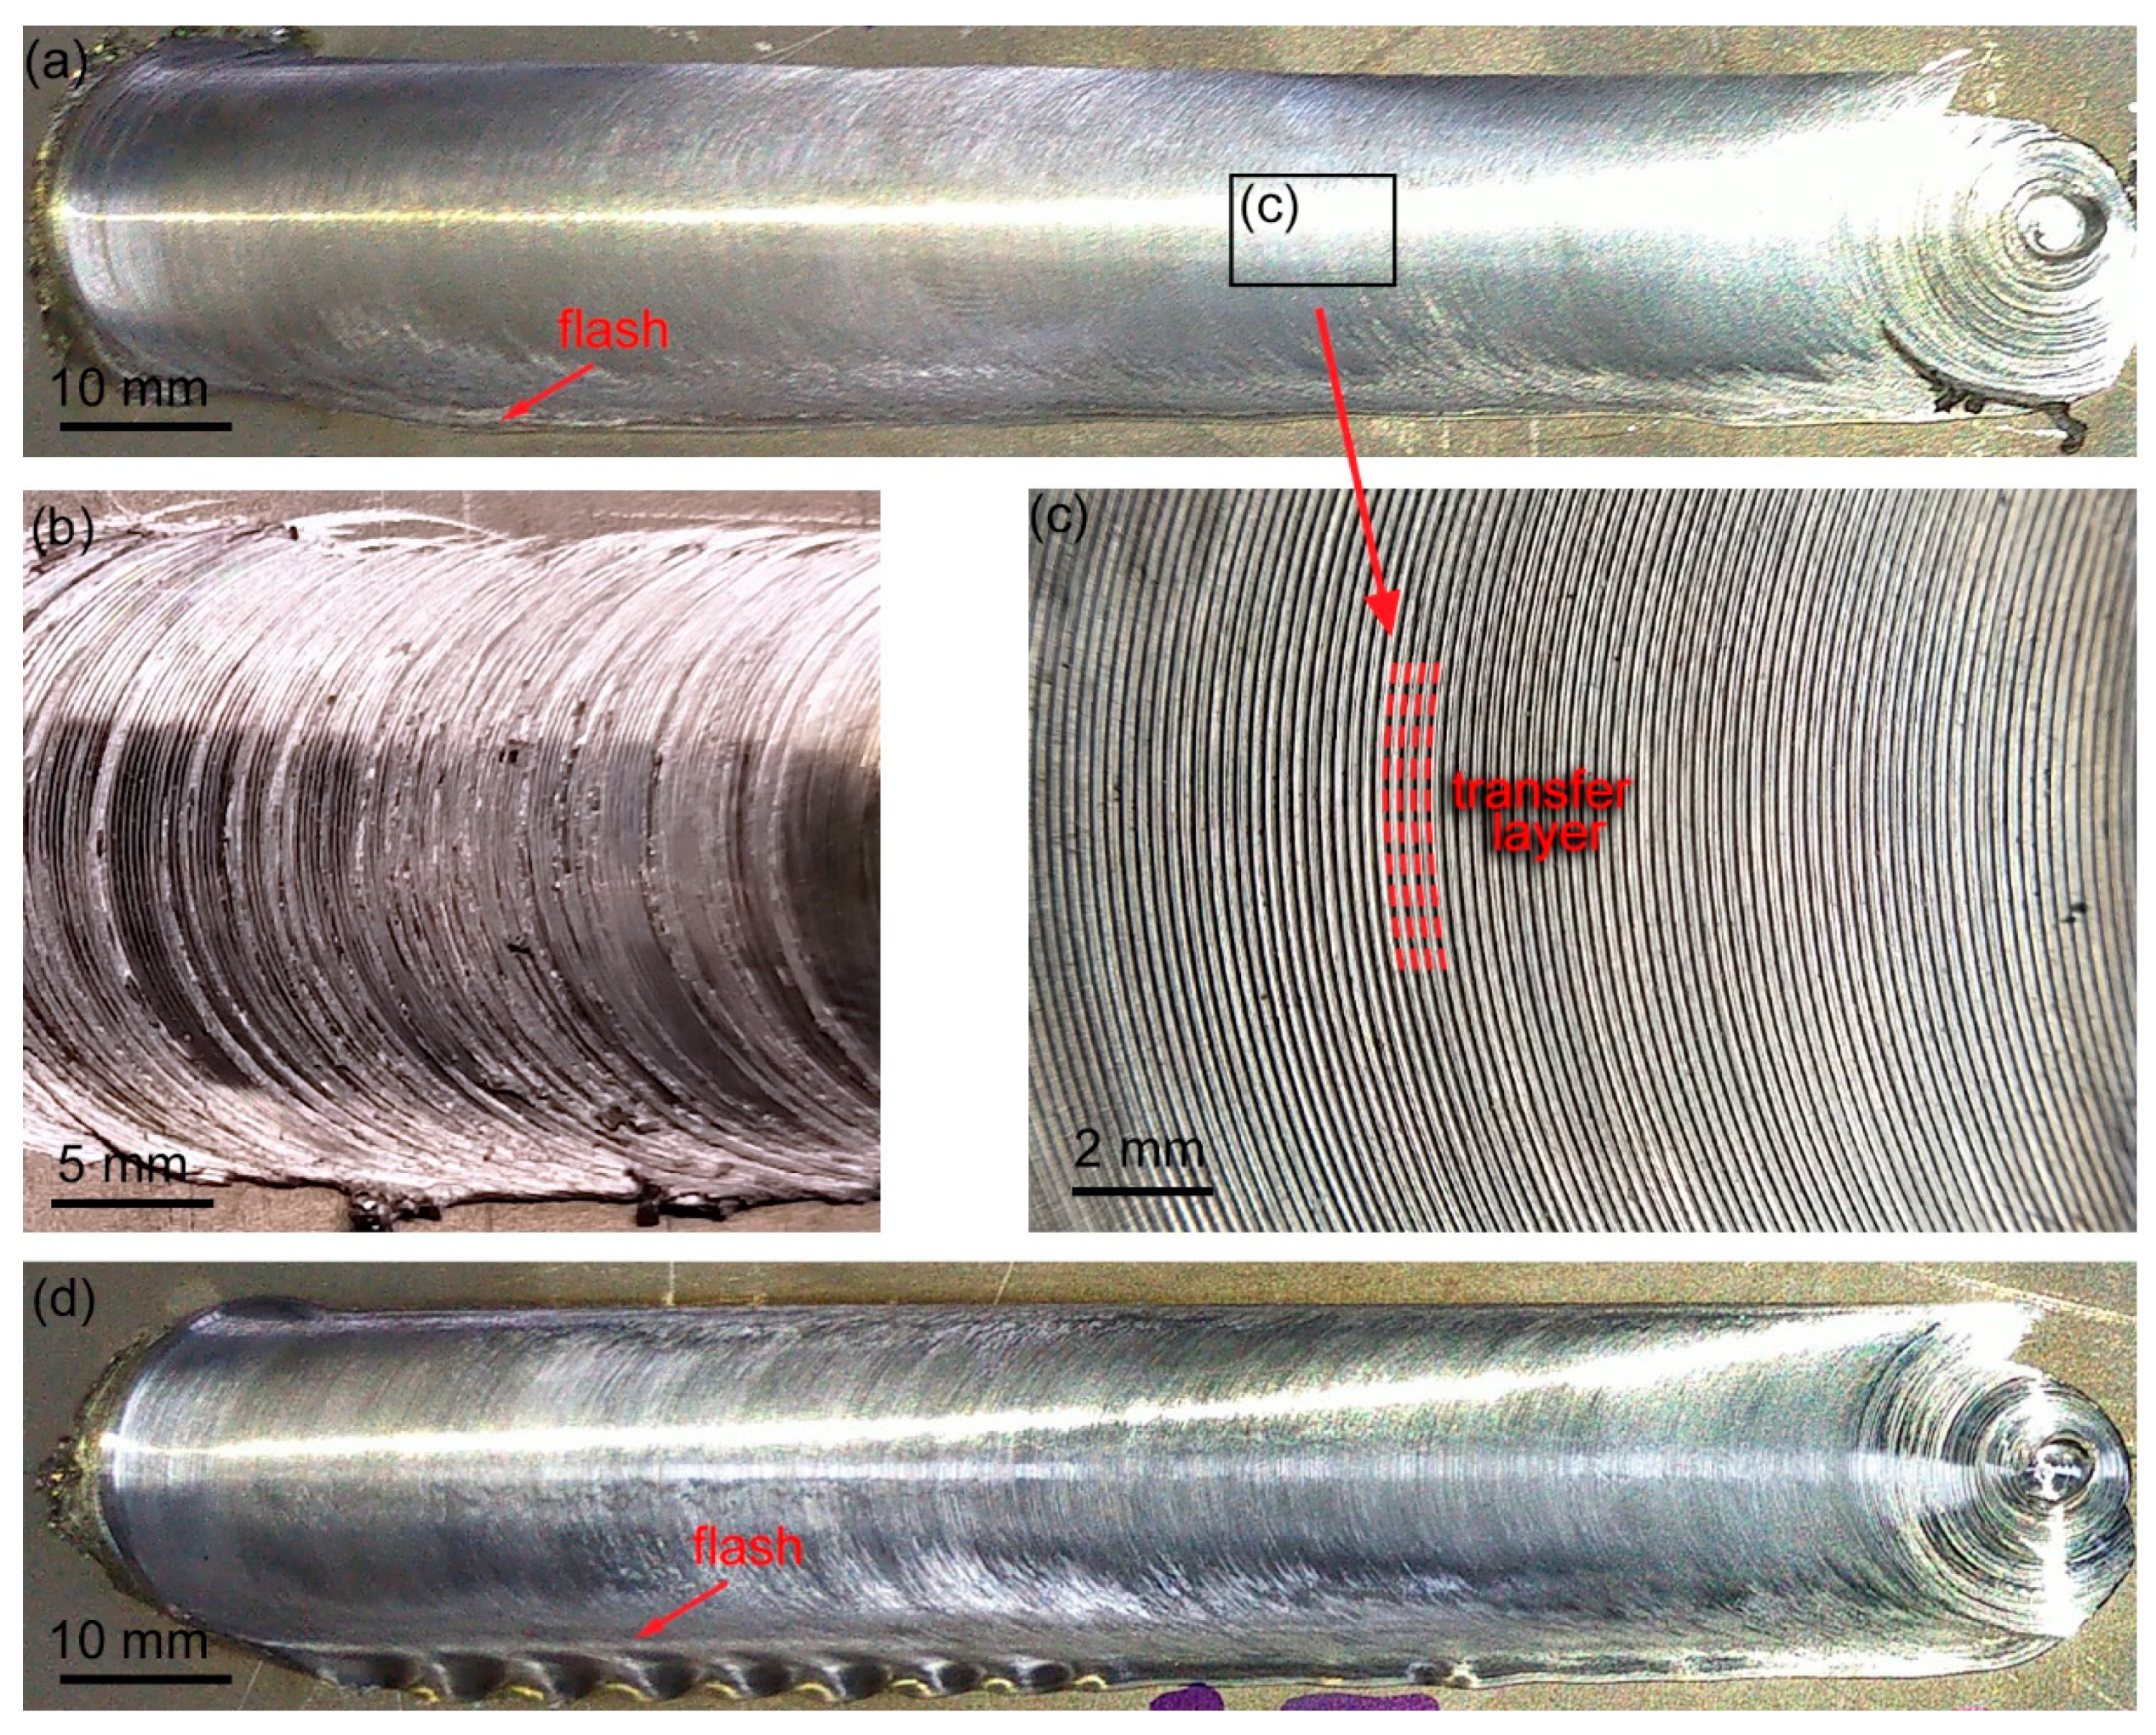
The first criterion in finding the welding parameters is the appearance of the welds. The weld should not contain visible defects, such as surface grooves and excessive flash. Both of these defects reduce the cross-section of the weld and its strength. The top surface of the weld should be relatively flat. Because welding is performed layer by layer, transfer layers are formed on the top surface in the form of adjacent arcs. These layers should be clearly distinguishable and have periodicity; for example, Figure 2a shows the appearance of weld no.8 without significant visible defects. On the top surface of this weld, a periodic morphology of the transfer layers could be distinguished (Figure 2c). Figure 2b shows the appearance of weld no.5, which had a highly irregular surface. All the produced joints did not contain surface grooves. Visually, a decrease in weld thickness and flashes were detected (Figure 2a). Figure 2d shows the appearance of sample no.4; this sample was characterized by an excessive flash. Both defects were, as a rule, interdependent since a part of the weld material was extruded and formed flashes. A higher load improved the appearance of the joints—the front surface appeared smoother. A further increase in the load led to flashing. The increased rotation rate resulted in a smoother surface but decreased torque, which is indicative of weaker adhesion and overheating, and was accompanied by flashing. An increase in the feed rate had little effect on the external quality of the joints but led to a gradual growth in torque and longitudinal force. In addition, these characteristics became less stable during the welding process, though their stability was an important criterion of the joint quality at the stage of rough selection of the mode. Based on the appearance as well as force and torque characteristics, mode no.4, no.8, no.9, no.12 and no.13 joints were chosen for further study. These joints had an acceptable appearance and the most stable characteristics of torque and longitudinal force.
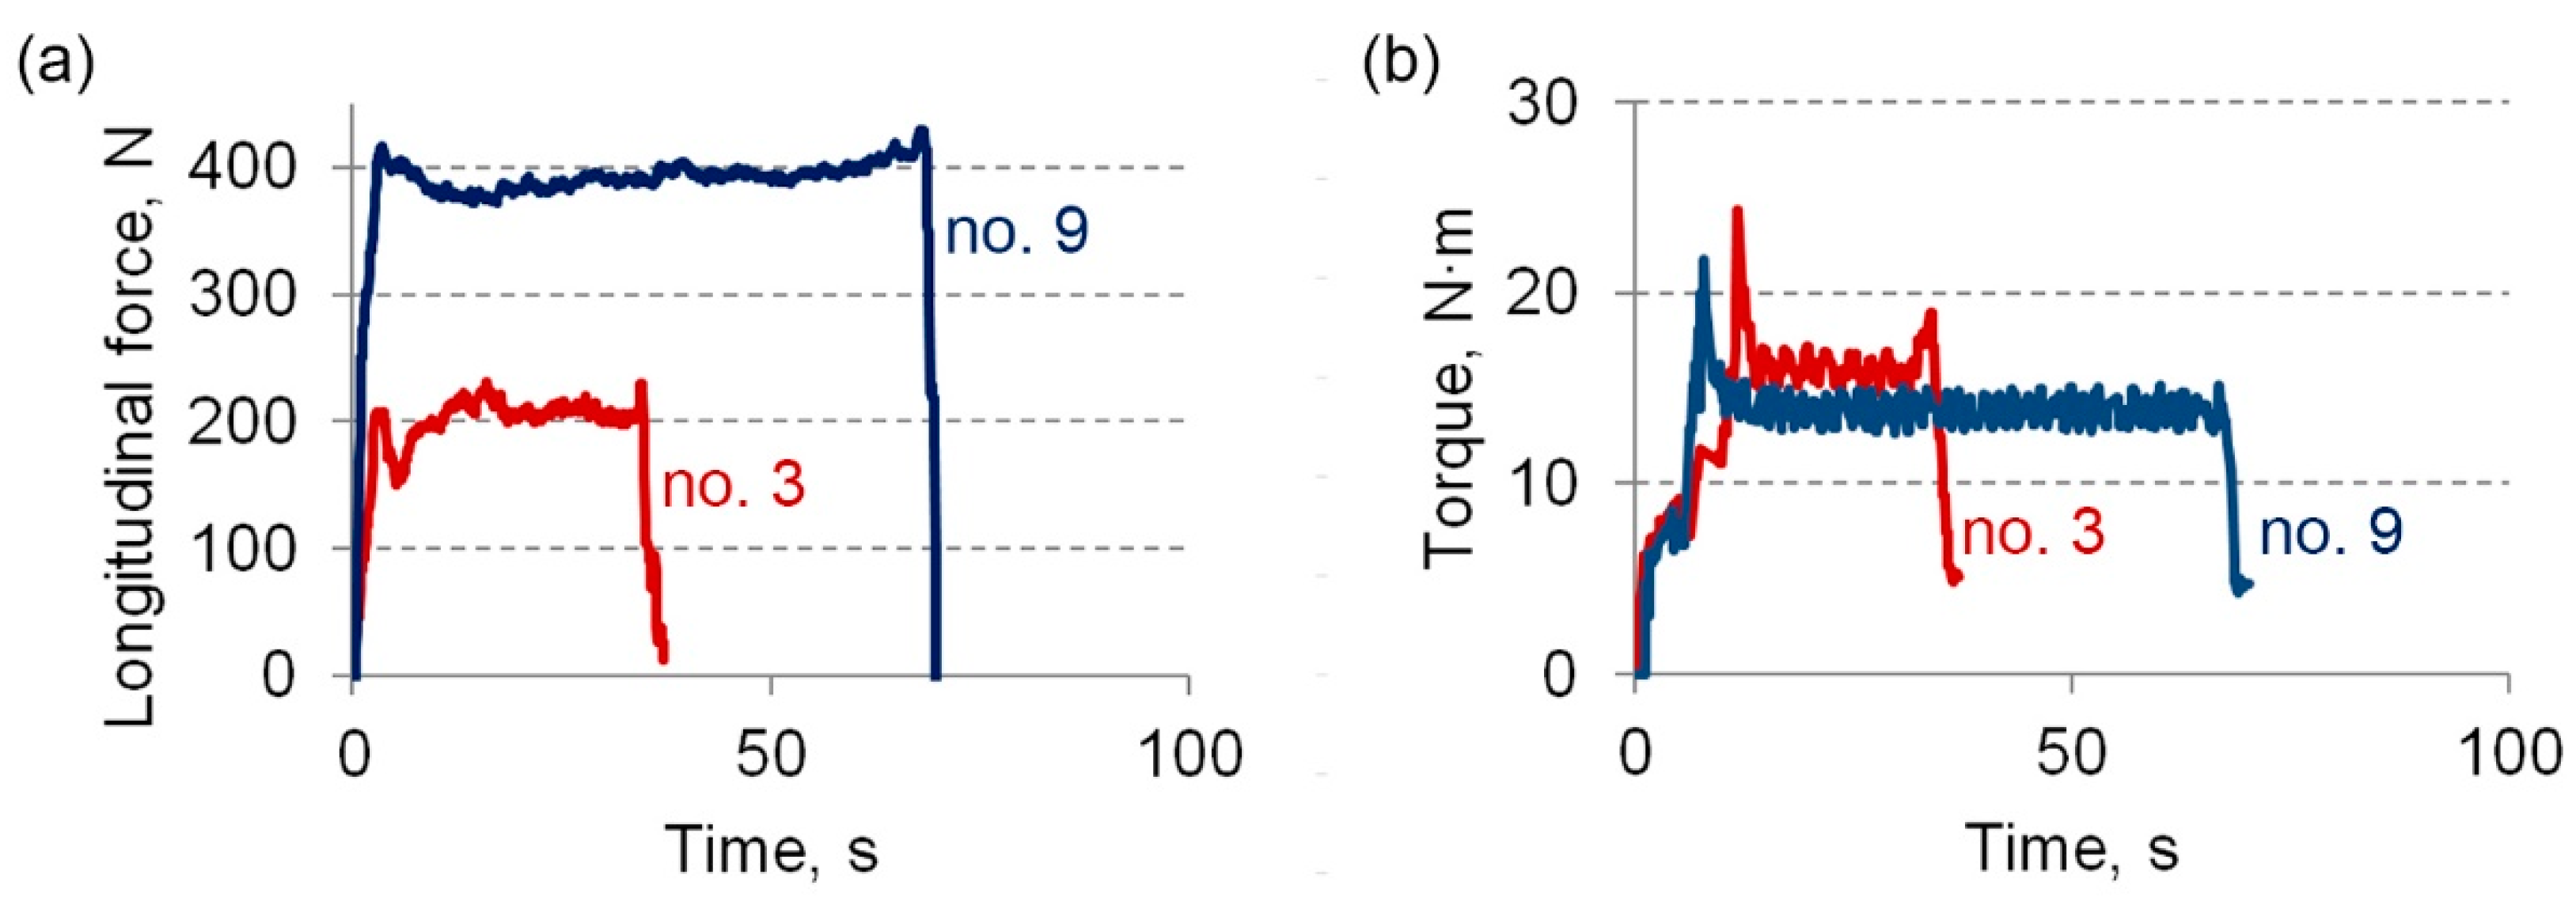
Diagrams of the longitudinal force and torque during welding are given in Figure 3. With load, frictional heat grows, causing overheating and decreasing the longitudinal force and torque. When the heat removal from the weld zone and the heat input do not compensate each other, the balance is disturbed and the thermal regime becomes unstable, resulting in defects. The heat input per meter of the friction stir weld can be estimated by the formula:
where M is the toque, ω is the rotation rate, and V is the feed rate. For comparison of the modes, the friction coefficient is also calculated by the formula:
where Fz is the axial load and Rs is the shoulder radius. This expression was obtained from the Coulomb model [21] and enables an estimation of the average friction coefficient via the average torque. Actual values of the friction coefficient, as well as of the torque, are different at each point of the tool surface. In areas with considerable adhesion, the friction coefficient exceeds unity, while, in other areas, slip occurs. The shoulders are thought to contribute mostly to material heating, as they are provided with slip conditions and have a larger area than the pin. In addition, the shoulder rate is higher than the pin rate. The pin makes a great contribution to the transfer of the material where uniformly constrained conditions arise. The same is confirmed by optical images of weld cross sections (Figure 10), exhibiting slight deformation of the material under the shoulders. In this case, an average friction coefficient may indicate the state of the entire system.
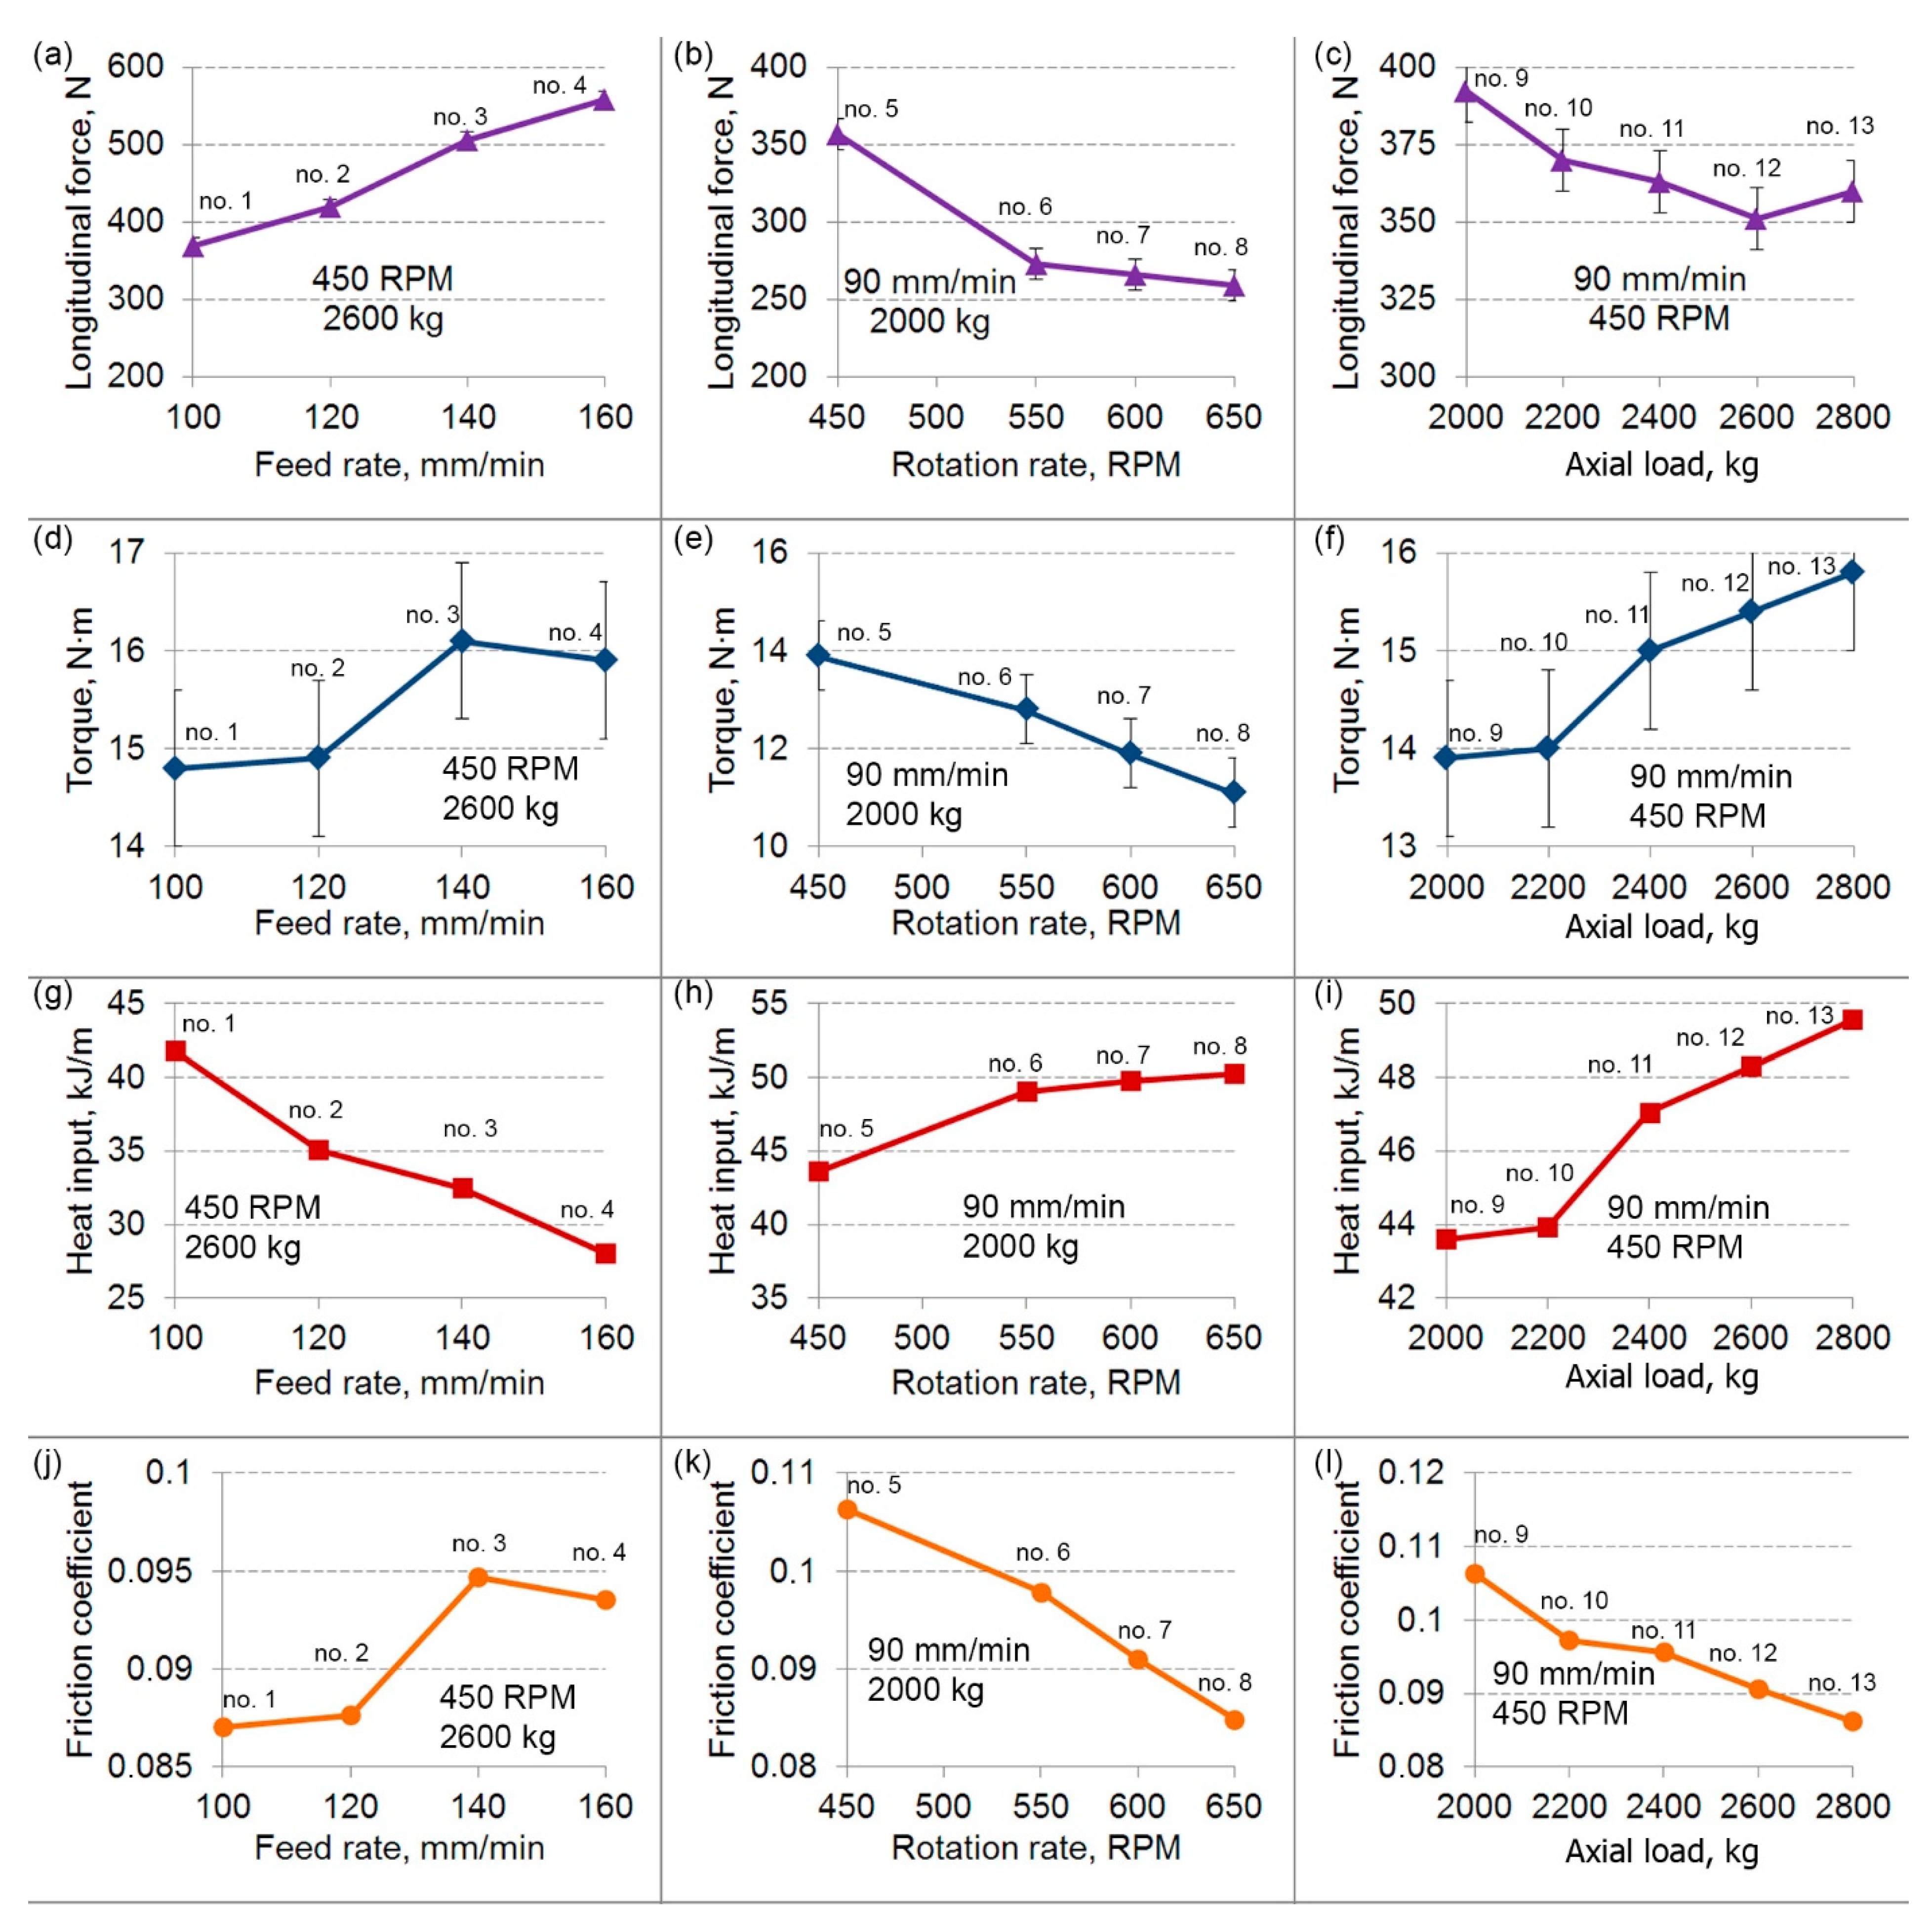
Figure 4 shows how torque, longitudinal force, heat input, and friction coefficient depend on the process parameters. In this range of modes, the influence of the parameters on the force and torque was intuitively clear. With increasing feed rate, the heat input decreased (Figure 4g). The material was less heated, and therefore the longitudinal force and torque grew due to the resistance of the material (Figure 4a,d). The average friction coefficient also increased with a higher axial load (Figure 4j). With increasing rotation rate, the heat input grew (Figure 4h). The material heated up more, and the longitudinal force, torque, and friction coefficient decreased (Figure 4b,e,k). Consideration should be given to the fact that joints produced in the selected range of modes had no visual defects. The heat input diagram gradually reached a plateau. A further increase in the rotation rate would lead to the material overheating; the transfer layer would act as a lubricant, and the friction coefficient would decrease even more. With bad adhesion, the material would extrude, and the tool would meet the unheated material, causing an increase in longitudinal force. Such effects result in defect formation.
The influence of the axial load was less obvious. On the one hand, with increasing load, the heat input grew (Figure 4i). As the frictional force increased, more heat was generated, the material heated up more, and the longitudinal force and friction coefficient decreased (Figure 4c,i). However, with increasing load, the torque also increased (Figure 4f). This meant that the material was less resistant to the translational motion of the tool, but more resistant to the rotational motion as a larger volume is involved in deformation. In addition, an increased load can improve adhesion between the tool and the material [22]. These processes compete with each other. The balance of their effects will depend on the specific conditions in each case. Therefore, despite softening of the material, the mass transfer became better. Thus, the axial load variation in modes can significantly enhance the joint quality. This parameter is still not understood because the load has not been used as an input welding parameter, though most FSW systems can measure it. A continuous variation in the load alters welding conditions. Setting a constant load can improve the stability of the entire welding process. For example, Kim et al. [23] showed that an increase in load can expand the window of admissible parameters.
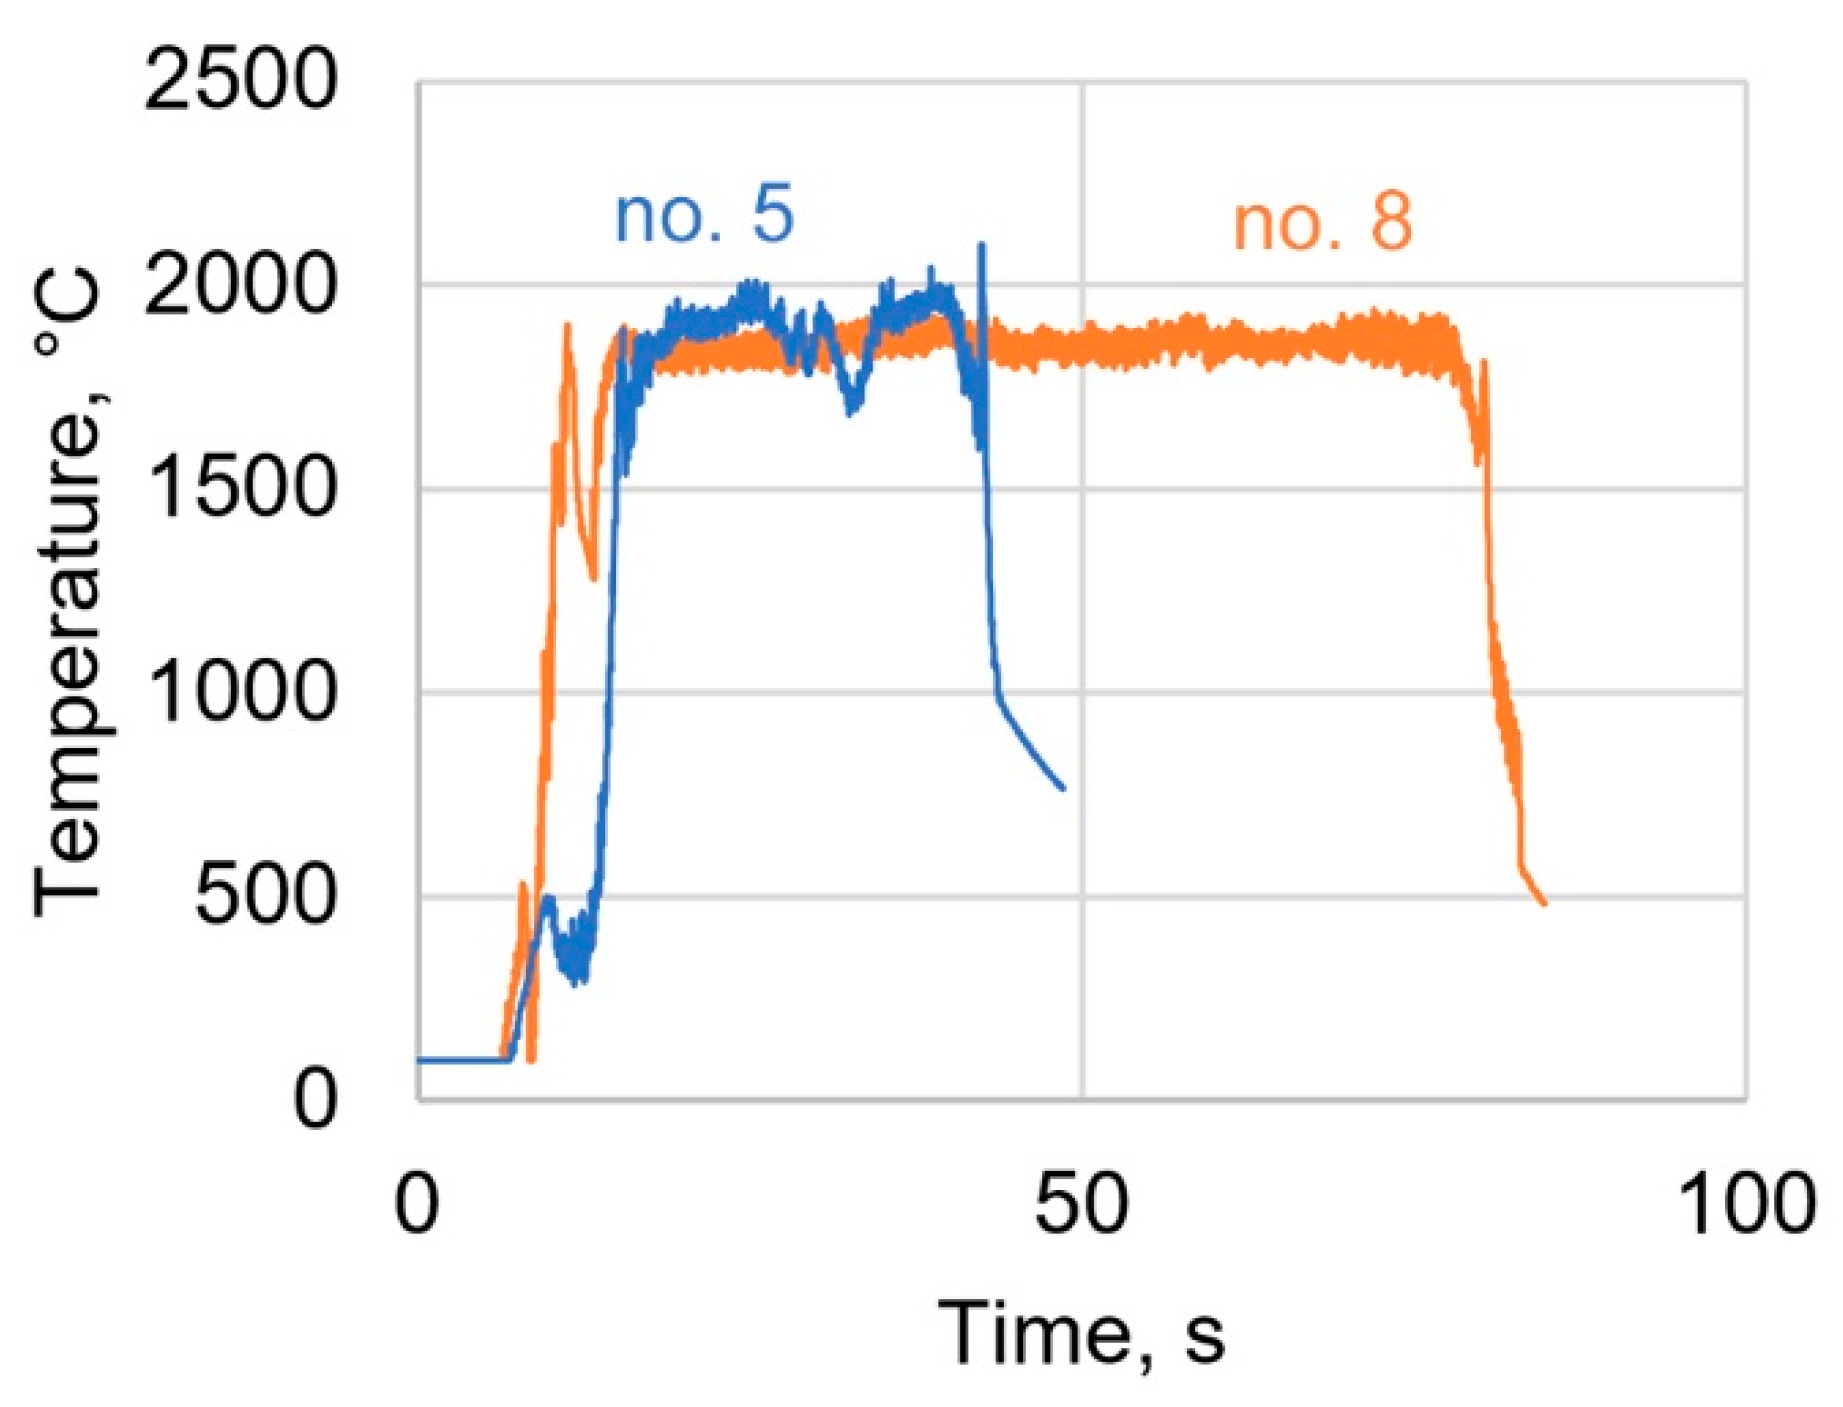
The thermal imager was used to analyze the temperature during the FSW process (Figure 5). Thermography was performed to observe the stability of the welding while adjusting the modes. The registered values ranged from 1980–2061 °C, accurate to ±100 °C, which is significantly higher than the melting point of the alloy. In fact, we measured the flash temperature, i.e., the maximum temperature in the tool–workpiece contact area. As the radius of the shoulders is maximum in this area, the friction velocity and heat input have maximum values. The temperature flash is a very short and local phenomenon, and therefore, the average temperature of stirring in the bulk can be significantly lower. In addition, due to high pressure in the weld zone (up to 81 MPa along the tool axis and up to 868 MPa along the welding axis), the alloy has a higher melting temperature. Thus, even such a high temperature does not lead to melting [24]. In particular, images of the weld macrostructure and front surfaces of the specimens exhibited no melting. This temperature does not indicate the actual welding temperature, but it may indicate the stability of the process.
Mode no.8 had the highest stability of heat input during welding (Figure 5). The rest temperature diagrams illustrate irregular heat input and an increase in heat input during welding. The thermogram of sample no.5 is shown for comparison. Thermal stability assumes better quality of joints. No correlation was found between temperature and process conditions. In addition, the measurement error due to large temperature jumps did not allow comparison of average temperatures. For this reason, temperatures for each mode are not shown here.
3.2. Mechanical Properties
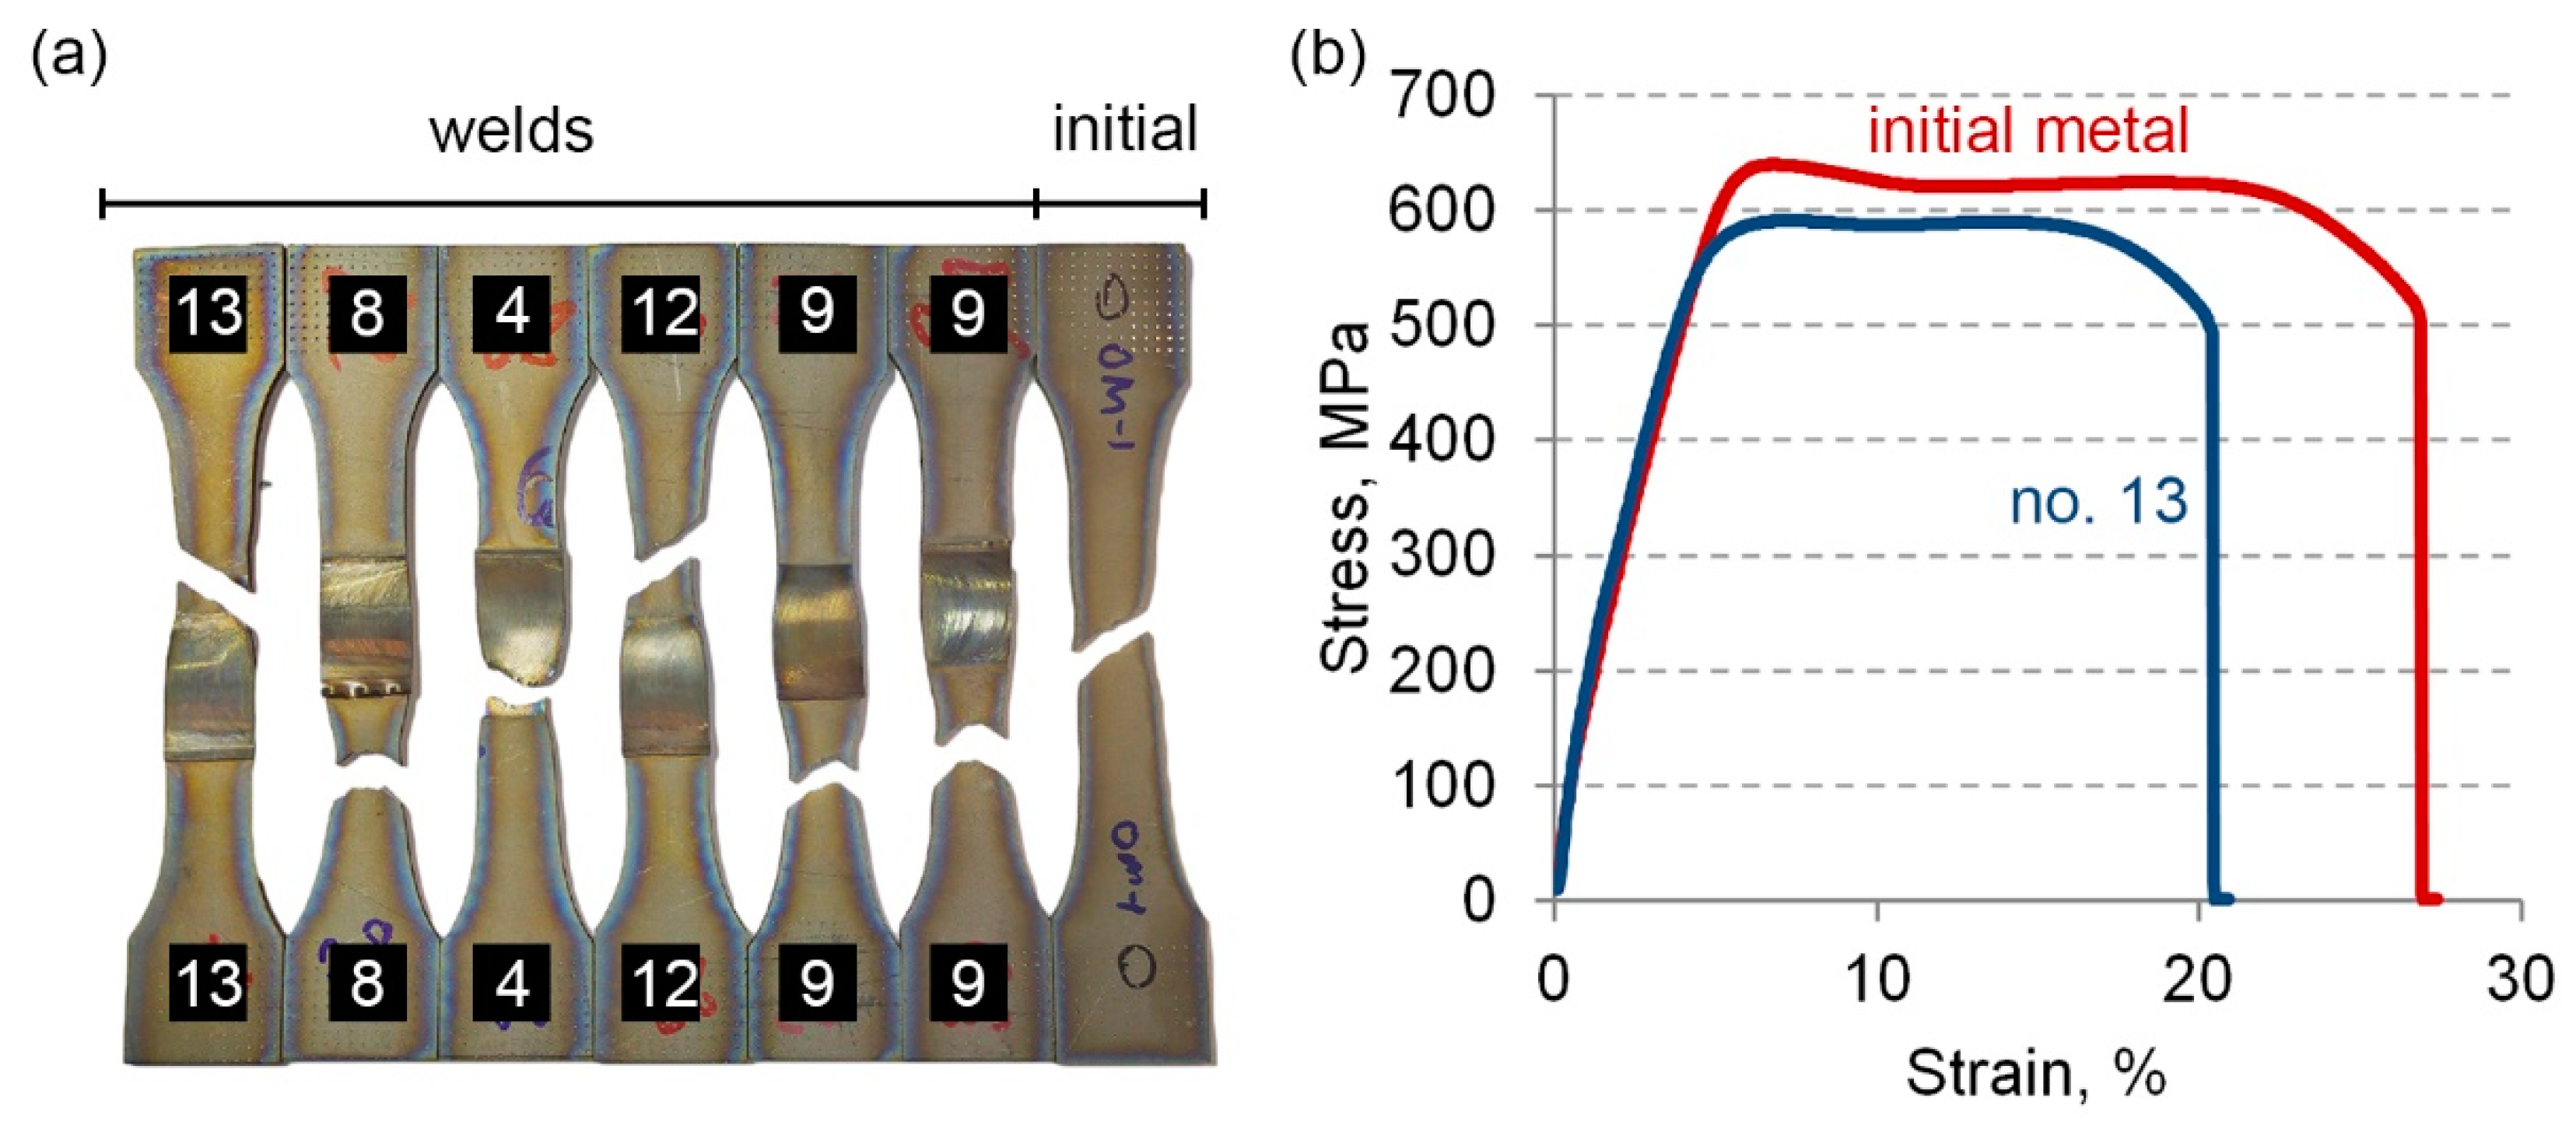
Tensile tests of friction stir welds were carried out on samples cut across the joint. The specimens were fractured mainly through the base metal outside the weld. Fracture occurred with the formation of two cross cracks at an angle of 45° to the specimen axis or one crack at an angle of 45° to the specimen axis (Figure 6a). A specimen of the initial material was tested for comparison. The strength of the initial material was 639.1 ± 0.5 MPa, and the maximum relative elongation was 27.5 ± 0.5%. Since the joints contained no macrodefects, the appearance of the stress–strain curves of all permanent joints was similar to that of the initial material (Figure 6b). In the presence of macrodefects, the appearance of the curves can vary significantly, like in our previous work [4].
Table 2 shows the results of mechanical tests on specimens with welded joints. The joint strength in all modes exceeded 90% of the strength of the base material. Judging from the average strength of the specimen, joints produced in modes no.8 and no.13 were the strongest. However, mode no.8 joints were more stable, i.e., the strength variation along the weld was minimum. This is indicated by a low error value. Since the test specimens were cut from different parts of the welds, the measurement error may indicate the stability of their mechanical properties. The weld strength can vary along the weld when the welding process is unstable. Mode no.9 joints also had low strength stability. As such, their average maximum elongation was the largest, comprising 92% of the maximum elongation of the base material. The ductility of mode no.13 joints was somewhat lower than that of mode no.9 specimens. However, despite low stability, the combination of their mechanical properties can be considered the most optimal. In general, mechanical properties showed small differences in all modes. The samples were cut from different parts of the welds, so the small error in the strength test indicated a high stability of the properties throughout the weld. Although many of the samples fractured over the base metal, their strength was lower than that of the initial material. This may be due to the fact that the weld sample is a multilayer composite that consists of the base material, the TMAZ, and the stir zone. Each of these zones has different characteristics, which can lead to stress redistribution.
The influence of the process parameters on strength and ductility was ambiguous. The rotation rate in mode no.8 was 200 RPM higher than that in mode no.9, which had a strong effect on longitudinal force and torque but no effect on strength. The possible reason is the close heat input; due to this, differences in ductility were great. In modes no.9 and no.12, the loads differed by 600 kg; the torque, heat input, and longitudinal force were very different, but the strength and ductility differed only slightly. This can be explained by a rather wide window of acceptable parameters of the material under these loads. This is common in welding of single-phase materials such as 5056 aluminum alloys.
The quality of weld joints was also studied in mechanical bending tests. One of the most dangerous defects of friction stir welds is incomplete root penetration. This defect is not a crack, but is caused by insufficient stirring or insufficient tool plunge. Therefore, bending was carried out on specimens with the weld root turned upward until its opening or until an angle of 180° was reached. According to the bending results (Table 2), specimens welded in modes no.8, no.9, no.12, and no.13 did not have this defect because no opening occurred at 180° bending. The weld root opened in specimens welded in mode no.4. In this mode, the feed rate is higher than in mode no.12, giving lower heat input (Table 1). Thus, opening of the weld root can be explained by insufficient heating and stirring.
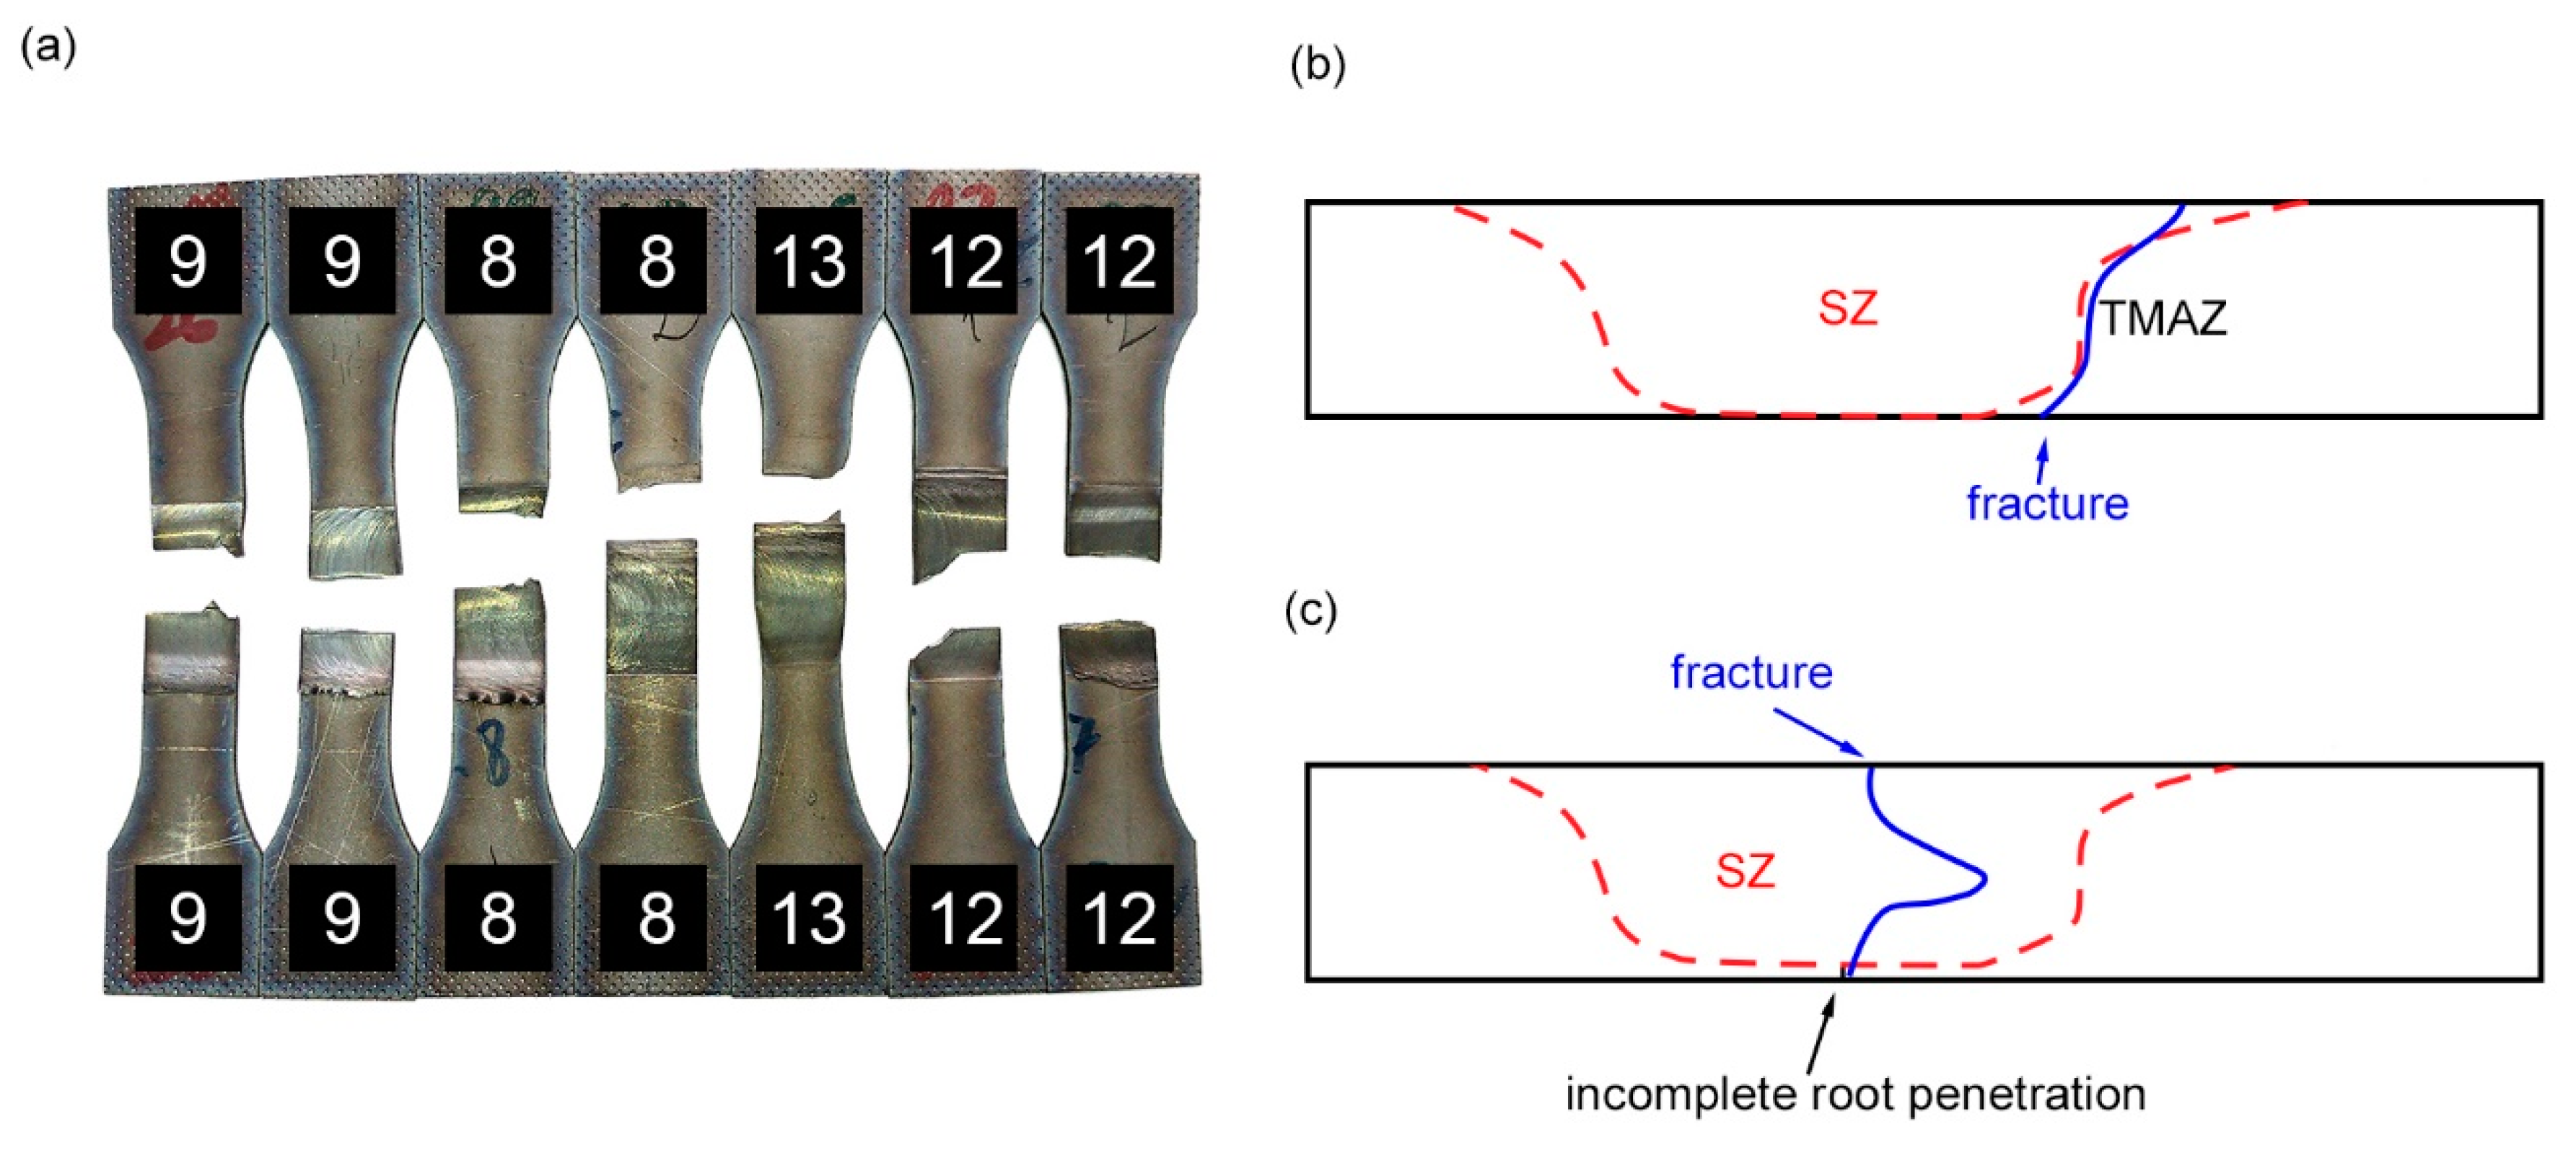
These specimens were also tested for fatigue strength. Figure 7 shows a typical appearance of the specimens after fracture. Most of the specimens were fractured along the boundary between the stir zone (SZ) and thermomechanically affected zone (TMAZ; Figure 7b). The strongest specimens welded in modes no.13 and no.8 failed outside the weld. Mode no.13 welds showed abnormal fatigue strength, several times higher than that of the base material. Since this mode had the highest load, it can be assumed that the abnormal strength was related to the effects of residual stress. All three types of mechanical tests showed that the mode no.13 specimen was the strongest. This mode had the highest axial load on the tool and provided the highest torque of specimens. Mode no.3 and no.4 specimens had the same high torque in welding but much lower heat input, which would not allow for high-quality welds. Mode no.4 showed root opening during bending, which can be considered a defect. In these samples, incomplete root penetration was found; therefore, the fracture occurred along it. The fracture diagram is shown in Figure 7c.
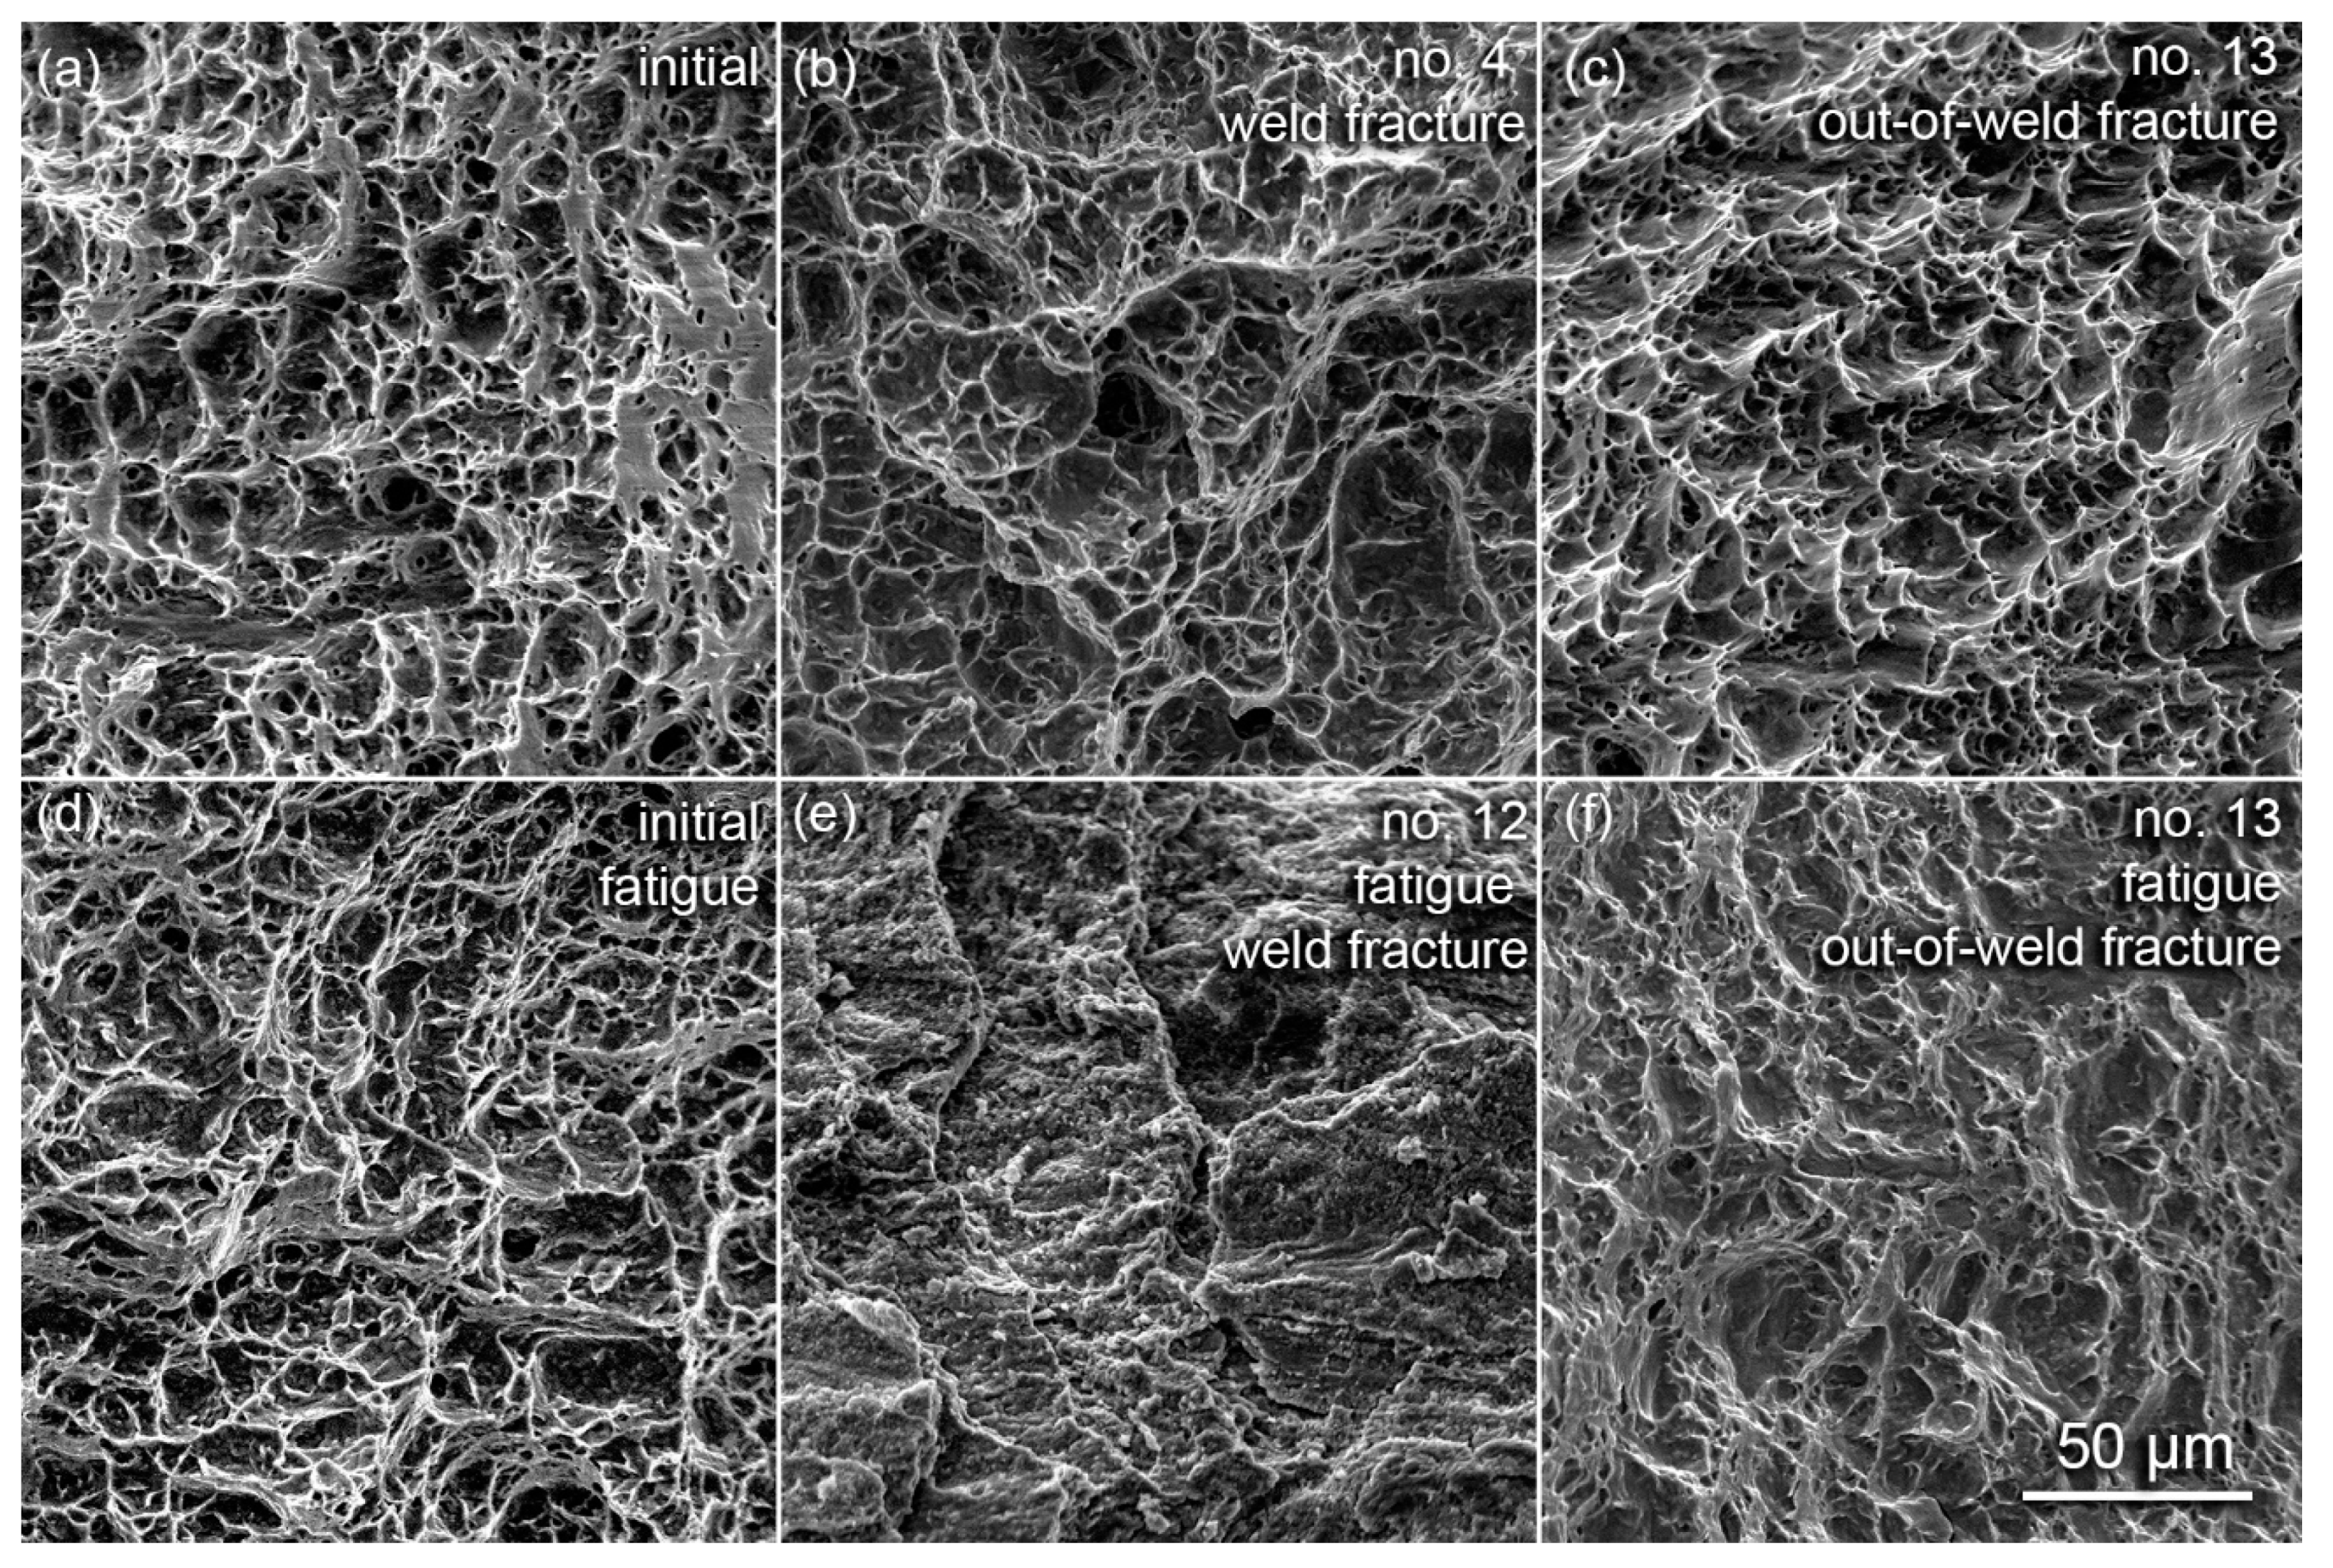
Figure 8 shows fractographic images of specimens after mechanical tensile and fatigue tests, which are given on the same scale. In most cases, ductile failure was observed. Brittle failure was observed in specimen no.12, which fractured at the weld during fatigue testing. Being typical of fatigue fracture, the brittle pattern was not met outside the weld. This may indicate a high crack velocity in the stir zone due to its refined equiaxial structure [25]. In this case, individual transfer layers could be distinguished, which had delaminated and been destroyed during the test. No other deviations from the normal fracture behavior of a material were observed.
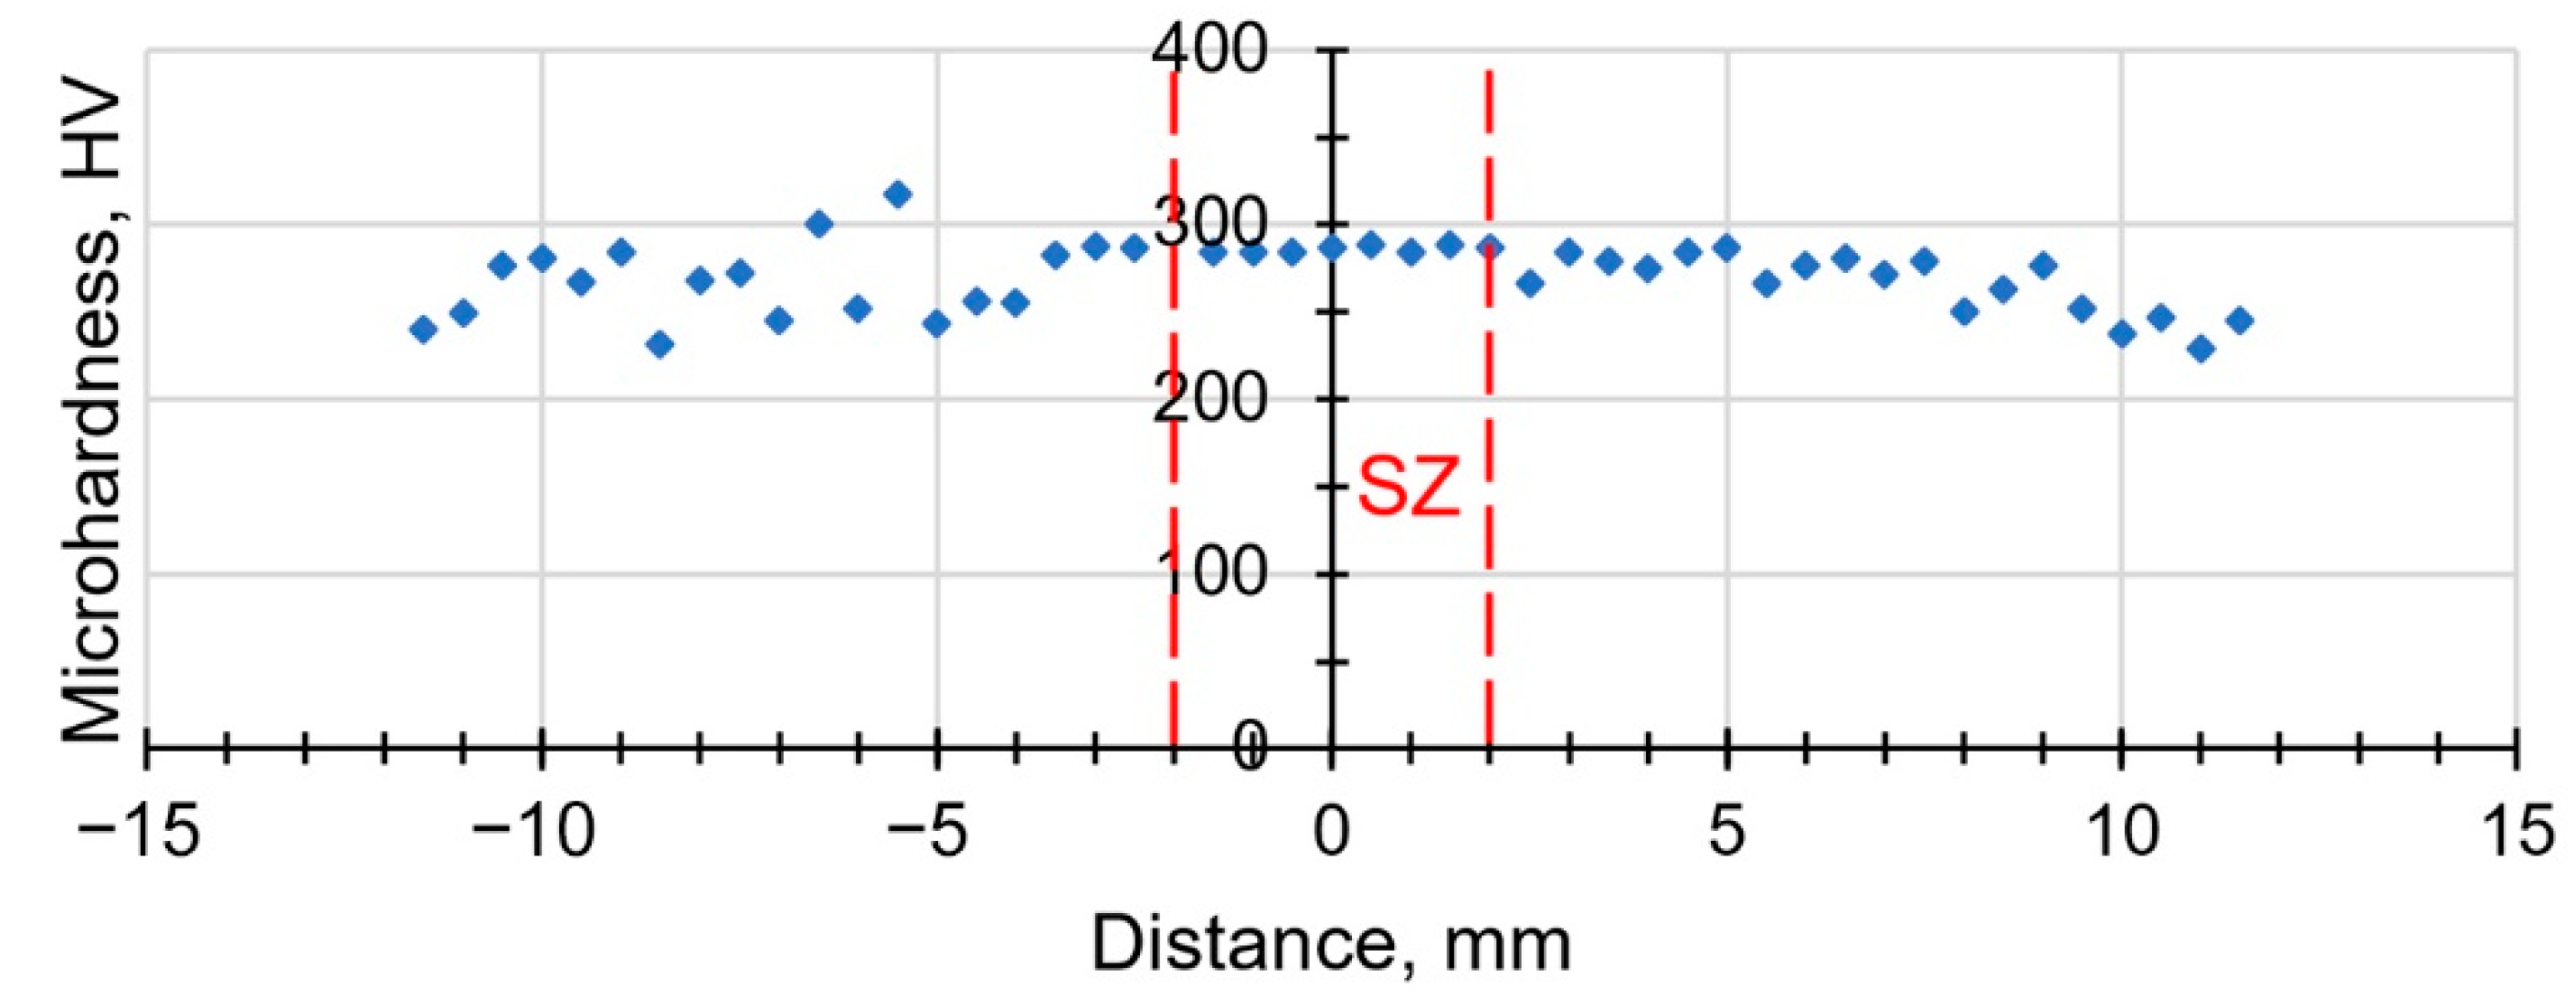
Figure 9 shows the microhardness graph of sample no.12. The microhardness was measured along the middle line of the weld (Figure 10). This measurement was made to determine the boundaries of the zones. Results of measurements have shown that in the sample no sharp fluctuations of microhardness were observed. Single high values of microhardness outside the weld were related to the features of the alloy itself; it is possible that there were grain boundaries or metallurgical defects in these areas, which is permissible for rolled sheets. Further microhardness was measured in specific areas.
The microhardness measurement results (Table 3) show that severe plastic deformation of Ti–1.5Al–1Mn titanium alloy during friction stir welding led to significant hardening of the material. Areas of microhardness measurement are represented in Figure 10. Maximum hardening was found in mode no.9, where it comprised 138% of the microhardness of the base material. The microhardness in the stir zone was generally stable in all specimens. With distance from the stir zone, the microhardness slightly decreased. No heat-affected zone was observed in these joints, and therefore, the related measurement area was designated as base metal (BM). The microhardness of friction stir welded joints rarely correlates with their strength, since the joint is actually a system of several heterogeneous zones. Characteristics of such a sharply gradient structure cannot be reduced to a simple sum of the characteristics of its elements. Therefore, the hardest specimen does not correspond to the strongest one. In the context of FSW, microhardness is used to determine the level of residual stresses in the material. For this reason, the deformed but not yet recrystallized material of the thermomechanically affected zone (TMAZ) is harder than the base material. However, it is in this place that fractures occur more often. The material of the stir zone, as can be seen from the next section, undergoes recrystallization; therefore, it deforms during tension by other mechanisms, for example, by the grain boundary sliding mechanism. That is why a mode no.9 specimen with the highest microhardness in the stir zone had the lowest fatigue strength. Higher stresses lead to material embrittlement; however, static tensile tests did not reveal this. The relationship between microhardness and structure (discussed in Section 3.3) was not detected. In particular, in the stir zone, the grain size was four times smaller than in the base metal. This may explain the higher microhardness of the stir zone. However, the grain size in the stir zone did not differ in all samples, and the microhardness was different.
3.3. Macro- and Microstructure of Welds
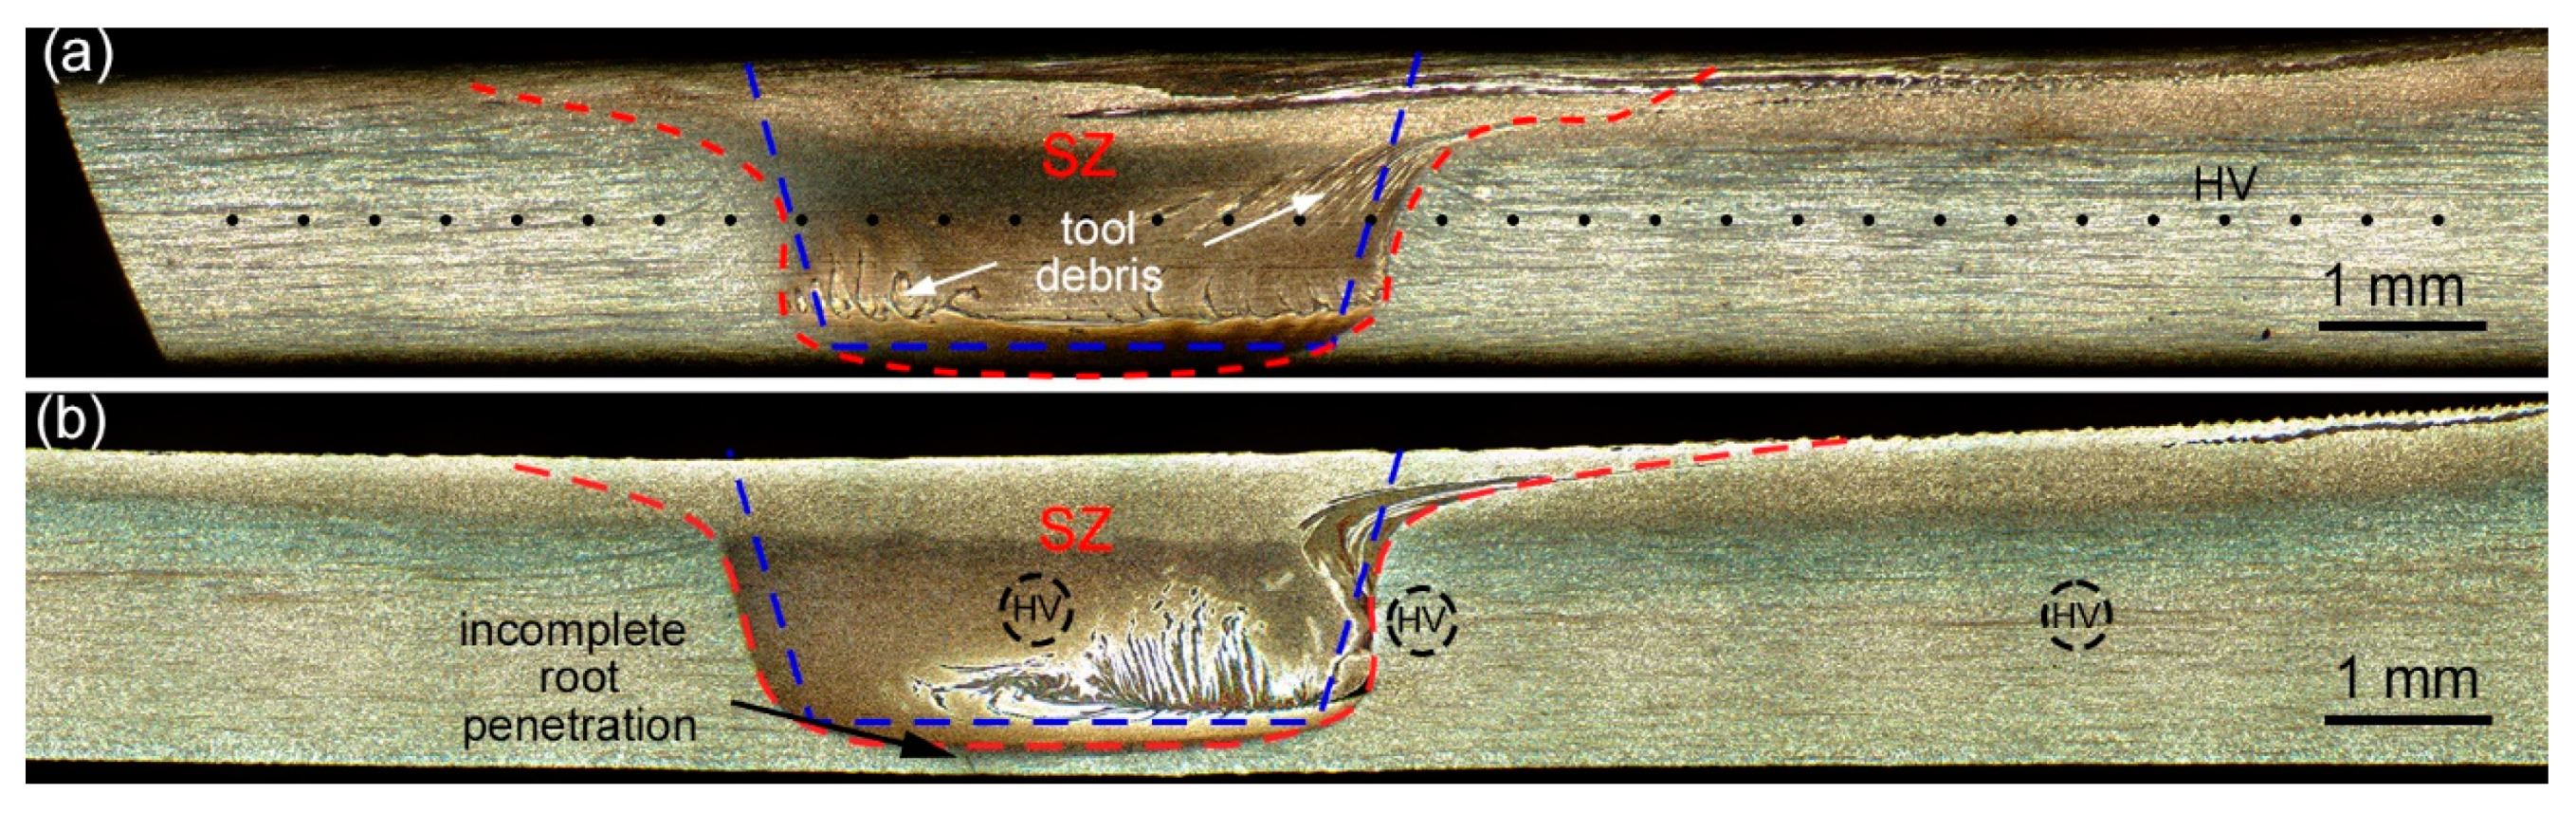
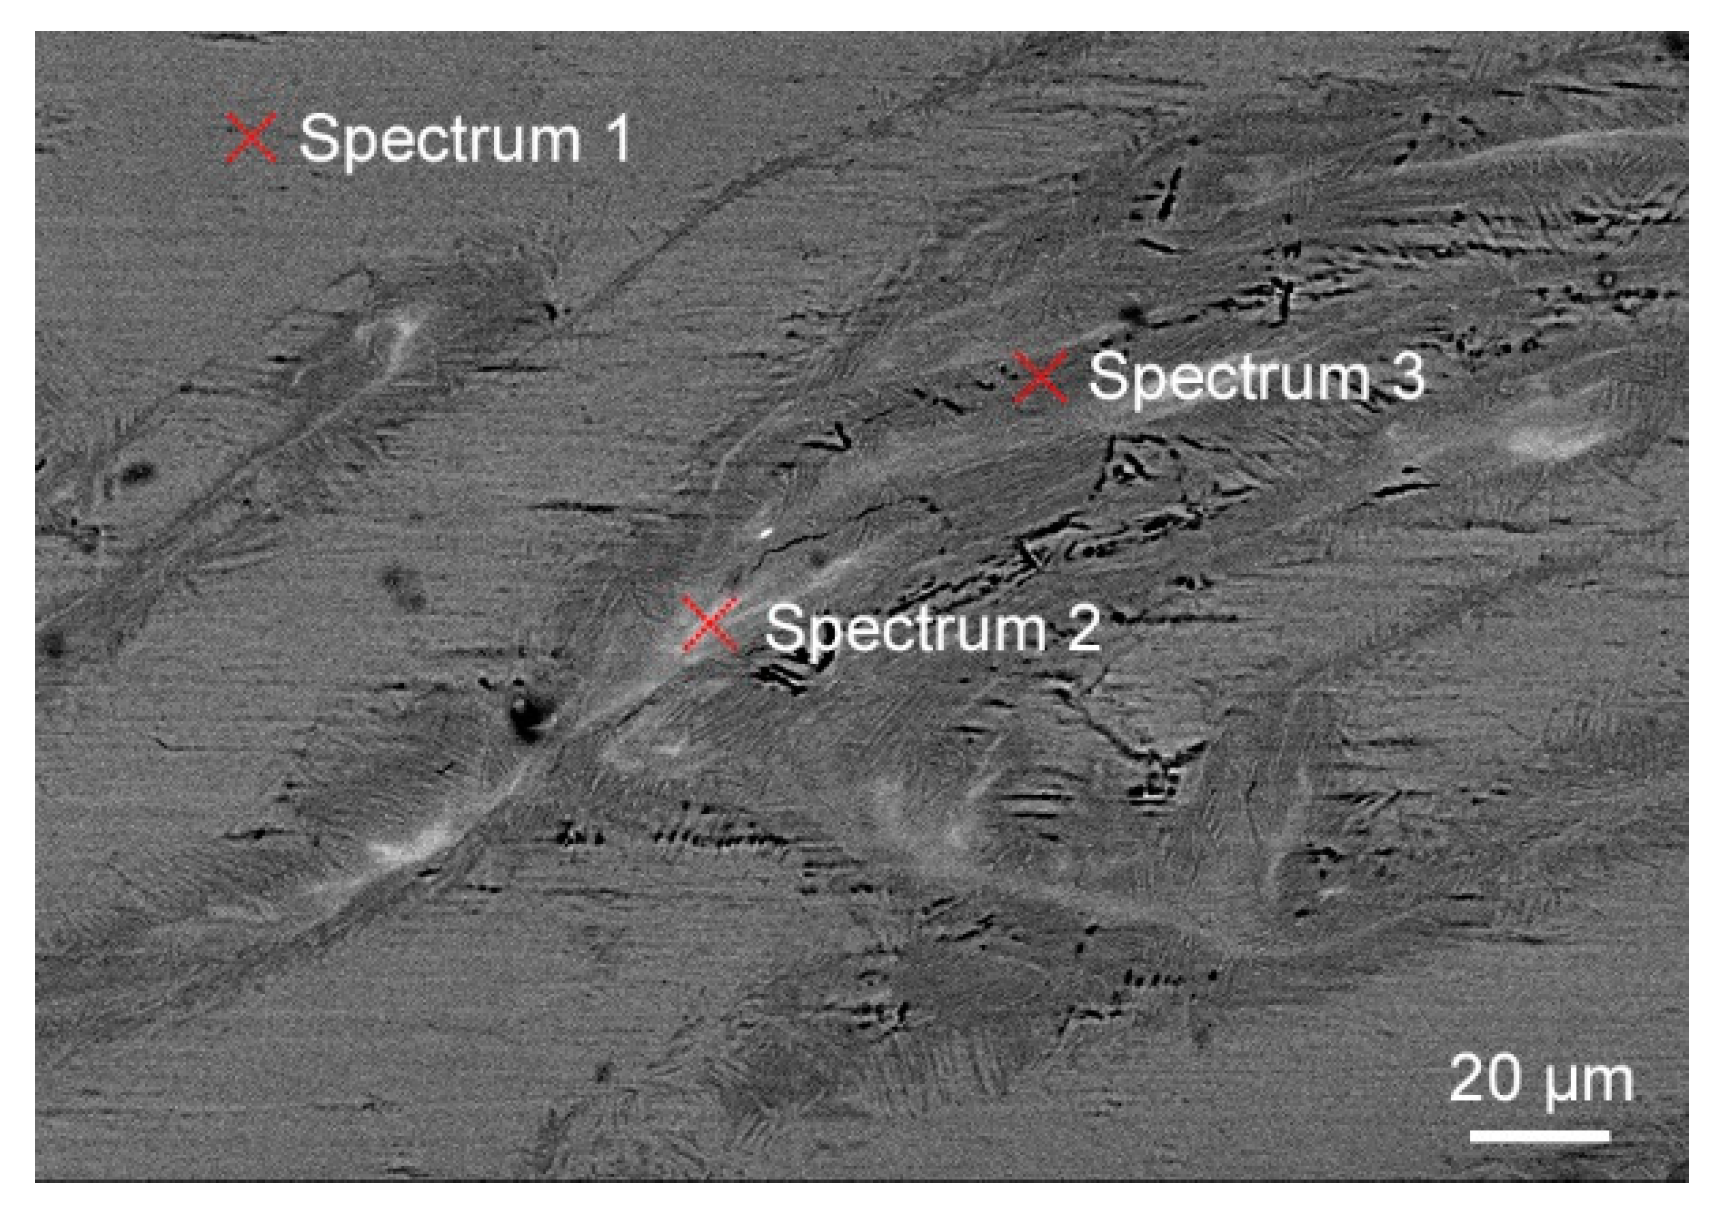
Figure 10 shows the weld macrostructure. The blue dashed line shows the tool pin contour. The macrostructure was typical of friction stir welds, but had special features. The stir zone was equal to the area of direct contact with the tool. In general, the shape of the stir zone followed the tool shape. The TMAZ was extremely narrow (about 0.2 mm), and therefore it is not indicated in the image. A heat affected zone was not found either by visual inspection nor in microhardness measurements, which however exist in aluminum alloys [10]. This feature is typical for other titanium alloys, e.g., Ti–6Al–4V [14]. It is supposed that the absence of the thermal affected zone is due to the low thermal conductivity of titanium alloys. A light layer of titanium alloy was observed in the stir zone subsurface. This layer is formed due to the low thermal conductivity and low ductility of the alloy, even at high temperatures. An area left behind the pin continues to experience pressure and friction due to the shoulders, and the material in this area is still under shear. Titanium alloys have very low thermal conductivity (21.9 W/(m⋅K)) in contrast to aluminum alloys (237 W/(m⋅K)). Slow heat removal leads to additional local heating and repeated recrystallization, which is accompanied by grain coarsening to the size of the base metal grains. Due to shear, localized deformation bands were formed in this area. These bands are not in fact defects, being revealed only by etching. Similar effects were observed in the lower part of the stir zone, where the material experienced vortex motion due to shear induced by the edge of the pin. Most of the joints had no macrodefects, but there was incomplete penetration in weld no. 4. Near the weld root and at the stir zone boundary on the advancing side, tool debris was observed. Wear debris has also been found in commercially pure titanium joints [18]. With adhesive wear of a tool, its particles are mechanically mixed into the joint, where they diffuse and form new compounds, which are well-detected by etching. So far, there is no understanding as to whether this is a defect. If these particles harden the weld, the stir zone can be considered a matrix composite. An energy-dispersive analysis was performed in this area. The results are shown in Figure 11 and Table 4. Tool debris are represented as light contrasting objects. Analysis of these objects showed that they had elements contained only in the tool (Cr, Co, Ni, W). Outside of these objects the chemical composition of the alloy corresponded to the grade composition.
Table 5 shows the measurement results for the cross-sectional area of the stir zone. This parameter is indicative of the material volume involved in stirring and deformation. A mode no.12 specimen had the largest stir zone due to its high load. Heat input per unit length in mode no.8 was slightly higher but the stir zone area and torque were lower. This illustrates the contribution of loading to mass transfer processes. In mode no.13 specimens, the stir zone area decreased again, although the load and torque increased. Apparently, this load in combination with other parameters turns out to be critical and the material begins to overheat, and consequently a smaller volume is involved in stirring. The stir zone area in mode no.4 specimen was smaller, which is explained by a higher feed rate. In this case, heat input contributes to mass transfer because the load is constant. The same situation occurs when comparing modes no.8 and no.9: the tool rotation rate, heat input, and stir zone area were higher in mode no.8.
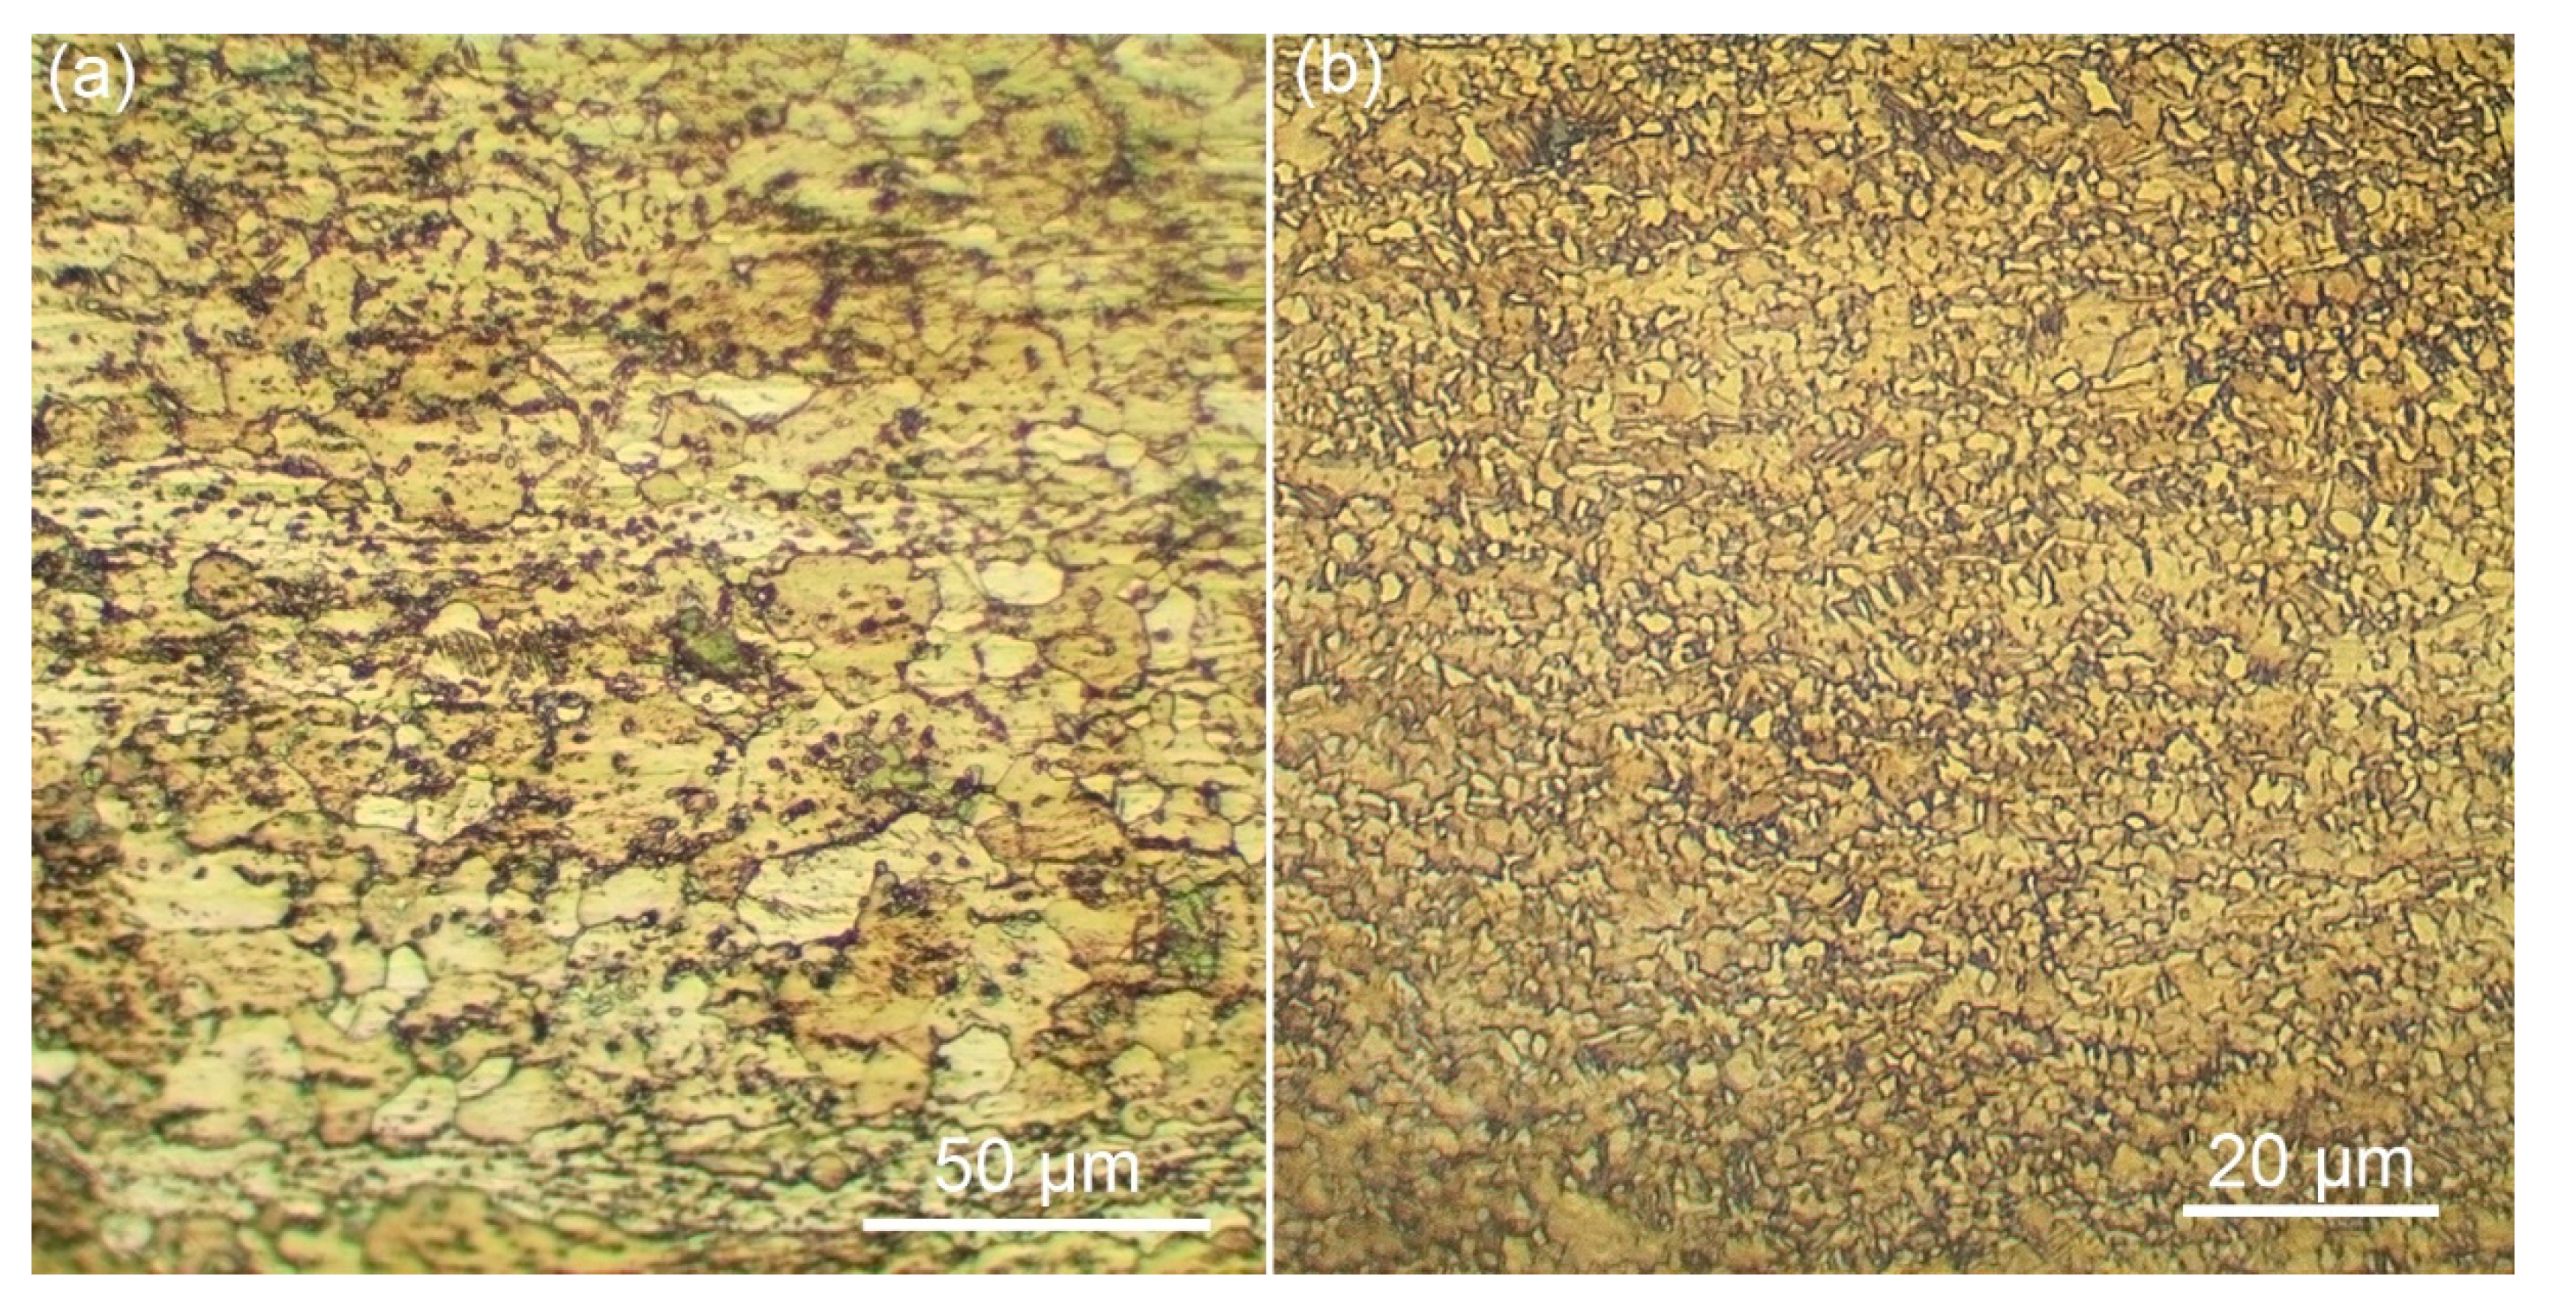
Figure 12 shows optical images of a typical grain structure in the stir zone and base material. The stir zone is characterized by a recrystallized structure with equiaxed grains of a solid solution. Due to dynamic recrystallization, the solid solution grains became four times smaller compared to the initial structure. Dynamic recrystallization resulted from severe plastic deformation during FSW. On the whole, this result is typical for such materials and under such conditions [26]. Between the modes, the grain size differed within the measurement accuracy.
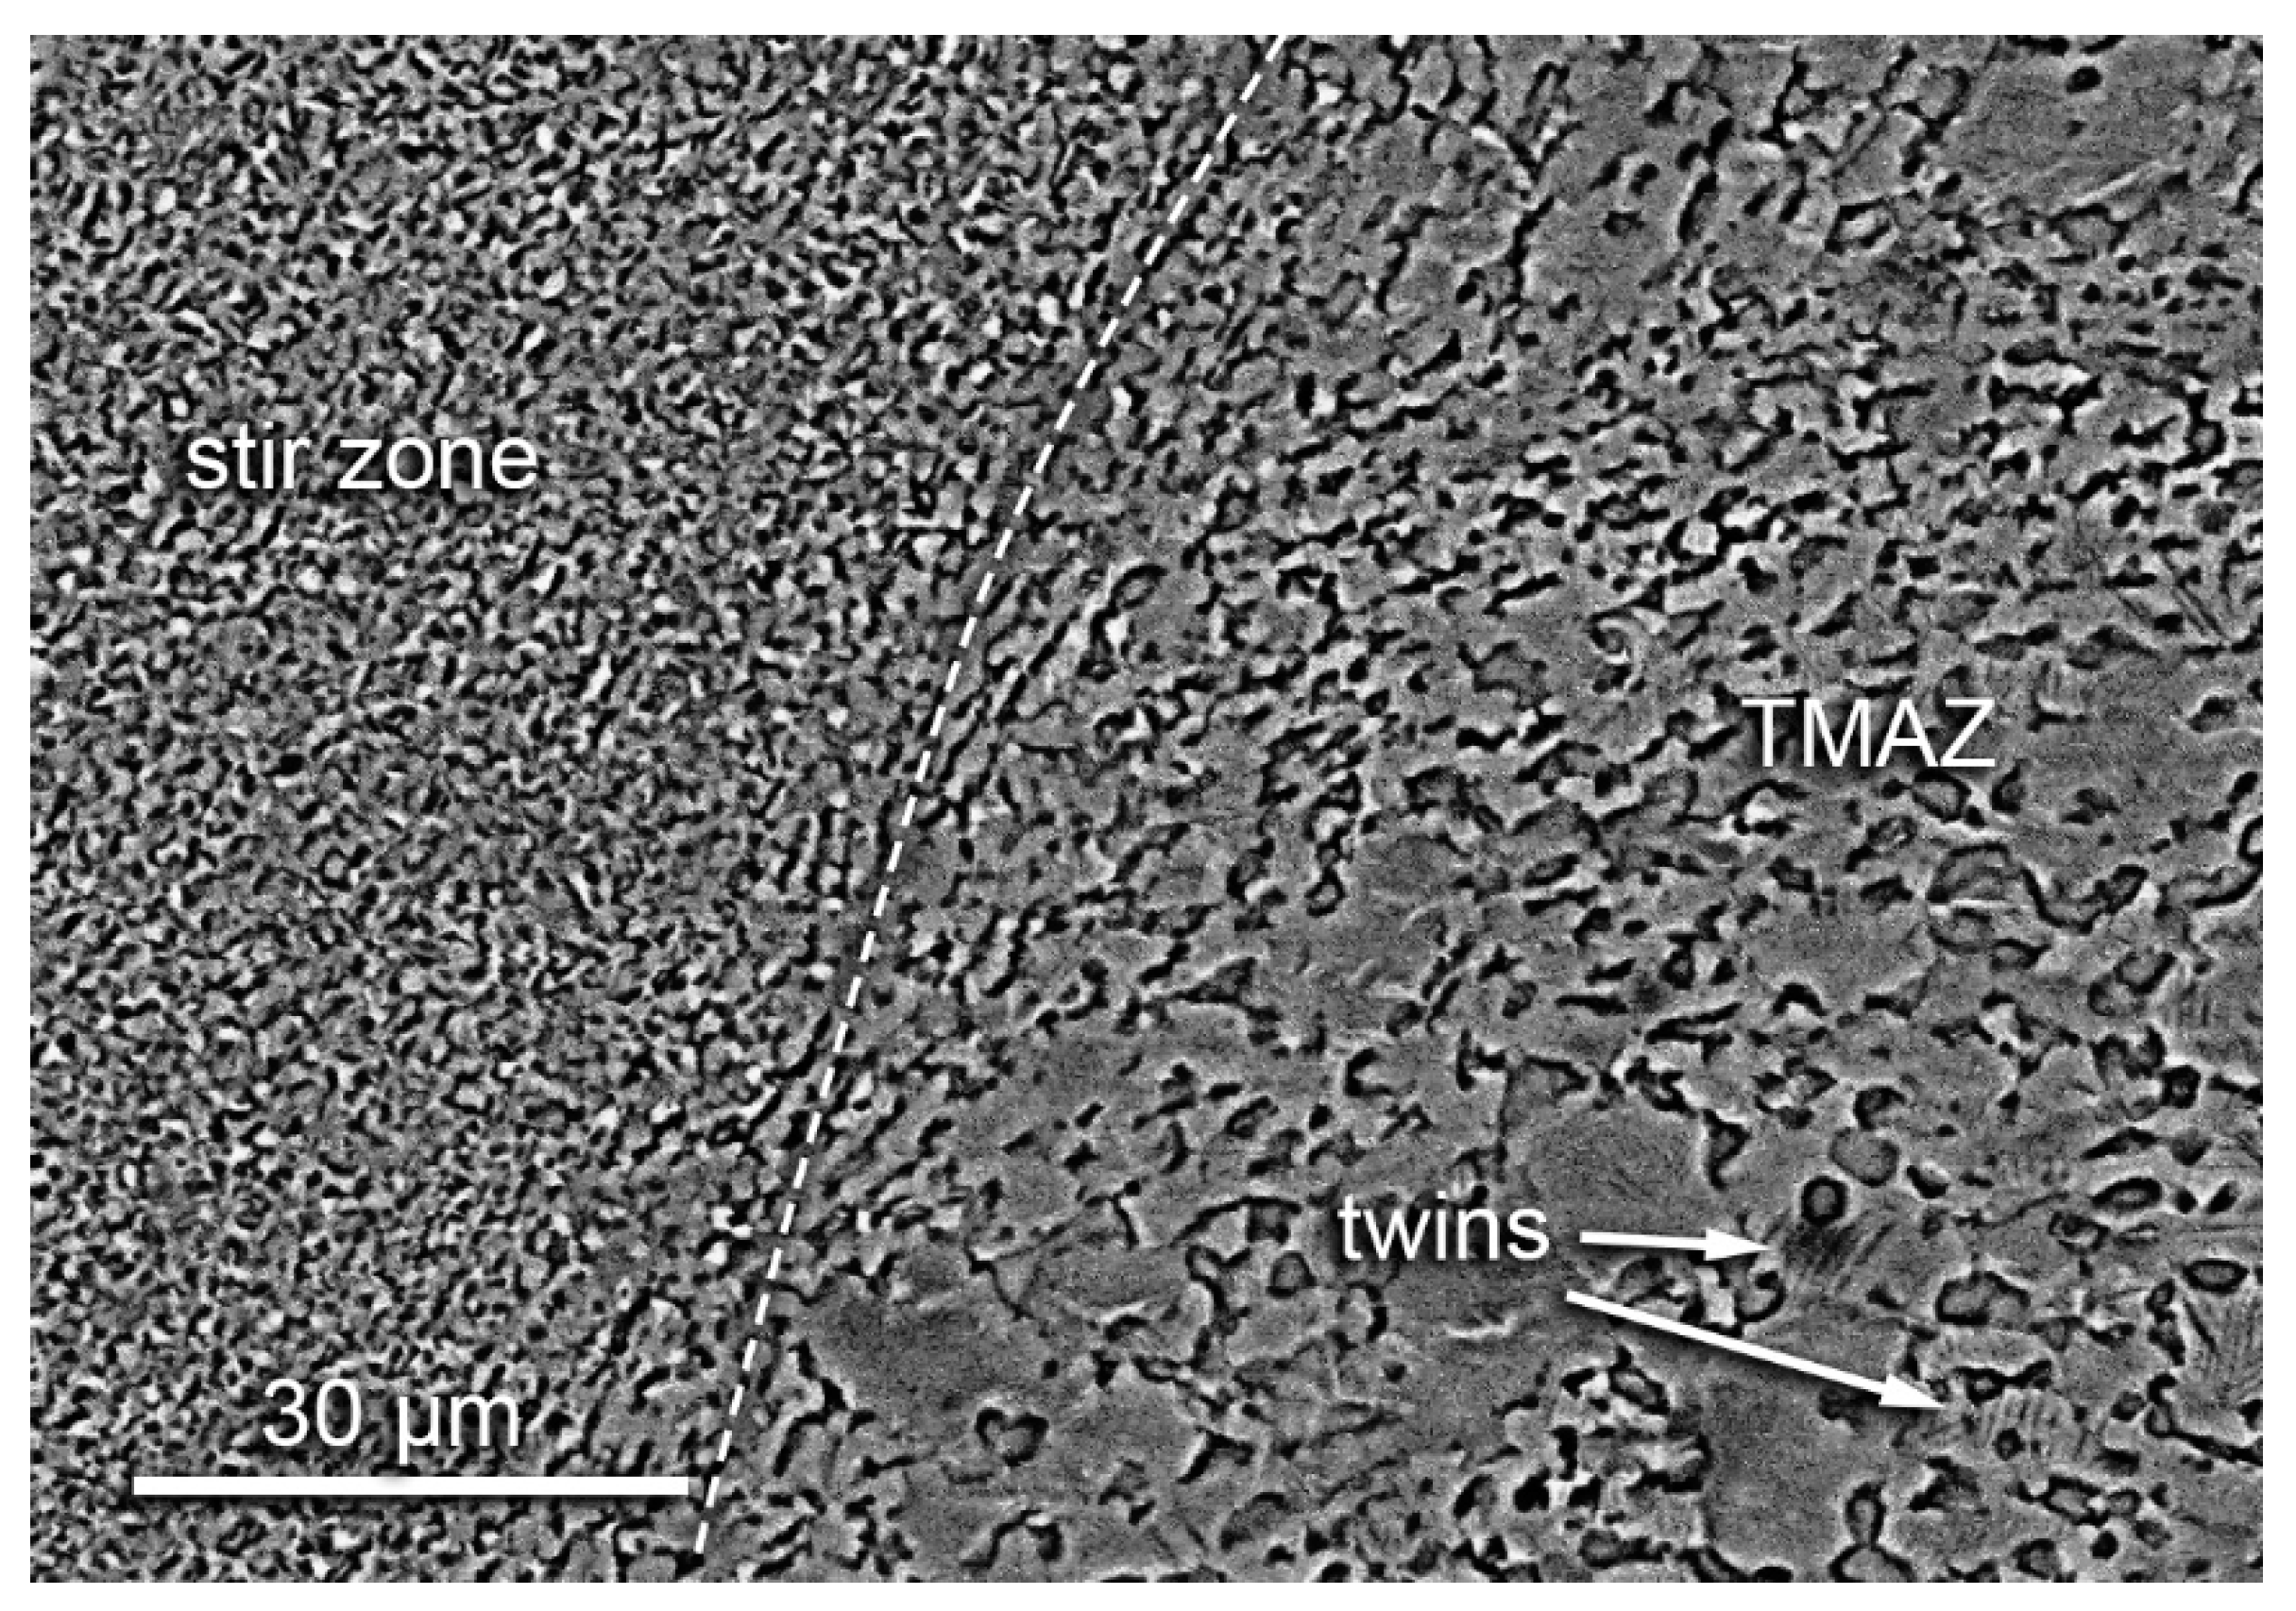
Figure 13 shows a backscattered electron SEM image of the boundary between the stir zone and TMAZ. The boundary between the zones is sharply gradient. TMAZ did not exhibit elongated grains as found in aluminum alloys [10]. This was probably due to its lower thermal conductivity and higher strength. Twins were found in some grains, which are indicative of deformation in this zone.
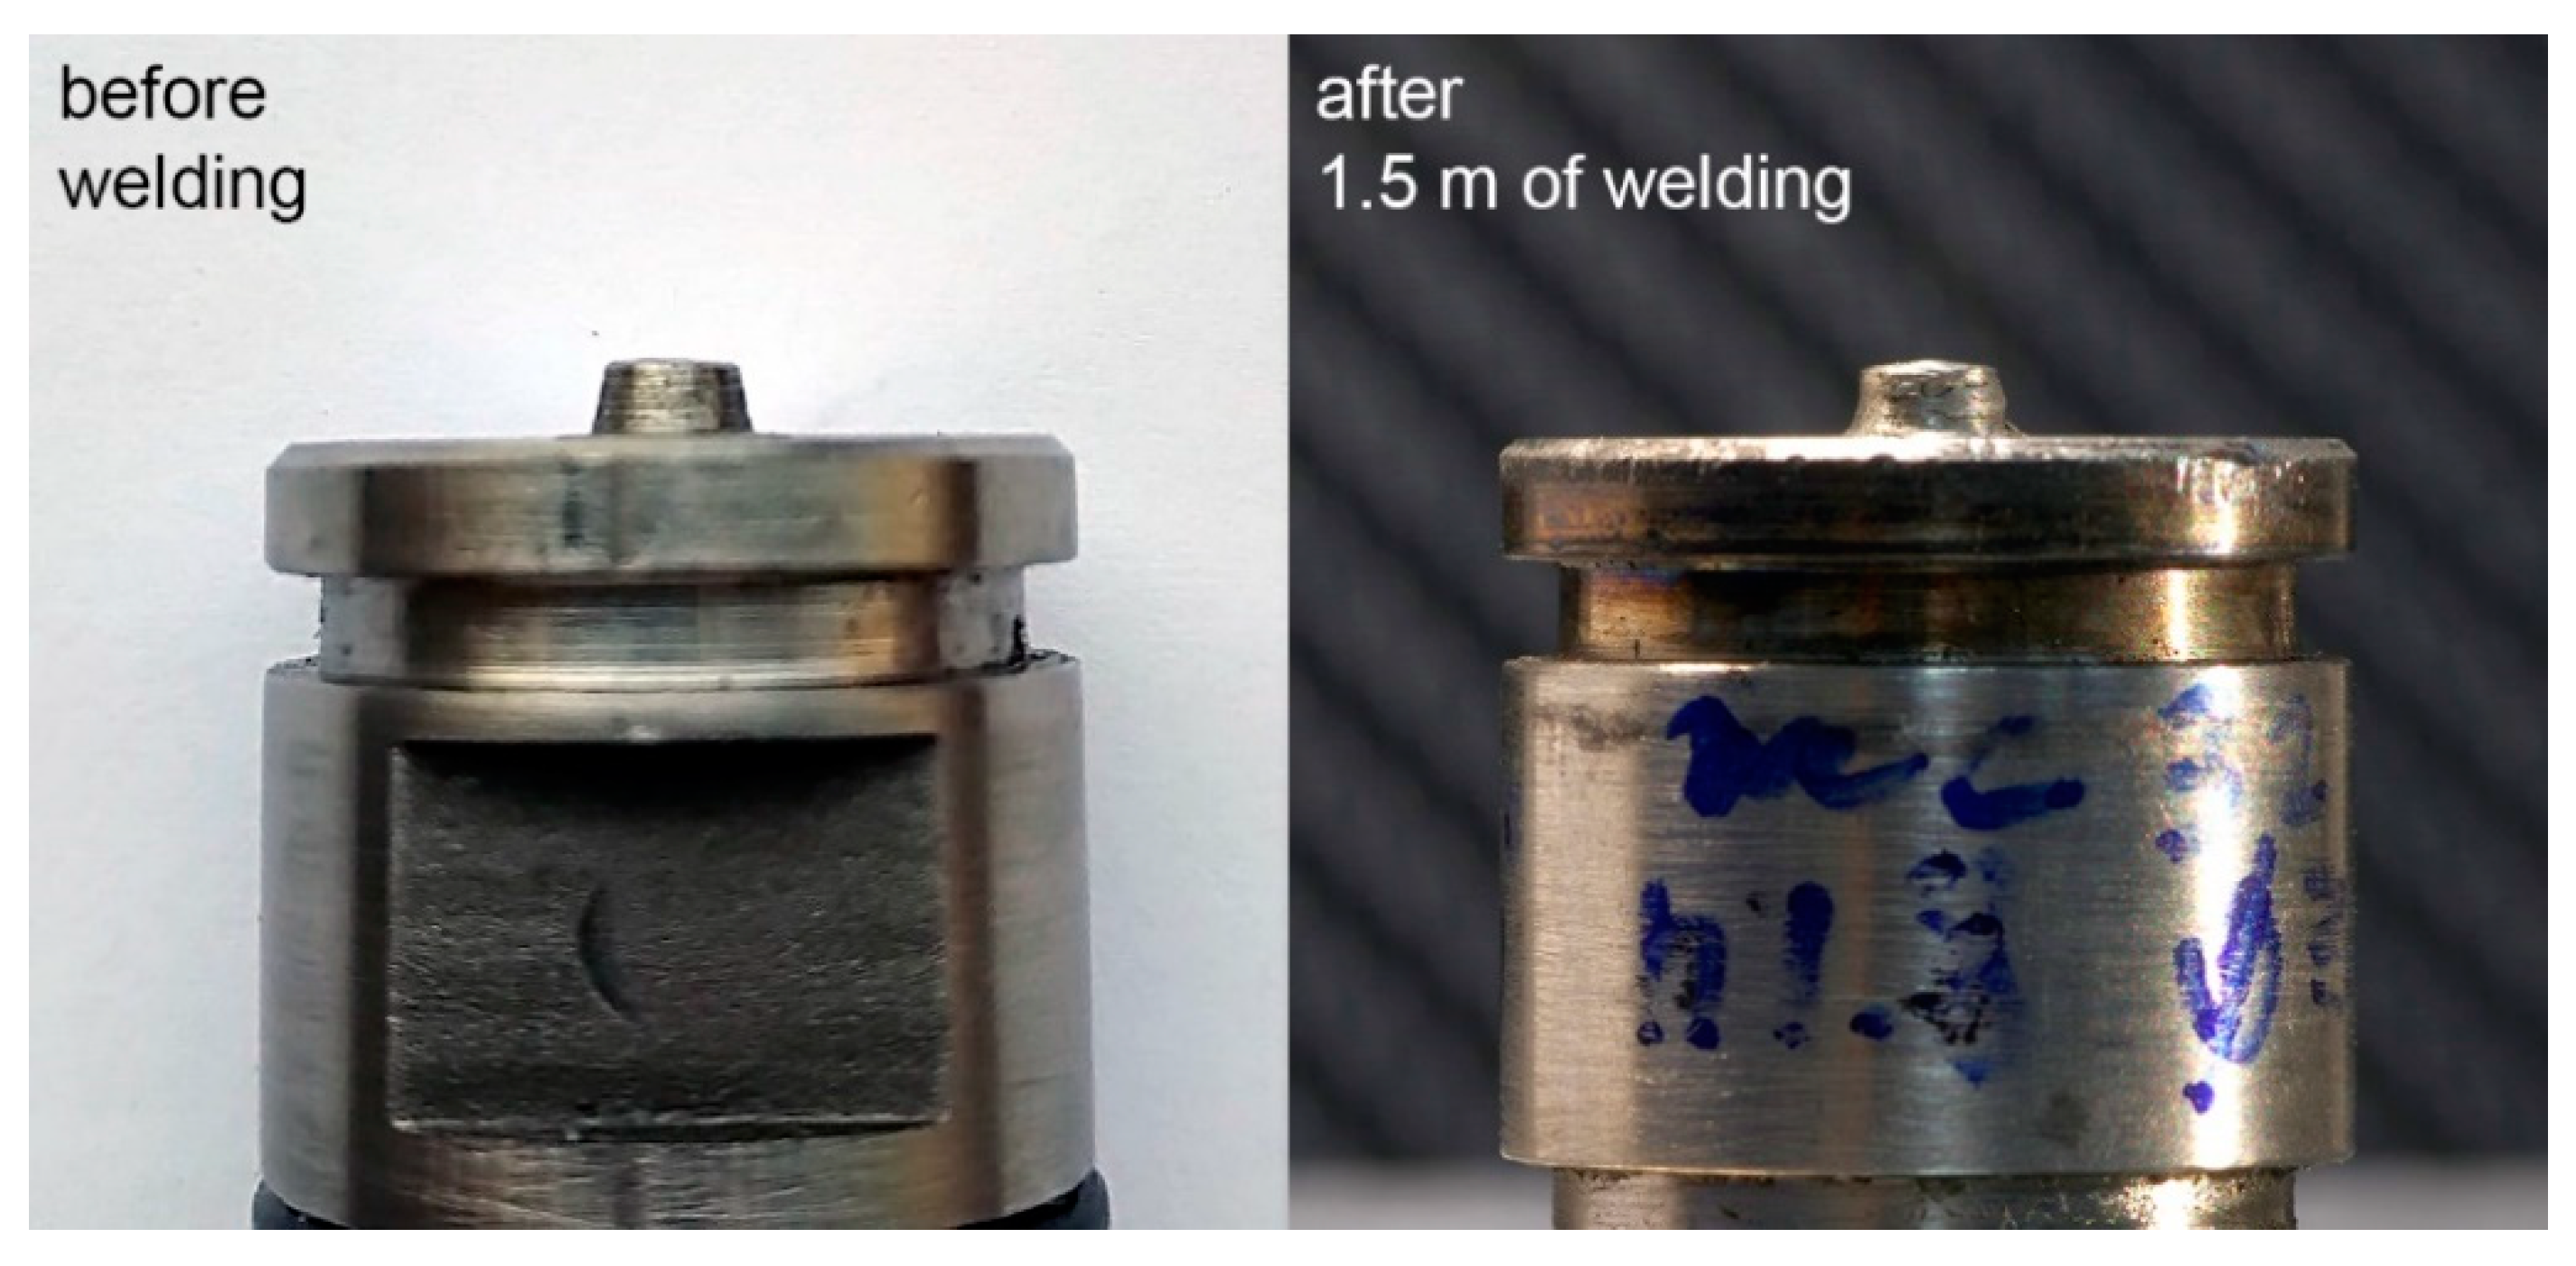
Tool wear should also be analyzed (Figure 14) as the tool is worn during the welding process and leaves debris in the weld, as well as the pin shape, which can affect stirring and the stir zone area. It was found that, after 1.5 m of welding, the pin length remained the same, but the shape changed slightly. In particular, the pin edges became rounded and the cone angle decreased slightly. The lateral surface of the pin appeared somewhat concave, which is partly due to adhered titanium. In general, tool wear was low.
From the results obtained, it can be concluded that modes no.8 and no.13 are the optimum modes for producing high-quality joints from 2 mm-thick Ti–1.5Al–1Mn titanium alloy. These joints have high mechanical properties and high stability of characteristics along the weld, which is explained by the high stability of the welding process at the selected process parameters.
4. Conclusions
In the present paper, we investigated the mechanical properties and structure of friction stir welded joints of 2 mm-thick Ti–1.5Al–1Mn titanium alloy. The main results of this investigation are as follows:
- -
- The fundamental role of the axial load in friction stir welding was shown. With load increasing to a certain value, the heat input increased and the friction coefficient decreased. In so doing, the torque increased, since the mass transfer grew due to higher adhesion.
- -
- A joint with 92% of the strength of the base metal was first obtained for 2 mm-thick Ti–1.5Al–1Mn titanium alloy. The fatigue durability of the best specimen was statistically equivalent to that of the base metal.
- -
- The ductility of the joints was less than that of the base metal. In particular, the elongation of the joints was 70–92% of the elongation of the base material. This was caused by significant recrystallization in the stir zone and a four-fold decrease in grain size. For the same reason, the microhardness of the stir zone was higher than that of the base metal by 8%.
- -
- The most optimal weld was obtained with maximum heat input and minimum friction coefficient, torque, and longitudinal force. Additionally, one of the best joints was produced with high heat input and the minimum friction coefficient, but the torque and longitudinal force were quite high. This suggests a large range of acceptable parameters.
- -
- The weld macrostructure was typical of FSW with some exceptions; it lacked a heat-affected zone and the TMAZ was extremely narrow (about 0.2 mm) due to the relatively low thermal conductivity. The boundary between the zones was sharply gradient. In the subsurface of the stir zone there was a layer with coarse grains. In the area left behind the pin, the shoulders continued to exert a thermal effect on the material, which had low thermal conductivity, thus causing grains to grow. In general, this effect is thought to be negative.
- -
- The tool made of ZhS32 nickel superalloy produced a 1.5 mm weld without significant wear.
Author Contributions
Conceptualization, E.K.; Funding acquisition, E.K.; Investigation, A.E., A.A., T.K. and A.V.; Methodology, A.E.; Writing—original draft, A.E.; Writing—review and editing, E.K. All authors have read and agreed to the published version of the manuscript.
Funding
The work was performed according to the Government research assignment for the ISPMS SB RAS, project FWRW-2021-0006.
Data Availability Statement
Not applicable.
Conflicts of Interest
The authors declare no conflict of interest.
References
- Lütjering, G.; Williams, J.C. Titanium; Springer: Berlin, Germany, 2003; Volume 2. [Google Scholar]
- Zwicker, U. Titanium and Titanium Alloys (German Book); Springer: Berlin, Germany, 1974; Volume 21. [Google Scholar]
- Butler, C.J.; McCartney, D.G.; Small, C.J.; Horrocks, F.J.; Saunders, N. Solidification microstructures and calculated phase equilibria in the Ti-Al-Mn system. Acta Mater. 1997, 45, 2931–2947. [Google Scholar] [CrossRef]
- Amirov, A.I.; Eliseev, A.A.; Beloborodov, V.A.; Chumaevskii, A.V.; Gurianov, D.A. Formation of α’titanium welds by friction stir welding. J. Phys. Conf. Ser. 2020, 1611, 012001. [Google Scholar] [CrossRef]
- Cheng, M.; Yu, B.; Guo, R.; Shi, X.; Xu, L.; Qiao, J.; Yang, R. Electron beam welding of a novel near α high temperature titanium alloy powder compact: Effect of post-welding heat treatment on tensile properties. J. Mater. Res. Technol. 2021, 10, 153–163. [Google Scholar] [CrossRef]
- Liu, Y.; Liu, F.; He, R.; Wang, Q.; Wang, C.; He, C.; Kashif, K.M.; Chen, Y. Mechanical behaviors of electron beam welded titanium alloy up to very high cycle fatigue under different process conditions. Mater. Sci. Eng. A 2021, 802, 140685. [Google Scholar] [CrossRef]
- Xu, Z.-Z.; Dong, Z.-Q.; Yu, Z.-H.; Wang, W.-K.; Zhang, J.-X. Relationships between microhardness, microstructure, and grain orientation in laser-welded joints with different welding speeds for Ti6Al4V titanium alloy. Trans. Nonferrous Met. Soc. China 2020, 30, 1277–1289. [Google Scholar] [CrossRef]
- Palanivel, R.; Dinaharan, I.; Laubscher, R. A comparative study on microstructure and mechanical properties between friction and laser beam welded titanium tubes. Optik 2019, 177, 102–111. [Google Scholar] [CrossRef]
- Chen, Z.W.; Yazdanian, S. Microstructures in interface region and mechanical behaviors of friction stir lap Al6060 to Ti–6Al–4V welds. Mater. Sci. Eng. A 2015, 634, 37–45. [Google Scholar] [CrossRef]
- Mishra, R.S.; Ma, Z.Y. Friction stir welding and processing. Mater. Sci. Eng. R Rep. 2005, 50, 1–78. [Google Scholar] [CrossRef]
- Nandan, R.; Debroy, T.; Bhadeshia, H. Recent advances in friction-stir welding—Process, weldment structure and properties. Prog. Mater. Sci. 2008, 53, 980–1023. [Google Scholar] [CrossRef] [Green Version]
- Li, B.; Shen, Y.; Hu, W.; Luo, L. Surface modification of Ti–6Al–4V alloy via friction-stir processing: Microstructure evolution and dry sliding wear performance. Surf. Coat. Technol. 2014, 239, 160–170. [Google Scholar] [CrossRef]
- Fall, A.; Fesharaki, M.H.; Khodabandeh, A.R.; Jahazi, M. Tool Wear Characteristics and Effect on Microstructure in Ti–6Al–4V Friction Stir Welded Joints. Metals 2016, 6, 275. [Google Scholar] [CrossRef] [Green Version]
- Mironov, S.; Sato, Y.S.; Kokawa, H. Friction-stir welding and processing of Ti–6Al–4V titanium alloy: A review. J. Mater. Sci. Technol. 2018, 34, 58–72. [Google Scholar] [CrossRef]
- Su, J.; Wang, J.; Mishra, R.S.; Xu, R.; Baumann, J.A. Microstructure and mechanical properties of a friction stir processed Ti–6Al–4V alloy. Mater. Sci. Eng. A 2013, 573, 67–74. [Google Scholar] [CrossRef]
- Wang, J.; Su, J.; Mishra, R.S.; Xu, R.; Baumann, J.A. Tool wear mechanisms in friction stir welding of Ti–6Al–4V alloy. Wear 2014, 321, 25–32. [Google Scholar] [CrossRef]
- Zhou, L.; Liu, H.J.; Liu, Q.W. Effect of rotation speed on microstructure and mechanical properties of Ti–6Al–4V friction stir welded joints. Mater. Des. 2010, 31, 2631–2636. [Google Scholar] [CrossRef]
- Amirov, A.I.; Eliseev, A.A.; Rubtsov, V.E.; Utyaganova, V.R. Butt friction stir welding of commercially pure titanium by the tool from a heat-resistant nickel alloy. AIP Conf. Proc. 2009, 2167, 020016. [Google Scholar] [CrossRef]
- Mironov, Y.P.; Grishkov, V.N.; Lotkov, A.I.; Rubtsov, V.Y.; Beloborodov, V.A. Influence of friction stir processing on the structure and phase state of TiNi alloys. AIP Conf. Proc. 2009, 2167, 020226. [Google Scholar] [CrossRef]
- Kalashnikov, K.N.; Ivanov, A.N.; Beloborodov, V.A. Steel surface wear under adhesive friction conditions. AIP Conf. Proc. 2019, 2167, 020144. [Google Scholar]
- Colligan, K.J.; Mishra, R.S. A conceptual model for the process variables related to heat generation in friction stir welding of aluminum. Scr. Mater. 2008, 58, 327–331. [Google Scholar] [CrossRef]
- Lyubimov, D.N.; Kolesnikov, V.I.; Gershman, I.S.; Kolesnikov, I.V. A Criterion for the Choice of Friction Materials Based on the Lifshitz-Hamaker Theory of Adhesive Interaction. Phys. Mesomech. 2020, 23, 509–513. [Google Scholar] [CrossRef]
- Kim, Y.G.; Fujii, H.; Tsumura, T.; Komazaki, T.; Nakata, K. Three defect types in friction stir welding of aluminum die casting alloy. Mater. Sci. Eng. A 2006, 415, 250–254. [Google Scholar] [CrossRef]
- Errandonea, D.; Schwager, B.; Ditz, R.; Gessmann, C.; Boehler, R.; Ross, M. Systems of transition-metal melting. Phys. Rev. B 2001, 63, 132104. [Google Scholar] [CrossRef]
- Naydenkin, E.V.; Soldatenkov, A.P.; Mishin, I.P.; Oborin, V.A.; Shanyavskiy, A.A. Very High Cycle Fatigue Failure of Near β Titanium Alloy. Phys. Mesomech. 2021, 24, 326–334. [Google Scholar] [CrossRef]
- Mironov, S.; Sato, Y.S.; Kokawa, H. Grain Structure Evolution during Friction-Stir Welding. Phys. Mesomech. 2020, 23, 21–31. [Google Scholar] [CrossRef]
Figure 1.
Friction stir welding diagram (a) and tool diagram (b).

Figure 2.
Appearance of welds no.8 (a), no.5 (b), no.8 with higher magnification (c), and no.4 (d).

Figure 3.
Dependence of the longitudinal force (a) and torque (b) on the FSW time in modes no.3 and no.9.
Figure 3.
Dependence of the longitudinal force (a) and torque (b) on the FSW time in modes no.3 and no.9.

Figure 4.
Effect of feed rate (a), rotation speed (b) and axial load (c) on the longitudinal force in modes no.1–4, no.5–8, and no.9–13 respectively; Effect of feed rate (d), rotation speed (e), and axial load (f) on torque in modes no.1–4, no.5–8, and no.9–13 respectively; effect of feed rate (g), rotation speed (h), and axial load (i) on heat input in modes no.1–4, no.5–8, and no.9–13 respectively; effect of feed rate (j), rotation speed (k), and axial load (l) on friction coefficient in modes no.1–4, no.5–8, and no.9–13, respectively.

Figure 5.
Results of thermography of friction stir welding for samples no.5 and no.8.

Figure 6.
Appearance of welded specimens no.4, no.8, no.9, no.12, and no.13 after mechanical tests (a) and characteristic stress–strain diagrams of initial metal and weld no.13 (b).
Figure 6.
Appearance of welded specimens no.4, no.8, no.9, no.12, and no.13 after mechanical tests (a) and characteristic stress–strain diagrams of initial metal and weld no.13 (b).

Figure 7.
Appearance of specimens no.8, no.9, no.12, and no.13 after fatigue tests (a) and typical fracture localization scheme in defect-free joints (b) and defective joints (c).
Figure 7.
Appearance of specimens no.8, no.9, no.12, and no.13 after fatigue tests (a) and typical fracture localization scheme in defect-free joints (b) and defective joints (c).

Figure 8.
Fractography of the initial (a,d) and welded materials no.4 (b), no.12 (e), and no.13 (c,f) after tensile test (a,b,c) and fatigue test (d,e,f).
Figure 8.
Fractography of the initial (a,d) and welded materials no.4 (b), no.12 (e), and no.13 (c,f) after tensile test (a,b,c) and fatigue test (d,e,f).

Figure 9.
Microhardness line graph of weld no.12.

Figure 10.
Macrostructure of 2 mm thick Ti–1.5Al–1Mn titanium alloy specimens after friction stir welding on mode no.9 (a) and no.4 (b).
Figure 10.
Macrostructure of 2 mm thick Ti–1.5Al–1Mn titanium alloy specimens after friction stir welding on mode no.9 (a) and no.4 (b).

Figure 11.
SEM image of the tool debris in the stir zone in BSE mode.

Figure 12.
Grain structure of the initial material (a) and in the stir zone of the mode no.12 specimen (b).
Figure 12.
Grain structure of the initial material (a) and in the stir zone of the mode no.12 specimen (b).

Figure 13.
SEM image of the boundary between the stir zone and TMAZ.

Figure 14.
Appearance of the tool before and after welding.


Table 1.
Technological modes of friction stir welding.
| no. | Feed Rate, mm/min | Rotation Rate, RPM | Axial Load, kg |
|---|---|---|---|
| 1 | 100 | 450 | 2600 |
| 2 | 120 | 450 | 2600 |
| 3 | 140 | 450 | 2600 |
| 4 | 160 | 450 | 2600 |
| 5 | 90 | 450 | 2000 |
| 6 | 90 | 550 | 2000 |
| 7 | 90 | 600 | 2000 |
| 8 | 90 | 650 | 2000 |
| 9 | 90 | 450 | 2000 |
| 10 | 90 | 450 | 2200 |
| 11 | 90 | 450 | 2400 |
| 12 | 90 | 450 | 2600 |
| 13 | 90 | 450 | 2800 |
Table 2.
Results of mechanical tests of the welds.
| no. | Tensile Strength MPa, (% of Initial) | Relative Elongation, MPa | Maximum Bending Angle, ° | Number of Cycles to Failure, Thousands |
|---|---|---|---|---|
| Initial | 639.1 ± 0.5 | 27.5 ± 0.5 | - | 550 ± 99 |
| 4 | 578.5 ± 0.5 (91) | 23.6 ± 0.2 | 135 ± 39 | 310 ± 151 |
| 8 | 586.3 ± 0.1 (92) | 19.5 ± 0.4 | 180 | 459 ± 50 |
| 9 | 582 ± 2 (91) | 25.5 ± 0.3 | 180 | 201 ± 99 |
| 12 | 576.3 ± 0.5 (90) | 22 ± 4 | 180 | 286 ± 119 |
| 13 | 589 ± 3 (92) | 21 ± 1 | 180 | 2724 ± 141 |
Table 3.
Measured values of microhardness in the weld and near it; HV.
| no. | Stir Zone | TMAZ | BM |
|---|---|---|---|
| 1 | 286 ± 10 | 244 ± 10 | 235 ± 10 |
| 8 | 290 ± 3 | 255 ± 10 | 234 ± 3 |
| 9 | 310 ± 5 | 270 ± 4 | 214 ± 10 |
| 12 | 291 ± 1 | 275 ± 10 | 224 ± 10 |
| 13 | 285 ± 2 | 252 ± 3 | 227 ± 4 |
| Initial state | 224 ± 10 | ||
Table 4.
Results of EDS analysis of the areas from Figure 11, wt.%.
Table 4.
Results of EDS analysis of the areas from Figure 11, wt.%.
| Element | Spectrum 1 | Spectrum 2 | Spectrum 3 |
|---|---|---|---|
| Al | 1.45 | 3.65 | 1.57 |
| Ti | 97.12 | 78.41 | 82.24 |
| Cr | - | 1.37 | 1.61 |
| Mn | 0.43 | 1.05 | 1.16 |
| Co | - | 1.66 | 1.64 |
| Ni | - | 12.08 | 10.72 |
| W | - | 1.78 | 1.05 |
Table 5.
Measured values of structural characteristics of welds.
| no. | Stir Zone Area, mm2 | Grain Size, μm |
|---|---|---|
| Initial state | - | 6 ± 1 |
| 4 | 8.8 ± 01 | 1.5 ± 0.3 |
| 8 | 8.2 ± 0.1 | 1.5 ± 0.2 |
| 9 | 7.8 ± 0.1 | 1.6 ± 0.1 |
| 12 | 12.3 ± 0.1 | 1.6 ± 0.2 |
| 13 | 8.4 ± 0.1 | 1.3 ± 0.1 |
Publisher’s Note: MDPI stays neutral with regard to jurisdictional claims in published maps and institutional affiliations. |
© 2021 by the authors. Licensee MDPI, Basel, Switzerland. This article is an open access article distributed under the terms and conditions of the Creative Commons Attribution (CC BY) license (https://creativecommons.org/licenses/by/4.0/).
Share and Cite
MDPI and ACS Style
Eliseev, A.; Amirov, A.; Kalashnikova, T.; Vorontsov, A.; Kolubaev, E. Production of Ti–1.5Al–1Mn Titanium Alloy Butt Joints by Friction Stir Welding. Metals 2021, 11, 1566. https://0-doi-org.brum.beds.ac.uk/10.3390/met11101566
AMA Style
Eliseev A, Amirov A, Kalashnikova T, Vorontsov A, Kolubaev E. Production of Ti–1.5Al–1Mn Titanium Alloy Butt Joints by Friction Stir Welding. Metals. 2021; 11(10):1566. https://0-doi-org.brum.beds.ac.uk/10.3390/met11101566
Chicago/Turabian StyleEliseev, Alexander, Alihan Amirov, Tatyana Kalashnikova, Andrey Vorontsov, and Evgeny Kolubaev. 2021. "Production of Ti–1.5Al–1Mn Titanium Alloy Butt Joints by Friction Stir Welding" Metals 11, no. 10: 1566. https://0-doi-org.brum.beds.ac.uk/10.3390/met11101566
Note that from the first issue of 2016, this journal uses article numbers instead of page numbers. See further details here.