Article

Modelling and Analysis of Surface Evolution on Turning of Hard-to-Cut CLARM 30NiCrMoV14 Steel Alloy

1
Department of Industrial Engineering, University of Engineering and Technology, Taxila 47050, Pakistan
2
Department of Mechanical Engineering, Narowal Campus, University of Engineering and Technology Lahore, Narowal 51600, Pakistan
3
School of Mechanical Engineering, University of Leeds, Leeds LS2 9JT, UK
4
Faculty of Integrated Technologies, Universiti Brunei Darussalam, Jalan Tungku Link, Gadong BE 1410, Brunei
5
Department of Automated Mechanical Engineering, South Ural State University, Lenin Prosp. 76, 454080 Chelyabinsk, Russia
6
School of Mechanical and Design Engineering, University of Portsmouth, Portsmouth PO1 3DJ, UK
7
Institute of Mechanical Engineering, University of Zielona Gora, 4 Prof. Z. Szafrana Street, 65-516 Zielona Gora, Poland
*
Authors to whom correspondence should be addressed.
Submission received: 5 September 2021 / Revised: 24 October 2021 / Accepted: 27 October 2021 / Published: 31 October 2021
(This article belongs to the Special Issue Optimization and Analysis of Metal Cutting Processes)

Abstract

:
Industrial practitioners are working on predictive solutions for the precise evaluation of input parameters and processed surfaces of engineering materials. To aid the aeronautical industry, this study is an effort to develop the mathematical modelling for comprehensive surface analysis of input parameters and surface finish after dry machining of CLARM HBR, a steel alloy with attractive mechanical properties and wide applications in large caliber gun barrels and high-pressure vessels. Feed rate, rotational speed, and depth of cut were taken as quantitative parameters, whereas machining time was considered as a categorical factor with a classification of three levels. Response surface methodology (RSM) with a central component design has been used for the constitution of the experimental design, mathematical modelling, and analysis of developed models. Eighteen samples were prepared to perform the experimentation for the development of prediction models. The adequacy of the developed models was verified using analysis of variance (ANOVA), and the models were validated using confirmatory trial experiments, which revealed the experimental results agreeing with predictions. The feed rate was the most significant parameter in achieving the desired surface finish. An increase in rotational speed at a low feed rate resulted in very fine surface texture, as though it deteriorated the surface finish at higher feed rates. The superior surface quality obtained was 0.137 μm at parametric settings of 0.19 mm/rev feed, 90 rpm speed, 3 mm depth of cut, and 4 min time. Overall, higher values of surface roughness were frecorded in the third level of process variable time. The developed empirical models are expected to aid manufacturers and machining practitioners in the prediction of the desired surface finish concerning different parameters before the experimentations.

1. Introduction

Approximately 400 million small and medium-sized enterprises around the world contribute to global manufacturing, with average revenue ranging from $5–$10 million. In the USA, 28 million enterprises mainly account for 54% of the country’s sales [1]. The fluctuations in the revenues globally affect the die and mold sector directly. In 2017, imports and exports related to dies and molds of China’s manufacturing sector reached US $7.5 billion, showing an annual increase of 11.01% [2]. Modern-day industrial demands are compelling manufacturers to seek the most sophisticated engineering materials that can cope with these ever-increasing requirements due to their highly competitive physical and mechanical properties [3,4]. While these modern materials are selected for designed requirements, it is equally important to choose the most compatible manufacturing processes that are the least harmful to the products and the overall structures [5,6]. Among the manufacturing processes, machining is a widely used shape-changing process that may alter the mechanical properties of machined parts. However, it needs to be carried out in a controlled fashion. One challenge with machined parts made by alloy steels is minimizing the surface roughness influenced by the tool wear and other machining parameters [7,8].
In the past, hard turning/machining of alloy steel components emerged as a very popular and effective technique that can replace successive grinding processes and give a comparable surface finish [9]. During hard machining/turning of forged, heat-treated materials, reasonable dimensional accuracy can be achieved and machining time has been reduced by up to 60% [10,11]. Other reasons for hard turning being considered as a better option as compared to grinding include substantial reduction in manufacturing cycles and costs, reduction in setting up times, and exclusion of environmentally unsafe coolants [12]. However, these advantages cannot be fully achieved without the proper optimization of cutting parameters [13,14]; in particular, the effects of machining parameters on surface roughness need to be precisely investigated [15,16]. Modelling and optimization of process parameters to achieve desired surface roughness are, therefore, imperative for the meaningful application of hard turning/machining [17].
Many researchers from industry and academia have worked on machining parameters to investigate their effects on surface roughness. As far as the literature on the hard machining of modern alloys is concerned, an appropriate amount of research has reported on experimentation-oriented works that did not necessarily emphasize modelling and future predictions. The studies by Ippolito et al. [12] on high-speed machining of steel, Grzesik [17] on the hard turning of 40 H steel, Das et al. [13] on AISI 52100 hardened steel, Chinchanikar et al. [18] on the hard turning of AISI 4340 steel, and Carou et al. [19] on UNS M11917 magnesium alloy during intermittent turning are a few instances of such literature. The main problem in the previous research work is that they presented only limited clues about a future prediction tool regarding the effects of machining parameters on surface roughness.
In recent decades, many studies have, therefore, reported on modelling and simulation of the machining characteristics to establish predictive analyses of surface finish consequences. Researchers have utilized several statistical and empirical techniques for the modelling of machining characteristics. In many cases, regression analysis was applied to develop the models. A few instances of regression analysis include the studies by Das et al. [13] to predict the effects of different parameters on surface finish during hard turning of EN 24 steel and the work reported by Kini and Chincholkar [20] to investigate the effects during turning of glass fiber-reinforced polymer. Das et al. [13] combined Taguchi orthogonal array to design the experiments. On top of the statistical techniques, researchers have combined traditional modelling tools, like the finite element method (e.g., Kini et al. [20]), and non-traditional techniques, like artificial neural networks (e.g., Nalbant et al. [10]), to constitute the predictive mathematical models.
However, it has been recognized from the literature that response surface methodology (RSM) is one of the most effective statistical modelling techniques due to its good predictive capacity, information transferring characteristics, and good data approximations with appropriate combinations of parameters [21]. In the recent past, RSM has, therefore, been utilized for empirical modelling to predict the real-time effects of machining parameters on surface finish. Mandal et al. [11] worked out the effects of depth of cut (DOC), cutting speed, and feed on surface finish in HSM (high-speed machining) of AISI 4340 steel using a zirconia-toughened alumina cutting insert and developed a second-order mathematical model to predict surface finish for a given set of parameters. RSM models developed by Lalwani et al. [22] provided different relationships between machining parameters and surface finish during hard turning of MDN250 steel.
The focus of much of the literature [23] and, specifically, Suresh et al. [24] has been on hardened AISI 4340 steel, in order to develop its RSM-based predictive models during machining. The workpiece material used by Gaitonde et al. [25] in their RSM modelling was AISI D2 cold-worked tool steel, and the tool was made of ceramics with a TiN coating. Noordin et al. [26] investigated the effects of a variety of machining parameters on surface finish during turning of AISI 1045 steel using a multilayer tungsten carbide tool. Some researchers have also implemented RSM to analyze the machining effects on surfaces of superalloys. Some instances include Ezilarasan et al. [27] and Ezilarasan and Velayudham [28] on Nimonic C-263 alloy. Despite the wide variety of RSM applications in different machining, non-machining, and other industrial problems, there is no comprehensive modelling in the literature that presents predictions about real-time machining behaviors of steel alloys like CLARM-HBR, which is a martensitic, forged, and heat-treated alloy steel.
The literature review shows that researchers have worked on different alloy steels, super alloys, and non-metallic alloys, as discussed earlier. The effects of significant contributing parameters like feed, speed, and depth of cut have been identified in turning operations under wet conditions, using MQL and hard turning for a variety of materials. However, the real-time behavior of these process parameters on CLARM HBR steel alloy, despite its excellent mechanical properties and attractive applications in pressure vessels, has not yet been analyzed, even with traditional methodologies other than RSM. Based on the research gaps explored, the scope of the current research was to develop a predictive mathematical model incorporating in-depth and combined effects of feed rate, rotational speed, depth of cut, and machining time upon the surface finish of CLARM HBR steel alloy using RSM and regression analysis. The developed mathematical model was utilized to describe the surface roughness responses with respect to varying input parameters i.e., feed, speed, depth of cut, and time. The research encompassed the theoretical study of cutting tools, including tool holder types and insert geometry, and, in addition, an analysis of the impact of other significant process parameters in isolation has also been carried out. The ranges were selected in accordance with ISO 3685 and were found to be practical in relation to their subsequent utilization. Four parameters, three quantitative and one categorical, have been selected. For the quantitative parameters, five levels were identified, whereas, for the remaining, there were three levels. The experiments were designed as per RSM. Fifty-four experiments were performed per design. The surface finish and tool wear as a response was measured. A predictive model for each categorical level for a set of process parameters was developed. Evaluation of the predicted model was confirmed by performing a validation test. Recommendations for future work are given at the end.
The next section of this paper provides details about experimental setup, material specifications, and adopted procedures. The methodology of the experimentation and the experimental design are presented in Section 2. The mathematical models, developed using RSM and regression analysis based on the real-time machining data, are provided in Section 3, named “Results and Discussions”. This same section includes a discussion about response surface plots for different machining parameters, which is then followed by a conclusions section.

2. Materials and Methods

2.1. Experimental Procedure

The CLARM HBR steel alloy (30NiCrMoV14) was selected as the material for this research, owing to its utilization in high-pressure vessels, tubes, and other parts, entailing yield strength from 900~1200 MPa [29]. It holds high mechanical and physical properties and exhibits excellent impact strength, even at cryogenic temperatures. Moreover, it performs well at elevated temperatures. The chemical composition (Table 1) and mechanical properties of the CLARM HBR steel alloy are stated in Table 2.
The surface finish responses, which are mostly evaluated as a result of machining, depend upon the various cutting process parameters and the types of cutting tools. In the current study, the selected quantitative input process parameters included feed rate, speed, and depth of cut because of their direct and intensive influence on the obtained surface finish. Time, as the fourth parameter selected for this study, was considered as a categorical parameter and defined in the form of different categories, which are called “levels”.
The criteria for range selection mainly depend on the type of material, its mechanical properties, cutting tool type, and insert geometry and grade. Therefore, preliminary experimentation was carried out to select a feasible range for mature experimentation [15,30]. In this case, the selection of cutting parameters and their ranges complied with the ISO 3685 [31] and Sandvik Technical Guide [24]. The material was forged, heat-treated alloy steel with hardness ranging from 380 to 410 HB. Its composition was verified by using a spectrometer (model: PMI-MASTER PRO, OXFORD Instruments, (Concord, MA, USA)). Samples were machined to maintain a leveled surface to preempt dynamic imbalance during experimentation and alleviate any surface unevenness. In order to achieve the credible and repeatable results, prepared samples were of diameter 175 mm and 280 mm in length, which were in compliance with ISO 3685 [31].
The cutting tool holder selected for the experimentation was ISO DSDNN, with a 45° cutting entry angle. The insert was ISO SNMG 250716 (ISO 3002) (insert included an angle of 90°), a CVD-coated wear-resistant carbide substrate with thick TiCN and alpha-alumina coating (CVD/CVD-TiN-TiCN-Al2O3-TiN) that provides the wear resistance required for machining materials such as alloy steels. A Computer Numerical Control CNC lathe machine (BOOHI SK50P, Baoji Zhongcheng, Shanghai, China) equipped with Siemens 840D professional control with a 39 kW main spindle motor was utilized for performing the experiments. The RPMs of the main spindle ranged from 0–4500.
A Mahr’s Perthometer M1 (Mahr, Milton Keynes, UK) was used to measure the surface finish, which was one of the responses to be measured after experimenting with various combinations of process parameters. From an experimentation point of view, arithmetic mean “Ra” values of surface finish were measured, analyzed, and compared accordingly because of its wide acceptability in the manufacturing industry. To visualize machined surfaces, the TESA profile projector (Carmar Accuracy Co., Ltd., Taichung City 40850, Taiwan) was used.

2.2. Experimental Design

This section includes a discussion on the design of experiments (DOE) and the methodology adopted. The experimentation parameters were designed using response surface methodology (RSM)—central composite design and carried out accordingly. Various responses, which are mostly evaluated in response to machining, largely depend on the several cutting process parameters and type of cutting tool. After a thorough literature review, feed, speed, and depth of cut were found to be the main quantitative input process meters, whereas time, in this case, was the categorical parameter and fell in the same bracket of parameters [11,23,32]. The range selection mainly depends on the type of material, its mechanical properties, cutting tool type, and insert geometry and grade. In this case, the selection of cutting parameters and their ranges complied with the ISO 3685 [31] and the Sandvik Technical Guide [33]. The experimental conditions/parameters were calculated using Software Package Design-Expert version 9. There were three quantitative input parameters (i.e., feed, rotational speed, and depth of cut) with five parametric levels for a thorough investigation, whereas time, in this case, was the categorical parameter and had three levels. The number of experiments to be performed was calculated using Equation (1).
Number of Experiments = (2n + 2n + nc) × 3
where n = number of parameters, nc = number of experiments on the center point.
The value of nc ranges from 4 to 6. However, in this case, nc was taken as 4. The fourth parameter, i.e., time (categorical) had three levels, which made the total number of experiments 54.
Experiments were conducted according to the experimental design generated through parametric levels mentioned in Table 3. Based on the numbers on the specimens prepared as test samples, the outer surface was made to the required diameter by rough turning prior to the start of experimentation.

3. Results and Discussion

In this section, the results obtained through experimentations are compiled and relevant statistical techniques have been utilized for the development of corresponding mathematical models for the prediction of machining characteristics. Moreover, the recommended model validations and applied RSM for in-depth analysis of surface finish with respect to different parameters are provided.

3.1. Development of Mathematical Models

Mathematical models have been developed in this section, based on the responses measured through standard experimentations and by performing the statistical data analysis in respective commercially available software. The surface finish of the machined samples was measured using a Mahr’s Perthometer M1. The responses were measured after machining for both the quantitative and categorical parameters. As an example, the third row explains the surface finish achieved when feed rate was 0.3 mm/rev, speed was 60 rpm, and depth of cut (DOC) was 4 mm. The categorical level of time in this row was 2, i.e., 8 min, and the surface finish was Ra = 2.715. To establish the mathematical model between the input variables and response, i.e., settings which could predict the surface finish quality for a given set of parameters, Design Expert Software Package (Version 9, Stat-Ease, Minneapolis, MN, USA) was used.
The mathematical models for surface finish are given below in terms of actual variables for three time levels:
Surface Finish (Time Level 1) = −1.70364 + (8.94524 × A) − (0.013129 × B) + (0.80007 × C) + (0.11561 × A × B) + (1.62556 × A × C) − (0.014217 × B × C) − (15.18306 × A2)
Surface Finish (Time Level 2) = −1.5892 + (8.94524 × A) − (0.013129 × B) + (0.80007 × C) + (0.11561 × A × B) + (1.62556 × B × C) − (15.18306 × A2)
Surface Finish (Time Level 3) = −1.19348 + (8.94524 × A) − (0.013129 × B) + (0.80007 × C) + (0.11561 × A × B) + (1.62556 × A × C) − (0.014217 × B × C) − (15.18306 × A2)

3.1.1. Comparison of Models

To find a model that can better predict the surface finish, all the models were compared with each other. The models that had a p-value less than 0.05 were selected, as shown in Table 4. The interactions of models are stated in the table with respect to their significance. The highest interaction is the most desirable one, therefore, quadratic vs. 2FI is suggested for better representation of the system. However, the cubic vs. quadratic interaction was aliased. Alias refers to the variables that are linearly dependent on others, causing multicollinearity, which hinders prediction, Therefore, the model interactions were significantly good in terms of quadratic vs. 2FI.

3.1.2. Lack of Fit Test

The sum of squares is calculated based on the components of the residuals in ANOVA. It is used as the numerator for the F-test of a null hypothesis, which affirms that the model is valid and fits well. The next step was to perform a lack of fit test. The model that had a high F value was selected. As shown in Table 5, based on the lack of fit test, the quadratic model had a higher F value than the cubic and 2FI models.

3.1.3. Model Summary Statistics

The R-squared value is of great importance in the statistical analysis as it shows the confidence of the model for the prediction of the responses over continuous predictors. The quadratic model had an acceptable standard deviation, and the R-squared value was close to unity, as shown in Table 6. This shows that the quadratic model is best for predicting the surface finish of the machined surface for a given set of parameters.

3.1.4. ANOVA for Surface Finish

ANOVA for the surface finish was performed at a confidence level of 95%, as shown in Table 7. The model had a p-value of 0.0001, which was less than 0.05, showing that the model was significant. All other significant factors have also been mentioned in Table 7, and it had a p-value less than 0.05. The independent, combined, and exponential effect of significant input variables is listed in Table 7.

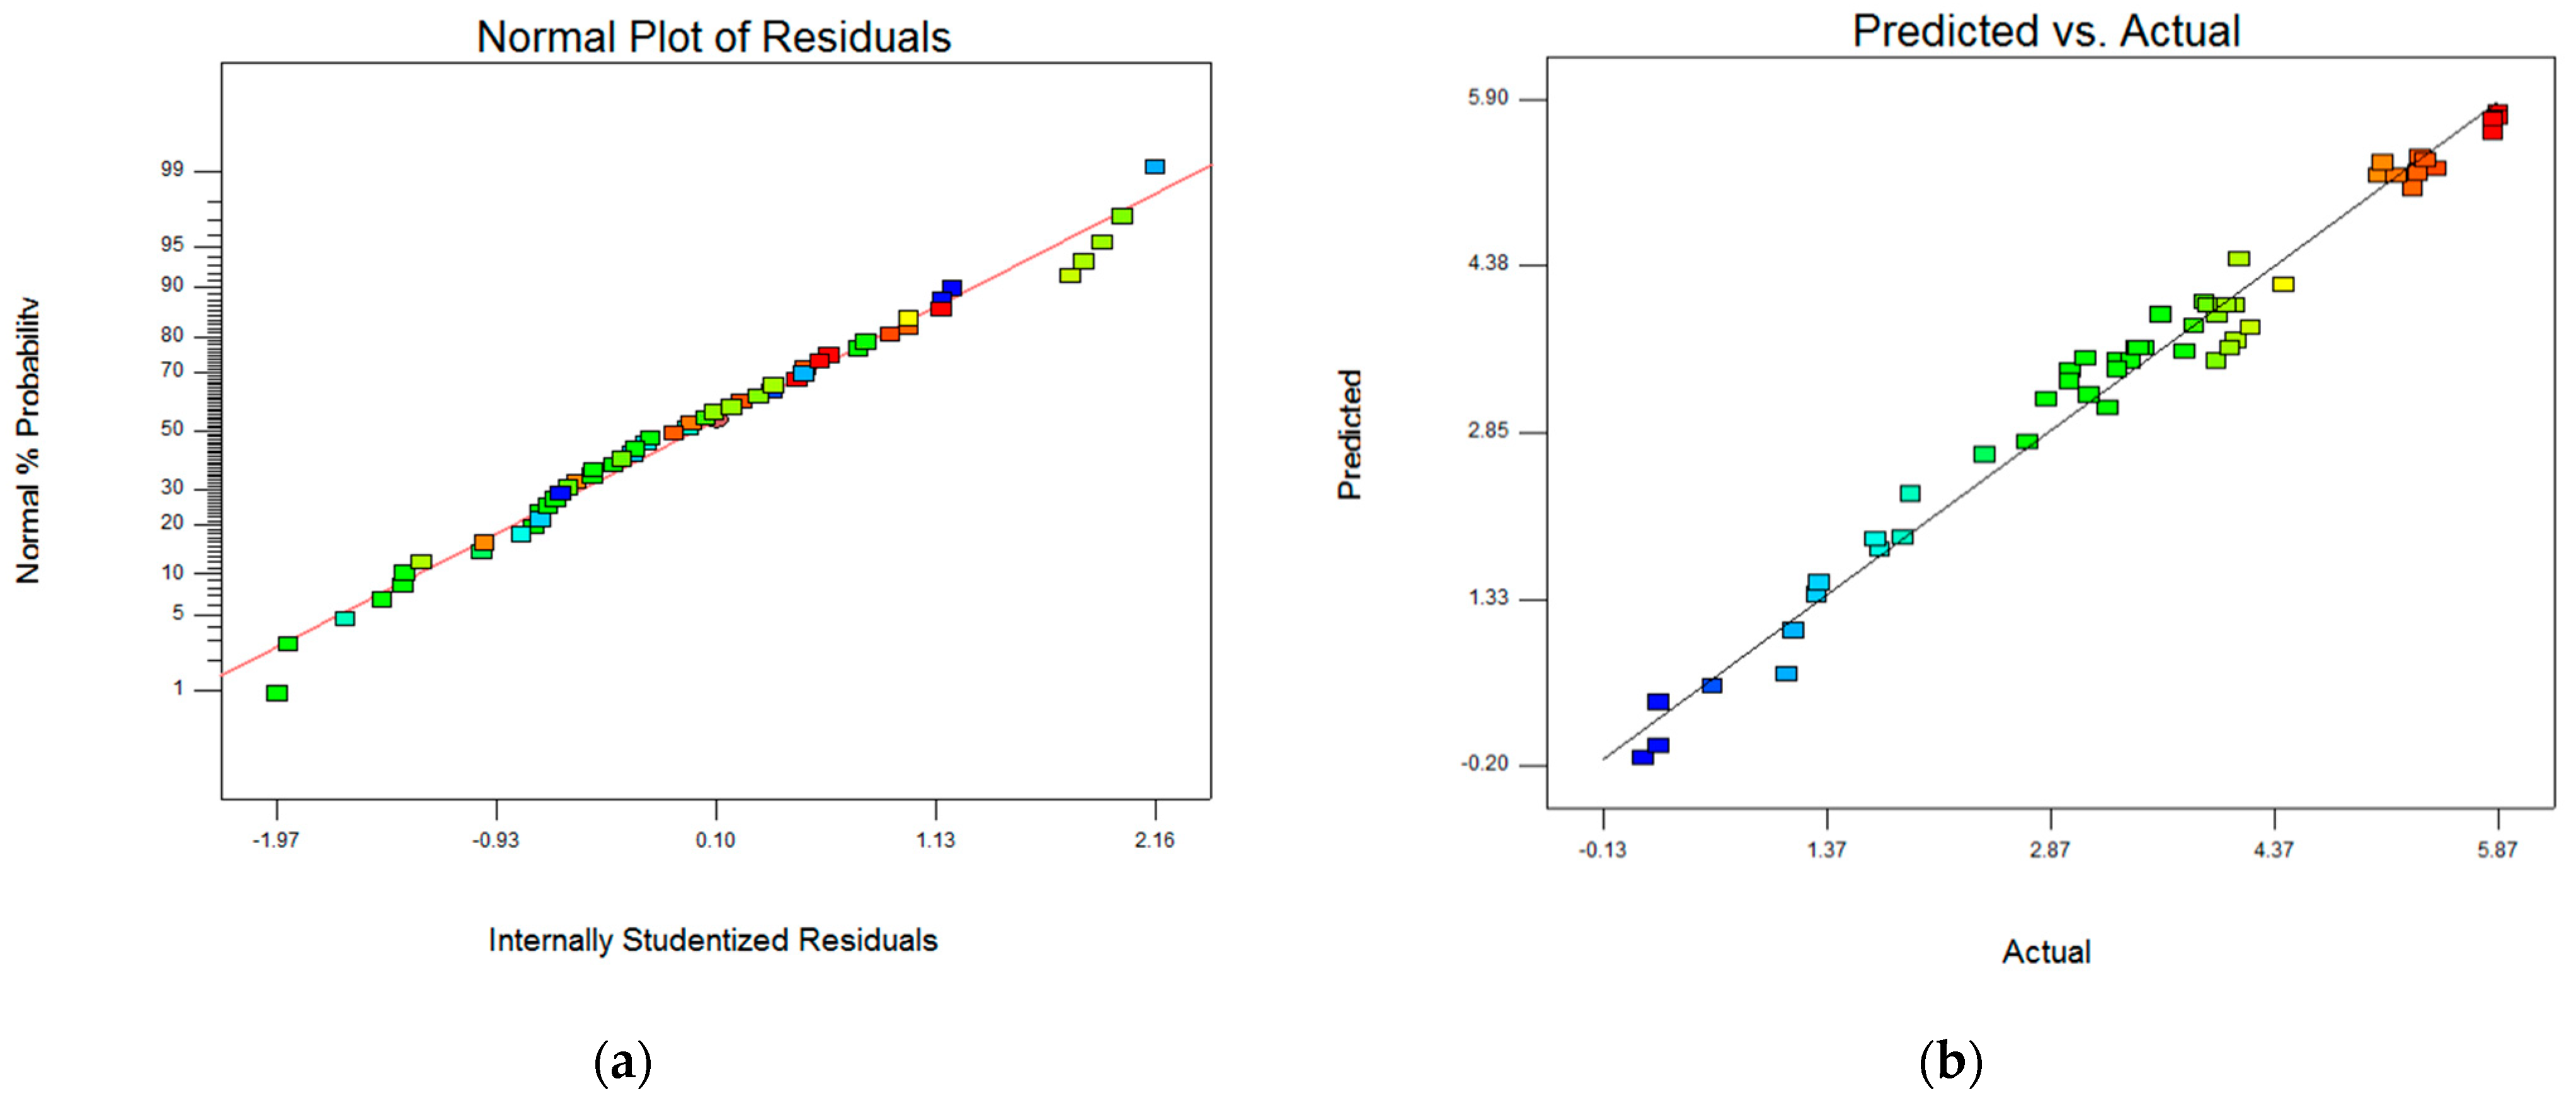
3.2. Adequacy Measures and Model Validation

The developed mathematical models have been validated using statistical analysis to ensure their adequacy. One attribute to measure the model adequacy is the coefficient of determination, “R2”, which should be closer to unity for a model to be considered as an accurate one. In the current case, the R2 value of 0.9788 justified this requirement. Moreover, the value of adequate precision, which is a signal-to-noise ratio, was computed as 55.097 (greater than 4), thus another statistical test approved the developed mathematical models. As per the standard procedure of ANOVA, residuals for surface finish were plotted as shown in Figure 1a. All points lie on the line, which means that the error was normally distributed, thus confirming the normality assumptions. Figure 1b shows the graph of predicted against actual values of surface roughness. The line in the middle shows the predicted value of surface roughness and the points represent the actual values obtained from experiments. The points of predicted values are situated very close to the line representing the actual values, which means that the predictability of the models is strong enough to consider them as adequate models.
It can, therefore, be concluded from these validation tests that the developed empirical models are capable of predicting the responses precisely with only minor deviations.

3.3. Response Surface Plots

This section shows the comparative effects of feed, speed, and depth of cut on the surface finish with respect to different time levels. These effects were plotted using the response surface methodology and are represented in the form of 3D graphs.

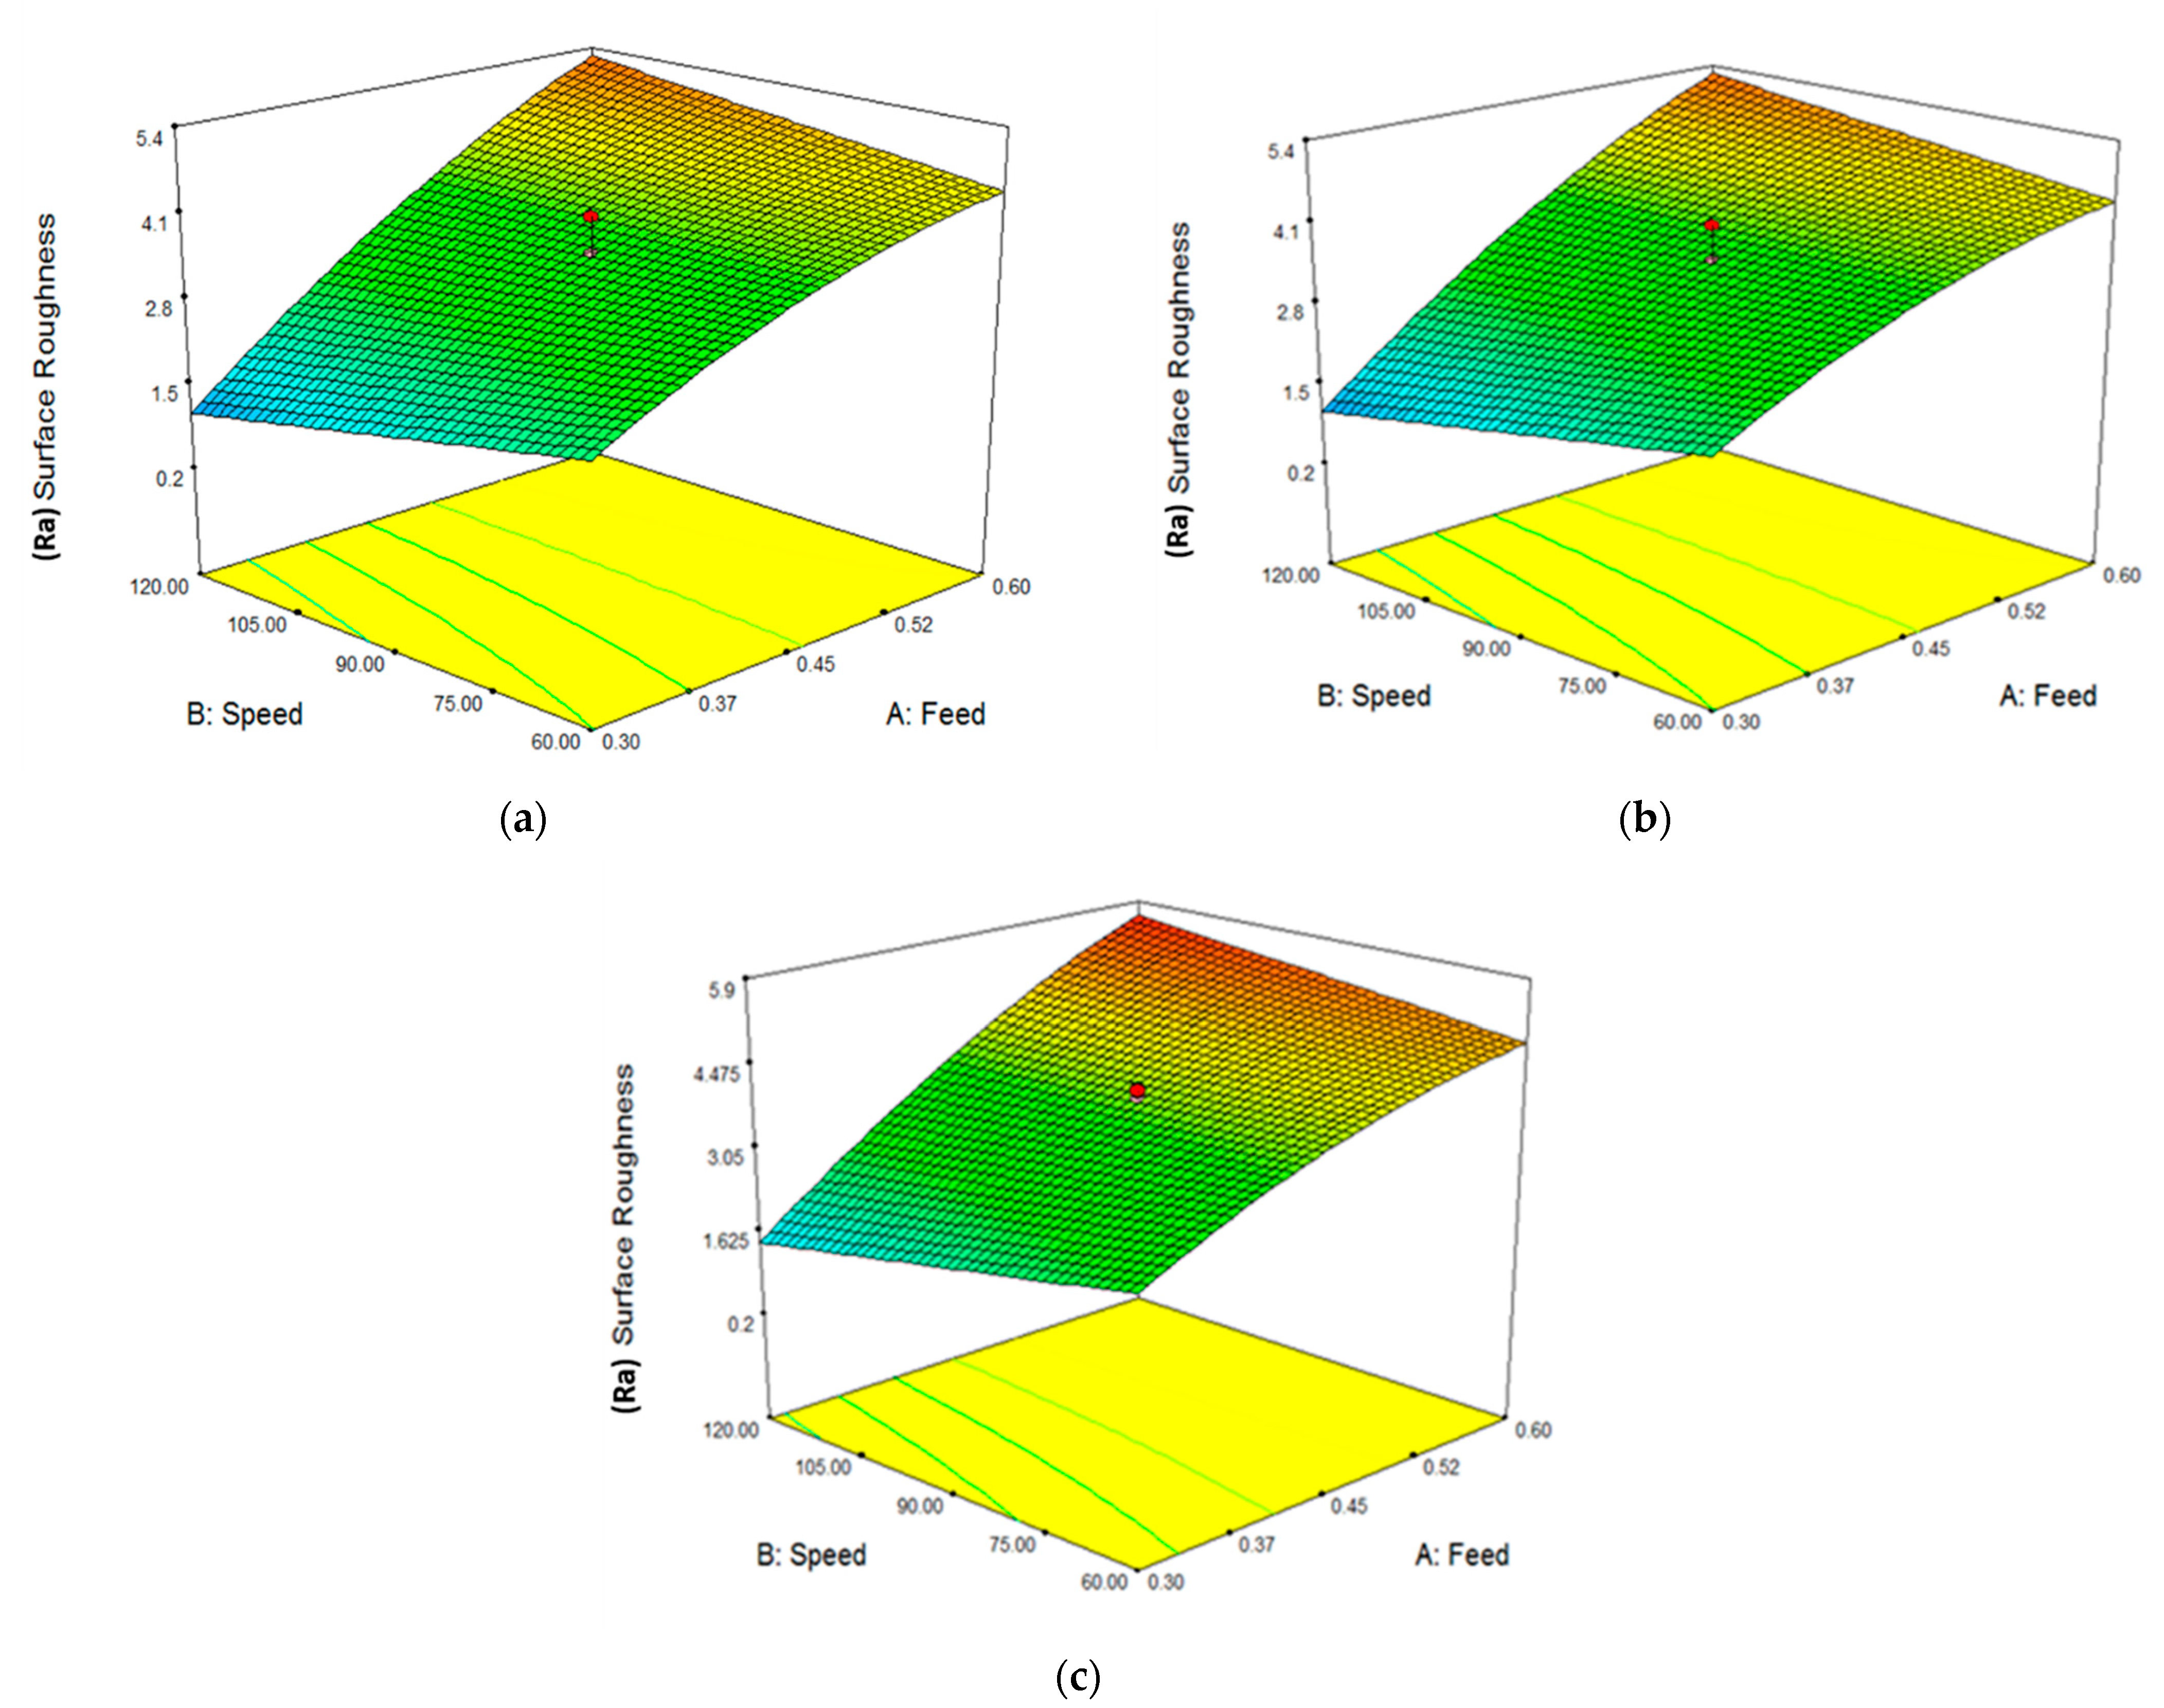
3.3.1. Response Surface Plots for Rotational Speed and Feed

The RSM 3D graphs representing a combined effect of rotational speed and feed rate on the roughness of the machined surface are shown in Figure 2a–c for three different levels of time, i.e., 4, 8, and 12 min. The graphs for the first two time levels are very similar. A slight increase in surface quality was observed with an increase in rotational speed. However, surface roughness increased with the increase in feed rate. The steeper curve of feed rate shows that the effect of feed rate on the generated surface was more than that of the rotational speed, and it was negative as well. Maximum values of surface roughness have been observed at maximum feed and rotational speed. This overall behavior of feed rate and rotational speed on surface roughness was almost the same in the case of the third time level. However, the intensity of surface roughness increased during this level, which means that as the machining time increases and the cutting tool became worn, the combined effect of feed and speed on surface roughness increased.
Figure 3 shows 2D images of the machined surface obtained for compound microscopic analysis. The images provide comprehensive insight into the surfaces of minimum and comparatively higher roughness parameters. At the higher levels of parameters shown in Figure 3b, 0.3 mm/rev feed, 60 rpm speed, 4 mm depth of cut, and 8 min time, numerous scratches and feed marks were visible on the machined surface, which were mild under lower parametric conditions. In addition, the plowing grooves and plastic deformation evidence were also present because of the high depth of cut, low speed, and higher value of feed rate. On the other hand, Figure 3a shows mild feed marks on the machined surface produced under 0.3 mm/rev feed, 120 rpm speed, 2 mm depth of cut, and 4 min time conditions. Less intense scratches, plowing grooves, and plastic deformation evidence were observed. The feed marks were visible for both conditions, which was potentially due to vibrations [14]. The altered surface features and roughness profile significantly affected the functional properties of the treated surface [34]. In addition, the harsh cutting conditions raised the temperature at the point of interaction of the tool and the workpiece, and promoted irregular plastic deformation, tooling wear and adhesion of chips, undesirable surface texture, traces of feed, and unwanted surface irregularities. The phenomenon was also reported by Liang et al. [35].

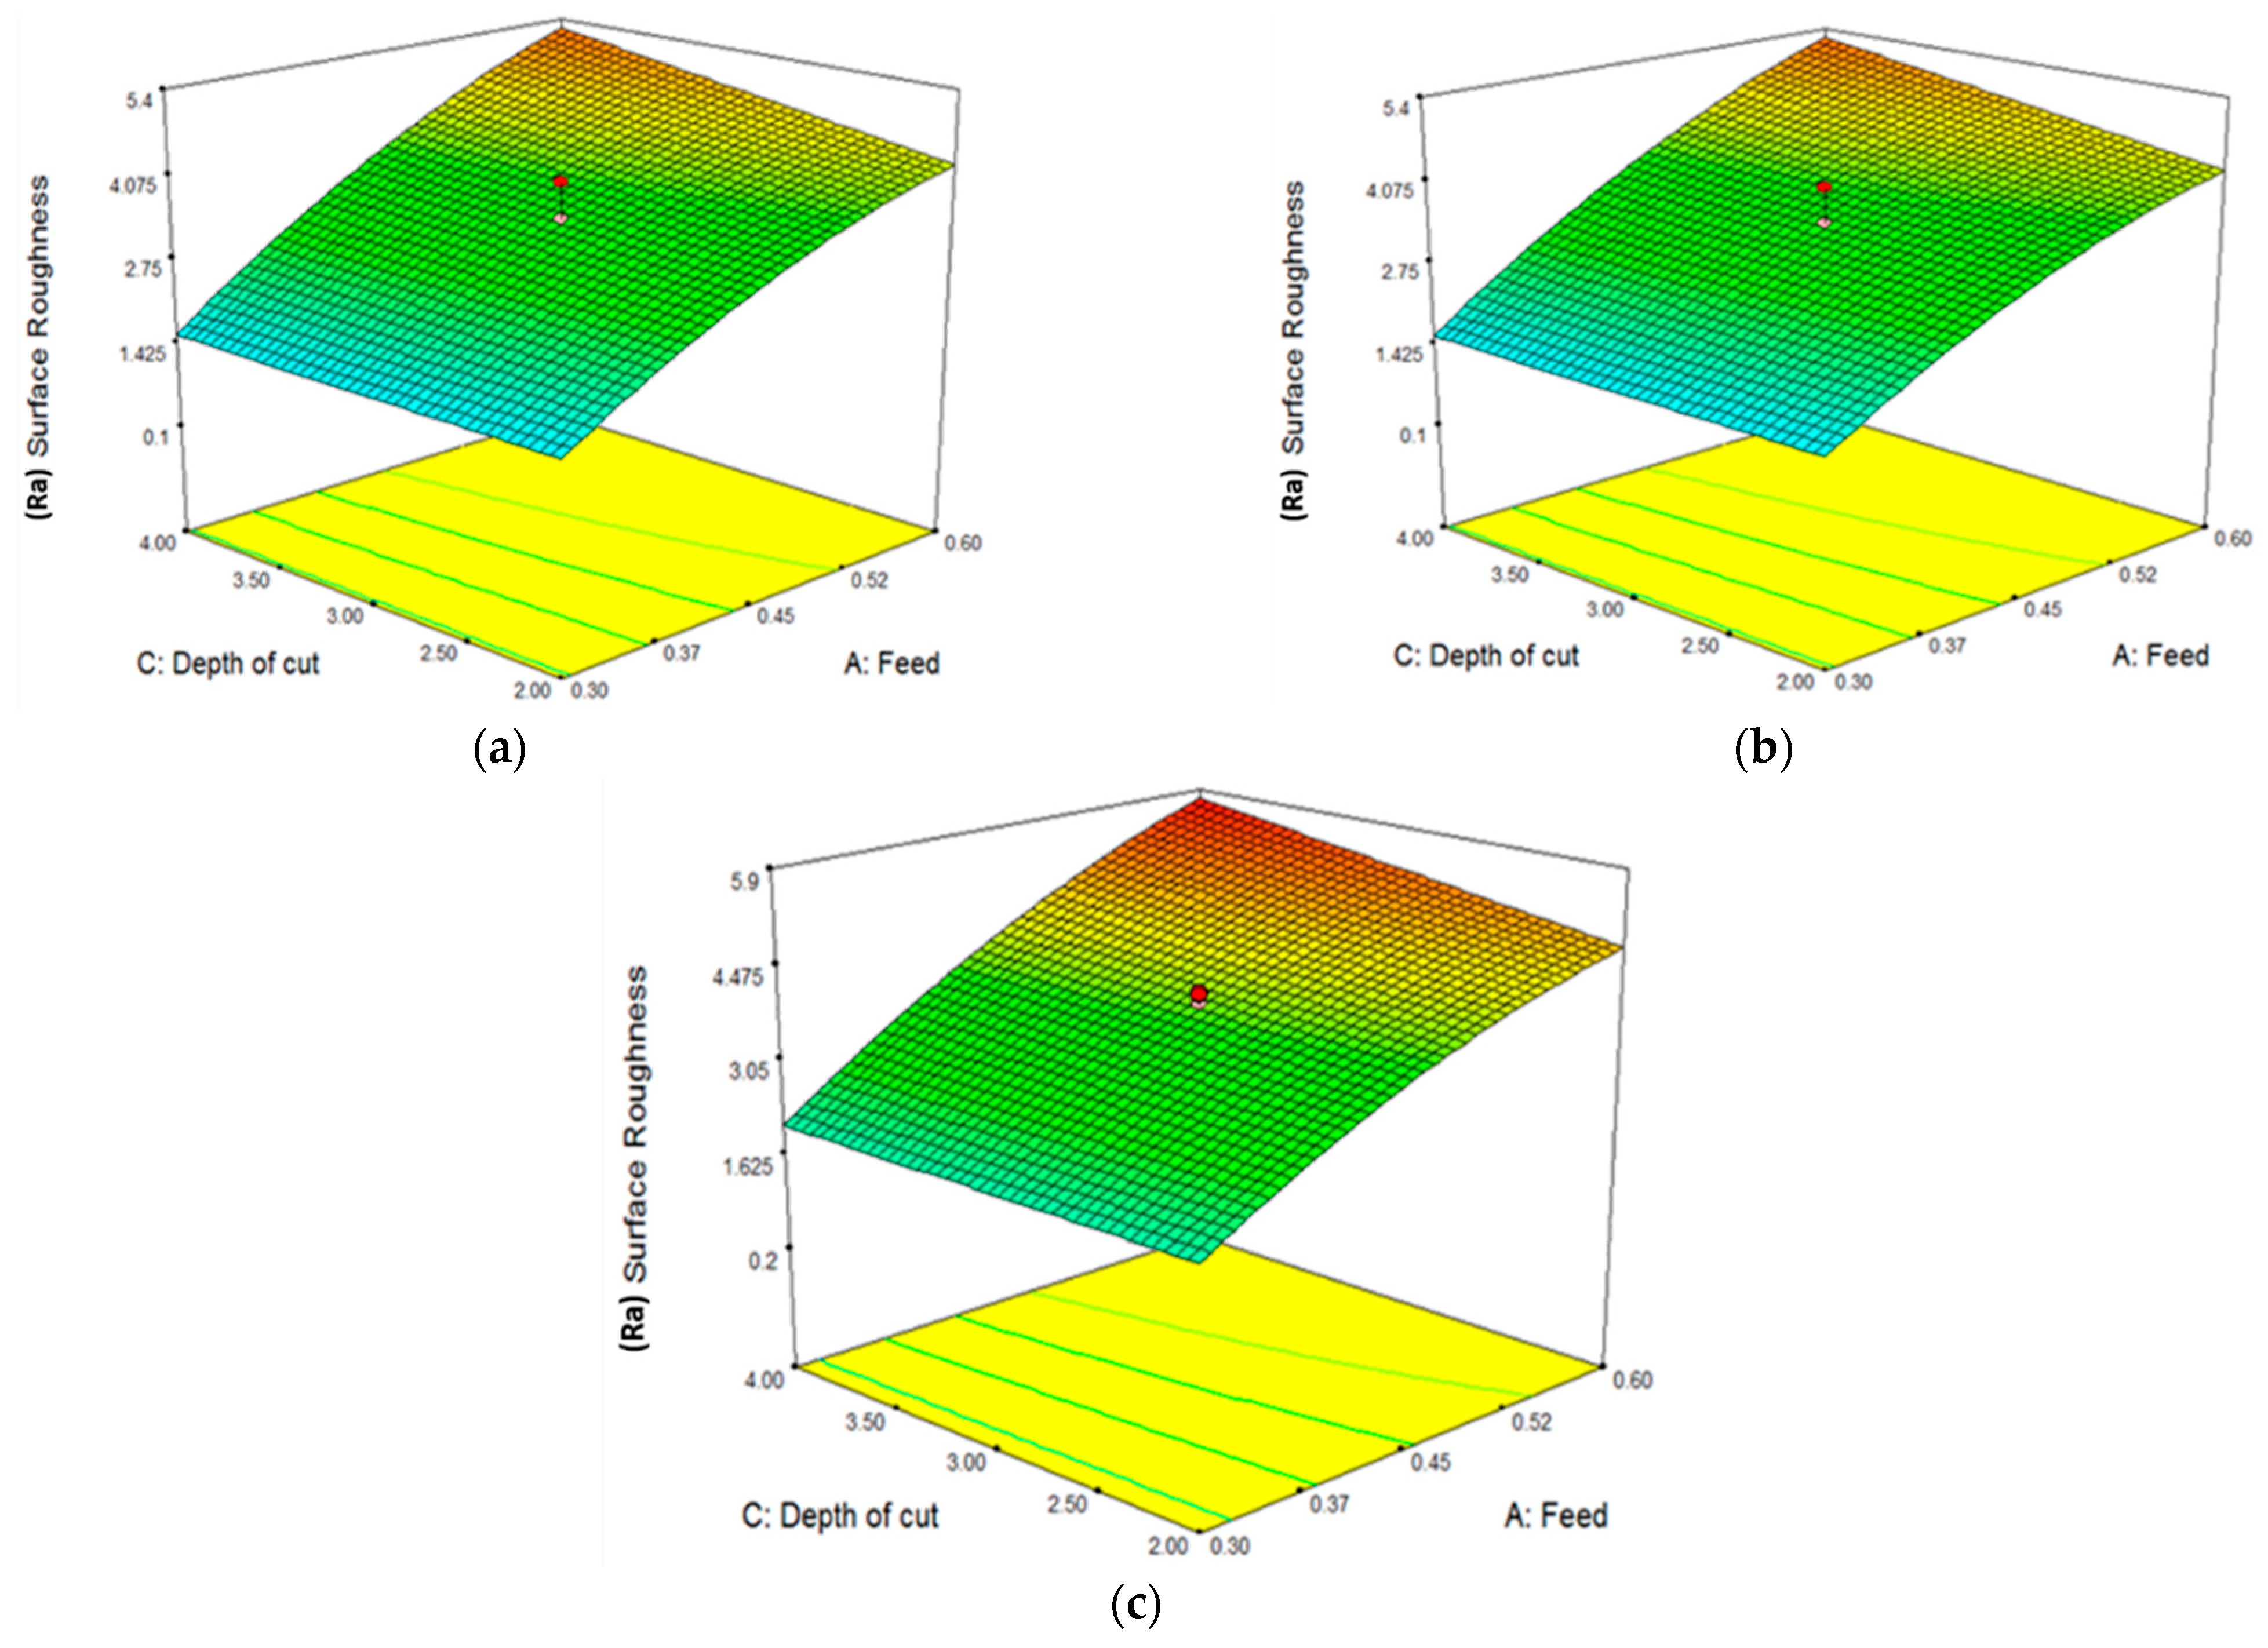
3.3.2. Response Surface Plots for Feed and Depth of Cut

The RS 3D graphs in Figure 4a–c summarize the stand-alone, as well as combined, effects of depth of cut (DOC) and feed rate on the surface roughness with respect to three time levels, respectively. It is evident from the graphs that at low feed rates, the effect of DOC surface roughened. However, higher values of surface roughness were recorded at higher feed rates. It is evident from the graphs that the combined effect of DOC and feed decreased the surface finish quality at higher values of input parameters.
The pattern of these 3D relationships was, again, more intensive during the third level of time, as shown in Figure 4c, thus, more surface roughness was observed as more time passed and the cutting tool became worn.

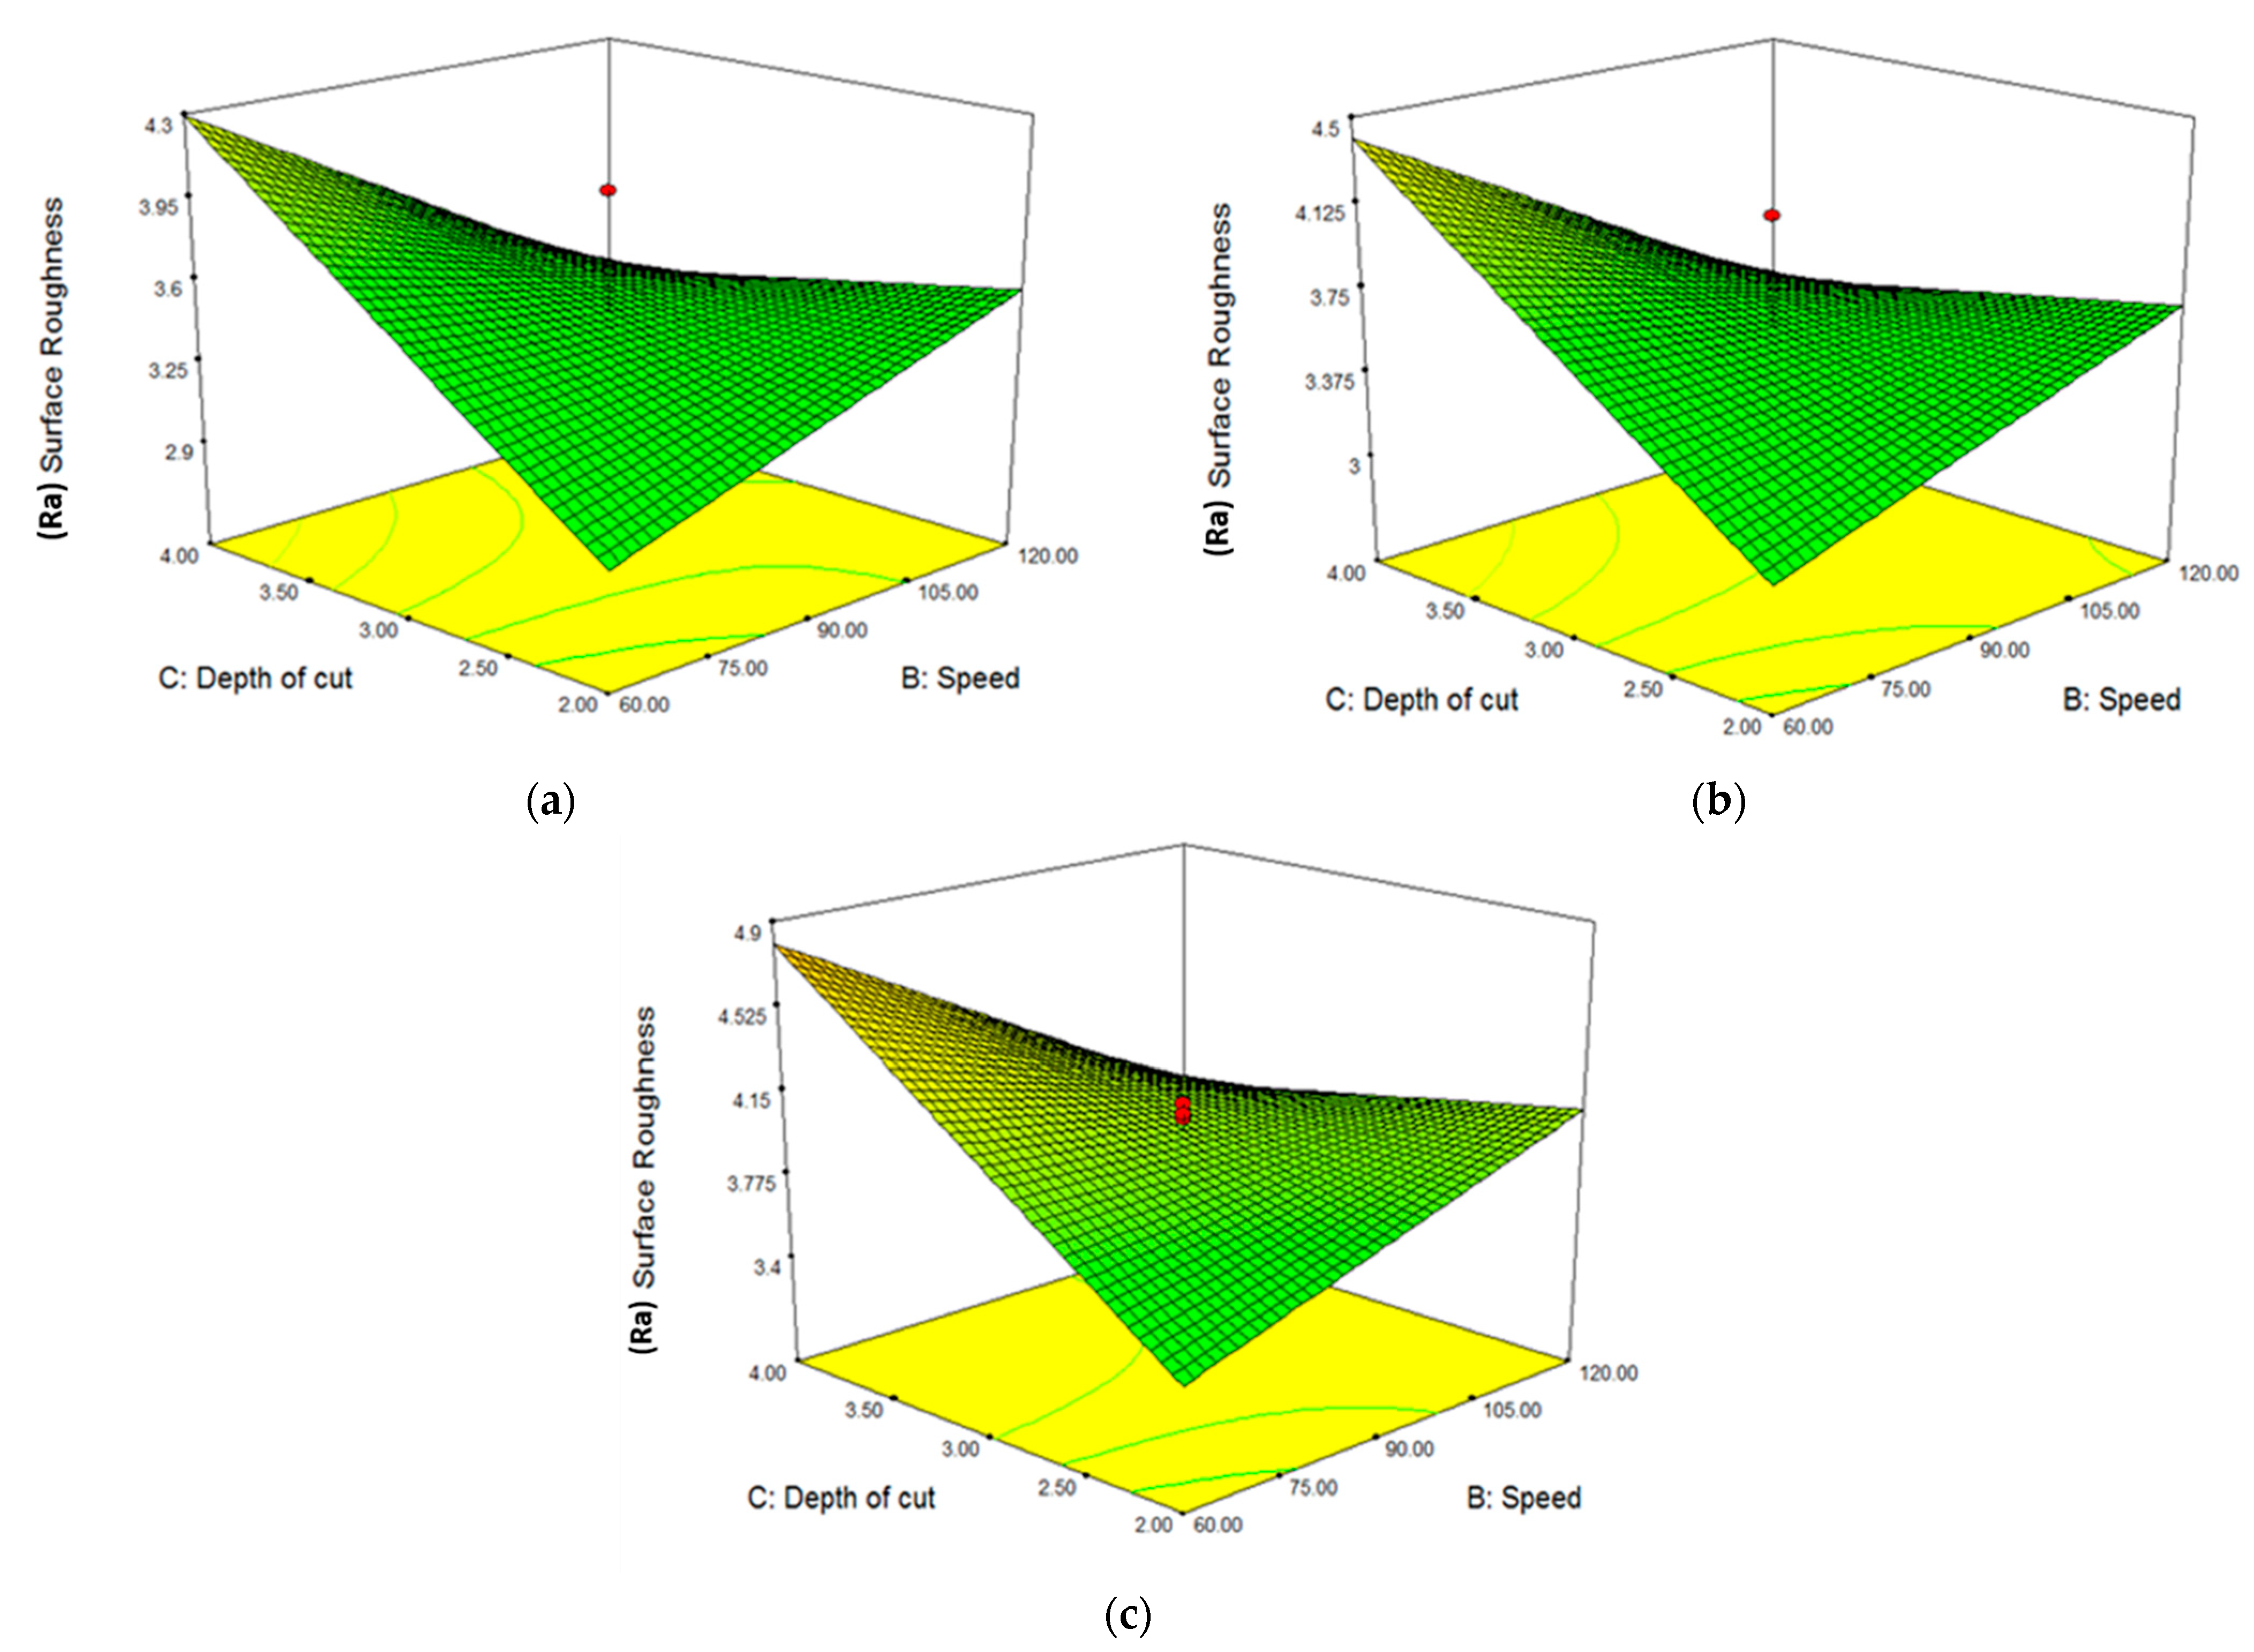
3.3.3. Response Surface Plots for Depth of Cut and Speed

The effects of DOC and feed rates on the surface finish/roughness are shown in the form of 3D graphs in Figure 5a–c. The pattern suggests that the best surface finish was achieved at low speed and DOC. A sudden decrease in surface finish quality at low speed was observed with an increase in DOC. However, this effect was observed to a lesser extent at the same DOC but with higher rotational speed. Considering the individual effects of speed on the surface finish, it also increased the surface roughness, though this increase was not as steep as it was in the case of the individual effect of DOC. It can be observed from the graph that the combined effect of DOC and speed, interestingly, gave a lesser value of surface roughness, which implies that if both the speed and DOC are increased, they produce a better surface finish. In this case, the increased machining time once again had an overall negative effect on the surface finish. Contrary to level 1 and level 2, overall higher surface roughness values were observed in all scenarios of speed and DOC during level 3.
The optimum selection of process variables improves process efficiency as well as surface integrity [36] and significantly affects the tool wear mechanism, as shown in Figure 6. The mechanics that occur in machining and are linked to the mechanical loading subjected at the workpiece to remove material distort the shape of the machined surface and a shallow layer, triggering the surface damage. This primarily happens during the turning process under low cutting speed. It is presumed that the mechanical loading is predominantly responsible for cracking, plucking, and grain deformation on the superficial surface of the workpiece, as shown in Figure 3. The magnitude of plastic deformation is interrelated with machining circumstances like high tool wear, cutting speed, and feed rate [32]. Under less aggressive machining conditions, the subsequent high mechanical load at the machined surface layer causes severe plastic deformation with the chance of grain refinement. This machining influences surface integrity, which assists the initiation and propagation of cracks at the workpiece surface [32]. Therefore, higher surface quality in terms of roughness is required for the fabrication of safety-critical parts for applications where high surface integrity is compulsory (for example, the automotive and aerospace industries). Generally, the mechanically produced hardened layer can be ascribed to the rise of strain (equivalent to the machining shear deformation) and strain rate (consistent with the speed and feed rate) [32].

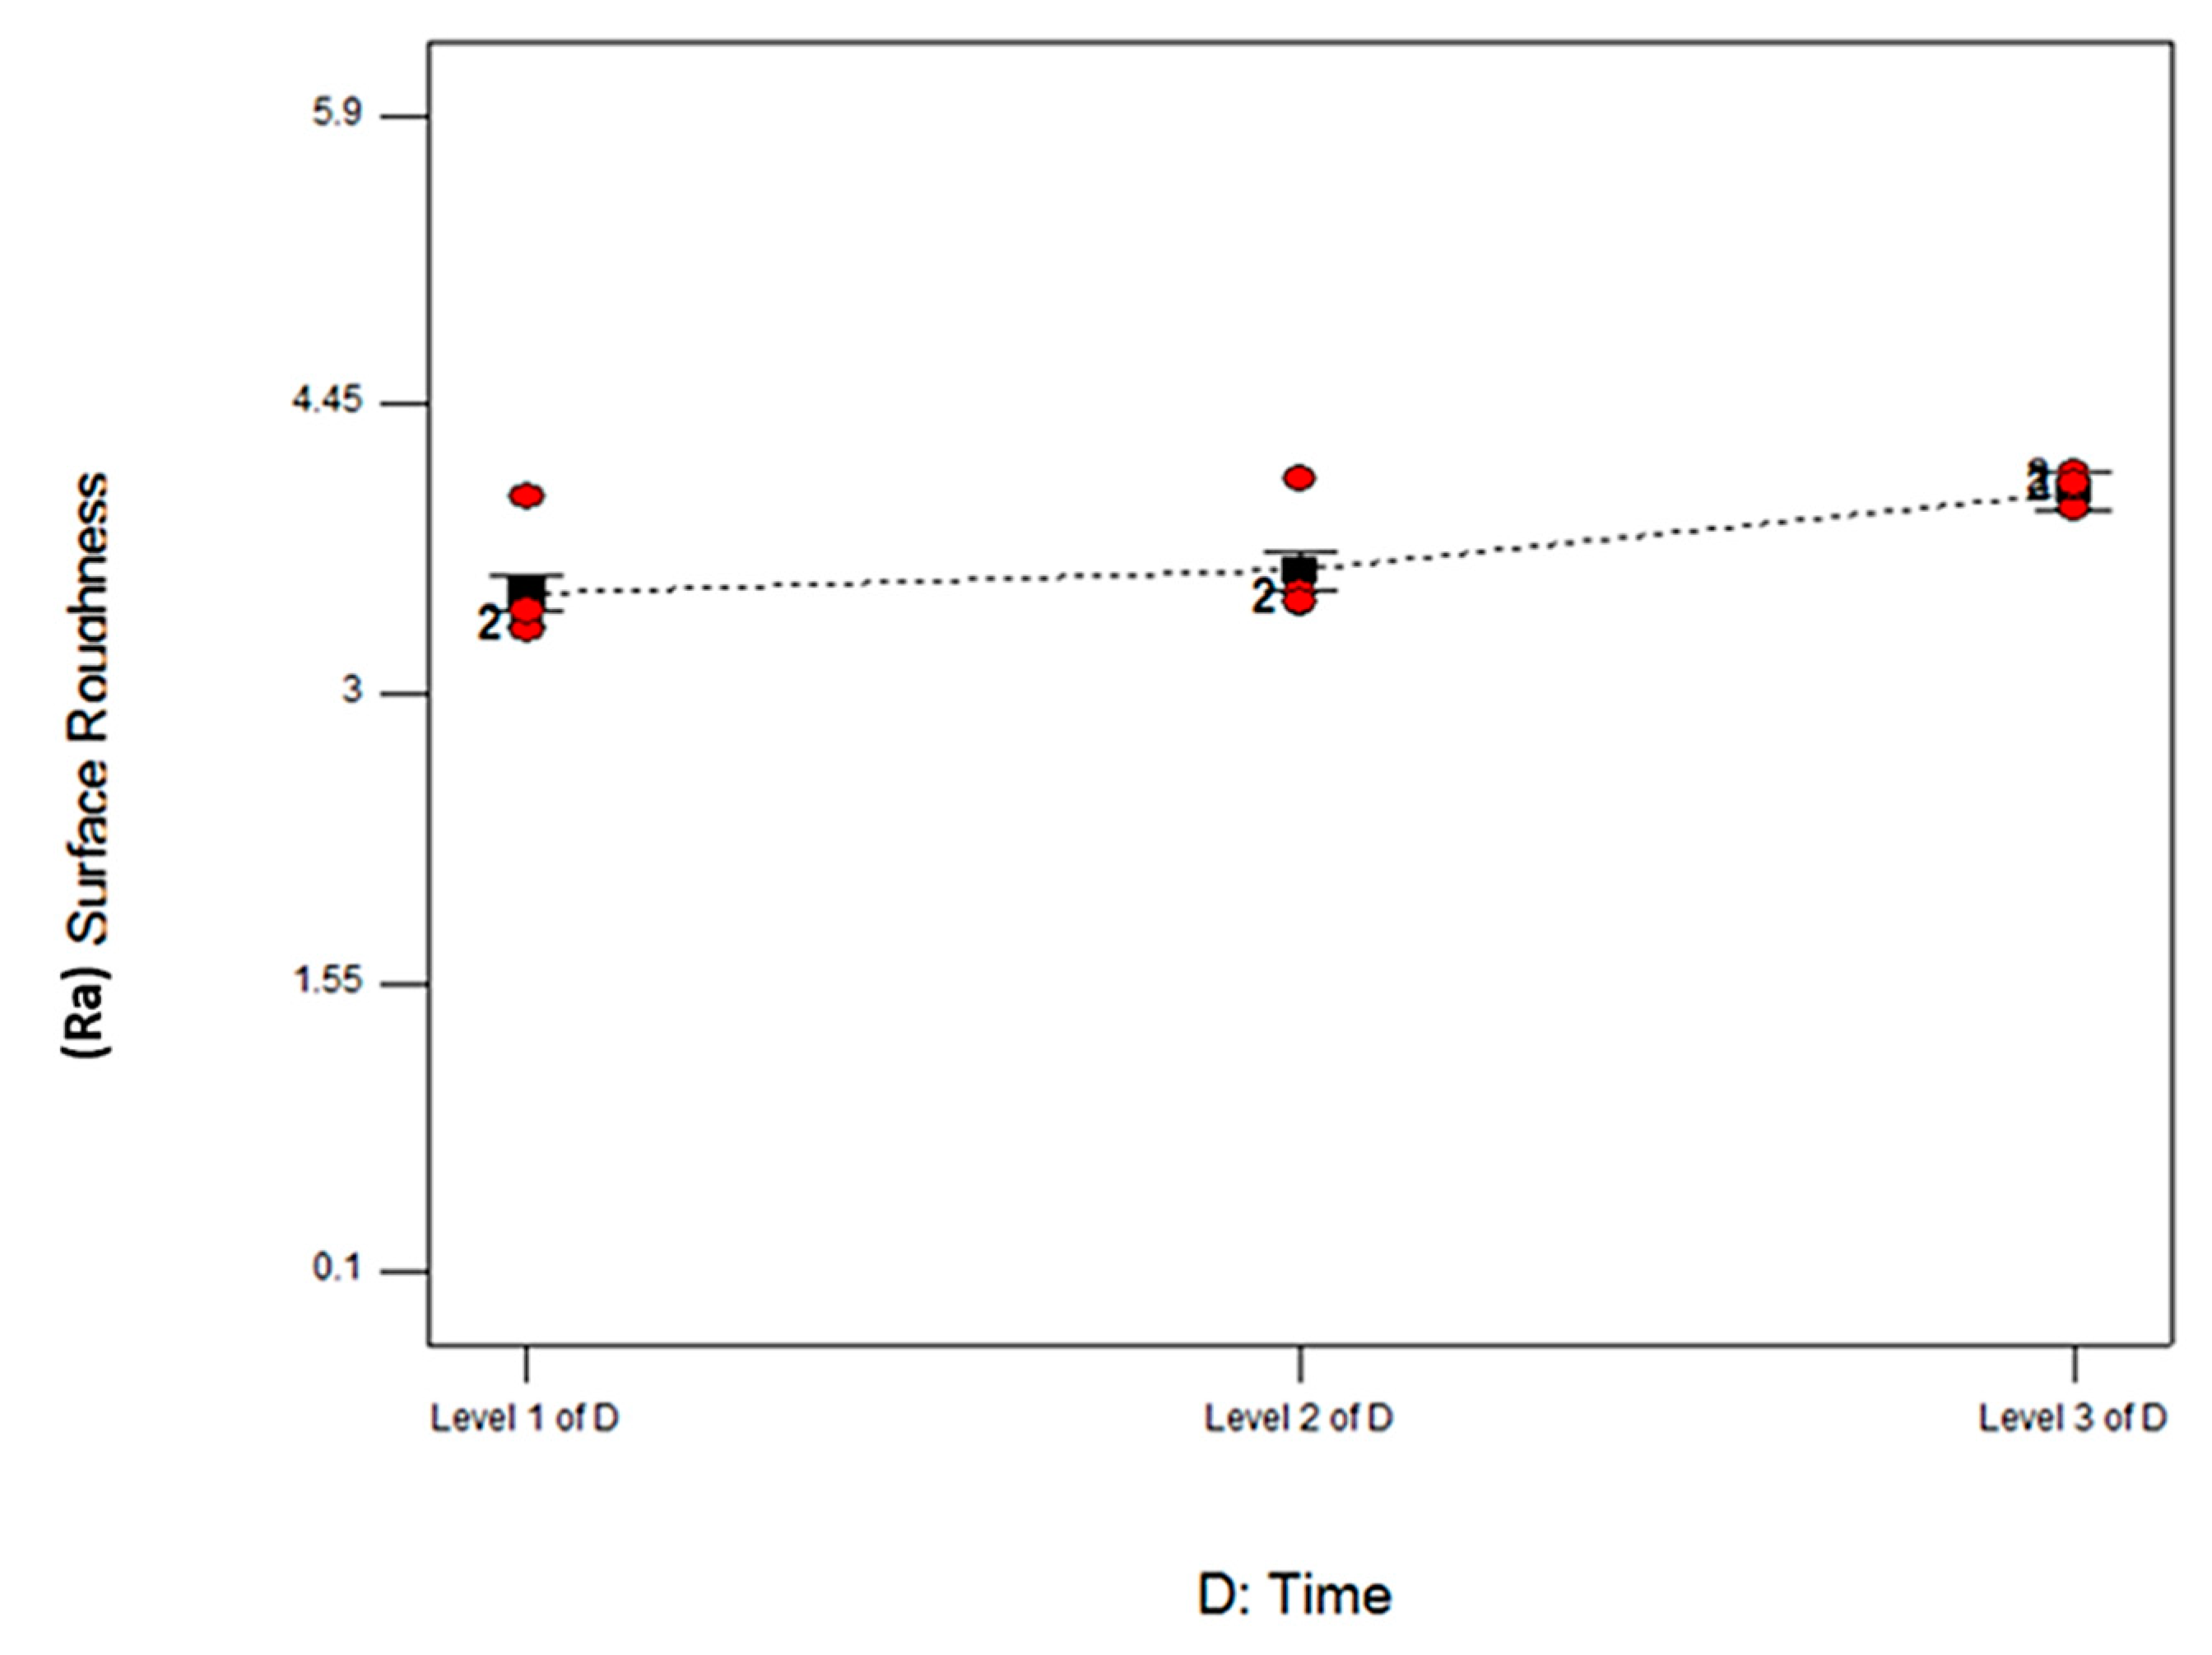
3.3.4. Analysis Based on Time

It has been observed in all 3D patterns generated using RS methodology that surfaces became rougher as time passes and tool wears. The trend observed in the surface finish over time has been generated and placed in Figure 7, which depicts that between time levels 1 and 2, the reduction in the surface finish was lower as compared to the time levels 2 and 3.

3.4. Confirmatory Trial Investigations

Four confirmation tests were performed for the validation of developed regression models. Although the values selected for these tests were within the designed space, these were not included in the main central composite design matrix [37]. Table 8 shows the details of these confirmation tests with a variety of input parameters and the calculated surface roughness. Each experimental test was repeated three times for reliability and precision, and the average experimental value of surface roughness Ra is reported. The standard deviation of the repetitions was within the acceptable limit. A comparison was made between the predicted and experimental roughness values. The recorded errors between predicted and experimental values depict that the comparative results were within a confidence level of 95%. It can, therefore, be concluded from these validation tests that the developed models provide reliable results and can be confidently used within their designed space [38].

4. Conclusions

The main focus in this research was to examine the effects of different input variables on the machined surface of CLARM HBR 30NiCrMoV14 steel alloy and to develop mathematical models that may predict different scenarios of surface roughness with respect to these input parameters. The combined and individual effects of parameters like rotational speed, feed rate (0.2–0.7 mm/rev), depth of cut, and machining time were modelled using a response surface methodology with a central component design.
  • From the investigation of the influence of the parameters on surface finish, it was revealed that feed rate is the most significant parameter, followed by the rotational speed. The increase in rotational speed at a low feed rate improves the surface finish, whereas, at a higher feed rate, the effect follows a slightly different trend, i.e., quality of surface finish is reduced, which is exhibited as a combined effect of feed, speed, and DOC.
  • At low feed rates, the effect of DOC is not highly significant. However, at a higher feed rate, it greatly affects the tool wear. The combined effect of DOC and feed decreases the surface finish quality at higher values of input parameters. The sudden decrease in surface finish quality at low speeds has been measured with an increase in DOC. However, the same effect is less influenced at the same DOC with the increase in speed.
  • Machining time, which was considered a categorical parameter in this research, also reduces the surface finish, though it is negligible at lower levels of time. This may be because of the tool wear observed as the machining time lapses.
  • RSM has been successfully used in this research for the analysis of results and the development of mathematical models. The adequacy of the models was verified using standard statistical techniques and by applying the confirmatory experimental tests.
  • The superior value of surface roughness obtained was 0.137 μm at parametric settings of 0.19 mm/rev feed, 90 rpm speed, 3 mm depth of cut, and 4 min time.
The practitioners will, therefore, be able to use the mathematical models, developed in this research to set the input variables to achieve desired surface finish and estimate the tooling requirements.

Author Contributions

Conceptualization, S.M.R. and K.G.; data curation, A.M.K.; formal analysis, M.U.F. and A.M.K.; funding acquisition, D.Y.P.; investigation, S.M.R. and A.I.; methodology, S.M.R. and K.G.; project administration, M.U.F. and A.I.; resources, K.G.; software, A.M.K.; supervision, D.Y.P.; validation, A.I. and K.L.; visualization, A.I.; writing—original draft, S.M.R.; writing—review and editing, A.M.K., M.U.F., D.Y.P., K.G. and K.L. All authors have read and agreed to the published version of the manuscript.

Funding

This research received no external funding.

Data Availability Statement

Data presented in this article are available at request from the corresponding author.

Conflicts of Interest

The authors declare no conflict of interest.

References

  1. Zhong, Y.; Xie, J.; Chen, Y.; Yin, L.; He, P.; Lu, W. Microstructure and mechanical properties of micro laser welding NiTiNb/Ti6Al4V dissimilar alloys lap joints with nickel interlayer. Mater. Lett. 2022, 306, 130896. [Google Scholar] [CrossRef]
  2. China Die & Mould Industry Association. Brief Statistics on 2017 China’s Die & Mould Import & Export. Available online: http://www.cdmia.com.cn/news/detail/4756.html (accessed on 29 January 2021).
  3. Kuntoğlu, M.; Aslan, A.; Sağlam, H.; Pimenov, D.Y.; Giasin, K.; Mikolajczyk, T. Optimization and analysis of surface roughness, flank wear and 5 different sensorial data via tool condition monitoring system in turning of AISI 5140. Sensors 2020, 20, 4377. [Google Scholar] [CrossRef]
  4. Kuntoğlu, M.; Aslan, A.; Pimenov, D.Y.; Giasin, K.; Mikolajczyk, T.; Sharma, S. Modeling of cutting parameters and tool geometry for multi-criteria optimization of surface roughness and vibration via response surface methodology in turning of AISI 5140 steel. Materials 2020, 13, 4242. [Google Scholar] [CrossRef]
  5. Abbas, A.T.; Pimenov, D.Y.; Erdakov, I.N.; Mikolajczyk, T.; El Danaf, E.A.; Taha, M.A. Minimization of turning time for high-strength steel with a given surface roughness using the edgeworth–pareto optimization method. Int. J. Adv. Manuf. Technol. 2017, 93, 2375–2392. [Google Scholar] [CrossRef]
  6. Kuntoğlu, M.; Acar, O.; Gupta, M.K.; Sağlam, H.; Sarikaya, M.; Giasin, K.; Pimenov, D.Y. Parametric optimization for cutting forces and material removal rate in the turning of AISI 5140. Machines 2021, 9, 90. [Google Scholar] [CrossRef]
  7. Leksycki, K.; Feldshtein, E.; Lisowicz, J.; Chudy, R.; Mrugalski, R. Cutting forces and chip shaping when finish turning of 17-4 PH stainless steel under dry, wet, and Mql machining conditions. Metals 2020, 10, 1187. [Google Scholar] [CrossRef]
  8. Leksycki, K.; Feldshtein, E.; Królczyk, G.M.; Legutko, S. On the chip shaping and surface topography when finish cutting 17-4 PH precipitation-hardening stainless steel under near-dry cutting conditions. Materials 2020, 13, 2188. [Google Scholar] [CrossRef]
  9. Galoppi, G.D.; Batalha, G.F. Hard turning of tempered DIN 100Cr6 steel with coated and no coated CBN inserts. J. Mater. Process. Technol. 2006, 179, 146–153. [Google Scholar] [CrossRef]
  10. Liu, C.; Gao, X.; Chi, D.; He, Y.; Liang, M.; Wang, H. On-line chatter detection in milling using fast kurtogram and frequency band power. Eur. J. Mech. A. Solids 2021, 90, 104341. [Google Scholar] [CrossRef]
  11. Mandal, N.; Doloi, B.; Mondal, B. Predictive modeling of surface roughness in high speed machining of AISI 4340 steel using Yttria stabilized zirconia toughened alumina turning insert. Int. J. Refract. Met. Hard Mater. 2013, 38, 40–46. [Google Scholar] [CrossRef]
  12. Ippolito, R.; Tornincasa, S.; Levi, R. High speed machining: Tool performance and surface finish in steel turning. CIRP Ann. 1988, 37, 105–108. [Google Scholar] [CrossRef]
  13. Das, D.K.; Sahoo, A.K.; Das, R.; Routara, B.C. Investigations on hard turning using coated carbide insert: Grey dased Taguchi and regression methodology. Procedia Mater. Sci. 2014, 6, 1351–1358. [Google Scholar] [CrossRef] [Green Version]
  14. Haq, M.A.; Hussain, S.; Ali, M.A.; Farooq, M.U.; Mufti, N.A.; Pruncu, C.I.; Wasim, A. Evaluating the effects of nano-fluids based MQL milling of IN718 associated to sustainable productions. J. Clean. Prod. 2021, 310, 127463. [Google Scholar] [CrossRef]
  15. Mughal, M.P.; Farooq, M.U.; Mumtaz, J.; Mia, M.; Shareef, M.; Javed, M.; Jamil, M.; Pruncu, C.I. Surface modification for osseointegration of Ti6Al4V ELI using powder mixed sinking EDM. J. Mech. Behav. Biomed. Mater. 2021, 113, 104145. [Google Scholar] [CrossRef] [PubMed]
  16. Khanna, N.; Shah, P.; Maruda, R.W.; Krolczyk, G.M.; Hegab, H. Experimental investigation and sustainability assessment to evaluate environmentally clean machining of 15-5 PH stainless steel. J. Manuf. Process. 2020, 56, 1027–1038. [Google Scholar] [CrossRef]
  17. Grzesik, W. Influence of tool wear on surface roughness in hard turning using differently shaped ceramic tools. Wear 2008, 265, 327–335. [Google Scholar] [CrossRef]
  18. Chinchanikar, S.; Choudhury, S.K. Effect of work material hardness and cutting parameters on performance of coated carbide tool when turning hardened steel: An optimization approach. Measurement 2013, 46, 1572–1584. [Google Scholar] [CrossRef]
  19. Carou, D.; Rubio, E.M.; Lauro, C.H.; Davim, J.P. Experimental Investigation on surface finish during intermittent turning of UNS M11917 magnesium alloy under dry and near dry machining conditions. Measurement 2014, 56, 136–154. [Google Scholar] [CrossRef]
  20. Kini, M.V.; Chincholkar, A.M. Effect of Machining Parameters on Surface Roughness and Material Removal Rate in Finish Turning of ±30 glass fibre reinforced polymer pipes. Mater. Des. 2010, 31, 3590–3598. [Google Scholar] [CrossRef]
  21. Ishfaq, K.; Farooq, M.U.; Anwar, S.; Ali, M.A.; Ahmad, S.; El-Sherbeeny, A.M. A comprehensive investigation of geometrical accuracy errors during WEDM of Al6061-7.5%SiC composite. Mater. Manuf. Process. 2020, 36, 362–372. [Google Scholar] [CrossRef]
  22. Lalwani, D.I.; Mehta, N.K.; Jain, P.K. Experimental investigations of cutting parameters influence on cutting forces and surface roughness in finish hard turning of MDN250 steel. J. Mater. Process. Technol. 2008, 206, 167–179. [Google Scholar] [CrossRef]
  23. Suresh, R.; Basavarajappa, S.; Samuel, G.L. Some studies on hard turning of AISI 4340 steel using multilayer coated carbide tool. Measurement 2012, 45, 1872–1884. [Google Scholar] [CrossRef]
  24. Suresh, R.; Basavarajappa, S.; Gaitonde, V.N.; Samuel, G.L. Machinability investigations on hardened AISI 4340 steel using coated carbide insert. Int. J. Refract. Met. Hard Mater. 2012, 33, 75–86. [Google Scholar] [CrossRef]
  25. Gaitonde, V.N.; Karnik, S.R.; Figueira, L.; Davim, J.P. Machinability investigations in hard turning of AISI D2 cold work tool steel with conventional and wiper ceramic inserts. Int. J. Refract. Met. Hard Mater. 2009, 27, 754–763. [Google Scholar] [CrossRef]
  26. Noordin, M.Y.; Venkatesh, V.C.; Sharif, S.; Elting, S.; Abdullah, A. Application of response surface methodology in describing the performance of coated carbide tools when turning AISI 1045 steel. J. Mater. Process. Technol. 2004, 145, 46–58. [Google Scholar] [CrossRef] [Green Version]
  27. Ezilarasan, C.; Kumar, V.S.; Velayudham, A.; Palanikumar, K. Modeling and analysis of surface roughness on machining of nimonic C-263 alloy by PVD coated carbide insert. Trans. Nonferrous Met. Soc. China 2011, 21, 1986–1994. [Google Scholar] [CrossRef]
  28. Ezilarasan, C.; Velayudham, A. An experimental analysis and measurement of process performances in machining of nimonic C-263 super alloy. Measurement 2013, 46, 185–199. [Google Scholar] [CrossRef]
  29. Pavel, C.C.; Tzimas, E. Raw Materials in the European Defence Industry; Publications Office of the European Union: Luxembourg, 2016; p. 126. [Google Scholar]
  30. Jawad, M.; Jahanzaib, M.; Ali, M.A.; Farooq, M.U.; Mufti, N.A.; Pruncu, C.I.; Hussain, S.; Wasim, A. Revealing the microstructure and mechanical attributes of pre-heated conditions for gas tungsten arc welded AISI 1045 steel joints. Int. J. Press. Vessel. Pip. 2021, 192, 104440. [Google Scholar] [CrossRef]
  31. Duplák, J.; Hatala, M.; Zajac, J.; Vasilko, K.; Kormoš, M.; Jurko, S. The comprehensive comparison of the selected cutting materials with standard ISO 3685 in machining process of steel C60. In Applied Mechanics and Materials; Trans Tech Publications Ltd.: Bach, Switzerland, 2015; Volume 718, pp. 93–98. [Google Scholar] [CrossRef]
  32. Liao, Z.; la Monaca, A.; Murray, J.; Speidel, A.; Ushmaev, D.; Clare, A.; Axinte, D.; M’Saoubi, R. Surface integrity in metal machining—Part I: Fundamentals of surface characteristics and formation mechanisms. Int. J. Mach. Tools Manuf. 2020, 162, 103687. [Google Scholar] [CrossRef]
  33. Kalpakjian, S. Manufacturing Processes for Engineering Materials; Pearson Education: Delhi, India, 1984. [Google Scholar]
  34. Niemczewska-Wójcik, M. Multi-Sensor measurements of titanium alloy surface texture formed at subsequent operations of precision machining process. Measurement 2017, 96, 8–17. [Google Scholar] [CrossRef]
  35. Liang, X.; Liu, Z.; Yao, G.; Wang, B.; Ren, X. Investigation of surface topography and its deterioration resulting from tool wear evolution when dry turning of titanium alloy Ti-6Al-4V. Tribol. Int. 2019, 135, 130–142. [Google Scholar] [CrossRef]
  36. Das, A.; Das, S.R.; Patel, S.K.; Biswal, B.B. Effect of MQL and nanofluid on the machinability aspects of hardened alloy steel. Mach. Sci. Technol. 2020, 24, 291–320. [Google Scholar] [CrossRef]
  37. Yu, X.; Sun, Y.; Zhao, D.; Wu, S. A revised contact stiffness model of rough curved surfaces based on the length scale. Tribol. Int. 2021, 164, 107206. [Google Scholar] [CrossRef]
  38. Zhang, Z.; Yang, F.; Zhang, H.; Zhang, T.; Wang, H.; Xu, Y.; Ma, Q. Influence of CeO2 addition on forming quality and microstructure of TiCx-reinforced CrTi4-based laser cladding composite coating. Mater. Charact. 2020, 171, 110732. [Google Scholar] [CrossRef]
Figure 1. (a) Normal plot of residuals for surface finish. (b) Predicted vs. actual plot for surface finish.
Metals 11 01751 g001
Figure 2. (a) 3D graph of rotational speed vs. feed for surface finish (level 1), (b) 3D graph of rotational speed vs. feed for surface finish (level 2), and (c) 3D graph for rotational speed vs. feed (level 3).
Metals 11 01751 g002
Figure 3. (a) Compound microscopical surface texture at the low time variable, producing low surface roughness at 0.3 mm/ revfeed, 120 rpm speed, 2 mm depth of cut, and 4 min time. (b) Higher surface roughness at 0.3 mm/ revfeed, 60 rpm speed, 4 mm depth of cut, and 8 min time.
Metals 11 01751 g003
Figure 4. (a) 3D Graph for feed vs. depth of cut (level 1), (b) 3D graph for feed vs. depth of cut (level 2), and (c) 3D graph for feed vs. depth of cut (level 3).
Metals 11 01751 g004
Figure 5. (a) 3D graph for depth of cut vs. speed (level 1), (b) 3D graph for depth of cut vs. speed (level 2), and (c) 3D graph for depth of cut vs. speed (level 3).
Metals 11 01751 g005
Figure 6. Shearing phenomenon and machining science during turning (redrawn from [32]).
Metals 11 01751 g006
Figure 7. Contour plot for surface finish vs. time.
Metals 11 01751 g007
Table 1. Chemical composition of CLARM HBR steel alloy 30NiCrMoV14 [29].
ElementFeCMnCrNiMoV
% wt 93.920.30.21.53.50.40.18
Table 2. Mechanical properties of CLARM HBR steel alloy 30NiCrMoV14.
UTS (MPa)0.2% Ys (MPa)% ElongationImpact Strength (−40 °C) (J)
1300 12001560
Table 3. Parameters with levels based on the preliminary experimentation.
ParametersLevels
−2−10+1+2
Feed (mm/rev)0.20.30.450.600.70
Speed (rpm)406090120140
Depth of Cut (mm)1.322.003.004.004.68
Time (min)-4812-
Table 4. Comparison of models.
SourceSum of SquaresDFMean SquareF Valuep-Value Prob > F
Mean vs. Total643.861643.86
Linear vs. Mean108.54521.7052.66<0.0001
2FI vs. Linear12.78891.427.91<0.0001
Quadratic vs. 2FI4.87731.6227.60<0.0001Suggested
Cubic vs. Quadratic1.41160.082.500.0269Aliased
Residual0.70200.035
Total772.195414.29
Table 5. “Lack of fit” test.
SourceSum of SquaresDFMean SquareF-Valuep-Value
Linear19.19178065390.49217.4486630.0016
2FI6.403758775300.213463.2310330.0343
Quadratic1.52597495270.056520.8554830.6471Suggested
Cubic0.110821801110.010070.1524970.9975Aliased
Pure Error0.5945862590.06607
Table 6. Model summary statistics.
SourceStd.
Deviation
R-SquaredAdjusted
R-Squared
Predicted
R-Squared
PRESS
Linear0.64290.84580.82970.799525.72
2FI0.42360.94540.92580.899812.85
Quadratic0.24270.98340.97560.96154.92Suggested
Cubic0.18780.99450.98540.97862.73Aliased
Table 7. ANOVA table for surface finish.
SourceSum of SquaresDFMean SquareF-Valuep-Value Prob > F
Model125.60913.95225.51<0.0001Significant
A—Feed102.831102.831661.72<0.0001
B—Speed0.519510.51958.390.0058
C—Depth of cut2.6012.6042.06<0.0001
D—Time2.5721.2820.84<0.0001
AB6.4916.49104.96<0.0001
AC1.4211.4223.05<0.0001
BC4.3614.3670.54<0.0001
A24.771.004.7777.16<0.0001
Residual2.7244.000.062
Lack of Fit2.1335.000.0610.920.6029Not Significant
Pure Error0.599.000.066
Cor Total128.3253
Table 8. Confirmation test results for surface roughness.
Exp. Test FeedSpeedDOCTimeAvg. ExperimentedPredictedError %
10.575243.5633.4174.3
2.0.6603124.5994.4533.3
3.0.480282.7372.834−3.4
4.0.651103.585.7875.6572.3
Publisher’s Note: MDPI stays neutral with regard to jurisdictional claims in published maps and institutional affiliations.

