Article

Predicted Torque Model in Low-Frequency-Assisted Boring (LFAB) Operations

by
Fernando Veiga
1,*,
Alain Gil Del Val
1,
Mari Luz Penalva
1,
Octavio Pereira
2,
Alfredo Suárez
1 and
Luis Norberto López de Lacalle Marcaide
3
1
TECNALIA, Basque Research and Technology Alliance (BRTA), Parque Científico, Parque Científico y Tecnológico de Gipuzkoa, E20009 Donostia-San Sebastián, Spain
2
CFAA, University of the Basque Country (UPV/EHU), Parque Tecnológico de Zamudio 202, 48170 Bilbao, Spain
3
Department of Mechanical Engineering, Faculty of Engineering of Bilbao, University of the Basque Country, Alameda de Urquijo s/n, 48013 Bilbao, Spain
*
Author to whom correspondence should be addressed.
Submission received: 16 May 2021 / Revised: 16 June 2021 / Accepted: 22 June 2021 / Published: 24 June 2021
(This article belongs to the Special Issue Optimization and Analysis of Metal Cutting Processes)

Abstract

:
A low-frequency-assisted boring operation is a key cutting process in the aircraft manufacturing sector when drilling deep holes to avoid chip clogging based on chip breakage and, consequently, to reduce the temperature level in the cutting process. This paper proposes a predicted force model based on a commercial control-supported chip breaking function without external vibration devices in the boring operations. The model was fitted by conventional boring measurements and was validated by vibration boring experiments with different ranges of amplitude and frequency. The average prediction error is around 10%. The use of a commercial function makes the model more attractive for the industry because there is no need for intrusive vibration sensors. The low-frequency-assisted boring (LFAB) operations foster the chip breakage. Finally, the model is generic and can be used for different cutting materials and conditions. Roughness is improved by 33% when vibration conditions are optimal, considered as a vibration amplitude of half the feed per tooth. This paper presents, as a novelty, the analysis of low-frequency vibration parameters in boring processes and their effect on chip formation and internal hole roughness. This has a practical significance for the definition of a methodology based on the torque model for the selection of conditions on other hole-making processes, cutting parameters and/or materials.

1. Introduction

The boring process is a very common operation when machining deep holes with tight precision and high-quality requirements [1,2,3]. The large length-to-diameter ratio implies large chip length and, consequently, high forces on the cutting tool and heating of the piece, tool and machine tool. Taking this into account, vibration-assisted machining (VAM) was proposed in the late 1950s. This technique is characterized by the addition of external or internal vibrational energy (either high or low frequency) to the conventional machining movement to reduce cutting forces and generate thinner chip thickness [4]. Numerous papers showed the technique being divided by the function of vibration frequencies: at a low frequency (under 100 Hz) in drilling [3,5,6] and in turning [7] and at ultrasonic frequencies both in milling [8,9] and in drilling [10].
Regarding boring [11], an apparatus to perform cutting with an elastic movement and superimposed axial vibration [12] to improve the quality of the surface showed good results [13]. Other processes between drilling and boring were discussed, such as the boring trepanning association (BTA) [3], presenting a severe segmentation of the chip; on the contrary, in this present paper, we look at generating segmented and easy-to-remove chips with vibrations at a very low frequency.
Regarding vibrational devices or approaches, they can be divided into three groups. The first group is piezoelectric and magnetostrictive actuators. The second one is based on transmission mechanisms, and the last group is resonant and non-resonant VAM systems [4]. All devices work at a high frequency and are intrusive to the process. Therefore, CNC software developers have created a function related to chip segmentation control (CSC) for several new pieces of equipment by different brands.
Focusing on this, CSC is described as the addition of a tool movement function (sinusoidal as an example) to the characteristically linear movement of the Z-axis, which is normally employed in conventional boring processes. When the frequency level is lower and the amplitude is larger, the process is a so-called low-frequency-assisted boring (LFAB) operation [5]. Figure 1 illustrates tool movement in LFAB. Boring is very interesting because the feed movement is not too fast; therefore, the CNC is agile enough to perform the sinusoidal variation [14]. Vibration in the radial direction produces a chip of variable thickness to facilitate chip segmentation [15,16].
LFAB induced a variable uncut chip thickness (tch), and momentarily uncut chip thickness is equal to zero; therefore, it could be assumed that chip segmentation allows the avoiding of chip clogging when drilling deep holes [17]. The tool oscillation opposite to the feed direction creates a loss of contact with the piece and, thus, interrupted machining occurs. In addition, fresh air enters in the tool–piece gap, decreasing tool temperature and, consequently, improving machining efficiency [5,6].
On the other hand, almost all CNC manufacturers offered the peck drilling cycle for deep drilling to allow chip breakage. However, a commercial enterprise proposes a specific function, called control-supported chip breaking, based on the superimposing of the lathe motion and a quadratic sine wave. The benefits of this function are the value positivity, the strategy simplicity, and the jerk motion continuity [3].
Focusing on kinematic and force models for LFAB, Jallageas et al. [18] proposed a kinematic model assisted by forced–excited low frequencies when drilling carbon fiber-reinforced plastics (CFRP) to optimize the chip evacuation. The model evaluated the efficiency of the MITIS™ vibration system. Yang et al. [5] developed a drilling force kinematic model for forced low-frequency-assisted drilling (LFAD) when machining a hole of Ti-6Al-4V. They estimated the maximum thrust force, maximum torque, mean thrust force and mean torque with an average predicted error of 10%. Moreover, Bleicher et al. [19] carried out a kinematic model to investigate the influence of LFAD on the chip formation when drilling small holes of age-hardened copper-zirconium. Recently, Li et al. [6] proposed an LFAB mechanical model to predict the thrust force and torque when drilling deep holes in Inconel 690. The thrust and torque levels are reduced by 22 and 14%, respectively, using an LFAB system. The described papers developed kinematic models using external devices to validate the LFAB or LFAD operations. However, this paper validates an LFAB process without an external one and exclusively uses the internal function of the control, which allows for the validation to be easily completed. Other models aim to study the effect of cutting parameters, based on statistical analysis, on the roughness of the machined surface and vibration [20,21].
This paper aims to facilitate the process of machining holes by boring. The estimation of the correct vibration parameters helps to facilitate chip removal. By means of an analytical model, the expected chip length and thickness were obtained. In addition, the cutting torque was estimated. The estimation of the cutting torque gives a better idea of the trends in heat generation, deviations or residual stresses in the workpiece. Firstly, the kinematic and torque models for LFAB are explained. Secondly, the validation results are illustrated and discussed, respectively. Finally, the conclusions are described.

2. Materials and Methods

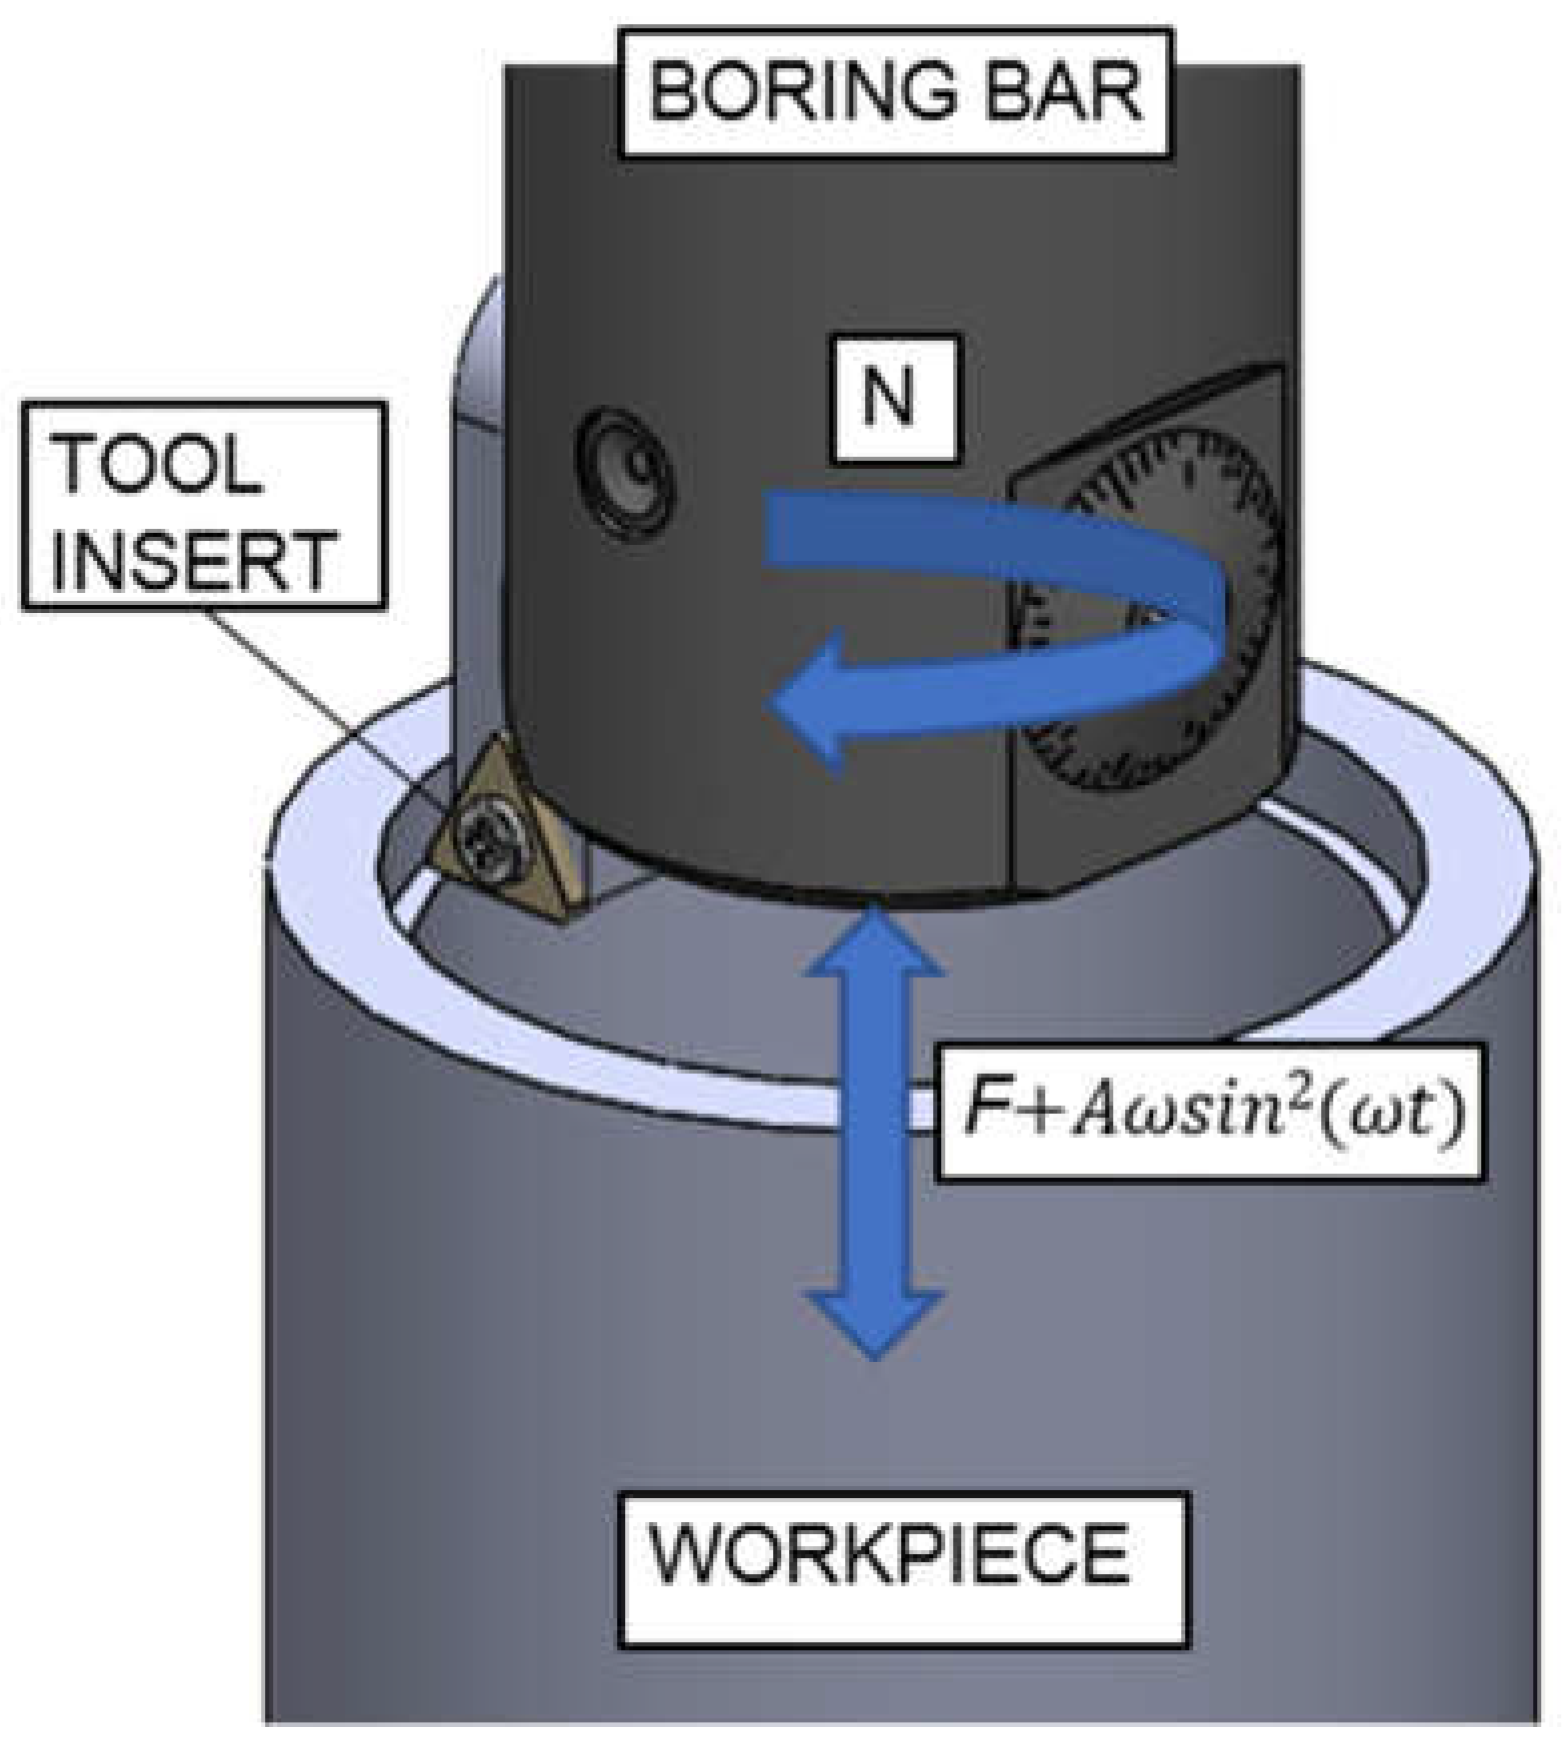
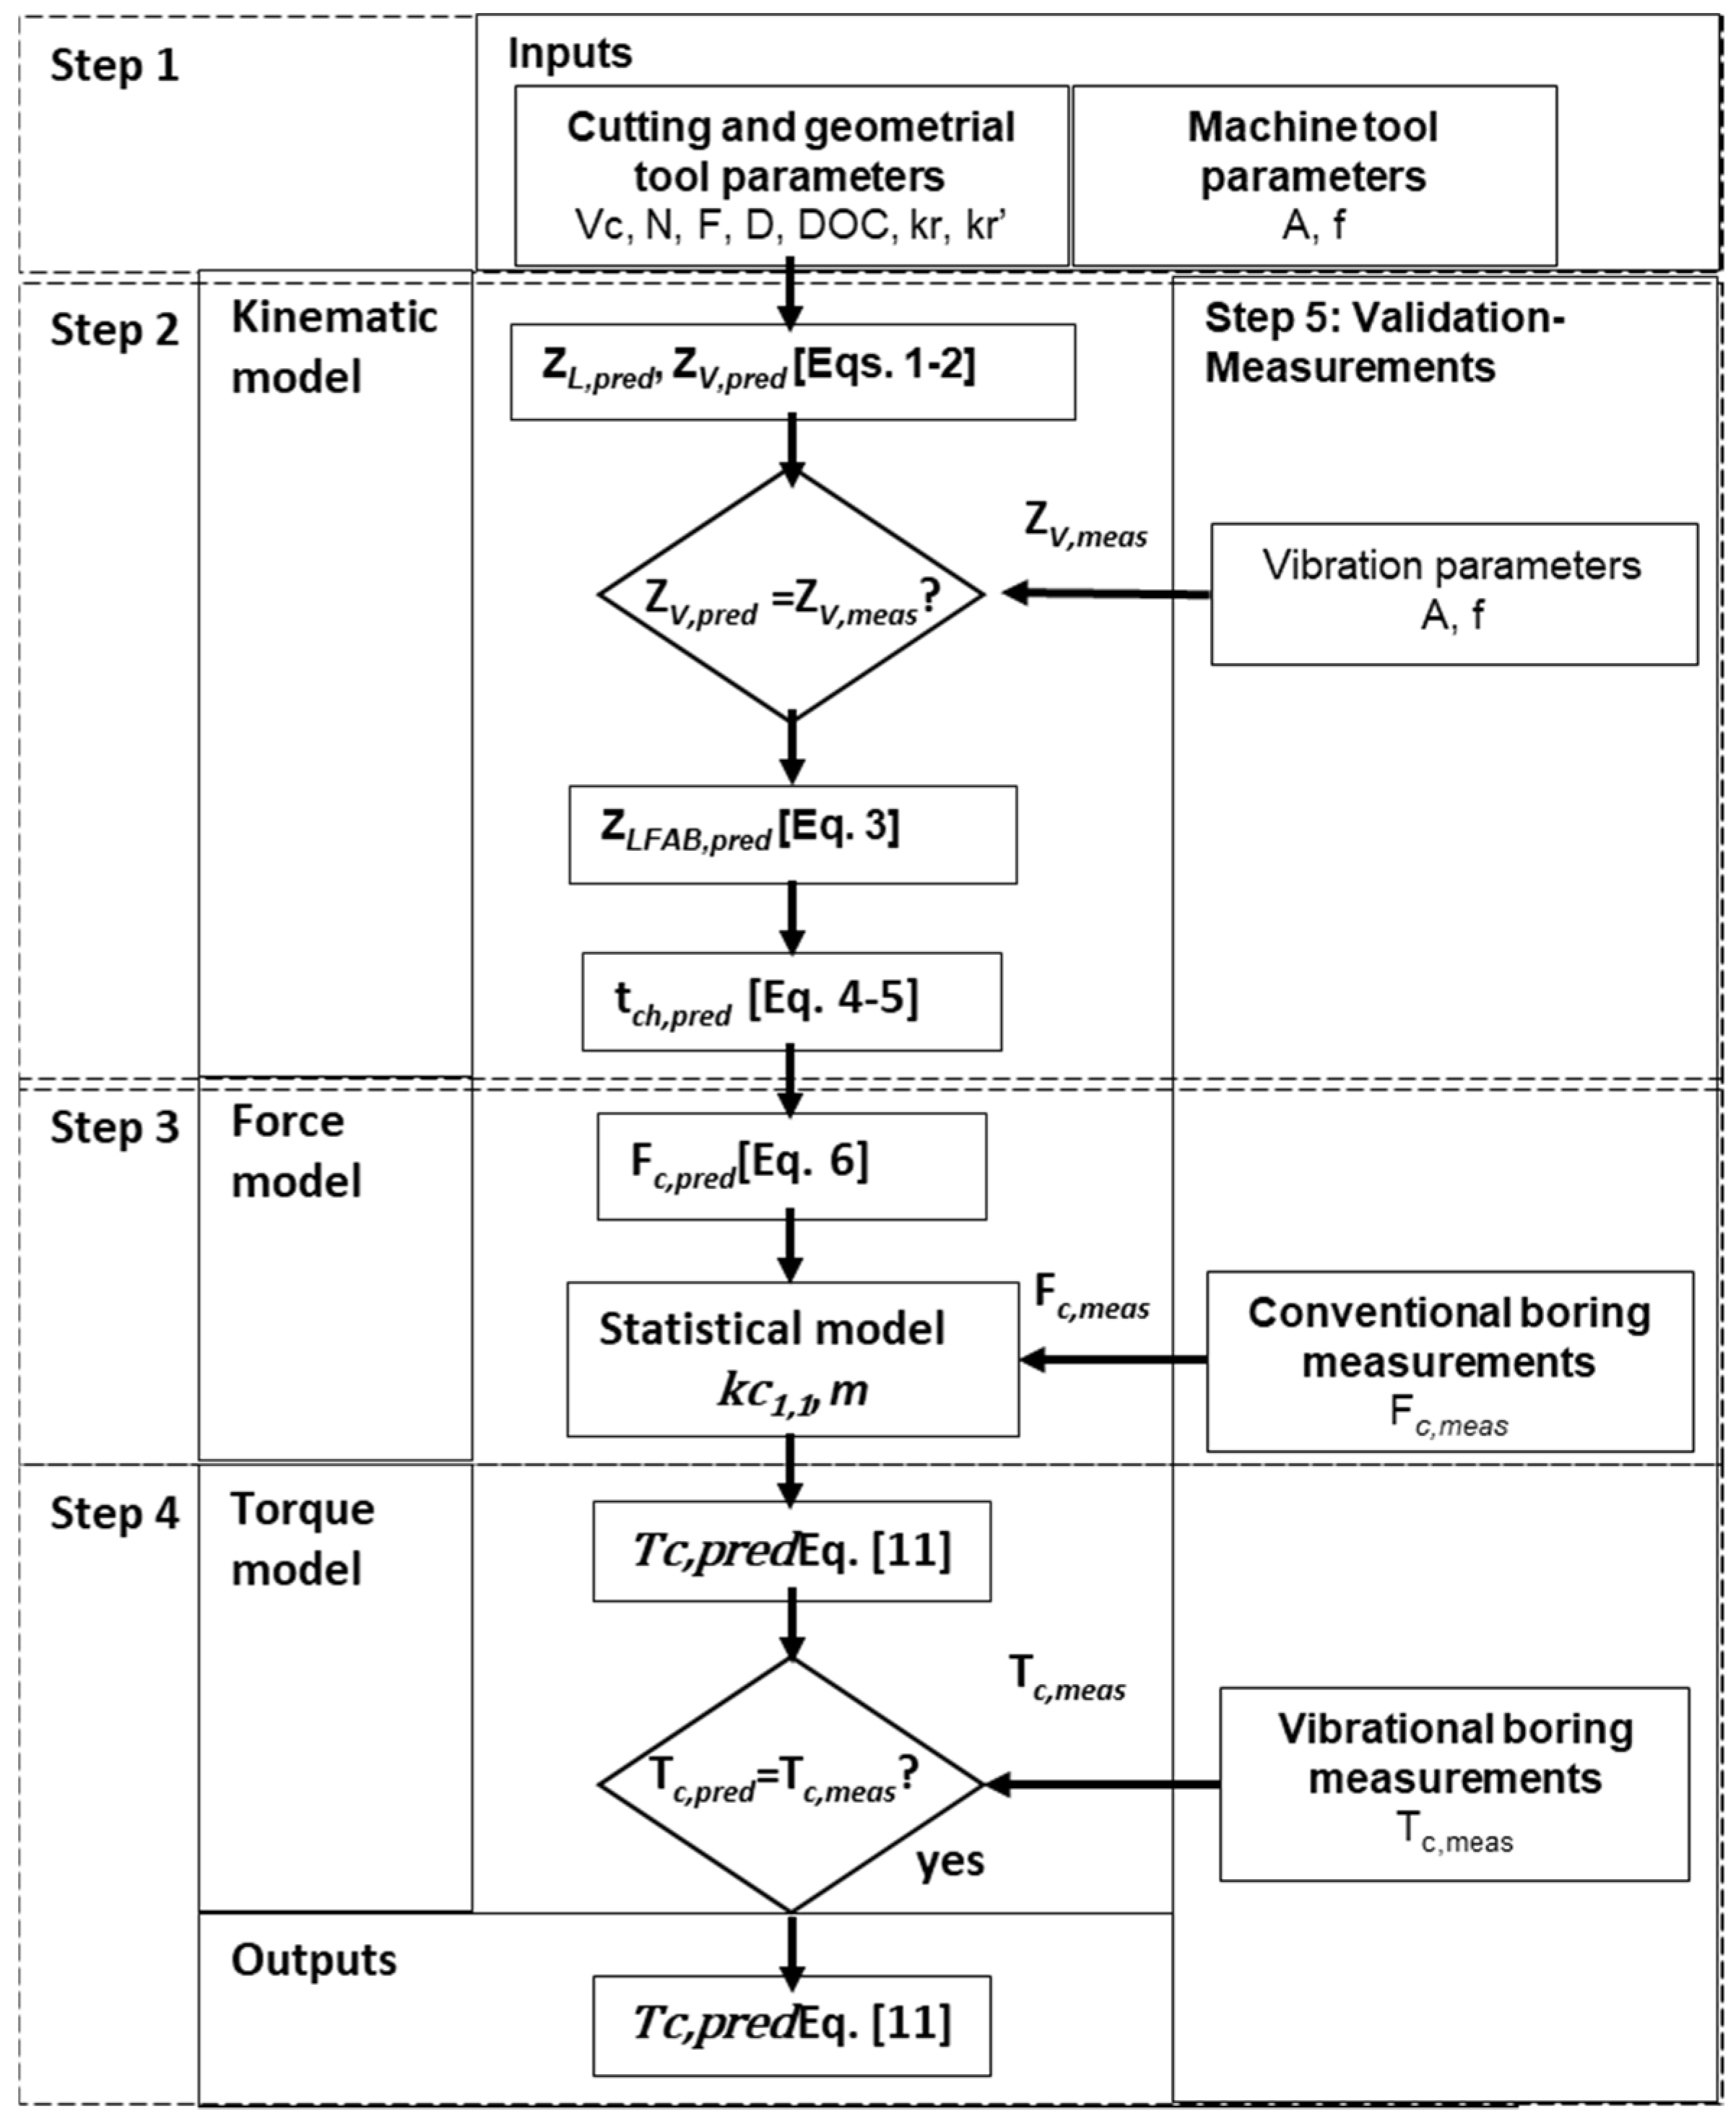
2.1. Kinematic and Torque Modeling for LFAB

The modeling procedure is divided into five steps as shown in Figure 2. The first one defines the cutting conditions of the boring process and the geometrical tool parameters and the main parameters to define the commercial control-supported chip breaking function. Second, the uncut chip thickness model is described.
The third step establishes the force model under conventional boring experiments, and the fourth one calculates the torque validated experimentally during a boring operation. The last step, called validation measurements, is a horizontal stage whose aim is to experimentally validate the control-supported chip breaking function, the force model without vibrations and the vibrational boring experiments.

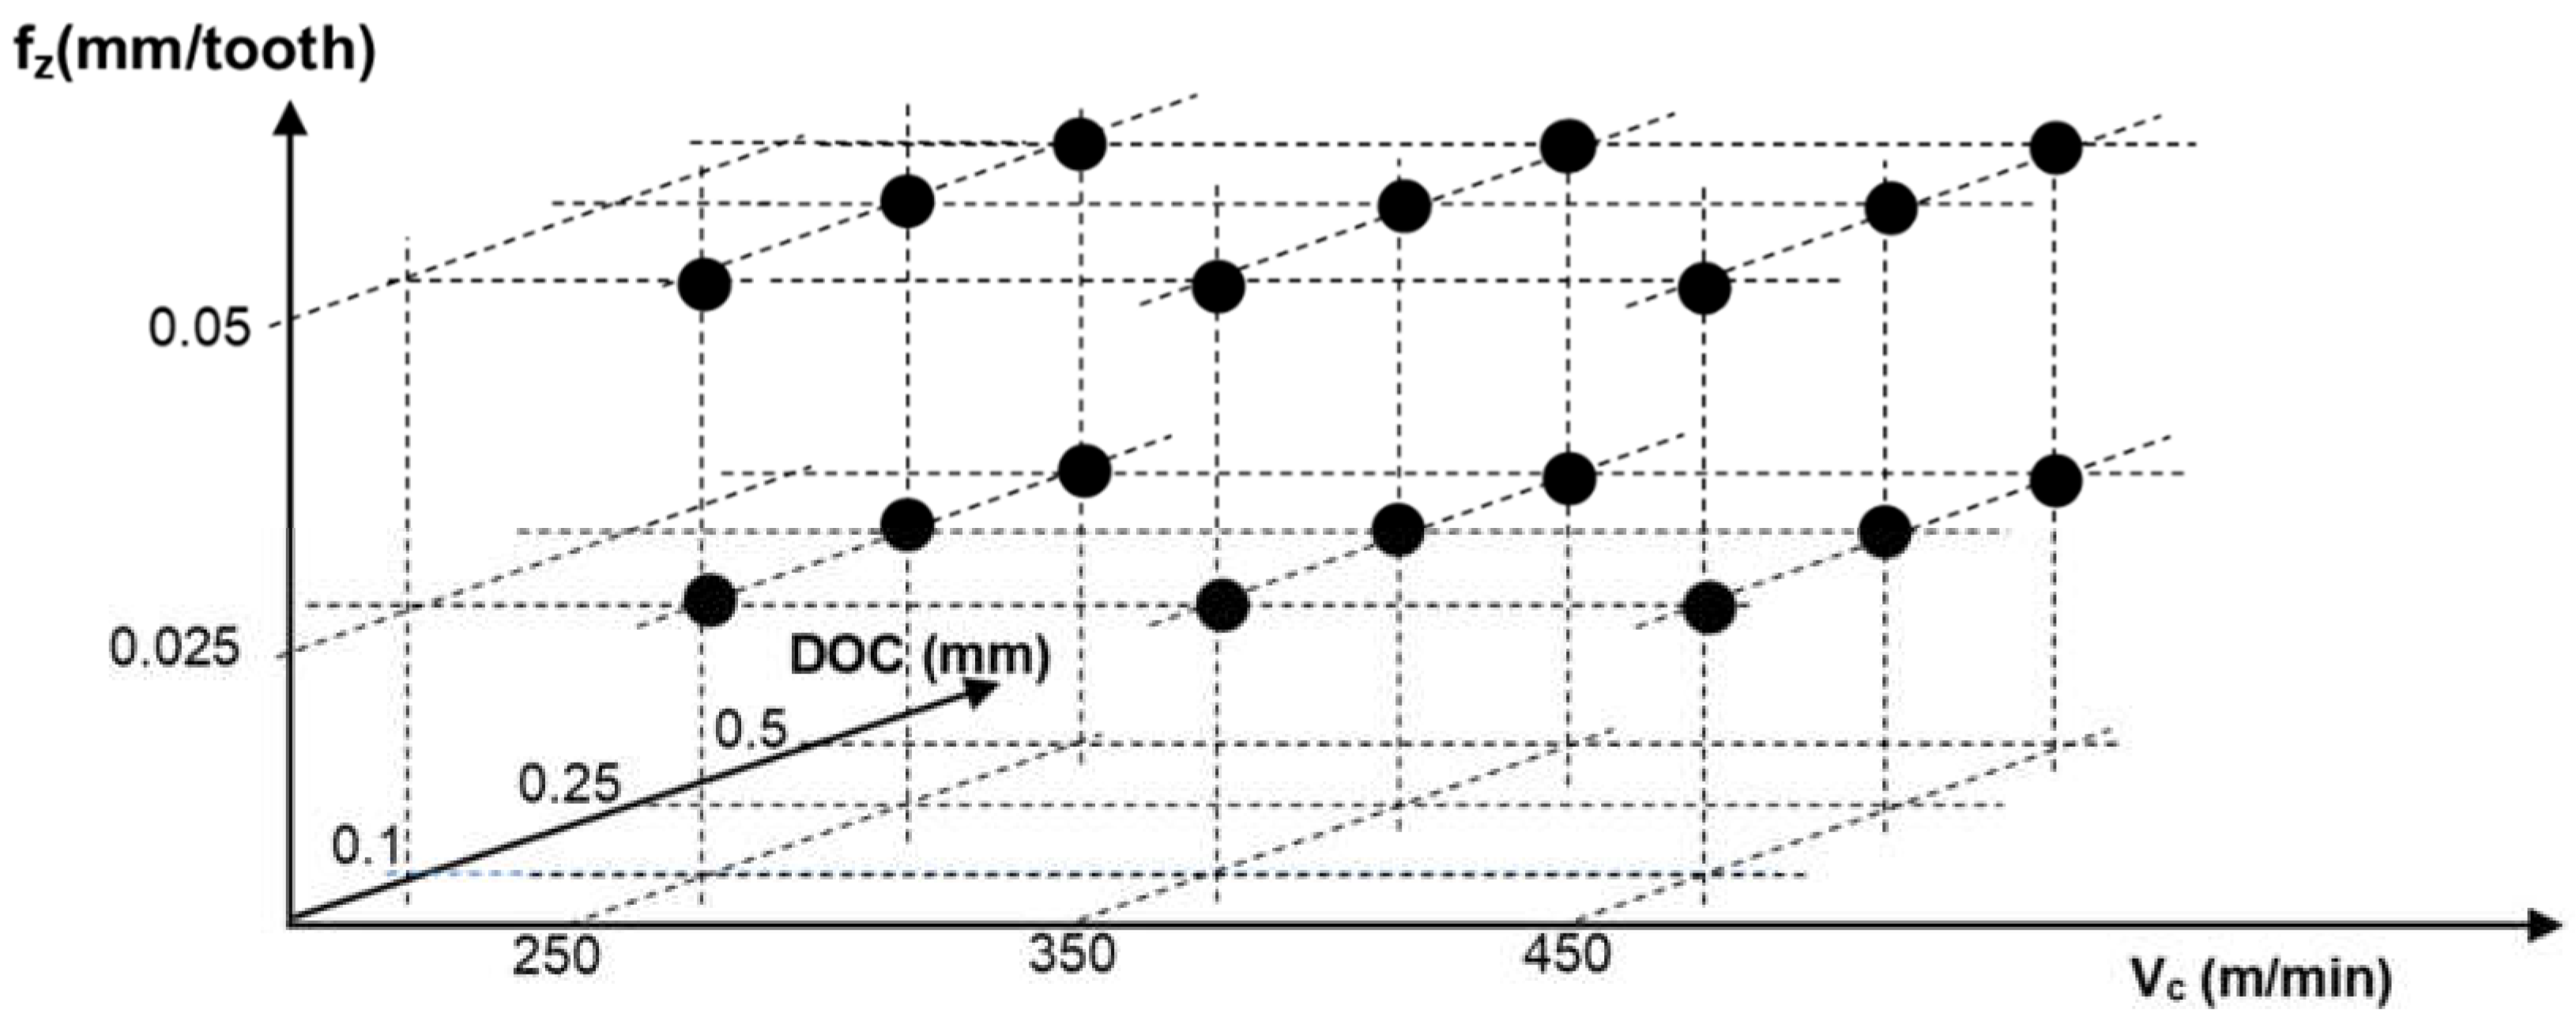
2.1.1. Input Parameters for the LFAB Model (Step 1)

The main features that define the LFAB model are described. Figure 3 illustrates the geometrical cutting tool parameters and workpiece material. The boring tool is a Sandvik Coromant CoroTurn® 107 insert (TCMT 06 T1 04-PF 4325, Sandviken, Sweden) coated with a multi-layer CVD TICN + AL2O3 + TICN. The main geometrical characteristics are 7° of clearance angle, 0.397 of corner radius and 3 cutting edges. The angles of incidence ( k r   y   k r ) are measured with an optical digital microscope Celestron 44302-C (Torrance, PA, USA) as can be seen in Figure 3 and with an optical microscope Dino-Lite AD7013MTL (Torrance, PA, USA). It has a 5-megapixel (2592 × 1944) sensor for crystal clear images with an anti-reflection coating.
The workpiece material is a ST52 cast steel cylinder. The cylinder major and minor diameters are 38 and 28, respectively. Table 1 shows the chemical composition of the material.
The cutting velocity is 250, 350 and 450 m/min, and the feed parameter and depth of cut are 0.05 mm/tooth and 0.5 mm, respectively, for the LFAB experiments. Finally, the vibration parameters are selected in a range of 0–4 Hz for the frequency and 0–0.2 mm for the amplitude to define the LFAB operations.

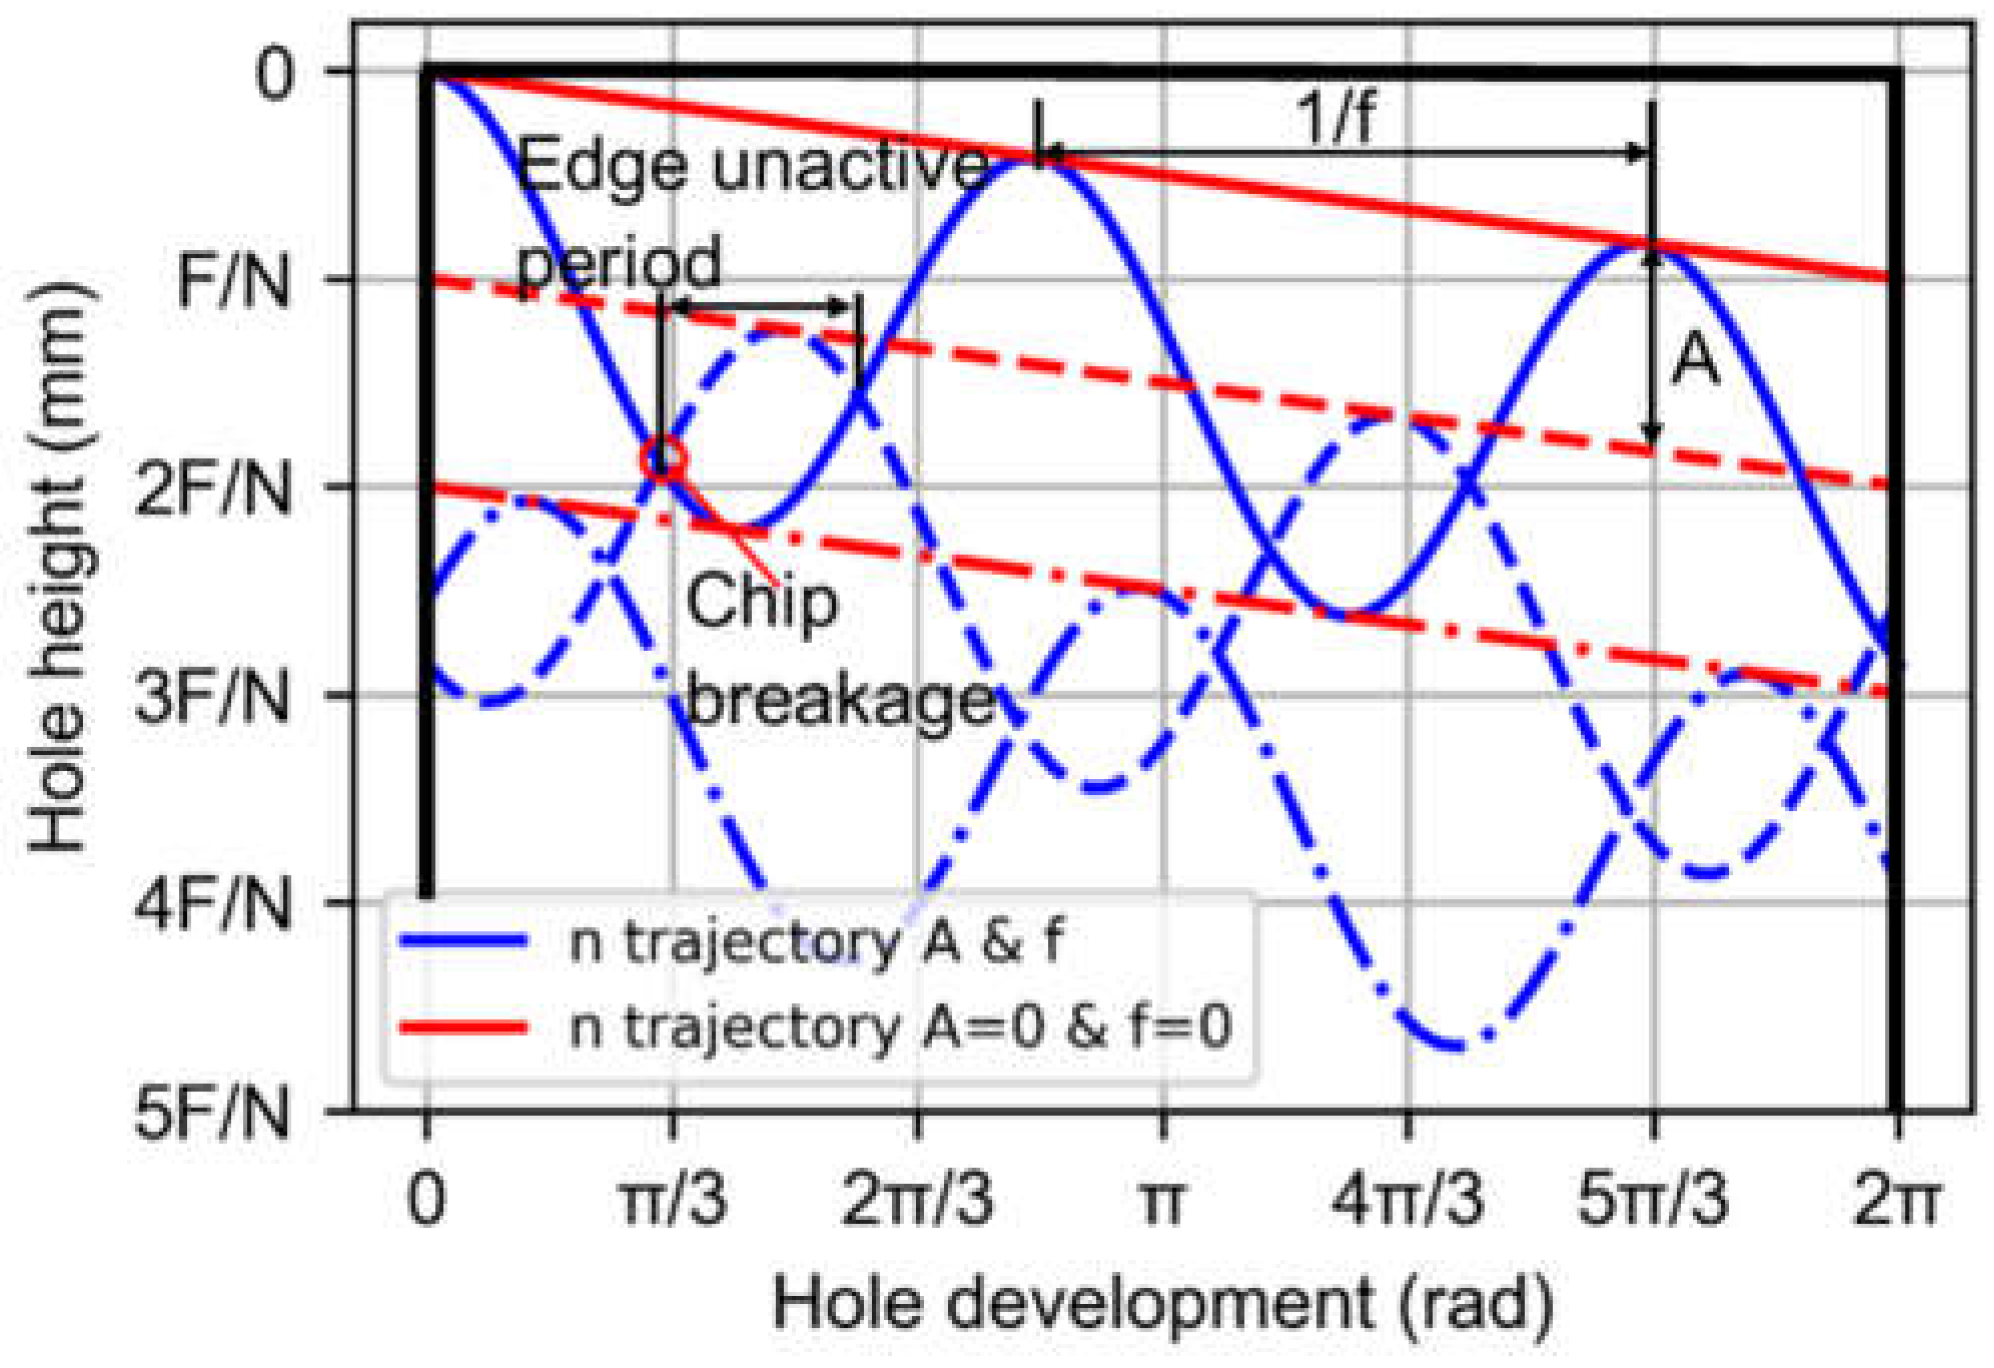
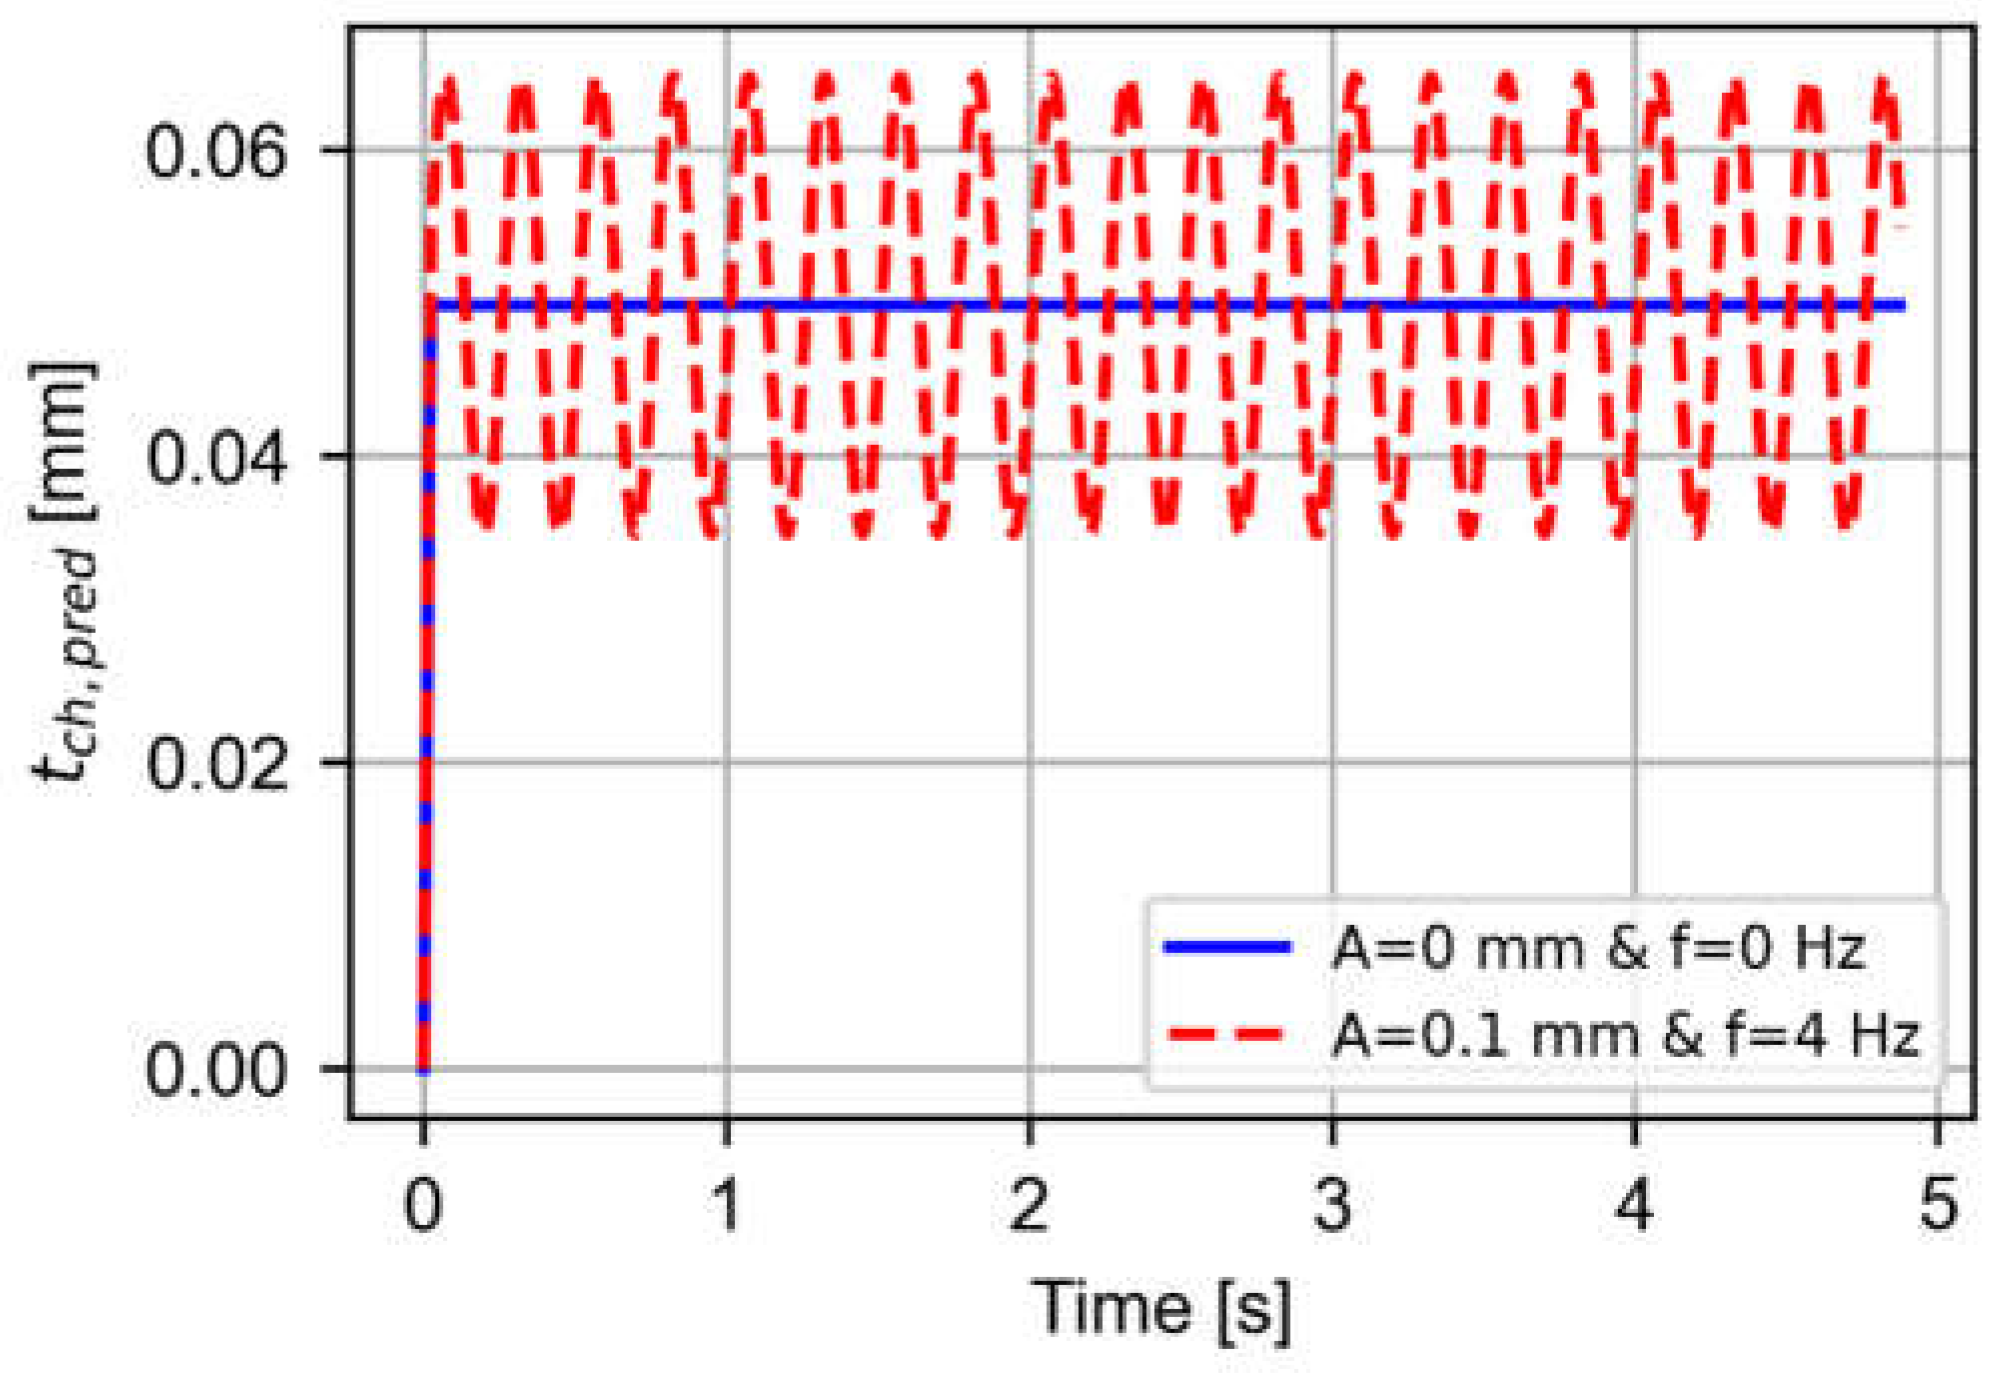
2.1.2. Uncut Chip Thickness Model (Step 2)

The kinematic model is based on a commercial control-supported chip breaking function. This application superimposes a vibrational motion on the lineal motion with the aim of breaking chips during the boring operation. Therefore, lineal movement is calculated by
Z L ,   p r e d = θ · F 2 π · N
where θ is the matrix of the angular position of the tool when developing a cylinder, F is the feed rate, and N is the revolution per minute.
The vibrational motion is defined by the sin2 function as can be seen in Equation (2), where the frequency of the predicted model is f = freq/2
Z V ,   p r e d = A · sin 2 ( 60 · f · θ N )
where A and f are the amplitude and the low frequency, respectively.
Therefore, both motions are superposed to define the LFAB process based on a commercial control-supported chip breaking function.
Z L F A B ,   p r e d = θ · F 2 π · N + A · sin 2 ( 60 · f · θ N )
Figure 4 illustrates the ZLFAB,pred along the angular position of the tool when developing a cylinder for the n trajectories with and without amplitude and frequency values. The chip breakage and the period when the edge is inactive can be observed.
Finally, the uncut thickness matrix (tch,pred) is estimated based on the difference between the superposed motions in the following angular positions:
t c h , p r e d = Z L F A B ,   p r e d i + 1 , j Z L F A B ,   p r e d i , j
Moreover, θ = 2 π · f · t ; therefore, the uncut thickness vector ( t c h , p r e d )
t c h , p r e d = t c h , p r e d ( t ) = Z L F A B ,   p r e d i + 1 , j Z L F A B , p r e d i , j

2.1.3. Force and Torque Model (Steps 3 and 4)

Once uncut thickness parameters along with the time are calculated, the following step (Step 3 in Figure 2) is to estimate cutting forces F c , p r e d . These values are calculated with Equation (5). However, this formula requires the specifications of the tool [16].
F c , p r e d = k c , 1 · A 1 , p r e d + k c , 2 · A 2 , p r e d
k c , 1 , k c , 2 ,   A 1 , p r e d   a n d · A 2 ,   p r e d are the specific pressures and the associated areas of primary and second edges, respectively, ref. [9]
F c ,   p r e d = k c 1 , 1 · b 1 · h 1 , p r e d 1 m + k c 1 , 1 · b 2 · h 2 ,   p r e d 1 m
k c 1 , 1 ,   b 1 ,   b 2 ,   h 1 , p r e d · h 2 , p r e d ,   m are the specific pressure, widths of cut, thicknesses of cut of primary and second edges and material constant, respectively [19].
Taking into account the geometrical parameters of the tool ( k r ,   k r ,   D O C ,   etc . ), Equation (7) is transformed into Equation (8):
F c ,   p r e d = k c 1 , 1 · D O C sin k r · [ t c h , p r e d · sin k r ] 1 m + k c 1 , 1 · D O C sin k r · [ t c h , p r e d · sin k r ] 1 m
Knowing the value of the incidence angle of the primary edge measured in the previous section ( k r = 90 ° ) and reordering the equation terms [19],
F c ,   p r e d = k c 1 , 1 · D O C · t c h , p r e d 1 m · [ 1 + sin k r m ]
Finally, the predicted torque T c , p r e d is calculated according to the following equation:
T c , p r e d = F c ,   p r e d · ( D 2 D O C 2 )
After reordering the equation terms, the final predicted torque equation is as follows:
T c ,   p r e d = 1 2 · k c 1 , 1 · D O C · ( D O C D ) · t c h , p r e d 1 m · [ 1 + sin k r m ]
k c 1 , 1 is the specific pressure and m is the material constant. Both are estimated statistically by studying the conventional boring process measurements.

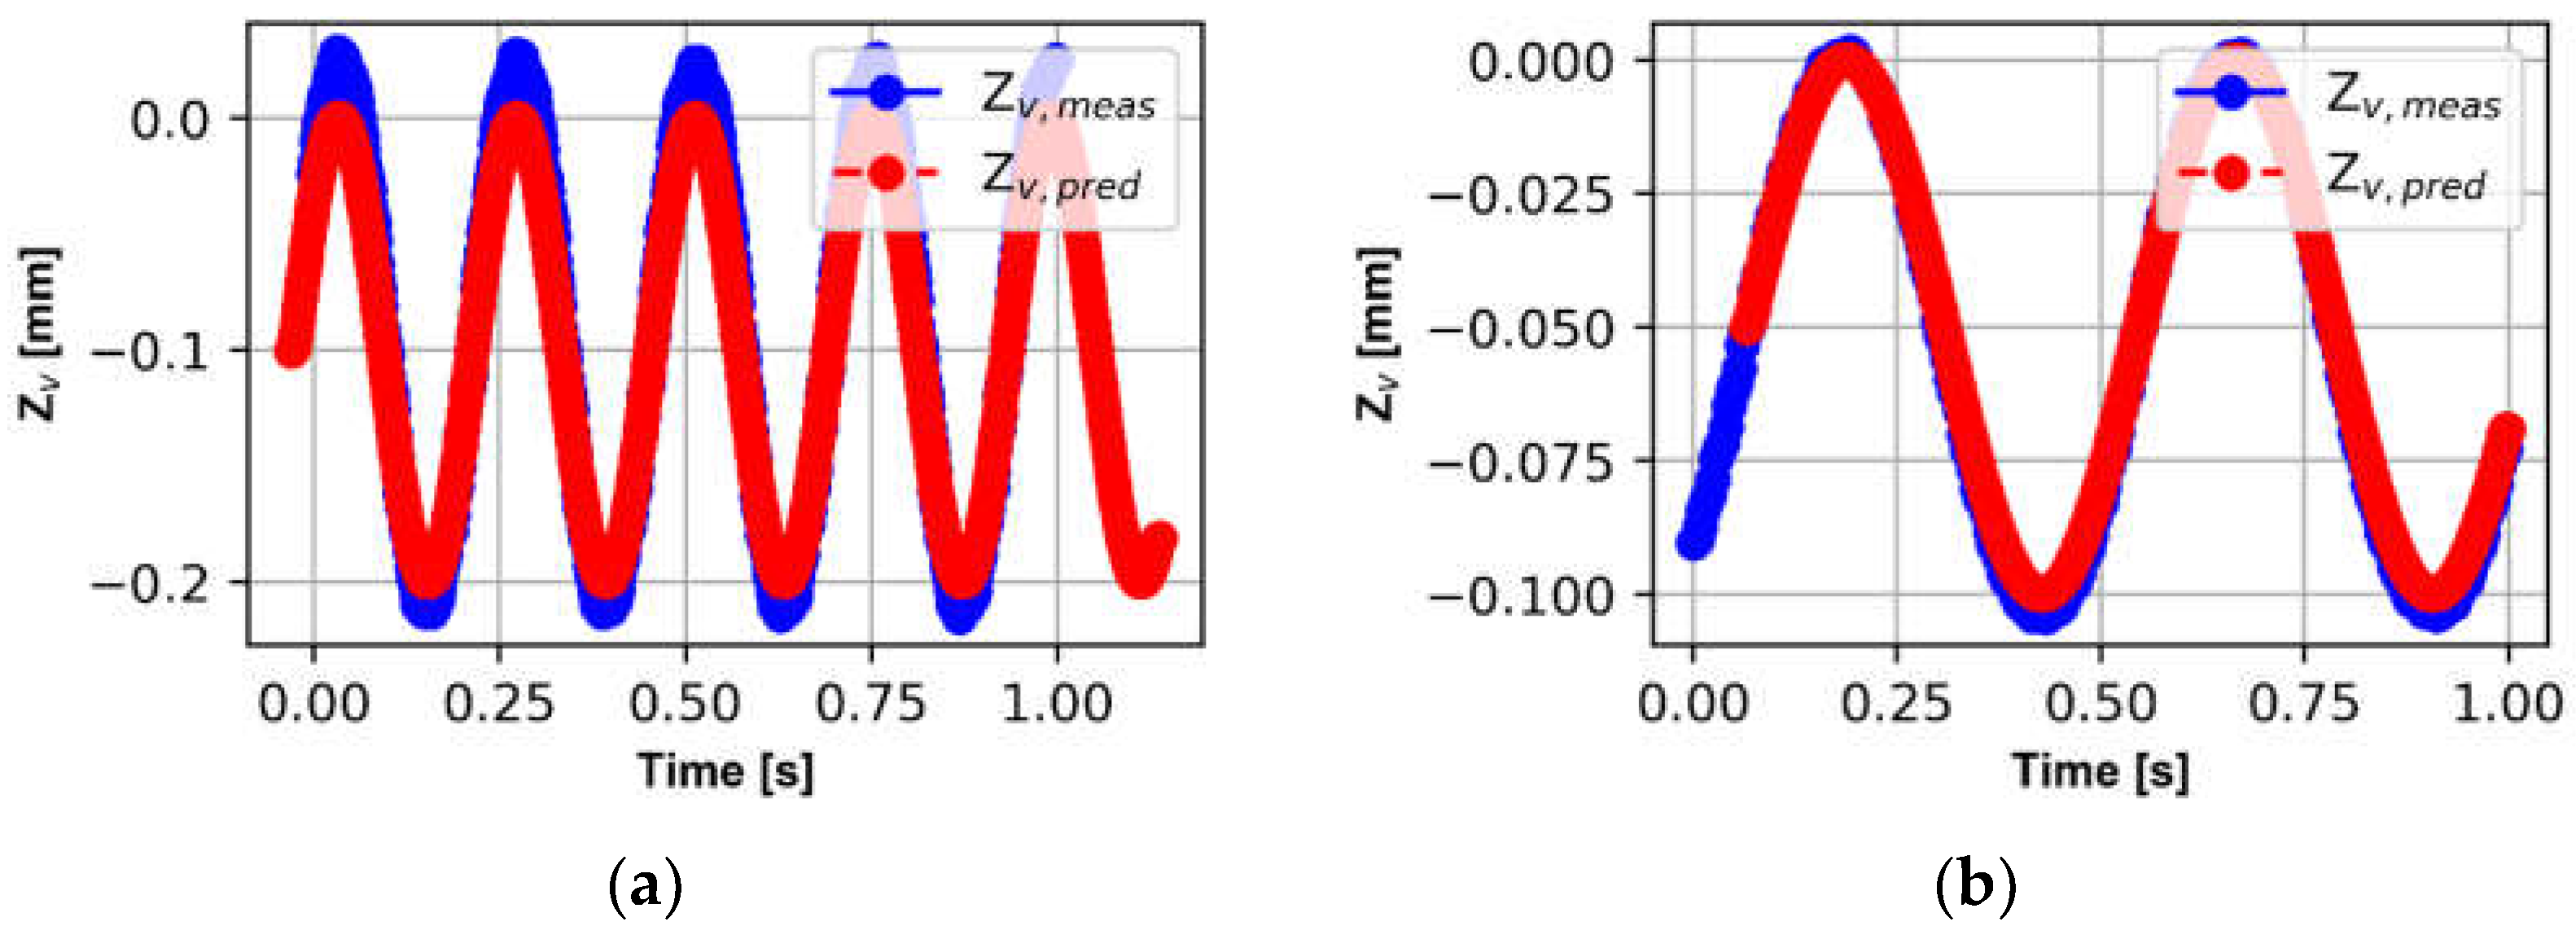
2.1.4. Validation Results and Discussion (Step 5)

In order to confirm the validity of the predicted torque model, several LFAB processes are performed. On one hand, this stage fits the torque model according to the conventional boring measurements analyzing different cutting conditions. On the other hand, the LFAB model fulfills the requirements of an industrial control function and is validated with different vibration conditions.
After describing the steps involved in setting the torque model for each case of boring, the chain of experiments is described. The chain of experiments is described in the following subsection, as well as the machine and cutting conditions.

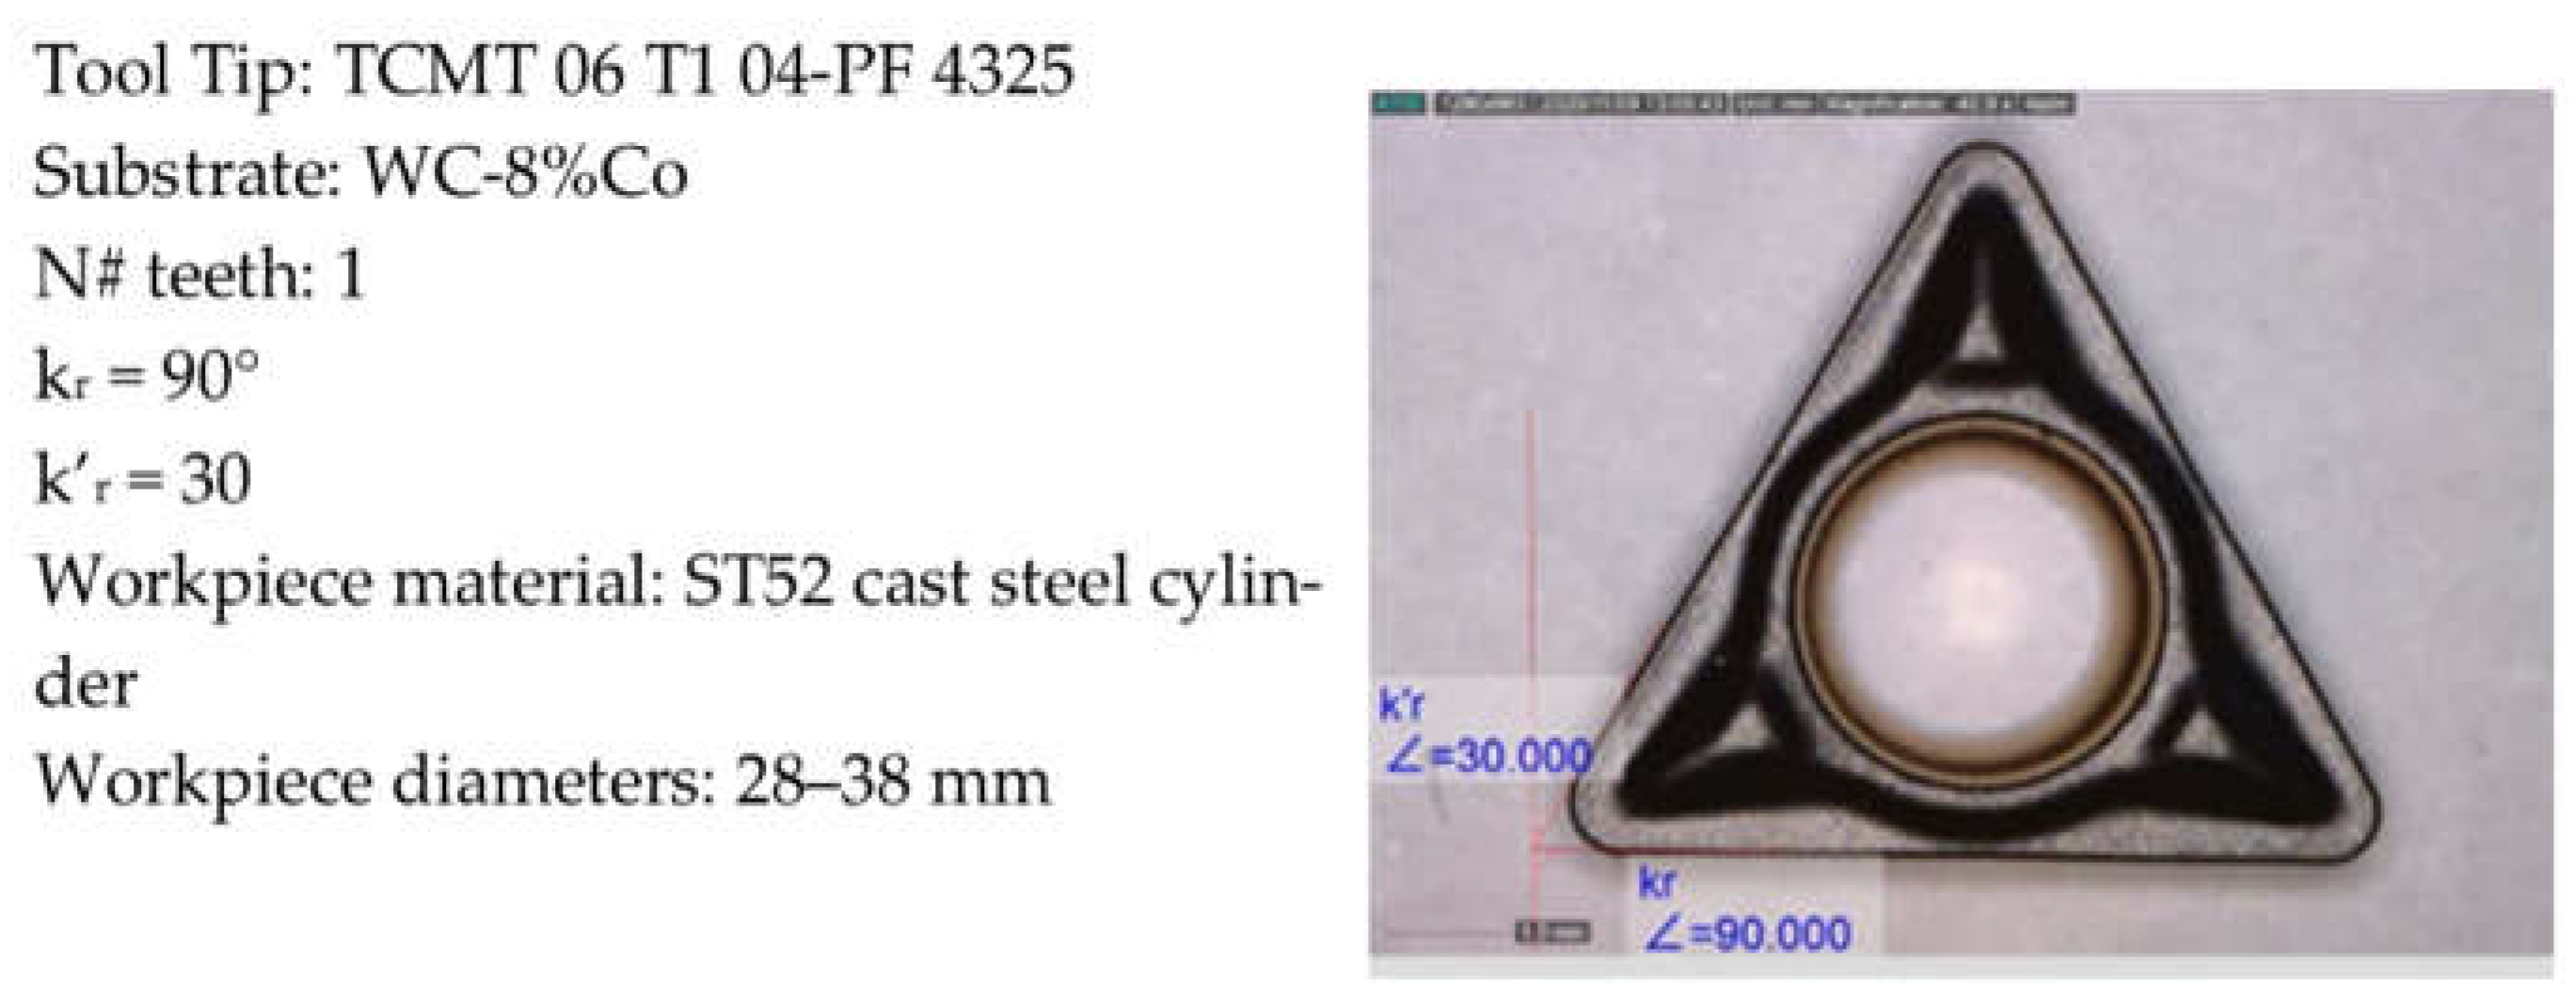
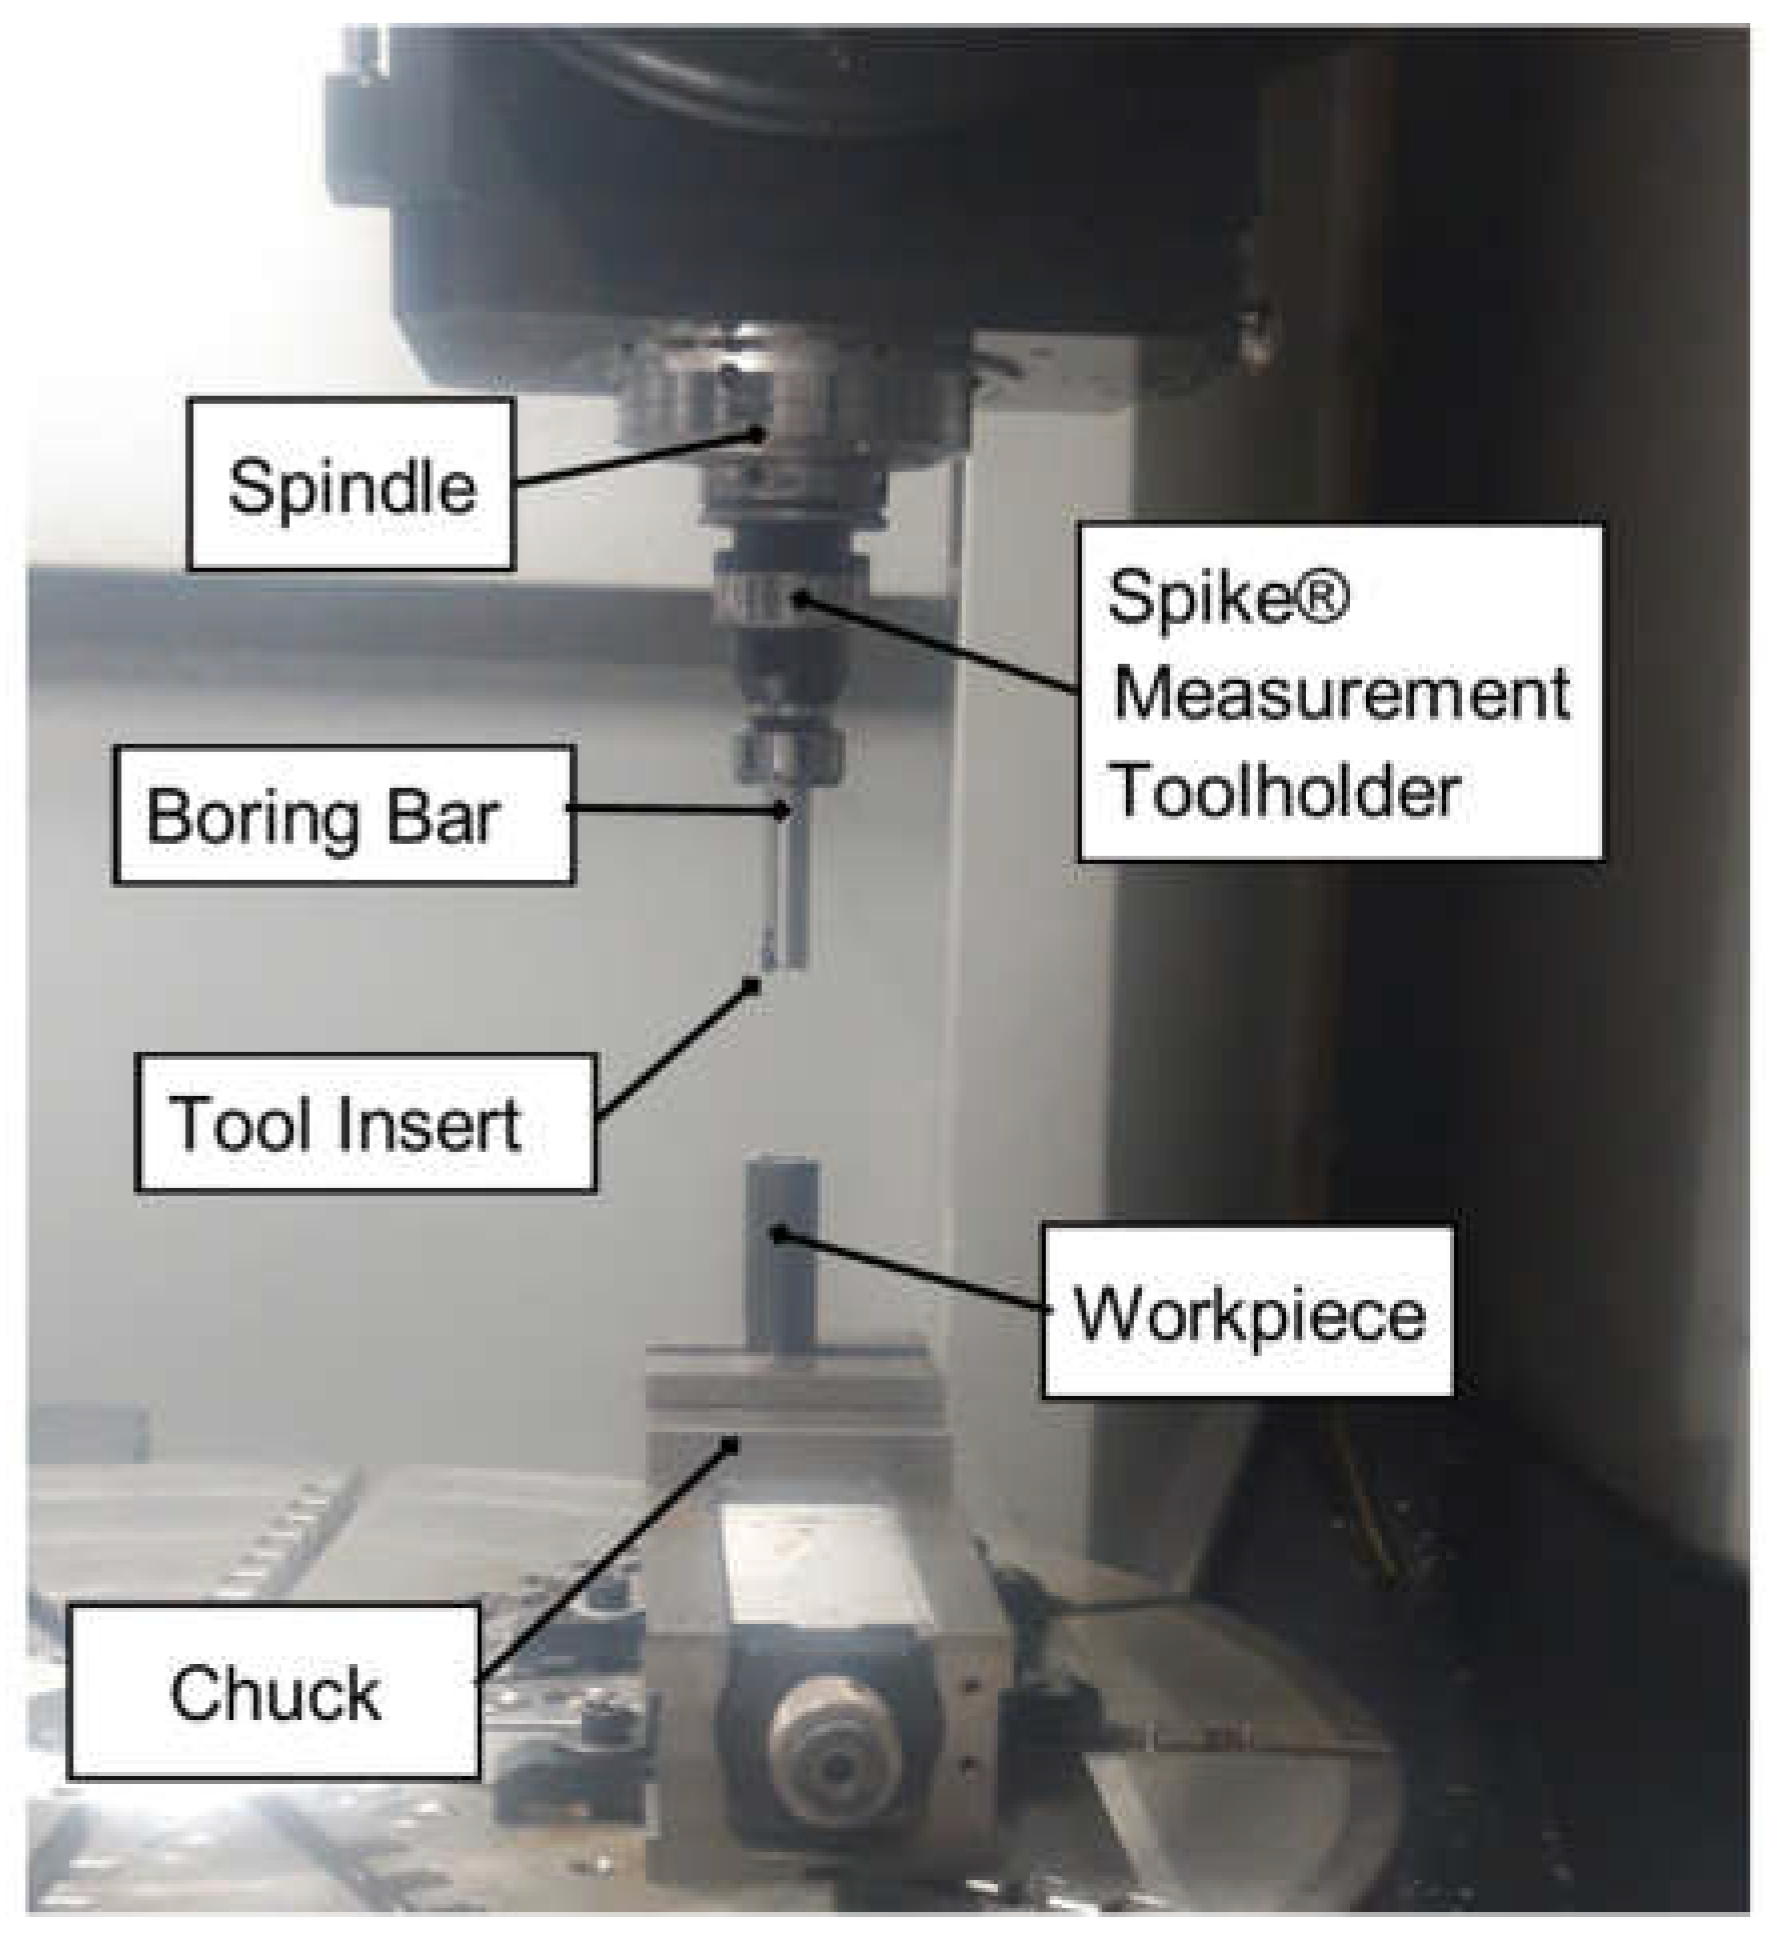
2.2. LFAB Tests Set-Up

The boring measurements are carried out in the 5-axis multitasking machining center THR 16 (Ibarmia, Azkoitia, Spain) with SINUMERIK 840D sl CNC software (Siemens, Berlin, Germany). The workpiece material is an ST52 cast steel cylinder whose outer and inner diameters are 40 and 28 mm, respectively. The Sandvik CoroBore® 825 fine boring tool (825-36TC06-A25) and coated commercial cemented carbides tool tips (Sandvik Coromant TCMT 06 T1 04-PF 4325, Sandviken, Sweden) with a 0.396 mm nose radius are used.
For the design of the experiments, cutting velocities are 250, 350 and 450 m/min, feed per tooth are 0.025 and 0.050 mm/tooth and depth of cut are 0.1, 0.25 and 0.50 mm. Therefore, 18 conventional measurements are required to fit the force model (three times replicated). The boring process worked without coolant. Figure 5 illustrates the setup of the LFAB process in the multitasking machining center.
Table 2 below summarizes the cut-off parameters used in the work presented in this paper. Table 2 in Group a presents the cutting conditions under conventional conditions that serve to feed Step 3, in which the constants of the tool–workpiece binomial are defined. All these tests are performed without amplitude and frequency. Table 2 in Group b shows the values used in the model validation tests, either in the kinematic part Step 2 or the torque model Step 4.
During the boring process, the milling machine is equipped with the Pro-micron Spike® system to acquire the cutting along the Z direction, the torque and the bending moments, although only the first two signals are studied to develop the torque model. This sensor is located on the tool holder. Post-processing analysis of the registered signals is performed in Python®.

3. Results and Discussion

3.1. Uncut Chip Thickness Model Results

Before fitting and validating the torque model, the model development proposes the validation of the vibration motion when using the commercial control-supported chip breaking function (Sf), and then studies the tool trajectory to understand the LFAB process when the chip segmentation control is enabled. The uncut chip thickness model results are shown.
Focusing on the validation of industrial vibration control, Table 3 shows two experiments with the same cutting conditions and different vibrations.
Figure 6 shows the superposed vibration motions in the cases of Table 3, corresponding to the vibration conditions of (a) vibration amplitude 0.1 mm and frequency 4 Hz and (b) vibration amplitude 0.05 mm and frequency 2 Hz. The first one is when the industrial chip segmentation control is used and the second one is the modeling movement using Equation (2). The R-squared of these two measurements are 0.90 and 0.95, respectively.
On validating the vibration motion in the model according to the industrial function, the tool trajectory and the predicted uncut thickness results are shown according to the cutting and vibrational conditions described in Table 4.
On the other hand, Figure 7 shows the predicted uncut thickness according to the cutting and vibration conditions in Table 2. The red signal shows the predicted chip thickness in the case of LFAB application with 0.1 mm amplitude and 4 Hz vibration frequency, and the blue line shows the predicted chip thickness under the same cutting conditions but without applying vibrations. It can be seen that the chip thickness in conventional cutting is constant once the tool enters the hole to be bored, while the chip thickness in the case of LFAB is variable according to the kinematics described in Figure 6.
This model parameter estimated by Equations (4) and (5) is the input for the next stage to validate the force and torque model analyzing an LFAB process.

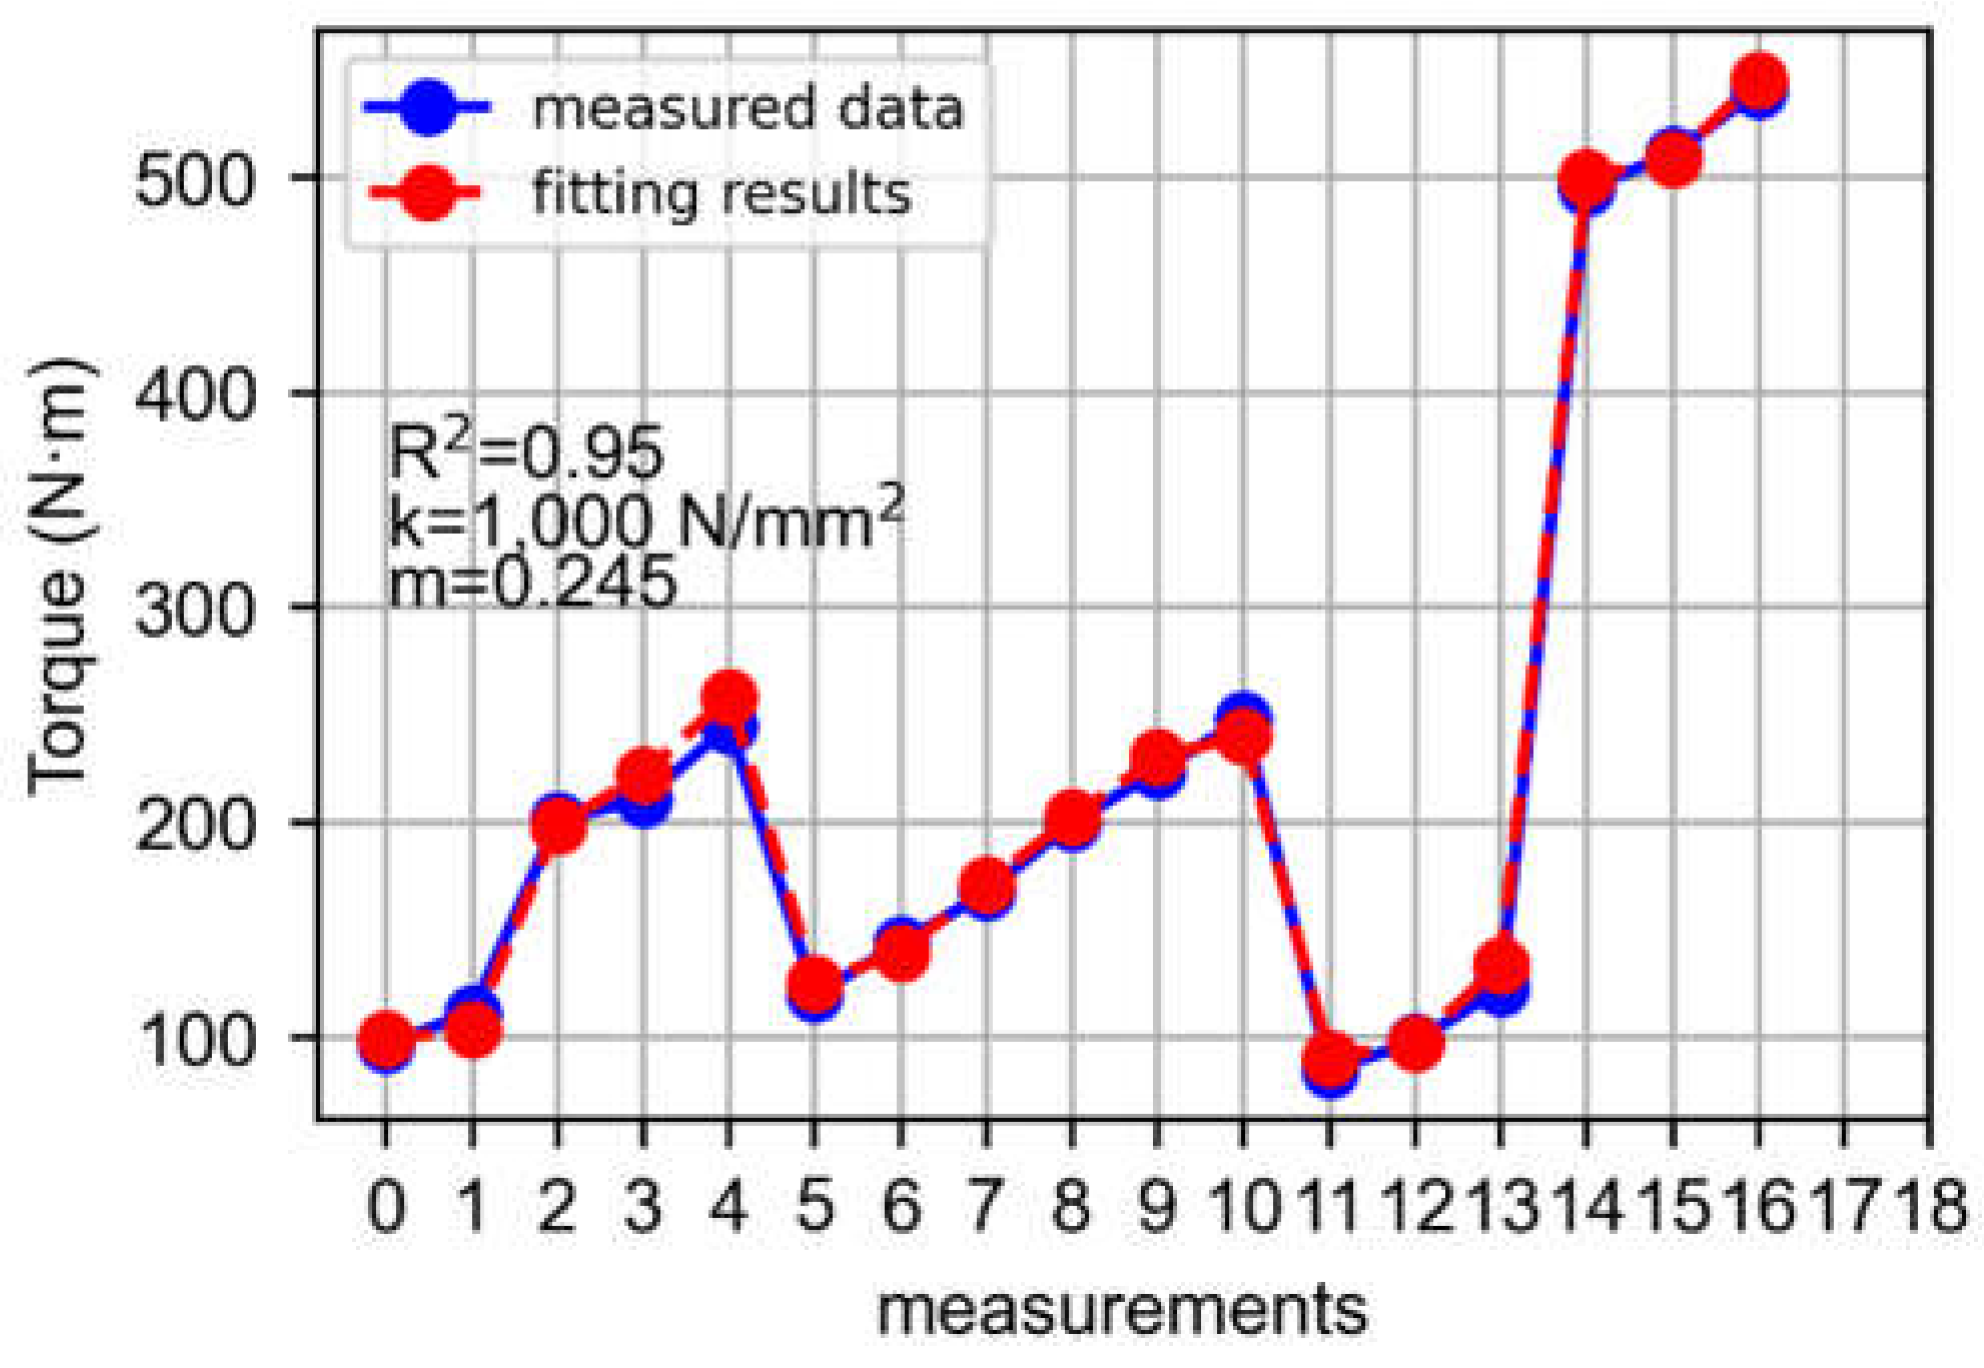
3.2. Fitting of Force Model Results

To calculate the uncut thickness, firstly, the force model is fitted according to conventional boring experiments and considering Equation (11), and, secondly, the model torque is fitted by the conventional boring experiments under different cutting conditions.
Figure 8 illustrates the design of experiments (DoE) proposed for the conventional measurements. Three levels for cutting velocity (250, 350 and 450 m/min), three levels for DOC (0.1, 0.25 and 0.5 mm) and two levels for fz (0.025 and 0.05 mm/tooth) are selected to define the DoE. All in all, there is a total of 18 measurements for the experiments. Furthermore, the boring tool diameter and the coolant are 30 mm and in dry conditions, respectively. Finally, the vibration conditions (amplitude and frequent) are zero in conventional experiments.
Before fitting the torque model, the average value is calculated by studying the steady state of the boring operation as can be seen in Figure 9. In Figure 9, torque signal and the average torque level of the conventional experiment registered by Pro-micron Spike are shown.
Once the torque average values of the DoE conventional measurements are estimated, best described in Table 2 Group a, the final stage is to fit the model torque regarding these averages and Equation (11). Figure 10 shows the average measured torque values and the fitting results. The fitting strategy used Python® functions to achieve the best R-squared parameter, which is the statistical measure used in this paper to represent the proportion of the variance of the dependent variable to be modeled (in this case the torque) that is explained with the regression [22].
The R-squared is 0.95; therefore, the specific pressure ( k c 1 , 1 ) and the material constant (m) values are fitted to 1000 N/mm2 and 0.245, respectively [23]. Therefore, Equation (11) is transformed into
F c ,   m o d = 1000 · D O C · t c h , m o d 1 0.245 · [ 1 + sin k r 0.245 ]
Consequently, the torque equation is
T c ,   m o d = 1 2 · 1000 · D O C · ( D O C D ) · t c h , m o d 1 0.245 · [ 1 + sin k r 0.245 ]

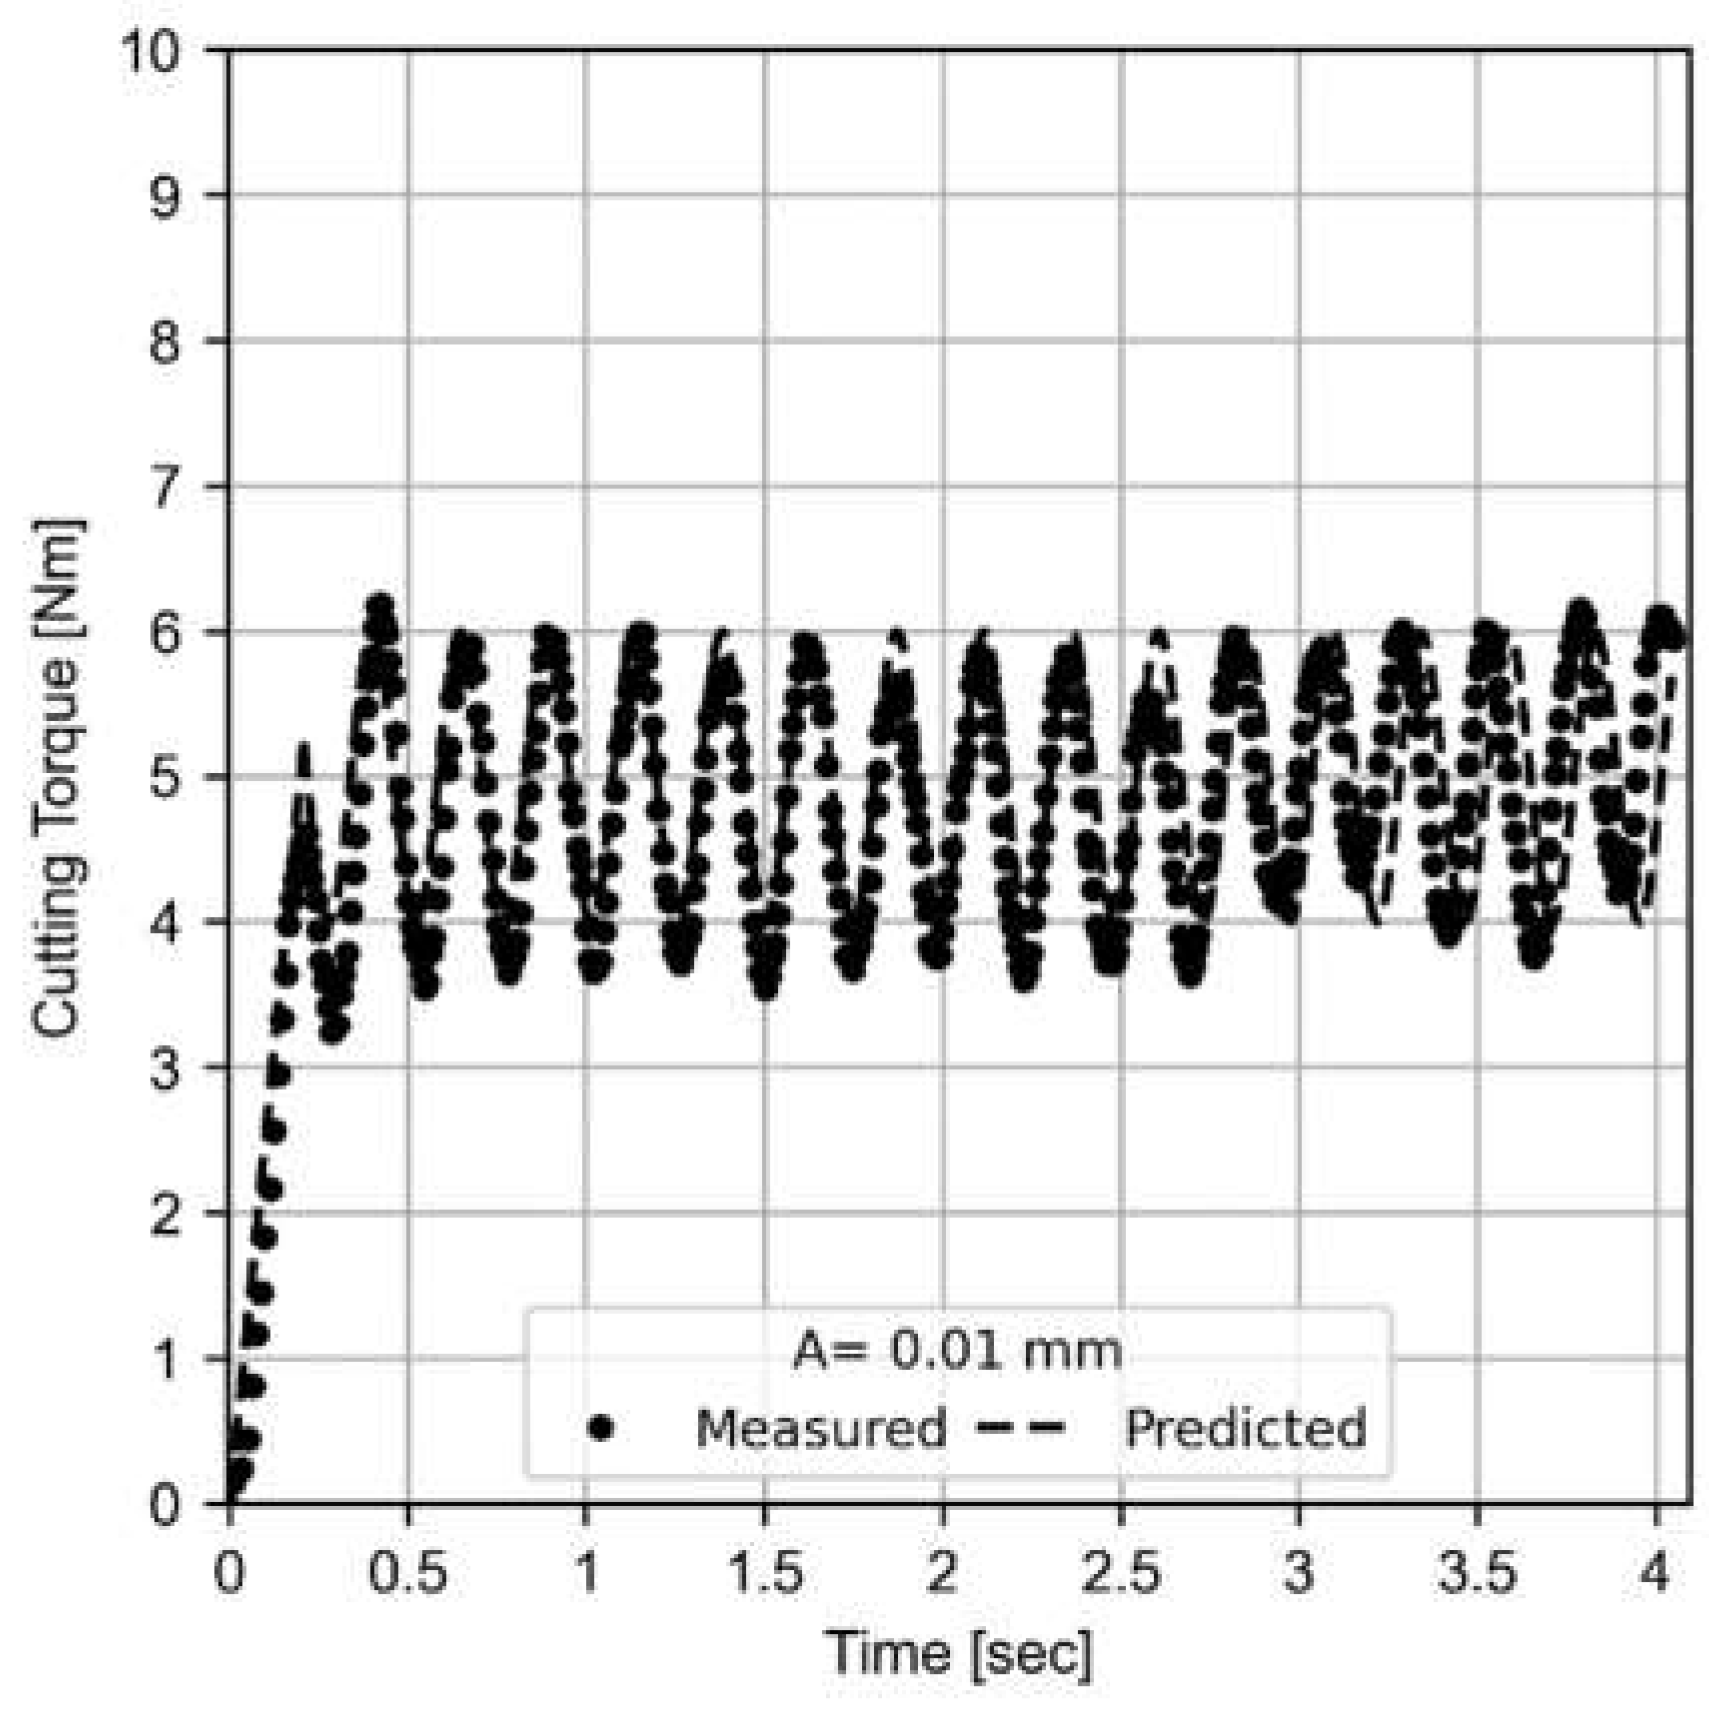
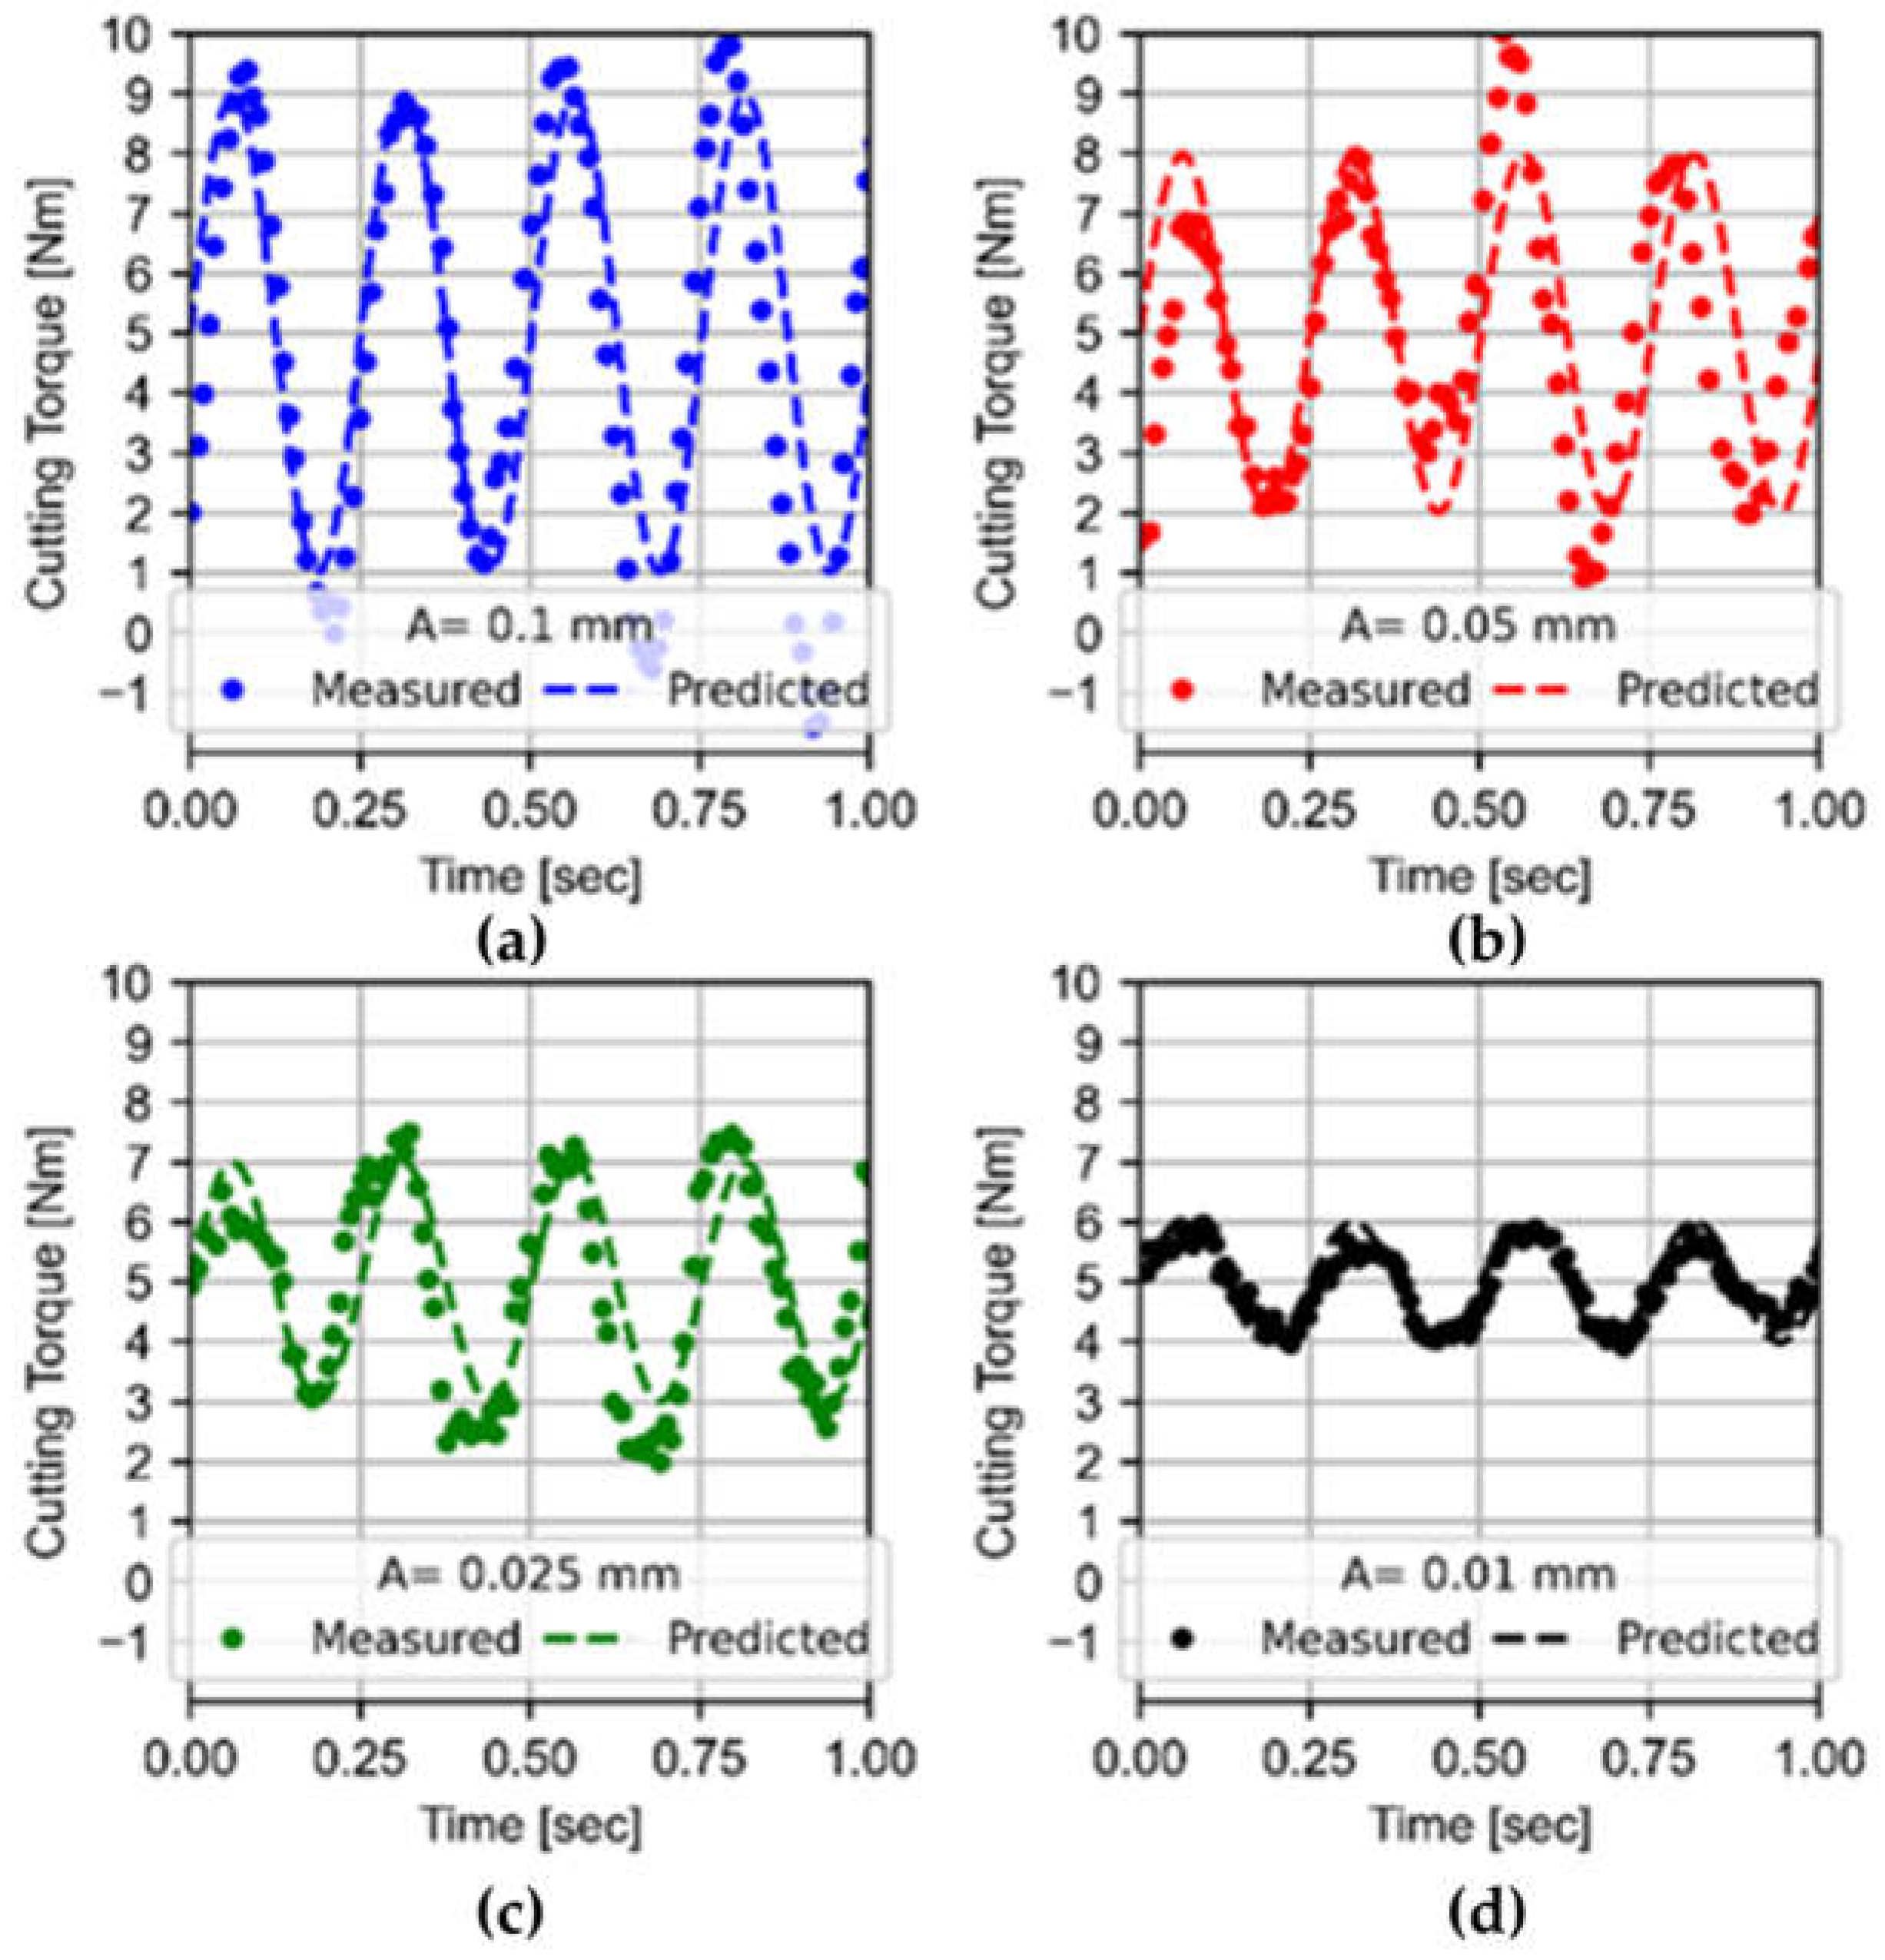
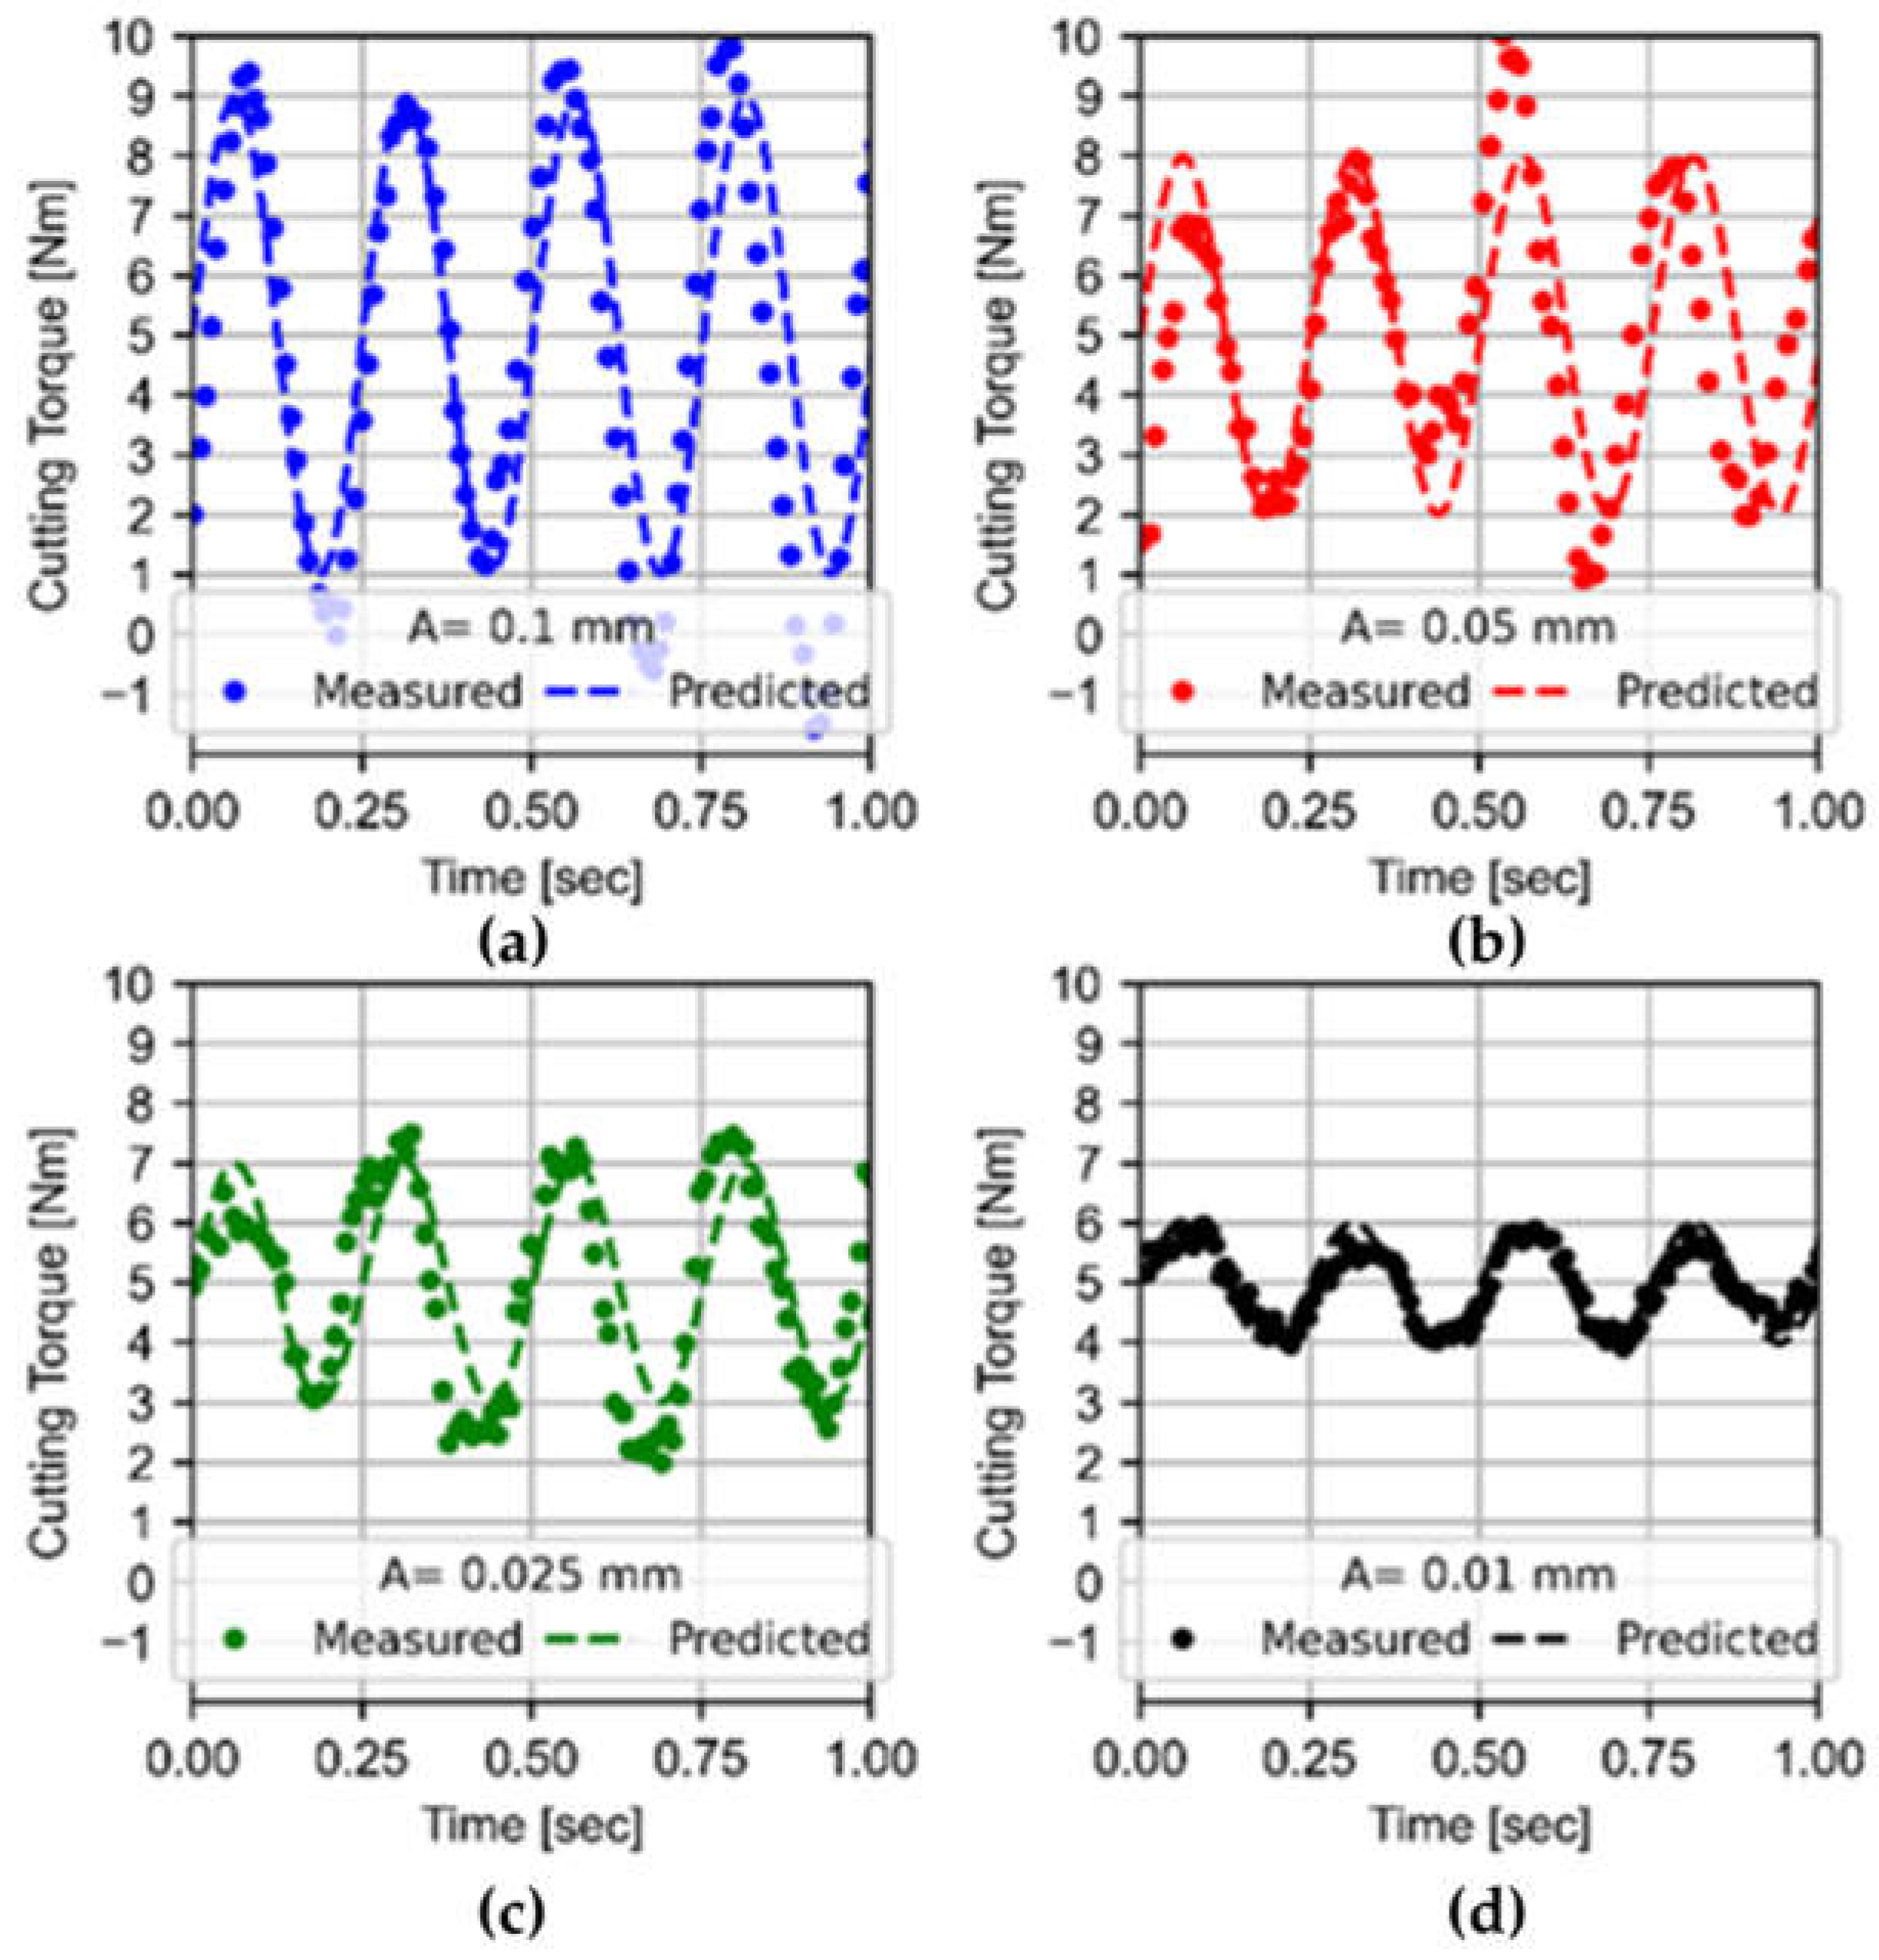
3.3. Torque Model Results

In this section, a torque model is presented as the result of the force model applied to the boring tool. In this section, the torque model is studied as a comparison parameter as it better adjusts to the phenomenon of machining with a rotary tool.
Once the theoretical background is described, the torque model and experimental results are validated for different vibration conditions and cutting requirements.
Focusing on the amplitude change, this study proposes to keep the values of cutting speed, fz and depth of cut, whose values are 250 m/min, 0.05 mm/tooth and 0.5 mm, respectively. The measurements are made in dry conditions. The boring tool diameter is 28 mm. The frequent is kept in the value of 4 Hz, and the amplitude values selected are 0.1, 0.05, 0.025 and 0.01 mm. Figure 10 shows the predicted and measured torques for an LFAB operation with an amplitude level of 0.01 mm and a frequency of 4 Hz. The R-squared is 0.98. The dashed line corresponds to the predicted signal that fits perfectly with the measured signal (black dots). It can be seen how the torque value increases from zero as the tool penetrates the part (the section before 0.3 s). Once the tool is fully inserted into the part, the torque has an average value of around 4.5 Nm and a peak-to-peak variation of 1.5 Nm.
All in all, the LFAB model performance works reasonably well to predict the torque by studying an LFAB process. Figure 11 shows the measured and predicted torques of LFAB operations keeping the frequency value at 4 Hz and selecting an amplitude range (0.1, 0.05, 0.025 and 0.01 mm). A better description of the cutting conditions used is shown in Table 2b tests 19–22. A reduction of peak-to-peak values is observed with decreasing vibration amplitude, while the mean torque value appears to remain constant.
Keeping the amplitude value, Figure 12 shows the predicted and measured torques in the LFAB operations at different frequency values. More precisely, the torque signals shown are test 23 in blue at a frequency of 0 Hz without LFAB, test 24 in red at 1 Hz, in green at 2 Hz test 25 and test 26 in black at a frequency of 4 Hz, which is test 27 of Table 2. One of the most favorable findings is that the use of LFAB does not result in a higher average cutting torque. As for the peak-to-peak torque, it reaches zero when segmentation occurs at all frequencies but seems to be slightly higher at the 4 Hz frequency.
The presented torque model shows results adjusted to the measurements made, with an error of 9% in the tests with amplitude variation and 13% in which the variable under examination is the frequency. A deviation smaller than 10% is widely accepted, although the quality of the prediction depends on the nature of the physical phenomenon and the measurement equipment [24]. This error is calculated considering the error percentage as Equation (14). In frequency tests, the source of the error comes from a certain phase difference between the simulated wave and the experimental wave.
i = 0 n T i m e a s u r e d T i p r e d i c t e d n   ·   T i m e a s u r e d × 100

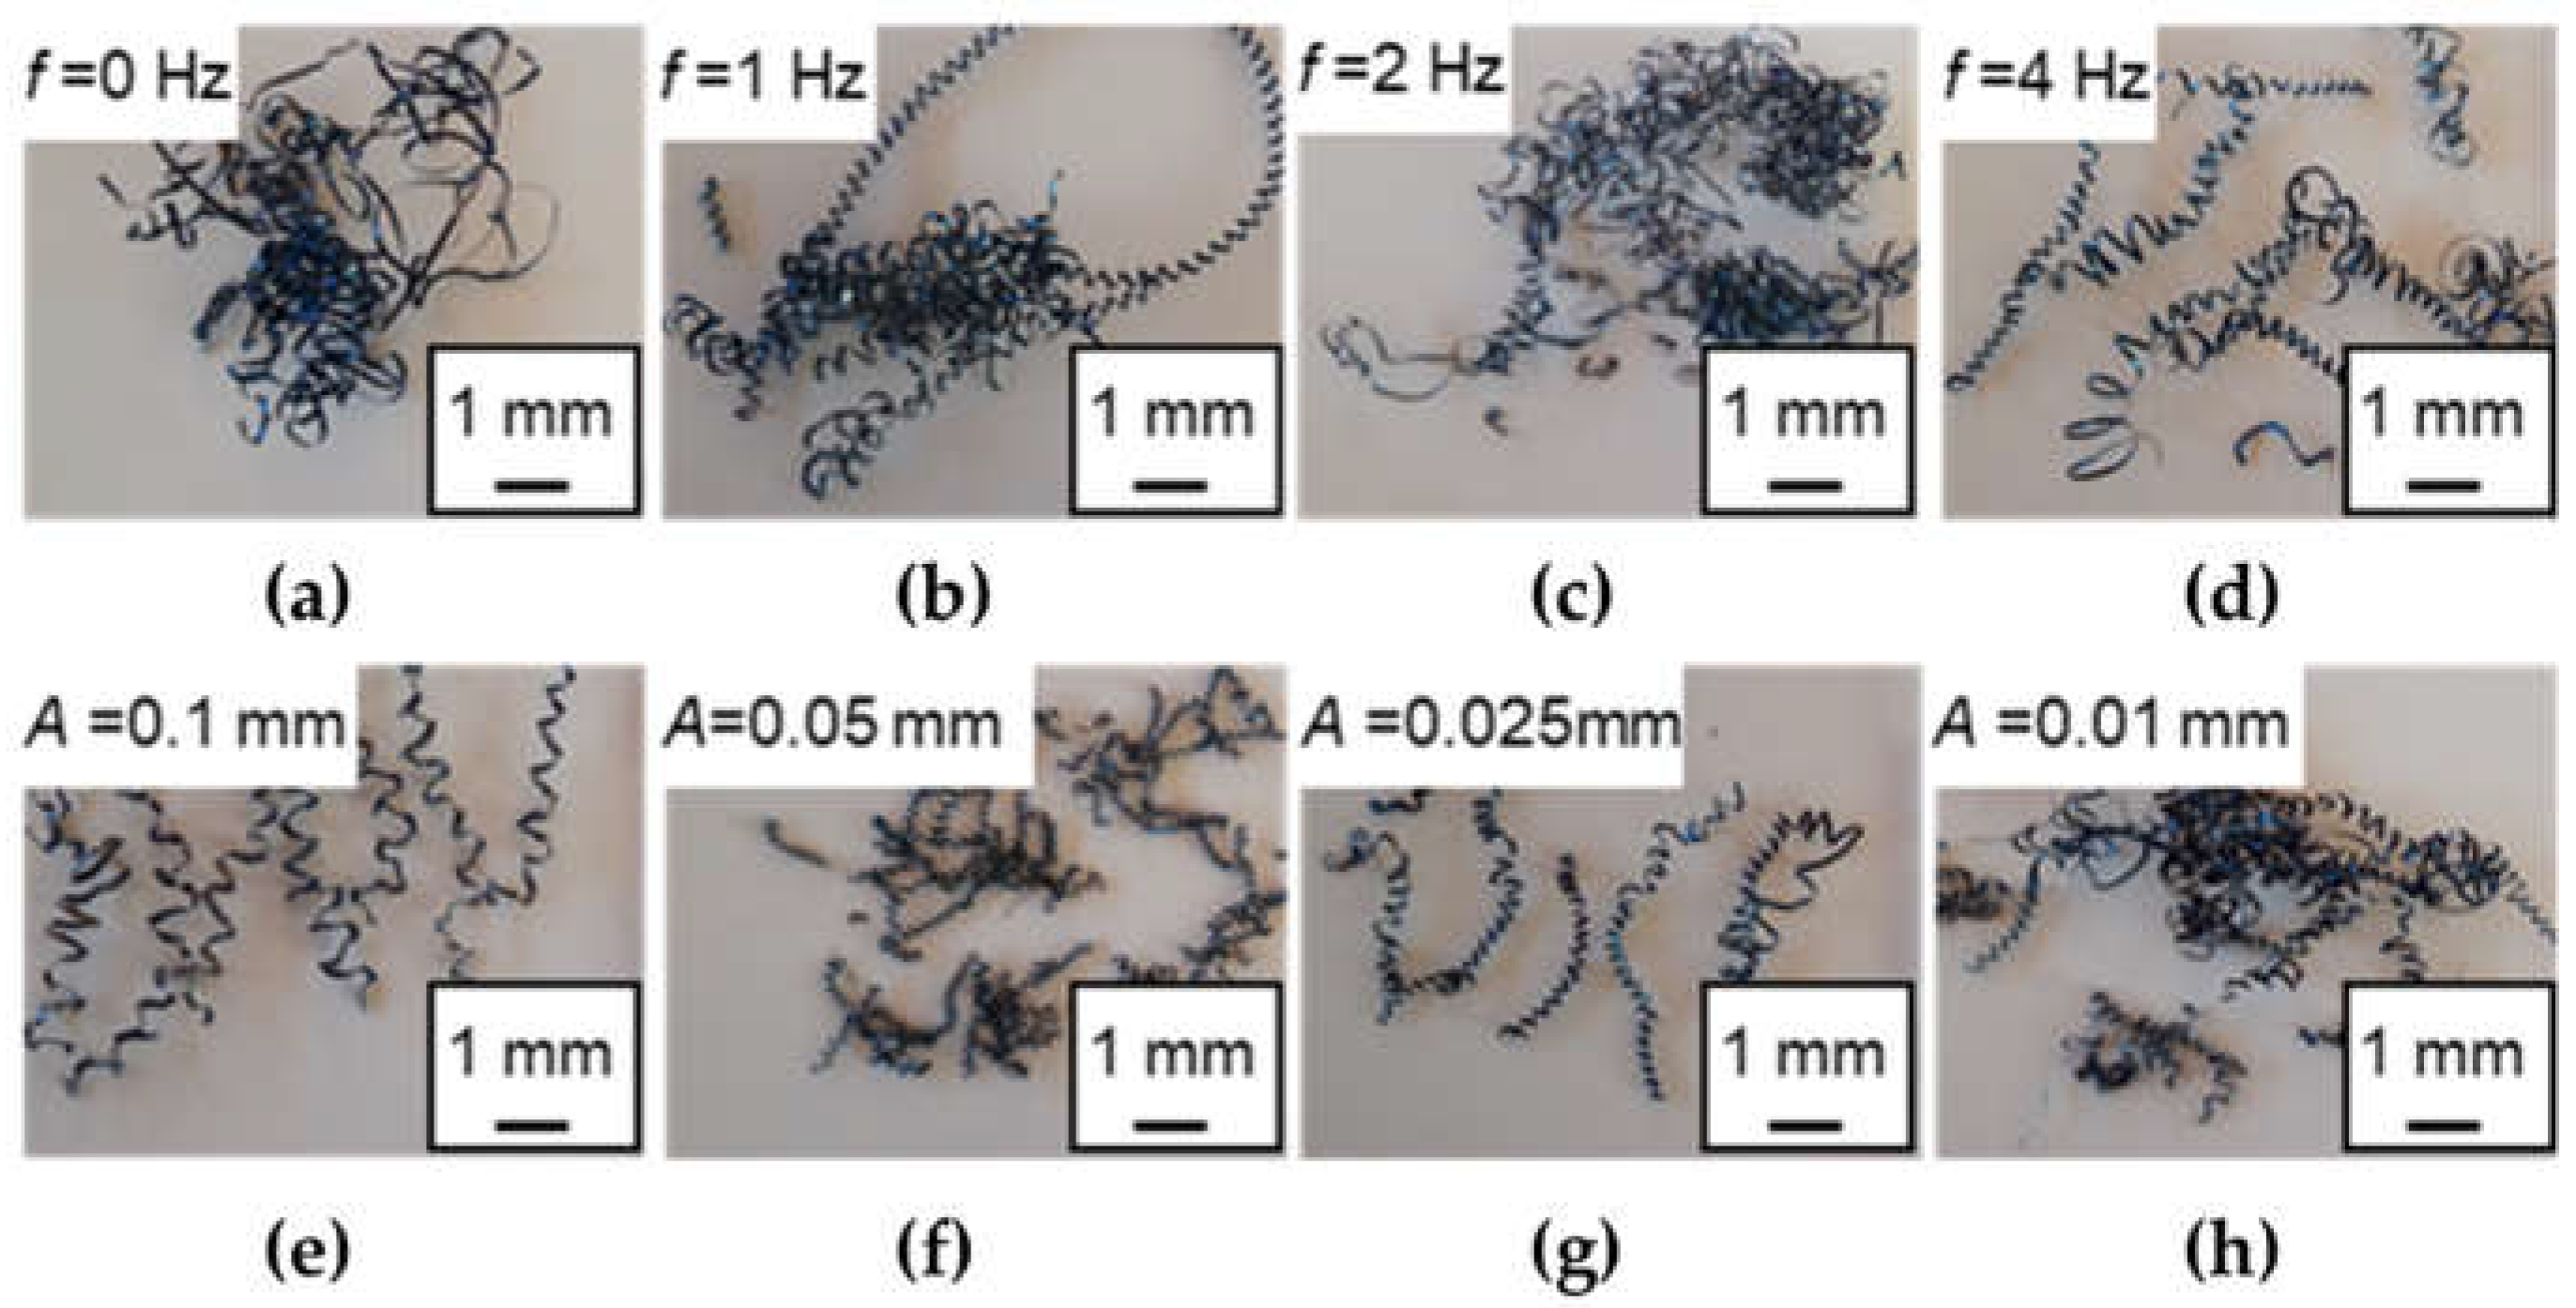
3.4. Observation of Chip Formation

Figure 13 shows the chips collected during the tests carried out to compare chip typology described and given by the standard [25]. The standard establishes categories by numbering them from 1. Ribbon chips to 8. Natural broken chips. A distinction is made between a favorable chip for cutting and an unfavorable chip. Considering this classification, the produced chip goes from an unfavorable 4.3 Snarled shape to a 4.2 Short in the 4. Washer-type chip category as the vibration frequency increases. The amplitude of vibration that produces a better chip corresponds to half the feed per tooth.
With further details on the analysis in Figure 13, for the same cutting conditions (Vc = 250 m/min, fz = 0.05 mm/tooth and DOC = 0.05 mm), as the frequency is increased, the chip is segmented more and more manually up to 4 Hz for a vibration amplitude of A = 0.1, double the feed per tooth. This amplitude of vibration is considered excessive; therefore, it is reduced by maintaining a fixed frequency of 4 Hz, and the lower part shows how this affects chip formation. An amplitude equal to the feed rate per revolution is not necessary. This is due to the fact that the waves are out of phase and the machined material is not excessively ductile. This is proven by the fact that the ends of the segmented chip do not transition from their maximum chip thickness to zero but that the segmentation occurs earlier.

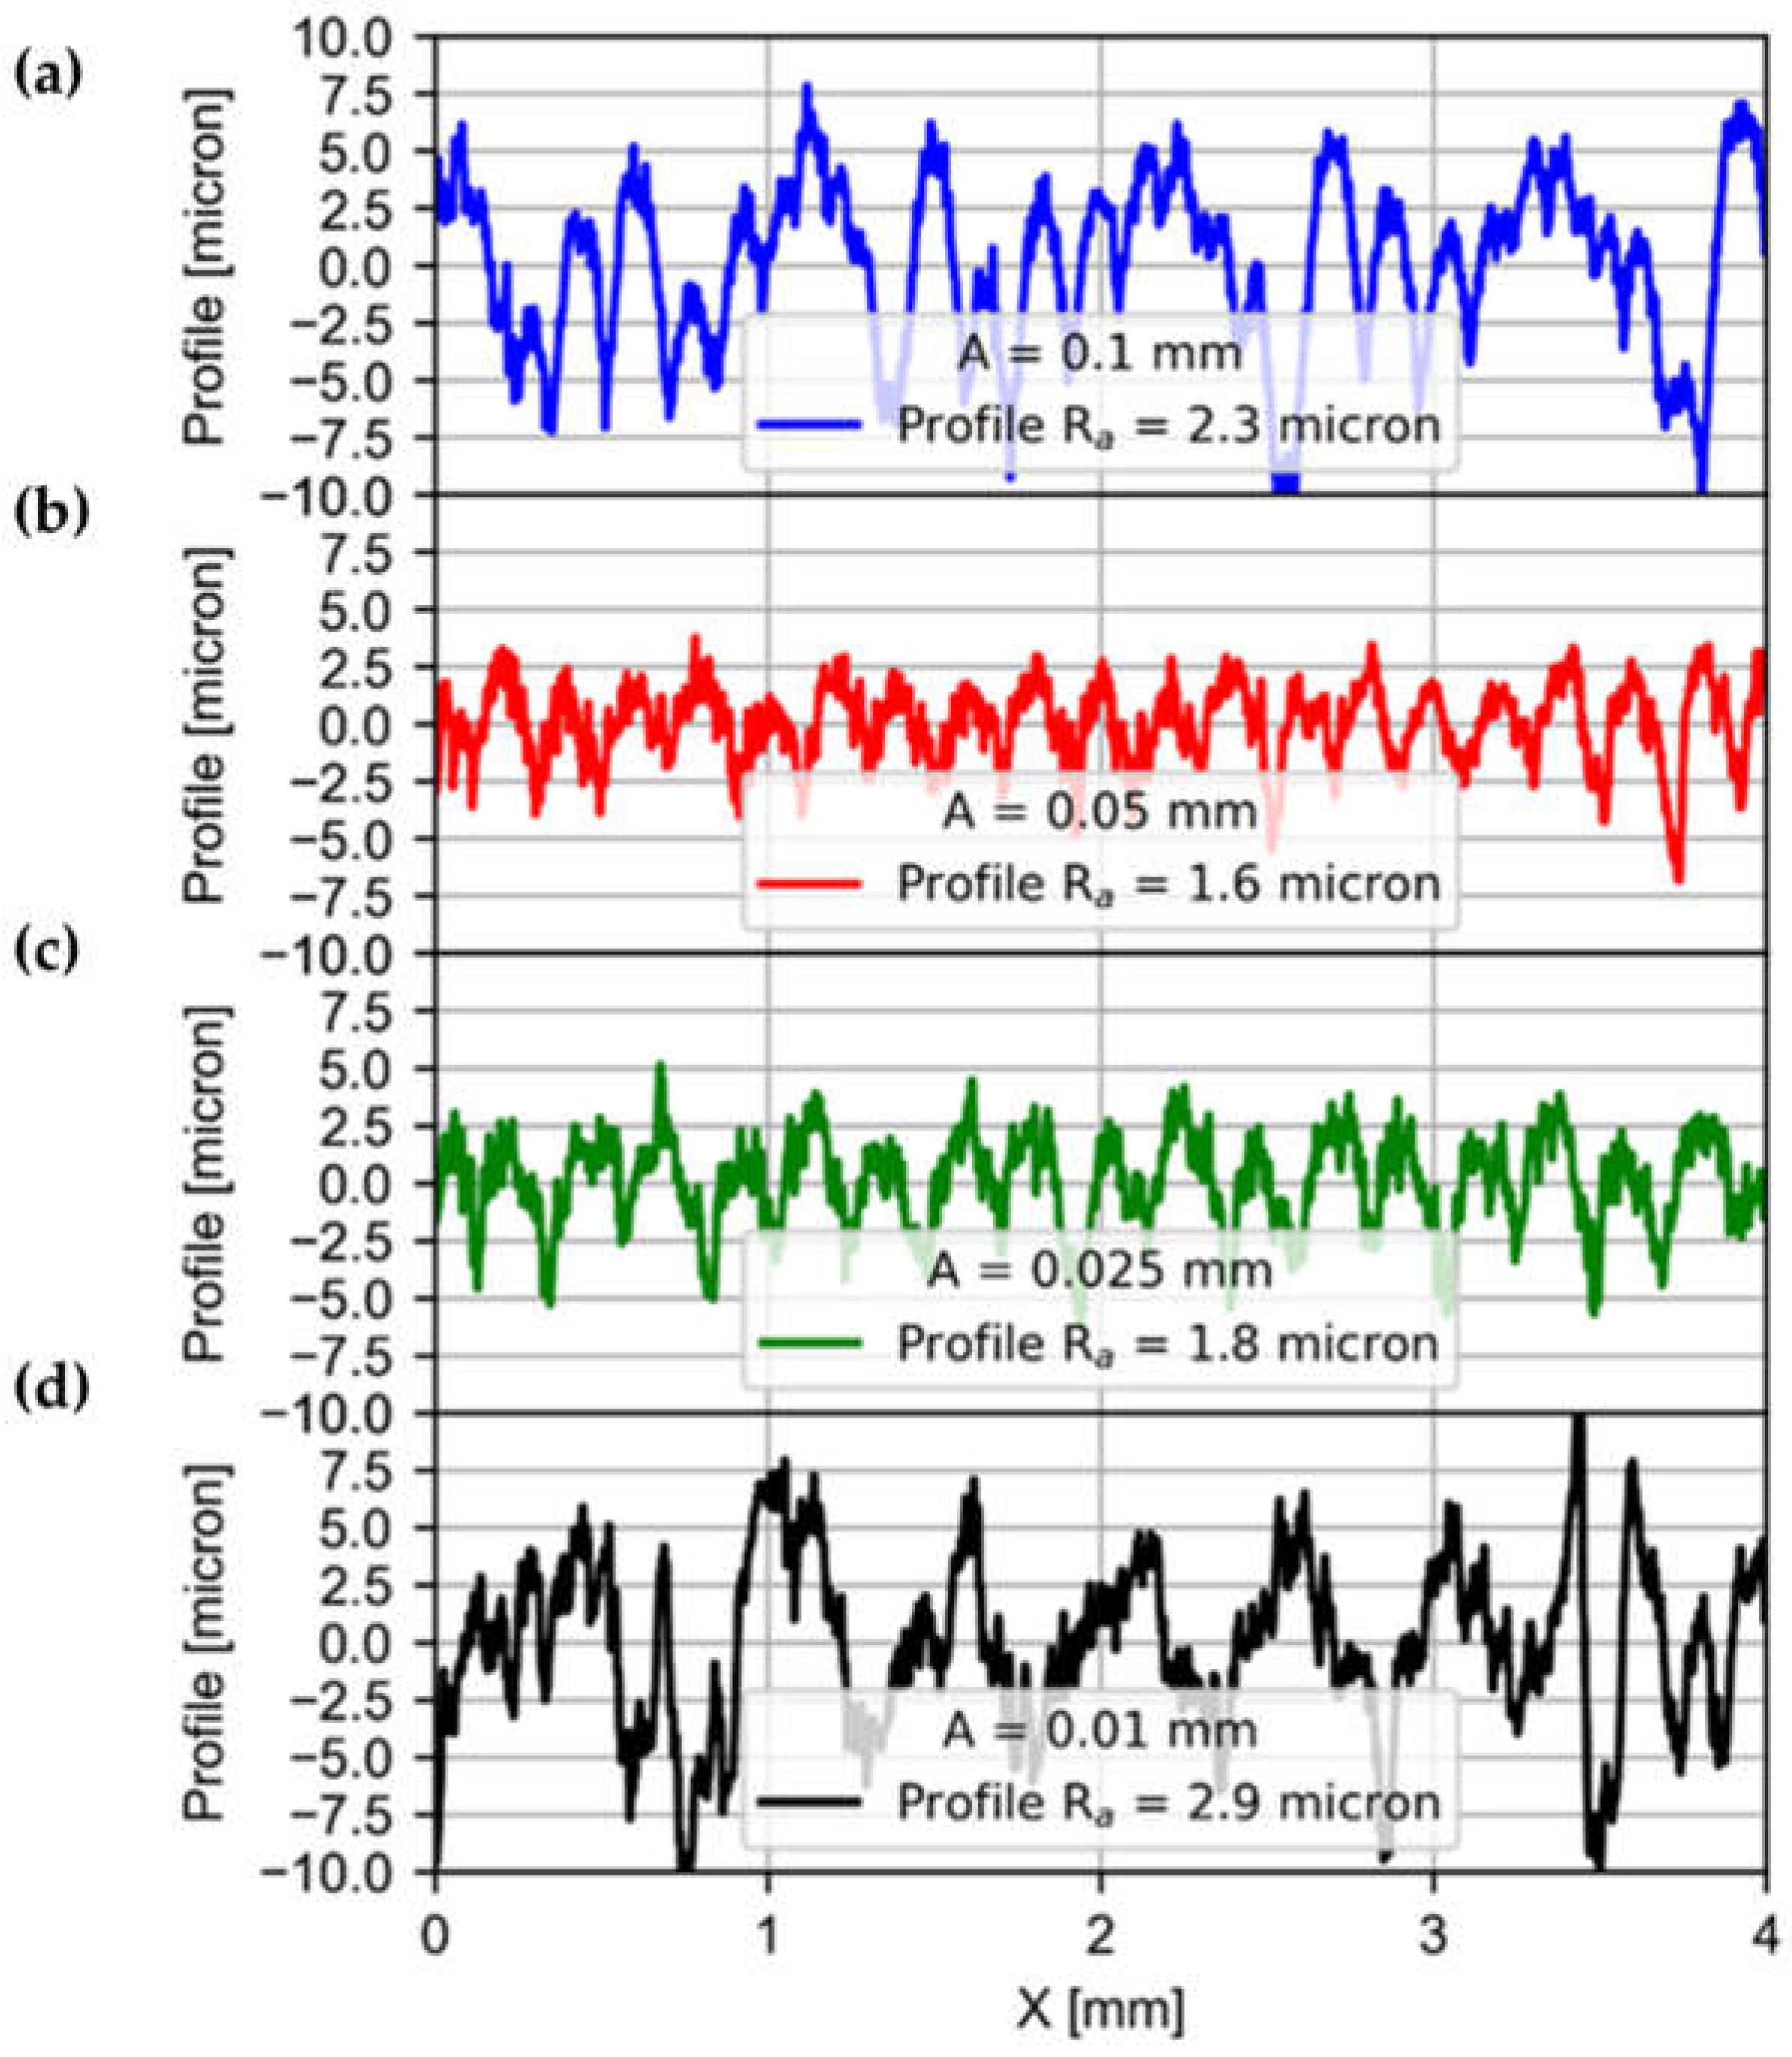
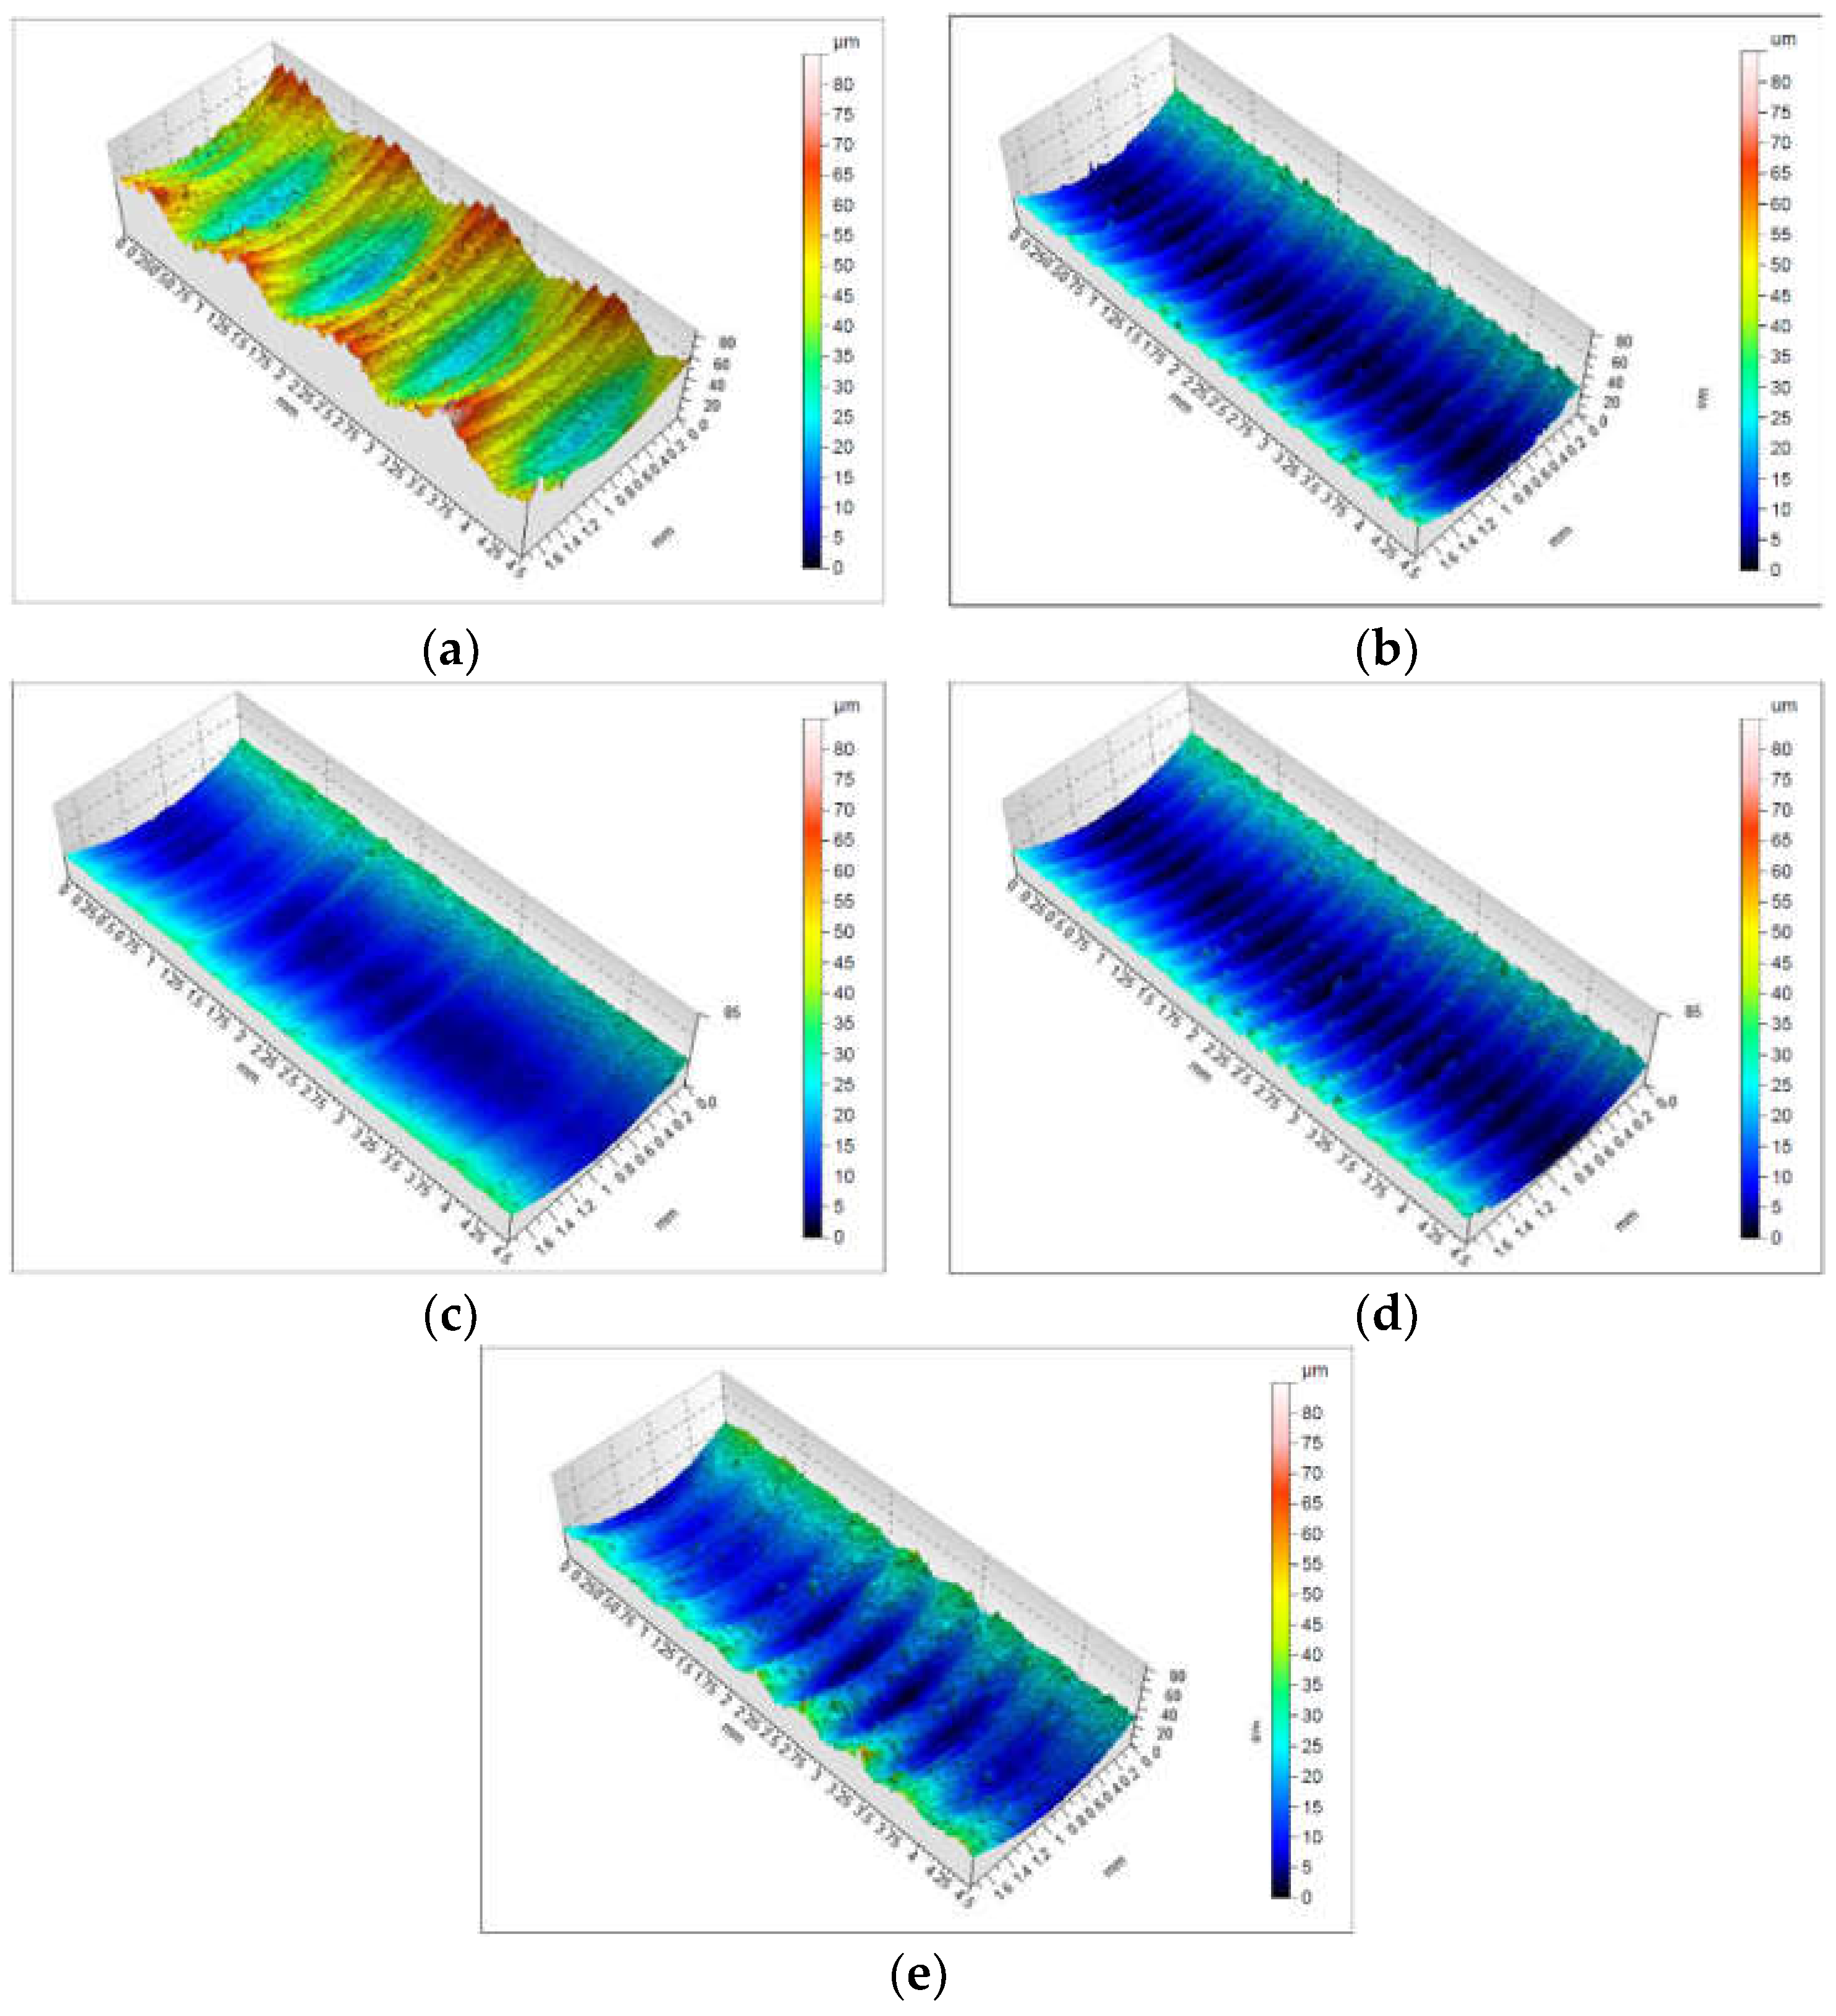
3.5. Surface Roughness

This section analyzes the effect of LFAB on the roughness of the machined hole. For this purpose, the holes made with a variable amplitude of vibration are studied. The objective is to determine the limit of amplitude necessary to promote a good final boring hole quality. Figure 14 shows the profiles measured with the roughness meter in the holes made. It is observed that an amplitude of vibration equal to 0.05 mm produces a better quality of hole; therefore, it is recommended to use an amplitude of half of the feed per tooth for boring holes of quality. The ripple frequency of the profile is maintained for the different vibration amplitudes. This indicates that the vibration amplitude does not affect the frequency at which the grooves that define the roughness of the part are produced as much as the vibration frequency does.
A vertical scanning interferometry, Sensofar S-neox (Terrassa, Spain), is used to measure the hole roughness profile. The window size of the spatial median is set as 5 × 5 points in order to reduce short wavelength noise. To reduce the effect of longer wavelengths, a Gaussian robust filter is used with a nesting index equal to 250 μm. Figure 15 shows the results of the roughness profile in the tests at different vibration amplitudes. The existence of a pattern derived from vibration can be seen more clearly. The tool in its axial movement breaks the ridges of the profile, improving the quality of the surface. Table 5 summarizes the roughness results with Ra as the mean roughness, Rz the maximum value of peak to valley and Sa and Sz the extension to the surface, with the different vibration amplitudes. It is confirmed that the best vibration amplitude strategy seems to be located around 0.05 mm, a value close to half the feed per tooth. This improvement when LFAB conditions are optimal can be attributed to the improved chip breaking seen in the previous section and Figure 13, which effectively avoids chip scraping on the bore surface. Remember that in the cutting conditions (amplitude 0.05 mm and frequency 4 Hz) with better roughness, a shorter chip length is shown. The effect of the vibration application is observed when comparing the conventional case (a) A = 0 and the others where LFAB (b–e) A = 0 with the same conditions: cutting speed, fz and depth of cut whose values are 250 m/min, 0.05 mm/tooth and 0.5 mm, respectively. The machined surfaces of the LFAB and the conventional one, see Figure 15, clearly indicate that the machined surface is more severely scratched by the chips in the conventional case.

4. Conclusions

A predicted torque model in LFAB operations based on the control-supported chip breaking function on ST52 cast steel cylinders is presented. The specific conclusions are the following:
  • The CNC function is more attractive for the industry because there is no need for intrusive vibration sensors.
  • The LFAB operations permit chip breakage and easy removal from bored holes.
  • The LFAB model is validated for different low frequencies and high amplitudes. The model estimates the cutting torques with a predicted error of 9% in the case of amplitude variable testing and 13 in the frequency evaluation testing.
  • The model is for general purposes and could be applied to different cutting materials and conditions.
A correct selection of vibration parameters favors the generation of correct chips and improves the surface generated in terms of its roughness. The minimum admissible vibration frequency is 4 Hz with a vibration amplitude equal to half the feed per tooth.
This work presents, as a novelty, the analysis of low-frequency vibration parameters in boring processes to favor chip segmentation and roughness improvement. This would be practically useful for materials where the heat is concentrated at the tool tip. Future lines would consist of offering a methodology capable of being extended to other material–tool assemblies and cutting conditions. It could also be applied to other continuous cutting processes, such as turning, drilling and reaming.

Author Contributions

F.V.: conceptualization, methodology, data curation, writing—original draft preparation. A.G.D.V.: data curation, formal analysis and writing—original draft preparation. M.L.P.: supervision, investigation and project administration. O.P.: investigation. A.S.: resources, validation. L.N.L.d.L.M.: resources and writing—reviewing and editing. All authors have read and agreed to the published version of the manuscript.

Funding

This research was funded by the European Union’s Horizon 2020 research and innovation program under grant agreement no. 723698 (ForZDM).

Institutional Review Board Statement

Not applicable.

Informed Consent Statement

Not applicable.

Data Availability Statement

Not applicable.

Conflicts of Interest

The authors declare no conflict of interest.

Nomenclature

VcCutting velocity (m/min)
NRotatory velocity (rpm)
FFeed rate (mm/min)
fzFeed per tooth (mm/tooth)
DOCDepth of cut (mm)
DBoring tool diameter (m)
krMain edge angle (°)
krSecond edge angle (°)
AAmplitude of LFAB process (mm)
FFrequency of predicted model (Hz)
FreqFrequency of LFAB process (Hz)
ZL,predVertical position of boring tool (mm)
Zv,predVibration vertical position of boring tool (mm)
Zv,measVibration vertical position of commercial function (mm)
ΘMatrix of the angular position of tool when developing a cylinder (°)
ZLFAB, predVertical position of LFAB process (mm)
tch, predUncut thickness of LFAB process (mm)
tTime (s)
kc1Specific cutting force (N/mm2) in the main edge
kc2Specific cutting force (N/mm2) in the second edge
A1,predCutting area in the main edge (mm2)
A2,predCutting area in the second edge (mm2)
b1Width of cut in the main edge (mm)
b2Width of cut in the second edge (mm)
kc1,1Predicted value of specific force (N/mm2)
mMaterial constant (-)
Fc,predPredicted cutting force of LFAB process (N)
Tc,predPredicted cutting torque of LFAB process (N·m)

References

  1. Yang, S.; Tong, X.; Ma, X.; Ji, W.; Liu, X.; Zhang, Y. The guide block structure design of boring and trepanning association (BTA) deep hole drilling. Int. J. Adv. Manuf. Technol. 2018, 99, 911–918. [Google Scholar] [CrossRef]
  2. Biermann, D.; Bleicher, F.; Heisel, U.; Klocke, F.; Möhring, H.-C.; Shih, A. Deep hole drilling. CIRP Ann. 2018, 67, 673–694. [Google Scholar] [CrossRef]
  3. Li, X.; Zheng, J.; Li, Y.; Xiao, J.; Guo, B.; Liu, C. Modeling and experimental investigation of drilling force for low-frequency axial vibration-assisted BTA deep hole drilling. Int. J. Adv. Manuf. Technol. 2020, 111, 1721–1733. [Google Scholar] [CrossRef]
  4. Zheng, L.; Chen, W.; Huo, D. Review of vibration devices for vibration-assisted machining. Int. J. Adv. Manuf. Technol. 2020, 108, 1631–1651. [Google Scholar] [CrossRef]
  5. Paulsen, T.; Guba, N.; Sölter, J.; Karpuschewski, B. Influence of the workpiece material on the cutting performance in low frequency vibration assisted drilling. CIRP J. Manuf. Sci. Technol. 2020, 31, 140–152. [Google Scholar] [CrossRef]
  6. Yang, H.; Ding, W.; Chen, Y.; Laporte, S.; Xu, J.; Fu, Y. Drilling force model for forced low frequency vibration assisted drilling of Ti-6Al-4V titanium alloy. Int. J. Mach. Tools Manuf. 2019, 146, 103438. [Google Scholar] [CrossRef]
  7. Gorostidi, J.M.; Beudaert, X.; Astarloa, A.; Ealo, J.A.; Soraluce, J.A.; Fernandes, M.H. Chip breaking system for turning applications using machine drive oscillations. DYNA Ing. E Ind. 2020, 95, 100–106. [Google Scholar] [CrossRef]
  8. Chen, W.; Huo, D.; Shi, Y.; Hale, J.M. State-of-the-art review on vibration-assisted milling: Principle, system design, and application. Int. J. Adv. Manuf. Technol. 2018, 97, 2033–2049. [Google Scholar] [CrossRef] [Green Version]
  9. Suárez, A.; Veiga, F.; Polvorosa, R.; Artaza, T.; Holmberg, J.; de Lacalle, L.L.; Wretland, A. Surface integrity and fatigue of non-conventional machined Alloy 718. J. Manuf. Process. 2019, 48, 44–50. [Google Scholar] [CrossRef]
  10. Yarar, E.; Karabay, S. Investigation of the effects of ultrasonic assisted drilling on tool wear and optimization of drilling parameters. CIRP J. Manuf. Sci. Technol. 2020, 31, 265–280. [Google Scholar] [CrossRef]
  11. Dong, G.; Wang, L.; Li, C.; Yu, Y. Investigation on ultrasonic elliptical vibration boring of deep holes with large depth–diameter ratio for high-strength steel 18Cr2Ni4WA. Int. J. Adv. Manuf. Technol. 2020, 108, 1527–1539. [Google Scholar] [CrossRef]
  12. Ngo, Q.H.; Chu, N.H.; Nguyen, V.D. A Study on Design of Vibratory Apparatus and Experimental Validation on Hard Boring with Ultrasonic-Assisted Cutting. Int. J. Adv. Eng. Res. Appl. 2018, 3, 383–396. [Google Scholar]
  13. Moraru, G.F. Nonlinear Dynamics in Drilling and Boring Operations Assisted by Low Frequency Vibration. In ASME 2007 International Design Engineering Technical Conferences and Computers and Information in Engineering Conference, Proceedings of the 6th International Conference on Multibody Systems, Nonlinear Dynamics, and Control, Parts A, B, and C, Las Vegas, NV, USA, 4–7 September 2007; The American Society of Mechanical Engineers: New York, NY, USA, 2007; Volume 5, pp. 951–960. [Google Scholar]
  14. Mikołajczyk, T.; Latos, H.; Pimenov, D.Y.; Paczkowski, T.; Gupta, M.K.; Krolczyk, G. Influence of the main cutting edge angle value on minimum uncut chip thickness during turning of C45 steel. J. Manuf. Process. 2020, 57, 354–362. [Google Scholar] [CrossRef]
  15. Zou, F.; Dang, J.; An, Q.; Chen, M. Mechanism and feasibility study of low frequency vibration assisted drilling of a newly developed CFRP/Al co-cured material. J. Manuf. Process. 2021, 68, 115–127. [Google Scholar] [CrossRef]
  16. Li, C.; Xu, J.; Chen, M.; An, Q.; El Mansori, M.; Ren, F. Tool wear processes in low frequency vibration assisted drilling of CFRP/Ti6Al4V stacks with forced air-cooling. Wear 2019, 426-427, 1616–1623. [Google Scholar] [CrossRef]
  17. Veiga, F.; Suárez, A.; Val, A.G.D.; Penalva, M.; Lacalle, L.N.L.D. Evaluation on advantages of low frequency assisted drilling (LFAD) aluminium alloy Al7075. Int. J. Mechatron. Manuf. Syst. 2020, 13, 230–246. [Google Scholar]
  18. Jallageas, J.; K’Nevez, J.-Y.; Chérif, M.; Cahuc, O. Modeling and optimization of vibration-assisted drilling on positive feed drilling unit. Int. J. Adv. Manuf. Technol. 2013, 67, 1205–1216. [Google Scholar] [CrossRef]
  19. Bleicher, F.; Reiter, M.; Brier, J. Increase of chip removal rate in single-lip deep hole drilling at small diameters by low-frequency vibration support. CIRP Ann. 2019, 68, 93–96. [Google Scholar] [CrossRef]
  20. Kuntoğlu, M.; Aslan, A.; Pimenov, D.Y.; Giasin, K.; Mikolajczyk, T.; Sharma, S. Modeling of Cutting Parameters and Tool Geometry for Multi-Criteria Optimization of Surface Roughness and Vibration via Response Surface Methodology in Turning of AISI 5140 Steel. Materials 2020, 13, 4242. [Google Scholar] [CrossRef]
  21. Kuntoğlu, M.; Aslan, A.; Sağlam, H.; Pimenov, D.Y.; Giasin, K.; Mikolajczyk, T. Optimization and Analysis of Surface Roughness, Flank Wear and 5 Different Sensorial Data via Tool Condition Monitoring System in Turning of AISI 5140. Sensors 2020, 20, 4377. [Google Scholar] [CrossRef]
  22. Steel, R.G.D.; Torrie, J.H. Principles and Procedures of Statistics: With Special Reference to the Biological Sciences, Volume 1; McGraw Hill: New York, NY, USA, 1960; pp. 187–287. [Google Scholar]
  23. Coromant, S. Training Handbook; Sandvik Coromant: Sandviken, Sweden, 2020; pp. 1–391. [Google Scholar]
  24. Ivester, R.W.; Kennedy, M.; Davies, M.; Stevenson, R.; Thiele, J.; Furness, R.; Athavale, S. Assessment of machining models: Progress report. Mach. Sci. Technol. 2000, 4, 511–538. [Google Scholar] [CrossRef]
  25. International Organization for Standardization (ISO). ISO 3685. Tool-Life Testing with Single-Point Turning Tools; ISO: Geneva, Switzerland, 1993. [Google Scholar]
Figure 1. Sketch of LFAB according to commercial function.
Metals 11 01009 g001
Figure 2. Flow chart of LFAB modeling.
Metals 11 01009 g002
Figure 3. Geometrical tool parameters.
Metals 11 01009 g003
Figure 4. Trajectories (ZLFAB,pred), chip breakage and edge inactive period of LFAB modeling.
Metals 11 01009 g004
Figure 5. Setup of LFAB operation.
Metals 11 01009 g005
Figure 6. Superposed vibration motions of modeling and measurements: (a) A = 0.1 mm and freq = 4 Hz and (b) A = 0.05 mm and f = 2 Hz.
Metals 11 01009 g006
Figure 7. Predicted uncut thicknesses when boring at different vibration conditions (red line A = 0.1 mm and f = 4 Hz and blue line A = 0 corresponding to conventional cutting).
Metals 11 01009 g007
Figure 8. Design of experiments for a boring conventional measurement corresponding to Table 2 Group a of tool material characterization tests.
Metals 11 01009 g008
Figure 9. Measured and fitting torque data according to DoE conventional experiments. Measurement number and cutting conditions defined by Table 2.
Metals 11 01009 g009
Figure 10. Measured (dot point cloud) and predicted torques (dashed line) of LFAB process with vibrational conditions (A = 0.01 mm and f = 4 Hz; test number 19 in Table 2).
Metals 11 01009 g010
Figure 11. Measured and predicted torques of LFAB processes with vibrational conditions: (a) A = 0.1 mm, (b) A = 0.05 mm, (c) A = 0.025 mm and (d) A = 0.01 mm with constant Vc = 250 m/min, fz = 0.05 mm/tooth, DOC = 0.5 mm and f = 4 Hz; tests 19–22 in Table 2.
Metals 11 01009 g011
Figure 12. Measured and predicted torques of LFAB processes with vibrational conditions. A = 0.1 mm and different frequencies (a) f = 0 Hz, (b) f = 1 Hz, (c) f = 2 Hz and (d) f = 4 Hz; tests 23–26 in Table 2.
Metals 11 01009 g012
Figure 13. Observation of the generated chip on LFAB processes with vibrational conditions A = 0.1 mm and frequency (a) f = 0, (b) f = 1, (c) f = 2 and (d) f = 4 Hz, tests 23–26 of Table 2, and with constant f = 4 Hz and different amplitudes (e) A = 0.1, (f) A = 0.05, (g) A = 0.025 and (h) A = 0.01 mm; tests 19–22 of Table 2.
Metals 11 01009 g013
Figure 14. Roughness profiles for tests with variable vibration amplitudes: (a) A = 0.1 mm, (b) A = 0.05 mm, (c) A = 0.025 mm and (d) A = 0.01 mm, all with f = 4 Hz (see Table 2 tests 19, 20, 21 and 22).
Metals 11 01009 g014
Figure 15. Topography profiles with different vibration amplitudes: (a) A = 0 mm, (b) A = 0.1 mm, (c) A = 0.05 mm, (d) A = 0.025 mm and (e) A = 0.01 mm with the same frequency f = 4 Hz (see Table 2 tests 23, 19, 20, 21 and 22, respectively).
Metals 11 01009 g015
Table 1. Nominal composition of the material.
Material AlloyChemical Composition (wt %)
CSiMnPS
Steel ST 520.200.551.600.0400.040
Table 2. Conventional cutting conditions. LFAB cutting conditions.
GroupTest #Vc (m/min)fz (mm/tooth)N (rpm)F (mm/min)DOC (mm)Amplitude (mm)f = 2freq (Hz)Coolant
a012500.0252487620.10--DRY
022500.0252487620.25--DRY
032500.0252487620.50--DRY
042500.05024871240.10--DRY
052500.05024871240.25--DRY
062500.05024871240.50--DRY
073500.0253482870.10--DRY
083500.0253482870.25--DRY
093500.0253482870.50--DRY
103500.05034821740.10--DRY
113500.05034821740.25--DRY
123500.05033821740.50--DRY
134500.02544761120.10--DRY
144500.02544761120.25--DRY
154500.02544761120.50--DRY
164500.05044762240.10--DRY
174500.05044762240.25--DRY
184500.05044762240.50--DRY
b192500.05024871240.50.1004DRY
202500.05024871240.50.0504DRY
212500.05024871240.50.0254DRY
222500.05024871240.50.0104DRY
232500.05024871240.500DRY
242500.05024871240.50.1001DRY
252500.05024871240.50.1002DRY
262500.05024871240.50.1004DRY
Table 3. LFAB boring specifications for different vibration conditions.
Vc (m/min)fz (mm/tooth)N (rpm)F (mm/min)DOC (mm)Amplitude (mm)f = 2freq (Hz)Coolant
2500.05024871240.50.1004DRY
2500.05024871240.50.0502DRY
Table 4. LFAB and conventional boring conditions.
Vc (m/min)fz (mm/tooth)N (rpm)F (mm/min)DOC (mm)Amplitude (mm)f (Hz)Coolant
2500.05024871240.50.1004DRY
2500.05024871240.50.0000DRY
Table 5. Summary of roughness results at different vibration amplitudes with f = 4 Hz.
AmplitudeRa (µm)Rz (µm)Sa (µm)Sz (µm)
A = 0 mm2.9513.933.1157.00
A = 0.1 mm2.1610.802.3132.80
A = 0.05 mm1.427.561.5016.10
A = 0.025 mm1.539.921.4119.40
A = 0 01 mm1.857.171.9218.90
Publisher’s Note: MDPI stays neutral with regard to jurisdictional claims in published maps and institutional affiliations.

