
Modification of Precipitate Coarsening Kinetics by Intragranular Nanoparticles—A Phase Field Study


1
Guangdong Technion-Israel Institute of Technology, #241 Daxue Rd, Shantou 515063, China
2
Technion-Israel Institute of Technology, Technion City, Haifa 32000, Israel
3
Guangdong Provincial Key Laboratory of Materials and Technologies for Energy Conversion, Guangdong Technion-Israel Institute of Technology, Shantou 515063, China
*
Author to whom correspondence should be addressed.
Metals 2022, 12(6), 892; https://0-doi-org.brum.beds.ac.uk/10.3390/met12060892
Submission received: 12 April 2022
/
Revised: 8 May 2022
/
Accepted: 12 May 2022
/
Published: 24 May 2022
(This article belongs to the Topic Numerical Modeling on Metallic Materials)
Abstract
:Precipitate coarsening is a major mechanism responsible for the degradation in mechanical properties of many precipitation-hardened alloys at high temperatures. With recent developments in processing of nanocomposite materials, a substantial volume fraction of inert second phase ceramic nanoparticles can be introduced into the grain interiors of polycrystalline materials. These intragranular nanoparticles can have synergistic effects of impeding dislocation motion and interacting with coarsening precipitates to modify the coarsening rate. In this work, the precipitate coarsening behavior of an alloy in the presence of intragranular inert nanoparticles was studied using the phase field method. Two key measurements of coarsening kinetics, precipitate size distribution and coarsening rate, were found to be affected by the volume fraction and the size of nanoparticles. Two novel mechanisms related to geometric constraints imposed by inter-nanoparticle distance and the blockage of solute diffusion path by nanoparticle–matrix interfaces were proposed to explain the observed changes in precipitate coarsening kinetics. The simulation results in general suggest that the use of small nanoparticles with large number density is effective in slowing down the coarsening kinetics.
1. Introduction
High performance alloys, including Al, Ni, and Co–based superalloys are strengthened by the heat treatment process to produce nano-sized, hard, and coherent precipitates through hindering of both dislocation movement and grain growth. However, at elevated temperatures, rapid increase in diffusion rate accelerates precipitate coarsening rate and results in the loss of mechanical strength. Precipitate coarsening refers to growth of larger particles at the expense of smaller shrinking particles in the matrix. Coarsening occurs when finely dispersed nanoprecipitates change their sizes, shapes, and distribution due to microstructural evolution driven by reduction in interfacial energy [1]. The kinetics of precipitate coarsening influence the strength of alloys such that this area continues to attract the interests of many researchers. Techniques like solute segregation at precipitate interfaces in Al alloys [2,3,4,5,6], formation of stacking fault ribbons in Ni alloys [7,8,9], introduction of slow diffusing elements in superalloys [10,11,12,13,14], and application of external compressive stresses [15,16] were proposed as measures to retard the precipitate coarsening process. The mechanisms responsible for precipitate coarsening resistance are thermodynamic and kinetic in nature and involve interfacial energy reduction, solute drag against precipitate growth, development of strain fields around growing precipitates, slowing down of solute diffusion [17], etc. Through proper incorporation of these effects during processing, the precipitate coarsening behavior can be forced to deviate significantly from the normal coarsening, described by the classical Lifshitz–Slyozov–Wagner (LSW) theory [18].
The practice of dispersing fine ceramic nanoparticles like titanium carbon nitride (TiCN), alumina (Al2O3), zirconia (ZrO2), and yttria (Y2O3) for the synergistic purposes of retarding solidification coarsening [19,20,21] and pinning grain growth [22,23,24,25,26,27] at elevated service temperatures is now established. During solidification, the introduced mobile second–phase particles migrate and form assemblies around the established nuclei and retard dendritic growth through combined pushing and drag effects. Retarded grain growth causes many nuclei to form in the melt, thereby refining the microstructure. Due to slow solidification velocities found in conventional casting processes, the majority of the nanoparticles are incorporated along grain boundaries (due to particle pushing) and become intergranular particles in the final microstructure, and only a few are engulfed by the moving solidification front to become intragranular in the final microstructure. However, with small sized nanoparticles and high cooling rates such as those encountered in laser additive manufacturing, it is possible for a large volume fraction of nanoparticles to be engulfed into the grains owing to fast moving solidification fronts which are larger than the critical velocity required for engulfment [28]. This technique was recently applied to produce an aluminum metal containing a high content of uniformly dispersed TiCN nanoparticles of a volume fraction of 35% using selective laser melting method [28]. Ceramic nanoparticles can also be introduced in grain interiors during grain growth and recrystallization [29], and the presence of second–phase inert particles in grain interiors during recrystallization was also predicted using 3D simulations [27]. Several studies have suggested that the engulfed nanoparticles inside the grains are more effective in strengthening the alloy through interaction with dislocations [19,20] when compared with those segregated on the grain boundaries. It should be noted that in the presence of nano-ceramic particles of lower thermal conductivity like Al2O3, SiO2, SiC, and ZrO2, it was observed [19,20] that during solidification cooling process the temperature of the particles is higher than that of the melt, and nucleation does not occur on the particles surface.
Many researchers to date have focused on the influence of nanoparticles on grain growth control, however at high temperatures, both grain growth and precipitate coarsening control are of considerable importance. The strengthening mechanism in conventionally solidified aluminum alloy containing 0.2–0.3 vol% of small sized coherent Al3Sc precipitates and 30 vol% incoherent grain boundary Al2O3 ceramic particles (300 nm) was comprehensively studied by Karnesky et al. [26]. The results demonstrated synergistic strengthening due to dislocation pinning at the departure side of Al2O3 particles and back strain effects imposed on dislocations by the Al3Sc precipitates due to lattice mismatch, but the coarsening kinetics of precipitates was not affected by the presence of intergranular ceramic particles. Although the presence of nanoparticles in grain interiors has been experimentally confirmed, according to our knowledge, their influence on precipitate coarsening kinetics has not yet been comprehensively studied. Since detailed experimental study of the influence of grain interior nanoparticles is not available, our present work begins by attempting to provide some insights, and this will guide future work.
The phase field method is a powerful continuum modelling method now extensively employed to simulate microstructural evolutions through characterizing phases using a set of conserved and non-conserved order parameters [30]. It has been used to model complex interface evolutions in a wide variety of materials by describing interfaces using smooth order parameters [30,31,32,33]. The coarsening kinetics of precipitates has been studied using the phase field method in many previous works [17,34,35,36], and the validity of the method has been established through experimental comparisons [17,37]. In this work, the effect of inert nanoparticles on precipitate coarsening kinetics is studied by extending the coarsening model [34] to include inert second–phase particles.
The article is arranged as follows: after the introduction section, the phase field model used in our simulations is formulated in the next section, then simulation results for the influence of various nanoparticle volume fractions and sizes on the coarsening kinetics are presented, together with discussions on potential mechanisms related to these results. This is then followed by conclusions.
2. Phase Field Model
In comparison with macroscopic models relying on thermodynamic equilibrium calculations, the phase field model consists of kinetic equations capable of predicting realistic mesoscale morphological and microstructural evolution rather than merely relying on final states, which is the case in macroscopic models. The phase field method was initially developed for simulating solidification microstructures [33] and solid-state phase transformation processes [30,31].
Coarsening of precipitates is satisfactorily explained by the Lifshitz–Slyozov–Wagner (LSW) theory in which large particles grow at the expense of small particles driven by interfacial energy reduction. In the classic LSW theory, the precipitate coarsening process occurs as the result of solute diffusion and the Gibbs–Thomson effect. The phase field method captures these two fundamental mechanisms by incorporating solute diffusions using the Cahn–Hilliard type generalized diffusion equation and the Gibbs–Thomson effect using an order parameter equation for precipitate–matrix interface evolution. Validity of the original phase field model from which the current work was developed has been previously verified by comparing experimental results with simulation results [35,38].
The phase field model used in this work is an extension of the previous coarsening model for binary alloys [34]. The free energy functional of the system is expressed using the following volume integral:
where is the concentration field which is equal to the equilibrium concentration , in the host matrix, and, in the precipitate phase, it is set to the equilibrium concentration of the precipitate phase , is the system volume, is the phase field parameter for tracking precipitate surface evolution of the grain with ith lattice orientation, and and are constant coefficients. The local term is
where,
The terms , A, B, , describe the concentration dependence of the thermodynamic free energy, and are used to describe the interfacial energy of precipitate matrix interfaces, is the nanoparticle phase field parameter, is the phase field parameter for tracking precipitate surface evolution of the grain with jth lattice orientation, and describes the interfacial energy between precipitates with different lattice orientations [34]. is a dimensional constant with the unit of energy per volume which was introduced to quantify the total free energy of the system. The inert nanoparticles were introduced into the model through the phase field parameter, , which is equal to 1 inside the nanoparticle and 0 outside. The interfacial energy between nanoparticles and precipitates was incorporated in the model through the term , with being the interaction parameter term. This nanoparticle–precipitate interfacial term has the same form as the precipitate interfacial term and the inert nanoparticle was treated as a non-evolving precipitate phase, as will be seen in the evolution equations below. The free energy functional above does not include the elastic energy associated with coherent interfaces and transformation induced volume change. Evolutions of the concentration and precipitate surfaces were studied using the standard variational dynamics for conserved (Equation (6)) and non-conserved (Equation (7)) fields:
where, Li and are kinetic coefficients, t is the time, and F is the free energy functional which is given in Equation (1). Since there is no solute diffusion inside inert nanoparticles, the concentration kinetic coefficient was chosen to be where , M is the solute mobility in the matrix (the solute mobility in the precipitate is assumed to be the same as in the matrix) such that the mobility vanishes inside the nanoparticle and varies smoothly between either the nanoparticle–precipitate or nanoparticle–matrix interface. For simplicity, the kinetic coefficients of all the phase field parameters were set to be the same, . One may notice that there are only four phase field parameters for precipitate surfaces appearing in the formulation. This choice is solely made for improving computational efficiency. It is acceptable when the precipitate volume fraction is low, but, at high precipitate volume fraction, unphysical precipitate coalescence may occur, since, by using only four phase field parameters, all the precipitates are assumed to have only 8 possible different lattice orientations . It was found from simulation tests that using 4 phase field parameters maintained the simulation efficiency while avoiding significant coalescence problems at the moderate precipitate volume fraction in our simulations.
Numerical implementation of the model was based on non-dimensionalized forms of Equations (8) and (9) as follows:
where, dimensionless time , particle radius , , , , and the relative kinetic coefficient . Here, is the interface width. The mobility is related to solute diffusivity D [39] and the choice of does not significantly affect the coarsening result [31].
A single grain in the illustrated microstructure in Figure 1 was set to be the study domain where the coarsening of existing precipitates occurs. Since the purpose of the current study was to explore the general precipitate coarsening behavior in the presence of inert nanoparticles, only 2-dimensional (2D) simulations were performed, but it can be easily extended to 3 dimensions (3D). The nanoparticle volume fraction in this 2D case was equivalent to the area fraction such that in this article these two terms are used interchangeably. A square simulation box with a grid size of 1000 1000 and spatial discretization of was used. The simulation time step was set to be . The following model parameters 0.05, = 0.95, , A = 2.0, B = 9.8, , , , were adapted from ref. [34]. For simplicity, the kinetic coefficient was set to have the same value equal to 1 in both the matrix and the precipitate. It has been shown that selecting within the range of 1 to 100 does not significantly affect the numerical result [39]. Initially, a large number of small nuclei with concentration of were randomly seeded into the system following an approach introduced by Simmons et al. [40]. The initial matrix concentration was set to be 0.22 which was enough for the precipitate volume fraction to reach about 20%. This precipitate volume fraction was small such that it was possible to vary the volume fraction of the inert nanoparticles within a large range. No further nucleation events were considered except those given as the initial nuclei. Equations (6) and (7) were solved numerically using center difference spatial discretization and forward Euler time integration. Periodic boundary conditions were applied to all the simulations. To properly capture the coarsening statistics, a simulation setup was repeated three times and coarsening statistics were averaged over the three simulations. For convenience, the volume fraction, equivalent average radii and particle size distributions of precipitates were post-processed from raw data with the aid of Image J software.
3. Results and Discussion
3.1. Coarsening Behavior in Absence of Nanoparticles
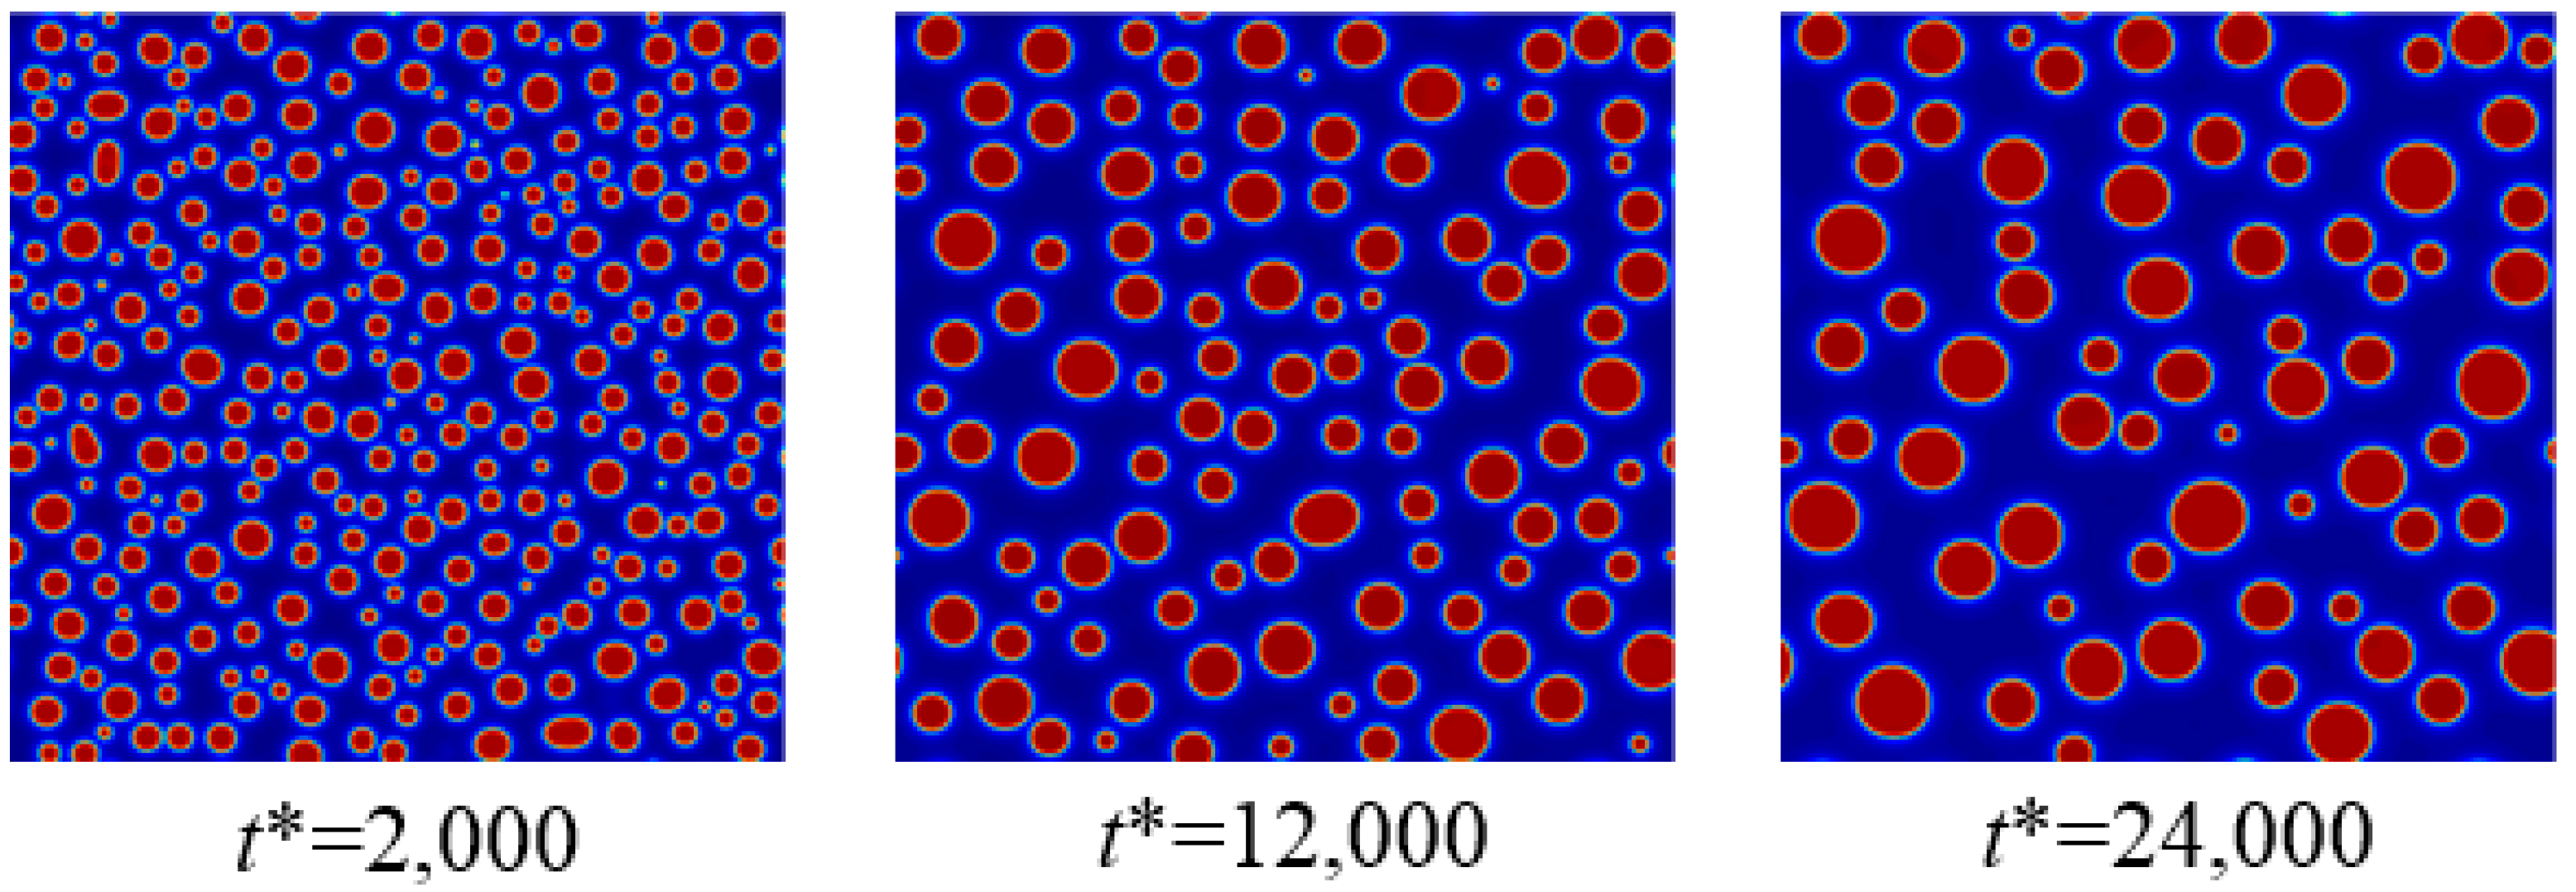
To evaluate the model, the precipitate coarsening process without inert nanoparticles was simulated first. Figure 2 shows the coarsening behavior of precipitates in the absence of nanoparticles at aging times of t* = 2000, 12,000 and 24,000. The red particles are precipitates and the blue regions are the matrix phase. The spherical precipitate shape is the result of the simplified model formulation where surface energy anisotropy and elastic energy are both ignored [34]. The precipitate number declines from more than 300 at a time step of t* = 2000 to less than 100 at a time step of t* = 24,000, whilst the average precipitate size increases. Here, coarsening is mainly controlled by inter-precipitate diffusion through the matrix phase driven by free energy differences between small and large precipitates due to the curvature effect, and this results in simultaneous shrinkage and growth of precipitates. The coarsening kinetics was studied by plotting the cube of the average precipitate radius versus aging time according to the power law (i.e., ) whilst fixing the value of the exponent n to 3. The precipitate radius is obtained from the relation where A is the precipitate area. We adopted the cubic growth law, since it is the standard exponent from the LSW theory and was reported by many researchers in literature. Such an approach makes it easy to compare our results with previous simulation and experimental results. Besides a brief introduction in Section 2, detailed background of the LSW theory can be found elsewhere [1,18,41]. The plot of the cube of average precipitate size () with coarsening time step (t) is given in Figure 3a. In the absence of nanoparticles, the cube of the particle size evolves linearly with time following the power growth law with the coarsening exponent of n = 3. The coarsening behavior satisfies the classical LSW theory [18] and this verifies that the process is controlled by bulk matrix diffusion. The variation of the precipitate area fraction with aging time step in absence of nanoparticles is shown in Figure 3b; it is evident that with time step, the area fraction rapidly decreases before reaching a steady state. The sluggish behavior observed in the transient stage before the steady state condition is due to the seeding method used to introduce precipitates in the system. Figure 3c show the changes in a number of precipitates during coarsening and reflects that the numbers are continuously decreasing due to simultaneous growth and shrinkage of precipitates.
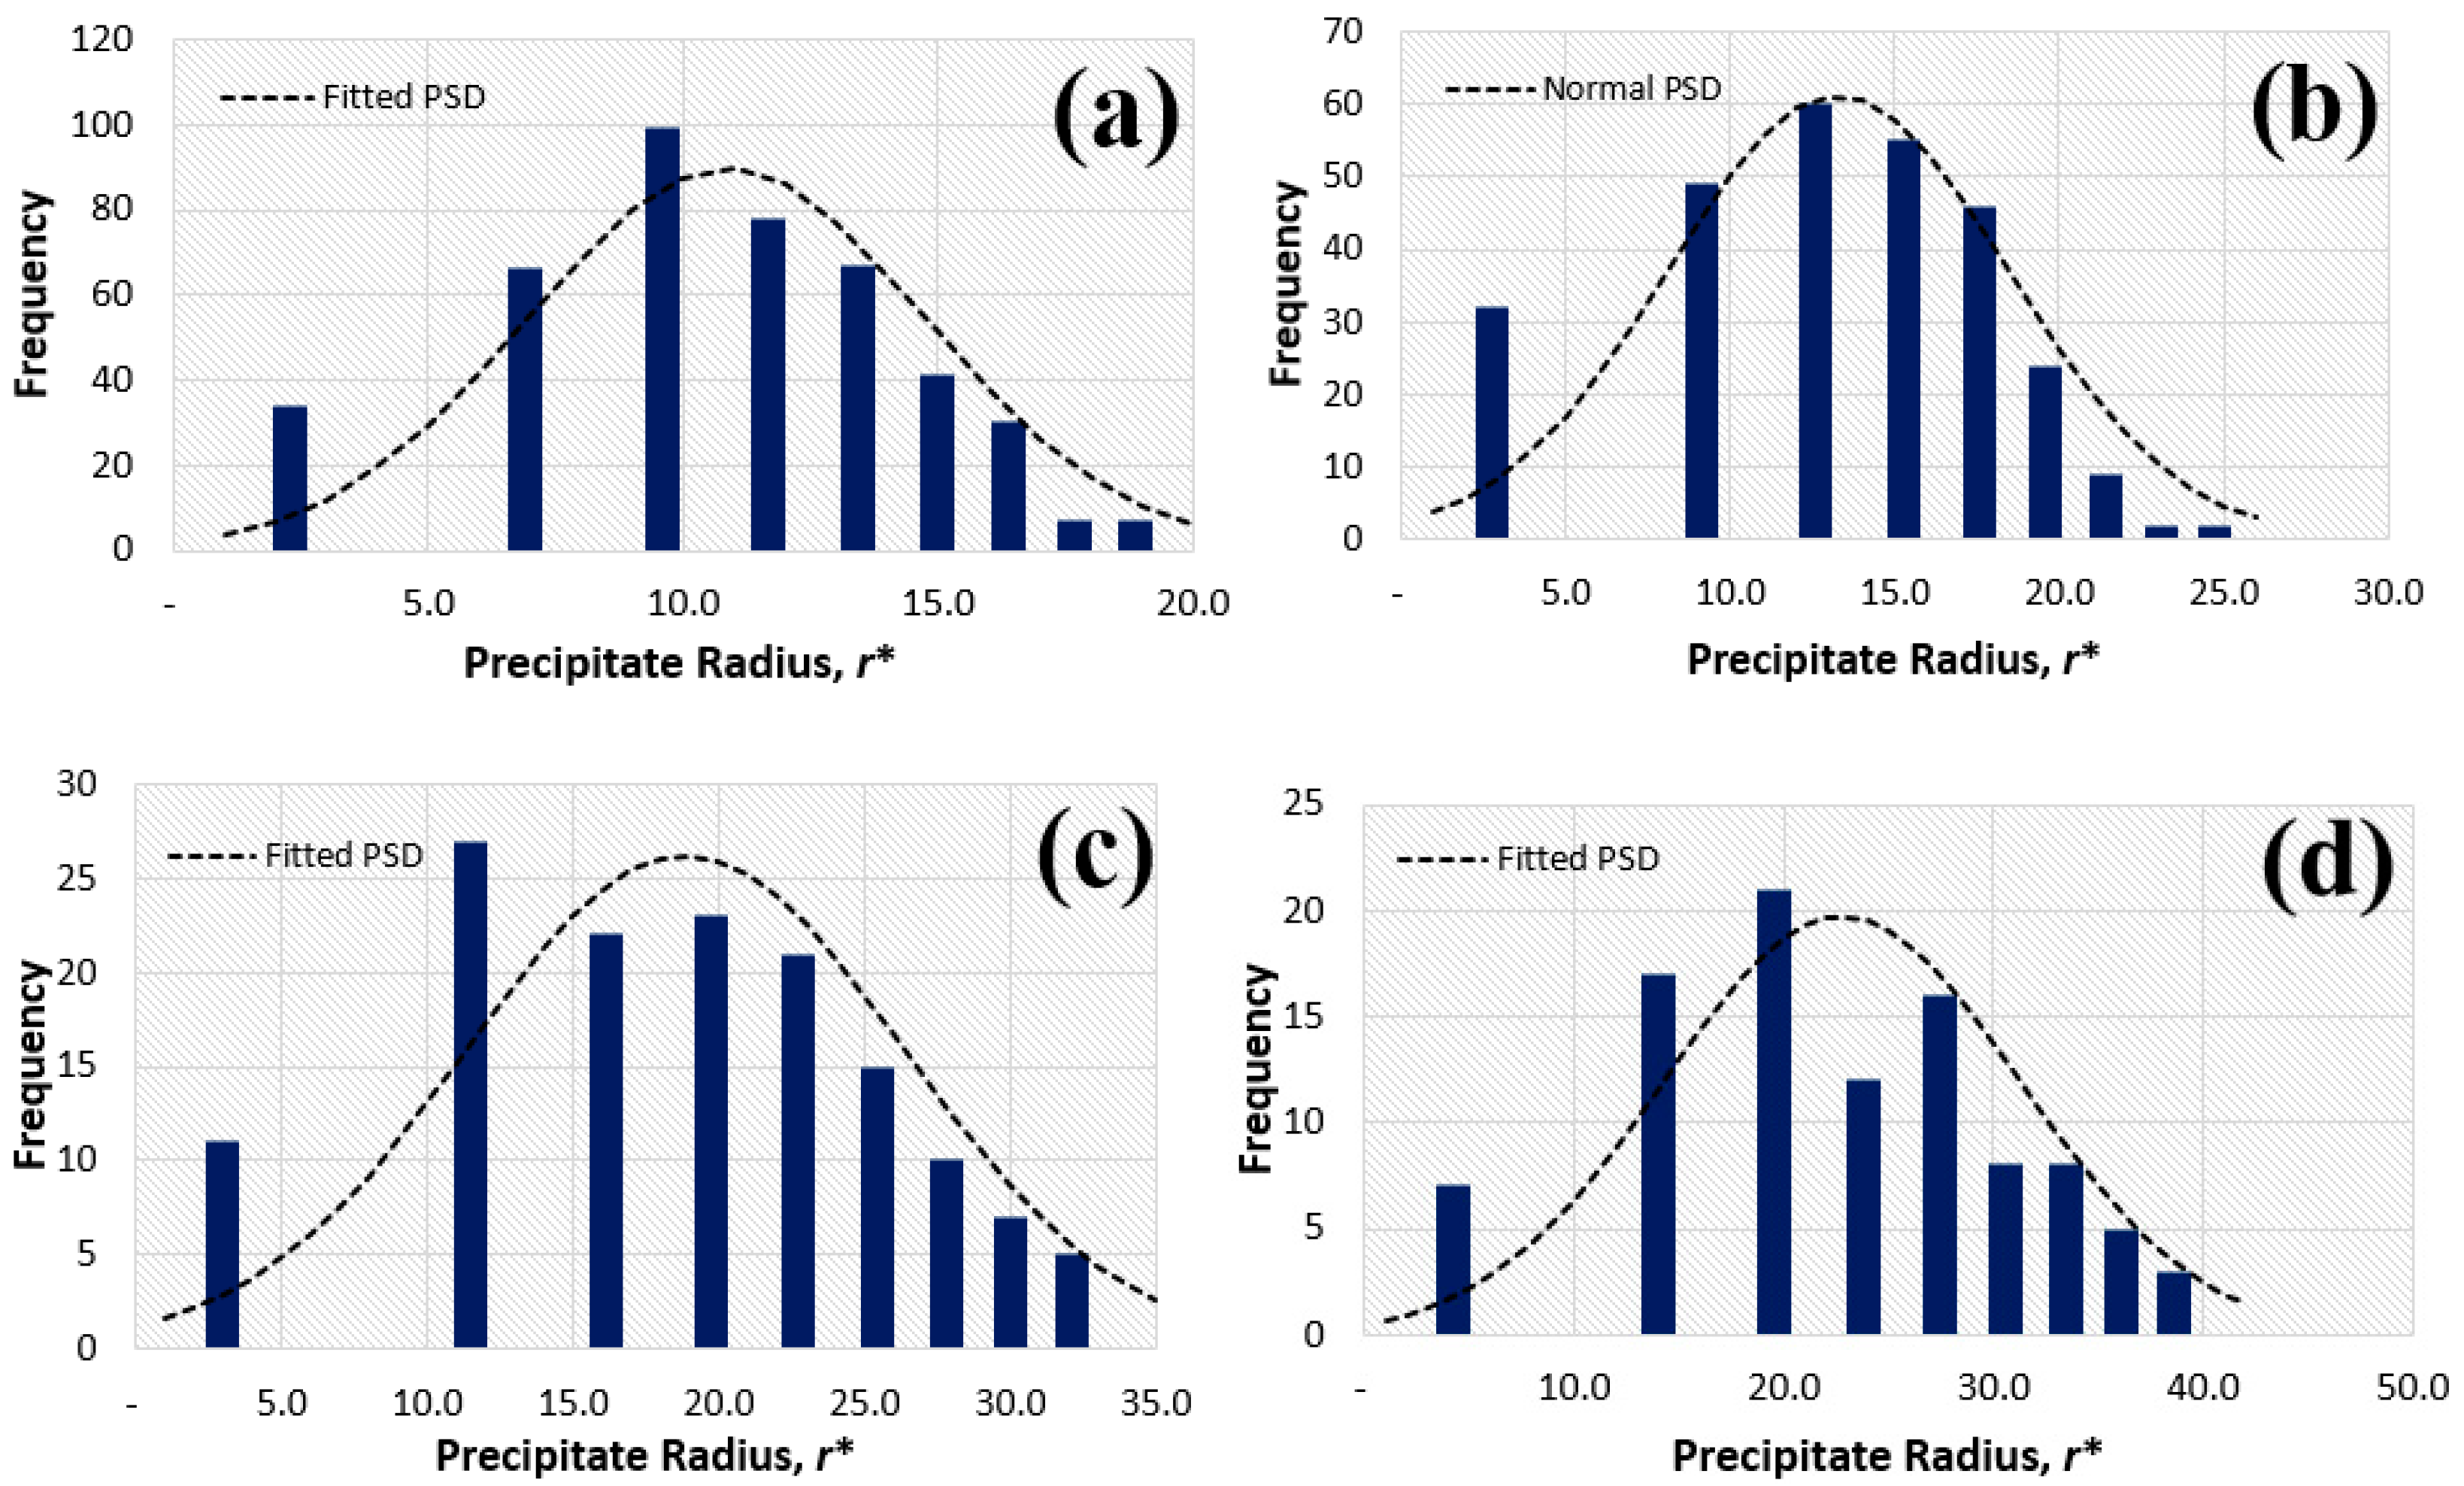
The LSW theory shows that regardless of the system initial particle size distribution, the particle size distribution (PSD) will always converge towards self-similarity with time [42]. The self-similarity can be examined by either calculating the structural function to verify dynamical scaling [36] or through analyzing the PSD shape that changes with time step. In this work, the latter was used to verify the self-similarity of our system. The normalized PSD shapes with fitted curves for precipitate coarsening at selected time steps in absence of nanoparticles are shown in Figure 4a–d. Data for plotting histograms was extracted from coarsening results using Image J software before plotting histograms Microsoft Excel. The peak frequency of the PSD gradually decreases and shifts to the right with time due to coarsening and this is consistent with normal coarsening behavior [36]. The figure also shows that the size distribution range becomes broader with an increase in time, as expected in a normal coarsening process. Observations show that the PSD did not significantly change in shape with time step and this indicates that, for the time steps considered, a scaling behavior during coarsening has already been reached.
To validate the model, our simulation results for precipitate coarsening in absence of nanoparticles were compared with results by Wu et al. [43], Wang et al. [44], and those from Zhu et al. [36] for coarsening of binary Ni Al alloys. The PSD shapes and curves of from our simulation results (Figure 3a and Figure 4a–c) are similar with those from these previous results, i.e., they both obey the linear cube growth law and have similar unimodal skewed PSD shapes. Quantitative comparisons are necessary in the future to further clarify this aspect.
3.2. Coarsening Behavior in Presence of Nanoparticles
To understand the effect of nanoparticles on the precipitate coarsening process, inert nanoparticle phases with volume fractions of 10%, 20%, and 30% were introduced into the domain. A previous study on grain boundary pinning [24] showed that the size distribution of nanoparticles is not important in controlling grain growth. Thus, for a given nanoparticle volume fraction, mono-sized spherical nanoparticles with three radii sizes, r*, of 10, 20 and 30 were used. All the nanoparticles were randomly distributed in the system. It should be noted that introduction of nanoparticles reduced the total solute content within the matrix, and, therefore, the volume fraction of the precipitate phase in the coarsening stage is also reduced.
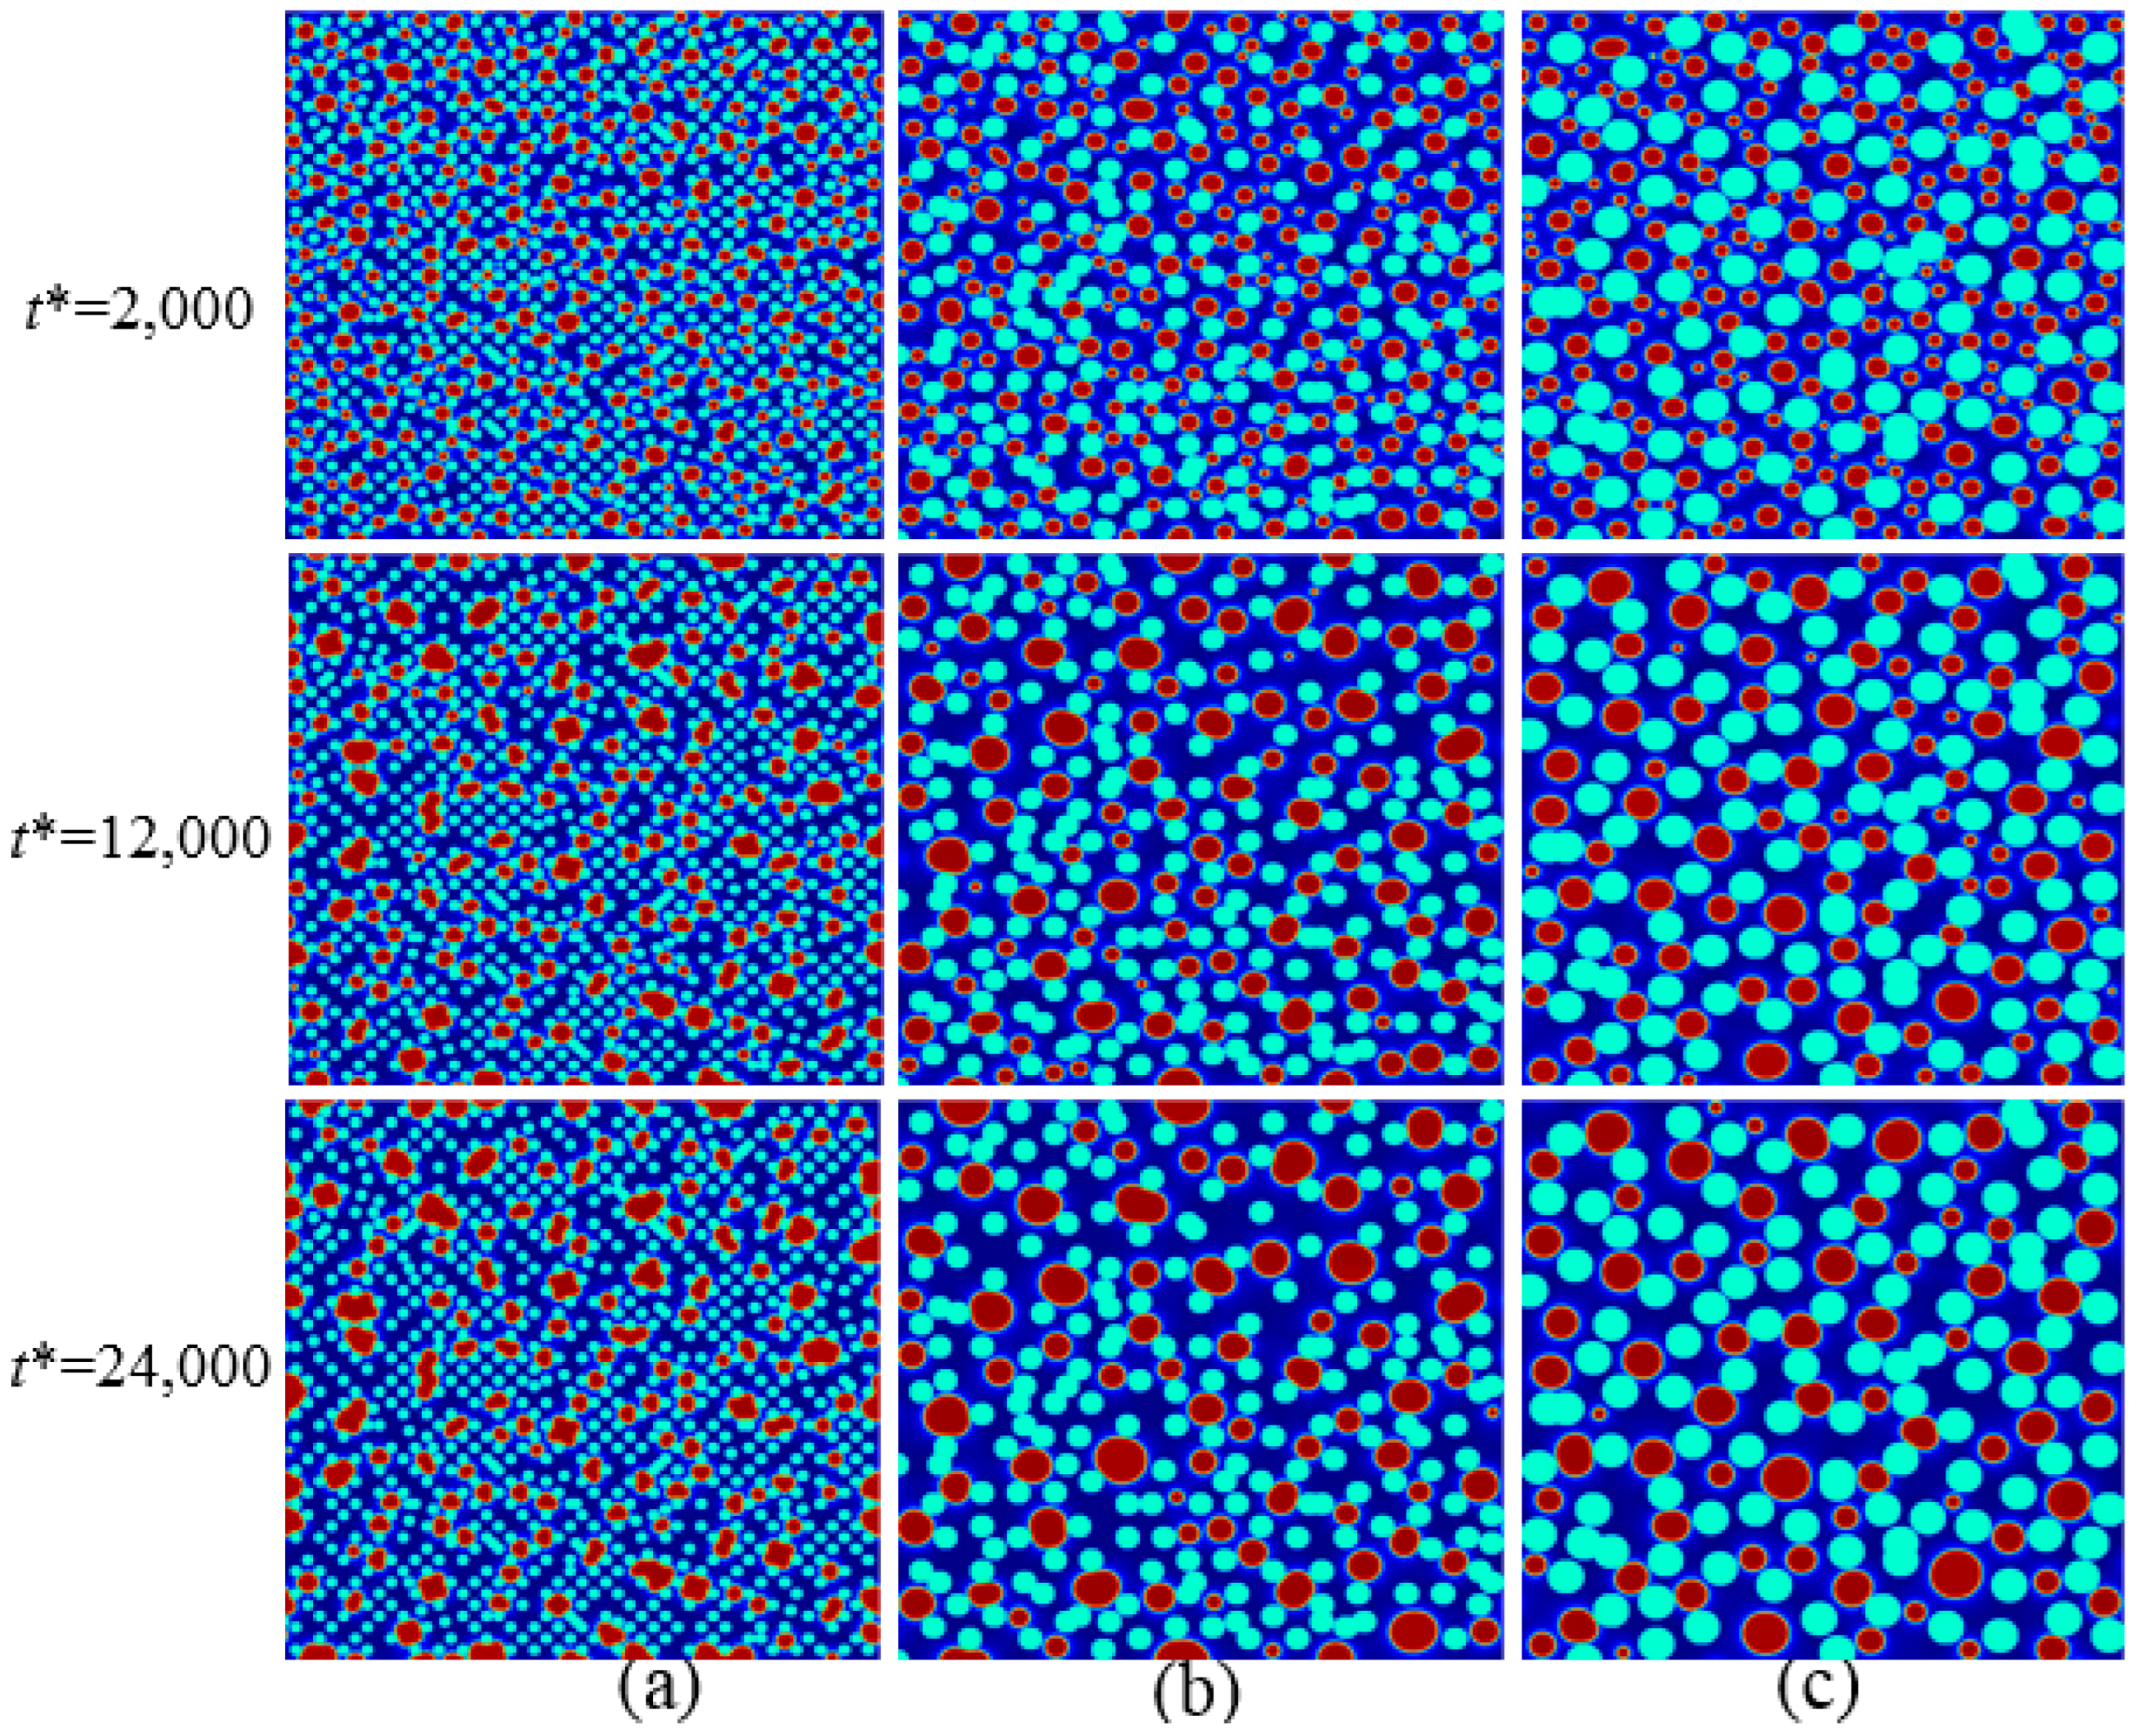
Figure 5a–c shows the evolution of the precipitates with different nanoparticle volume fractions at a fixed nanoparticle size of r* = 20. The relationships of the cube of the average precipitate size with the coarsening time under different volume fractions of nanoparticles, including zero volume fraction, are merged for comparison and plotted in Figure 6a. At a given time, the average precipitate size decreases with increasing nanoparticle volume fractions. Similar simulations with different nanoparticle sizes are also shown in Figure 6b,c. In general, the average precipitate size curves deviate from the linear cubic growth law and become more nonlinear at higher volume fractions of nanoparticles. This behavior is expected, since low nanoparticle volume fraction systems are closer to the classic LSW coarsening theory, and one should expect a larger deviation of the average precipitate size from the LSW theory as more nanoparticles are added into the system. One may also notice that, at the same nanoparticle volume fraction, the deviation from linear LSW coarsening rate is more significant for smaller nanoparticles. This particle size effect will be discussed in a later section.
Figure 6 also shows that, at a given time, the gradients of the curves are non-constant and gradually decrease with an increase in nanoparticle volume fraction, and this signifies the slowing down of the coarsening rate. The local slopes of the curves are the coarsening rate constants which indicate the kinetic and thermodynamic changes in terms of the diffusion coefficient, interfacial energy, and molar volume according to the coarsening rate constant relationship given below [37].
where, is the molar volume of the precipitates, D is the bulk diffusion of solutes in the matrix, is the equilibrium solute concentration of the matrix, is the interfacial energy of the precipitate–matrix interface, is the particle radius, T is the temperature, and is the ratio of the coarsening rate with finite precipitate volume fraction to the coarsening rate with zero volume fraction. After examining the precipitate shrinkage and growth behavior in detail, it was found that the decelerated coarsening behavior experienced in this study is not attributed to inverse coarsening like the one experienced in the previous study [45], but the behavior is in agreement with results obtained by Ryu et al. [46] for regular coarsening deceleration.
The PSD at different times in presence of nanoparticles of radius size r* = 10 with different volume fractions in the system are given in Figure 7, Figure 8 and Figure 9. The graphs show that with an increase in the system nanoparticle area fraction, the particle size distributions change and significant differences from the non-nanoparticles PSD in Figure 4 can be identified. Firstly, with an increase in volume fraction of nanoparticles, the PSD shapes become more disordered and peak positions do not significantly move to the right. This signifies much departure from the regular PSD observed in the absence of nanoparticles. Secondly, the rate of increase of the broadness of the precipitate size ranges becomes slower at higher volume fractions of precipitates (Figure 9) when compared to that in the absence of nanoparticles (Figure 4). After examining the coarsening simulation results carefully, it is found that, at high nanoparticle volume fraction, the shapes of the precipitates become irregular due to contact with nanoparticles. As seen in the high volume fraction PSD in Figure 9, the precipitate size range becomes narrow, and such PSD shapes are quite similar to those obtained for decelerated coarsening in the presence of stresses [15]. Figure 7, Figure 8 and Figure 9 show that in the presence of nanoparticles in the system, the PSD shapes are constantly changing with time and are not self-similar according to the classic LSW theory. This behavior can be understood by identifying another precipitate size–limiting mechanism, which is the distance between randomly distributed inert nanoparticles. As shown in Figure 5, when the precipitates are in contact with nanoparticles, further growth of precipitates is constrained by the surrounding nanoparticles. Since the nanoparticles are randomly distributed in the matrix, the size distribution of the inter-particle space where the precipitates can grow is also random, with the average inter-particle space being inversely proportional to the number of nanoparticles. The particle size distribution, particularly in the late stages of coarsening, is the combined result of the classic coarsening kinetics that pushes the distribution towards the standard LSW PSD shapes and the geometric constraint imposed by inter-particle, distance which leads to random size distribution. Thus, with less size constraints at low nanoparticle volume fraction, the system will relax towards the standard PSD given by the LSW theory, and with strong size constraints at high nanoparticle volume fractions, precipitates will form a PSD that centers around the average inter-particle distance.
To investigate the effect of nanoparticle sizes on the precipitate coarsening rate, the nanoparticle volume fractions were fixed and the nanoparticle sizes were varied. Figure 10a–c shows the evolution of precipitates with time steps for nanoparticles of a fixed volume fraction of 30% and different sizes, r*, of 10, 20, and 30. In the presence of small sized nanoparticles, the late stage precipitate shape changes from circular to irregular, whilst for large nanoparticles the changes are insignificant. Figure 11a–c shows the plots of the cube of average precipitate radius with time for nanoparticles with fixed volume fractions and different particle sizes. It is shown that small-sized nanoparticles are more effective in suppressing precipitate coarsening when compared to large ones. The results show that, for the same volume fraction, the precipitate sizes and gradients of the curves decreases with a decrease in the nanoparticle size. The smallest precipitate sizes are obtained in the presence of a high volume fraction of nanoparticles of the smallest size, as shown in Figure 11c. On the contrary, a small area fraction of large nanoparticles, like those shown in Figure 11a, only slightly affects the precipitate’ coarsening rate. At the same volume fraction, small nanoparticles possess larger overall surface area. Since the coarsening process involves the transportation of solute atoms from small precipitates to large precipitates through diffusion, the large amount of particle–matrix interfaces produced by small nanoparticles block more solute transportation path and, therefore, effectively slows down the coarsening process.
The effect of nanoparticle sizes on PSD are shown in Figure 9, Figure 12 and Figure 13 for nanoparticles with 30% volume fraction and size radii, R*, of 10, 20, and 30. The figures show that with a decrease in the nanoparticle size, the PSD shapes become more random due to the inter-particle distance constraints from the increasing nanoparticle number density. With larger nanoparticle size, like in Figure 13, the PSD shape is close to the one in absence of nanoparticles since the inter-particle distance is also large. A similar behavior was observed in NiAl and Fe-Cr alloys, where it was shown that the coarsening rate can be decelerated by solute segregation, stresses and strains [10,47].
4. Conclusions
The effects of intra-granular nanoparticles on early-stage coarsening behavior of precipitates were studied computationally by generalizing a previously proved phase field model for precipitate coarsening. Inert nanoparticles of various sizes and volume fractions were incorporated in the matrix phase using a non-evolving order parameter. It is found that both the precipitate size distribution and the coarsening rate may be affected by the presence and characteristics of nanoparticles. Two distinct mechanisms for these nanoparticle effects are proposed. The new length scale related to the inter-nanoparticle distance introduced by incorporating random nanoparticles may change the standard LSW precipitate size distribution by geometrically constraining the precipitate size, and the reduction of available diffusion paths due to the blockage of nanoparticle–matrix interfaces can significantly slow down the coarsening process. As the first systematic computational study of the effects of nanoparticles on the precipitate coarsening process, this work sheds light on potential approaches to control the coarsening process and further improve the mechanical properties of nanoparticle–reinforced metal matrix composites.
The simulation results in general suggests that the use of smaller nanoparticles with large number density is effective in slowing down of the coarsening kinetics. However, since the current work was performed in 2D only, the diffusion path blockage mechanism that leads to this conclusion may become less significant in 3D due to an increasing transport path. Computationally intensive 3D simulations need to be carried out in the future in order to confirm the result. In addition, other potential contributing factors like the precipitate–matrix misfit stress and surface diffusion along the particle–matrix interface should be included when generalizing the results to real materials.
Author Contributions
Conceptualization and study design, N.W.; Model development, simulations, manuscript writing, S.F.; Data interpretation, data collection and manuscript revision, B.H. All authors have read and agreed to the published version of the manuscript.
Funding
This research received no external funding.
Data Availability Statement
Not applicable.
Acknowledgments
The authors acknowledge the computer time support from the High Performance Computing Center of Guangdong Technion—Israel Institute of Technology.
Conflicts of Interest
The authors of this manuscript declare that there is no any conflict of interest in this paper.
References
- Baldan, A. Review Progress in Ostwald ripening theories and their applications to the γ’-precipitates in nickel-base superalloys Part II Nickel-base superalloys. J. Mater. Sci. 2002, 37, 2379–2405. [Google Scholar] [CrossRef]
- Yang, C.; Cao, L.; Gao, Y.; Cheng, P.; Zhang, P.; Kuang, J.; Zhang, J.; Liu, G.; Sun, J. Nanostructural Sc-based hierarchy to improve the creep resistance of Al–Cu alloys. Mater. Des. 2020, 186, 108309. [Google Scholar] [CrossRef]
- Shower, P.; Morris, J.; DShin Radhakrishnan, B.; Poplawsky, J.; Shyam, A. Mechanisms for stabilizing θ’(Al2Cu) precipitates at elevated temperatures investigated with Phase Field modeling. Materialia 2019, 6, 100335. [Google Scholar] [CrossRef]
- Devaraj, A.; Wang, W.; Vemuri, R.; Kovarik, L.; Jiang, X.; Bowden, M.; Trelewicz, J.R.; Mathaudhu, S.; Rohatgi, A. Grain boundary segregation and intermetallic precipitation in coarsening resistant nanocrystalline aluminum alloys. Acta Mater. 2019, 165, 698–708. [Google Scholar] [CrossRef]
- Gao, Y.H.; Guan, P.F.; Su, R.; Chen, H.W.; Yang, C.; He, C.; Cao, L.F.; Song, H.; Zhang, J.Y.; Zhang, X.F.; et al. Segregation-sandwiched stable interface suffocates nanoprecipitate coarsening to elevate creep resistance. Mater. Res. Lett. 2020, 8, 446–453. [Google Scholar] [CrossRef]
- Gao, Y.H.; Yang, C.; Zhang, J.Y.; Cao, L.F.; Liu, G.; Sun, J.; Ma, E. Stabilizing nanoprecipitates in Al-Cu alloys for creep resistance at 300 °C. Mater. Res. Lett. 2019, 7, 18–25. [Google Scholar] [CrossRef]
- Smith, T.M.; Good, B.S.; Gabb, T.P.; Esser, B.D.; Egan, A.J.; Evans, L.J.; McComb, D.W.; Mills, M.J. Effect of stacking fault segregation and local phase transformations on creep strength in Ni-base superalloys. Acta Mater. 2019, 172, 55–65. [Google Scholar] [CrossRef]
- Bian, H.; Xu, X.; Li, Y.; Koizumi, Y.; Wang, Z.; Chen, M.; Yamanaka, K.; Chiba, A. Regulating the coarsening of the γ’ phase in superalloys. NPG Asia Mater. 2015, 7, e212. [Google Scholar] [CrossRef] [Green Version]
- Feng, L.; Rao, Y.; Ghazisaeidi, M.; Mills, M.J.; Wang, Y. Quantitative prediction of Suzuki segregation at stacking faults of the γ’phase in Ni-base superalloys. Acta Mater. 2020, 200, 223–235. [Google Scholar] [CrossRef]
- Mushongera, L.T.; Fleck, M.; Kundin, J.; Wang, Y.; Emmerich, H. Effect of Re on directional γ’-coarsening in commercial single crystal Ni-base superalloys: A phase field study. Acta Mater. 2015, 93, 60–72. [Google Scholar] [CrossRef]
- Wang, W.Z.; Jin, T.; Liu, J.L.; Sun, X.F.; Guan, H.R.; Hu, Z.Q. Role of Re and Co on microstructures and γ’ coarsening in single crystal superalloys. Mater. Sci. Eng. A 2008, 479, 148–156. [Google Scholar] [CrossRef]
- Lu, F.; Antonov, S.; Lu, S.; Zhang, J.; Li, L.; Wang, D.; Zhang, J.; Feng, Q. Unveiling the Re effect on long-term coarsening behaviors of γ’ precipitates in Ni-based single crystal superalloys. Acta Mater. 2022, 233, 117979. [Google Scholar] [CrossRef]
- Pyczak, F.; Devrient, B.; Neuner, F.C.; Mughrabi, H. The influence of different alloying elements on the development of the γ/γ’ microstructure of nickel-base superalloys during high-temperature annealing and deformation. Acta Mater. 2005, 53, 3879–3891. [Google Scholar] [CrossRef]
- Chen, Y.; Slater, T.J.; Bai, M.; Mitchell, R.; Ciuca, O.; Preuss, M.; Haigh, S.J. An investigation of diffusion-mediated cyclic coarsening and reversal coarsening in an advanced Ni-based superalloy. Acta Mater. 2016, 110, 295–305. [Google Scholar] [CrossRef]
- Prikhodko, S.V.; Ardell, A.J. Coarsening of γ’ in Ni–Al alloys aged under uniaxial compression: I. Early-stage kinetics. Acta Mater. 2003, 51, 5001–5012. [Google Scholar] [CrossRef]
- Ardell, A.J.; Prikhodko, S.V. Coarsening of γ’ in Ni–Al alloys aged under uniaxial compression: II. Diffusion under stress and retardation of coarsening kinetics. Acta Mater. 2003, 51, 5013–5019. [Google Scholar]
- Kundin, J.; Mushongera, L.; Goehler, T.; Emmerich, H. Phase-field modeling of the γ’-coarsening behavior in Ni-based superalloys. Acta Mater. 2012, 60, 3758–3772. [Google Scholar] [CrossRef]
- Voorhees, P.W. The theory of Ostwald ripening. J. Stat. Phys. 1985, 38, 231–252. [Google Scholar] [CrossRef] [Green Version]
- Chen, L.Y.; Xu, J.Q.; Li, X.C. Controlling phase growth during solidification by nanoparticles. Mater. Res. Lett. 2015, 3, 43–49. [Google Scholar] [CrossRef] [Green Version]
- Wang, K.; Jiang, H.Y.; Jia, Y.W.; Zhou, H.; Wang, Q.D.; Ye, B.; Ding, W.J. Nanoparticle-inhibited growth of primary aluminum in Al–10Si alloys. Acta Mater. 2016, 103, 252–263. [Google Scholar] [CrossRef]
- Chen, L.Y.; Xu, J.Q.; Choi, H.; Konishi, H.; Jin, S.; Li, X.C. Rapid control of phase growth by nanoparticles. Nat. Commun. 2014, 5, 3879. [Google Scholar] [CrossRef] [PubMed] [Green Version]
- Vanherpe, L.; Moelans, N.; Blanpain, B.; Vandewalle, S. Pinning effect of spheroid second-phase particles on grain growth studied by three-dimensional phase-field simulations. Comput. Mater. Sci. 2010, 49, 340–350. [Google Scholar] [CrossRef]
- Chakrabarti, T.; Manna, S. Zener pinning through coherent precipitate: A phase-field study. Comput. Mater. Sci. 2018, 154, 84–90. [Google Scholar] [CrossRef] [Green Version]
- Chang, K.; Feng, W.; Chen, L.Q. Effect of second-phase particle morphology on grain growth kinetics. Acta Mater. 2009, 57, 5229–5236. [Google Scholar] [CrossRef]
- Moelans, N.; Blanpain, B.; Wollants, P. Phase field simulations of grain growth in two-dimensional systems containing finely dispersed second-phase particles. Acta Mater. 2006, 54, 1175–1184. [Google Scholar] [CrossRef]
- Karnesky, R.A.; Meng, L.; Dunand, D.C. Strengthening mechanisms in aluminum containing coherent Al3Sc precipitates and incoherent Al2O3 dispersoids. Acta Mater. 2007, 55, 1299–1308. [Google Scholar] [CrossRef]
- Moelans, N.; Blanpain, B.; Wollants, P. Pinning effect of second-phase particles on grain growth in polycrystalline films studied by 3-D phase field simulations. Acta Mater. 2007, 55, 2173–2182. [Google Scholar] [CrossRef]
- Lin, T.C.; Cao, C.; Sokoluk, M.; Jiang, L.; Wang, X.; Schoenung, J.M.; Lavernia, E.J.; Li, X. Aluminum with dispersed nanoparticles by laser additive manufacturing. Nat. Commun. 2019, 10, 4124. [Google Scholar] [CrossRef] [Green Version]
- Suwa, Y.; Saito, Y.; Onodera, H. Phase field simulation of grain growth in three dimensional system containing finely dispersed second-phase particles. Scr. Mater. 2006, 55, 407–410. [Google Scholar] [CrossRef]
- DeWitt, S.; Thornton, K. Phase field modeling of microstructural evolution. Comput. Mater. Syst. Des. 2018, pp. 67–87. Available online: https://0-link-springer-com.brum.beds.ac.uk/chapter/10.1007/978-3-319-68280-8_4 (accessed on 30 March 2022).
- Moelans, N.; Blanpain, B.; Wollants, P. An introduction to phase-field modeling of microstructure evolution. Calphad 2008, 32, 268–294. [Google Scholar] [CrossRef]
- Bellemans, I.; Moelans, N.; Verbeken, K. Phase-field modelling in extractive metallurgy. Crit. Rev. Solid State Mater. Sci. 2018, 43, 417–454. [Google Scholar] [CrossRef]
- Boettinger, W.J.; Warren, J.A.; Beckermann, C.; Karma, A. Phase-field simulation of solidification. Annu. Rev. Mater. Res. 2002, 32, 163–194. [Google Scholar] [CrossRef]
- Fan, D.; Chen, S.P.; Chen, L.Q.; Voorhees, P.W. Phase-field simulation of 2-D Ostwald ripening in the high volume fraction regime. Acta Mater. 2002, 50, 1895–1907. [Google Scholar] [CrossRef]
- Vaithyanathan, V. Phase-Field Simulations of Coherent Precipitate Morphologies and Coarsening Kinetics. Ph.D. Thesis, The Pennsylvania State University, Centre County, PA, USA, 2002. [Google Scholar]
- Zhu, J.Z.; Wang, T.; Ardell, A.J.; Zhou, S.H.; Liu, Z.K.; Chen, L.Q. Three-dimensional phase-field simulations of coarsening kinetics of γ’ particles in binary Ni–Al alloys. Acta Mater. 2004, 52, 2837–2845. [Google Scholar] [CrossRef]
- Li, X.; Saunders, N.; Miodownik, A.P. The coarsening kinetics of γ’ particles in nickel-based alloys. Metall. Mater. Trans. A 2002, 33, 3367–3373. [Google Scholar] [CrossRef]
- Ardell, A.J.; Nicholson, R.B. The coarsening of γ’ in Ni-Al alloys. J. Phys. Chem. Solids 1966, 27, 1793–1794. [Google Scholar] [CrossRef]
- Vaithyanathan, V.; Wolverton, C.; Chen, L.Q. Multiscale modeling of precipitate microstructure evolution. Phys. Rev. Lett. 2002, 88, 125503. [Google Scholar] [CrossRef]
- Simmons, J.P.; Shen, C.; Wang, Y. Phase field modeling of simultaneous nucleation and growth by explicitly incorporating nucleation events. Scr. Mater. 2000, 43, 935–942. [Google Scholar] [CrossRef]
- Marqusee, J.A.; Ross, J. Theory of Ostwald ripening: Competitive growth and its dependence on volume fraction. J. Chem. Phys. 1984, 80, 536–543. [Google Scholar] [CrossRef]
- Sun, Y.; Andrews, W.B.; Thornton, K.; Voorhees, P.W. Self-similarity and the dynamics of coarsening in materials. Sci. Rep. 2018, 8, 17940. [Google Scholar] [CrossRef]
- Wu, X.; Li, Y.; Huang, M.; Liu, W.; Hou, Z. Precipitation kinetics of ordered γ’ phase and microstructure evolution in a NiAl alloy. Mater. Chem. Phys. 2016, 182, 125–132. [Google Scholar] [CrossRef]
- Wang, T.; Sheng, G.; Liu, Z.K.; Chen, L.Q. Coarsening kinetics of γ’ precipitates in the Ni–Al–Mo system. Acta Mater. 2008, 56, 5544–5551. [Google Scholar] [CrossRef]
- Miyazaki, T.; Koyama, T. Stability bifurcation against coarsening in elastically constrained many-particle systems. Mater. Sci. Eng. A 1993, 169, 159–165. [Google Scholar] [CrossRef]
- Ryu, H.J.; Hong, S.H.; Weber, J.; Tundermann, J.H. Effect of elastic interaction energy on coarsening of γ’ precipitates in a mechanically alloyed ODS Ni-base superalloy. J. Mater. Sci. 1999, 34, 329–336. [Google Scholar] [CrossRef]
- Zhu, L.; Li, Y.; Shi, S.; Yan, Z.; Chen, J.; Maqbool, S. Morphology and kinetics evolution of nanoscale phase in Fe–Cr alloys under external strain. Nanomaterials 2019, 9, 294. [Google Scholar] [CrossRef] [PubMed] [Green Version]
Figure 1.
A schematic microstructure showing grains with randomly dispersed nanoparticles in both grain interiors and grain boundaries. Solid lines are grain boundaries, and dark dots are nanoparticles.
Figure 1.
A schematic microstructure showing grains with randomly dispersed nanoparticles in both grain interiors and grain boundaries. Solid lines are grain boundaries, and dark dots are nanoparticles.

Figure 2.
Simulation snapshots of the precipitate evolution in absence of nanoparticles at different times. The precipitates are colored red, and the matrix is in dark blue.
Figure 2.
Simulation snapshots of the precipitate evolution in absence of nanoparticles at different times. The precipitates are colored red, and the matrix is in dark blue.

Figure 3.
(a) Plots of the cube of the average precipitate radius with time in absence of nanoparticles, (b) the change in precipitate area fraction with time in absence of nanoparticles, and (c) the change of precipitate numbers with time in absence of nanoparticles in the system.
Figure 3.
(a) Plots of the cube of the average precipitate radius with time in absence of nanoparticles, (b) the change in precipitate area fraction with time in absence of nanoparticles, and (c) the change of precipitate numbers with time in absence of nanoparticles in the system.

Figure 4.
Histograms of the PSD in absence of nanoparticles at different times t* of: (a) 1000, (b) 2500, (c) 10,000, and (d) 20,000.
Figure 4.
Histograms of the PSD in absence of nanoparticles at different times t* of: (a) 1000, (b) 2500, (c) 10,000, and (d) 20,000.

Figure 5.
Simulation snapshots of the system at different times are shown in vertical columns. Particle size, r*, is fixed to 20. Volume fractions of nanoparticles are: (a) 10%, (b) 20%, and (c) 30%. The nanoparticles are shown in light blue, precipitates are colored red, and the matrix is in dark blue.

Figure 6.
Plots of the cube of the average precipitate radius versus time. Nanoparticle area fractions are labeled in the figures. Nanoparticle sizes are: (a) 10, (b) 20 and (c) 30.
Figure 6.
Plots of the cube of the average precipitate radius versus time. Nanoparticle area fractions are labeled in the figures. Nanoparticle sizes are: (a) 10, (b) 20 and (c) 30.

Figure 7.
Histograms of the PSD in presence of 10% nanoparticles of size 10 at different times t* of: (a) 1000, (b) 2500, (c) 10,000, and (d) 20,000.
Figure 7.
Histograms of the PSD in presence of 10% nanoparticles of size 10 at different times t* of: (a) 1000, (b) 2500, (c) 10,000, and (d) 20,000.

Figure 8.
Histograms of the PSD in presence of 20% nanoparticles of size 10 at different times, t*, of: (a) 1000, (b) 2500, (c) 10,000, and (d) 20,000.
Figure 8.
Histograms of the PSD in presence of 20% nanoparticles of size 10 at different times, t*, of: (a) 1000, (b) 2500, (c) 10,000, and (d) 20,000.

Figure 9.
Histograms of the PSD in presence of 30% nanoparticles of size 10 at different times t* of: (a) 1000, (b) 2500, (c) 10,000, and (d) 20,000.
Figure 9.
Histograms of the PSD in presence of 30% nanoparticles of size 10 at different times t* of: (a) 1000, (b) 2500, (c) 10,000, and (d) 20,000.

Figure 10.
Simulation snapshots of the system at different times are shown in vertical columns. Particle volume fraction is set to 30%. Particle sizes are: (a) 10, (b) 20, and (c) 30. The same coloring scheme in Figure 5 is used.
Figure 10.
Simulation snapshots of the system at different times are shown in vertical columns. Particle volume fraction is set to 30%. Particle sizes are: (a) 10, (b) 20, and (c) 30. The same coloring scheme in Figure 5 is used.

Figure 11.
Plots of the cube of the average precipitate radius with time for different nanoparticles area fractions of: (a) 10%, (b) 20%, and (c) 30%. Particle sizes are labeled in the figures.
Figure 11.
Plots of the cube of the average precipitate radius with time for different nanoparticles area fractions of: (a) 10%, (b) 20%, and (c) 30%. Particle sizes are labeled in the figures.

Figure 12.
Histograms of the PSD in presence of 30% nanoparticles of size 20 at different times, t*, of: (a) 1000, (b) 2500, (c) 10,000 and (d) 20,000.
Figure 12.
Histograms of the PSD in presence of 30% nanoparticles of size 20 at different times, t*, of: (a) 1000, (b) 2500, (c) 10,000 and (d) 20,000.

Figure 13.
Histograms of the PSD in presence of 30% nanoparticles of size 30 at different times, t*, of: (a) 1000, (b) 2500, (c) 10,000 and (d) 20,000.
Figure 13.
Histograms of the PSD in presence of 30% nanoparticles of size 30 at different times, t*, of: (a) 1000, (b) 2500, (c) 10,000 and (d) 20,000.

Publisher’s Note: MDPI stays neutral with regard to jurisdictional claims in published maps and institutional affiliations. |
© 2022 by the authors. Licensee MDPI, Basel, Switzerland. This article is an open access article distributed under the terms and conditions of the Creative Commons Attribution (CC BY) license (https://creativecommons.org/licenses/by/4.0/).
Share and Cite
MDPI and ACS Style
Fashu, S.; Huang, B.; Wang, N. Modification of Precipitate Coarsening Kinetics by Intragranular Nanoparticles—A Phase Field Study. Metals 2022, 12, 892. https://0-doi-org.brum.beds.ac.uk/10.3390/met12060892
AMA Style
Fashu S, Huang B, Wang N. Modification of Precipitate Coarsening Kinetics by Intragranular Nanoparticles—A Phase Field Study. Metals. 2022; 12(6):892. https://0-doi-org.brum.beds.ac.uk/10.3390/met12060892
Chicago/Turabian StyleFashu, Simbarashe, Binting Huang, and Nan Wang. 2022. "Modification of Precipitate Coarsening Kinetics by Intragranular Nanoparticles—A Phase Field Study" Metals 12, no. 6: 892. https://0-doi-org.brum.beds.ac.uk/10.3390/met12060892
Note that from the first issue of 2016, this journal uses article numbers instead of page numbers. See further details here.