1. Introduction
1.1. Background and Motivation
Cities have been considered as the major contributors to the overall greenhouse gas emissions and this tendency is only going to get stronger. By 2050, over 70% of the global population will be living in cities [
1]. Increasing the share of renewables in the energy mix will not help to reduce CO
2 emissions to the limits set in the Paris agreement: [
2] the consumption should also be reduced by achieving ambitious targets for energy efficiency. However, without decarbonizing cities current energy and climate objectives cannot be achieved as cities are responsible for about two thirds of energy consumption and emissions [
3]. This goal of decarbonizing cities has to be facilitated by promoting net-zero/positive energy buildings and districts and replicating them, driving cities towards sustainability goals.
It is important to bear in mind that almost complete decarbonization is a key objective of the EU by 2050 [
4], particularly for long-lived infrastructures such as energy infrastructures. The EU position [
5] is based on the idea that a sustainable decarbonization policy cannot be built solely on reducing emissions or saving energy, but on “creating value” for cities and people, taking full advantage of the technology and the increasingly growing opportunities generated by digitalization. If such mitigation (and climate adaptation) strategy is well implemented, cities will solve many socio-economic problems by procuring creative solutions, promoting cross-sectoral cooperation, creating new business models, and partnering with the private sector and residents.
Many projects in smart cities show novel and groundbreaking approaches and are often creative in nature (for example, REMINING-LOWEX where the heat energy stored in old mine shafts was used for the heating and cooling of buildings; EnerGAware—a mobile app-based game that is linked to the actual energy consumption (smart meter data) of the game user’s home and allows to transfer energy savings achieved virtually to the reality and decrease the energy consumption costs; the STORM—a project which tackles energy efficiency at district level by developing an innovative district heating & cooling network controller, based on self-learning algorithms). Detailed information about these and other EU-funded smart city projects available in the Smart Cities Information System (SCIS) database:
https://smartcities-infosystem.eu/sites-projects/projects accessed on 11 December 2020. Various approaches are demonstrated in urban living laboratories, test beds, pilots, and lighthouse projects. This evidence-based approach is very useful for life-testing outcomes, procedures, strategies and insights in a particular territorial context. However, as the historical, geographic, political, social and economic characteristics of urban areas vary greatly, not only between cities, but also between districts and even communities, it is not that easy to repeat the project in another city or even district. At the same time, the findings of a demonstration or pilot should be transferable to other locations and circumstances in order to give the project a broader and deeper impact, and to promote urban transformations towards sustainability and resilience [
6].
In order to avoid the situation where pilot schemes are an “on-off” exercise, there is a strong need to look for opportunities to scale up and repeat successful pilots. Sharing experiences and best practices, repeating, replicating and scaling up already implemented and life-tested projects is the key to further uptake and acceleration of low-carbon smart city solutions as such “success stories” help to build trust among stakeholders and positively influence the decision-making process [
7].
1.2. Methodology
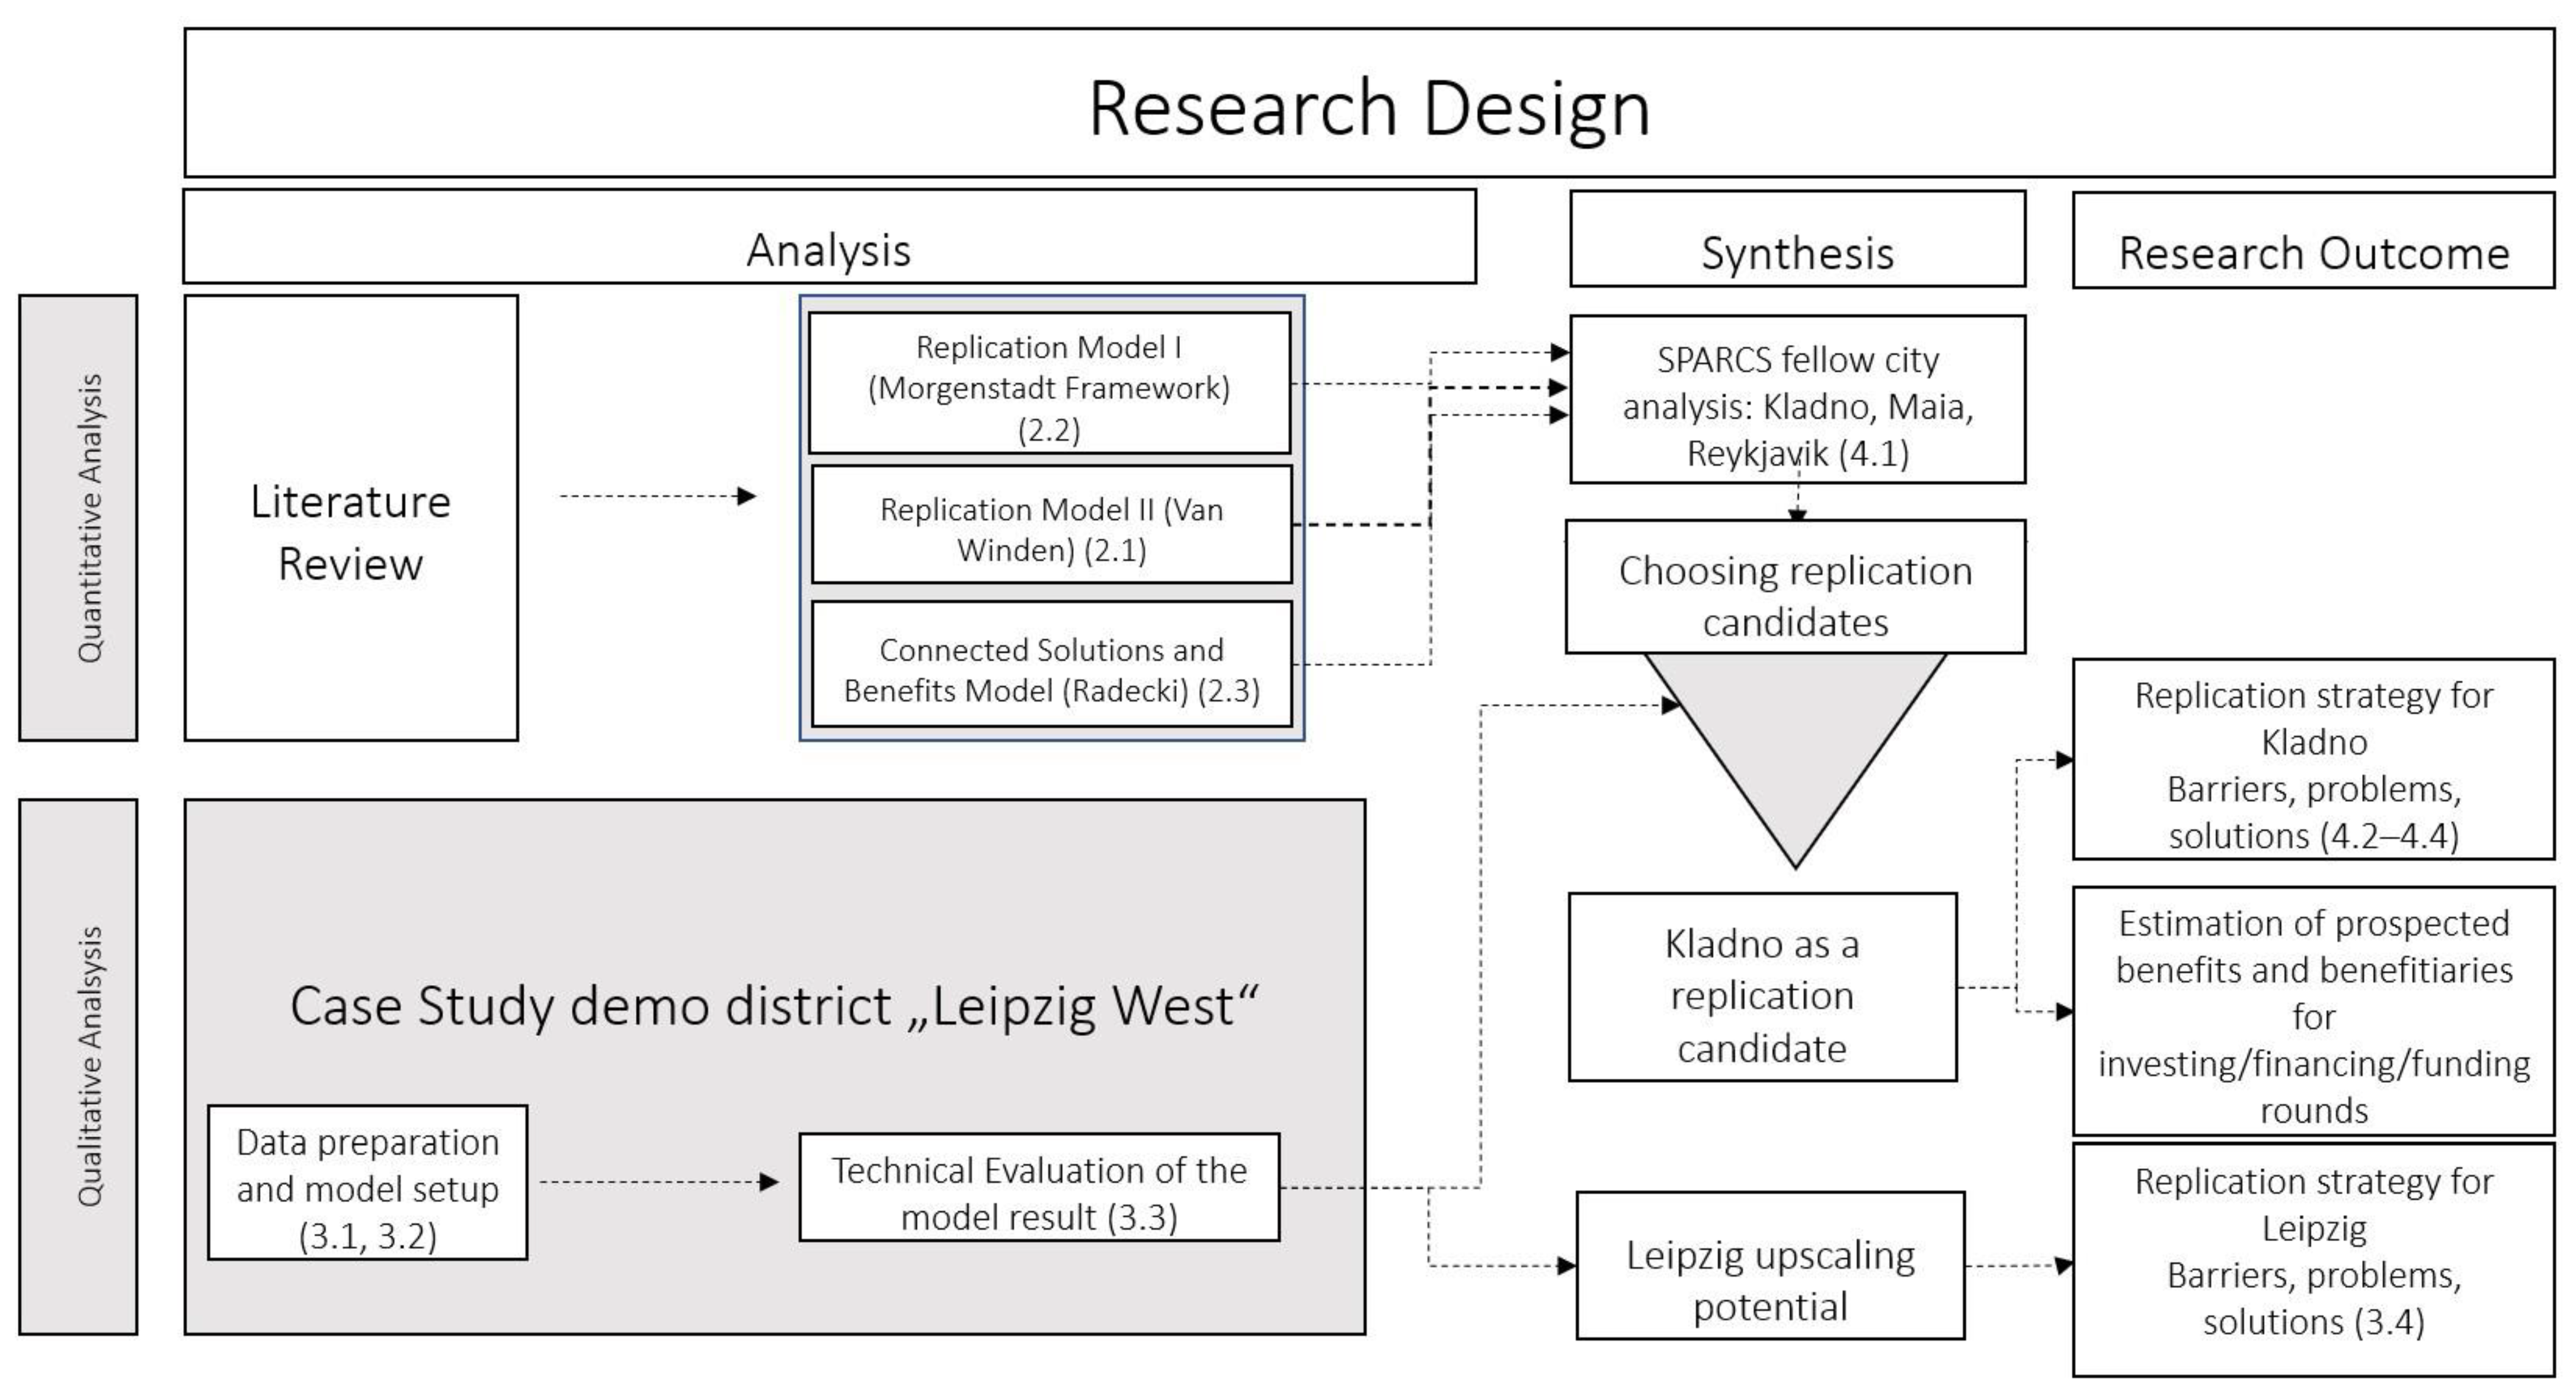
The study is designed as follows (see
Figure 1). At first, different existing models and frameworks of replication in smart cities were compared, and replication models were chosen for further analysis. Using the deconstruction method of analysis, the authors prepared a matrix which can be applied to the particular case in a smart city project in order to define the project’s replication type.
In parallel, in the quantitative part of the study, a model for the energy related parameters of the demo district was prepared. The input data for the modeling exercise were prepared the following way. Regarding the demand-side, the annual heat demand as settled is disaggregated to derive an hourly demand profile of the relevant buildings in the demonstration district applying the Hellwig [
8] procedure. With respect to the supply-side the solar thermal plant is characterized by the following technical parameters: peak power and total annual heat generation, number of solar panels, technological specifics of the system. After that, the input data are transferred to a modeling toolbox establishing the specific energy system model of the demo district. The model output data were analyzed in order to understand the potential for the upscaling of the demand and supply side of the district’s heating energy, and one of the models was applied.
Synthesizing the results of the research, the replication process in the EU smart city project SPARCS was described step-by-step in order to demonstrate the practical application of the replication models and the energy system modelling.
1.3. Definitions and Objectives
Since 2016, buildings have accounted for almost 40% of the EU final energy consumption according to the EU energy efficiency monitoring tool ODYSSEE-MURE [
9]. Overall, the building sector accounts for 41% of the final energy consumption and 60% of the electricity consumption in the EU. Two thirds of this intake belong to residential buildings. This opens a tremendous potential for energy efficiency gains in Europe.
In 2018, the European Parliament gave its final approval on the revised Energy Performance of Buildings directive (EPBD). The EPBD is a part of the implementation of the Juncker Commission priorities to build “a resilient Energy Union with a forward-looking climate change policy”. The Commission wants the EU to lead the clean energy transition. For this reason, the EU has committed to cut CO
2 emissions by at least 40% by 2030 while modernizing the EU′s economy and delivering on jobs and growth for all European citizens. In doing so, the Commission is guided by three main goals: putting energy efficiency first, achieving global leadership in renewable energies and providing a fair deal for consumers [
10].
In the same year, the Program on Positive Energy Districts and Neighborhoods has been established [
11] by the Action 3.2 on Smart Cities and Communities of the European Strategic Energy Technology (SET) Plan, but the exact definition of a Positive Energy District (PED) and its boundaries are still under discussion. In general, PED is a “working area” in smart city projects with a focus on energy, sustainability and emission reduction or, to put it another way, the functionality of a PED is enabled by a smart city. In a SET Plan a PED is defined as following: “Positive Energy Districts are energy-efficient and energy-flexible urban areas or groups of connected buildings which produce net zero greenhouse gas emissions and actively manage an annual local or regional surplus production of renewable energy. They require integration of different systems and infrastructures and interaction between buildings, the users and the regional energy, mobility and Information and Communication Technology (ICT) systems, while securing the energy supply and a good life for all in line with social, economic and environmental sustainability.” [
12]
The Thematic Working Group on ICT for energy efficiency states that: ‘‘Energy-positive buildings and neighborhoods are those that generate more power than their needs. They include the management of local energy sources (mainly renewable, e.g., solar, fuel cells, micro-turbines) and the connection to the power grid in order to sell energy if there is excess or, conversely, to buy energy when their own is not sufficient” [
13].
The purpose of this paper is to explore common trends in technologies and replication strategies for positive energy buildings or districts in smart city projects. This paper discusses some of the barriers that prevent the successful replication of PEDs and suggests strategies to overcome them, taking the city of Leipzig as an example.
The paper is structured as follows. The concept of replication in smart cities is discussed and an overview of the existing models and frameworks which help to categorize different types of replication is given in
Section 2. Thereafter, the case study of a particular smart district in Leipzig within the framework of SPARCS, an EU-funded smart city project, is described and preliminary results as well as suggestions for upscaling are provided (see
Section 3). In
Section 4 the adoption possibility of the solution demonstrated in the case study by the fellow cities of SPARCS project is examined and discusses the possible replication challenges. Finally, a conclusion is presented and results are discussed in
Section 5.
2. Replication: The Collaborative Approach
What is a replication? According to the Cambridge Dictionary, replication is “the act of making or doing something again in exactly the same way, or something that is made or done in this way” [
14].
The EU Smart City Information System (SCIS) definition is partly aligned with the one from the Cambridge Dictionary and claims that replication is the “possibility of transporting or ‘copying’ results from a pilot case to other geographical areas, albeit with potentially different boundary conditions”, but it also includes “the management process that was used in the pilot scheme or the cooperation structure between critical stakeholders.”
The definition prepared for the European Parliament′s Committee on Industry, Research and Energy is the following: “Replication essentially means repeating successful Smart City initiatives in another locale or replicating the same type of Smart City in other cities. These replicas would be based on matching the aggregate characteristics (population, income distribution, local economic characteristics, socio-economic outcomes), and deliberately creating a similar strategic vision and portfolio of (locally relevant) initiatives.” [
15]
As was mentioned in the introduction, the idea of replicating smart city projects goes beyond reducing CO2 emissions in a given district/city or refurbishing some buildings: The intention is to make the process of decarbonizing cities in Europe easier and faster. In this case, the definition given by the EU Parliament′s Committee describes the replication process in the best way highlighting that this process is more about “matching the aggregate characteristics” and “creating the similar portfolio” rather than “copying results from a pilot case”. Having this definition in mind, it is easy to suggest that replication requires a deep understanding of the scaling process of smart city solutions as well as the establishment of strategic cooperation between cities on European and international level.
In this section, we will have a look at two contemporary replication models which have been proposed by the literature. (The third model described in this paper (A. Radecki) is not a replication model but an economic model describing costs and benefits of a single smart city solution.) Provided by leading researchers, these models serve the above-mentioned goal: to deepen the understanding of processes of scaling up the smart city solutions and to provide a common background for establishing a collaboration between the cities.
2.1. Replication Model I (W. van Winden)
One of the most descriptive models to capture the processes of scaling up smart-city solutions is the one suggested by the Dutch urban researcher Willem van Winden [
16]. He proposed a clear distinction between three types of upscaling: roll-out, expansion, and replication (see
Table 1).
Van Winden highlights that these types of replication are different but not mutually excluding: a project may scale in various directions simultaneously, having some parts of the project replicated according to one type and other parts to another (see
Figure 2).
For the purpose of this paper, whenever we refer to the term “context” we consider the interrelated conditions in which a smart city solution or a project is maintained.
To apply the model to the particular case in a smart city project and define the project’s replication type, the following matrix can be used (see
Table 2).
Van Winden created his scheme by observing and classifying the completed projects, but his matrix can be used for mapping out the replication strategy for ongoing projects. For example, taking the Type 1 criteria as requirements, we can describe the solution which can be easily rolled-out: a successfully tested solution which does not fundamentally challenge the state-of-the art technology, behavioral patterns or organizational structure, does not require new partnership, does not anticipate regulatory challenges and does not require new budget.
A smart city project is a complex venture which includes different stakeholders with varying rationales, ambitions and perspectives regarding the upscaling. Moreover, the partners follow different motivations to take part in the project itself from conducting a study that might be commercialized later on to establishing close relations with the local government or improving their own sustainability policy. Therefore, more research is needed to study the dynamics in the area of upscaling where different interests meet and collide.
At the same time, a smart city project must maintain a good balance between exploration (developing new knowledge and competencies associated with Research&Development and innovation) and exploitation (implementation, scale production, refinement). Pilot projects, after all, are designed mainly for the exploration stage [
17].
2.2. Replication Model II (The Morgenstadt Framework)
Another framework which has been used widely in smart city projects within the EU is the Morgenstadt Initiative developed by the Fraunhofer Institute for Industrial Engineering (IAO). Using innovation management methodologies and a range of tools and measures, e.g., international city surveys, “city labs”, analytical tools, online assessment instruments, etc. this framework aims to accelerate development that helps to reduce energy and resource consumption while enhancing the livability and prosperity of a city.
2.2.1. Morgenstadt Model for Sustainable Urban Development
Starting from a systemic analysis of six leading cities (Singapore, Copenhagen, Freiburg, New York City, Berlin and Tokyo) Fraunhofer researchers aligned and synchronized insights from all cities in one action-oriented model—called the “Morgenstadt Model for Sustainable Urban Development”.
There are three types of data available in the Model [
18]:
Over 300 indicators are used for measuring the performance of the cities within the eight defined sectors and for assessing the social, economic and environmental state of the city. All indicators are put into one of the following three categories to provide a complete basis for quantitative analysis of the status quo in any city:
Pressure Indicators—indicate which pressures exist on the city system from the different sectors and from the social, economic and environmental point of view.
State Indicators—describe the current state of the environment, the society, the economy and the different technology sectors within the city.
Impact Indicators—show which impact the city system has on the environment, the society, the economy and long-term resilience.
The 83 defined key action fields for sustainable development represent the Morgenstadt Model core. Assessing the state of key action fields allows to create a city profile and analyze the coherency of existing strategies and measures. Relating key action fields to indicators allows us to assess whether the response of a city is in line with pressures and state and really helps optimizing outputs for enhanced sustainability.
An impact factor analysis uncovers why certain progress happens (or does not happen) in a particular way in a specific urban system. Understanding the constellation of impact factors of a city means understanding external pressures, underlying forces, dynamics, socio-cultural and historical implications that are present within a city and have an impact (often unnoticed) on decisions, structures, strategies and measures taken on the city level and on the project level. Identifying impact factors is complex and needs trans-disciplinary reflection of the researchers. It builds upon an on-site analysis, addressing specific interview questions, applying defined interview techniques, using pre-structured interaction of the researchers and working with mind maps and clustering of impact factors.
Analyzing the three main levels of urban systems (indicators, action fields, and impact factors) the Model describes the selected cities in depth and helps to understand their sustainability performance. The full list of urban indicators, key action fields and impact factors as well as detailed descriptions of their evaluation and assessment is presented in the Morgenstadt: City Insights—Final Report [
18].
2.2.2. Morgenstadt City Index
A simplified version of the methodology defined within the Morgenstadt Framework is the Morgenstadt City Index (
Figure 3). It provides a general, yet accurate, representation of urban performance derived from statistics and data already available and does not require costly and time-consuming surveys and analysis.
To create the City Index, 28 indicators were identified and categorized into four central themes (quality of life, environmental consciousness, innovation and resilience) in order to measure the future viability of a city. (For the full list of the indicators and their values refer to the
Appendix A and Morgenstadt City Index Online Documentation). Through graphic visualization of the results, the Morgenstadt City Index offers a snapshot of a city identifying its strengths and weaknesses, and presents a baseline for a city’s strategy for improvement. The indicators within the City Index were classified on a scale of 0 to 10 points (or 0 to 100%). The values for each indicator and its place on the scale illustrate where the focus of the city development should lay. The only absolute benchmark is set for CO
2 emissions: The target value is CO
2 neutrality.
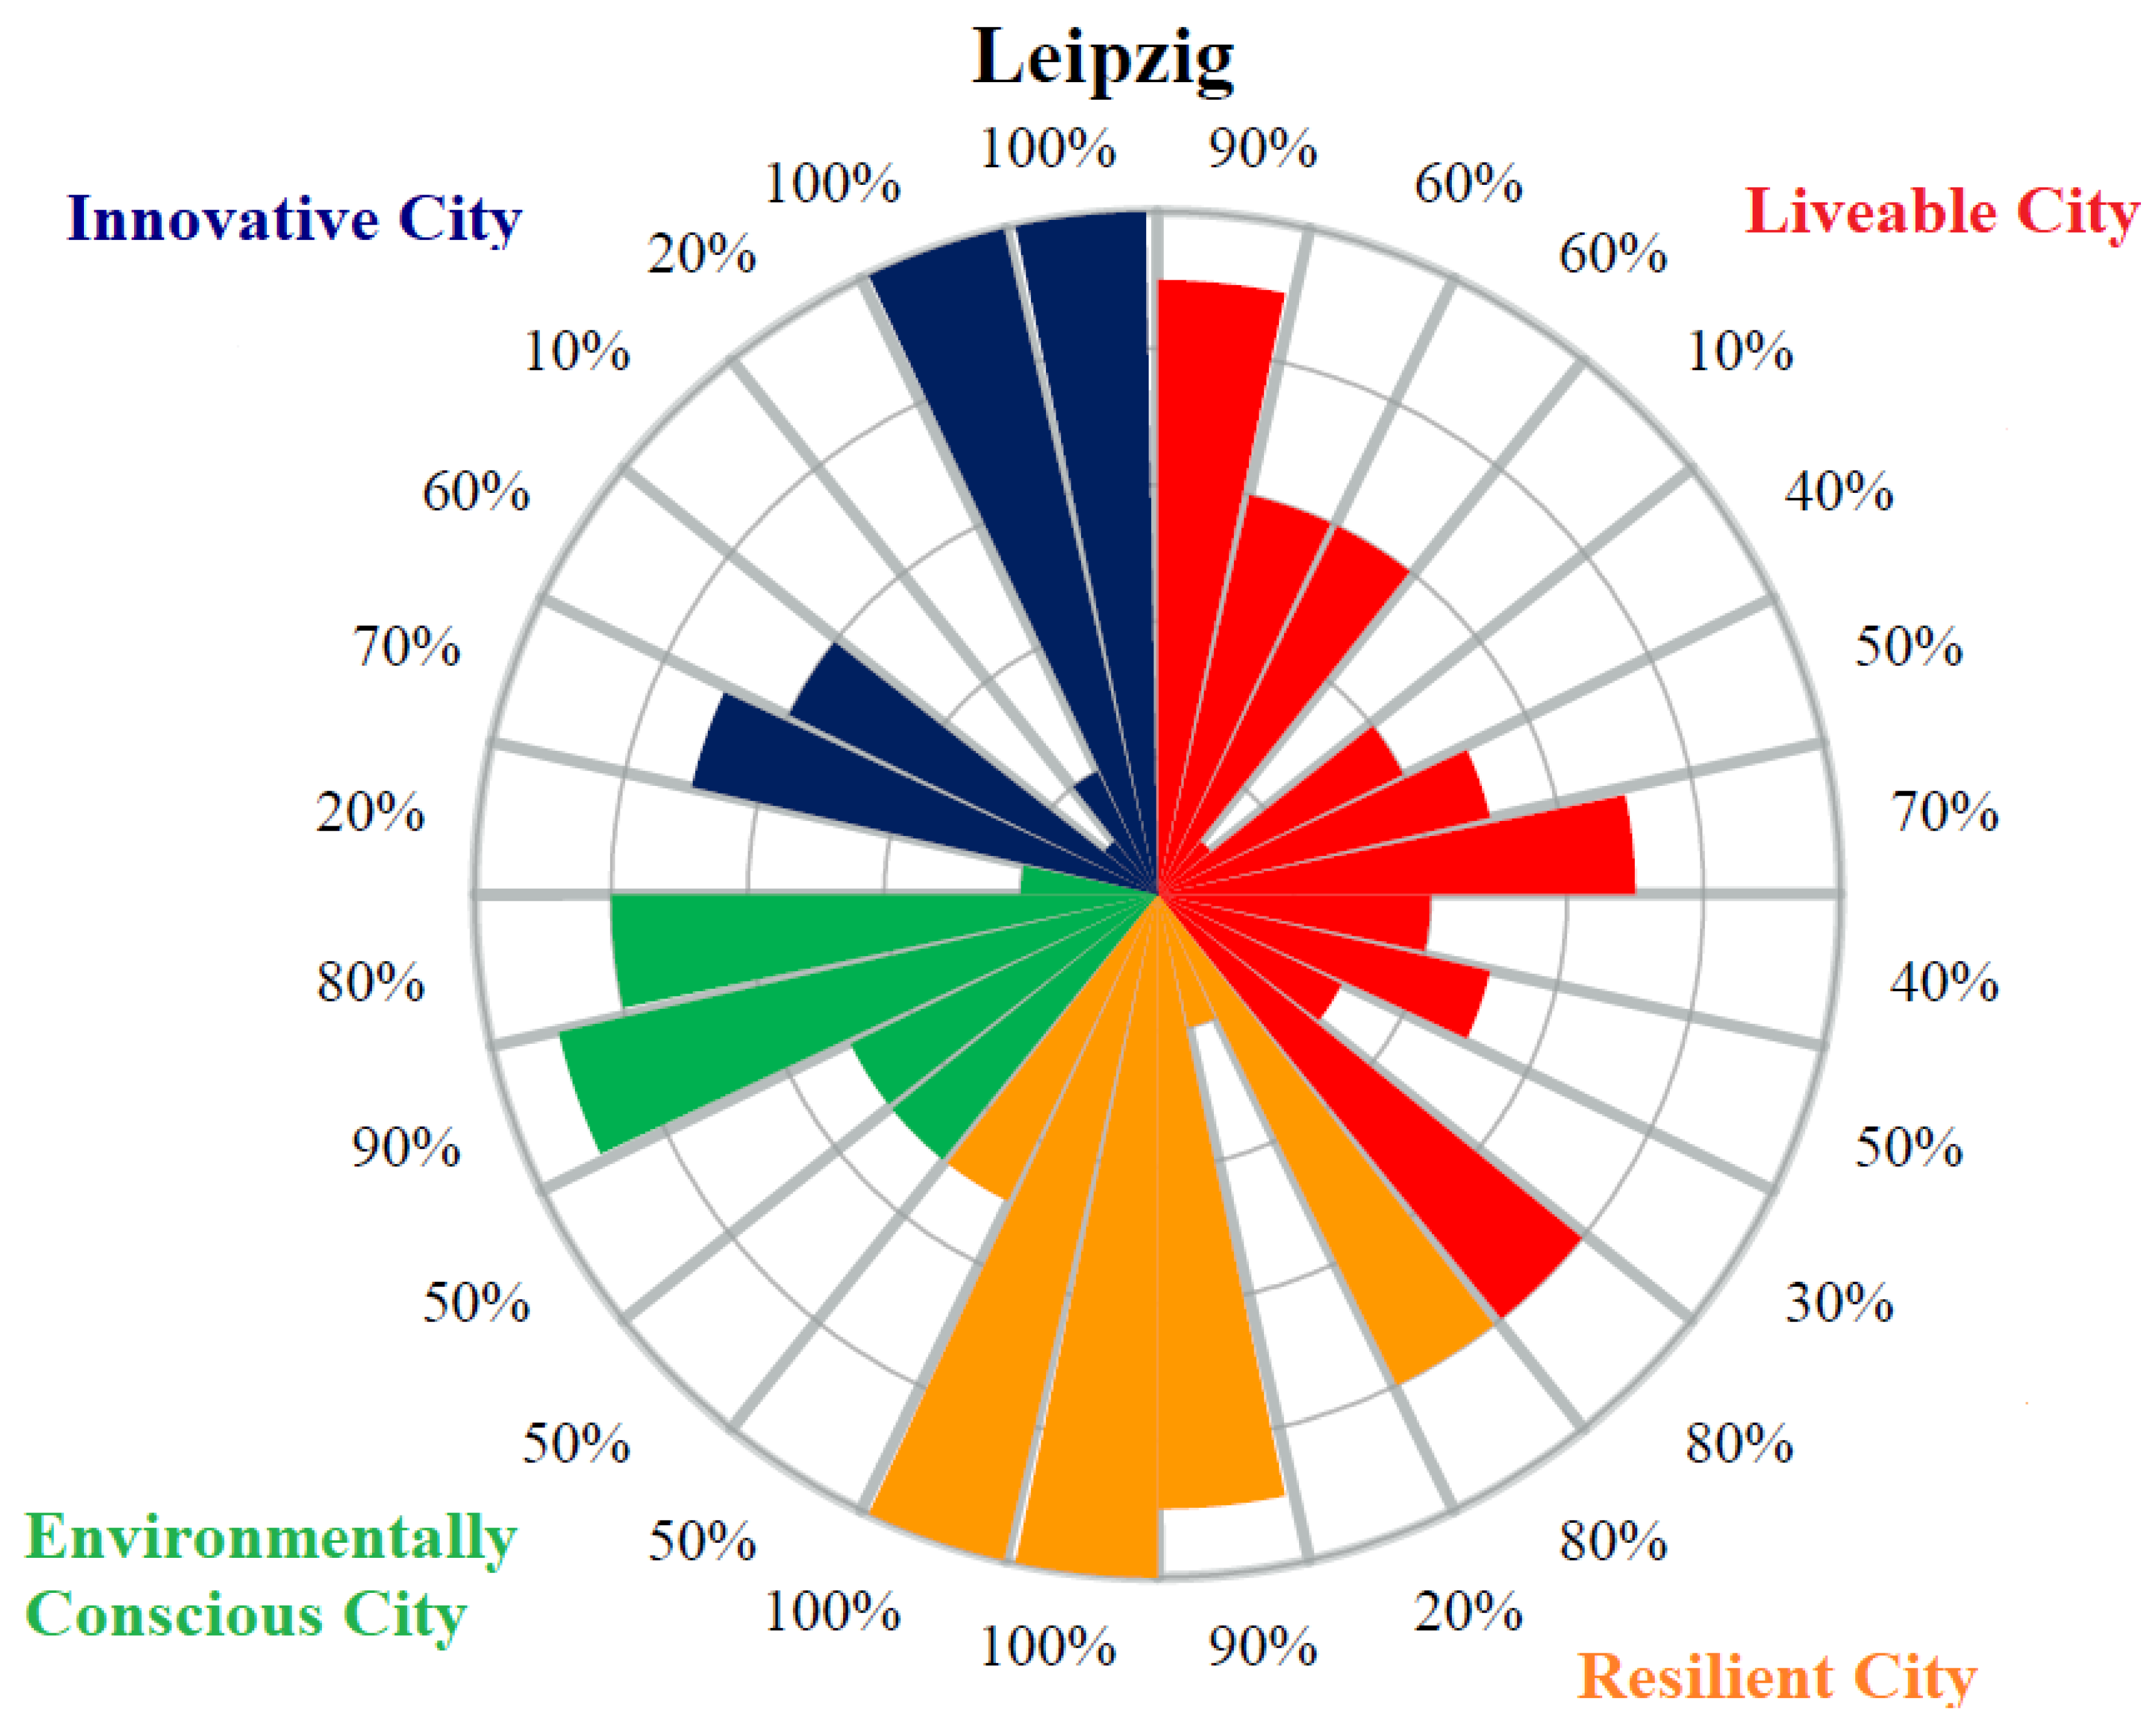
Below is the graphic representation of the City Index assessment [
19] done for Leipzig, one of the lighthouse cities in the SPARCS project.
Interpretation of the Research Results
Liveable City
In terms of quality of life, Leipzig hits exactly the middle of the scale, with individual factors being quite extreme: On the one hand a very low poverty rate (1.1%) and quite favorable rents, but one the other hand one of the highest unemployment rates (within Germany). The bad access to medical care and polluted air contribute to low life expectancy—with 80.3 years Leipzig lies in the middle of the lower third of the scale. Despite the small number of cars, public transport only has average usage, the situation for cyclists is quite positive from the perspective of the citizens. Another plus is the high amount of green and water surfaces within the city.
Resilient City
The city has a rather low debt level, but is very strongly dependent on subsidies from outside—with 58% of self-financed expenditures. The economy is well diversified. In such areas as “risk management” and “disaster control” Leipzig does well, and the city is already thinking about a new Climate Adaptation Strategy.
Environmentally Conscious City
With a low waste volume of 291 t per head (average amount = 430.14 t per head), a rather low water consumption of 121.80 L per person per day (average amount = 120–123 L) and CO2 emissions 6.62 t per head (average amount = 8.4 t) Leipzig scores well as an Environmentally Conscious City. The share of renewable energies is expandable (30%); the same applies also to the recycling rate—only 38% versus the average of 45%.
Innovative City
In the area of innovation, Leipzig is in the top third of the scale and offers good conditions for research and experimentation. There is an above-average number of newly founded companies, but the number of highly qualified jobs and patents can still be increased significantly. Due to the relatively high number of city inhabitants, the student share is 6.59% which is quite low.
The idea behind the Morgenstadt Framework is to create a tool-kit for the collaboration between cities, industries and research institutions. Developing the model, the Fraunhofer researchers witnessed several challenges that industry and businesses are facing while working together with cities: A single company can never meet the needs of a city, nor can a city implement innovative solutions without cooperation from business partners from different sectors. The Morgenstadt Framework is designed to address these challenges with a new collaborative approach: to initiate and accelerate the long-term transformation of cities into sustainable urban systems, and to thereby create both international and Germany based reference projects on the city-level.
2.3. Connected Solutions and Benefits Model (Alanus von Radecki)
To further deepen the understanding of the scaling process of smart city solutions, the connected solutions and benefits model was suggested by Alanus von Radecki and first used in the Triangulum project [
20]. The basic principle behind the replication of smart city solutions lies within economies of scale [
21] meaning that the cost advantage for a company increases with the increased output of goods or services. However, the conventional business models of scaling would not work with smart city solutions.
There are two general approaches which describe the cost-benefit relations in energy economics:
The efficiency model, where the technological innovation itself is able to reduce external costs and to increase the socially efficient allocation through a free market allocation of money and technology at the same time; An investment is made into a key technology or solution (e.g., an efficient LED-light bulb) because the increased efficiency of the technology leads to (energy) savings over time which, in turn, leads to lower energy costs for operating the light bulb. After a time period the investment has paid itself off and money is saved.
The policy model, where the government closes the gap for the investor with a subsidy or a regulation that makes investments into the desired technologies more profitable than investing into conventional alternatives, and therefore provides an economic rationale for incentivizing investments into clean technologies and for developing the markets of green tech. We encounter it, for example, when governments provide subsidies for desired technologies (e.g., solar- and wind energy, electric vehicles etc.), or regulate the market through taxes and fees (e.g., for polluting cars).
With digitalization and clean and efficient technologies starting to take off, a third economic model becomes viable, and it is intrinsically linked to smart cities.
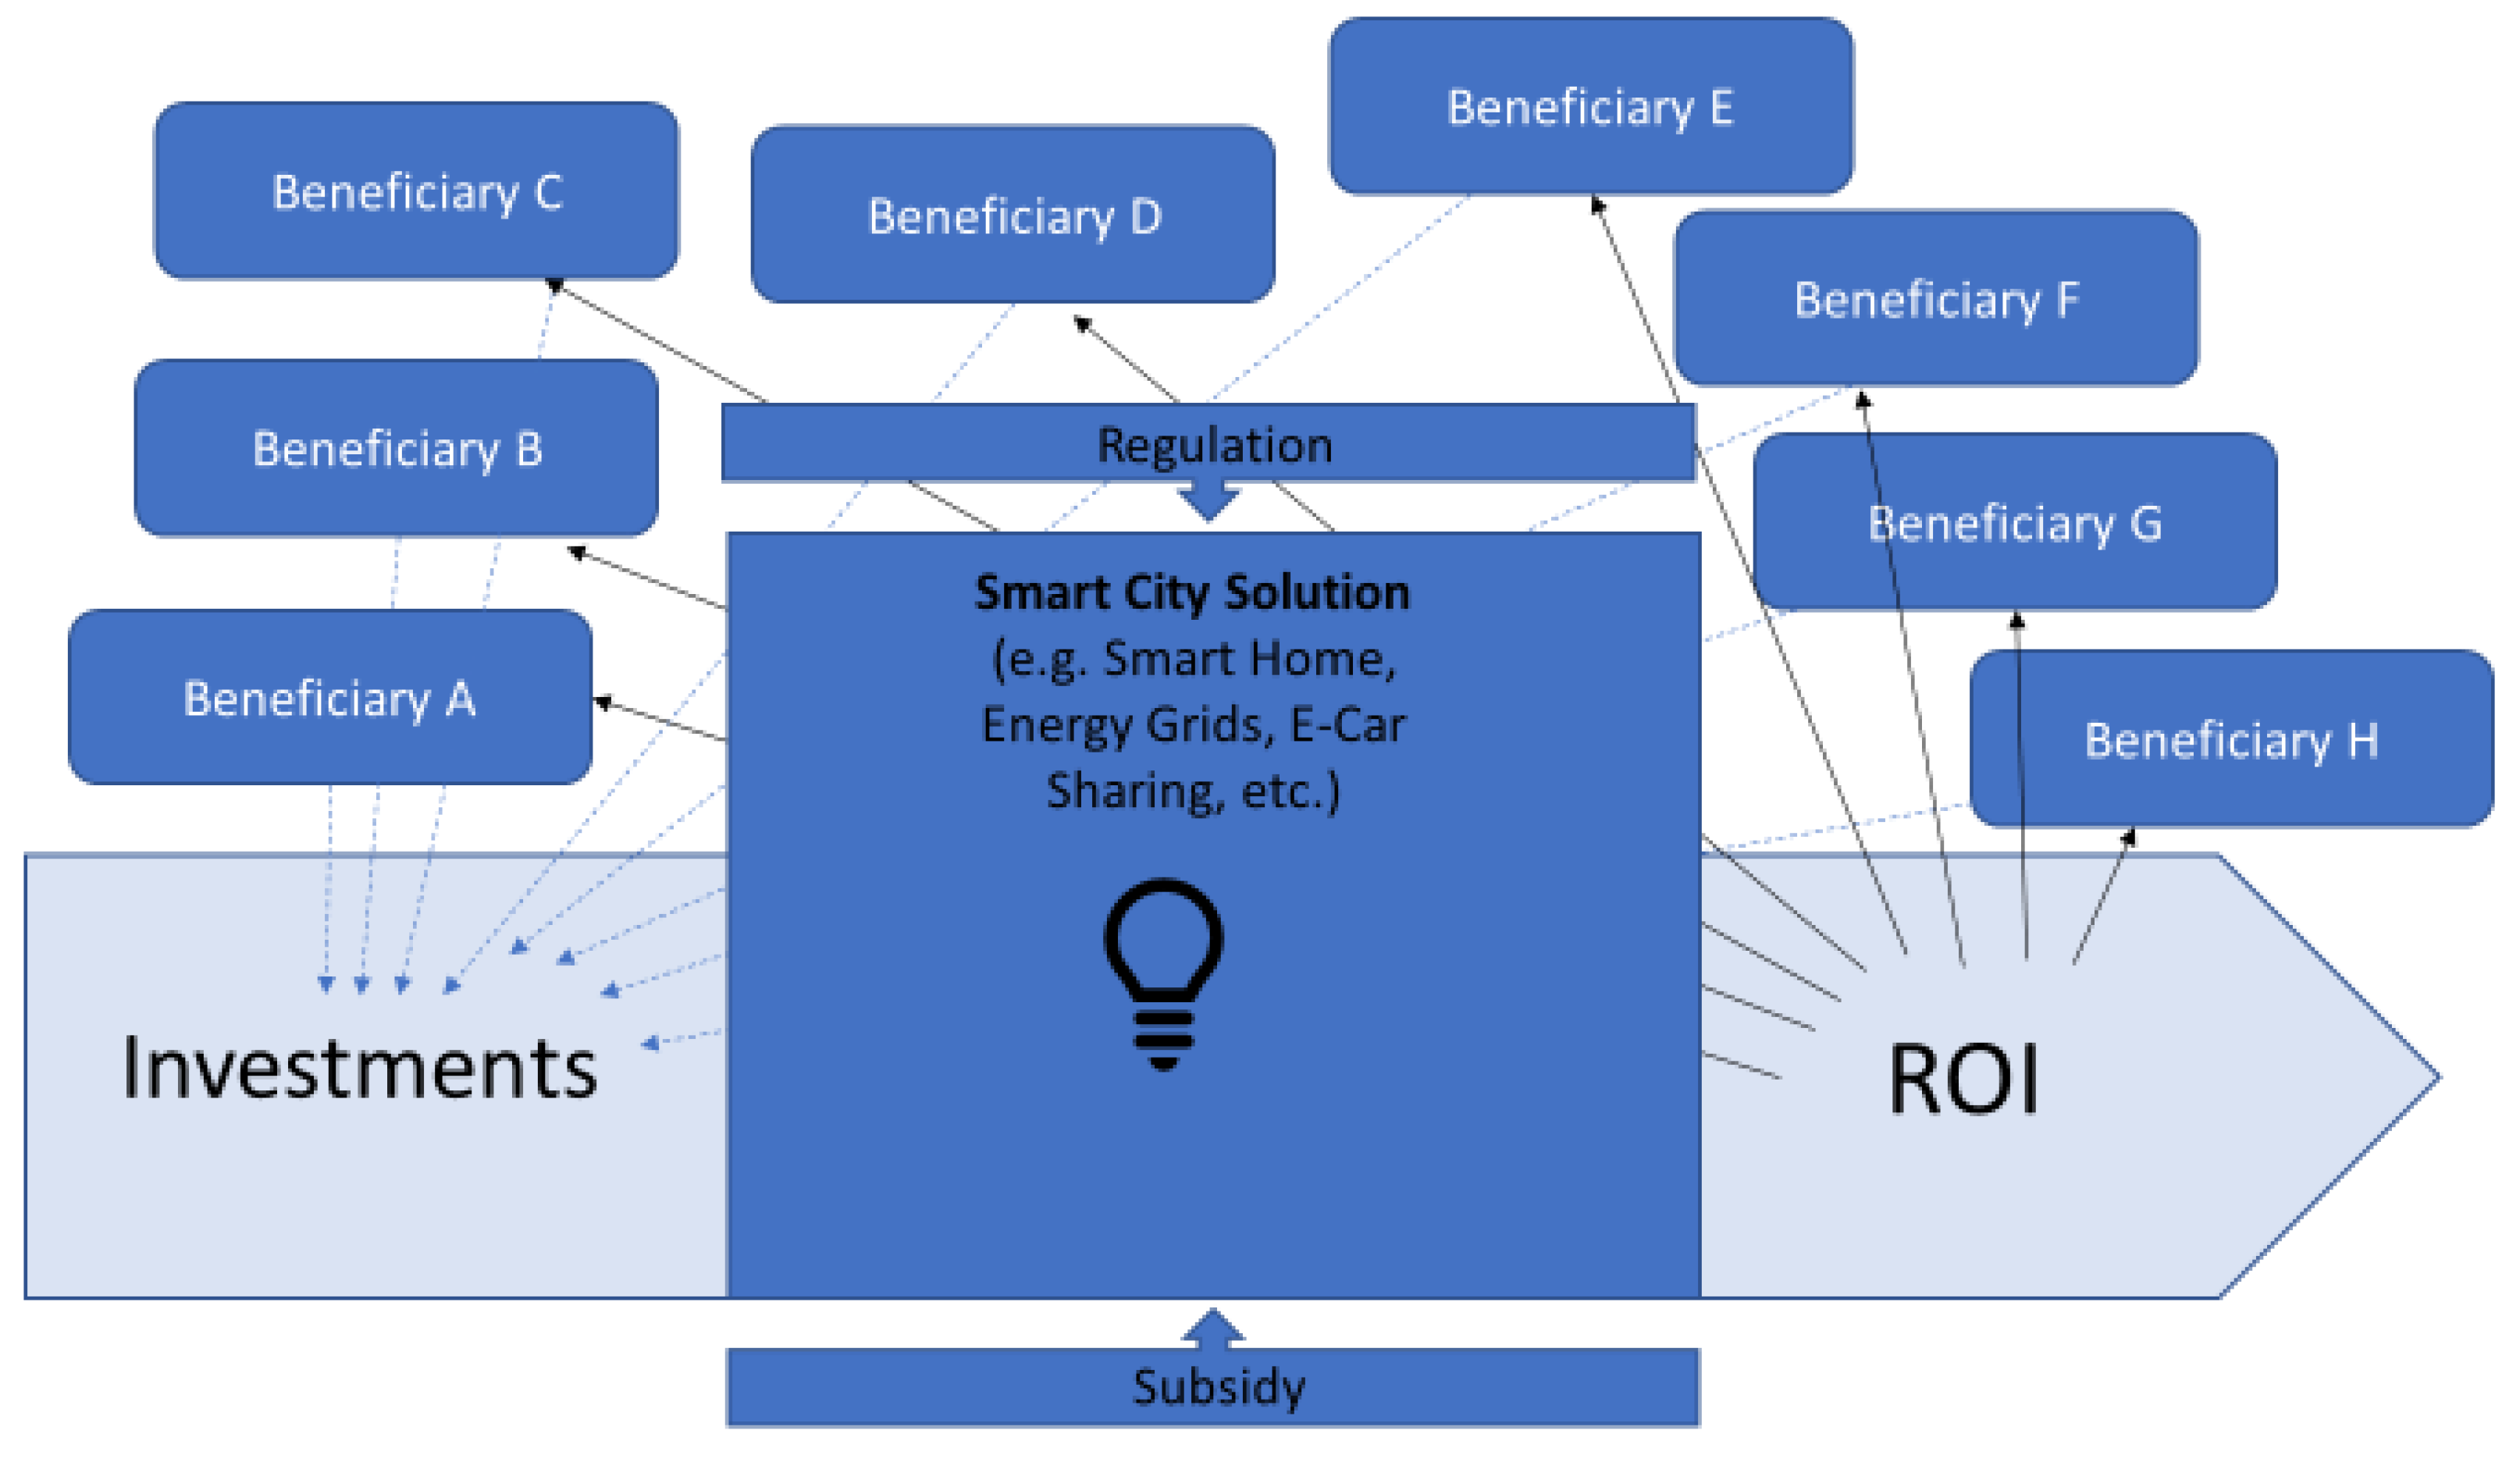
The connected solutions and benefits model is a new economic paradigm to link the value creation of integrated socio-technical systems to a set of different beneficiaries and types of benefits. For example, an electric car-sharing solution reduces noise in cities, frees up urban space, reduces emissions and increases personal mobility for everyone. A hybrid district energy grid reduces fossil fuel consumption, maximizes clean energy use, achieves cost effective production use and storage of energy through intelligent balancing schemes and increases the livability for city dwellers that have electricity and heat at their demand at any time.
The basic concept for leveraging the additional value of connected solutions lies within identifying all the additional benefits that come on top of the conventional efficiency model, therefore all benefits the solution creates for a range of different stakeholders, need to be identified in a first step.
The identified beneficiaries then invest their money (or use corresponding investment schemes) into the solution proportionally to the benefits that they will achieve. Usually a large part of the required return of investments (ROI) will already be generated through the efficiency model. Therefore, it is estimated that the identified beneficiaries will only need to invest a smaller share of their own estimated benefits (10–30%), making the solution highly attractive to a range of beneficiaries (see
Figure 4).
The main problem with distributed benefits and shared investments is the risk that is connected to achieving the benefits. It means that prospected benefits of smart city solutions need to be proven under reproducible circumstances in order to convince future beneficiaries to become smart city investors. This makes the connected solutions and benefits model firmly linked to smart districts—places where the positive effects of a connected solution can be proven, and where many different beneficiaries are able to create different kinds of value through the interaction of many systems and people.
3. Case Study: Demonstration District “Leipzig-West”
The following section presents preliminary technical results for a particular smart district case study in Leipzig within the framework of SPARCS, an EU-funded Smart city project [
22]. An economic analysis of the case study is out of scope for the paper at hand. A short introduction is provided for the energy related parameters of the demo district and the applied operational framework (
Section 3.1). Next, additional data are derived and pre-processed for the application of an optimization model (
Section 3.2). In
Section 3.3 the modelling results as well as deduced indicators are presented and discussed. Finally, the technical perspective of an upscaling of the demonstration district in Leipzig is outlined considering potential challenges and limitations.
3.1. Introducing the Case Study
As part of the SPARCS project, the city district “Leipzig West” is transformed into a smarter, more interactive district. To enable this process multiple deliverables are defined for the project [
22]. The overarching goals comprise the set-up of a Virtual Power Plant that also embraces the integration of a community energy storage as well as community demand response measures. Additional tasks include the provision of energy services for prosumers supported by the blockchain technology, enhanced by ICT applications and user interfaces for electricity consumption monitoring.
One main element of SPARCS is to show pathways for a decarbonization of district heating. The demo district is characterized by social housing units that make up the multitude of apartment buildings. For construction of new development areas or retrofitting of existing areas multi-criteria decision making methods can be applied to achieve an optimal, energy efficient building/district design [
23]. As the demo-district is made up of existing, recently retrofitted buildings, a renovation is not a viable option. The demonstration activities should enable the provision of heat based completely on renewable energy for those properties in the area that are connected to the heating grid infrastructure. For the demonstration district this condition is met by seven apartment buildings with a total of about 300 tenants, owned by the municipal housing company. According to the housing service provider, the total demand for heating and hot water supply is approx. 1300 MWh each year.
Among other measures, the installation of renewable power generation plants on the supply side of the district heating system can support the complete provision of renewable heating energy to the system. The municipal utility, Leipziger Stadtwerke (LSW), as owner and operator of the district heating grid, has decided to build and integrate a solar thermal power plant for district heating purposes. Based on the planning, the site for the solar thermal plant will take an area of about 11 ha. The solar heat supply is projected to be 25–30 GWh per year, whereas the peak power will be ca. 30 MWp. In addition, a thermal storage unit will be installed nearby with a capacity of ca. 30 MWh. To model the demand and supply behavior of the case study’s energy system an Energy System Optimization Model (ESOM) is used (see
Section 3.2) [
24].
In [
25] a review and overview of currently existing definitions of PEDs and similar concepts is given and three PED-frameworks are defined. One of them states: “PED virtual—a district that allows the implementation of virtual renewable energy systems and energy storage outside its geographical boundaries. The combined annual energy generation of the virtual renewable energy systems and the on-site renewable energy systems must, however, be greater than the annual energy demand of the district.“
As the solar thermal power plant and the demonstration district are not in direct geographical vicinity, the solar thermal power plant must be viewed as a virtual renewable energy system in the above-mentioned manner. Furthermore, an annual surplus of regenerative heating energy over the district’s heating demand is expected. According to this definition the considered district of the case study is a virtual PED.
In Ala-Juusela et al. [
26] the concept of an energy positive neighborhood (EPN) is introduced, defined and operationalized. For this case study, the key performance indicators (KPI) that have been developed for the operationalization of EPNs will be applied. This includes KPIs for the so-called Onsite Energy Ratio (OER), Annual Mismatch Ratio (AMR), Maximum Hourly Surplus (MHS), Maximum Hourly Deficit (MHD), and Monthly Ratio of Peak hourly demand to Lowest hourly demand (RPL). For calculating the first KPI the annual values of energy production and demand are sufficient (The KPIs are defined and measured for several forms of end-use energy, e.g., heating, cooling and electricity. We focus on heating energy in this study). However, the majority of the KPIs require input data with a higher temporal resolution, i.e., hourly values.
3.2. Input Data and Model Setup
Within this section we present a modeling approach to analyze the projected impact of the solar thermal plant on the decarbonization efforts of the demo district. In doing this, the analysis can be abstracted from the estimated date of commissioning of the plant in 2023. Moreover, the heat demand is virtually balanced against the hourly solar heat generation, enabling the calculation of district specific KPIs. In practice, the generation portfolio of the district heating system consists of several gas-fired cogeneration units, gas boilers, and thermal storage units that impede a correct allocation of single carbon-free energy sources to specific parts of demand-side.
In the first step, the input data for the modeling exercise have to be prepared. Regarding the demand-side, the annual heat demand as settled is disaggregated to derive an hourly demand profile of the relevant buildings in the demonstration district applying the Hellwig procedure [
8]. This method was developed at the TU Munich in cooperation with multiple natural gas suppliers to estimate the demand of small customers and the resulting amount of gas distributed in the grid. It utilizes statistical load profiles of different customer groups to emulate the heating demand depending on ambient temperature and building parameters (age, number of tenants). Firstly, the annual heating demand is disaggregated to daily values using a normalized regression function. Secondly, the daily values are further disaggregated into hourly values by means of percentage factors contingent on ambient temperature, building parameters and the customer group, e.g., the private housing sector in this case.
With respect to the supply-side the solar thermal plant is characterized by the following technical parameters: peak power and total annual heat generation, number of solar panels, technological specifics of the system such as collector efficiency
and heat loss coefficients
,
, total aperture area
as well as the temperature level of the district heating system
—and environmental parameters—ambient temperature
and global irradiance
at the chosen location. Given those data the hourly thermal power output
of the plant is calculated considering the following physical relations, expressed by Equations (1) and (2):
with
According to Ecuation (2) the optical efficiency η decreases due to thermal losses through the temperature gradient between the fluid inside the solar collector and the ambient temperature
as well as the transmission losses that occur through reflection at the collector’s surface. Given the hourly temperature and irradiance data from the “Deutscher Wetterdienst” for the specific location, we simulated an hourly heat output of the solar thermal power plant. [
27]
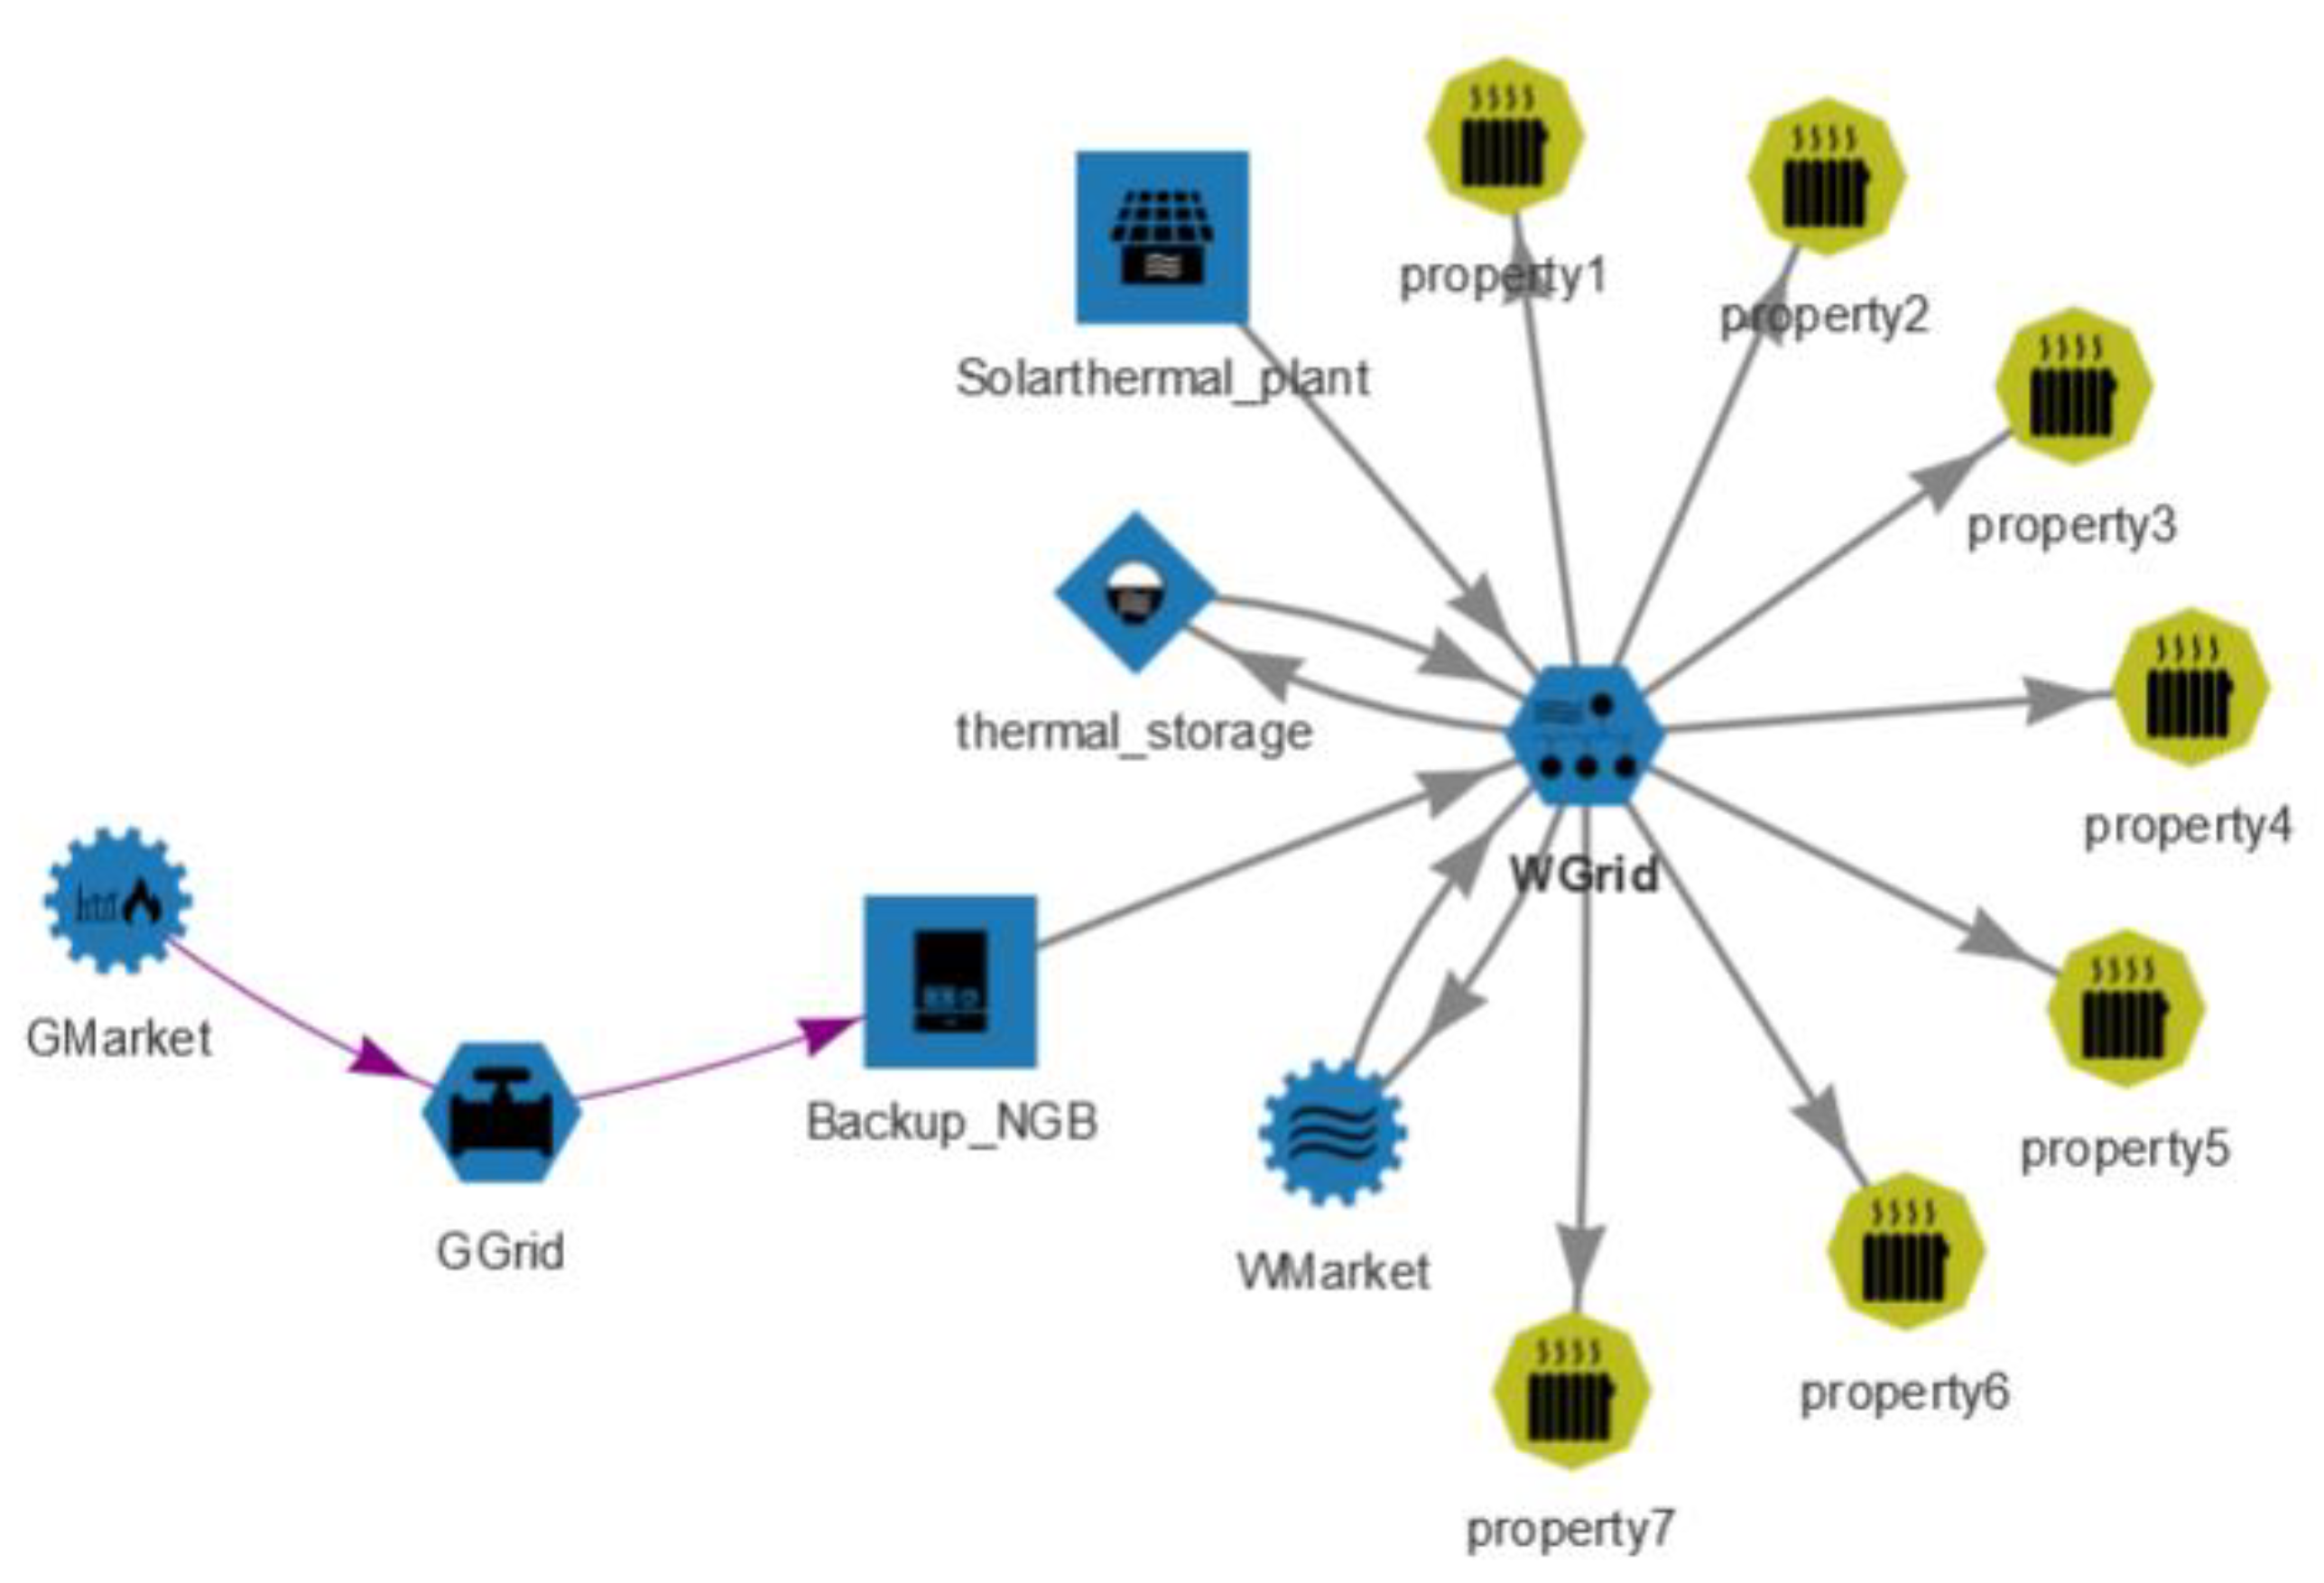
In a second step, the input data are transferred to a modeling toolbox establishing the specific energy system model of the demo district. The modeling framework IRPopt (Integrated Resource Planning and optimization, version hash: 847078050cdd3535be63d564bae71b49c6b1f741; by University of Leipzig, Leipzig, Germany) is an actor-oriented techno-economical optimization program that enables the modelling of a wide variety of different energy systems. [
28]. For this case study, the demand-side (property 1–7) is linked with a balancing entity (WGrid) to reflect the district heating system that is fueled by the solar thermal plant (see
Figure 5). In addition, a thermal storage and a backup facility are modelled to cope with the inter-temporal variability of the solar heat supply.
Through demand-side management (DSM), the temporal distribution of demand of the district heating system can be shaped at the municipal utility will to a certain degree. DSM utilizes the thermal storage of the buildings themselves to shift or reduce the heat demand of the customers without reducing their comfort [
29]. In the demo district the technical requirements for DSM are not met. However, prospectively technical adjustments that enable DSM are possible. As a means of consideration of this possibility, the surplus thermal storage present in the system can be viewed as a proxy for DSM. Through a sensitivity analysis of the thermal storage capacity and the foresight horizon, the impact of further flexibility through storage or DSM is considered. Accordingly, the thermal storage varies from 10 MWh to 100 MWh whereas the optimization horizon which denotes the accuracy of the forecast horizon for the system operator ranges between two days (48 h) and one year (8760 h). As a reference case, this study assumes a thermal storage size of 30 MWh and an optimization horizon of 48 h.
3.3. Modelling Results and KPIs
The model output includes first and foremost the thermal energy flow between the implemented components in an hourly resolution for the reference case and the sensitivities. Based on the energy flow for one entire year the KPIs can be calculated and interpreted.
The Onsite Energy Ratio (OER) denotes the overall balance between renewable heat supply and the demand as annually aggregated values in relation to one another. For the case study the OER is 13.93, i.e., the solar thermal energy exceeds the demand almost fourteen-fold. The Maximum Hourly Surplus (MHS) and Maximum Hourly Deficit (MHD) measure by how much the hourly supply maximally exceeds the demand and vice versa. For calculating these KPIs, the hourly zero carbon heat supply and demand is balanced and normalized to the demand or supply, respectively. As a result, the MHS for the case study is 1028.33, reflecting that the supply exceeds the demand by that factor at a certain point in time. Conversely, the MHD is 20.89 indicating that the demand overshoots the supply by a factor of 20.89. The RPL denotes the maximum monthly ratio of Peak hourly demand to Lowest hourly demand. For the demo district the maximum demand ratio arises in the month of June, it is 17.76. It should be noticed that the sensitivity analysis has no influence on these four KPIs, as the total sum of supply and demand do not change by varying assumptions on the storage size or the model foresight.
The last and most elaborated KPI proposed by VTT [
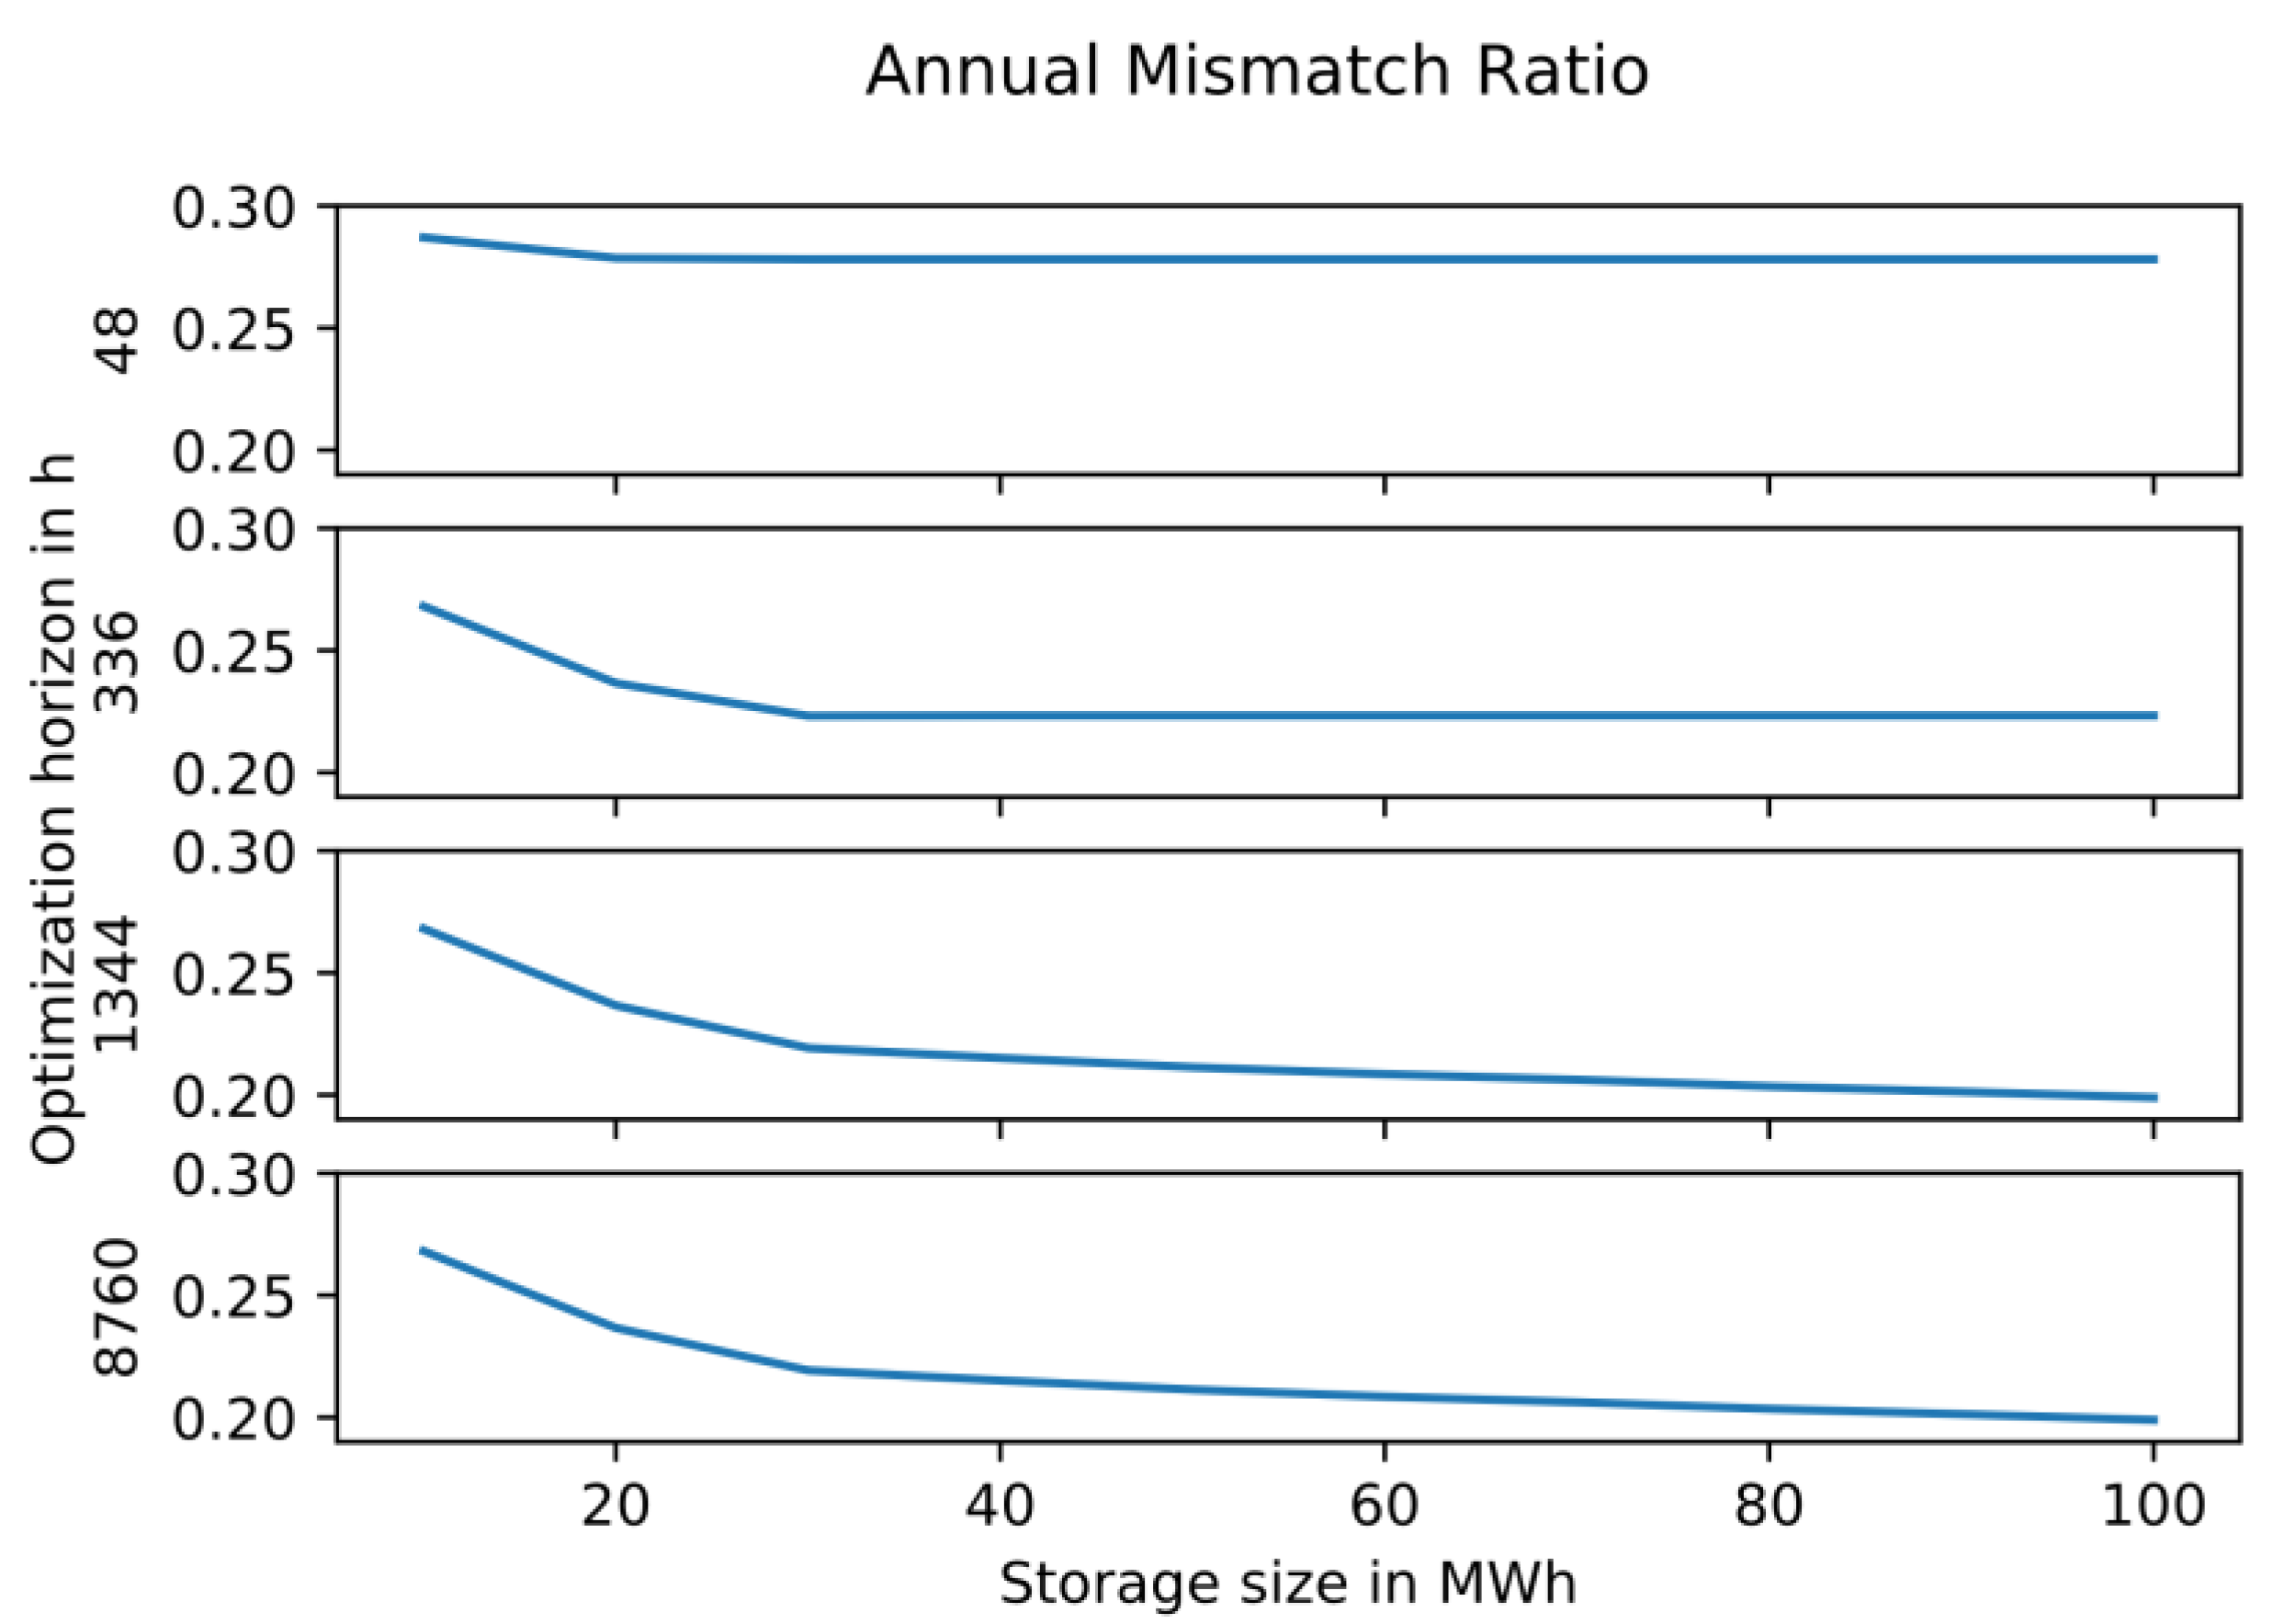
26] is the Annual Mismatch Ratio (AMR). For this ratio, firstly, the Hourly Mismatch Ratio is determined considering the state of charge of the storage and the demand and supply situation at every hour of the year. Secondly, the AMR is derived as an arithmetic mean of all HMR values. The AMR varies between zero—denoting a complete temporal simultaneity of energy generation and consumption—and one which hallmarks an entire mismatch of both determinants.
Given the reference case (30 MWh, 48 h), the AMR is calculated at 0.278. In
Figure 6 the impact of the sensitivity analysis on the AMR is visualized depending on thermal storage size (10–100 MWh) and optimization horizon (48 h, 336 h, 1344 h, 8760 h). It shows that lower levels of AMR are achieved with a larger storage in combination with enhanced forecast accuracy (100 MWh, 1344 h). However, enlarging the storage separately does not necessarily reduce the AMR as a shorter forecast accuracy impedes the possibility to utilize the storage. As an example, fixing the optimization horizon at 48 h or 336 h, respectively, a storage capacity larger than 20 MWh or 30MWh, respectively, does not yield a further decline of the AMR.
The KPIs are able to provide a first impression on the technical challenges of the specific energy system. Based on the OER, the total solar heat supply suffices to cover the total demand given. However, a higher temporal resolution reveals the daily or seasonal volatility of the heating demand of the buildings in each single month (RPL). Additionally, the MHD and MHS indicate that the solar heat overshoots the energy demand by several magnitudes and vice versa. And finally, the AMR clearly quantifies the amount of mismatched energy for the use case at hand. For the reference case there is an energy mismatch of 27.8%. By expansion of the storage volume and an improvement of the forecast horizon, this KPI can be reduced to 20%. The mismatch is triggered by the generic properties of the solar irradiation and the heat demand profile of private households in general. The installed thermal storage can be utilized as a short-term storage, to account for the time-shift between supply and demand peaks.
In the future, more housing properties in the demonstration district “Leipzig West” may be connected to the district heating system. LSW also plans to install room thermometers in the district′s buildings to gain more insight into the heating behavior. The municipal utility company also develops an application to supply tenants with further information about the energy consumption and connected savings potential which may serve as a gateway to future DSM-activities. On the other hand, more or different regenerative heating solutions may be added to the district heating system, changing the structure of the demo districts energy consumption and generation and thereby the KPIs. The upscaling of the demand and supply side of the district’s heating energy is partially explored in
Section 3.4.
3.4. Upscaling of the Demonstration Project in Leipzig
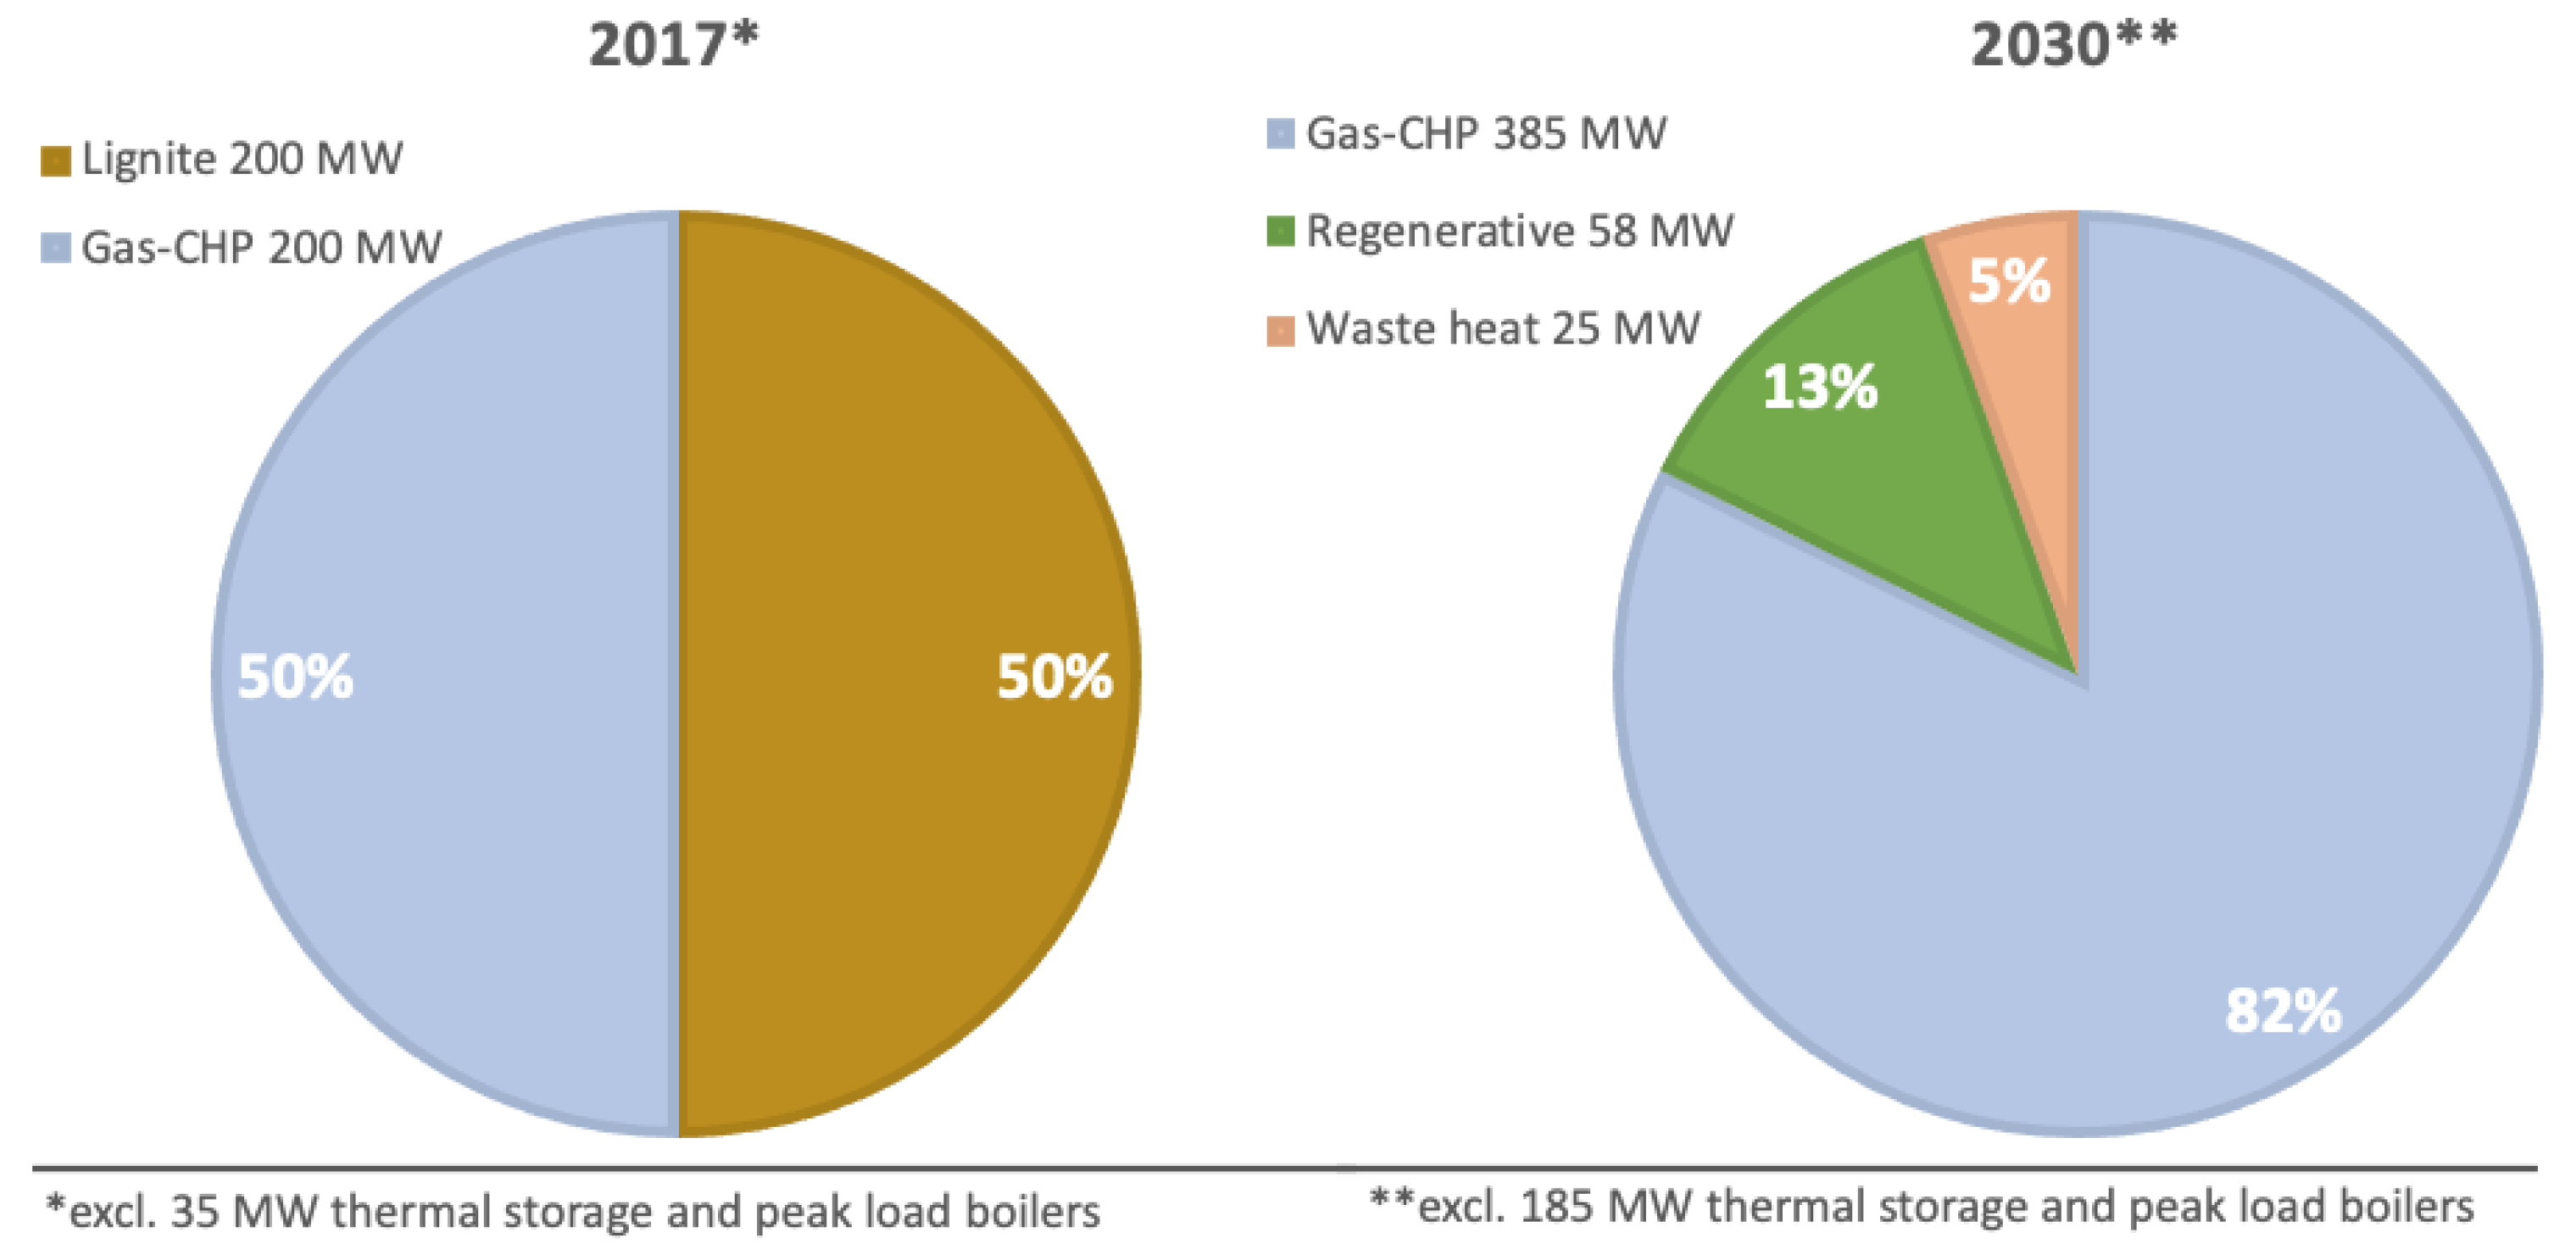
As of 2017, Leipzig’s district heating system relies entirely on fossil energy sources (see
Figure 7). However, over the next years LSW is planning to increase the share of the regenerative heating energy production. The solar thermal power plant covered in this case study is a first step on the transition pathway. However, the mid-term strategy for 2030 requires additional investments in net zero carbon technologies for the district heating system. One option is to scale up the solution introduced in this case study’s demonstration district.
From a theoretical standpoint, the design of a pilot project is essential for the success of the scaling. Moreover, “pilots should be designed in such a way that they could be scaled up, if successful, and so that key factors which will be necessary for a scaling up decision—with what dimensions, with which approach, along which paths, etc.—are already explored during the pilot phase.” [
31]
3.4.1. Applying the Model of van Winden
The replication model of Willem van Winden (
Section 2.1) can be applied to the upscaling process in Leipzig based on the demonstration district covered in the case study. Firstly, the upscaling Type 1—Rollout is considered. For a market rollout of solar thermal plants, the state-of-the-art technology does not have to be challenged and no new partnerships or organizational changes are necessary. In this context, it entails identifying additional districts connected to the district heating system that can potentially be supplied by the planned solar thermal power plant. The ongoing cooperation with the municipal property owner LWB ensures a smooth expansion process through repetition.
Secondly, applying an Expansion according to Type 2 of upscaling, further partners are added to the process. Regarding the demand-side, owners of existing buildings or property developers of new living quarters should be convinced to be connected to the district heating grid. Alternatively, a so-called geographical supply expansion is considered. For this approach, new properties have to be identified that fulfil the technical and geographical requirements for the installation of further solar thermal power plants, e.g., distance to the district heating grid.
The third option for upscaling the solution, a defined replication, is discussed in
Section 4 of the paper at hand.
3.4.2. Challenges, Limitations and Alternative Solutions
Solar thermal plants rely on the local irradiation mainly and require only minor auxiliary fuels to run the pumps for heat generation. Thus, the operational cost in cent per kWh is relatively low whereas investment cost (€ per kW installed capacity) is quite high in comparison to natural gas boilers. A recent case study in Vienna reveals that similar large scale solar thermal plants would not be economically viable without a subsidy [
32].
To increase or enable the economic feasibility of the project, it is important to identify viable business models from the beginning [
33]. One possibility here is the introduction of special heating tariffs to the district heating customers by LSW. The cost of a special tariff can exceed the usual heating tariff cost while offering the customer the opportunity to contribute to a sustainable future. Research on household preferences shows that customers′ willingness to pay for district heating from renewable sources proves to be larger than for other heating options [
34]. The special “green” tariffs can ensure a certain percentage of regenerative heat in the generation mix. In this case, the heat provider has to ascertain that the sales of “green” heat do not exceed the energy produced by the solar thermal plant in balance. (As district heating is a monopoly market for technical reasons, the price can basically be chosen freely. However, there is a danger of customers being dissatisfied or switching to other forms of heating, for which high market entry cost have to be paid.). As district heating is a monopoly market for technical reasons, the price can basically be chosen freely. However, there is a danger of customers being dissatisfied or switching to other forms of heating, for which high market entry cost have to be paid
Other business models on the topic of solar thermal heating—like public, financial participation or custom-made heating tariffs for commercial customers—have been developed in recent years and can further enhance the project’s feasibility. [
35]
The expansion of the district heating grid infrastructure plays a major role for the upscaling of the heat demand, where multiple issues can arise. The district heating system is a complex technical system, extensions have to be carefully planned both from a technical and economical perspective. Considering a yet unconnected district for linking to the system, the following aspects should be taken into account: The district should be preferably in close geographical proximity to the existing system. Furthermore, the grid operator should be aware of the city-wide distribution of heating demand [
36]. Districts identified for integration featuring a high demand potential are also financially attractive. Lastly, it is also significant to be aware of socio-economic factors in the considered district. An evaluation on relevance of players and the willingness to switch to district heating, including exploration of possible partnerships or conflicts of interest should be done beforehand.
The results of the case study suggest some limitations for the heating solution. As elaborated in
Section 3.3 the energy production of the solar thermal plant does not coincide with the energy consumption of the customers completely. This temporal mismatch cannot be solved by scaling up the supply and demand through roll-out or expansion. If scaled-up to the entire city of Leipzig, the AMR (
Section 3.3) would still remain at values comparable to the demonstration district. To improve the simultaneity of energy production and consumption other technologies or larger thermal storages have to be implemented in the district heating system. A methodology designed to find the most fitting optimization solution is introduced in [
37]. Here, an eight-step program is presented to support city planners in finding the energy performance solution to transform the considered city district into a PED.
Firstly, the baseline and structure of the considered district are analyzed, then possible energy performance measures are identified and economically evaluated. Based on this, the district’s energy demand is calculated and energy system alternatives are defined. Finally, a cost benefit calculation is executed and an optimal combination of the district’s buildings, energy performance and energy system measures is determined. [
37] The application of this methodology supports the identification of additional regenerative heating energy solutions for the demonstration district in Leipzig West, e.g., geothermal heat, biogas power plants, heat pumps powered by green electricity or thermal power stations powered by green hydrogen. LSW plans to incorporate some of the stated technologies into the district heating system in the future. [
38]
In the following section an insight into the upscaling on an international/ inter-city level is presented. The replication of the case study for SPARCS fellow cities will be illuminated, continuing the consideration of challenges and introduction of possible solutions.
4. Replication Challenges and Solutions in Fellow Cities
As part of the project, SPARCS lighthouse cities need to prepare and test the solutions which later can be replicated or adapted by fellow cities. Aim of this replication strategy is to simplify the application of sustainable solutions for the follower cities.
In the previous section we demonstrated how a city district “Leipzig West” is transformed into a smarter, more interactive district, and examined the challenges which may occur during the upscaling of the district in the city of Leipzig.
In this section, we will see how the replication process in SPARCS is organized, how the demo district fits into the SPARCS replication strategy (
Section 4.1), which challenges can occur during the adaptation of the demonstrated solution and what strategies can be applied in order to overcome those (
Section 4.2,
Section 4.3 and
Section 4.4).
4.1. Replication Process in SPARCS
The replication process in SPARCS is based on the Morgenstadt assessment framework and divided into the following steps:
Phase 1. Preparation: creating an individual city profile highlighting the drivers, barriers and opportunities. This phase includes the desktop research and preliminary analysis, as well as the selection of the experts and team members.
Phase 2. Understanding: detailed analysis of specific sectors relevant to SPARCS (e.g., energy—see below). This phase consists of the analysis of strategic documents and plans of the city relevant to the energy sector and the data collection through online research and desktop analysis with the following identification of the gaps.
Phases 3 and 4. Co-creation and Design: the goal of this phase is to formulate sustainability solutions for the city followed by the implementation plan. Ideally, the solutions are already developed and tested in the Lighthouse cities.
Since the SPARCS project is focused on energy and related impacts (e.g., building), a carefully considered selection of indicators and action fields from the original framework related to these sectors was carried out. For the detailed assessment of the energy sector the cities are presented with an indicator selection as seen in
Table 3. These indicators assess municipal energy generation and distribution with respect to renewables share, networks for intersectoral resource sharing and the existence of district heating. The cities then could choose those indicators that are most relevant for them or have a consistent history of data collection.
By comparing a subset of the indicators from three other cities—Reykjavik, Kladno and Maia—and evaluating them—we can make some assumptions and suggestions for further replication (
Table 4).
Reykjavik performs well in the energy sector: 100% of energy demand is covered by renewable sources, and 100% of heating demand is served by district heating systems. However, one area for improvement is decreasing energy use per household. This can be done by installation of smart meters, sensors, time switchers and other demand-management technologies as well as building refurbishment.
Maia also demonstrates a good degree of sustainability in its energy and electricity provision: The share of demand covered through renewable energy is 26.5%. However, to reach the target of complete decarbonization, this share could be increased. The measures that could be taken are, for instance, installing solar panels on the residential buildings, or conversion of the automobile fleet to electric mobility. Additionally, the city of Maia could concentrate on the holistic promotion of renewable energies and raising the awareness of energy saving measures among the citizens. Investors can be motivated to install or use renewable energies in new buildings or when refurbishing them with new strategic pilot projects.
In contrast to this, the performance of Kladno in the energy sector has a lot of potential for improvement. According to the energy indicators presented in
Table 4, only 4.75% of electricity demand is covered by renewable sources. The city’s main energy supplier providing 343 MW electrical capacity and 173 MW thermal capacity is a coal-fired power plant [
39]. Even though the location of the power plant allows for disposing of most of the generated pollutants outside the city, the global environmental effect of using coal as the energy source cannot be ignored. Thus, the city should first and foremost focus on expanding the share of renewable energy sources on energy consumption supported by energy efficiency measures, e.g., building insulation, to reduce the security margin on thermal capacity and temperature levels of the district heating grid.
If we now examine whether the solution demonstrated in our case study (
Section 3) can be adopted by the fellow cities it becomes evident that Reykjavik’s energy demand is already completely covered by renewables and Maia does not possess a district heating system which is a crucial element of Leipzig’s solution. The solar thermal plant, however, suits Kladno as it gives the city an opportunity to increase the share of renewable energy generation supplying the district heating grid.
Which possible challenges can occur during this replication?
According to van Winden’s model (see
Section 2.1) this type of replication falls into the Type 3—the most complex type of scaling—as the solution needs to be replicated in another context (another country and city) with possible legal-, organizational- or partnership-related obstacles.
4.2. Legislation Barriers for Replication in Kladno
In order to combat CO
2 emissions, the Czech Republic/Czechia created the ’National Energy and Climate Plan’. It aims to meet EU targets and announced to reduce its total greenhouse gas emissions by 30% by 2030 compared to 2005. This decarbonization goal also includes the shift to renewable energy sources. In the Czech Republic’s/Czechia’s previous “Energy Action Plan”, it set renewable energy targets for 2020. It aims to meet 14% of the heating and cooling demand by renewable energy sources by 2020 and 22% by 2030. Additionally, 14% of the electricity demand shall be produced by renewable energy sources and 11% of the energy demand in the transport sector stem from renewable sources by 2020 [
40].
Even though the legislation package in Kladno looks particularly well in terms of the promotion of renewable energies, the policies supporting renewables are still to be implemented. In August 2013, the Czech Parliament amended Act No. 165/2012 (Act No. 310/2013 Coll.), which de facto abolished the feed-in tariff scheme for all technologies except small hydro since the end of 2013. New PV installations and biogas plants are only being supported if put into operation before 31 December 2013 (§ 4 par. 10 Act No. 165/2012) [
41].
According to the EU Smart City Information System, at present rather ordinary and sub-optimal solutions are commonly being implemented in smart city projects only because the initial (and better) solution was blocked off by legal bottlenecks [
7]. This diminishes the effect of the replication, affects the development of performant business models and as a result slows down the process of driving cities towards sustainability goals.
Coming across such legislation and/or regulatory bottlenecks, policymakers need to be aware that changes in legislation will take time and involve social, cultural, political, institutional and behavioral changes that are very context sensitive.
4.3. Challenges Related to Stakeholder Engagement
In order to make the solution appealing to potential investors, the Connected Solutions and Benefits Model (see
Section 2.3) should be applied, relating the economic impact to the projected social benefits and making the solution more attractive to a variety of beneficiaries. Mutual understanding is a key factor to exploit potential cooperation with investors and relevant stakeholders (e.g., developers, distributors, engineers, spatial planners). Even though Positive Energy District might seem like a logical and understandable concept, for citizens or potential partners who are not very much familiar with modern approaches in the energy sector it is necessary to explain the concept in a short and structured way.
Demonstrating the purpose and potential social benefits of the PED (a comfortable living space, a well-organized recreational area, modern urban services for citizens, opportunities for entrepreneurship, etc.) is crucial for negotiations with the relevant stakeholders and establishing a profitable business-model. Even district heating systems themselves are still only emerging in some cities and countries. People are skeptical about trying something “new” and “different” to what they are used to. If for example, the heat market is unregulated and has historically gained a bad reputation as inefficient, expensive and unreliable, it can be extra difficult to shift people′s perceptions [
38]. It is therefore important to engage (potential) customers as well as other key stakeholders at an early stage to facilitate the expansion of district heating and cooling systems.
4.4. Urban Planning Challenges
For PED replication, the urban area plays an important role. New development areas where no buildings exist yet are good prerequisites for spatial planning to steer PED replication, as the PED can be planned to integrate into other development interests of the area, prior to the implementation of the buildings and infrastructure. [
39] When a PED project takes place in existing urban environments, there is often a vast number of stakeholders such as citizens and building-owners. In this case, the replication process strongly depends on cooperation with stakeholders. Once the implementation area is determined, financial schemes or innovative business models for the deployment take place.
5. Conclusions
This paper contributes to the existing research on replication of smart city projects by investigating the common replication models and strategies. The paper also addresses several challenges that prevent positive energy districts from replicating effectively and proposes solutions to resolve them, using a specific decarbonization measure from the city of Leipzig as an example.
One of the key premises of the paper, as explicated in
Section 2, is the necessity of a profound replication planning and modelling to deepen the understanding of upscaling processes for smart city solutions, complemented by having a shared context for city-to-city collaboration. The three replication models analyzed in this article are able to provide a multidimensional representation of a potential solution for reaching PED status. Nonetheless, depending on the ambition of decision makers and the environmental conditions different types of replication are applicable.
Before implementing and commissioning the solution in the real-world, energy system modeling provides first insights into the technical potential of integrating renewable energy sources in combination with storage options. As minimum prerequisites of the analysis, we determined the hourly demand of thermal energy services of the demonstration district, as well as the heat supply pattern of the solar thermal plant. As a basis for discussing results with respect to replication compatibility we provide a set of KPIs to capture the demonstration district’s provision with renewable thermal energy. It becomes evident that even though the annual total generation exceeds the consumption and supports a weak definition of PED, the temporal mismatch between supply and demand, depicted by an Annual Mismatch Ratio of 27.8%, remains despite thermal storage use. Prospectively, the utilization of actual data from metering services in the district and the solar thermal plant will enable a retrospective reality check of the model-based KPIs.
Additional findings derived by an application of van Winden′s upscaling model to Leipzig based on the demo district leads to various challenges including the identification of viable business models for project feasibility (for Type 1: Roll-out) and the expansion of the district heating system in a beneficial way (for Type 2: Expansion). The introduction of a special heating tariff for providing regenerative heat supports the integration of districts on the demand side and different regenerative heating technologies on the supply side. Concluding from the KPIs of the demo district a more versatile heat generation mix is indispensable for a full transition to an environmentally sustainable heat provision and CO2-neutral districts (PED).
In
Section 4, data from the in-depth Morgenstadt assessment of the SPARCS fellow cities is used to apply van Winden’s model for the replication of the solution demonstrated in the case study. However, the solution only proves possible for the city of Kladno, which utilizes a district heating system and has improvement potential in regenerative energy provision.
In addition to the challenges that occur during scaling up in Leipzig, several further potential challenges (e.g., challenges related to the stakeholder engagement, legislation barriers) were identified for Kladno as well as ways to address them in the replication process.
Concluding the article, it is important to once again to highlight the fact that replication is a very complex and context-sensitive topic. There is no one-size-fits-all solution as every single city has its own specific requirements. However, certain ways to speed up the process of repeating and scaling up successful projects, to accelerate the market for low-carbon smart city solutions, as well as certain mechanisms to allow and simplify the replication of those solutions do exist and should be more widely known/spread/used within smart city projects across the EU. Having said that, the authors would recommend planning and modelling the replication of a smart city project at the very early stage as it is important to find tailor-made solutions that fit the spatial, legislative, socio-economic conditions and historical growth of the cities.
Author Contributions
Conceptualization, K.S. and D.U.; methodology, K.S. and D.U.; validation, K.S. and D.U.; formal analysis, H.K. and T.B.; writing—original draft preparation, K.S. and D.U.; writing—review and editing, H.K.; supervision, T.B. and H.K. All authors have read and agreed to the published version of the manuscript.
Funding
This research was funded by SPARCS Project. The SPARCS Project has received funding from the European Union′s Horizon 2020 research and innovation programme under grant agreement No. 864242.
Institutional Review Board Statement
Not applicable.
Informed Consent Statement
Not applicable.
Data Availability Statement
The data presented in this study are available on request from the corresponding author. The data are not publicly available due to security reasons.
Conflicts of Interest
The authors declare no conflict of interest.
Abbreviations
| AMR | Annual Mismatch Ratio |
| DSM | Demand-Side Management |
| EU | European Union |
| EPBD | Energy Performance of Buildings directive |
| EPN | Energy Positive Neighborhood |
| ICT | Information and Communication Technology |
| IAO | (German: Institut für Arbeitswirtschaft und Organization) Institute for Industrial Engineering |
| KPI | Key Performance Indicators |
| LED | Light-Emitting Diode |
| LSW | (German: Leipziger Stadtwerke) Leipzig Municipal Utilities |
| MHS | Maximum Hourly Surplus |
| MHD | Maximum Hourly Deficit |
| RPL | Monthly Ratio of Peak hourly demand to Lowest hourly demand |
| OER | Onsite Energy Ratio |
| PED | Positive Energy District |
| R&D | Research and Development |
| ROI | Return of Investments |
| SCIS | Smart City Information System |
| SET | Strategic Energy Technology |
| SPARCS | Sustainable energy Positive & zero cARbon CommunitieS |
| VTT | Technical Research Centre of Finland Ltd. |
Appendix A. List of urban indicators for Leipzig within the City-Index (Morgenstadt Framework)
Appendix A.1. Livable City
Poverty rate (social assistance according to SGB II, III, XII), %—1.10%
Unemployment rate, %—9.30%
Rental and service charges, % of household income—34.79%
Doctors per 100,000 inhabitants—219.11
Life expectancy of newborns—80.3
Burglary rate per 100,000 inhabitants p.a.—266
Private car per capita—0.38
Use of public transport per capita p.a.—250.24
Situation for cyclists ADFC wheel index—3.61
Air quality (according to LBI) Air pollution index—4.6
Green and water areas, hectares per 100,000 inhabitants—3063.55
Appendix A.2. Resilient City
Debt service ratio, %—1.88
Independent income (as a percentage of total income), %—58.00%
Share of the three largest employers in total employment, %—1.81%
Emergency plans for various natural disasters, green/yellow/red—yellow
Provisions in the budget for catastrophes, green/yellow/red—green
Climate adaptation strategy, green/yellow/red—yellow
Appendix A.3. Environmentally Conscious City
Greenhouse gas emissions, tons per capita—6.61
Share of renewable energies in own energy production, %—30.00%
Waste volume, kilo per capita p.a.—291,02
Water consumption, daily consumption per capita—121.8
Recycling rate for solid waste, %—38%
Appendix A.4. Innovative City
Difference between new and abandoned businesses, three-year average per 1000 inhabitants—132.42
Share of highly qualified jobs in total labor market, %—33.70%
Number of new patents per 100,000 inhabitants p.a.—15.61
Proportion of students in the total population, in % of total population—6.59%
Smart City or innovation strategy, Yes/No—yes
Research institutions for experimental and innovative technologies and applications, Yes/No—yes
References
- United Nations. 68% of the World Population Projected to Live in Urban Areas by 2050. Available online: https://www.un.org/development/desa/en/news/population/2018-revision-of-world-urbanization-prospects.html (accessed on 7 December 2020).
- United Nations Climate Change. The Paris Agreement. Available online: https://unfccc.int/process-and-meetings/the-paris-agreement/the-paris-agreement (accessed on 7 December 2020).
- Garrido-Marijuan, A. The Making of a Smart City: Best Practices Across Europe 2017. Available online: https://smartcities-infosystem.eu/sites/default/files/document/the_making_of_a_smart_city_-_best_practices_across_europe.pdf (accessed on 7 December 2020).
- IEC Annual Report 2014. Available online: https://basecamp.iec.ch/download/iec-annual-report-2014/ (accessed on 1 December 2020).
- European Commision. Smart Cities—Smart living: EU Policy. Available online: https://ec.europa.eu/digital-single-market/en/about-smart-cities (accessed on 7 December 2020).
- Borsboom-van Beurden, J.; Kallaos, J.; Gindroz, B.; Costa, S.; Riegler, J. Smart City Guidance Package. Available online: https://smart-cities-marketplace.ec.europa.eu/news/smart-city-guidance-package (accessed on 7 December 2020).
- Kaiser, G.; Remmele, B. Why May Replication (Not) be Happening. Recommendations on EU R&I and Regulatory Policies. 2018. Available online: https://smartcities-infosystem.eu/sites/www.smartcities-infosystem.eu/files/document/scis_policy_paper_1_replication_web.pdf (accessed on 7 December 2020).
- Hellwig, M. Entwicklung und Anwendung Parametrisierter Standard-Lastprofile. Ph.D. Thesis, Technical University of Munich, Munich, Germany, 2003. [Google Scholar]
- ODYSSEE-MURE. Energy Efficiency Trends in Buildings: Policy Brief. Available online: https://www.odyssee-mure.eu/publications/policy-brief/buildings-energy-efficiency-trends.pdf (accessed on 7 December 2020).
- European Commission. Commission Welcomes Final Vote on Energy Performance of Buildings: EU Press Release. Available online: https://ec.europa.eu/commission/presscorner/detail/en/IP_18_3374 (accessed on 7 December 2020).
- Temporary Working Group of the European Strategic Energy Technology. Implementation Plan on Action 3.2 “Smart Cities and Communities”. Available online: https://setis.ec.europa.eu/system/files/setplan_smartcities_implementationplan.pdf (accessed on 7 December 2020).
- Hinterberger, R.; Gollner, C.; Noll, M.; Meyer, S.; Schwarz, H.-G. White Paper on Reference Framework for Positive Energy Districts and Neighbourhoods. Key Lessons from National Consultations. 2020. Available online: https://jpi-urbaneurope.eu/wp-content/uploads/2020/04/White-Paper-PED-Framework-Definition-2020323-final.pdf (accessed on 7 December 2020).
- Davis, K. Towards an ICT Infrastructure for Energy Positive Neighbourhoods: Report from ELSA Thematic Working Group on ICT for Energy Efficiency. 2009. Available online: http://ec.europa.eu/information_society/activities/sustainable_growth/docs/elsa/elsa_1/ELSA-EnergyPositive-Report1.pdf (accessed on 7 December 2020).
- Cambridge University Press. Definition from the Cambridge Advanced Learner’s Dictionary & Thesaurus ©. Available online: https://dictionary.cambridge.org/dictionary/english/replication (accessed on 7 December 2020).
- Manville, C.; Milliard, J.; Liebe, A.; Massink, R. Mapping Smart Cities in the EU. Policy Department A: Economic and Scientific Policy. 2014. Available online: https://www.europarl.europa.eu/RegData/etudes/etudes/join/2014/507480/IPOL-ITRE_ET(2014)507480_EN.pdf (accessed on 7 December 2020).
- Van Winden, W.; van den Buuse, D. Smart City Pilot Projects: Exploring the Dimensions and Conditions of Scaling Up. J. Urban Technol. 2017, 24, 51–72. [Google Scholar] [CrossRef]
- Van Winden, W. Smart City Pilot Projects, Scaling Up or Fading Out? Experiences from Amsterdam. In Proceedings of the Regional Studies Association, Annual Conference, Graz, Austria, 3–6 April 2016. [Google Scholar]
- Radecki, A.; Tettenborn, F.; Mohr, M.; Hiessl, H.; Hedmans, T.; Knudsen, M.; Siedlarek, L.; Wahren, S.; Loleit, M.; Raiber, S.; et al. Morgenstadt: City Insights—Final Report; Fraunhofer Institute for Industrial Engineering IAO: Stuttgart, Germany, 2013. [Google Scholar]
- Von Radecki, A.; Pfau-Weller, N.; Domzalski, O.; Vollmar, R. Morgenstadt City Index; Online Documentation; Fraunhofer Institute for Industrial Engineering IAO: Stuttgart, Germany, 2013. [Google Scholar]
- Von Radecki, A. Smart City Replication Framework; Fraunhofer Institute for Industrial Engineering IAO: Stuttgart, Germany, 2015. [Google Scholar]
- Gelles, G.M.; Mitchell, D.W. Returns to Scale and Economies of Scale: Further Observations. J. Econ. Educ. 1996, 27, 259–261. [Google Scholar] [CrossRef]
- SPARCS: Sustainable Energy Positive & Zero cARbon CommunitieS. Available online: https://www.sparcs.info/ (accessed on 7 December 2020).
- Mela, K.; Tiainen, T.; Heinisuo, M. Comparative study of multiple criteria decision making methods for building design. Adv. Eng. Inform. 2012, 26, 716–726. [Google Scholar] [CrossRef]
- Scheller, F.; Bruckner, T. Energy system optimization at the municipal level: An analysis of modeling approaches and challenges. Renew. Sustain. Energy Rev. 2019, 105, 444–461. [Google Scholar] [CrossRef]
- Lindholm, O.; Rehman, H.U.; Reda, F. Positioning Positive Energy Districts in European Cities. Buildings 2021, 11, 19. [Google Scholar] [CrossRef]
- Ala-Juusela, M.; Crosbie, T.; Hukkalainen, M. Defining and operationalising the concept of an energy positive neighbourhood. Energy Convers. Manag. 2016, 125, 133–140. [Google Scholar] [CrossRef] [Green Version]
- Corradini, R.; Sutter, M.; Leukefeld, T. (Eds.) Solarthermie—Technik, Potenziale, Wirtschaftlichkeit und Ökobilanz für Solarthermische Systeme in Einfamilienhäuser; Wüstenrot Stiftung: Ludwigsburg, Germany, 2014; ISBN 978-3-933249-89-0. [Google Scholar]
- Scheller, F.; Burgenmeister, B.; Kondziella, H.; Kühne, S.; Reichelt, D.G.; Bruckner, T. Towards integrated multi-modal municipal energy systems: An actor-oriented optimization approach. Appl. Energy 2018, 228, 2009–2023. [Google Scholar] [CrossRef]
- Kärkkäinen, S.; Sipilä, K.; Pirvola, L.; Esterinen, J.; Eriksson, E.; Soikkeli, S.; Nuitinen, M.; Aarnio, H.; Schmitt, F.; Eisgruber, C. Demand Side Management of the District Heating Systems. Research Notes No. 2247. 2004. Available online: https://www.vttresearch.com/sites/default/files/pdf/tiedotteet/2004/T2247.pdf (accessed on 4 December 2020).
- Leipziger Stadtwerke. Umweltbericht für die Fernwärmeversorgung der Leipziger Stadtwerke. Available online: https://www.l.de/file/download/c7cdce09ec92c8b3a460dac5bd44d682.pdf (accessed on 10 December 2020).
- Hartmann, A.; Linn, J.F. Scaling Up: A Framework and Lessons for Development Effectiveness from Literature and Practice. SSRN J. 2008. [Google Scholar] [CrossRef] [Green Version]
- Zinganell, C. Ökonomische Analyse von Unterschiedlichen Solarthermischen Systemen für Eine Einbindung in das Bestehende Fernwärmenetz der Fernwärme Wien. Ph.D. Thesis, University of Natural Resources and Life Sciences, Vienna, Austira, 2013. [Google Scholar]
- Van Winden, W.; Oskam, I.; van den Buuse, D.; Schrama, W.; van Dijck, E.-J.; van den Buuse, D. Organising Smart City Projects: Lessons learned from Amsterdam. In Role of Stakeholder Interaction in Collaborative Business Modelling for Sustainability; Eburon: Amsterdam, The Netherlands, 2016. [Google Scholar]
- Krikser, T.; Profeta, A.; Grimm, S.; Huther, H. Willingness-to-Pay for District Heating from Renewables of Private Households in Germany. Sustainability 2020, 12, 4129. [Google Scholar] [CrossRef]
- Solarthermaworld. SHC Solar Award: Six Successful Business Models. Available online: https://www.solarthermalworld.org/news/shc-solar-award-six-successful-business-models (accessed on 4 December 2020).
- Dorotić, H.; Novosel, T.; Duić, N.; Pukšec, T. Heat Demand Mapping and District Heating Grid Expansion Analysis: Case Study of Velika Gorica. In E3s Web Conference, Proceedings of the International Conference Energy, Environment and Material Systems (EEMS 2017), Polanica-Zdroj, Poland, 13–15 September 2017; EDP Sciences—Web of Conferences: Paris, France, 2017. [Google Scholar] [CrossRef]
- Shnapp, S.; Paci, D.; Bertoldi, P. Enabling Positive Energy Districts across Europe: Energy Efficiency Couples Renewable Energy; JRC Technical Report; European Commission: Brussels, Belgium, 2020. [Google Scholar]
- Leipziger Stadtwerke. Die Zukunft der Leipziger Fernwärme—Leipziger Stadtwerke. Available online: https://zukunft-fernwaerme.de/ (accessed on 10 December 2020).
- Alpiq Group. Czech Power Station ECKG. Available online: https://www.alpiq.cz/en/alpiq-group/media-relations/media-releases/media-release-detail/czech-power-station-eckg (accessed on 7 December 2020).
- Smrz, M. National Energy Action Plan of Czech Republic. Available online: https://www.eurosolar.de/en/index.php/sections-eurosolar/czech-republic/781-national-energy-action-plan-of-czech-republic-eurosolar (accessed on 10 December 2020).
- Legal Source on Renewable Energy. Feed-in Tariff. Available online: http://www.res-legal.eu/search-by-country/czech-republic/single/s/res-e/t/promotion/aid/feed-in-tariff-act-on-the-promotion-of-the-use-of-res/lastp/119/ (accessed on 10 December 2020).
| Publisher’s Note: MDPI stays neutral with regard to jurisdictional claims in published maps and institutional affiliations. |
© 2021 by the authors. Licensee MDPI, Basel, Switzerland. This article is an open access article distributed under the terms and conditions of the Creative Commons Attribution (CC BY) license (http://creativecommons.org/licenses/by/4.0/).


