1. Introduction
1.1. Background
Over the past few decades, off-site constructed buildings, such as prefabricated buildings, have come into use as an alternative to the on-site method in both emerging and established economies [
1]. Off-site manufacturing is commonly associated with affordable housing and student accommodation, but it is becoming more common in other areas such as hotels, residential areas, the private rented sector, airports, healthcare facilities, and defense-related buildings [
2]. In particular, due to the COVID-19 pandemic outbreak, healthcare infrastructure is becoming overwhelmed around the world. In response to bed shortages and facility saturation, modular hospitals are growing quickly in the on-going fight against COVID-19 [
3,
4].
Owing to the advantages of inherent strength, modular construction, and relatively low costs, the role of containers functioning as building modules has gained in popularity over the past years. Thus, they can be one solution to the above challenges in terms of prefabricated or modular buildings. Compared to traditional building materials that have a large footprint, off-site constructed buildings are more eco-friendly and are in line with the concept of upcycled container architecture [
5]. Flexible and quickly assembled modular container buildings usually consist of one or more standardized individual containers with size restrictions that depend in particular on what can be safely and economically built and transported. This is how most container manufacturers build modular sizes in various widths from 8 feet to a maximum of 14 feet. Prefabricated modular buildings are still affected by some deficiencies in both design and certain technical aspects, being unable to meet the occupant’s requirements for thermal comfort and energy saving throughout the life cycle of the building.
It is currently estimated that there are more than 17 million retired shipping containers in ports around the world [
6]. Most of them are just beyond the official age of retirement from ‘active service’ after approximately 12–15 years. The rest of them are structurally intact, but are no longer in use for their main purpose. The lifespan of containers used as buildings is much longer and can be assumed to be at least 50 years [
7] according to lower degree of mechanical and climatic stresses they are subjected to, as compared to sea containers.
Moreover, because of the high expenses incurred to either destroy or transport them back to the original country and their non-degradable construction materials, they occupy lots of space in the ports. However, this does not mean that these containers cannot be used anymore. The sale of used containers can be a business area in itself, which may consist of depot services and container renovation and re-engineering, as well as the purchasing and onward selling of various types of containers [
8].
1.2. Literature Review
A nearly zero-energy building (NZEB) refers to a building that has very high energy performance with the use of zero or very little energy. The nearly zero or very low amount of energy required is normally covered significantly by energy from renewable sources. The energy performance of a building can be determined on the basis of the calculated or actual consumed annual energy [
9]. Strategies of design concepts and energy systems for NZEBs have been largely investigated in different climates. Rezaee et al. [
10] proposed a parametric framework for a feasibility study of zero-energy residential buildings for the design stage. Their results showed that wall insulation, infiltration, and lighting load are the most significant parameters affecting the region’s energy performance. Rey-Hernández et al. [
11] performed an analysis of a hybrid ventilation system in an NZEB to meet the heating and cooling demand and IAQ levels. They concluded that the ventilation system with an energy recovery function has great potential. Medved et al. [
12] assessed the contribution of energy storage to an NZEB, including heat and cold storage and batteries, which are significant in the transition of NZEBs towards ZEB. Guarda et al. [
13] reported the influence of climate change on renewable energy systems designed for NZEBs with a case study in the Brazilian savannah. They indicated that energy demand will increase over the years, while the photovoltaic (PV) system alone will not be able to meet this new demand. As a result, they suggested that the bioclimatic building guidelines must be updated to promote adequate strategies to guide designers to construct resilient buildings when considering the impacts of climate change. Li and Wang [
14] proposed an optimal design method to identify the global optimal design solutions for the NZEBs by considering uncertainties. The design process included robust design optimizations of the building envelope and energy systems, which were further tested by a case study in Hong Kong. Lindberg et al. [
15] conducted a case study of a German multi-family house to explore the cost-optimal energy system design in an NZEB with grid connection. In the current energy market, they concluded that a heat pump is not a cost-optimal choice. With the same objective of cost-optimal energy performance, Ferrara et al. [
16] evaluated a great number of design alternatives for NZEB building envelopes through automated optimization search procedures. They suggested that both envelope design and energy systems should be considered simultaneously at the early design stage in order to achieve a cost-optimal solution.
Several studies have investigated the possibility of achieving an NZEB using containers. Kristiansen et al. [
17] investigated the feasibility of an off-grid container unit for industrial construction in China by considering vacuum insulation panels, three-layer glazed windows, natural ventilation, and cooling and heating set points. Additionally, they summarized perspectives on industrialized transportable solar powered zero-energy buildings using PV and battery storage [
18]. In addition, this team [
19] also performed energy analyses and lifecycle assessments to quantify the lifecycle impacts related to four energy efficiency designs of a container building (conventional, low-energy, net-zero energy, and off-grid). They indicated that the net-zero energy design strategy had the lowest lifecycle impacts in all categories. They also pointed out the transition from a linear approach to a circular approach to building products with the reuse of building structures in the form of containers. This can significantly increase the potential environmental benefits of the building’s lifecycle, particularly in designs characterized by a dominant share of the pre-use stage in their total lifecycle impact. Moreover, Vijayalaxmi [
20] developed a one-story home with a container structure for the hot–humid tropical climate of Chennai, India. It is claimed that the most effective passive means of achieving thermal comfort in a hot–humid climate is through comfort ventilation. Trancossi et al. proposed thermoelectric and solar heat pumps for self-sufficient container buildings [
21]. Taleb et al. [
22] developed a container home in a subtropical desert climate with green roofs and green walls as an insulation layer for the container envelope, in which triple glazing windows with low-emissivity film played a key role in reducing the cooling load. Cornaro et al. [
23] designed a container-built show house, which had a satisfactory thermal performance with mild and temperate climates by the use of a solar chimney. Bohm [
24] undertook the challenge to design a single house for high performance in two very different climates, indicating that it is difficult to find a common design strategy for conservative envelopes of such modular buildings in many diverse climates. It is therefore necessary to develop a category of energy-efficient design for container-based modular buildings under different climate conditions.
1.3. Motivation and Scope
Most of the above studies focused on nearly zero-energy container buildings (NZECBs), where containers are used for single houses or one-story buildings under specific climate conditions. The research gap is thus identified by the fact that there is a lack of a flexible guidance on design strategies for different building archetypes and energy systems in the concept of NZECBs in different climate zones. As a result, this paper proposes passive design concepts for NZECBs through extensive climate analysis, feasible designs for three building archetypes, and in-depth case studies of the related energy system solutions in three representative climate conditions.
One of the main goals is to show how different building types can be built up modularly from easily adaptable container units for different climatic conditions and for different user profiles. The building types are selected according to geographic, social, and cultural aspects in three different countries. Furthermore, the application of a reference building is analyzed and compared for all major climatic zones.
The paper is structured as following:
Section 2 illustrates the overall research methodology.
Section 3 presents the extensive climate analysis in feasible locations for NZECBs and the detailed climate evaluation in three representative climate conditions for passive design strategies, which are further proposed in
Section 4 for three building archetypes as examples. In
Section 5, the energy system solutions for NZECBs are studied. The conclusion and future work are finally discussed in
Section 6.
2. Research Methodology
The overall research methodology is illustrated in
Figure 1 in order to design NZECBs. This study comprises a total of three design phases, from the preliminary (early design) stage, to the scheme design stage, and then to the detailed design stage. The whole study is part of the ENSECO (energy self-sufficient container buildings) project [
25], which aims to identify the integrated life-cycle product and process the development of energy self-sufficient buildings in different climate zones using prefabricated affordable containers. The construction design stage with demonstration work is regarded as future work in this paper.
The proposed research method starts from analyzing regional resources, for instance, climate, geography, and resources, to realize the development of the passive potential of buildings under different functional and climatic scenarios. Therefore, all relevant climate zones are characterized, and key values are defined and compared for several representative locations. For the early planning stages of a building project, there are several climatic analysis tools [
26]. Among them, the Olgyay Bioclimatic chart is the first bioclimatic chart that includes both temperature and relative humidity so as to construct a thermal comfort zone. However, only limited solutions are available from this chart if the climate is outside of the comfort zone. The other method, the Givoni–Milne Bioclimatic Chart shown in
Figure 2, is another tool that is mainly applied for residential-scale construction [
27]. There are more alternatives in the area of thermal comfort building design to investigate possible passive techniques for different types of climates around the world, covering passive methods of natural ventilation, evaporative cooling, thermal mass, passive heating, and active methods of conventional air conditioning or dehumidification [
27,
28,
29,
30].
The scheme design phase stage is based on the identified favorable options. Within this phase, the building components are selected, and it is decided if complementary mechanical ventilation and/or cooling systems are necessary to provide thermal comfort. If the response is positive, the selection of suitable complementary mechanical systems, for instance, air handing units or room unit coolers, takes place in the third stage, the detailed design. Moreover, another consideration in the detailed design stage is the development of outline operation/control strategies to match external/internal conditions. The definition of the ideal energy supply system can be carried out with modelling tools in two steps. The hourly heat and electricity demand is calculated with building simulation tools, e.g., with IDA ICE, and then transferred into the Polysun software in order to design the energy supply system based on renewable energies. Different configurations can be assessed using key indicators such as the degree of self-sufficiency or other economic or ecological parameters. Modelling techniques are used in the preliminary and detailed design phases.
The proposed design for both passive and mechanical strategies requires iterative calibration progression to avoid unnecessary oversize problems. The results from the detailed design phase are used in the preliminary design phase and vice versa.
The priority should first be given to passive strategies. As a consequence, the key approaches to achieve an NZECB are reflected in the above steps and by maintaining the internal climate of buildings and existing container structures, while minimizing the ecological footprint, as well as maximizing both the use of renewable energy and mechanical systems efficiencies.
3. Climate Analysis
This section starts with a general analysis of the worldwide climate zones at selected representative locations. It aims to describe concise and precise analytical results so that the interpretation together with the conclusions can be used for further building design. Afterwards, three locations are selected for building applications and will be analyzed in more detail.
3.1. General Climate Analysis of Appropriate Regions for NZECBs
There are different definitions of how the earth is divided into climatic zones. According to ASHRAE 169–2020 [
31], the Earth’s climate is essentially divided into eight different climate zones: Very hot, Hot, Warm, Mixed, Cool, Cold, Very Cold, and Subarctic, which are again differentiated according to different types: Humid, Dry, and Marine. In order to quantify the potentials of each climate zone for renewable energy in buildings, characteristic cities for the different climate zones are defined and characterized as plotted in
Figure 3. The corresponding climate zones are listed in
Table 1. Although the main focus is on Europe, the selection should also represent areas from the other continents. The subarctic zone is not considered further here. Berlin was selected as a characteristic climate for Central Europe, which is mainly cool–humid. Stockholm, Kiruna, Reykjavik, and Murmansk represent the northern European climate, which varies between a cold and very cold climate, with Kiruna having the lowest annual global radiation and average temperatures. Tashkent belongs to the same climate zone as Ankara, but the Uzbek area is characterized by a particular continental climate with large seasonal temperature fluctuations and a particularly high position of the sun. Mexico City, Melbourne, and Cape Town belong to the warm zone on three different continents. The subtropical Addis Ababa in the hot–humid climate is exposed to particularly high sunlight and is characterized by a so-called diurnal climate in which the mean temperature differences between day and night are greater than the temperature differences between the individual months. Melbourne in Australia and Recife and Mexico City represent a warm climate; Kharga and Abu Dhabi represent a hot and dry climate. Mumbai is characterized by a tropical climate, and is extremely hot and humid with particularly high mean temperatures.
Climatic data were collected for all cities using the Climate Data Center (CDC) [
32] and weather data of the EnergyPlus™ [
33]. Global radiation is one of the most important key values for renewable energies and is therefore considered in more detail here.
Figure 4 shows the frequency distribution with the number of days per year with a certain amount of radiation energy. The warm and hot locations have their maximum values between 5000 and 8000 Wh/m
2 per day. Only Melbourne has a significantly lower maximum value. The cool and cold locations have a much lower radiation potential with their maximum daily values mainly between 1000 and 2000 Wh/m
2 per day. Only Tashkent has a significantly higher radiation potential. These diagrams are useful in order to evaluate the solar potential over the year. A high frequency of low radiation energy requires greater effort to create energy self-sufficient buildings. Of course, the temperatures are also relevant for building designs, and so further data were collected such as average, minimum, and maximum temperatures; their daily fluctuations; the hours of sunshine; and average wind speeds.
Table 2 contains all the data, and the cities are sorted in ascending order of their global annual radiation, with Kiruna having a minimum and Abu Dhabi a maximum of solar radiation. The peak values are marked in red and the minimum values in green. High average wind speeds are indicators for the potential of wind turbines as significant energy converters. In this context, wind energy is particularly relevant for Melbourne, Reykjavik, and Cape Town due to their proximity to the coast and the consequent high wind speeds. High average temperatures indicate a need for cooling, which could be potentially compensated by passive measures such as insulation or an increased heat capacity in the building structure if the nighttime temperatures are low enough. The same relationship applies to cold temperatures.
Thus, the heating and cooling requirements for the respective locations can be assessed by a characteristic integrated parameter. Therefore, the temperature–time curves are integrated, once as an integral above the temperature of 23 °C and once below 20 °C. This is based on the assumption that there is a potential cooling requirement (without any building structure) in outside temperatures greater than 23 °C and heating requirements in temperatures below 20 °C. Even if the heating and cooling requirements are particularly dependent on the building and usage conditions, this method is used to derive a building-independent parameter for characterizing the climatic conditions in terms of energy demand. The resulting heating and cooling potentials are plotted in
Figure 5. For example, although Addis Ababa and Abu Dhabi have a very high global radiation, the integral predicts an especially high cooling demand, while in Addis Ababa there is predominantly a heating demand. This is due to the significantly different outside temperatures. From these data, it can also be derived that locations such as Mumbai, Charga, Recife, and Abu Dhabi have a high potential for photovoltaic or solar-thermal implementation into the cooling system of a building. In addition, in Abu Dhabi, little energy is needed for heating, which means that heating systems are potentially obsolete in new buildings, while in Addis Ababa heating systems seem to be necessary due to low night temperatures. In Cape Town and Melbourne, cooling and heating functions should be available, as temperatures may change significantly. For high self-sufficiency in these locations, more climate-independent methods will probably play a key role. Ankara shows a similar picture, where no outstanding opportunities are noticeable.
3.2. Detailed Climate Analysis for Passive Design Strategies
Three characteristic cities were selected for in-depth case studies with the purpose of dedicated passive design optimization and minimization of the dependence on active systems in the subsequent stage. The building types were chosen from a social and cultural perspective, as well as from the existing demand for buildings in three countries.
Germany, Berlin: Germany can be categorized both according to its dense population and its urban characteristics. Because of the limited space available within major German cities and the great demand for affordable living space, an apartment building shall be designed.
Sweden, Stockholm: In Sweden, the majority of the population lives in single-family houses. Due to the available space in Sweden and the current desire of the Swedish population for sustainable housing, a single-family home shall be designed.
Ethiopia, Addis Ababa: Most of the population of Ethiopia still lives in rural areas, where energy supply and buildings for education are a major issue. The population in Ethiopia has more than doubled within the last 30 years, and the rate of growth is not decreasing. The need for education is correspondingly high. A small school building shall be designed primarily for rural areas.
Climate analysis is the first step towards passive potential exploration within the sustainable building design procedure. Here, all the preliminary weather analyses were investigated based on the scientific weather data from International Weather for Energy Calculations (IWEC) [
34]. The IWEC data files are ‘typical’ weather files suitable for use with building energy simulation programs, which are derived from up to 18 years (1982–1999 for most stations) of DATSAV3 hourly weather data originally archived at the U.S. National Climatic Data Centre. The ‘epw’ weather file contains weather data for all 8760 h of a 365-day year covering location information, temperature, humidity and enthalpy, wind data, and solar radiation data. In the subsequent stage, the same IWEC climate data will be employed in the building performance simulation tool, IDA ICE, to assess the overall building performance.
3.2.1. Berlin, Germany, Representing Central Europe
For the central European climate, Berlin/Schönefeld (Airport) (latitude 52.38° N, longitude 13.152° E) in Germany was selected. From weather data collected, this climatic zone belongs to the cool–humid type according to the International Climate Zones Category (Zone 5 A) [
31]. The amount of solar radiation resources is not great. The summer solar height (June) ranges from 0° at azimuth −133° to 133°, with the highest 61° at azimuth 0°. Thus, there are about 7 to 8 h of sunshine per day during the period from May to August. The winter solar height (December) ranges from 0° at azimuth −53° to 53°, with 14° being the highest at azimuth 0°, so the sun rarely shines, and the solar time is short from November to February. The climate is characterized by a cool winter from December to February, while summer is pleasantly warm from June to August. However, there are obvious greater diurnal temperature variations and greater wind speeds than those in other seasons. Sky cover range at this period is at the lowest level with a constant radiation level, so exceeded direct solar gains bring these occasions out of the comfort zone.
In short (according to meteorological data obtained for most stations over 18years), the average daily total global horizontal solar radiation fluctuates from 405 to 5109 Wh/m2. The average monthly air temperature is in the range of 0 to 19 °C, while the average monthly relative humidity varies from 63% to 86%, and the average monthly wind speed has a maximum value of 5 m/s and a minimum value of 3 m/s.
3.2.2. Stockholm, Sweden, Representing the Scandinavian Region
Stockholm Arlanda Airport (Latitude 59.62° N, Longitude 17.95° E) in Sweden was selected. From the weather data collected, the climate is characterized by freezing winters and pleasantly warm summers and belongs to the cold–humid type according to the International Climate Zones Category (Zone 6 A) [
31]. During the winter, the average temperature drops below freezing (0 °C) from December and reaches the lowest temperature in February. During this period, the sky cover range has an average of around 70%, and the average relative humidity is around 80% to 90% during this period. Summer spans the period from from June to August; it is a mild season with more pleasant days. Extreme hot temperatures are rarely recorded: occasionally the temperature has reached 28 °C within historic records. There is an obvious diurnal temperature variation along with greater windy occasions. Sometimes, it can be very cool or even cold at night since the temperature can drop below 10 °C even in summer.
Higher in the northern latitudes, the days are very short for winter times, and the amount of solar radiation resources is valuable. The winter solar height (December) ranges from 0° at azimuth −40° to 40°, with 7° being the highest at azimuth 0°, so it is clearly low from November to January when the sun is rarely seen. The summer solar height (June) ranges from 0° at azimuth −154° to 154°, with 54° being the highest at azimuth 0°. From around the middle of May to the end of July, the duration of sunshine in Stockholm is about 15 to 17 h per day, when it is not completely dark even at midnight.
In short (according to 18 years’ worth of data of meteorological parameters for most stations), the average daily total global horizontal solar radiation fluctuates from 199 to 5278 Wh/m2; the average monthly air temperature is in the range of −3 to 17 °C, while the average monthly relative humidity varies from 63% to 90%, and the average monthly wind speed has a maximum value of 4 m/s and a minimum value of 2 m/s.
3.2.3. Addis Ababa, Ethiopia, Representing a Hot Region
For the hot climate, Addis Ababa (latitude 9.0° N, longitude 38.76° E) in Ethiopia was selected. From the weather data collected, Addis Ababa is located in the Ethiopian Plateau, which is 2300 m above sea level [
15]. It belongs to the hot–humid type according to the International Climate Zones Category (Zone 2 A) [
31]. Thus, even though it is located in a tropical climate zone, the climate is mild. It has pleasantly warm daytimes, around 23/25 °C, most of time outside of summer, and cool nights when the temperature drops below 10 °C. In terms of precipitation, it has an annual 1200 mm of rainfall, and the notable rainy seasons occur in June to September and from March to May.
The amount of solar radiation resources is high. The summer solar height (June) ranges from 0° N at azimuth −72° to 72°, with 74° being the highest at azimuth 0°, while the winter solar height (December) ranges from 0° at azimuth −115° to 115°, with 58° being the highest at azimuth 0°. The amount of sunshine in Addis Ababa is high from October to May. In other words, solar resources in Addis Ababa are moderate with average sky cover in the range of around 56%.
In short (according to 18 years’ worth of data of meteorological parameters for most stations), the average daily total global horizontal solar radiation fluctuates from 4638 to 6835 Wh/m2. The average monthly air temperature is in the range of 15 to 17 °C, while the average monthly relative humidity varies from 54% to 83%, and the average monthly wind speed has a maximum value of 4 m/s and a minimum value of 2 m/s.
4. Passive Design Strategies and Concepts for Three Building Archetypes in the Represented Climates
4.1. Design Strategies in Berlin, Germany and a Case Design of Multi-Family House
The moderate temperatures, light winds, and four distinctively marked seasons provide more flexibility in the selection of passive design strategy in terms of architectural engineering.
Figure 6 illustrates the historical hourly weather data under a Givoni Bioclimatic Chart overlay. When analyzing the current climate condition over a whole year period, there are a total of 8760 h; 8.1% of these already meet the comfort conditions, while around 57.7% of them require an additional active system design to improve the comfort conditions. The comfort conditions can be satisfied through passive design strategies within the remaining 34.3% of annual time.
With the help of the Givoni Bioclimatic Chart, the majority of hourly data are located toward the heating process line in
Figure 6. This implies that passive heating should be the main concern in passive design strategies, which can be principally improved by building siting and orientation. Firstly, it is always beneficial to learn the traditions from local buildings with common compact floorplans and a central heat source, south facing windows, vestibule entries (working as air locks) to reduce unnecessary infiltration and uncomfortable drafts, and a pitched roof for wind protection. A building’s plan geometry is usually quantified based on its aspect ratio. The optimal building aspect ratio varies with orientation, climatic condition, latitude, longitude, and altitude. Here, the approximate aspect ratio of 1:1.6 (which is the proportion of the short side to the long side of the floor plan dimensions) was considered to be optimal because it keeps the exposed surface area-to-volume ratio as compact as possible so that it can obtain balanced heat transmission through the envelopes from cool winters to warm summers.
Building orientation is another important factor to improve a building’s thermal performance in relation to both the solar position and the prevailing winds. In this case, the optimal orientation is to locate the E–W axis 18° north of east. The floorplan can be organized towards either winter sun or natural daylight, which is able to penetrate into spaces occupied during the daytime with specific functions that coincide with solar orientation. The long south-facing surfaces of the building can capture solar energy for passive heating during the winter. Simultaneously, the structural mass, such as shear wall, and construction components, such as tiles, slates or a stone-faced fireplace, as well as the service core, can be located at the center of the building’s volume. Thus, ‘inertia’ against temperature fluctuations is provided that can keep winter solar gain and summer night cooling from the perimeter where the circulation zone can be located. Additionally, this can facilitate access to high levels of illumination and reduce the energy required for artificial lighting. However, direct sunlight admitted through the southern facade should be controlled by means of either insulating blinds, heavy curtains, or operable window shutters. These can not only help minimize glare and visual discomfort but also reduce winter nighttime heat losses. In addition, more considerations ought to be given to the exterior. If a basement is used, it must be at least 46 cm below the frost line and insulated on the exterior (foam) or on the interior (fiberglass in a furred wall). A garage or storage area can be additionally added as a buffer zone on the side of the building facing the coldest wind. In terms of landscape, more efforts can be made to create a biophilic summer garden and a cozy winter outdoor space. Landscape trees (either conifer or deciduous) are acceptable beyond 45 degrees from each corner of the glazing for passive solar gain. Dense planting of trees (with at least the same height and distance up to twice the height of the building excluding the roof) can even protect entries from cold winter winds. Sunny wind-protected outdoor spaces (seasonal sun rooms, enclosed patios, courtyards, or verandas) can extend interior living areas with the extra help of exterior wind shields (e.g., wing walls, wind breaks, fences, exterior structures, or land forms).
The main purpose of the opening and glazing design is to maximize natural ventilation and daylight. Both are key elements for an adaptive design as they can significantly boost the occupants’ comfort and reduce the required energy consumption. Natural ventilation is most effective when the building is shaped and oriented to optimized summer prevailing winds. Narrow floor plans have the advantage of smooth air flow and cross ventilation through the building floor plan so that both air quality and thermal comfort performance are better. There are adequate wind resources with the prevailing winds coming from west during the summer months; thus, window openings can be located on both the windward sides and the leeward north and northeast sides to generate the pressure differences between the inside and the outside so as to facilitate cross ventilation. As the average wind speed is around 11 m/s during the summer time, it would feel more than a strong breeze, so small opening sizes would be adequate to provide fresh air. Additionally, it is necessary to restrict incoming cold gales from the southwest (around 13 m/s for the monthly average, from
Figure 7) and the southeast (around 10 m/s for the monthly average, from
Figure 7) during the winter months. In order to have passive solar heating, most of the vision glazing should face the south for winter sun exposure, and overhangs should fully shade windows during the overheated period. When performing the window selection, glazing should possess a minimized U-value as the undesired solar radiation gain has less impact in this climate. Additional placement of small well-insulated skylights (less than 3% of floor area for most clear-day conditions, 5% for most overcast-day conditions) is vital to balance the daytime lighting energy and overheating risk.
Together with addressing passive heating, the retention of useful internal heat gains is another solution. It is beneficial to borrow the idea from the envelope of traditional local buildings’ that use low-mass, tightly sealed, well-insulated construction and a steep pitched roof, which, with a vented attic over a well-insulated ceiling, helps to shed rain and snow and even prevent ice dams. Since we aimed to optimize the passive potential of container house, tightness, as one of the significant features, can be retained and additionally well insulated to gather significant internal heat gains to reduce heating load. Within a super-tight container home, it is also recommended to equip this with a fan-driven HRV or ERV (heat/energy recovery fan) to ensure adequate indoor air quality while conserving energy. Even though the extra insulation (super insulation) and the reduced thermal bridge might prove cost effective, this increases occupant comfort by keeping indoor temperatures more uniform. Meanwhile, it is feasible to lower the indoor comfort temperature at night to reduce heating energy consumption. Thus, a design case is illustrated in
Figure 8 as a multi-family house. According to above design strategies, this design case has following characteristics:
Utilization of structural components in preserving internal heat gains during winter;
Optimal orientation and window-to-wall ratio so as to strengthen (1) daylighting from multiple side; (2) passive solar gain; (3) flexible natural ventilation strategies (cross ventilation and night flushing);
Optimization of landscape design, for instance, of green walls and earth sheltering, to achieve both wind protection and direct evaporative cooling;
Adding overhangs and corridor balconies as fixed sun-shading devices.
4.2. Design Strategies in Stockholm, Sweden, and a Design Case of a Single-Family House
In general, the passive design strategies in this climate are similar to those of the previous case, but are characterized by less sunlight, wetter conditions, cooler winter temperatures, and shorter summers. In terms of architectural engineering,
Figure 9 shows the historical hourly weather data under the Givoni Bioclimatic Chart. Analyzing the current climate condition over a whole year period, there are in total 8760 h; only 4.7% of these already meet the comfort conditions, while around 66.6% of them require an additional active system design to improve the comfort conditions. The comfort conditions can be achieved through passive design strategies within the remaining 28.7% of the annual time.
With the help of the Givoni Bioclimatic Chart, it was observed that a lot of hourly data are located towards the heating process line in
Figure 9. This implies that passive heating should be the main concern in passive design strategies, which can be principally assisted by building siting and orientation. Firstly, it is always beneficial to borrow beneficial ideas from traditional local homes in this cold climate. These suggestions include a common snug and appropriate floorplan with a central fire place, south-facing windows, vestibule entries (air locks) to minimize infiltration and eliminate drafts, and pitched roofs for wind protection. According to design practice, the optimal building dimension ratio is close to 1:1:1 and is partial to multiple stories so as to keep the exposed surface area-to-volume ratio as compact as possible to avoid exposure to the chilly wind environment and significant heat loss through the building’s surfaces. An appropriate size can avoid an excessive floor area with an unnecessary heating demand.
In this climate, the floor plan of the building can be organized in such a way that either winter sun or natural daylight penetrate into the day-use spaces with specific functions that correspond to the orientation of the sun. It is recommended to have the long surface of the building oriented toward the south to capture solar energy for passive heating during the winter. The main orientation of the building should be within 30° of south. In this case, the optimal orientation is to locate the E–W axis towards the south. Bedrooms facing southeast benefit from the morning sun, while living rooms orientated west of south will catch the late afternoon sun, which can help delay the evening heating period. Similar to the Berlin case, the structural mass; construction components, such as tiles, slates, or a stone-faced fireplace; and the service core can be located at the center of the building volume. There are two primary reasons for this: one is to provide ‘inertia’ against temperature fluctuations to store both internal gains and winter day time solar gains from the perimeter; another reason is to have a thermal buffer zone, where the circulation zone can be located on the north side to mitigate lower exterior temperatures.
As sunshine is much more appreciated in this climate, it plays an important role in glazing for passive heating and daylighting as it can significantly reduce the required energy consumption and boost visual comfort with high levels of illumination. Direct sunlight from the south façade can be an excellent source of lighting here. However, it needs to be efficiently distributed throughout the floor plan. If it is a rectangular, a narrow floor plan with the longer sides aligned to the east and west axes can allow a lot of diffuse natural light to enter from the north. In large buildings with a square footprint, access to natural light is restricted to the building periphery and areas near the glazing, so the inner parts of the floor area are dependent on artificial lighting. Introducing daylight from skylights can eliminate this problem (less than 3% of floor area in clear weather, 5% in overcast weather). In order to enable passive solar heating, most of the viewing glass should face south in order to maximize solar radiation in winter. The direct sunlight through the south facade should be controlled either via insulating blinds, heavy curtains, or operable shutters. This can also help minimize glare and visual discomfort as well as reduce heat loss during winter nights.
Even when the climate is cold, passive cooling is still an essential strategy to improve the thermal comfort for around 231 h in a year. Narrow floor plans have the advantage of smooth airflow and cross ventilation through the building floor plan so that both air quality and thermal comfort performance are better. Square floor plans can facilitate passive cooling using the stack effect by means of skylights. There are sufficient wind resources with the prevailing winds coming from the southwest and northeast during the summer months (from
Figure 10). Window openings can be located on the both windward southwest facades and the leeward northeast sides to generate pressure differences between the inside and the outside to facilitate cross ventilation. As the average wind speed is around 9 m/s during summer time, it would feel like a strong breeze, so adequate air exchange through small openings is preferable to maintain comfortable interior temperatures and to avoid excessive heat loss. During the cool winter time, the average wind speed is less than a gentle breeze, although the prevailing winds are still mainly from the southwest and south. When performing the window selection, glazing should minimize conductive loss and gain (minimize U-value) because undesired solar radiation gain has less impact in this climate. The additional placement of small, well-insulated skylights (less than 3% of the floor area in a clear climate, 5% in cloudy weather) is crucial to reduce the lighting energy and the risk of overheating during the day.
In cold climates, traditional buildings prefer to use a low-mass, tightly sealed envelope; thick insulation; and a steep pitched roof with a vented attic over a well-insulated ceiling. The primary reason for this is to maintain a cold roof temperature to avoid risky ice dams, as well as to vent moisture thereby preventing mold and bacteria growth, which usually occurs on or within attics and wall assemblies due to condensation or improper detailing. For the implementation of this, the thermal insulation level of the roof perimeter should be equal or greater to the thermal resistance of the exterior wall. In addition, a 1:300 ventilation ratio is recommended (as specified by most building codes), which is based principally on good historical experience and simple psychometric analysis. Since we planned to optimize the passive potential of a container home, tightness, as one of the significant features, can be kept and additionally well insulated to gather significant internal heat gains to reduce heating load. Within a super-tight container home, it is also recommended to equip a fan-powered heat/energy recovery ventilator to ensure indoor air quality while conserving energy. Even though extra insulation (super insulation) and a reduced thermal bridge might prove cost effective, they increase occupant comfort by keeping indoor temperatures uniform. Additionally, it is feasible to lower the indoor comfort temperature during sleeping time to reduce heating energy consumption. As a result, a design case is displayed in
Figure 11 as a single-family house. This involves the main characteristics from the above passive design using the following climate-control strategies:
An optimal orientation and floor plan so as to strengthen passive solar gain;
Maximizing daylighting through multiple sides and skylights;
The utilization of high thermal mass in preserving internal heat gains during winter, assisted using night flushing during summer;
A hybrid ventilation solution covering both adaptive comfort natural ventilation and fan-forced ventilation;
The optimization of landscaping design to achieve both wind protection and direct evaporative cooling;
Movable sun-shading devices;
The utilization of high thermal mass assisted by night flushing.
4.3. Design Strategies in Addis Ababa, Ethiopia
This climate is characterized by high temperatures, constantly high humidity, and great changes in daily temperatures. In terms of architectural engineering,
Figure 12 gives the historical hourly weather data according to the Givoni Bioclimatic Chart. Analyzing the current climate condition over a whole year period, there are total 8760 h; 16.6% of these already meet the comfort conditions, while around 15.9% of them require an additional active system design to improve the comfort conditions. The comfort conditions can be achieved through passive design strategies within the remaining 67.5% of annual time. In general, the promising climate control strategies are (arranged by percentage):
Internal heat-gain preservation;
Passive solar gain;
Wind protection of outdoor spaces;
Using shading elements around windows;
High thermal mass associated with night flushing;
Placing direct evaporative features to achieve passive cooling effects;
Employing ceiling fans or indoor forced-air motion, making the interior feel cooler (to be used on hot days with the windows closed); thus, less air conditioning is needed.
With the help of the Givoni Bioclimatic Chart, there is still a high number of hourly data located toward the heating process line, but generally lower in relative humidity as shown in the
Figure 12. This implies that passive heating should be the main concern in passive design strategies, which can be principally assisted by building siting and orientation. The lessons from traditional buildings indicate that high ceilings and tall, operable (French) windows protected by deep overhangs and verandahs are commonly seen in this climatic area. It is useful to create shaded outdoor buffer zones (porch, patio, lanai) oriented to the prevailing breezes, which can extend living and working areas in summer, and use passive solar gain in winter. In terms of floorplans, cross ventilation is maximized by a long, narrow building floorplan as an effective cooling strategy. As there is often a great diurnal temperature variation, night flushing is another strategy with which to remove much of the thermal storage out of envelopes, leading to lower early morning interior temperatures. This is true for the surrounding landscape design and the dense planting of bushes, trees, and ivy-covered walls, especially on the west to minimize heat gain (if summer rains support native plant growth). Furthermore, this climatic area always has wet soil; therefore, raising the building high above the ground is suggested to minimize dampness and maximize natural ventilation underneath the building.
The predominant considerations are given to maximized natural ventilation and reducing or eliminating air conditioning in warm weather if windows are well shaded and oriented to prevailing breezes (shown in
Figure 13). As the average wind speed is around 3 m/s, mainly from due north during the summer time, it would feel like a gentle breeze, so adequate air exchange through large openings is preferable to maintain comfortable interior temperatures. In principle, there are some additional suggestions:
Shade the window well with window overhangs (design dependent on the latitude) or operable shades (e.g., awnings that can be extended in summer) to eliminate cooling load;
Window openings perpendicularly oriented to the prevailing winds for natural ventilation;
Locate exterior wing walls and plants around the window direction up to 45 degrees;
Create the possibility of natural cross ventilation by placing doors and window openings on opposite sides of the building;
Choose screened porches and patios to provide a longer time of passive comfort cooling without potential insect problems;
Have a ridge hood, roof monitor, open stairwell, and two-story spaces to enhance the natural indoor buoyancy ventilation.
A design case is proposed in
Figure 14 as a school building in Addis Ababa, Ethiopia. In hot and humid climatic zones, local traditional buildings still emphasize natural ventilation in terms of enclosure design. They have a preference to take advantage of lightweight construction with slabs on grade, operable walls and shaded outdoor spaces. Placing enough north glazing is suggested in order to benefit from diffused daylighting and cross ventilation (about 5% of floor area). A whole-house ventilation strategy can be achieved through:
Maximizing the vertical height between air inlet and outlet (open stairwells, two-story spaces, roof monitors) so as to take advantage of stack ventilation during calm, warm days;
Using a well-ventilated attic with pitched roofs to guarantee ventilation and rain protection.
Figure 12 indicates that the target climatic zone has a significant diurnal temperature fluctuation, which provides sufficient support to the climate-dependent strategy. Taking advantage of diurnal temperature differences, a cooler night-air circulation allows the dissipation of the heat build-up in the whole envelope during the daytime. In order to achieve this passive cooling effect, one simple requirement is to allow the night air to fully circulate the building from the openings and through an open floor plan.
4.4. Development of Multifunctional Components
In order to achieve the project objective of developing partially energy-autonomous lightweight buildings, innovative multifunctional components including the production technology required for their manufacturing were developed. These multifunctional assemblies enable a significant improvement in energy efficiency by using regenerative energies as well as a reduction in the required energy consumption due to improved structural–physical properties (thermal insulation, heat storage). The components developed within the scope of the research project [
25] are the roof assembly (
Figure 15), the floor assembly (
Figure 16), and the side wall assembly (
Figure 17).
The use of regenerative energies is achieved by innovative photovoltaic–thermal (PVT) modules integrated into the building’s outer shell, which supply the building with electrical and thermal energy. To reduce thermal energy consumption, highly insulating vacuum insulation panels (VIP) were integrated into the assembly constructions. These enable a significant improvement in thermal insulation with simultaneously low insulation thicknesses compared to conventional insulation materials. To improve the low heat-storage capacity of lightweight buildings, phase change materials (PCM) were integrated in macro-encapsulations in the side walls and roof assemblies. This enables a significant increase in heat-storage capacity while maintaining the original wall thicknesses. PCM serves as a thermal buffer that can be useful in regions with large daytime temperatures fluctuations so that the PCM can be regenerate itself regularly.
Environmentally friendly interior climatization is achieved by the integration of capillary tube mats into the wall and roof assemblies, which enable the use of a low-exergy system using renewable energies. The multifunctionality of the assemblies enables a significant improvement in the energy balance and living comfort of container-based lightweight buildings and thus enables the production of lightweight buildings that significantly surpass the state of the art for the fast, cost-effective, and sustainable provision of urgently needed living space.
5. Energy Systems Strategies for Three Different Archetypes in Represented Climates
In this section, the three design cases from the above section are considered for an in-depth energetic analysis. The heating and energy demands are calculated with the building simulation tool IDA ICE. Based on the determined energy requirements, the following energy supply concepts C1-C7 were created, with the emphasis on maximizing the degree of self-sufficiency. They were applied in Polysun for each of the three application cases.
C1: Air heat pump (AHP) with photovoltaics (PV): An air heat pump for heating and cooling is combined with two water storage tanks, one for heating and one for cooling. The photovoltaic system uses the entire available roof area. A DC battery acts as a power storage device. In order to increase the degree of self-sufficiency, an electric heating rod is integrated into the storage system, which further loads the storage system above the working temperature of the heat pump with excess, self-generated solar electricity.
C2: Geothermal heat pump (GHP) with PV: A geothermal pump provides heat that is stored in a heat-storage system. A heat exchanger between the earth probe and the underfloor heating cools the building directly. The PV, battery, and heating rod are implemented as in concept C1.
C3: Combined heat and power plant with PV: A biogas combined heat and power plant (CHP) generates heat and electricity. In order to extend the life of the CHP, an absorption-cooling machine is used to cool the building. One water tank is used for heat and cold. Since the CHP works at a higher temperature level than the heat pump, no electric heating rod is used. PV and battery storage systems are implemented as in concept C1.
C4: Air heat pump with solar thermal (ST) and photovoltaics: In contrast to concept C1, the area of the photovoltaic system is reduced to provide space for a small solar thermal system (up to eight collectors or 16 m2).
C5: Air heat pump with hybrid photovoltaics/thermal collectors (PVT) and PV: The solar thermal collectors from concept C4 are replaced by photovoltaic–thermal hybrid collectors.
C6: Air heat pump with hybrid collectors: Hybrid collectors cover the entire roof area; otherwise, the approach adopted is similar to that in concept C1. An exception for the multi-family house is that the hybrid collectors cover the balcony balustrade only.
C7: Air heat pump with photovoltaics and wind turbine (WT): In addition to all components from concept C1, a 3.5 kW wind turbine is integrated.
All concepts were modeled with the software Polysun® for the three application cases. In all cases, the electricity requirements for heat generation, the degree of self-sufficiency, electricity generation by means of PV, electricity supply, and grid feed-in were evaluated.
5.1. Multi-Family House in Berlin, Germany
Due to its design, the multi-family house in Germany has only a small roof area in relation to the usable area. Therefore, the building uses the balcony balustrade as an energy conversion area. Depending on the concept, these were equipped with photovoltaic, solar thermal, or hybrid collectors. The following component specifications apply to the concept C1–C7 for the multi-family home:
Heat pump: power 5 kW + 2× water storage 1000 L;
PV (roof): alignment 0°, angle 30°, power 15 kWp (concept C1–C4,C6 + C7)/12 (concept C5), polycrystalline, rated power STC 300 W;
PV (balcony scaffolding): alignment 0°, angle 90°, power 6 kWp (concept C1–C3,C5 + C7)/12;
Solar thermal: orientation 0°, angle 90°, gross total area 36 m2, flat collectors;
Hybrid collectors (roof): alignment 0°, angle 30°, gross area 17 m2, power 2.95 kWp;
Hybrid collectors (balcony scaffolding): alignment 0°, angle 90°, gross total area 34 m2, power 5.9 kWp;
Battery: capacity 10 kWh, Li-Ion.
Table 3 shows the results for the apartment building. With the use of the entire available roof area and the balcony balustrade, it is possible to generate 19,233 kWh of electricity, which corresponds to 915 kWh/kWp. The electricity generated is far from sufficient to cover the entire demand. Only concept C3 (CHP) achieves a degree of self-sufficiency of 84.5% under these boundary conditions. Without a CHP, it is currently only possible to achieve a degree of self-sufficiency of about 45%. This value may be increased by making use of the façade for the installation of further photovoltaic modules.
5.2. Single-Family House in Stockholm, Sweden
Two consumer scenarios with different power consumptions of 3000 kWh and 6000 kWh for electrical appliances were analyzed for the single-family house. The following specifications were used for concepts C1 to C7 for the single-family house:
Heat pump: power 8 kW + 2× water storage 1000 L
PV: orientation 0°, angle of adjustment 45°, power 22.5 kWp (concept C1–C3, C7)/19.2 kW (concept C4 and C5), polycrystalline, rated power STC 300 W
Solar thermal: orientation 0°, angle of application 45°, gross total area 16 m2, flat collectors
Hybrid collectors: alignment 0°, angle 45°, gross total area 17 m2, power 2.95 kWp (concept C5)/22.1 kWp (concept C6)
Battery: capacity 20 kWh, Li-Ion.
Table 4 shows the simulation results for the single-family house with low and high power demand. The photovoltaic plant provides a yield of approx. 1000 kWh/kWp so that a degree of self-sufficiency of 80% is possible with low power demand in concept C1. It is striking that the degree of self-sufficiency decreases only by a few percentage points, although the electricity demand doubles in the second scenario. This is mainly due to the very large size of the photovoltaic system and battery storage. With low power consumption, more than 60% of the generated electricity is fed into the grid. With the high consumption, the grid feed is still close to 50%.
Concept C3 (CHP + PV) achieves a high degree of self-sufficiency of 84.4% with low power consumption. However, due to the low electricity consumption, the advantage of CHP, the simultaneous generation of electricity and heat, cannot be used. More than half of the energy generated by CHP has to be fed into the electricity grid. This changes with the higher power demand, so in this case an even higher degree of self-sufficiency of 92.3% is possible. The self-sufficiency is only an electric self-sufficiency, so the biogenic fuel consumption of the CHP is not taken into account.
In large parts of Sweden, the operation of a wind turbine would be possible due to the good wind conditions. Concept C7 (air-WP + PV + wind turbine) achieves a degree of self-sufficiency of more than 80% with the help of a 3.5-kW wind turbine. However, this is only marginally higher than that in concept C1. From an economic point of view, a wind turbine will not be a viable solution in the current situation.
Concept C6, where the hybrid collectors covered the entire roof, is not advantageous for a high degree of self-sufficiency. The low demand does not require the high amount of heat generated by the collectors. The collectors heat up strongly, and the efficiency of the power generation decreases sharply.
5.3. School Building in Addis Ababa, Ethiopia
In Ethiopia, the majority of people live in rural areas, and only 4.8% of them have access to the public electricity grid [
35]. Thus, energy self-sufficiency is a key issue. The following component specifications apply to the concepts C1–C7 for the school building:
Heat pump: power 5 kW + 2× water storage 1000 l
PV: orientation 0°, angle 20°, power 12.6 kWp (concept C1–C3; C7)/9.9 kW (concept C4 + C5), polycrystalline, rated power STC 300 W
Solar thermal: orientation 0°, angle 20°, gross total area 16 m2, flat collectors
Hybrid collectors: orientation 0°, angle 20°, gross total area 17 m2, power 2.95 kWp (concept C5)/12.39 kWp (concept C6)
Battery: capacity 10 kWh, Li-Ion.
The roof area of the building is sufficiently large to install a photovoltaic system with 12.6 kWp. In contrast to in the single-family house, hot water is used for hand washing only, so the water temperature at the tapping points can be reduced to 40 °C.
Table 5 gives the results of the Polysun simulation for the school in Addis Ababa, Ethiopia.
Due to the good weather and climate conditions, PV energy can produce a 50% higher gain in Ethiopia than in Sweden. The gain is approx. 1500 kWh/kWp. Approximately 80% of the photovoltaic electricity can be used directly since the total electricity demand mainly occurs during daytime hours for the school’s operation. In addition, the position on the equator clearly favors self-sufficiency. Throughout the whole year, the position of the sun is already high in the early morning hours. Although the photovoltaic energy production is only about 1000 kWh higher than the demand, a remarkably good degree of self-sufficiency of 84.2% is possible.
As a school, the heat requirement is not sufficient for the consumption of the generated heat of the hybrid collectors from concept C6. The concept has the worst degree of self-sufficiency. In rural Ethiopia in particular, a connection to an electricity grid is not common. Therefore, we analyzed the times of the day during which restrictions on energy supply are likely to happen without a grid. The respective deviation from complete energy self-sufficiency is determined in percentage points and summed up for each time of day.
Figure 18 shows the annual sum of the percentage points over time. A high deviation means that there is not enough power available for regular school operation. The greatest deviation occurs during the first hour of school operation. However, the deviations remain very small for most of the day. Only in the evening hours does the likelihood of restrictions rise.
5.4. Influence of Different Climate Zones on the Energy Self-Sufficiency: A Case Study of a Single-Family House in Different Climates
Finally, the influence of different climate zones on energy self-sufficiency was investigated for several locations (Berlin, Stockholm, Kiruna, Reykjavik, Murmansk, Tashkent, Mumbai, Addis Ababa). For this evaluation, a simplified building model was used in Polysun, which represents the energetic behavior of a single-family house as described above. The simulation considered a dynamic calculation, which was based on the weather data and the building data. Since the heat requirements for the three application cases were already available at the specified location, the simulation of these specific cases was based on the heating load, so there may have been minor deviations between the simplified model (Polysun) and the detailed model (IDA ICE).
In addition, the parameters of battery size, power consumption, and thermal insulation were varied for the locations. The results for high and low electricity consumption (3000 kWh/a and 6000 kWh/a) as well as for battery storage sizes of 10 kWh and 20 kWh are plotted in
Figure 19. Generally, the degree of self-sufficiency should decrease with decreasing storage size. The effect is noticeable in all locations except Reykjavik and less pronounced in locations with little sunlight (Kiruna, Murmansk). Battery storage in these locations can use a smaller design. If the power consumption is particularly high, the degree of self-sufficiency decreases as expected. The effect of the storage size is particularly pronounced in sunny locations (Mumbai, Tashkent).
The passive house standard, as used in the previous investigations, is relatively cost-intensive due to the complex technology with vacuum insulation panels (VIP). Therefore, the influence of such thermal insulation systems for different climate zones was also simulated and is presented in
Figure 20. For this purpose, the container building in the passive house standard (heat transfer coefficient U = 0. 12 W/m
2K) was compared to a conventional glass-wool-insulated container building (U = 0.27 W/m
2K). The heat capacity of the conventionally insulated building was lower by 30%. In hot regions, the high level of thermal insulation is not advantageous, so the buildings in these locations can be built more economically. The levels of self-sufficiency hardly differed here (Tashkent, Mumbai, and Addis Ababa). In the other cases, the degree of self-sufficiency was reduced moderately by approx. 3–8 percentage points.
6. Conclusions and Future Work
In this paper, we demonstrated how to systematically design container-based buildings with nearly zero-energy consumption. Owing to their lightweight construction, container buildings have economic and ecological advantages that can be further increased by using recycled containers. Based on a general climate analysis, an architectural design for three building types was derived. The building types were selected according to geographic, social, and cultural aspects in three different countries. The goal of almost-zero energy container buildings was achieved through the use of specific wall constructions with vacuum insulation panels and phase-change materials as well as with the design of various renewable energy systems consisting of photovoltaics, battery storage, solar thermal energy, and air and geothermal heat pumps, as well as combined heat and power plants. The selected locations differ considerably in terms of use and climatic conditions. Therefore, energy supply concepts were systematically developed for all applications, which should enable the highest possible degree of self-sufficiency whereby a degree of real self-sufficiency of approx. 80% can be considered a realistic goal when standard conditions for electricity demand and comfortable temperature are applied. This self-sufficiency goal can be achieved for the SFH and the school building with concept C1 through the use of photovoltaics, batteries, and air heat pumps. The MFH has a comparatively disadvantageous surface-area-specific energy requirement and surface-area-to-volume ratio, so photovoltaics are not sufficient here. Instead, concept C3 with a CHP unit is required for a high degree of self-sufficiency. However, the total annual energy production is often significantly higher than the actual annual energy demand, which makes the buildings on-grid self-sufficient when electricity can be fed into and consumed from the grid. The building solutions need to be adapted individually to the different applications and climates by using the described tools and strategies. The sophisticated wall construction with VIP is particularly beneficial for cool climates, while the PCM serves as a thermal buffer that can be useful in hot regions with large daytime temperature fluctuations so that the PCM can regenerate itself regularly.
In this paper, passive design potentials have been extensively evaluated at the early design stage, while thermal comfort and sensation should be further included in the following stage. Further work will target the lifecycle assessment and economic evaluation of the energy efficiency measures.
Author Contributions
Conceptualization, J.K., J.S. and X.Z.; methodology, A.S. and J.S.; formal analysis, J.K., A.S. and J.S.; writing—original draft preparation, J.K., A.S., J.S., S.K., P.K. and X.Z.; writing—review and editing, J.K., J.S. and X.Z., Funding acquisition, P.K. All authors have read and agreed to the published version of the manuscript.
Funding
This research was funded by Bundesministerium für Wirtschaft und Energie (BMWi), (ZF4574901AT8).
Conflicts of Interest
The authors declare no conflict of interest.
References
- Kamali, M.; Hewage, K. Life cycle performance of modular buildings: A critical review. Renew. Sustain. Energy Rev. 2016, 62, 1171–1183. [Google Scholar] [CrossRef]
- Elements Europe. Ressidential. Available online: https://elements-europe.com/sectors/residential/ (accessed on 20 July 2020).
- Harrouk, C. Alternative Healthcare Facilities: Architects Mobilize their Creativity in Fight against COVID-19. Available online: https://www.archdaily.com/937840/alternative-healthcare-facilities-architects-mobilize-their-creativity-in-fight-against-covid-19 (accessed on 11 August 2020).
- Karmode Prefabicated Technologies. Prefab Modular Hospital Buildings. Available online: https://karmod.com/en/page/prefab-modular-pandemic-hospitals (accessed on 11 August 2020).
- Shen, J.; Copertaro, B.; Zhang, X.; Koke, J.; Kaufmann, P.; Krause, S. Exploring the potential of climate-adaptive container building design under future climates scenarios in three different climate zones. Sustainability 2020, 12, 108. [Google Scholar] [CrossRef] [Green Version]
- Islam, H.; Zhang, G.; Setunge, S.; Muhammes, A. Life cycle assessment of shipping container home: A sustainable construction. Energy Build. 2016, 128, 673–685. [Google Scholar] [CrossRef]
- Dara, C.; Hachem-Vermette, C.; Assefa, G. Life cycle assessment and life cycle costing of container-based single-family housing in Canada: A case study. Build. Environ. 2019, 163, 106332. [Google Scholar] [CrossRef]
- Sharma, S. Maersk Line. What Happens When Containers Retire? Available online: https://www.supplychaindigital.com/scm/what-happens-when-containers-retire (accessed on 7 August 2019).
- Hermelink, A.; Schimschar, S.; Boermans, T.; Pagliano, L.; Zangheri, P.; Armani, R.; Voss, K.; Musall, E. Towards nearly zero-energy buildings: Definition of common principles under the EPBD. Ecofys. 2012. Available online: https://ec.europa.eu/energy/sites/ener/files/documents/nzeb_full_report.pdf (accessed on 12 September 2020).
- Rezaee, R.; Vakilinezhad, R.; Haymaker, J. Parametric framework for a feasibility study of zero-energy residential buildings for the design stage. J. Build. Eng. 2021, 35, 101960. [Google Scholar] [CrossRef]
- Rey-Hernández, J.M.; San José-Alonso, J.F.; Velasco-Gómez, E.; Yousif, C.; Rey-Martínez, F.J. Performance analysis of a hybrid ventilation system in a near zero energy building. Build. Environ. 2020, 185, 107265. [Google Scholar] [CrossRef]
- Medved, S.; Domjan, S.; Arkar, C. Contribution of energy storage to the transition from net zero to zero energy buildings. Energy Build. 2021, 236, 110751. [Google Scholar] [CrossRef]
- Aparecida da Guarda, E.L.; Mansuelo, R.; Domingos, A.; Hoffmann Martins Jorge, S.; Durante, L.C.; Machado Sanches, J.C.; Leão, M.; Apolônio Callejas, I.J. The influence of climate change on renewable energy systems designed to achieve zero energy buildings in the present: A case study in the Brazilian Savannah. Sustain. Cities Soc. 2020, 52, 101843. [Google Scholar] [CrossRef]
- Li, H.; Wang, S. Coordinated robust optimal design of building envelope and energy systems for zero/low energy buildings considering uncertainties. Appl. Energy 2020, 265, 114779. [Google Scholar] [CrossRef]
- Lindberg, K.B.; Fischer, D.; Doorman, G.; Korpås, M.; Sartori, I. Cost-optimal energy system design in Zero Energy Buildings with resulting grid impact: A case study of a German multi-family house. Energy Build. 2016, 127, 830–845. [Google Scholar] [CrossRef] [Green Version]
- Ferrara, M.; Fabrizio, E.; Virgone, J.; Filippi, M. Energy systems in cost-optimized design of nearly zero-energy buildings. Autom. Constr. 2016, 70, 109–127. [Google Scholar] [CrossRef]
- Kristiansen, A.B.; Satola, D.; Lee, K.; Zhao, B.; Ma, T.; Wang, R.Z.; Gustavsen, A.; Novakovic, V. Feasibility study of an off-grid container unit for industrial construction. Sustain. Cities Soc. 2020, 61, 102335. [Google Scholar] [CrossRef]
- Kristiansen, A.B.; Ma, T.; Wang, R.Z. Perspectives on industrialized transportable solar powered zero energy buildings. Renew. Sustain. Energy Rev. 2019, 108, 112–124. [Google Scholar] [CrossRef]
- Satola, D.; Kristiansen, A.B.; Houlihan-Wiberg, A.; Gustavsen, A.; Ma, T.; Wang, R.Z. Comparative life cycle assessment of various energy efficiency designs of a container-based housing unit in China: A case study. Build. Environ. 2020, 186, 107358. [Google Scholar] [CrossRef]
- Vijayalaxmi, J. Towards sustainable architecture—A case with Greentainer. Local Environ. 2010, 15, 245–259. [Google Scholar] [CrossRef]
- Trancossi, M.; Cannistraro, G.; Pascoa, J. Thermoelectric and solar heat pump use toward self sufficient buildings: The case of a container house. Therm. Sci. Eng. Prog. 2020, 18, 100509. [Google Scholar] [CrossRef]
- Taleb, H.; Elsebaei, M.; El-Attar, M. Enhancing the sustainability of shipping container homes in a hot arid region: A case study of Aswan in Egypt. Archit. Eng. Des. Manag. 2019, 15, 459–474. [Google Scholar] [CrossRef]
- Cornaro, C.; Rossi, S.; Cordiner, S.; Mulone, V.; Ramazzotti, L.; Rinaldi, Z. Energy performance analysis of STILE house at the Solar Decathlon 2015: Lessons learned. J. Build. Eng. 2017, 13, 11–27. [Google Scholar] [CrossRef]
- Bohm, M. Energy technology and lifestyle: A case study of the University at Buffalo 2015 Solar Decathlon home. Renew. Energy 2018, 123, 92–103. [Google Scholar] [CrossRef]
- ENSECO Produkt- und Verfahrensentwicklung zur Vorbereitung und Realisierung Kompletter Gebäude Verschiedener Nutzungsarten Mittels Energieautarker Container, Project Funding Code ZF4574901AT8; BMWi—Federal Ministry for Economic Affairs and Energy: Berlin, Germany, 2018–2020.
- Matsumoto, H.; Tsuzuki, K.; Susanti, L. Bioclimatic Analysis in Pre-Design Stage of Passive House in Indonesia. Buildings 2017, 2, 24. [Google Scholar]
- Sayigh, A.; Marafia, A.H. Chapter 1—Thermal comfort and the development of bioclimatic concept in building design. Renew. Sustain. Energy Rev. 1998, 2, 3–24. [Google Scholar] [CrossRef]
- Lam, J.C.; Yang, L.; Liu, J. Development of passive design zones in China using Bioclimatic approach. Energy Conversat. Manag. 2006, 47, 746–762. [Google Scholar] [CrossRef]
- Rakoto-Joseph, O.; Garde, F.; David, M.; Adelard, L.; Randriamanantany, Z.A. Development of climatic zones and passive solar design in Madagascar. Energy Convers. Manag. 2009, 50, 1004–1010. [Google Scholar] [CrossRef]
- Singh, M.K.; Mahapatra, S.; Atreya, S.K. Development of bio-climatic zones in north-east India. Energy Build. 2007, 39, 1250–1257. [Google Scholar] [CrossRef]
- Climatic Data for Building Design Standards. ANSI/ASHRAE Standard 169-2020, American Society of Heating, Refrigerating and Air-Conditioning Engineers; ASHRAE: Atlanta, GA, USA, 2020; ISSN 1041-233. [Google Scholar]
- Deutscher Wetterdienst. Clima Data Center—OpenData-Bereich. Available online: https://www.dwd.de/DE/klimaumwelt/cdc/cdc_node.html (accessed on 5 September 2019).
- EnergyPlus. Weather Data. Available online: https://energyplus.net/weather (accessed on 5 September 2019).
- American Society of Heating, Refrigerating and Air-Conditioning Engineers (ASHRAE), International Weather for Energy Calculation (IWEC). Available online: http://www.equaonline.com/ice4user/indexIWEC.html (accessed on 5 September 2019).
- Länderprofil Äthiopien: Informationen zur Nutzung und Förderung erneuerbarer Energien für Unternehmen der deutschen Branche, Stand August 2014. Available online: https://www.dena.de/fileadmin/dena/Dokumente/Pdf/3110_Laenderprofil_AEthiopien_REG.pdf (accessed on 5 September 2019).
Figure 1.
Design stages for a nearly zero-energy container building.
Figure 1.
Design stages for a nearly zero-energy container building.
Figure 2.
Givoni–Milne Bioclimatic chart.
Figure 2.
Givoni–Milne Bioclimatic chart.
Figure 3.
All selected representative locations on a world map. Yellow background color indicates the locations for detailed analysis.
Figure 3.
All selected representative locations on a world map. Yellow background color indicates the locations for detailed analysis.
Figure 4.
Frequency distribution of daily global radiation for selected cities. (a): Hot and warm climate zones 1–3. (b): Cool and cold climate zones 4–7.
Figure 4.
Frequency distribution of daily global radiation for selected cities. (a): Hot and warm climate zones 1–3. (b): Cool and cold climate zones 4–7.
Figure 5.
Annual temperature–time integrals for different cities. Temperatures above 23 °C (cooling potential) and below 20 °C (heating potential).
Figure 5.
Annual temperature–time integrals for different cities. Temperatures above 23 °C (cooling potential) and below 20 °C (heating potential).
Figure 6.
Hourly psychometric chart with Givoni Bioclimatic Chart overlay, Berlin, Germany.
Figure 6.
Hourly psychometric chart with Givoni Bioclimatic Chart overlay, Berlin, Germany.
Figure 7.
Prevailing winds in winter and summer in Berlin, Germany.
Figure 7.
Prevailing winds in winter and summer in Berlin, Germany.
Figure 8.
A passive design case for a multi-family house in Berlin, Germany.
Figure 8.
A passive design case for a multi-family house in Berlin, Germany.
Figure 9.
Hourly psychometric chart with Givoni Bioclimatic Chart overlay, Stockholm, Sweden.
Figure 9.
Hourly psychometric chart with Givoni Bioclimatic Chart overlay, Stockholm, Sweden.
Figure 10.
Prevailing winds in winter and summer, Stockholm, Sweden.
Figure 10.
Prevailing winds in winter and summer, Stockholm, Sweden.
Figure 11.
A passive design case for single-family house in Stockholm, Sweden.
Figure 11.
A passive design case for single-family house in Stockholm, Sweden.
Figure 12.
Hourly psychometric chart with Givoni Bioclimatic Chart overlay, Addis Ababa, Ethiopia.
Figure 12.
Hourly psychometric chart with Givoni Bioclimatic Chart overlay, Addis Ababa, Ethiopia.
Figure 13.
Prevailing winds in winter and summer, Addis Ababa, Ethiopia.
Figure 13.
Prevailing winds in winter and summer, Addis Ababa, Ethiopia.
Figure 14.
A passive design case for a school in Addis Ababa, Ethiopia.
Figure 14.
A passive design case for a school in Addis Ababa, Ethiopia.
Figure 15.
Construction of a multifunctional roof assembly.
Figure 15.
Construction of a multifunctional roof assembly.
Figure 16.
Construction of a multifunctional floor assembly.
Figure 16.
Construction of a multifunctional floor assembly.
Figure 17.
Construction of a side wall assembly.
Figure 17.
Construction of a side wall assembly.
Figure 18.
Probability of not meeting the electricity demand. School concept C1 in Addis Ababa.
Figure 18.
Probability of not meeting the electricity demand. School concept C1 in Addis Ababa.
Figure 19.
Comparison of the degree of self-sufficiency for different power consumption and battery storage sizes for several locations (single-family house).
Figure 19.
Comparison of the degree of self-sufficiency for different power consumption and battery storage sizes for several locations (single-family house).
Figure 20.
Degree of self-sufficiency for several locations with a changed heat transfer coefficient (U) of the building with a 20-kWh battery (single-family house).
Figure 20.
Degree of self-sufficiency for several locations with a changed heat transfer coefficient (U) of the building with a 20-kWh battery (single-family house).
Table 1.
The selected regions and the representative climate zones with data from ASHRAE 169–2020 [
31].
Table 1.
The selected regions and the representative climate zones with data from ASHRAE 169–2020 [
31].
| No. | Location | Country | Climatic Zone |
|---|
| 1 | Mumbai | India | 0A Extremely Hot—Humid |
| 2 | Recife | Brazil | 0A Extremely Hot—Humid |
| 3 | Abu Dhabi | United Arab Emirates | 0B Extremely Hot—Dry |
| 4 | Kharga | Egypt | 1B Very Hot—Dry |
| 5 | Addis Ababa | Ethiopia | 2A Hot—Humid |
| 6 | Melbourne | Australia | 3A Warm—Humid |
| 7 | Mexico City | Mexico | 3A Warm—Humid |
| 8 | Cape Town | South Africa | 3C Warm—Marine |
| 9 | Ankara | Turkey | 4A Mixed—Humid |
| 10 | Tashkent | Uzbekistan | 4A Mixed—Humid |
| 11 | Berlin | Germany | 5A Cool—Humid |
| 12 | Stockholm | Sweden | 6A Cold—Humid |
| 13 | Reykjavik | Iceland | 6A Cold—Humid |
| 14 | Murmansk | Russia | 7 Very Cold |
| 15 | Kiruna | Sweden | 7 Very Cold |
Table 2.
Climatic characteristics for the sites under consideration. Background colors vary from red to yellow to green for each column, with red indicating the maximum value and dark green the minimum value.
Table 2.
Climatic characteristics for the sites under consideration. Background colors vary from red to yellow to green for each column, with red indicating the maximum value and dark green the minimum value.
| | Radiation Global | Average External Temp. | Minimum External Temp. | Maximum External-Temp. | Average Daily Temp. Fluctuation | Average Wind Speed | Hours of SUNSHINE Per Year |
|---|
| | kWh/m2 | °C | °C | °C | °C | m/s | h |
| Kiruna | 747.8 | −0.87 | −29.1 | 22.6 | 7.6 | 3.8 | 1239 |
| Reykjawik | 780.5 | 4.7 | −9.6 | 18.6 | 4.7 | 6 | 1163 |
| Murmansk | 816.9 | 1.8 | −34.4 | 28.7 | 6.9 | 2.9 | 1708 |
| Stockholm | 921.8 | 6.6 | −16.9 | 27.1 | 6.7 | 3.4 | 2256 |
| Berlin | 985.5 | 9.9 | −8.8 | 33.1 | 7 | 4.2 | 2175 |
| Ankara | 1484 | 9.8 | −21.9 | 34.1 | 12 | 2.5 | 2200 |
| Melbourne | 1583.2 | 13.8 | 0 | 38.9 | 9.3 | 4.9 | 2506 |
| Tashkent | 1710.3 | 14.7 | −10.9 | 40.5 | 11.6 | 1.6 | 2638 |
| Mexico City | 1816.3 | 16.9 | 2.6 | 30.8 | 13.5 | 2.6 | 2515 |
| Mumbai | 1829.6 | 27.1 | 12.5 | 40 | 7.6 | 2.1 | 1944 |
| Cape Town | 1900.7 | 16.5 | 0.9 | 33.9 | 9.4 | 5.1 | 3100 |
| Kharga | 1919.3 | 21.7 | 7 | 43.4 | 10.8 | 3.4 | 3715 |
| Recife | 1966 | 27.5 | 19 | 38.4 | 6.8 | 3.3 | 2454 |
| Addis Ababa | 2033.7 | 16.2 | 0.6 | 28.2 | 11.4 | 3.9 | 2421 |
| Abu Dhabi | 2204.6 | 27.2 | 5 | 47 | 12.4 | 3.6 | 3492 |
Table 3.
Results of the Polysun simulation for the multi-family house in Berlin, Germany.
Table 3.
Results of the Polysun simulation for the multi-family house in Berlin, Germany.
| Multifamily House Berlin | Units | C1: AHP + PV | C2: GHP + PV | C3: CHP + PV | C4: AHP + ST + PV | C5: AHP + PVT + PV | C6: AHP + PVT | C7: AHP + PV + WT |
|---|
| Electricity demand for heat generation | kWh | 31,425 | 11,322 | 51.0 | 31,390 | 32,650 | 71 | 28,222 |
| Degree of self-sufficiency | % | 30.8 | 39.7 | 84.5 | 25.2 | 29.7 | 45.6 | 38.3 |
| Production PV (AC) | kWh | 19,233 | 19,233 | 19,233 | 14,879 | 18,848 | 17,888 | 19,233 |
| Self-sufficiency | kWh | 15,272 | 11,703 | 15,416 | 12,604 | 15,104 | 8331 | 13,770 |
| Purchased electricity | kWh | 34,397 | 17,876 | 2908 | 37,025 | 35,789 | 9995 | 32,694 |
Table 4.
Results of the Polysun simulation for the single-family house in Stockholm, Sweden.
Table 4.
Results of the Polysun simulation for the single-family house in Stockholm, Sweden.
| Single-Family House Stockholm | Units | C1: AHP + PV | C2: GHP + PV | C3: CHP + PV | C4: AHP + ST + PV | C5: AHP + PVT + PV | C6: AHP + PVT | C7: AHP + PV + WT |
|---|
| Low electricity demand: 3000 kWh |
| Electricity demand for heat generation | kWh | 6850 | 4996 | 169 | 5596 | 6815 | 332 | 6561 |
| Degree of self-sufficiency | % | 80.2 | 74.3 | 84.5 | 72.8 | 75.2 | 72.2 | 80.3 |
| Production PV (AC) | kWh | 22,439 | 22,439 | 22,439 | 19,163 | 20,532 | 12,649 | 22,439 |
| Self-sufficiency | kWh | 8794 | 6908 | 3776 | 7288 | 8380 | 3366 | 8684 |
| Purchased electricity | kWh | 2210 | 2504 | 721 | 2709 | 2777 | 1313 | 1183 |
| High electricity demand: 6000 kWh |
| Electricity demand for heat generation | kWh | 6807 | 4915 | 169 | 5463 | 6729 | 332 | 6492 |
| Degree of self sufficiency | % | 76.5 | 64.2 | 92.3 | 69.9 | 71.7 | 67.5 | 75.1 |
| Production PV (AC) | kWh | 22,439 | 22,439 | 22,439 | 19,163 | 20,532 | 12,649 | 22,439 |
| Self-sufficiency | kWh | 10,827 | 7843 | 6894 | 8951 | 10,093 | 5191 | 10,372 |
| Purchased electricity | kWh | 3325 | 4523 | 635 | 3868 | 3992 | 2506 | 1875 |
Table 5.
Results of the Polysun simulation for the school in Addis Ababa, Ethiopia.
Table 5.
Results of the Polysun simulation for the school in Addis Ababa, Ethiopia.
| School Building Addis Ababa | Units | C1: AHP + PV | C2: GHP + PV | C3: CHP + PV | C4: AHP + ST + PV | C5: AHP + PVT + PV | C6: AHP + PVT | C7: AHP + PV + WT |
|---|
| Electricity demand for heat generation | kWh | 6903 | 4910 | 854 | 4036 | 5244 | 1150 | 6085 |
| Degree of self-sufficiency | % | 84.2 | 79.4 | 91.7 | 75.6 | 81.7 | 64.7 | 85.1 |
| Production PV (AC) | kWh | 18,906 | 18,906 | 18,906 | 14,850 | 17,112 | 10,609 | 18,906 |
| Self-sufficiency | kWh | 15,146 | 12,696 | 10,948 | 11,432 | 13,338 | 7912 | 14,285 |
| Purchased electricity | kWh | 2873 | 3365 | 1010 | 3731 | 3052 | 4359 | 2936 |
| Publisher’s Note: MDPI stays neutral with regard to jurisdictional claims in published maps and institutional affiliations. |
© 2021 by the authors. Licensee MDPI, Basel, Switzerland. This article is an open access article distributed under the terms and conditions of the Creative Commons Attribution (CC BY) license (https://creativecommons.org/licenses/by/4.0/).


 ,
, 


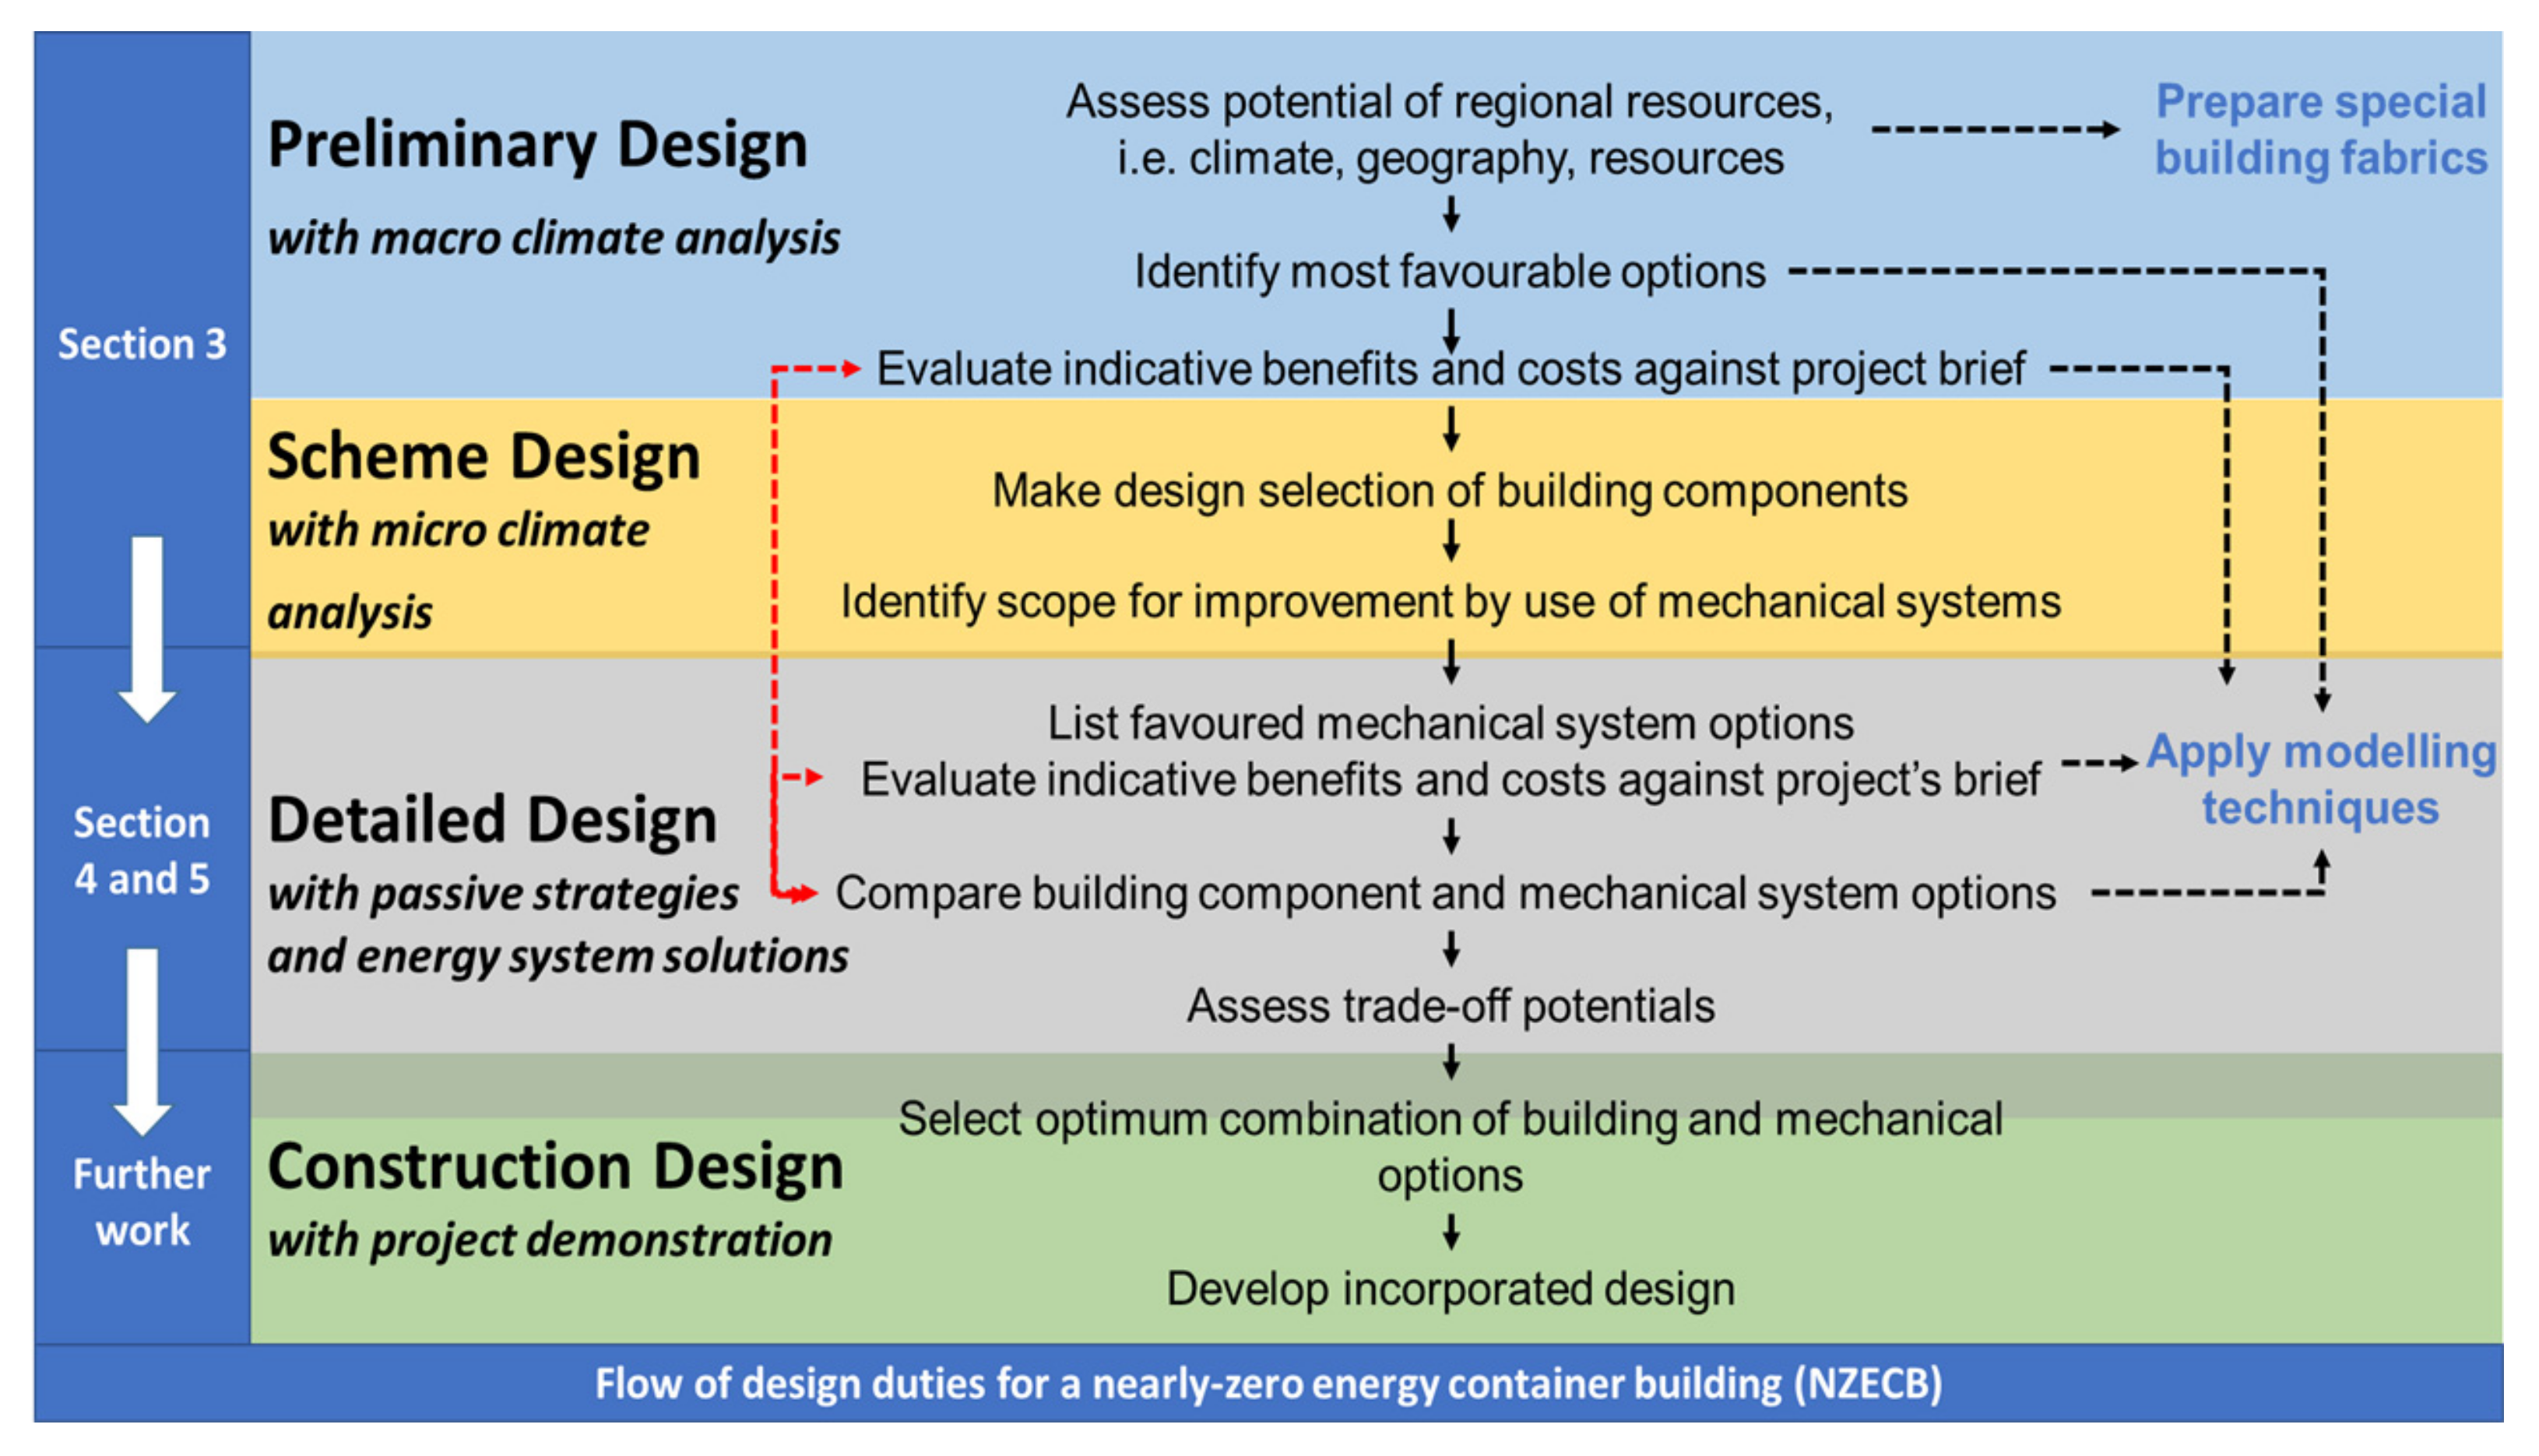
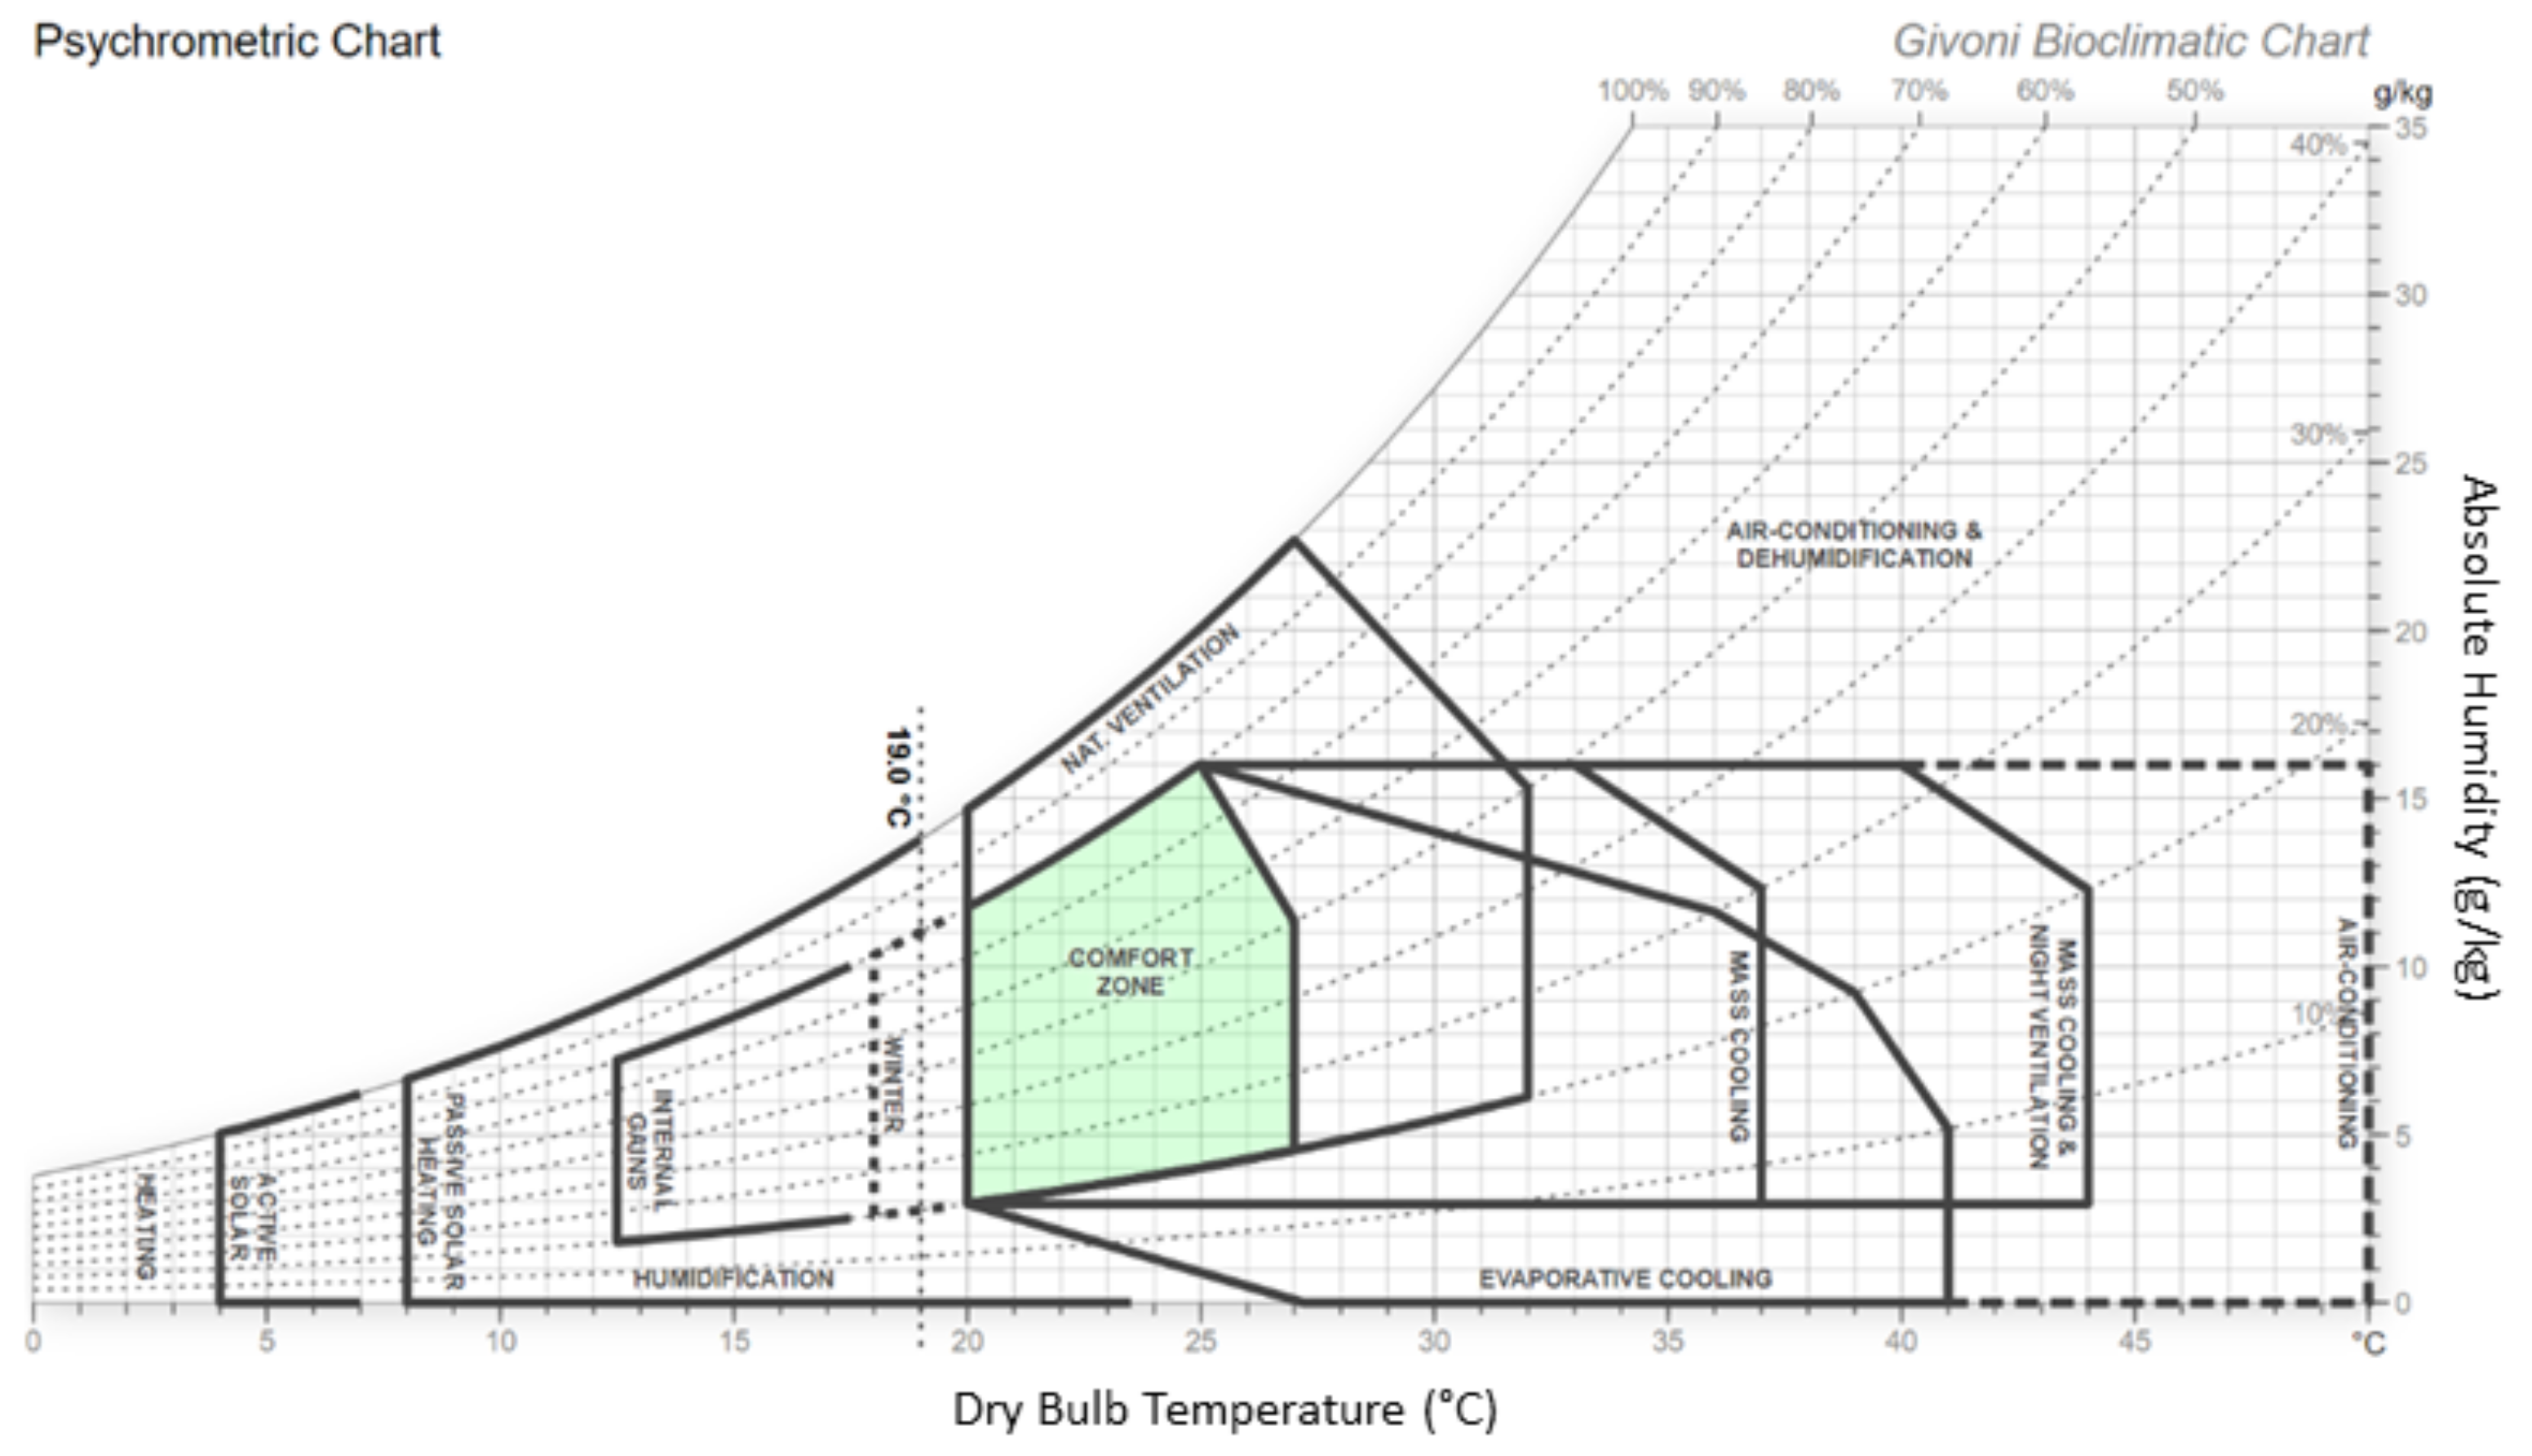
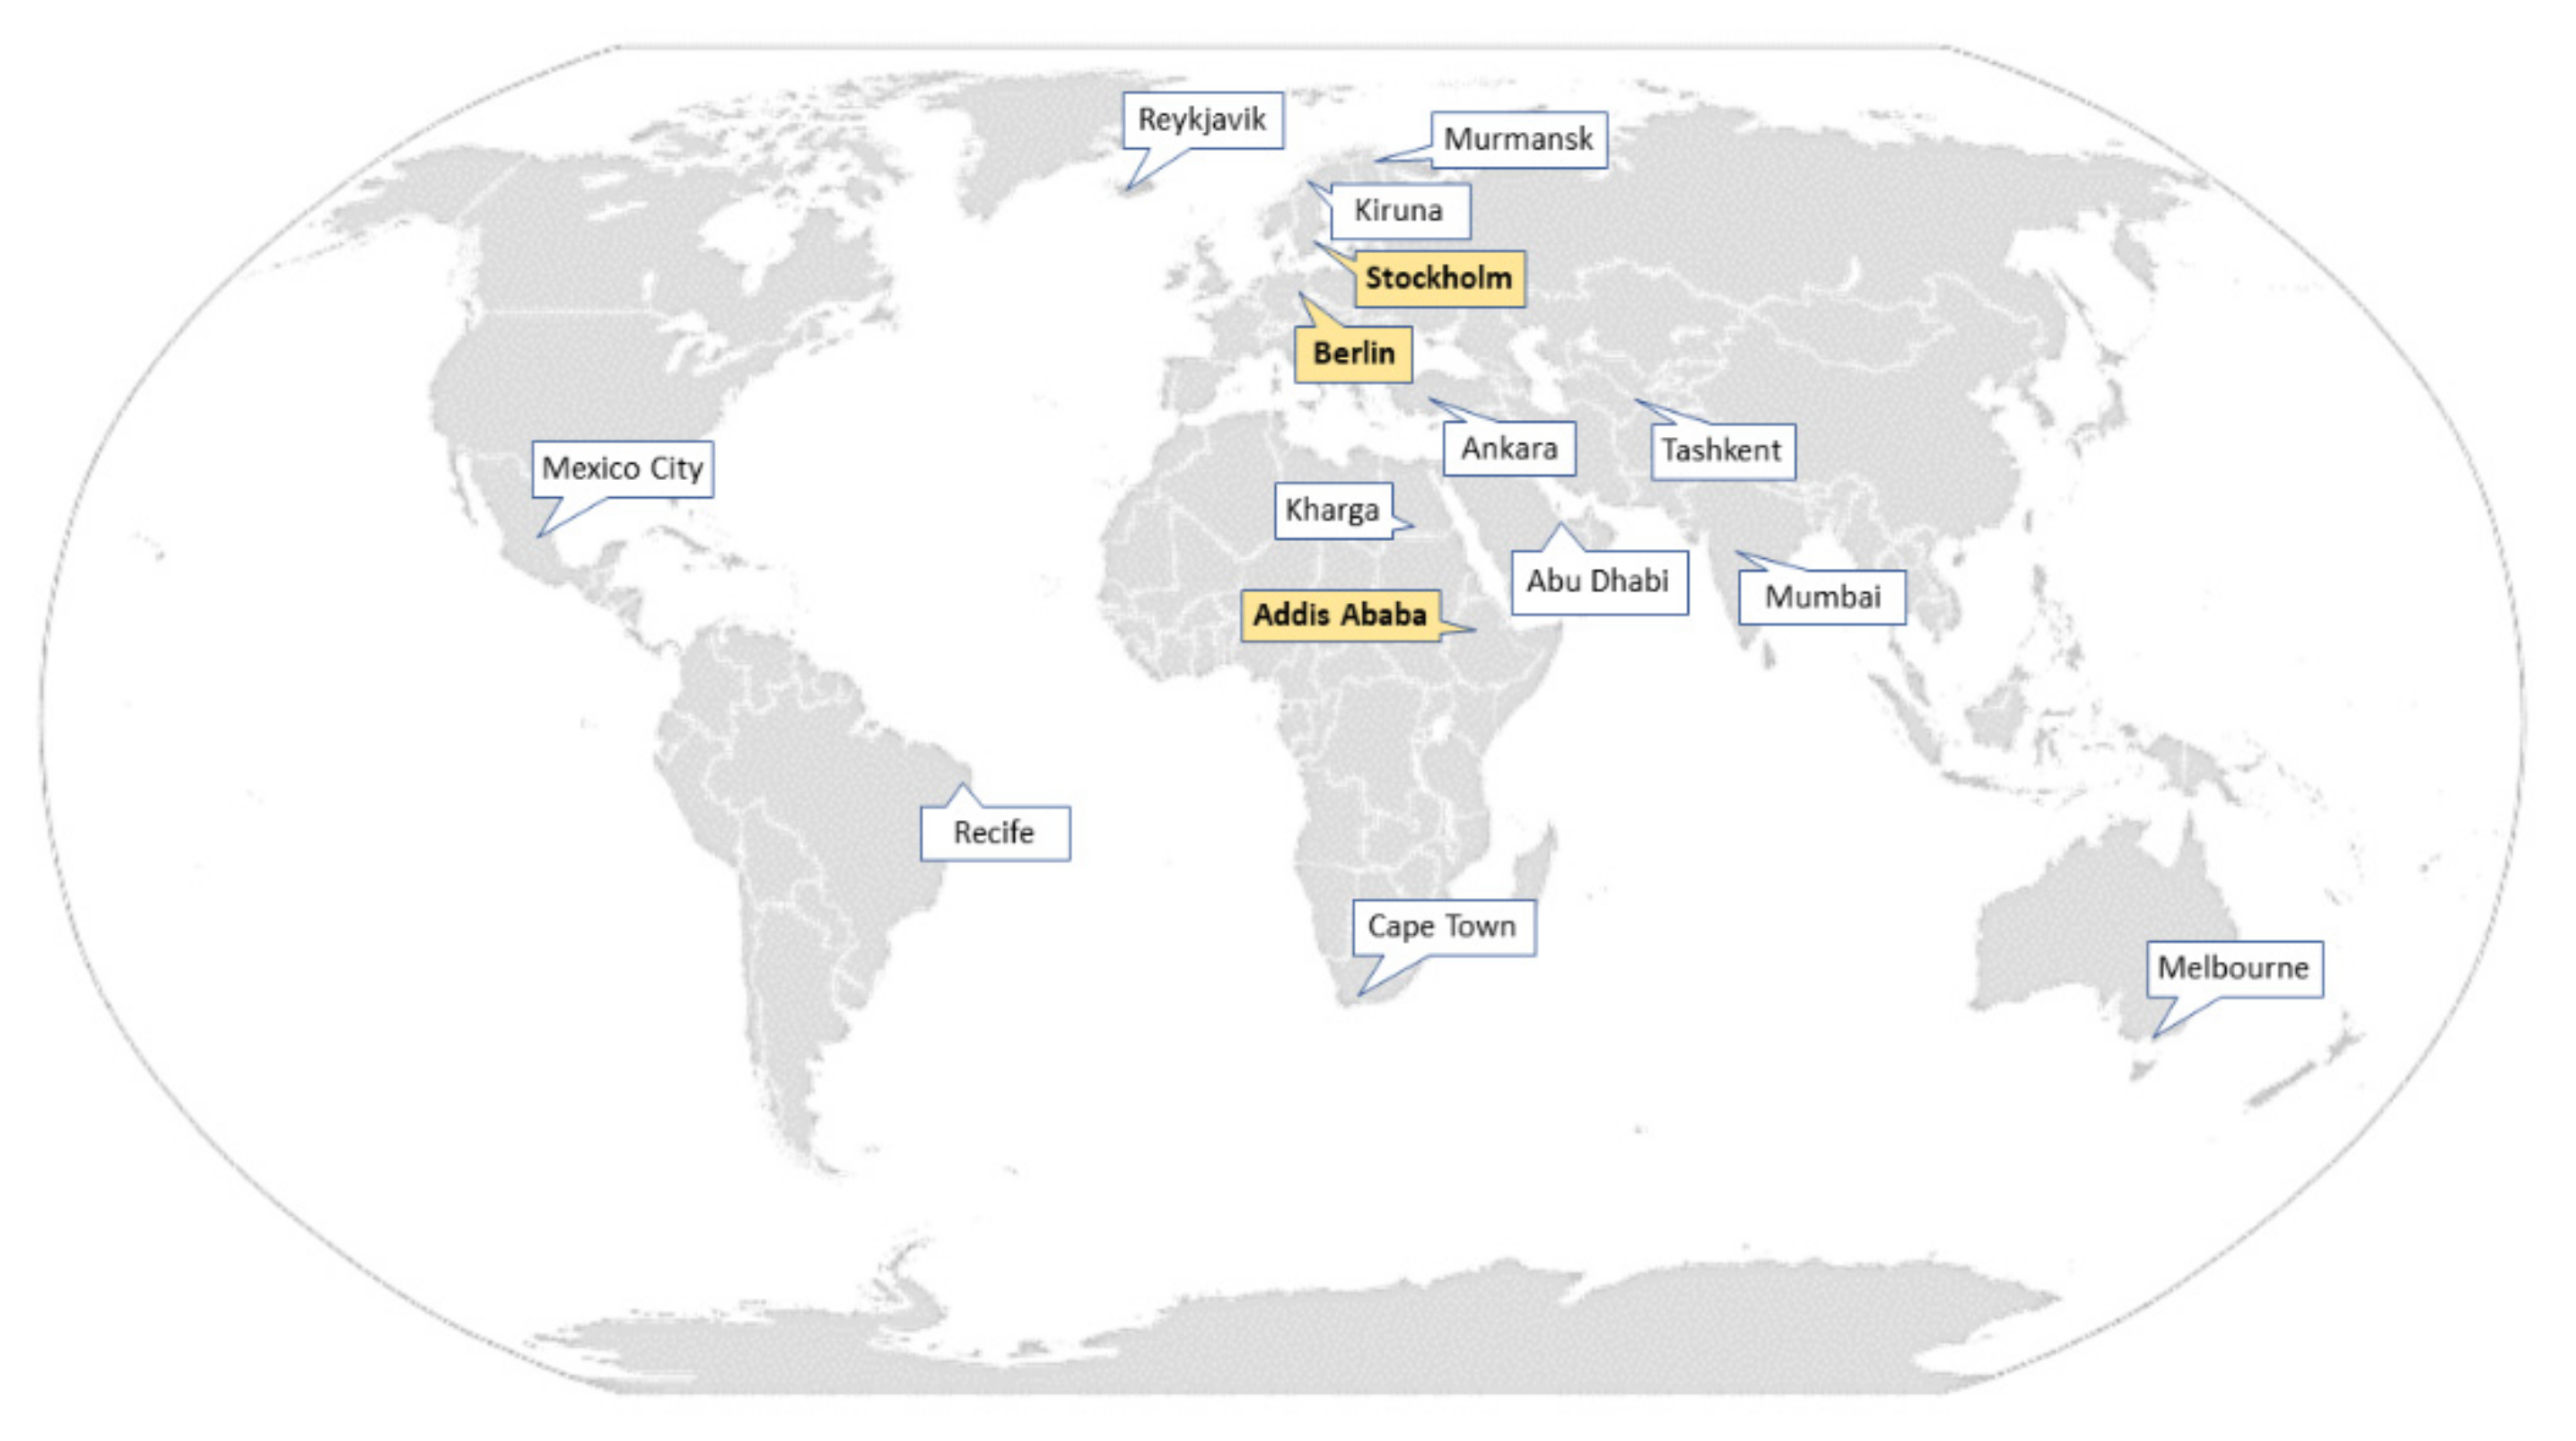
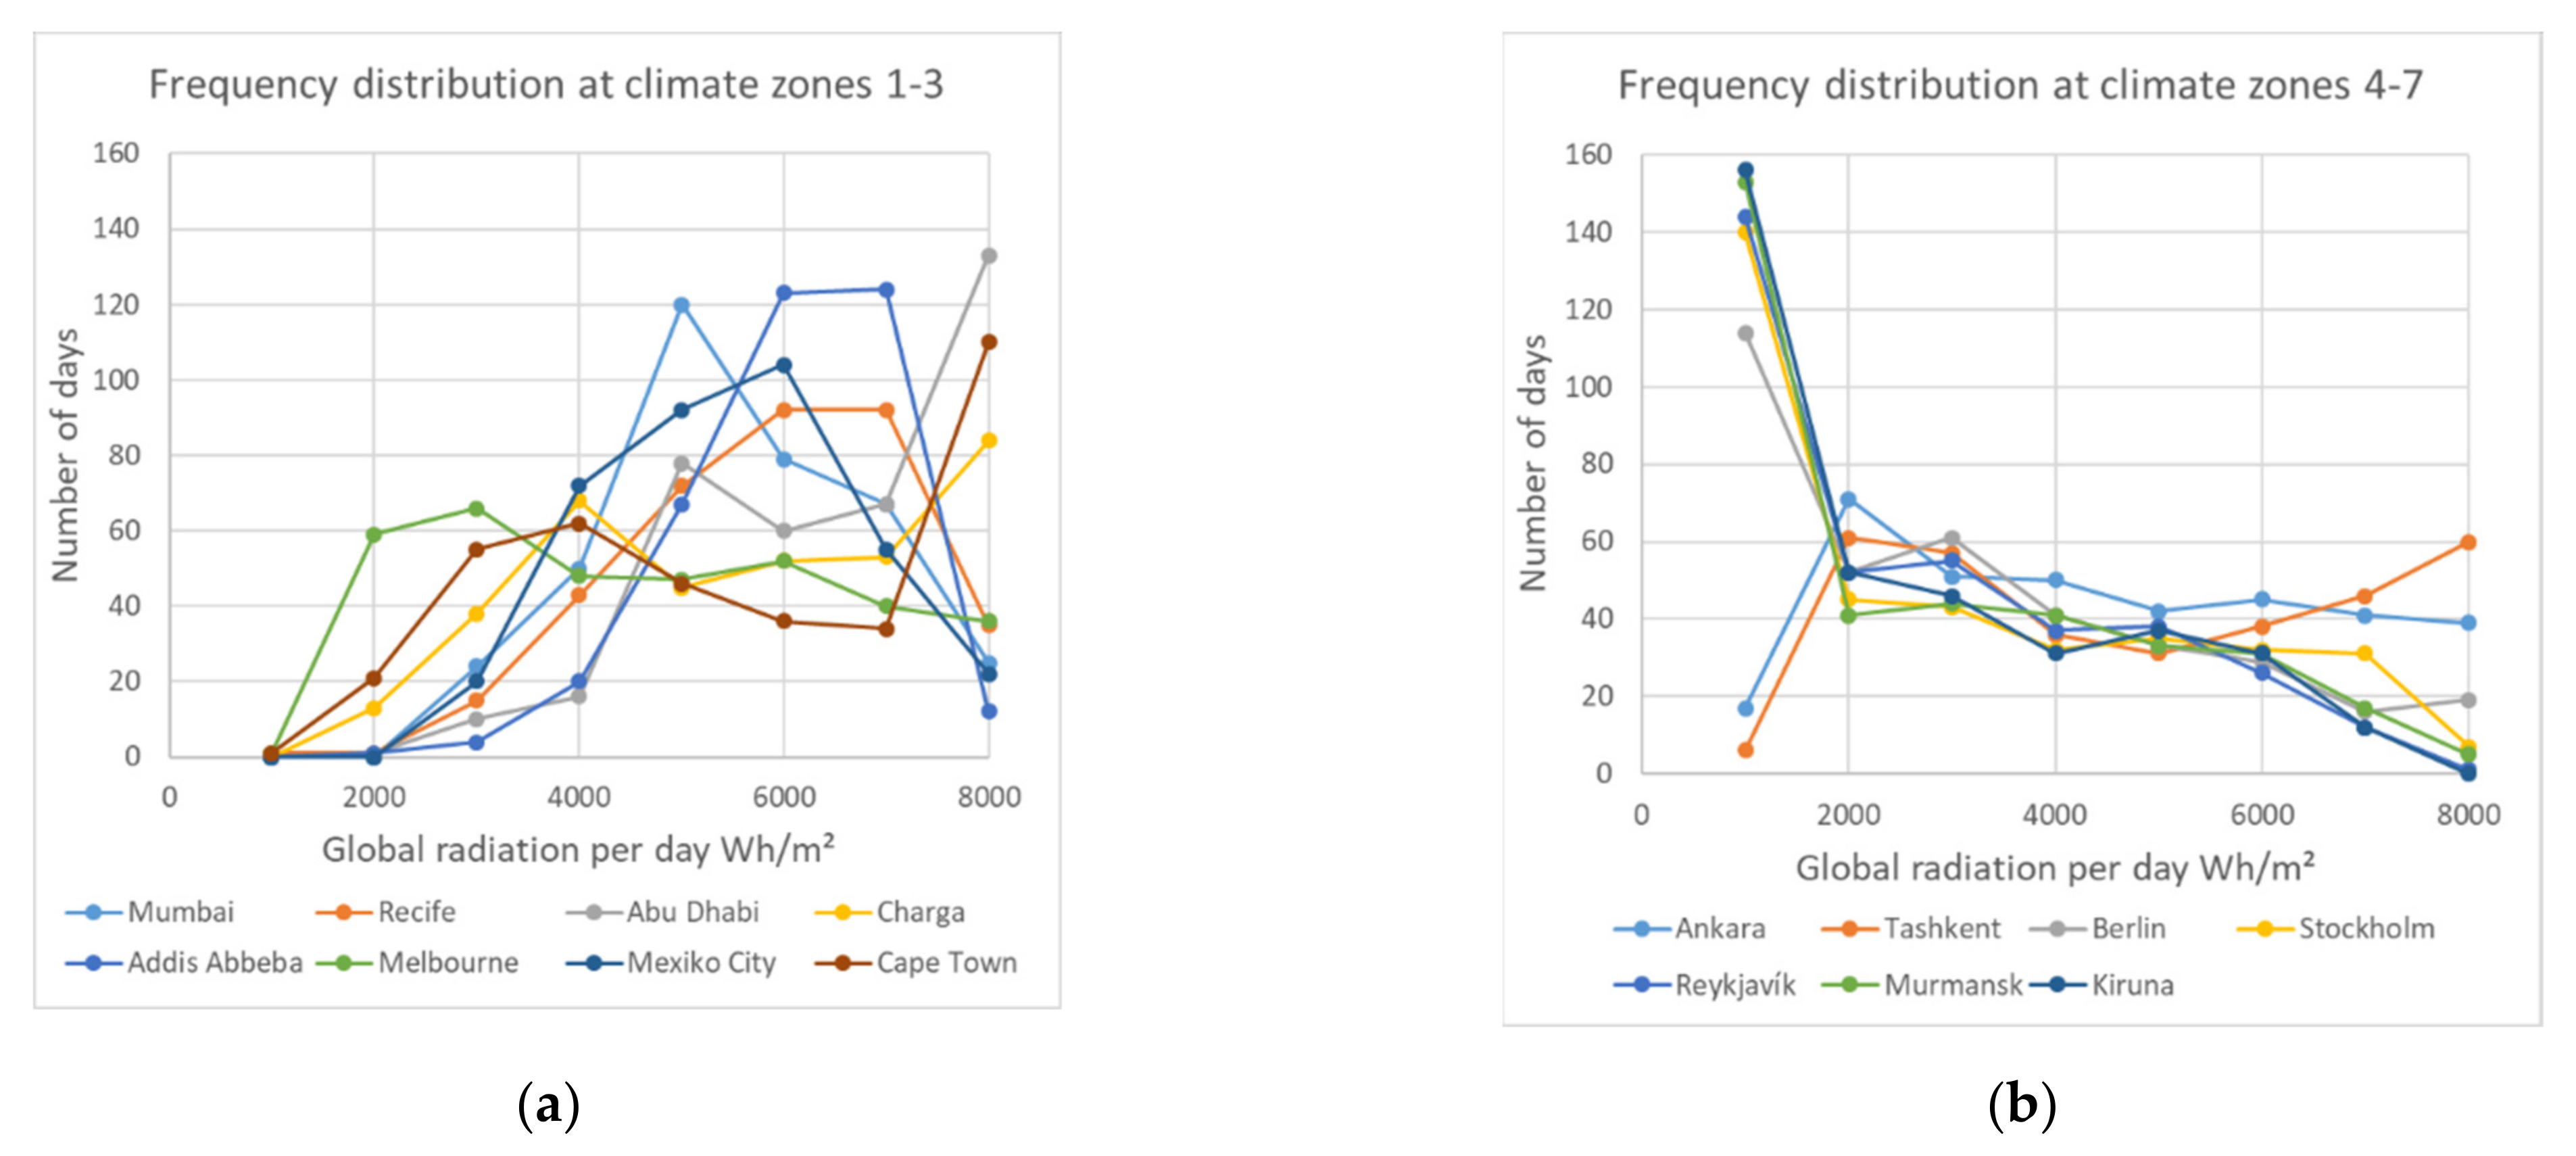
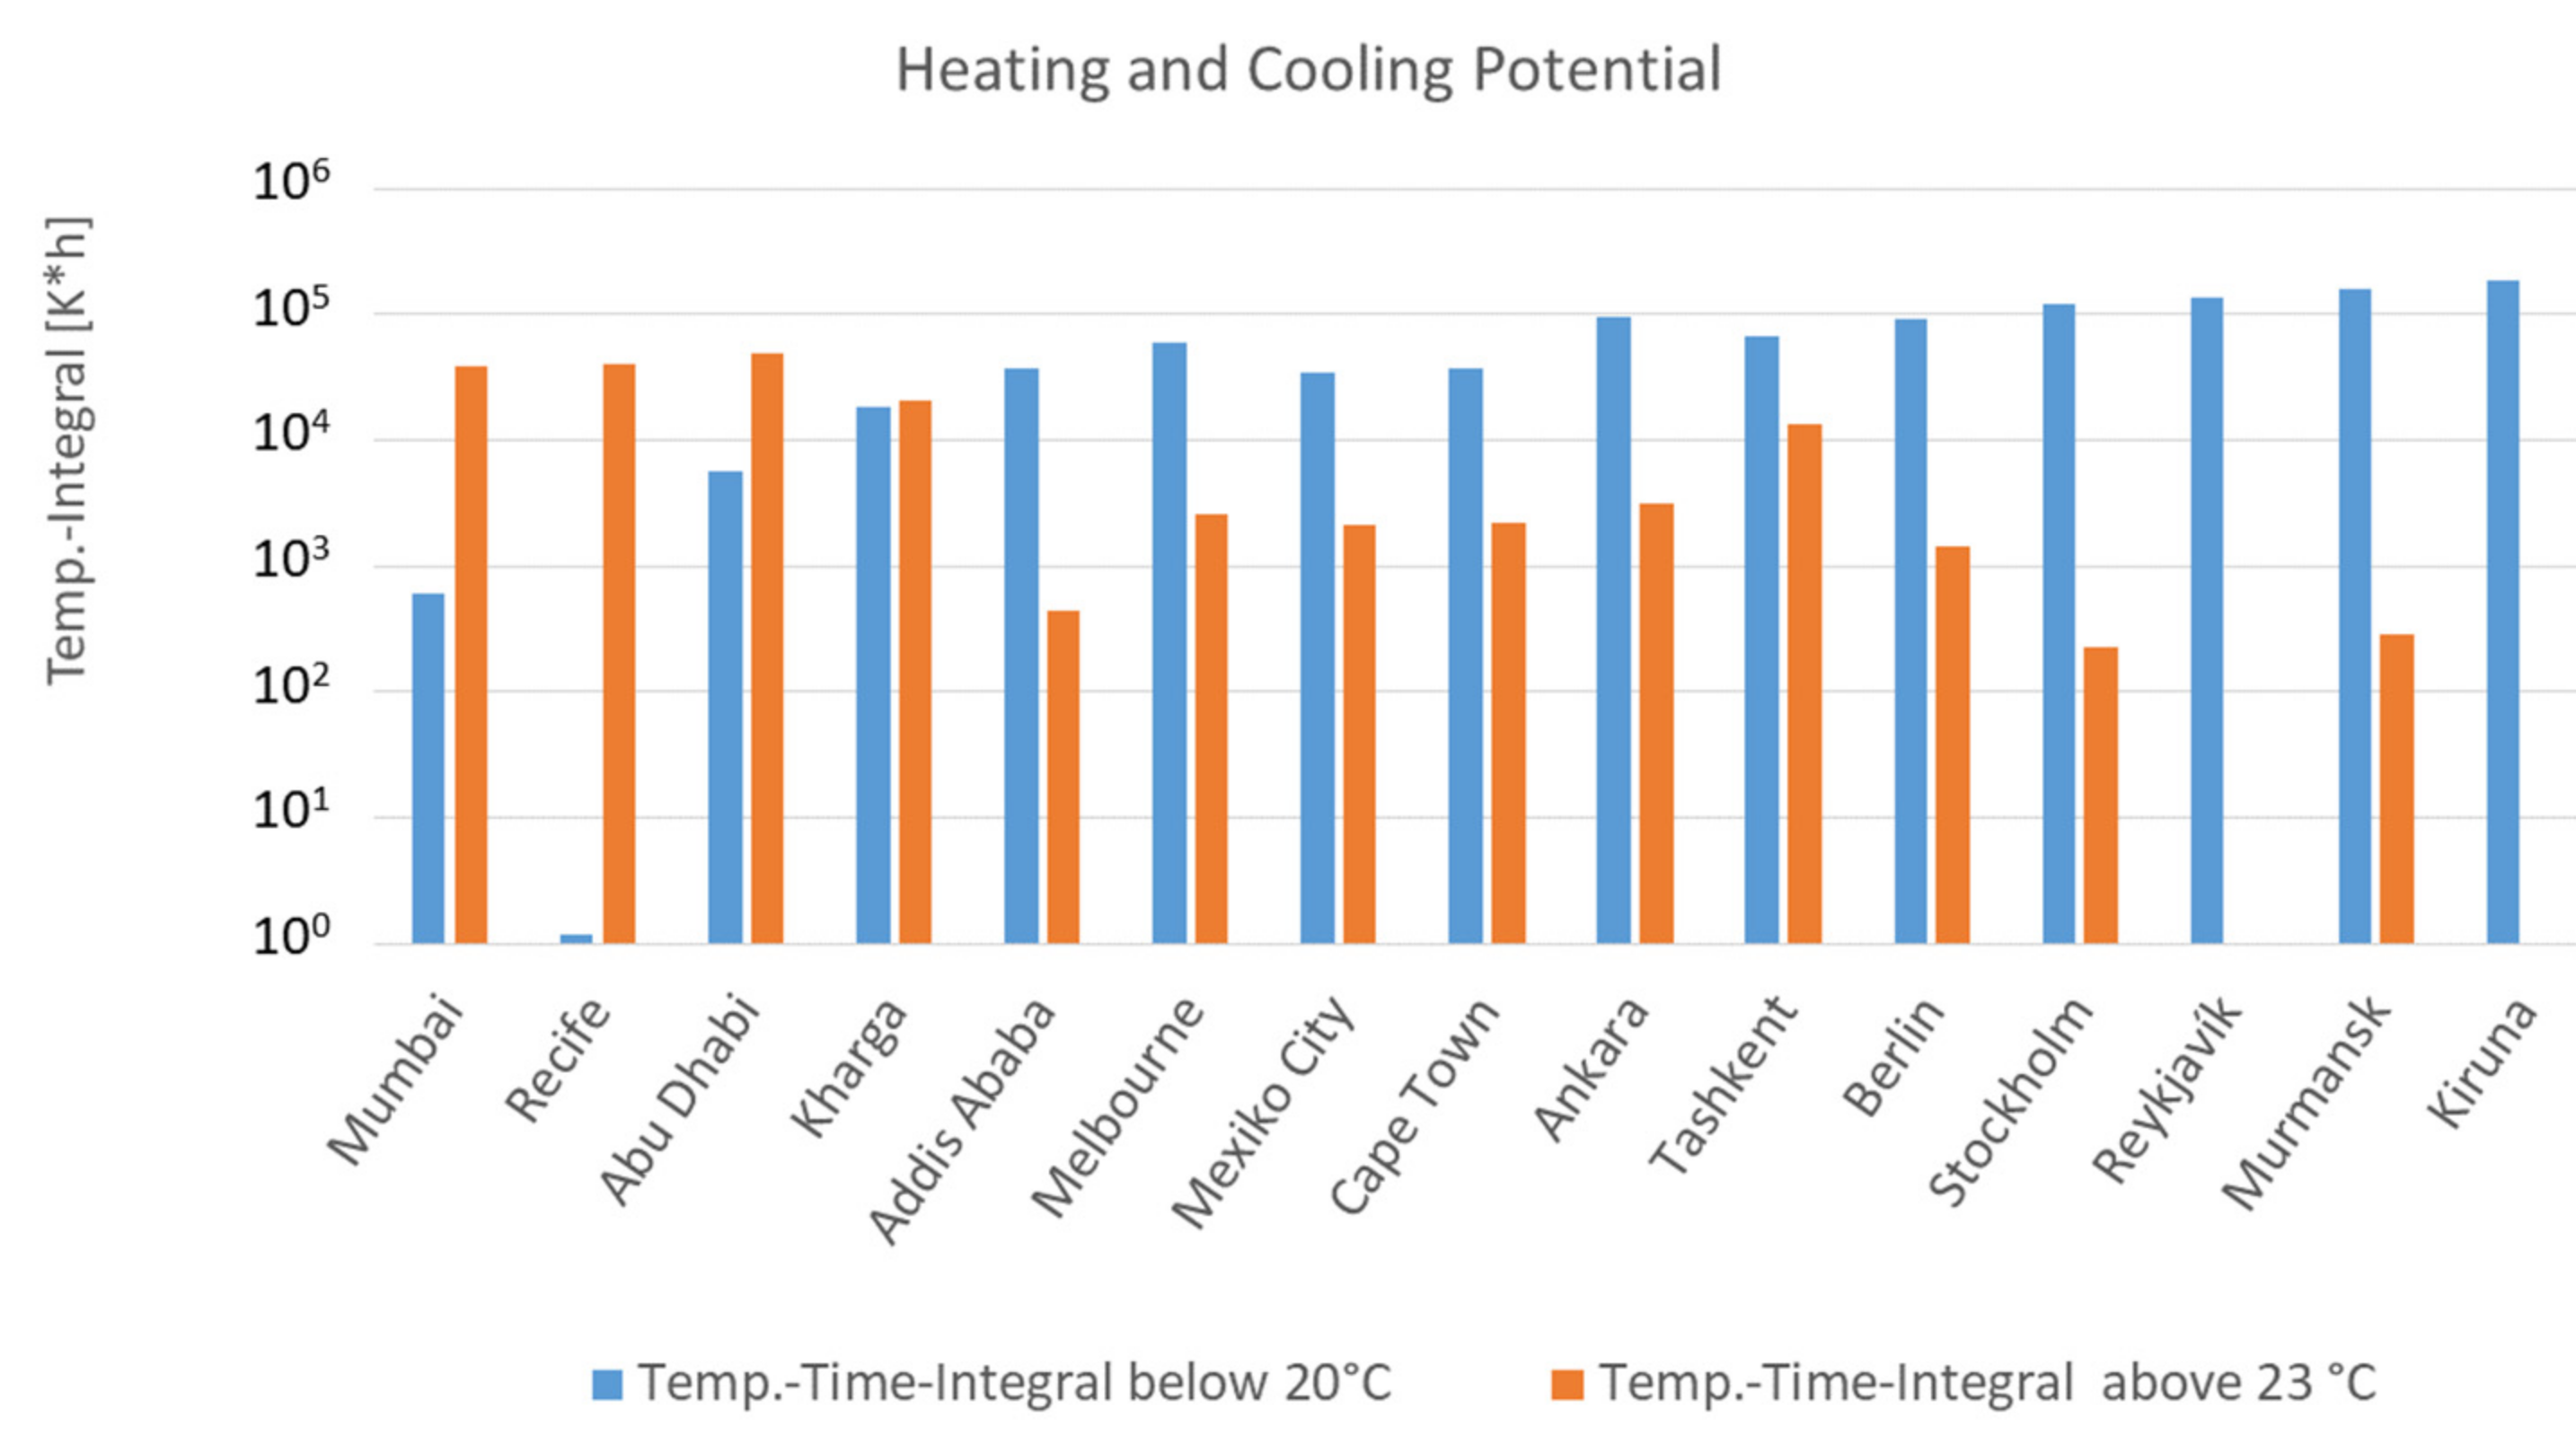
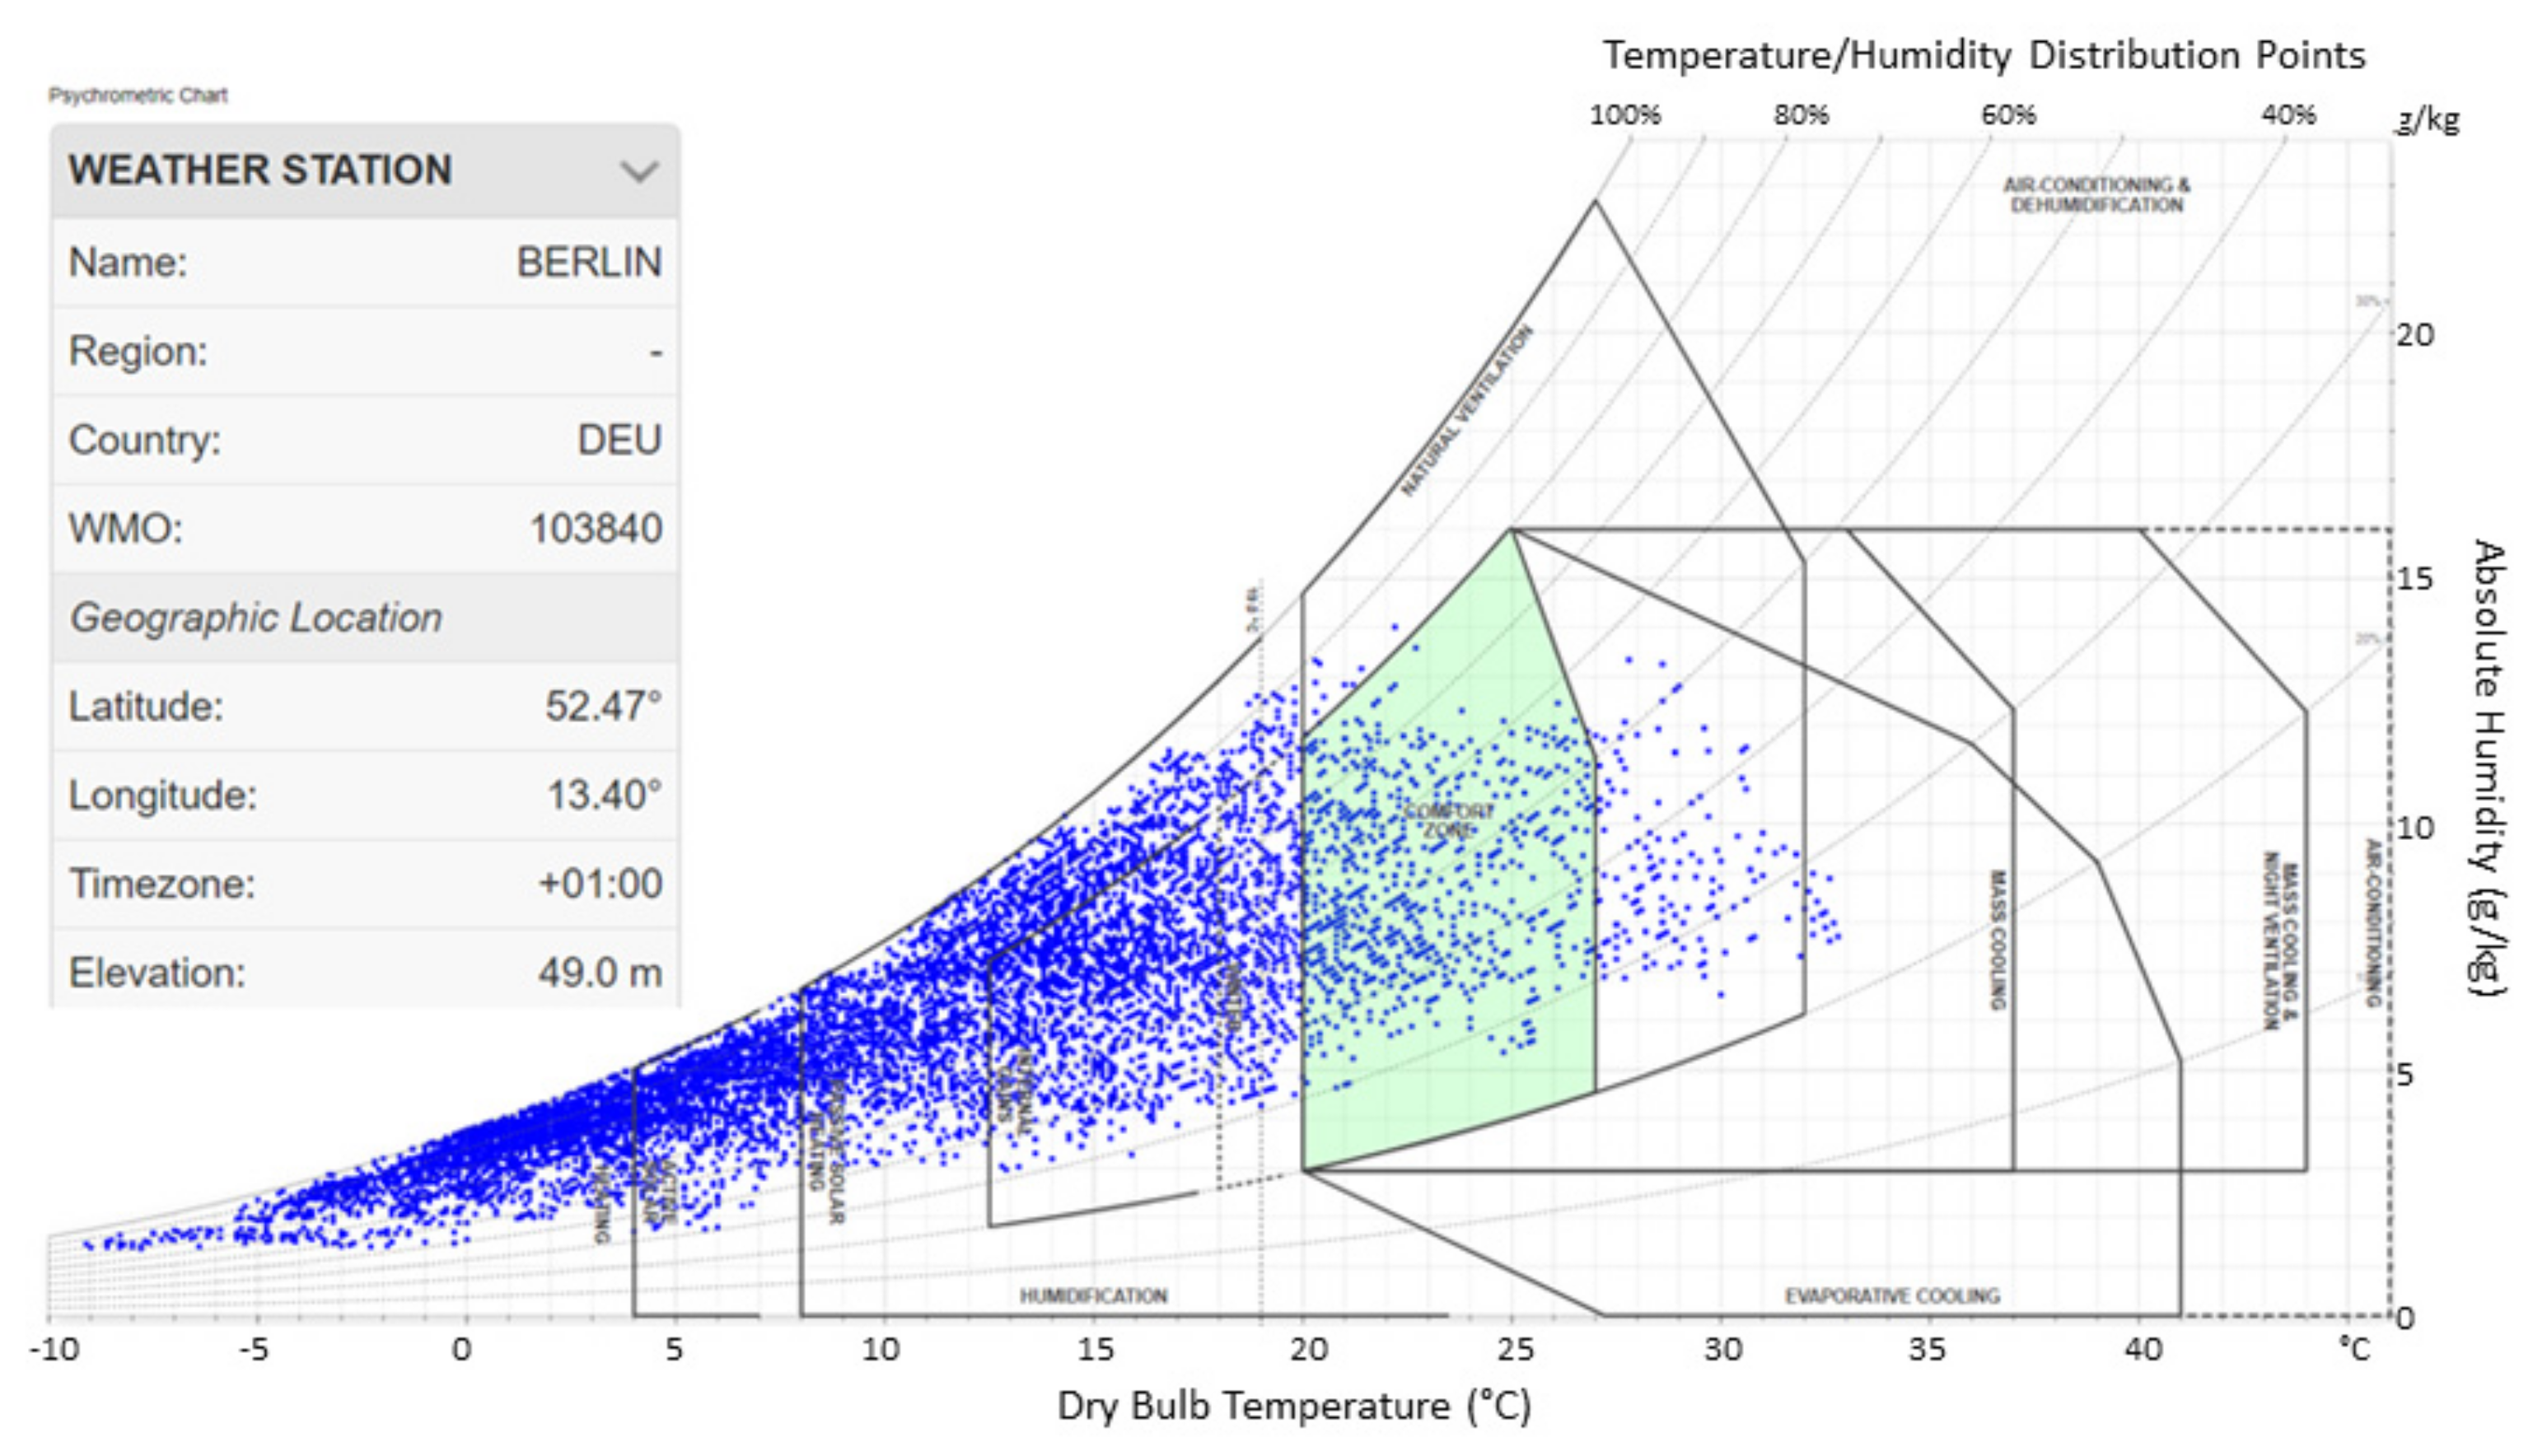
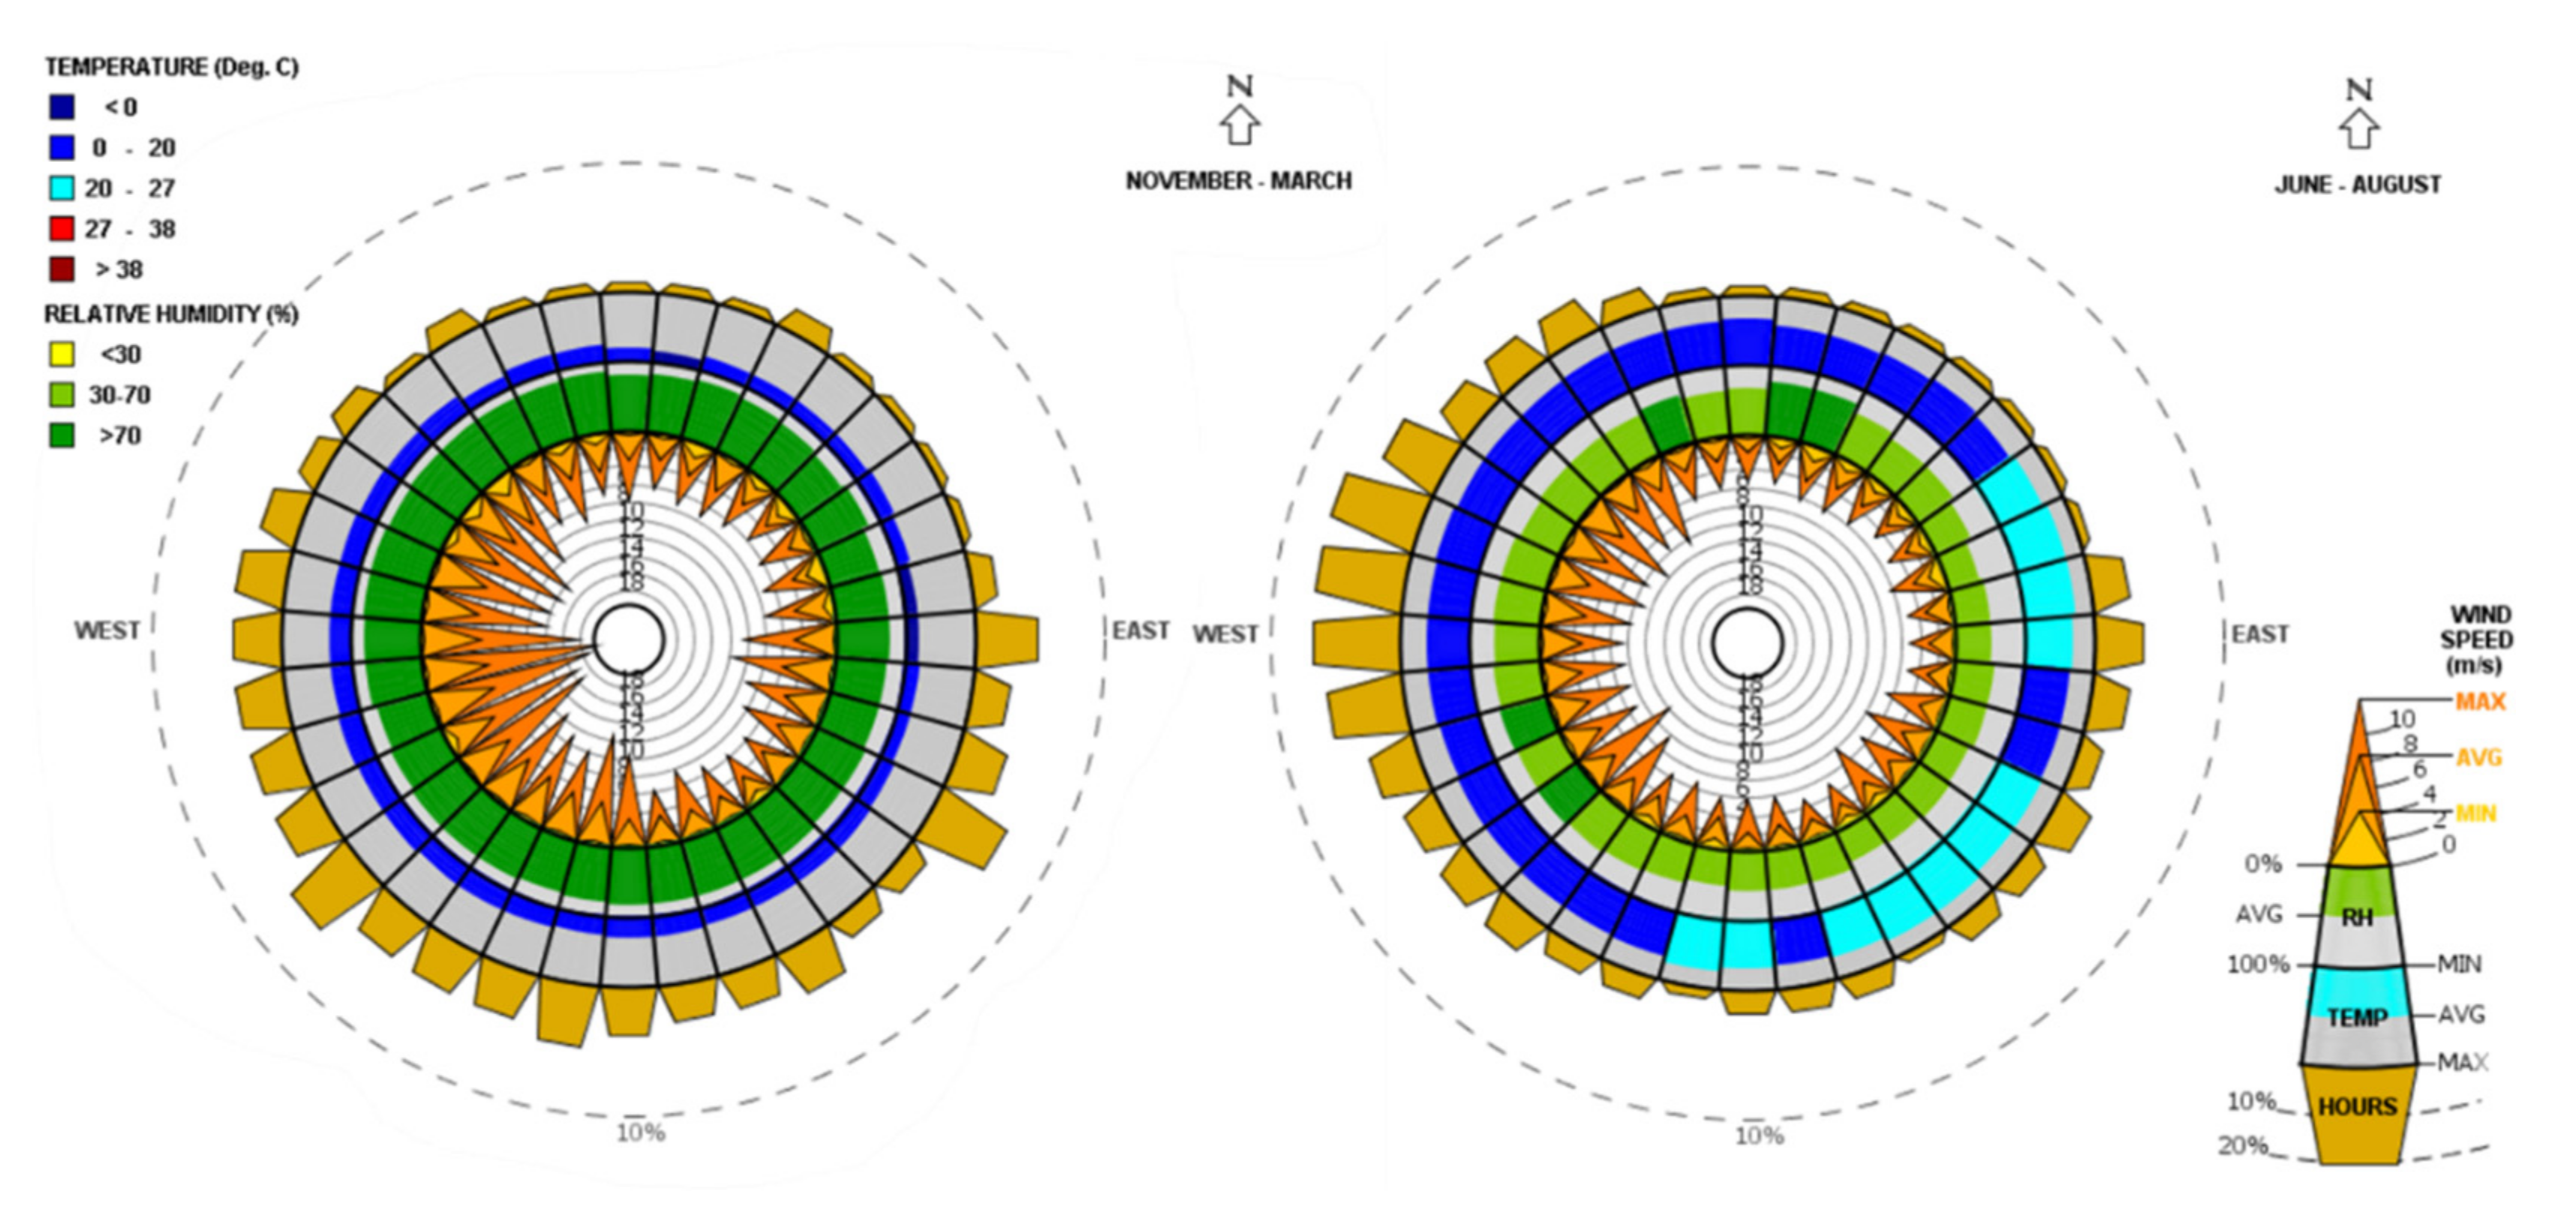
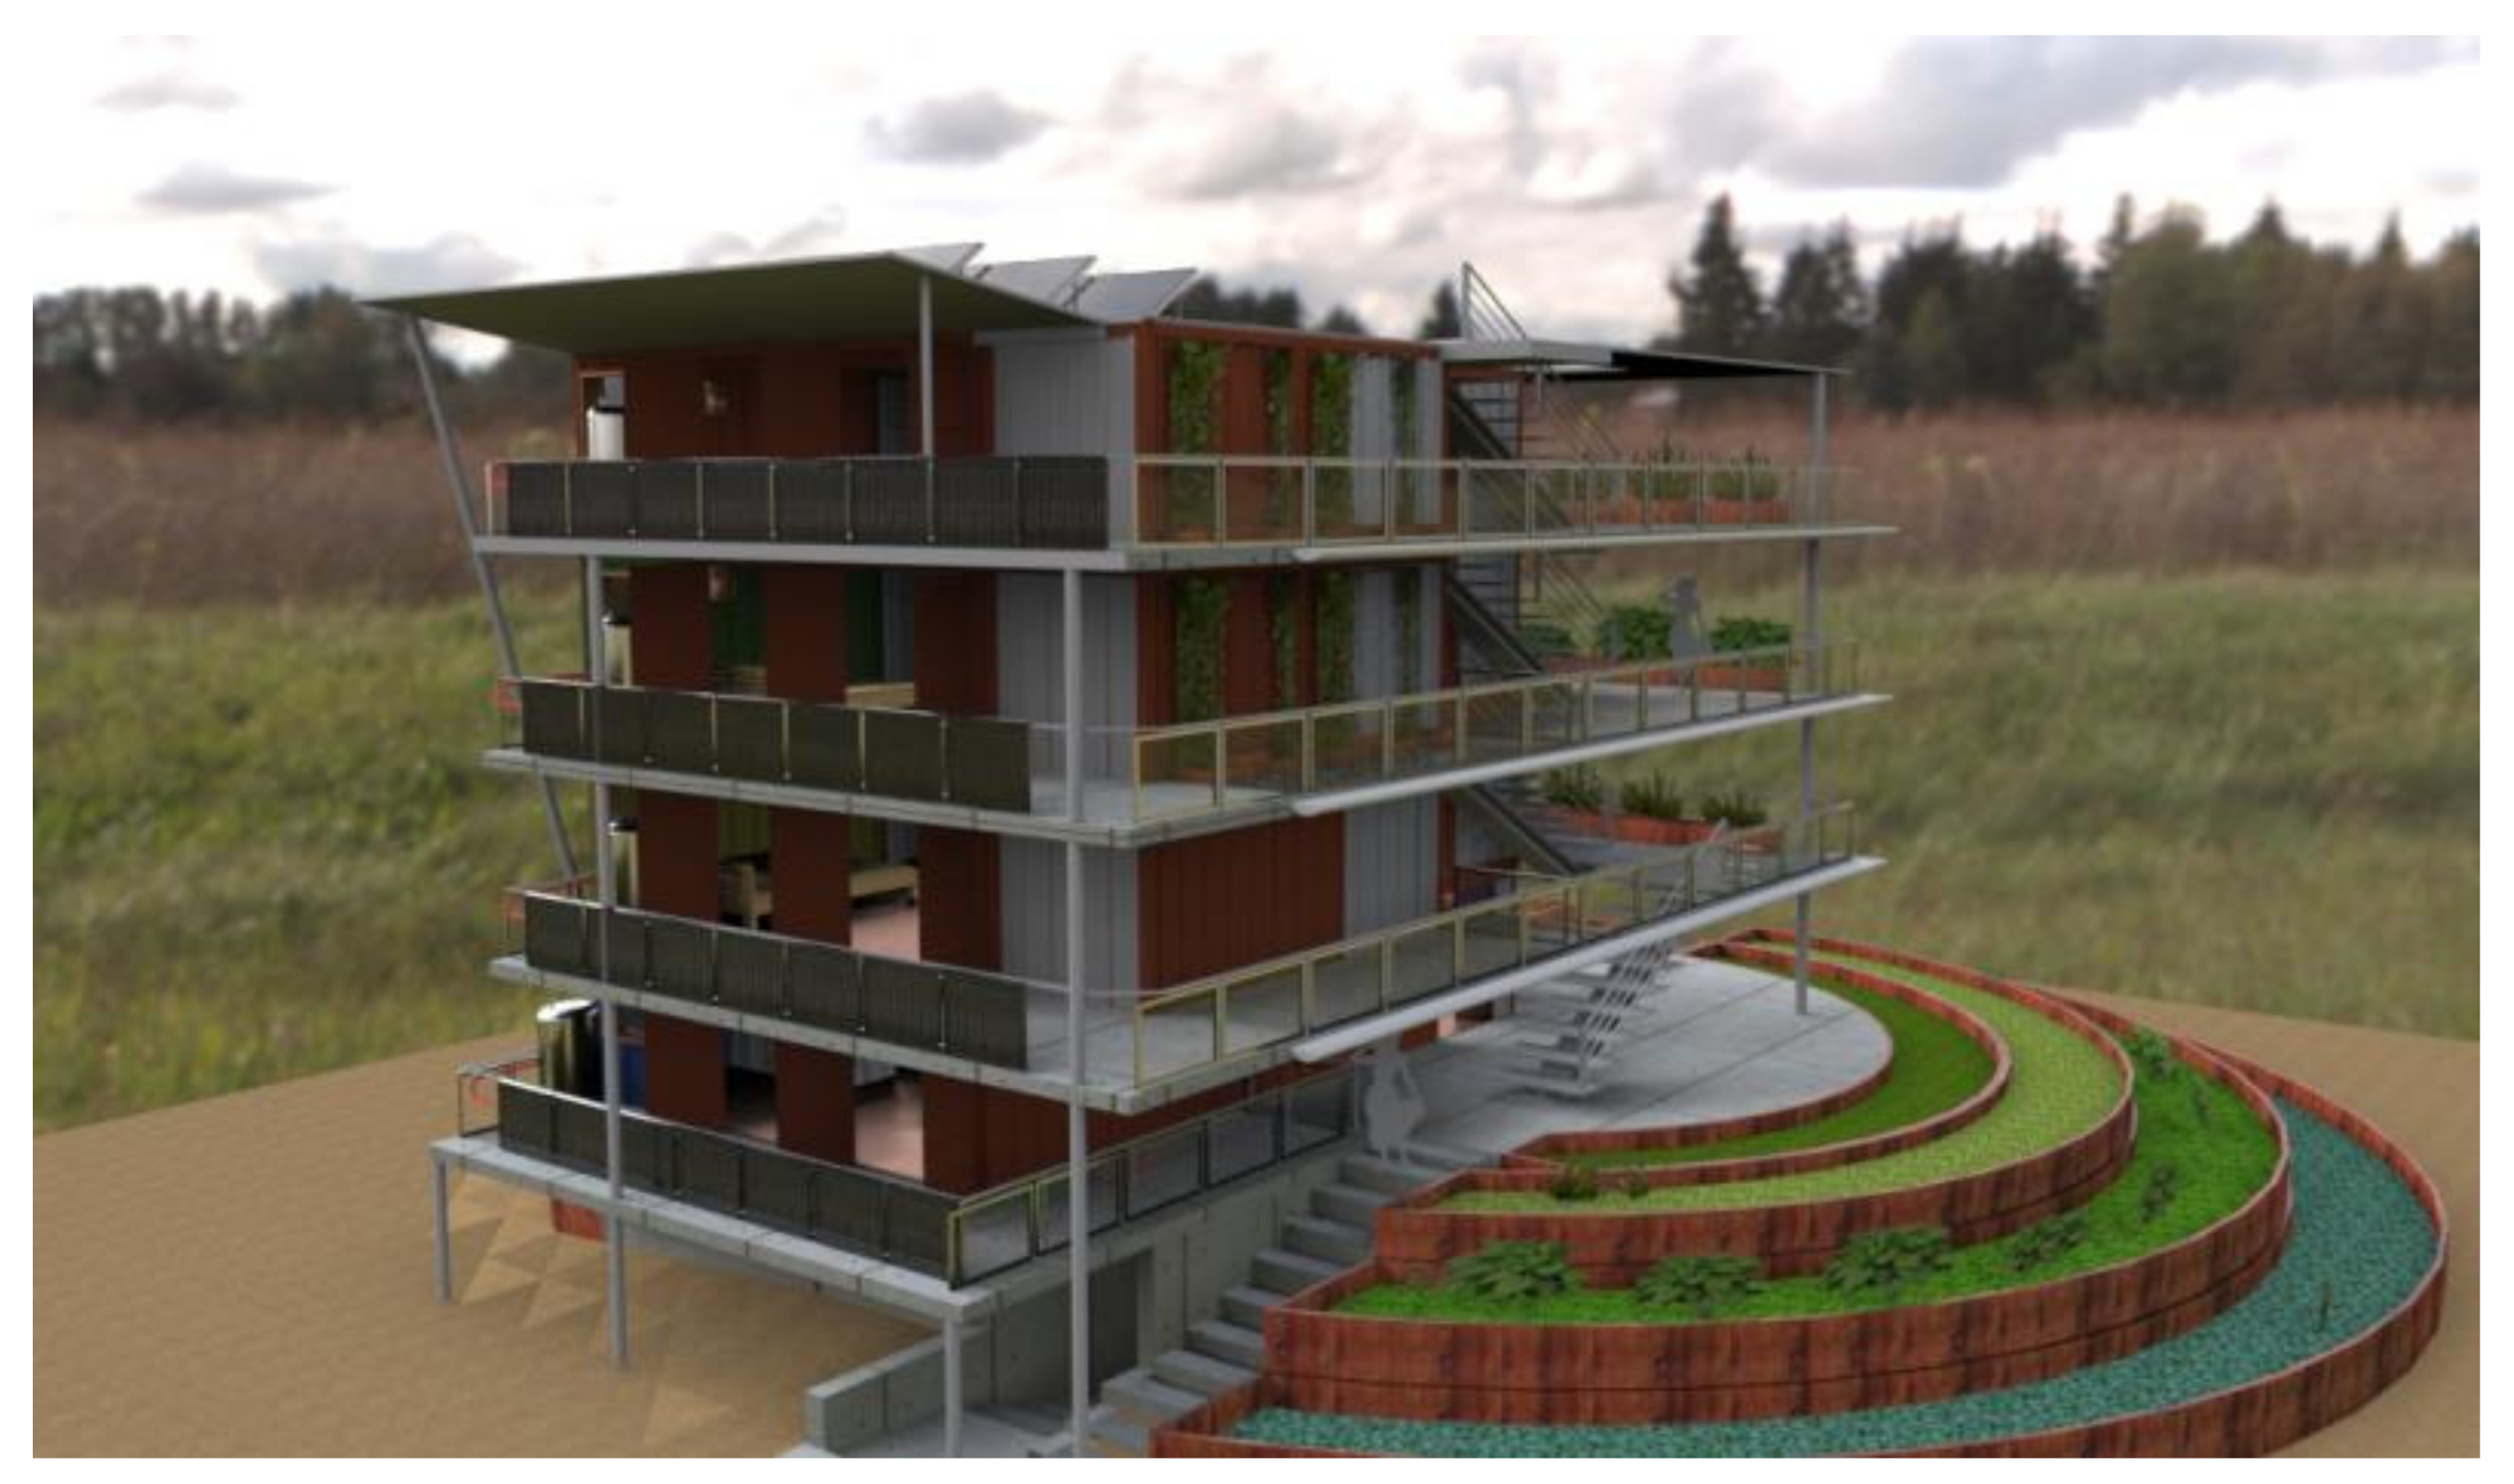
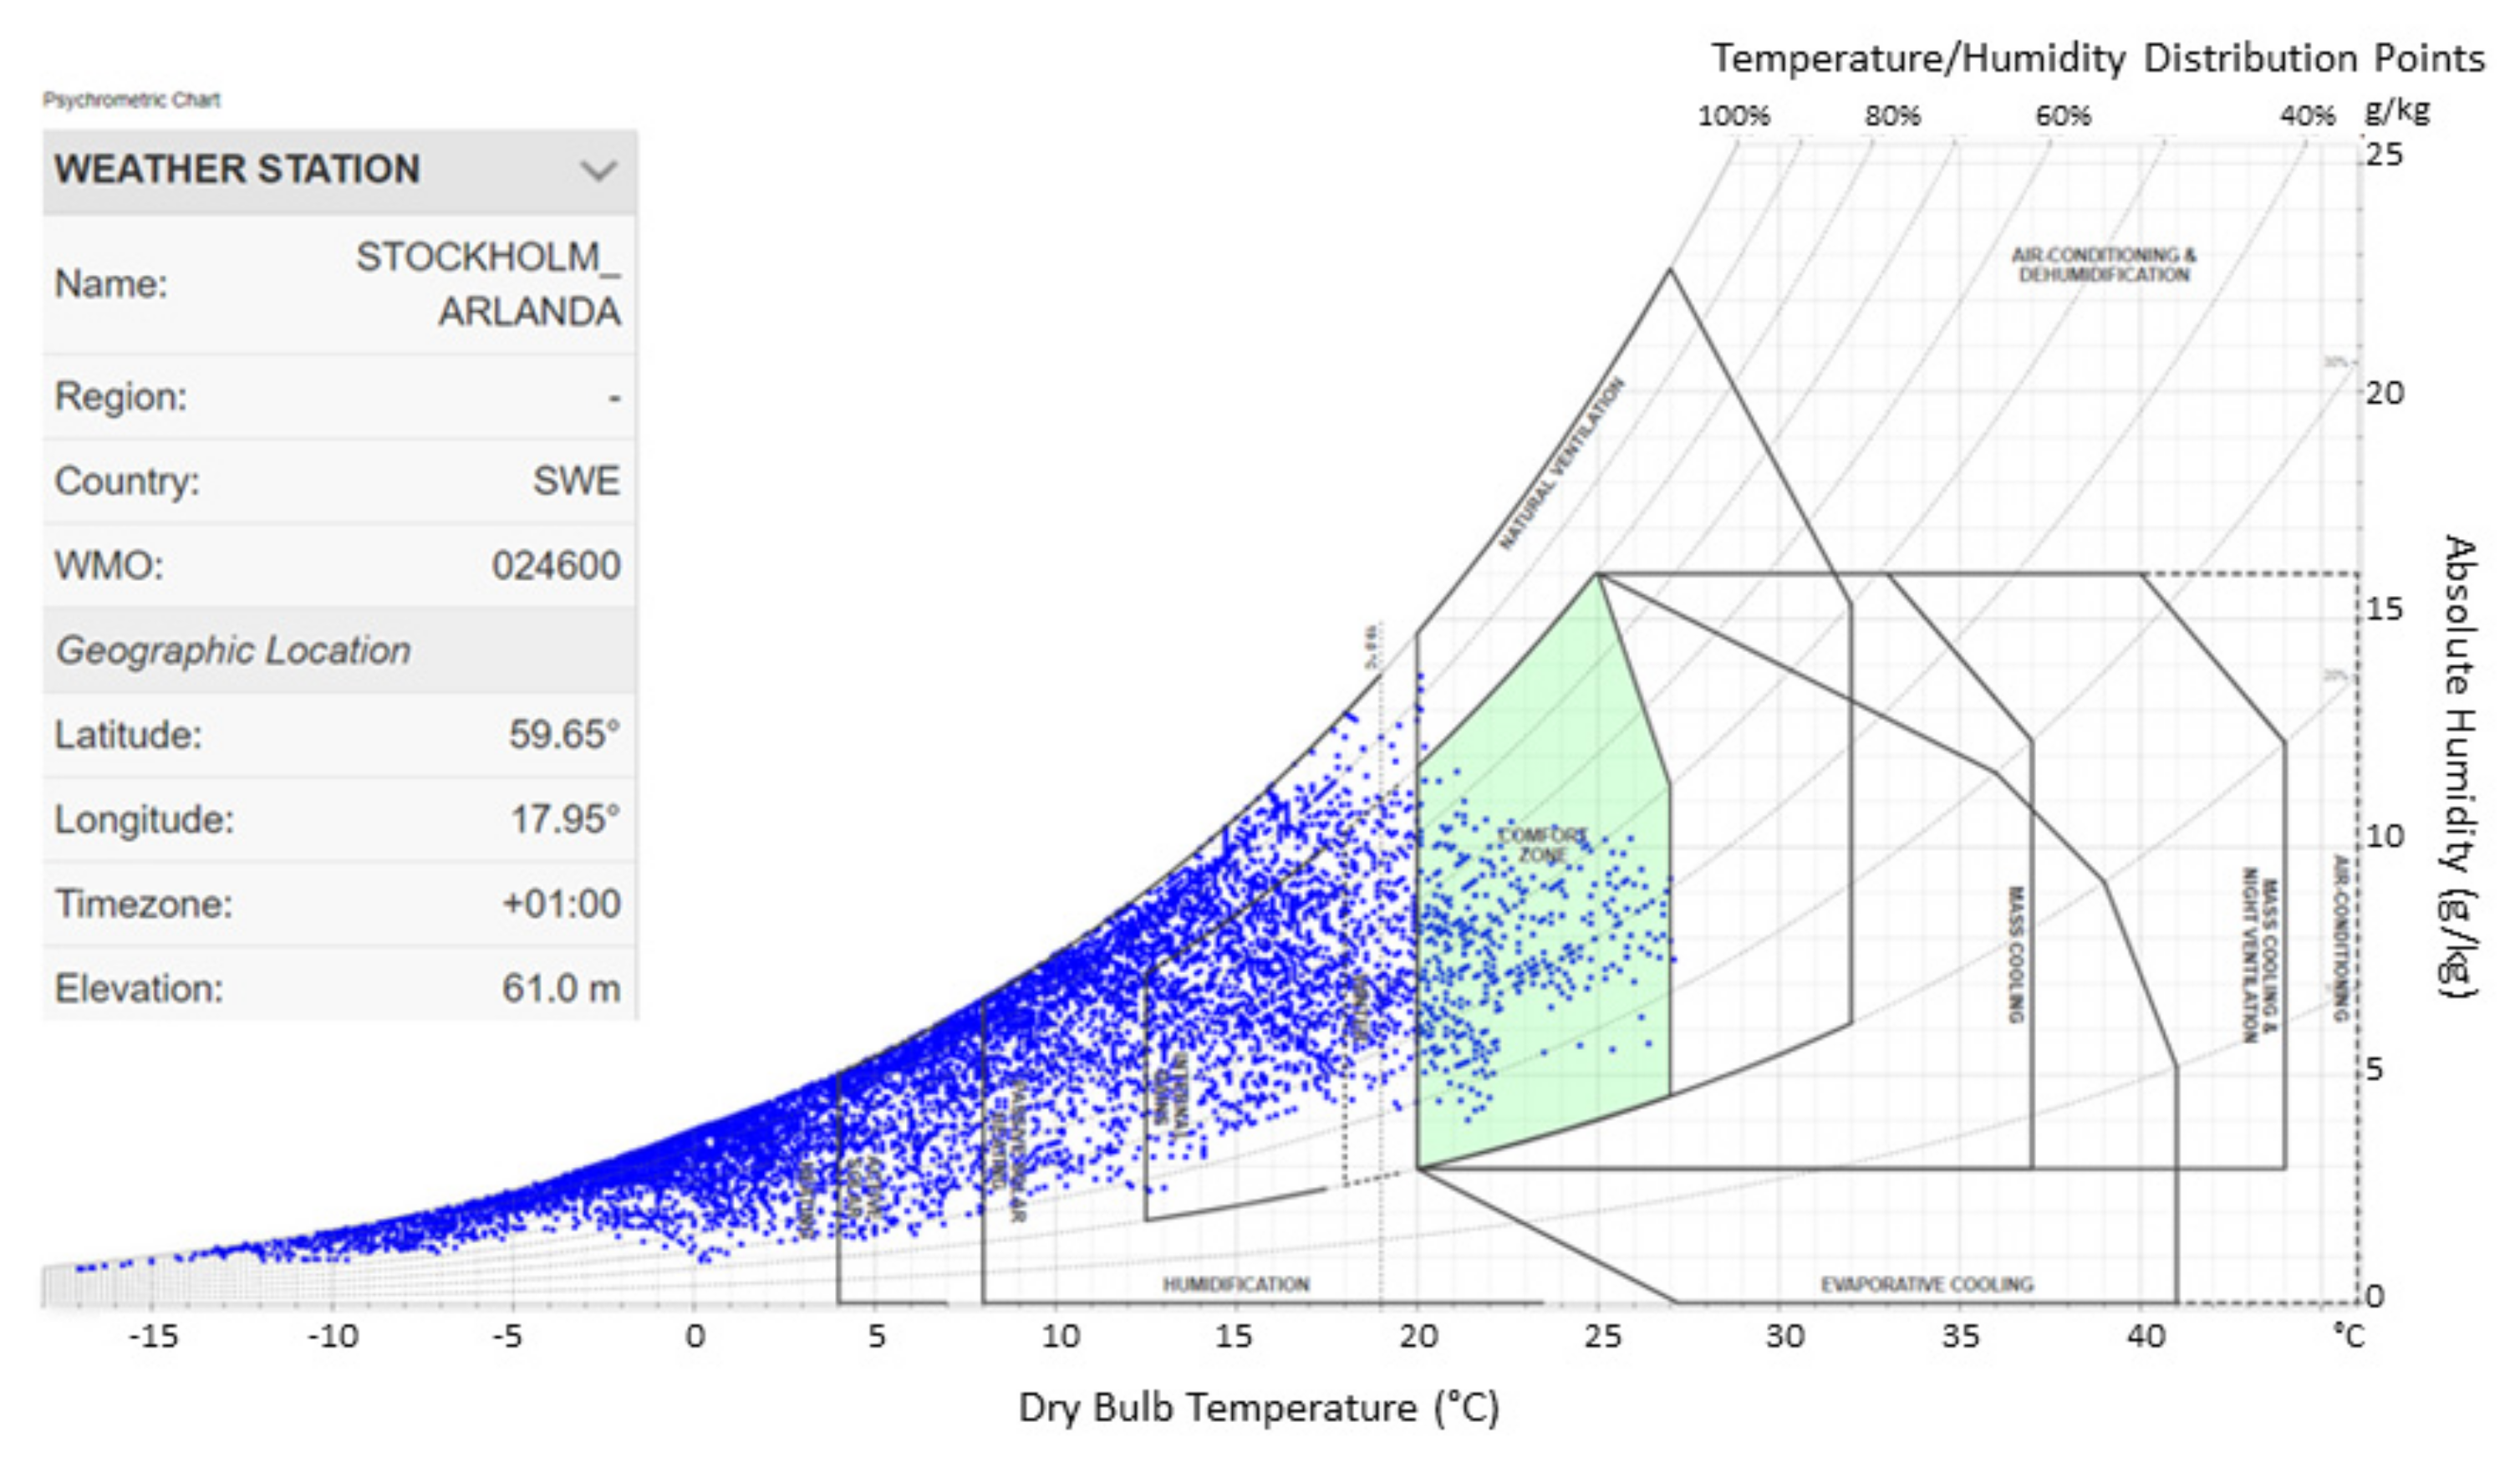
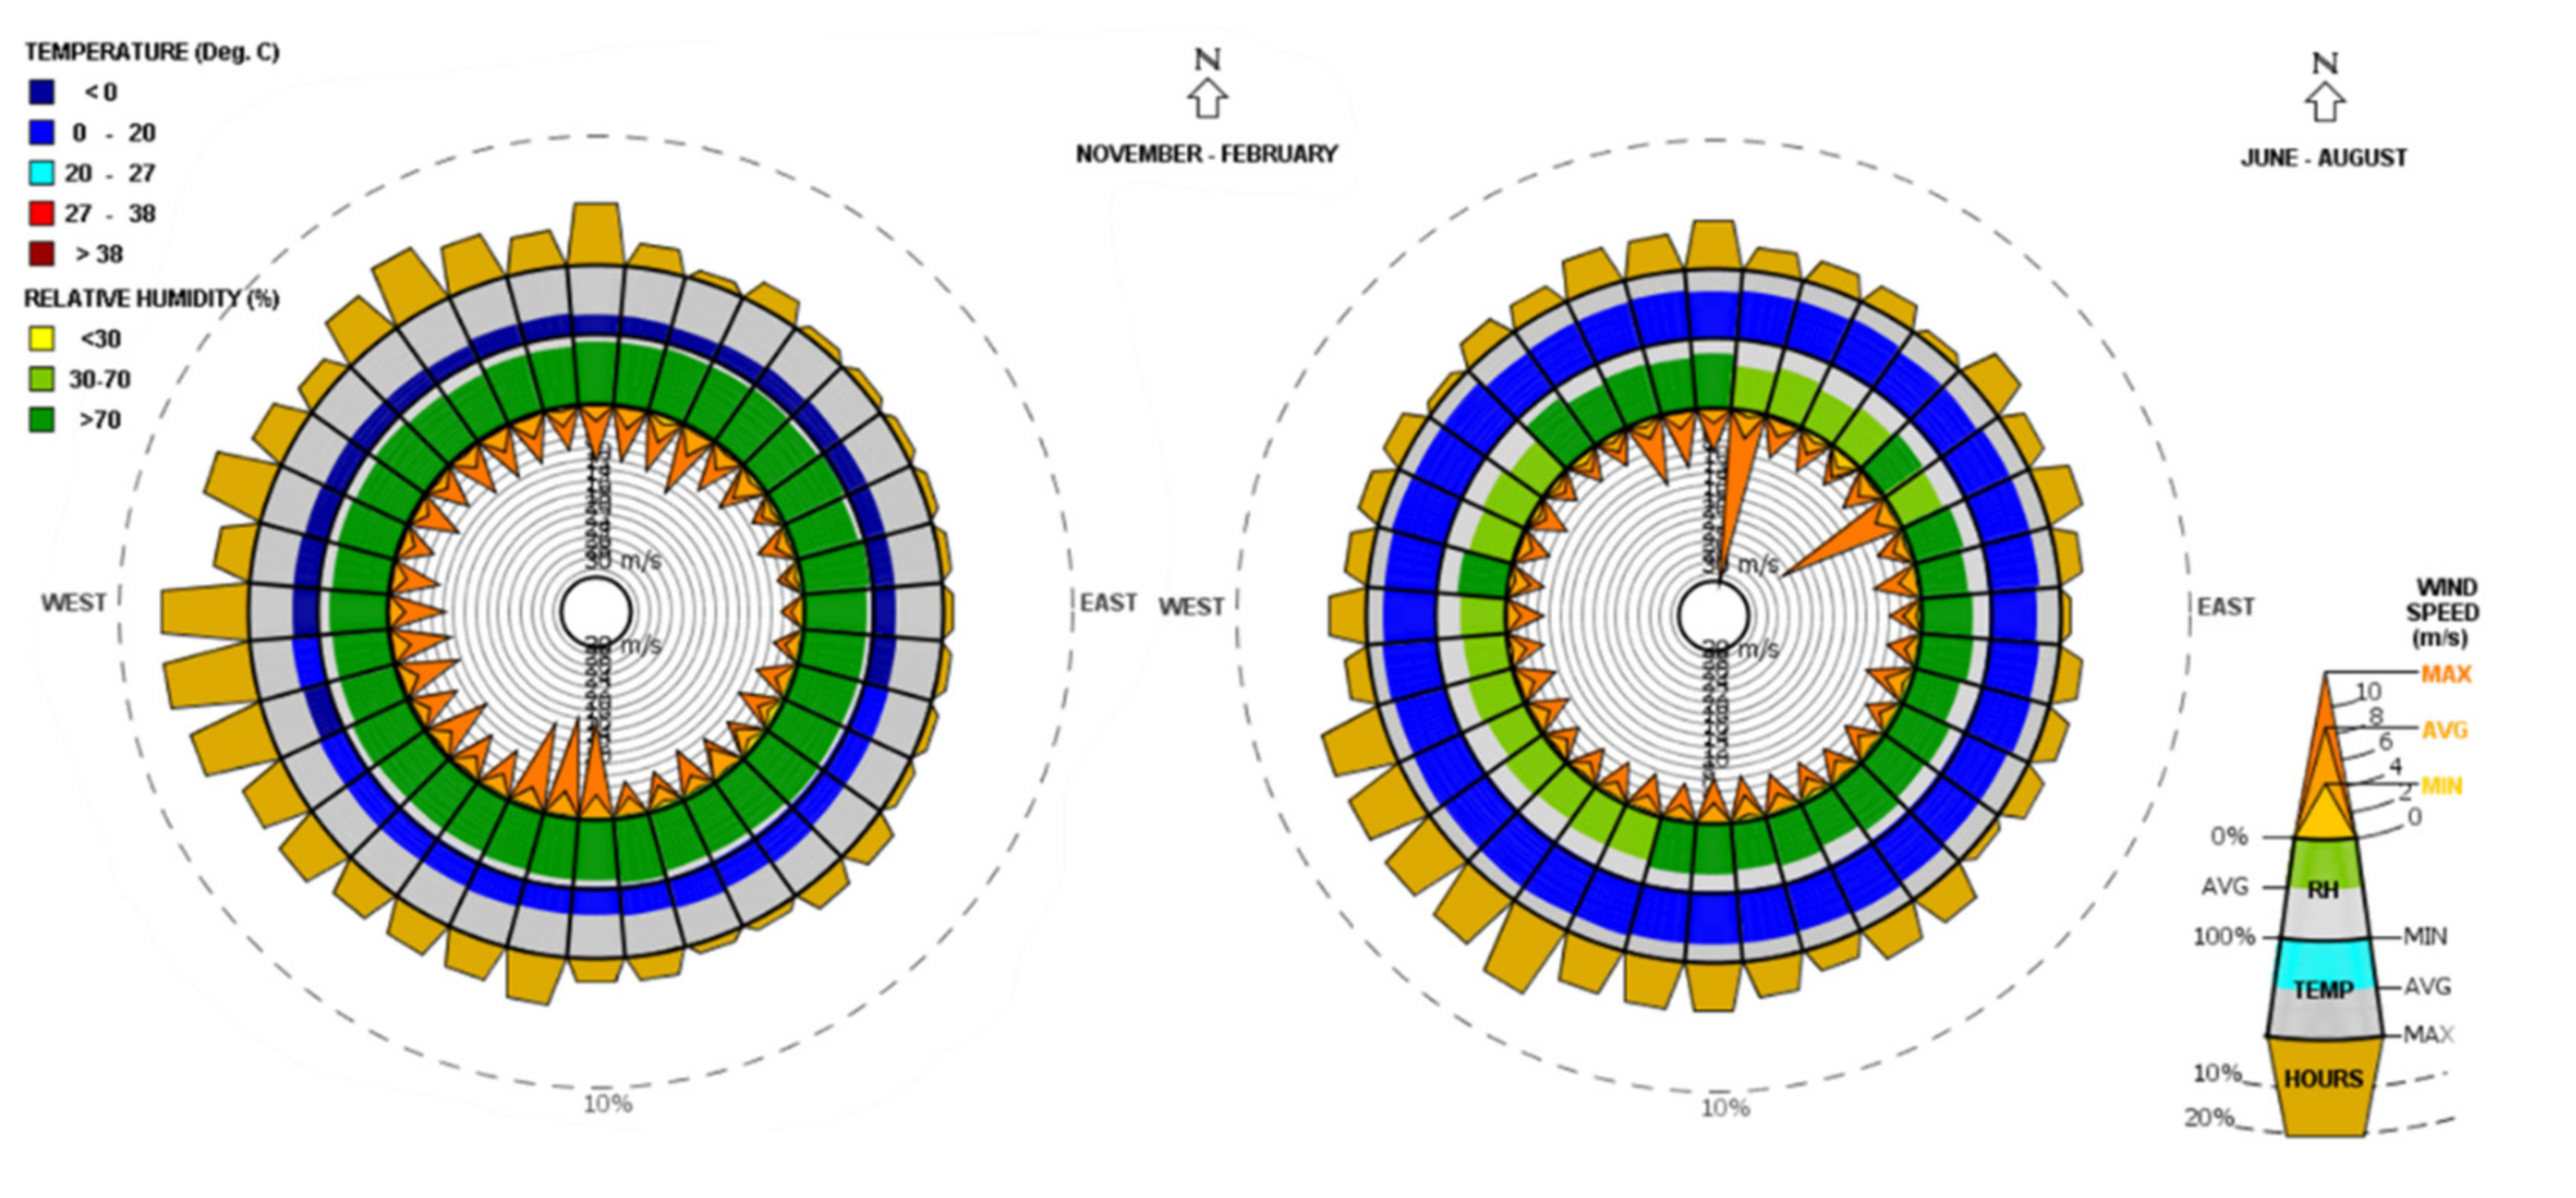
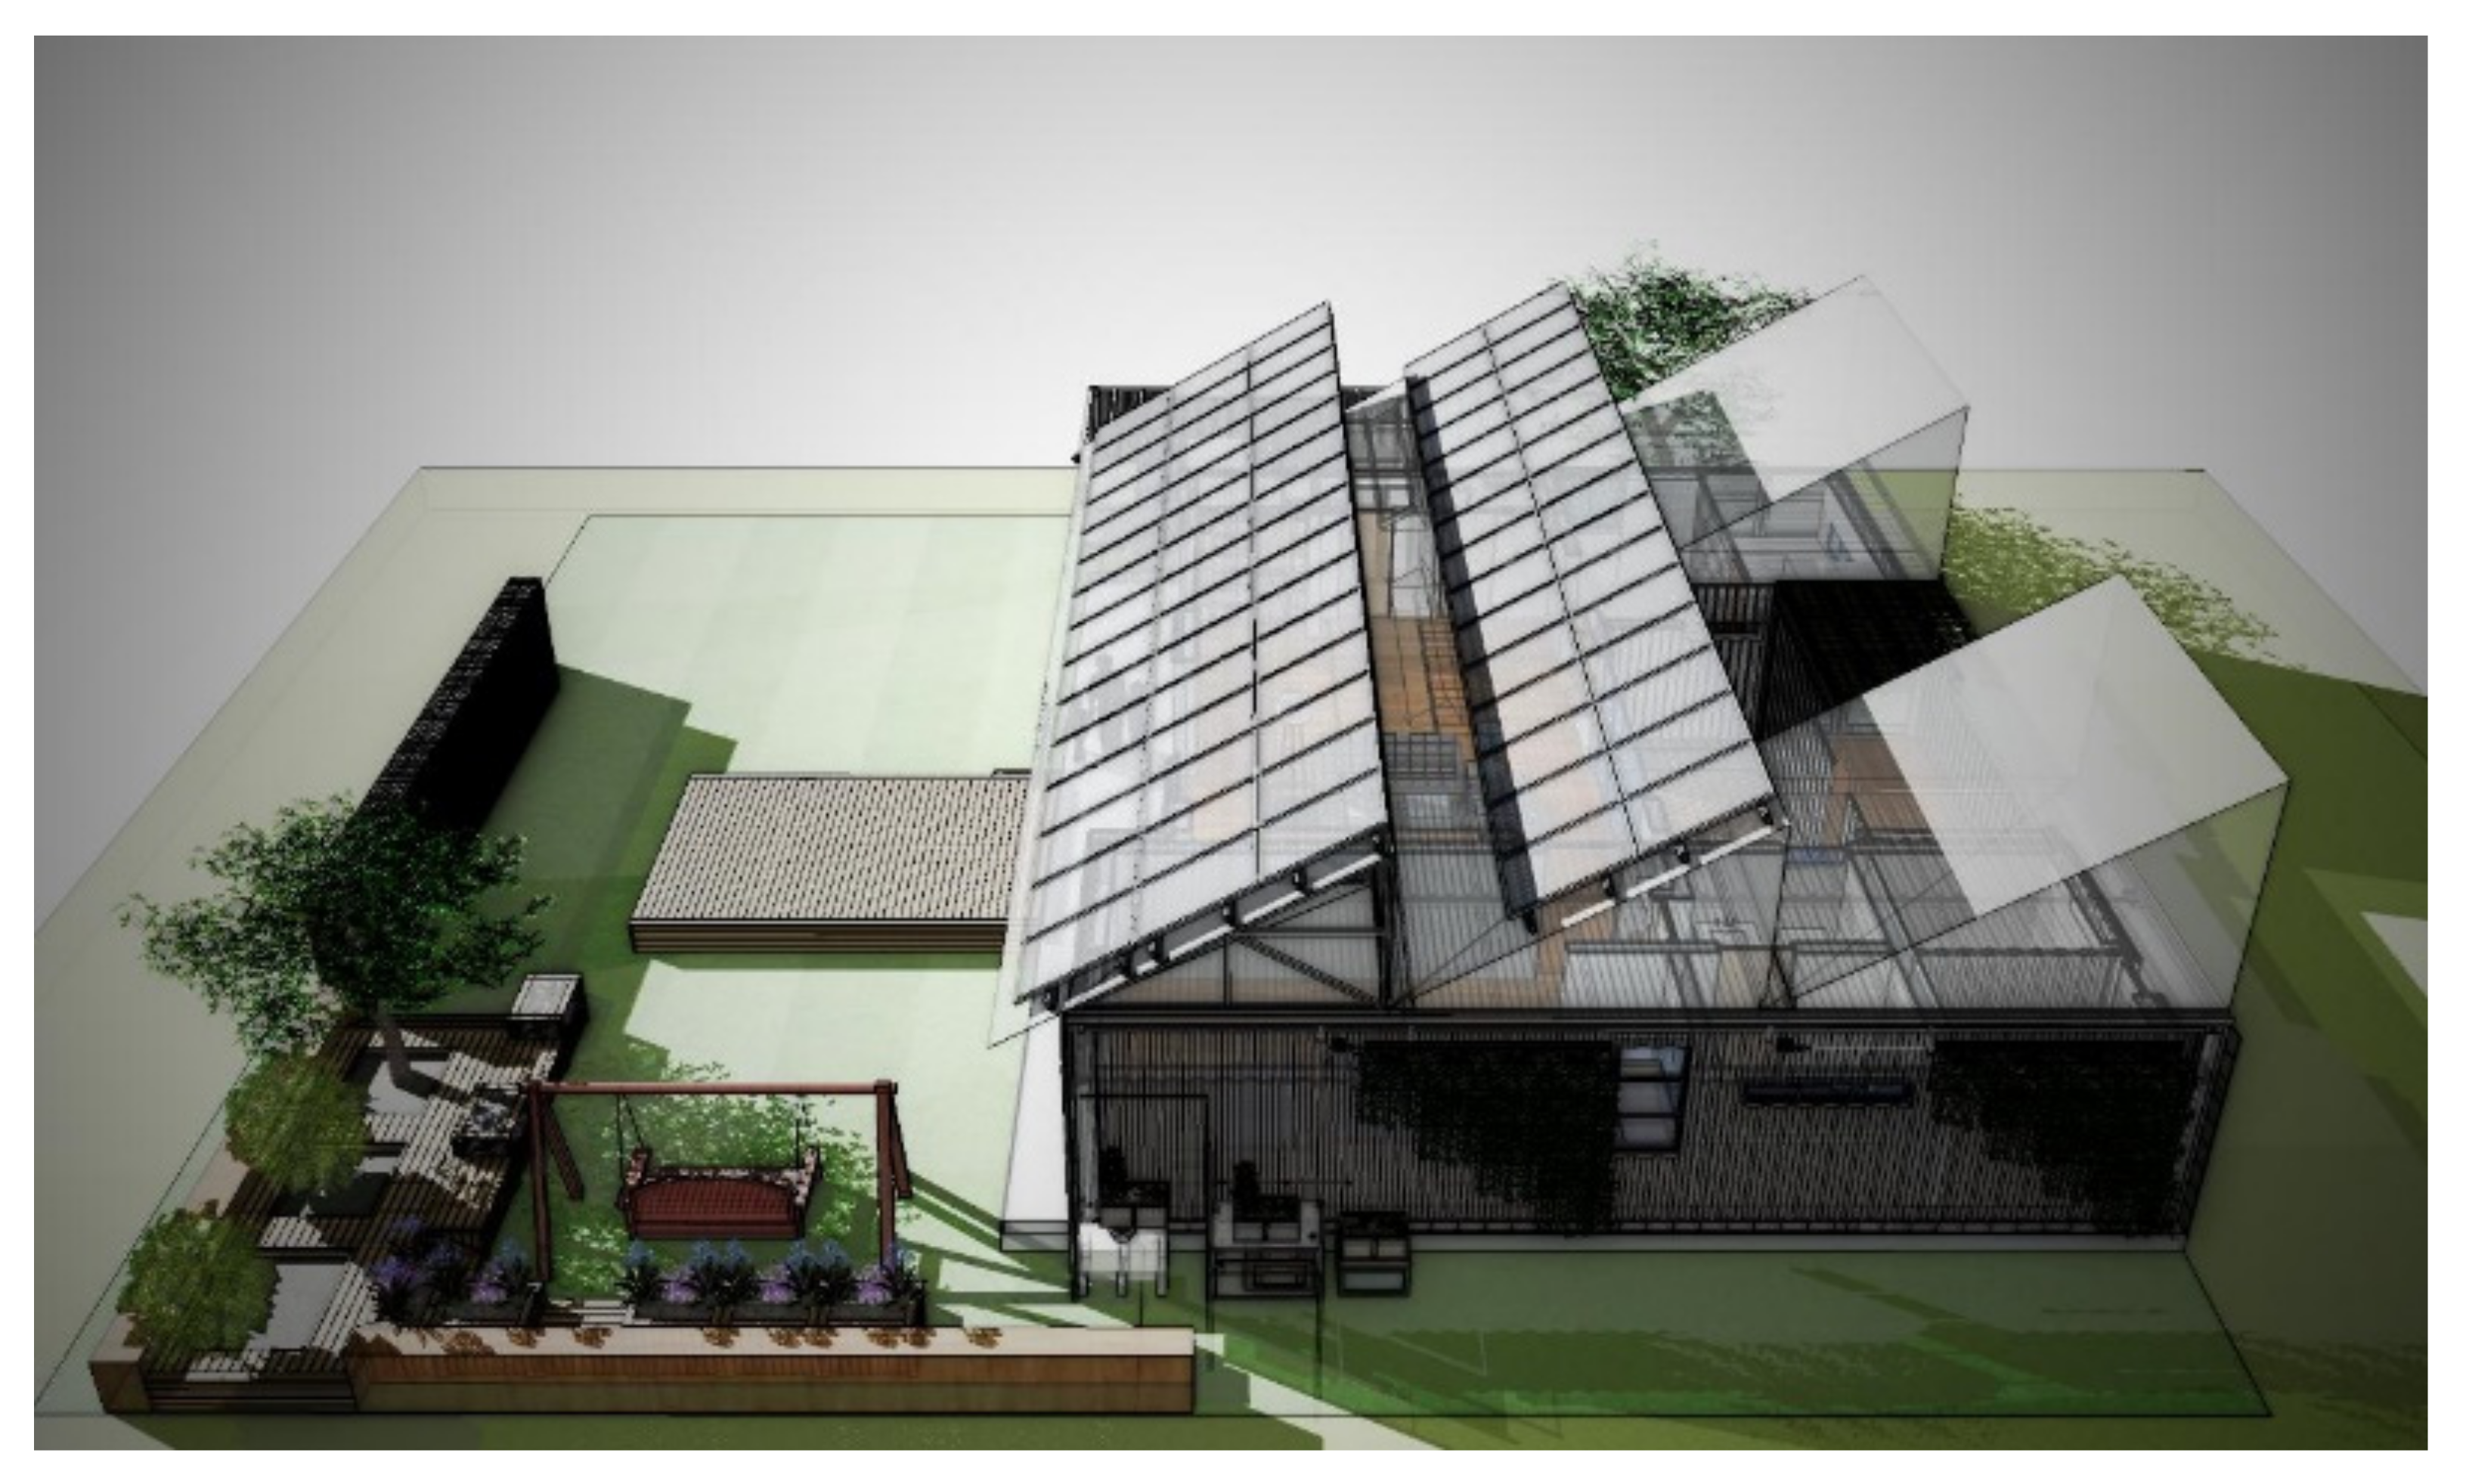
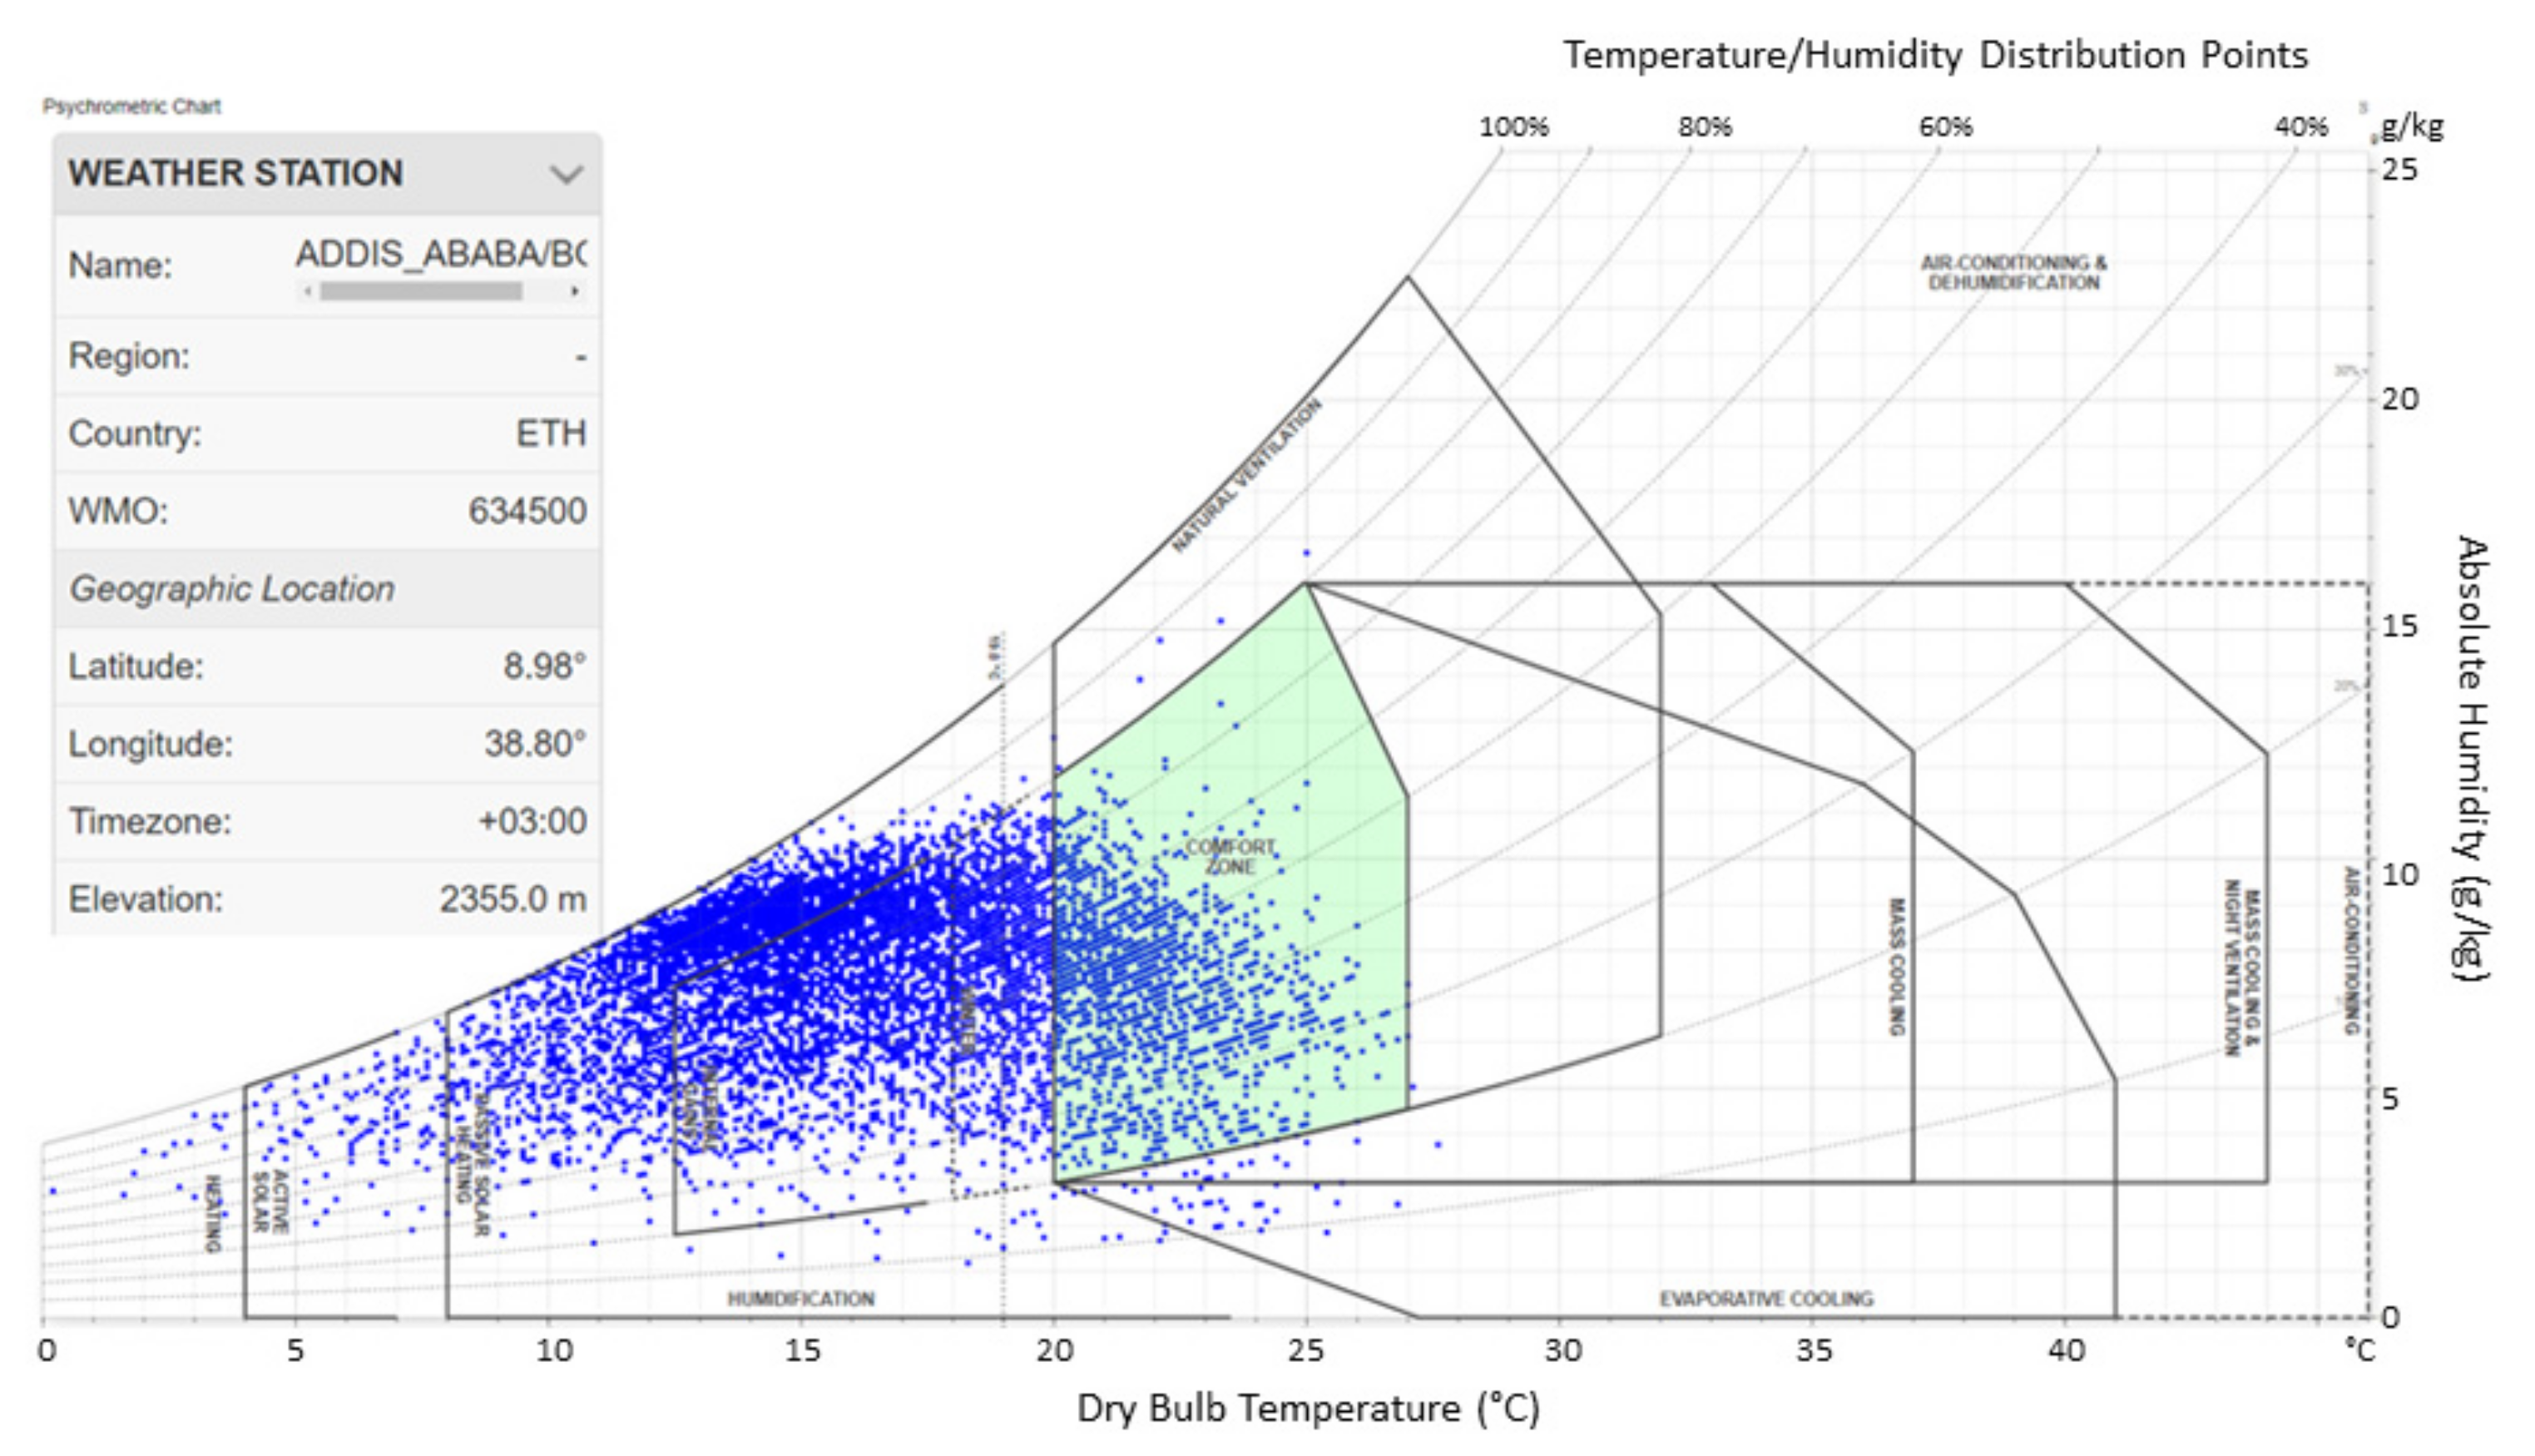
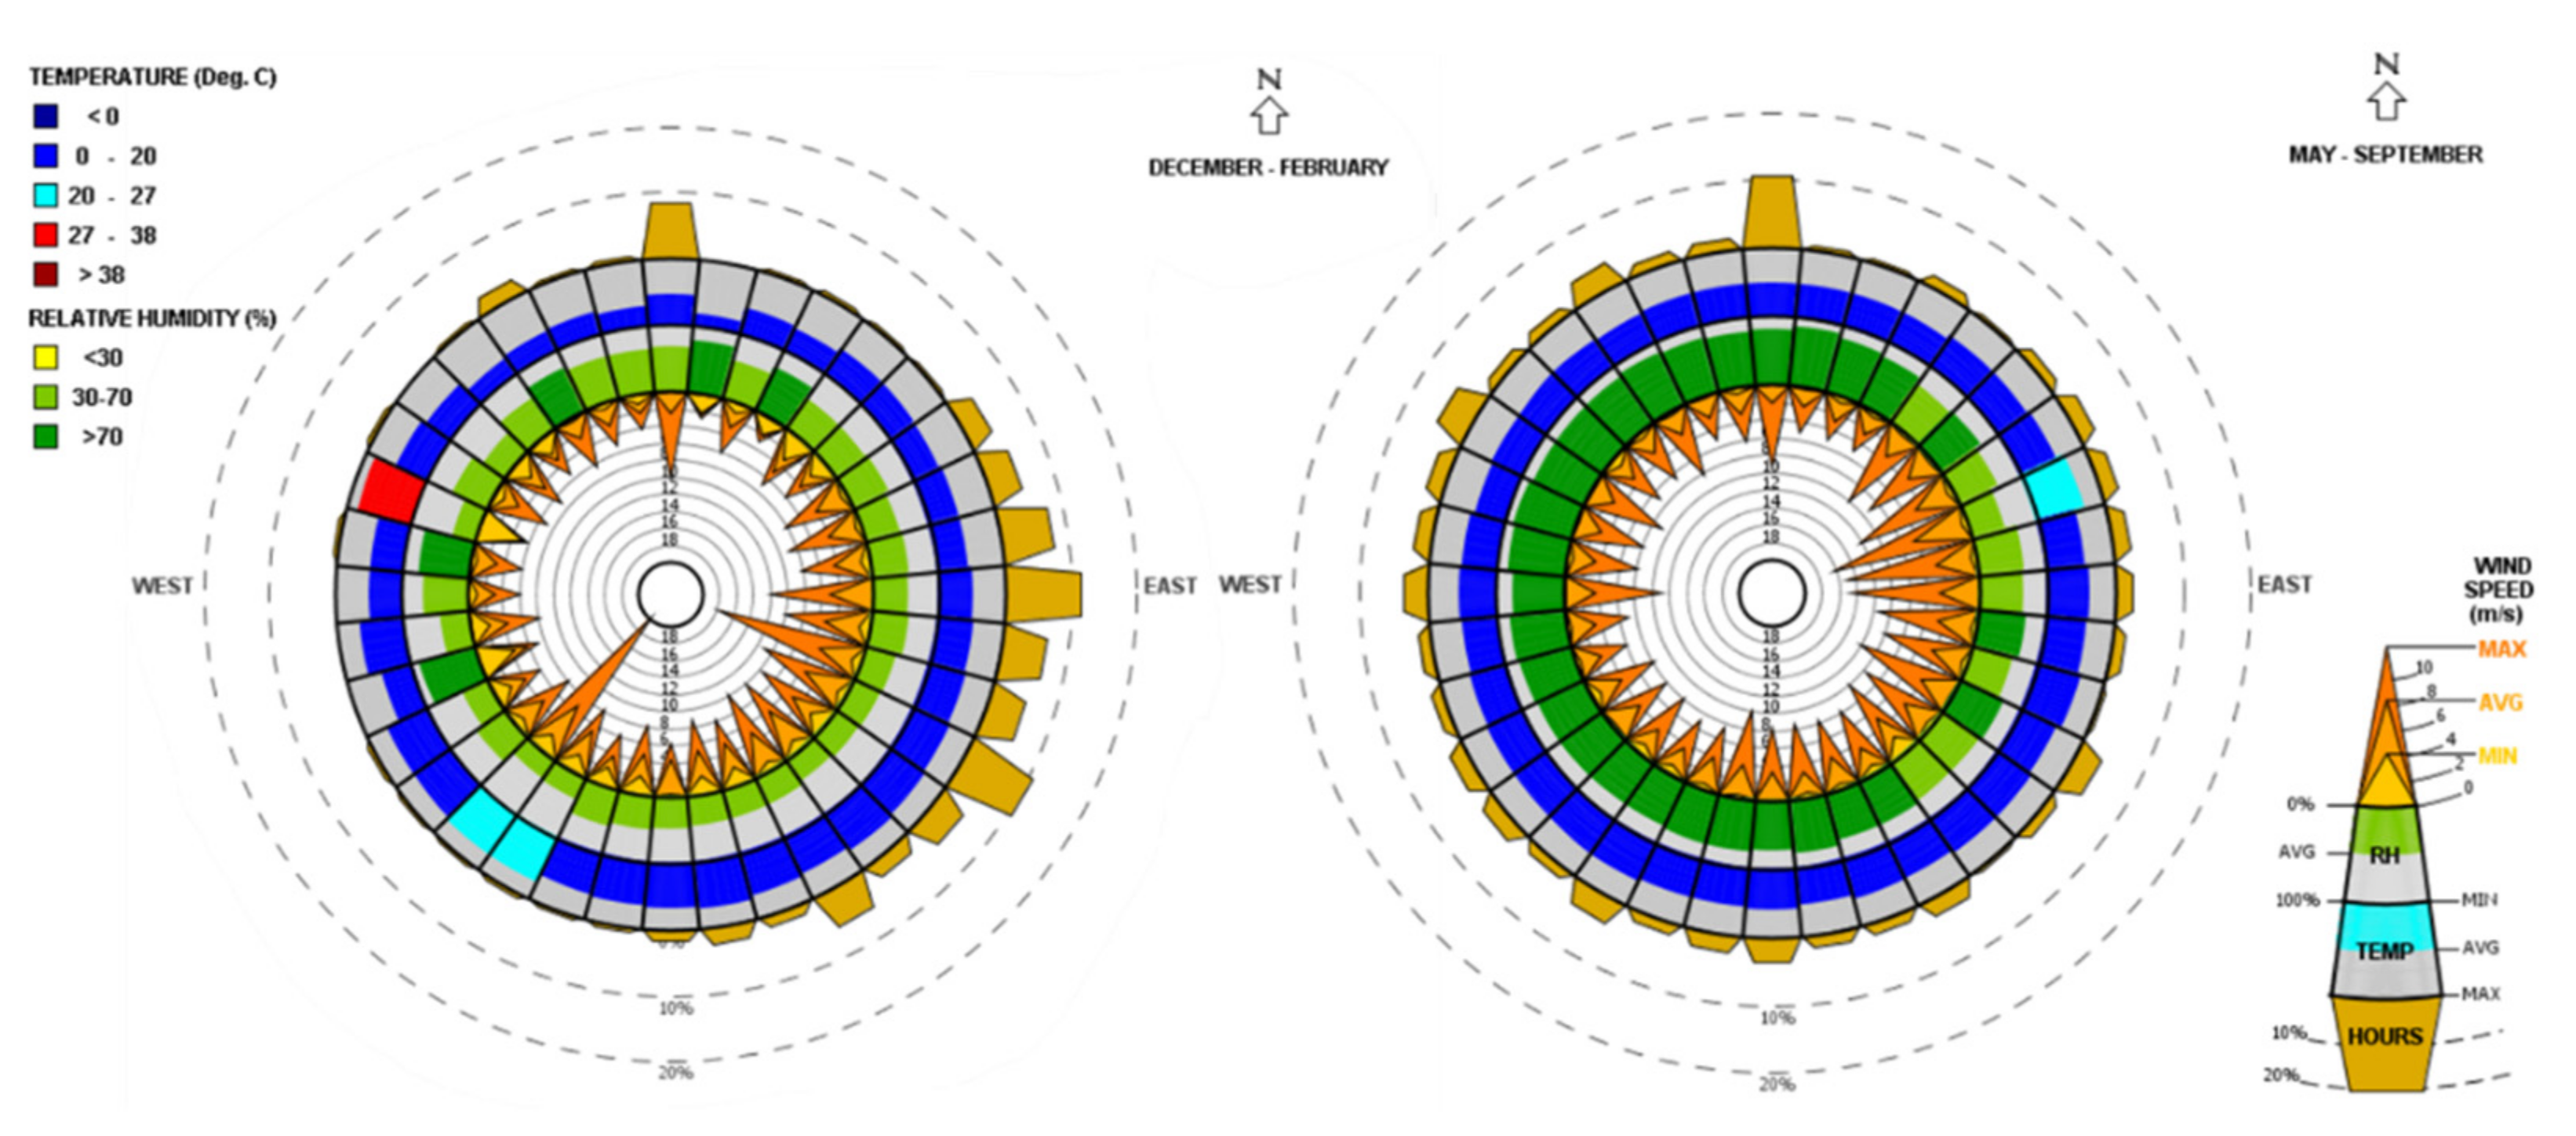
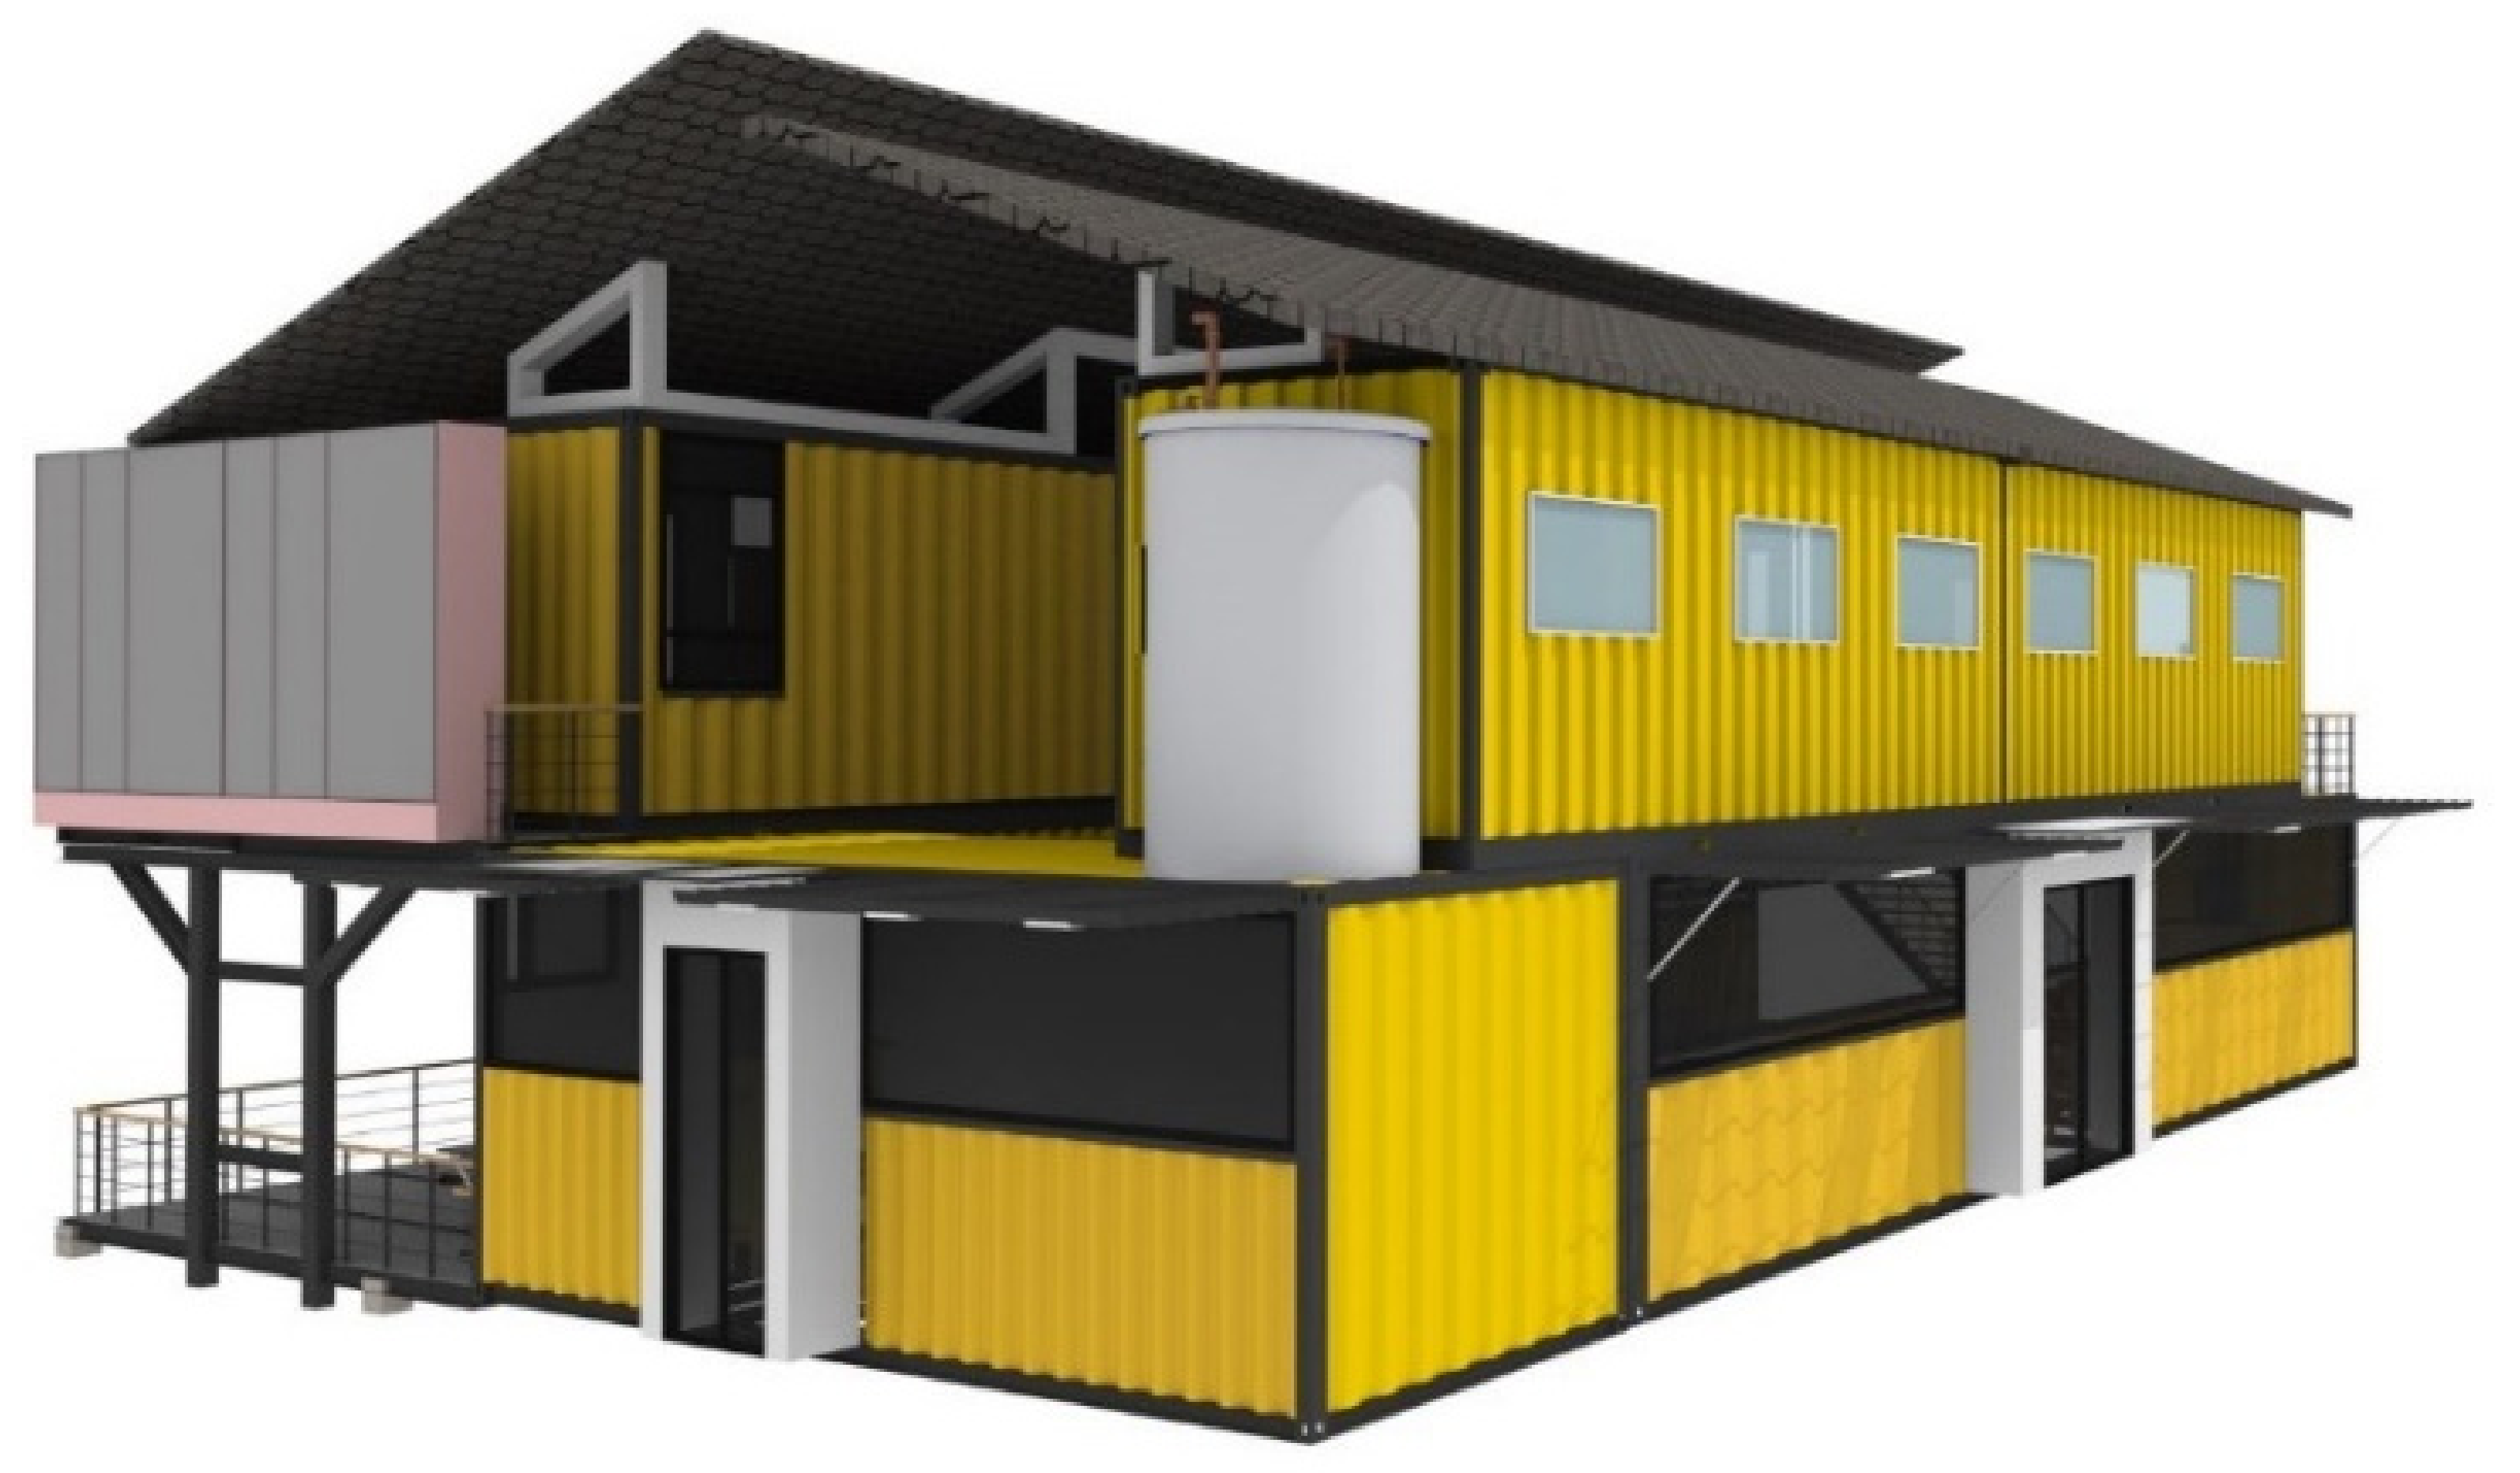
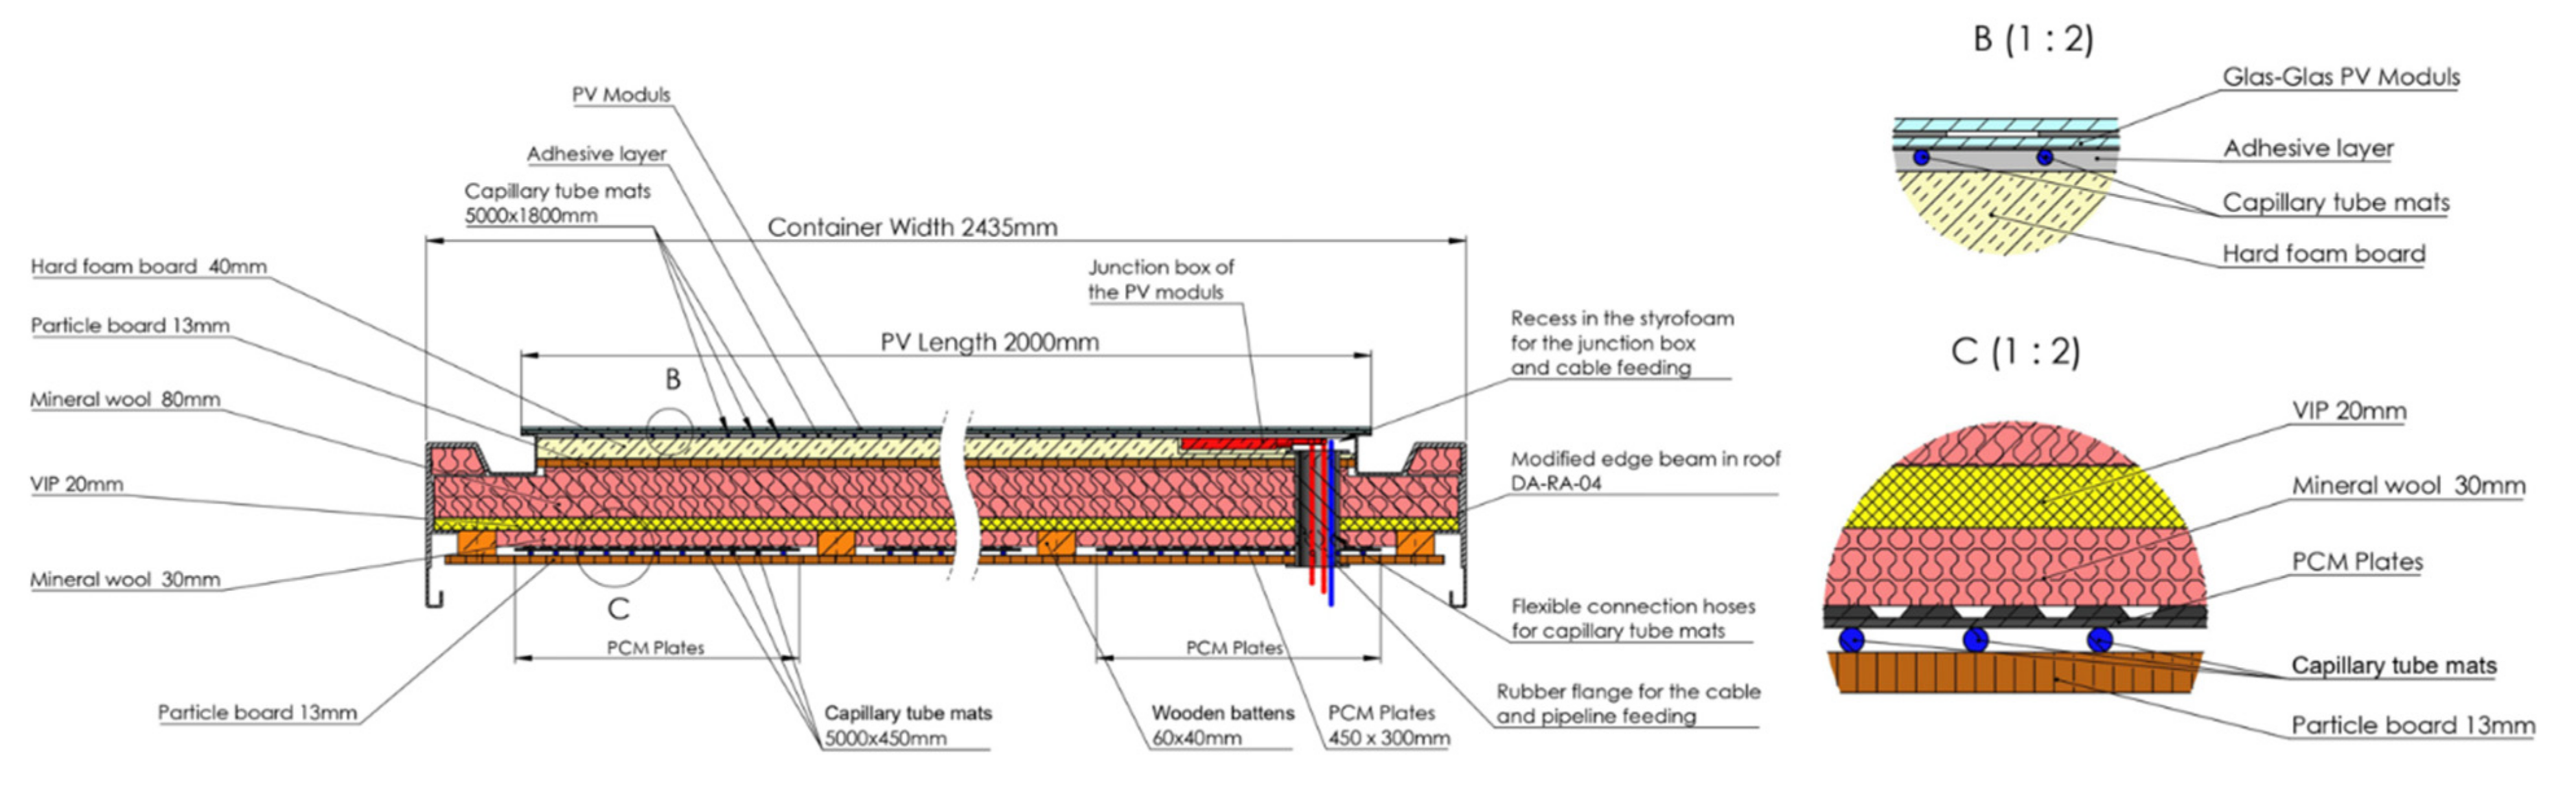
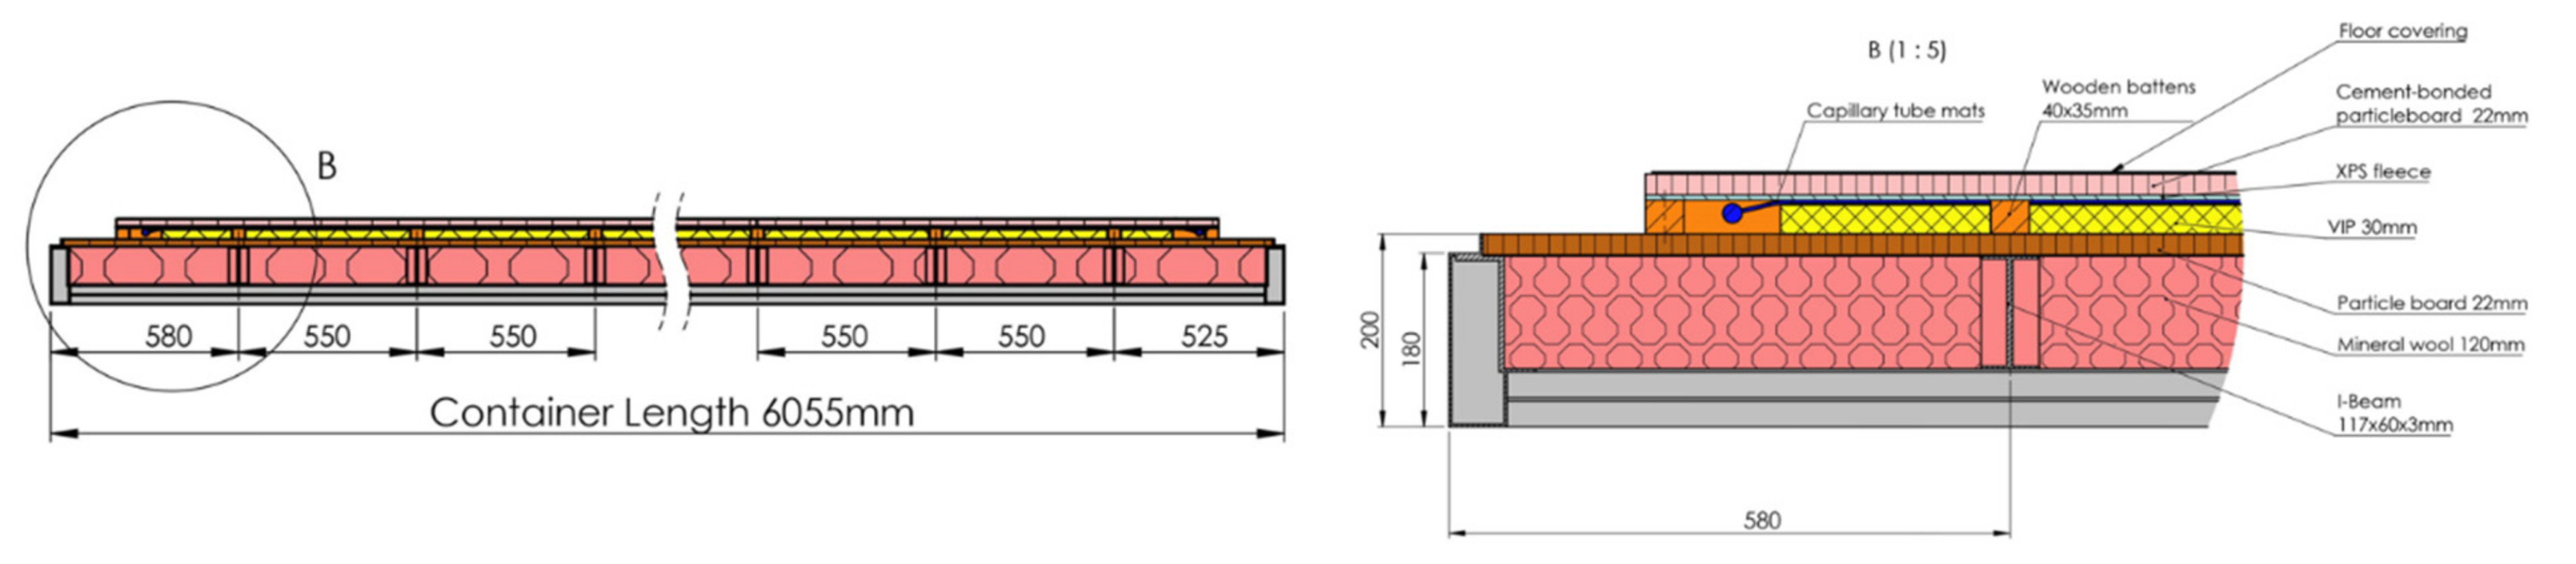
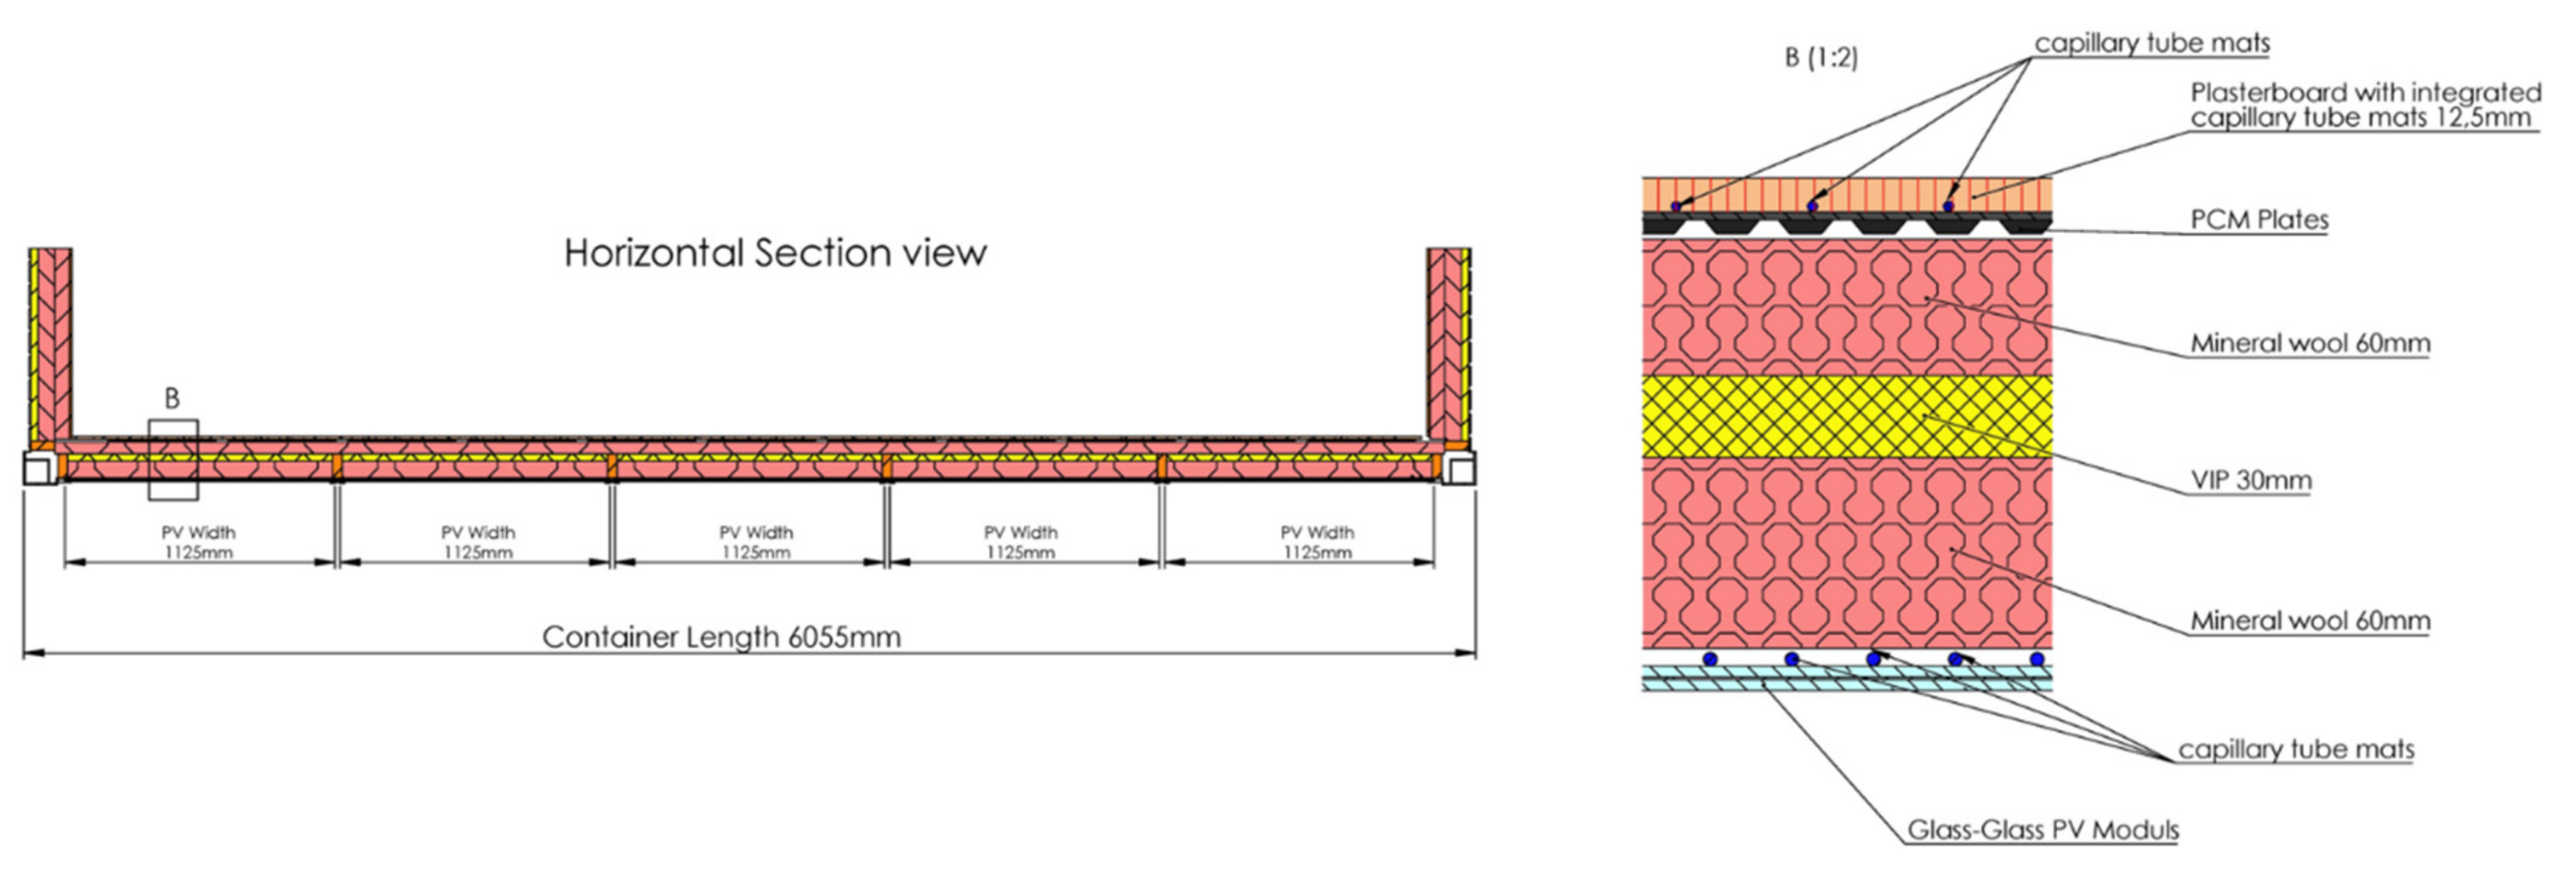
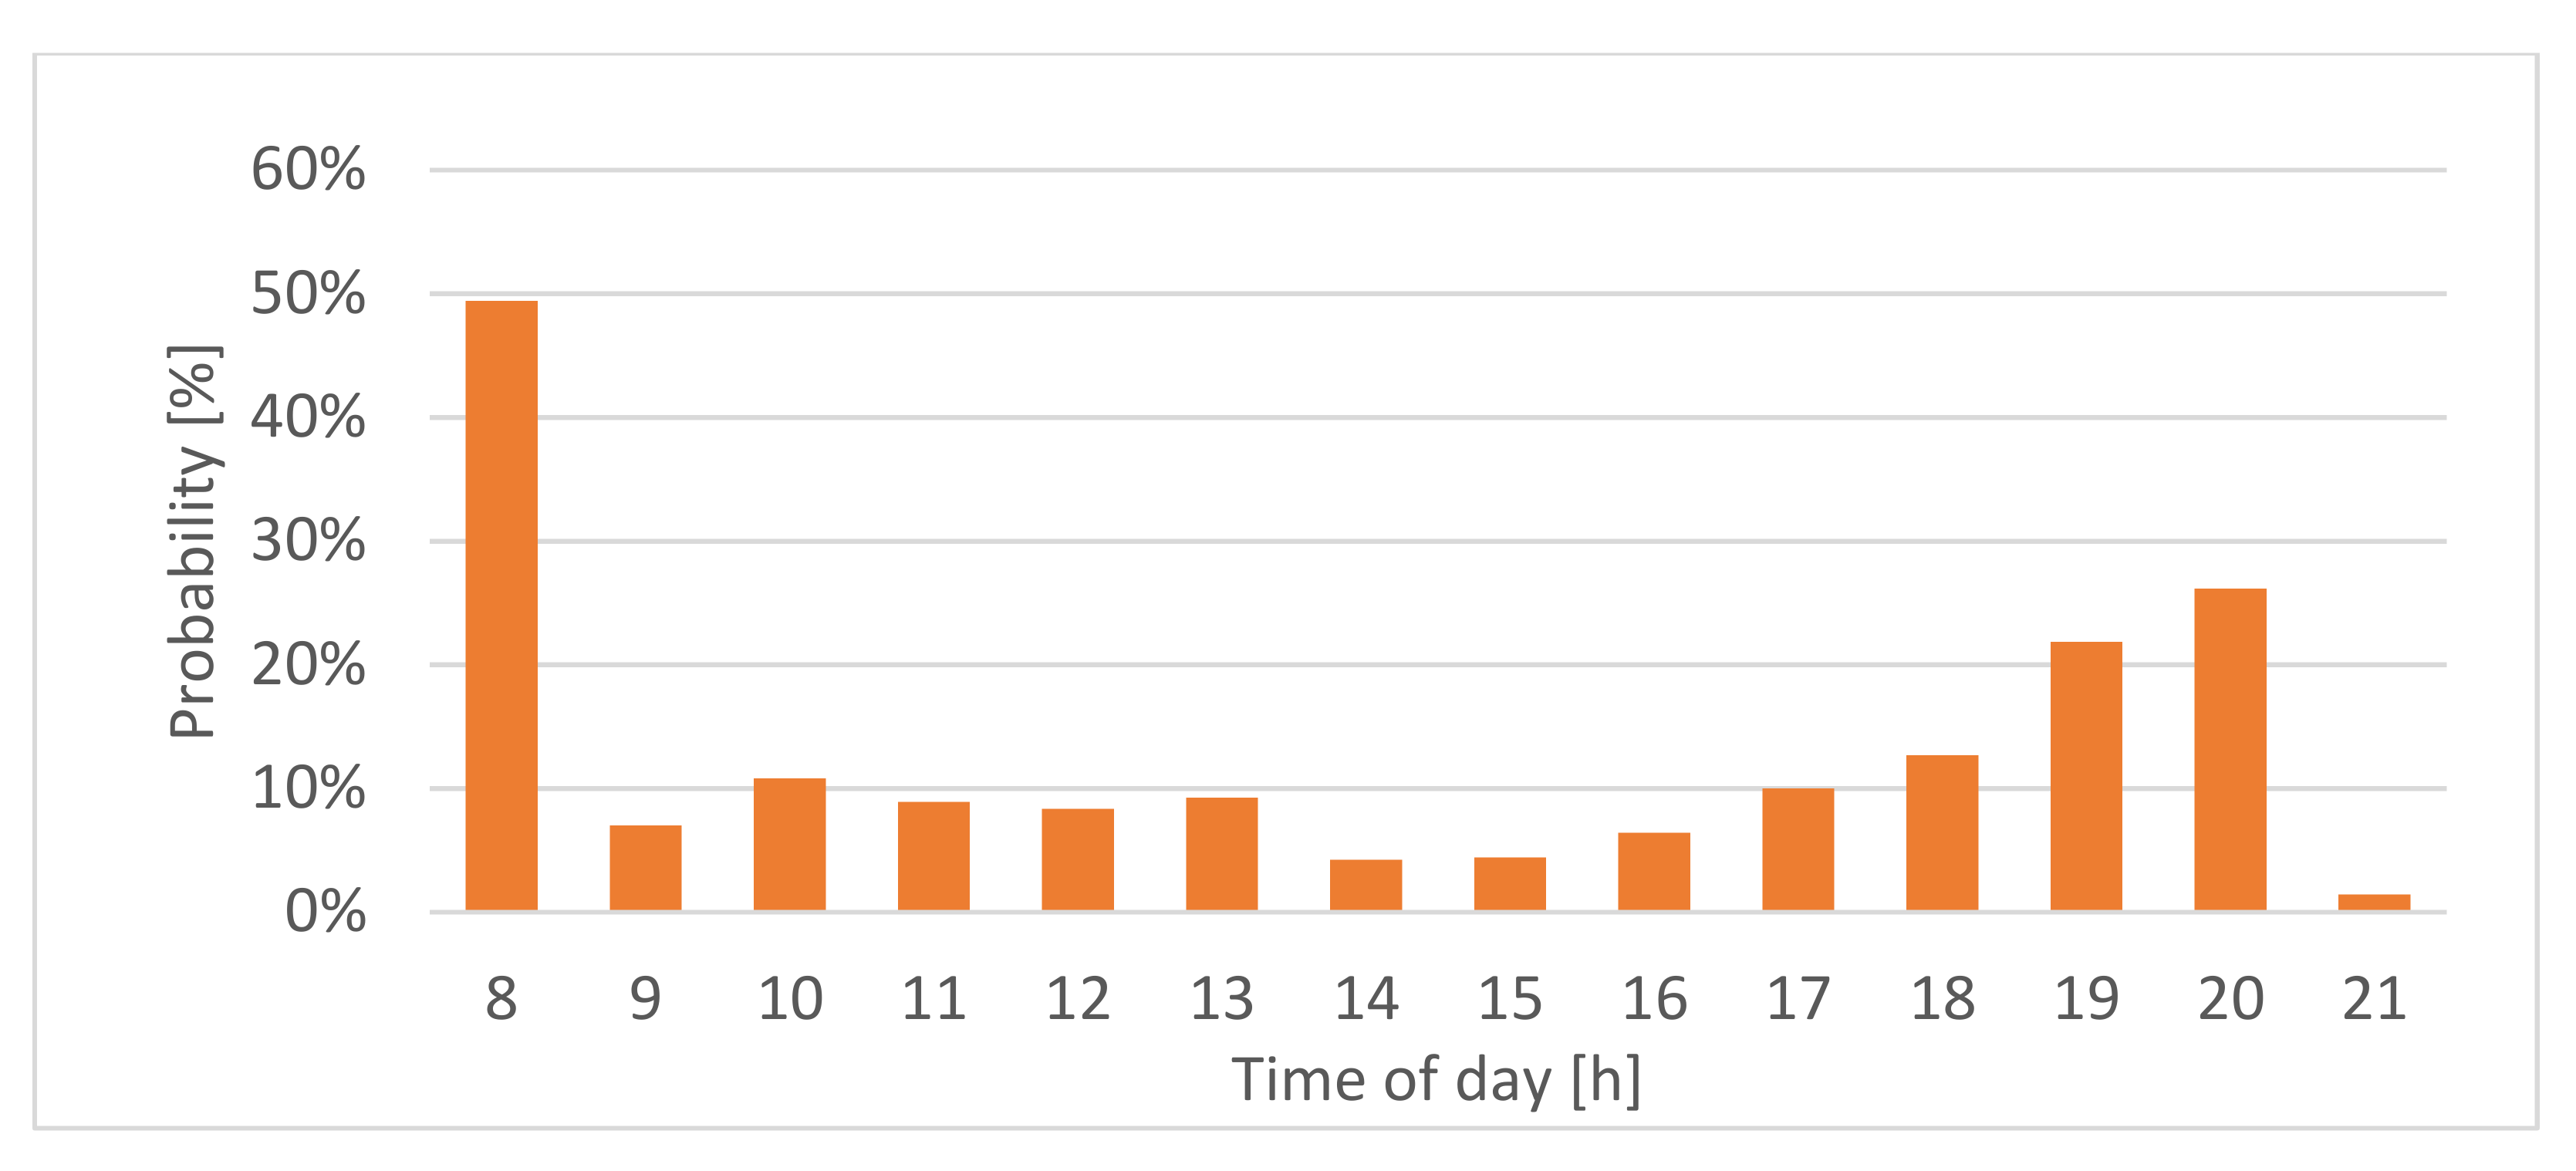
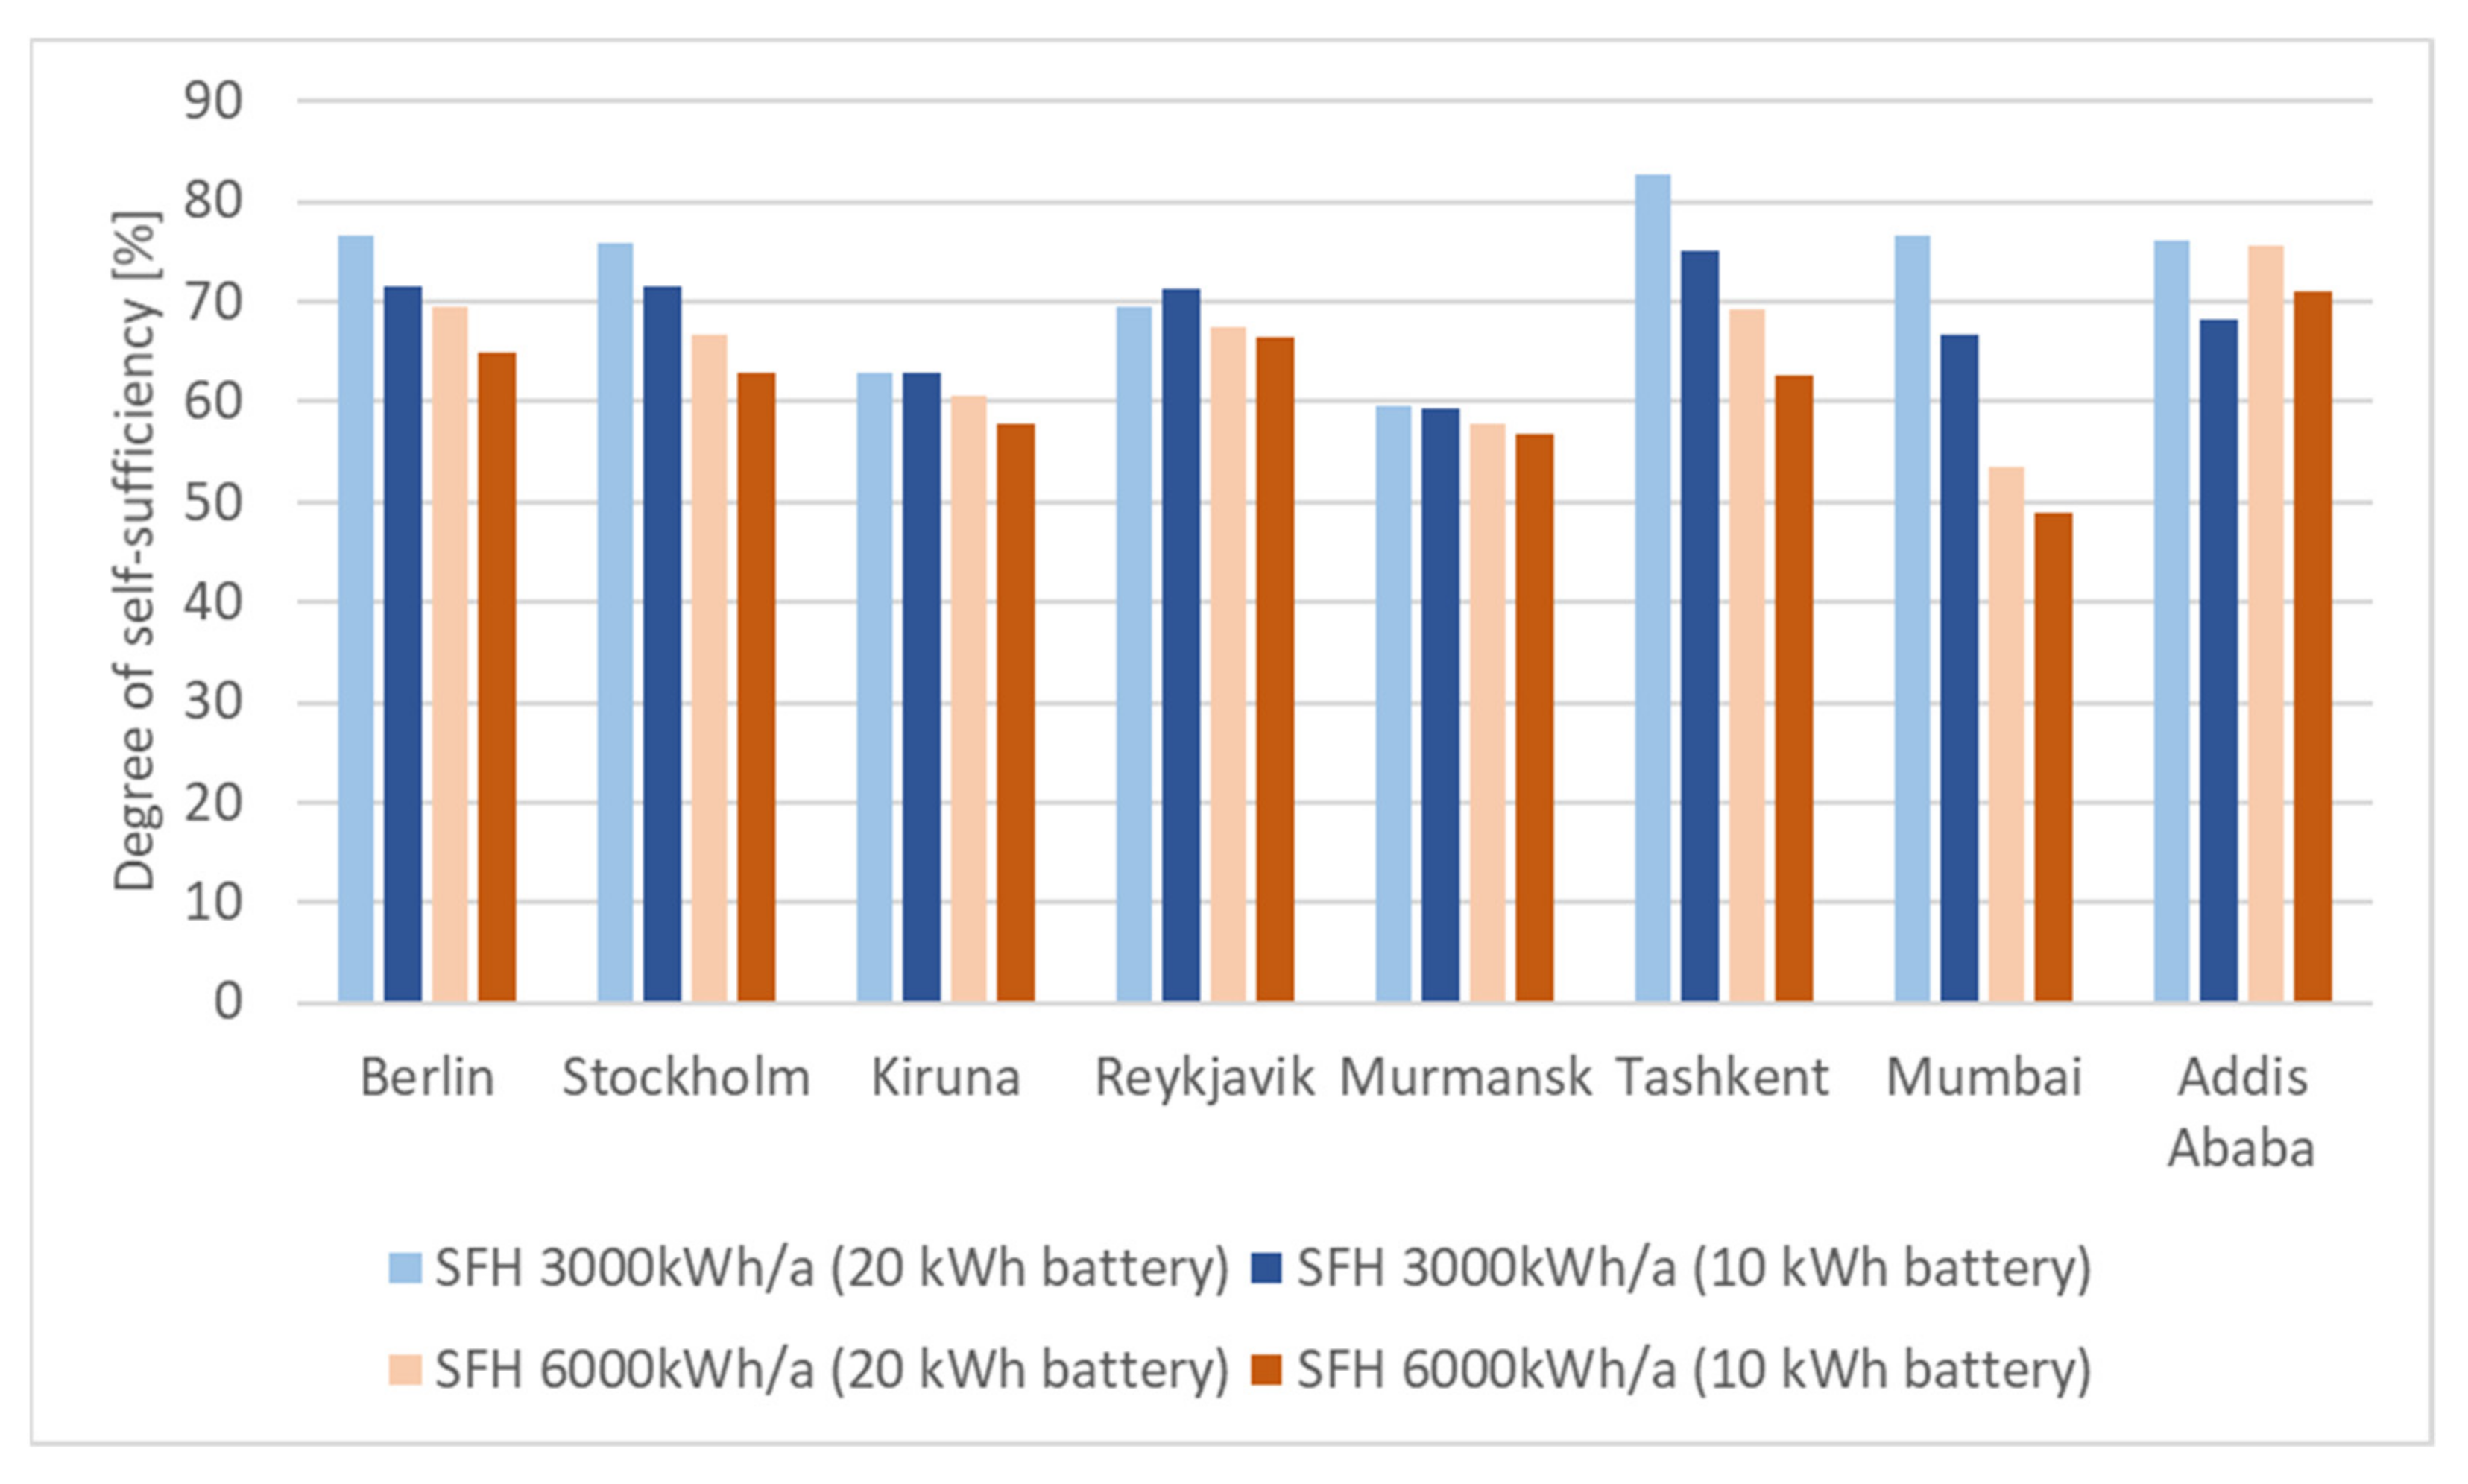
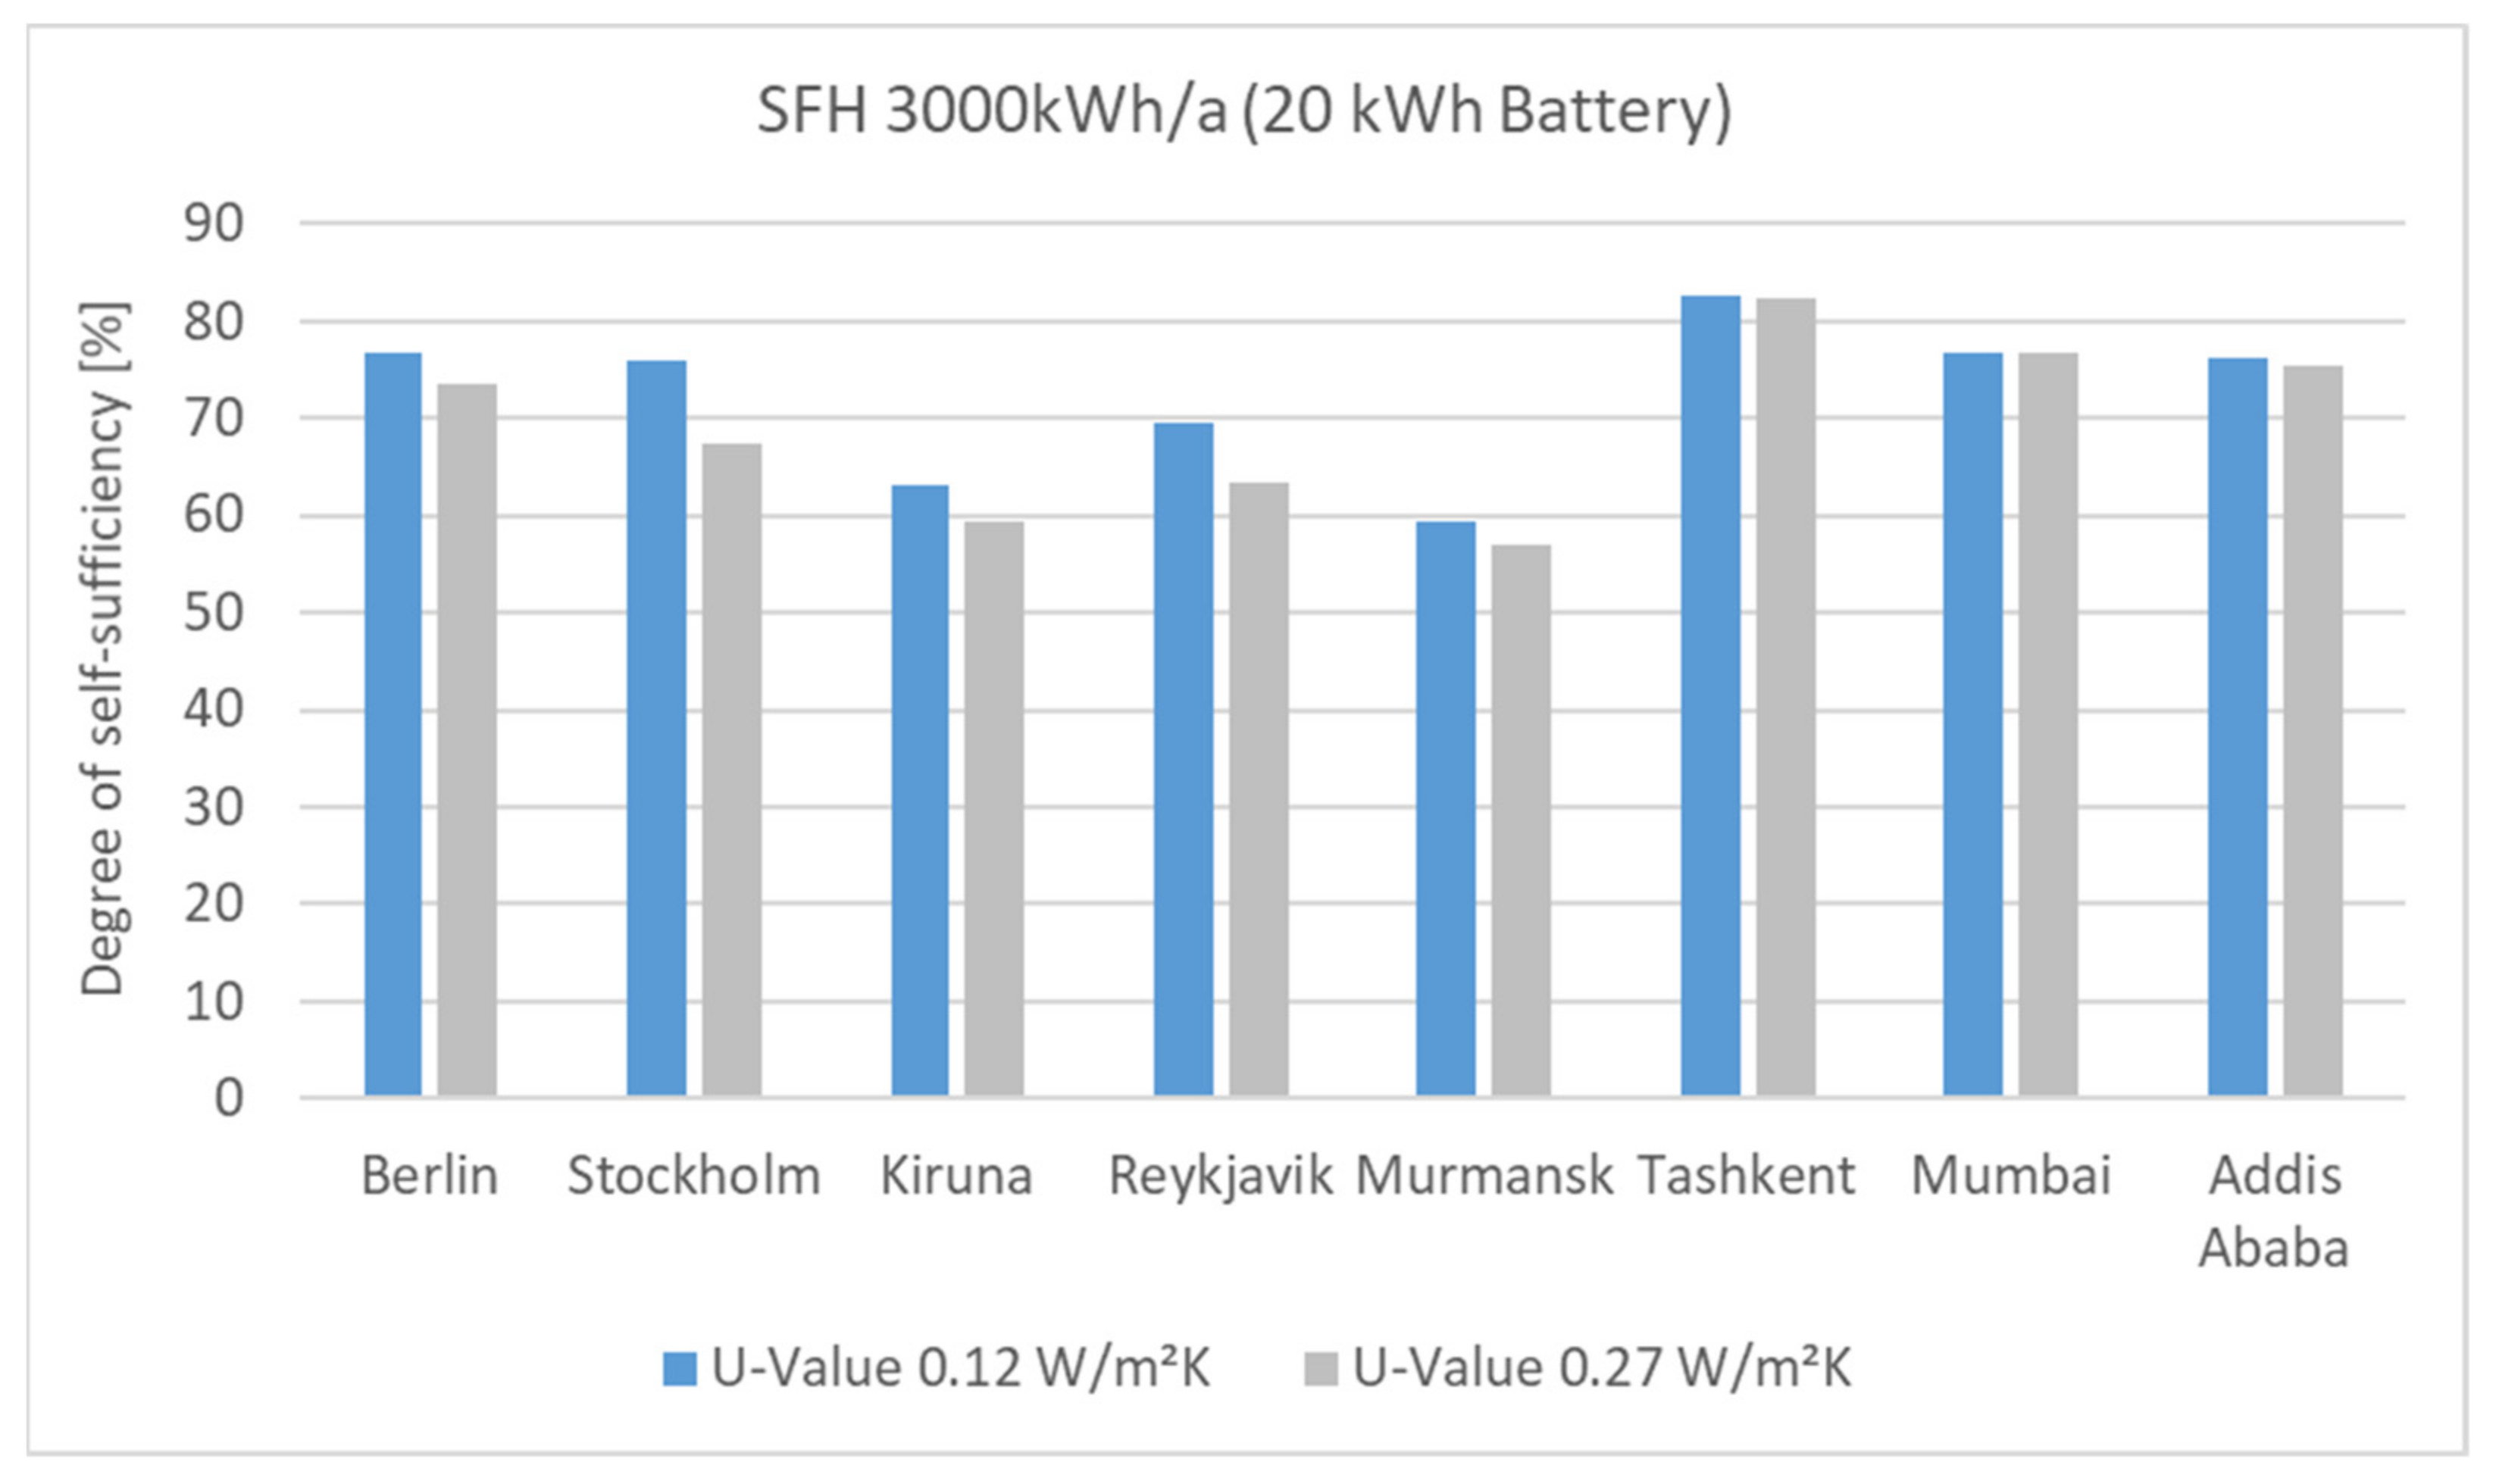