
Comparison of Summer Outdoor Thermal Environment Optimization Strategies in Different Residential Districts in Xi’an, China
 ,
,
Abstract
:1. Introduction
1.1. Effects from UHI
1.2. Causes of UHI
1.3. Strategies to Mitigate UHI
1.3.1. Use of Green Spaces and Trees to Mitigate the UHI Effect
1.3.2. Modification of Thermal Performance of Building and Road Materials
1.4. Research on Residential Districts in China
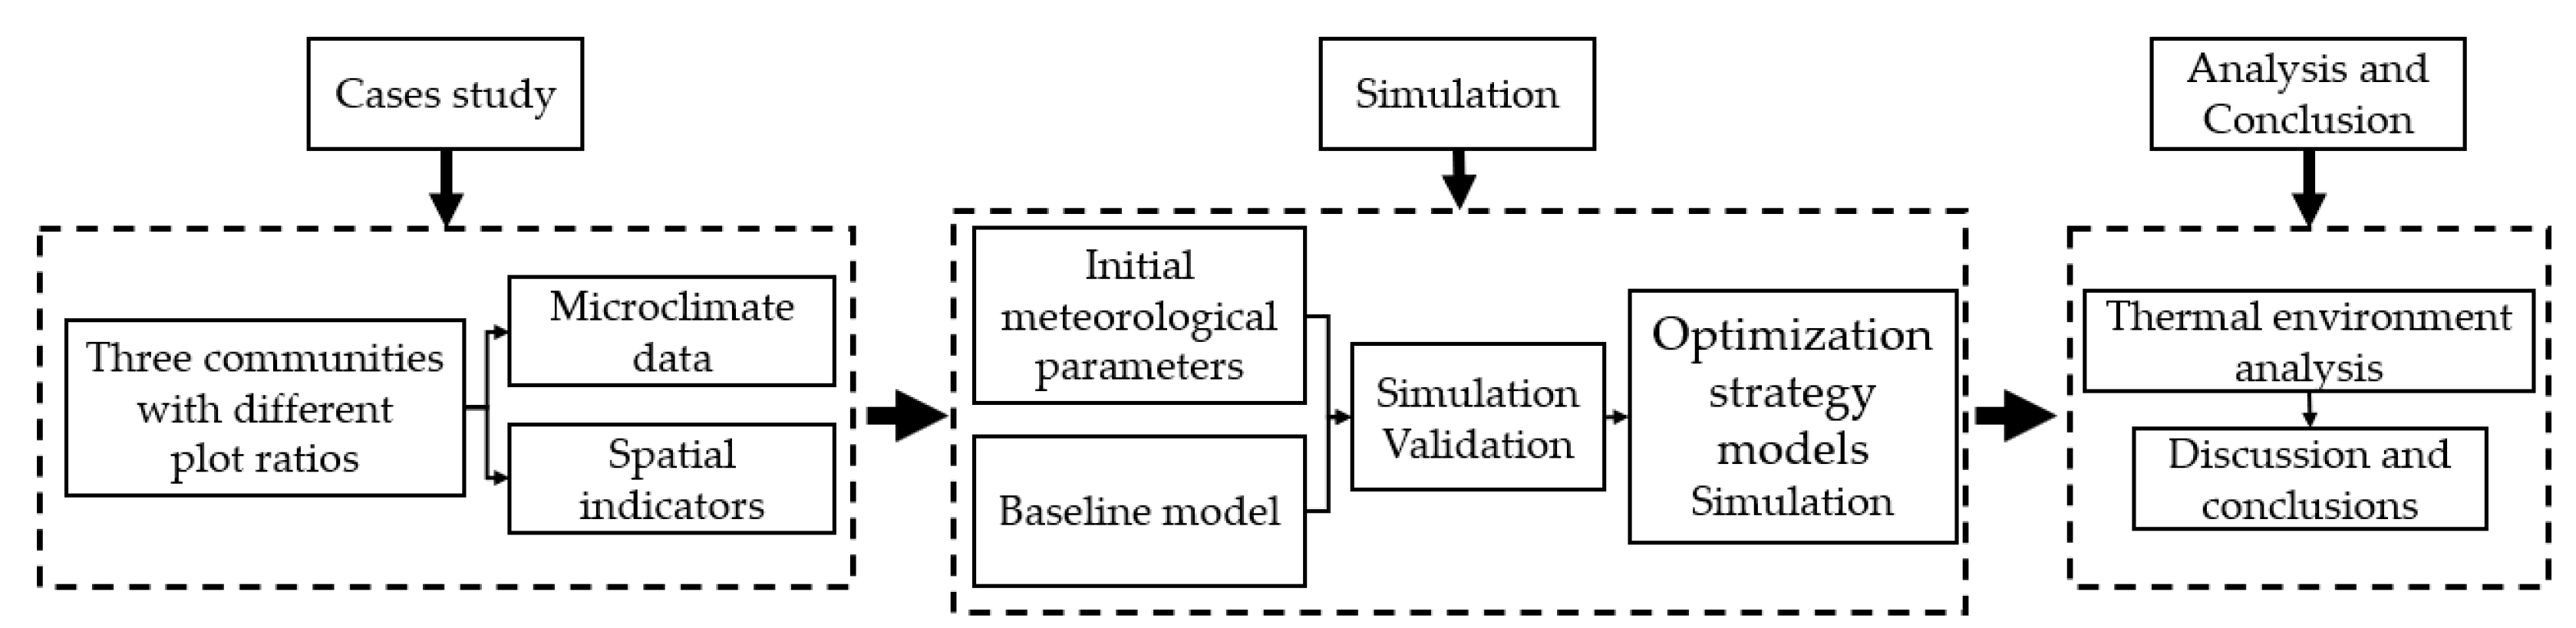
2. Methods
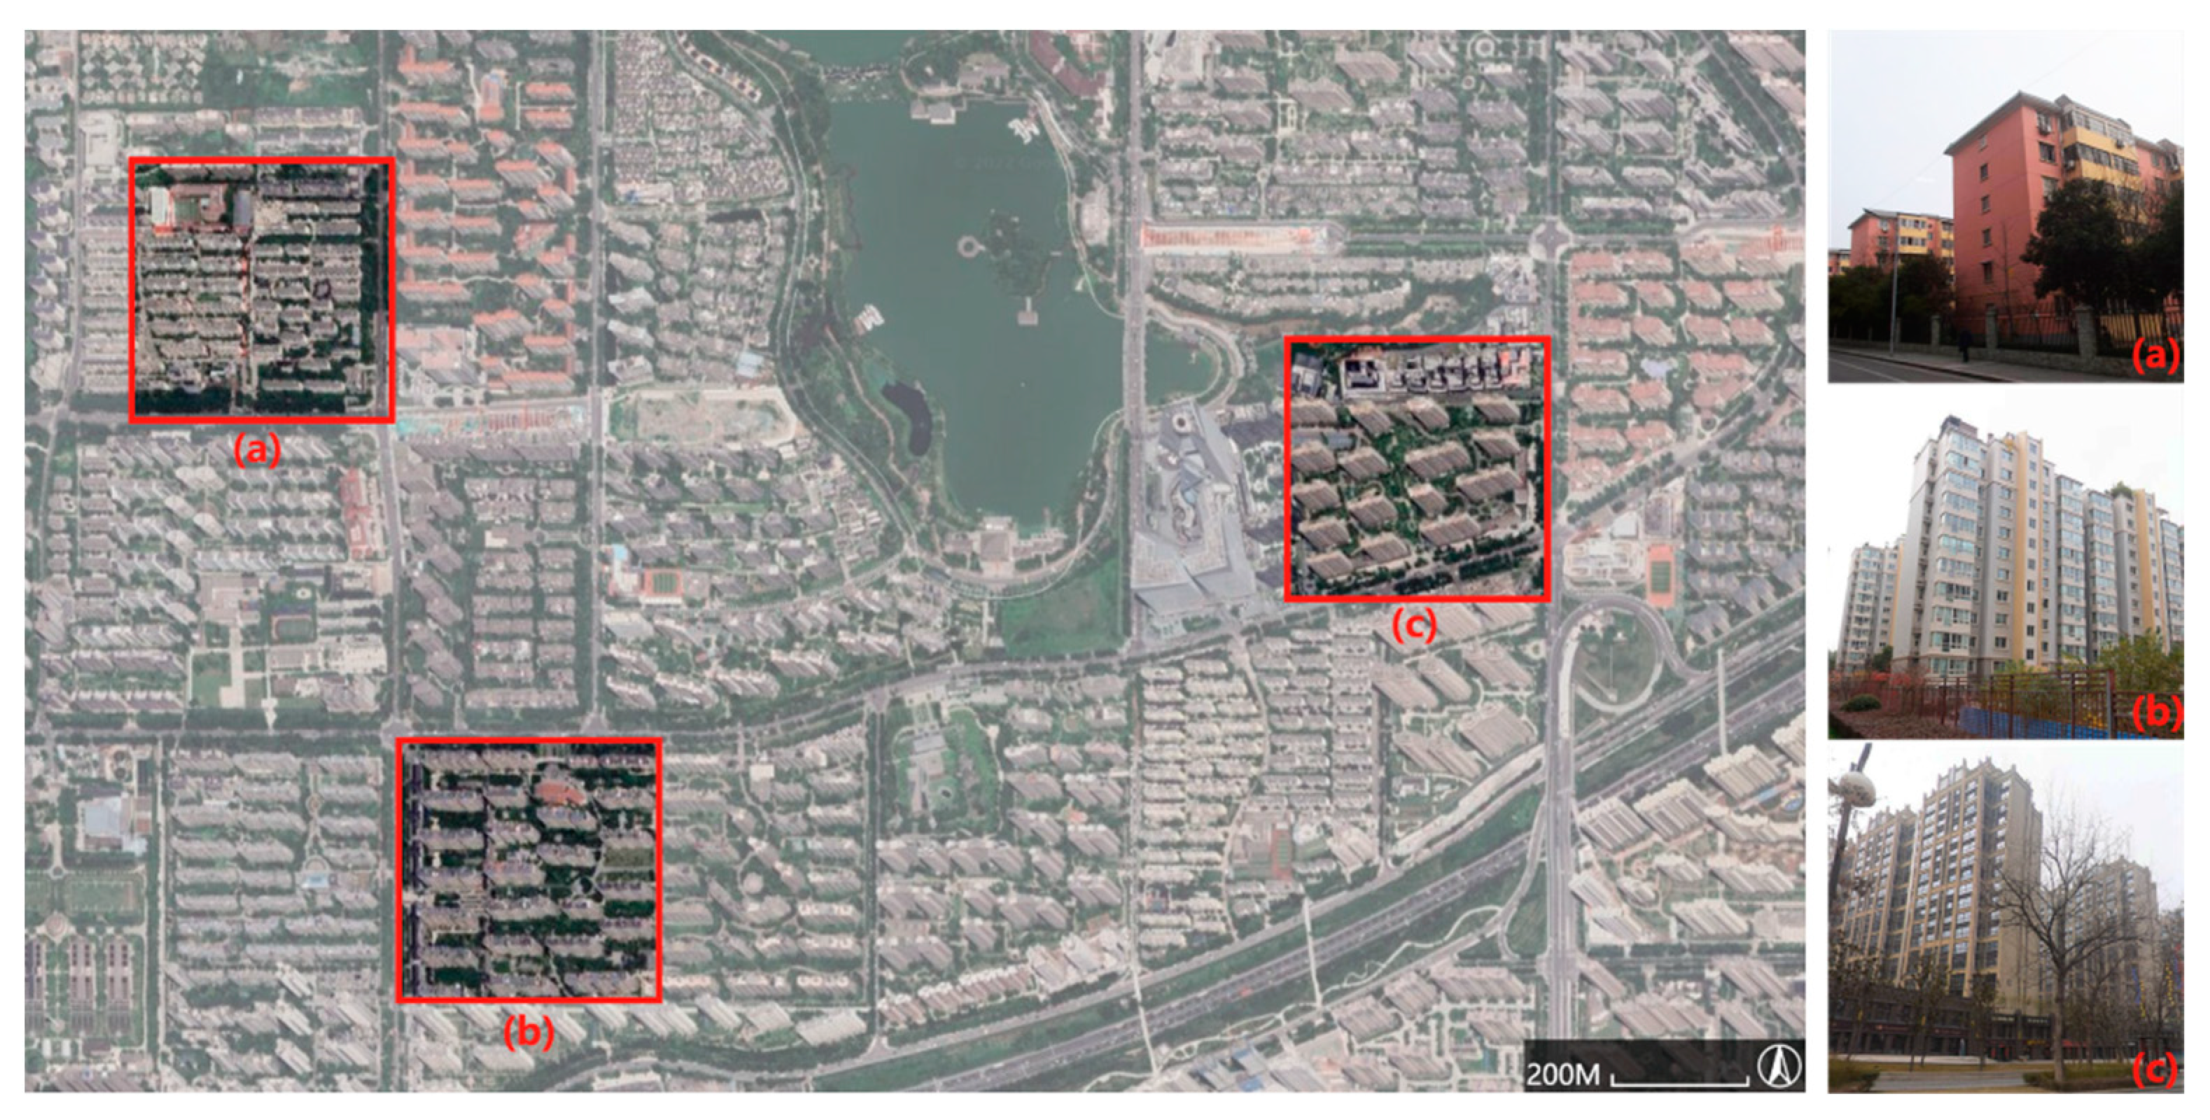
2.1. Study Cases
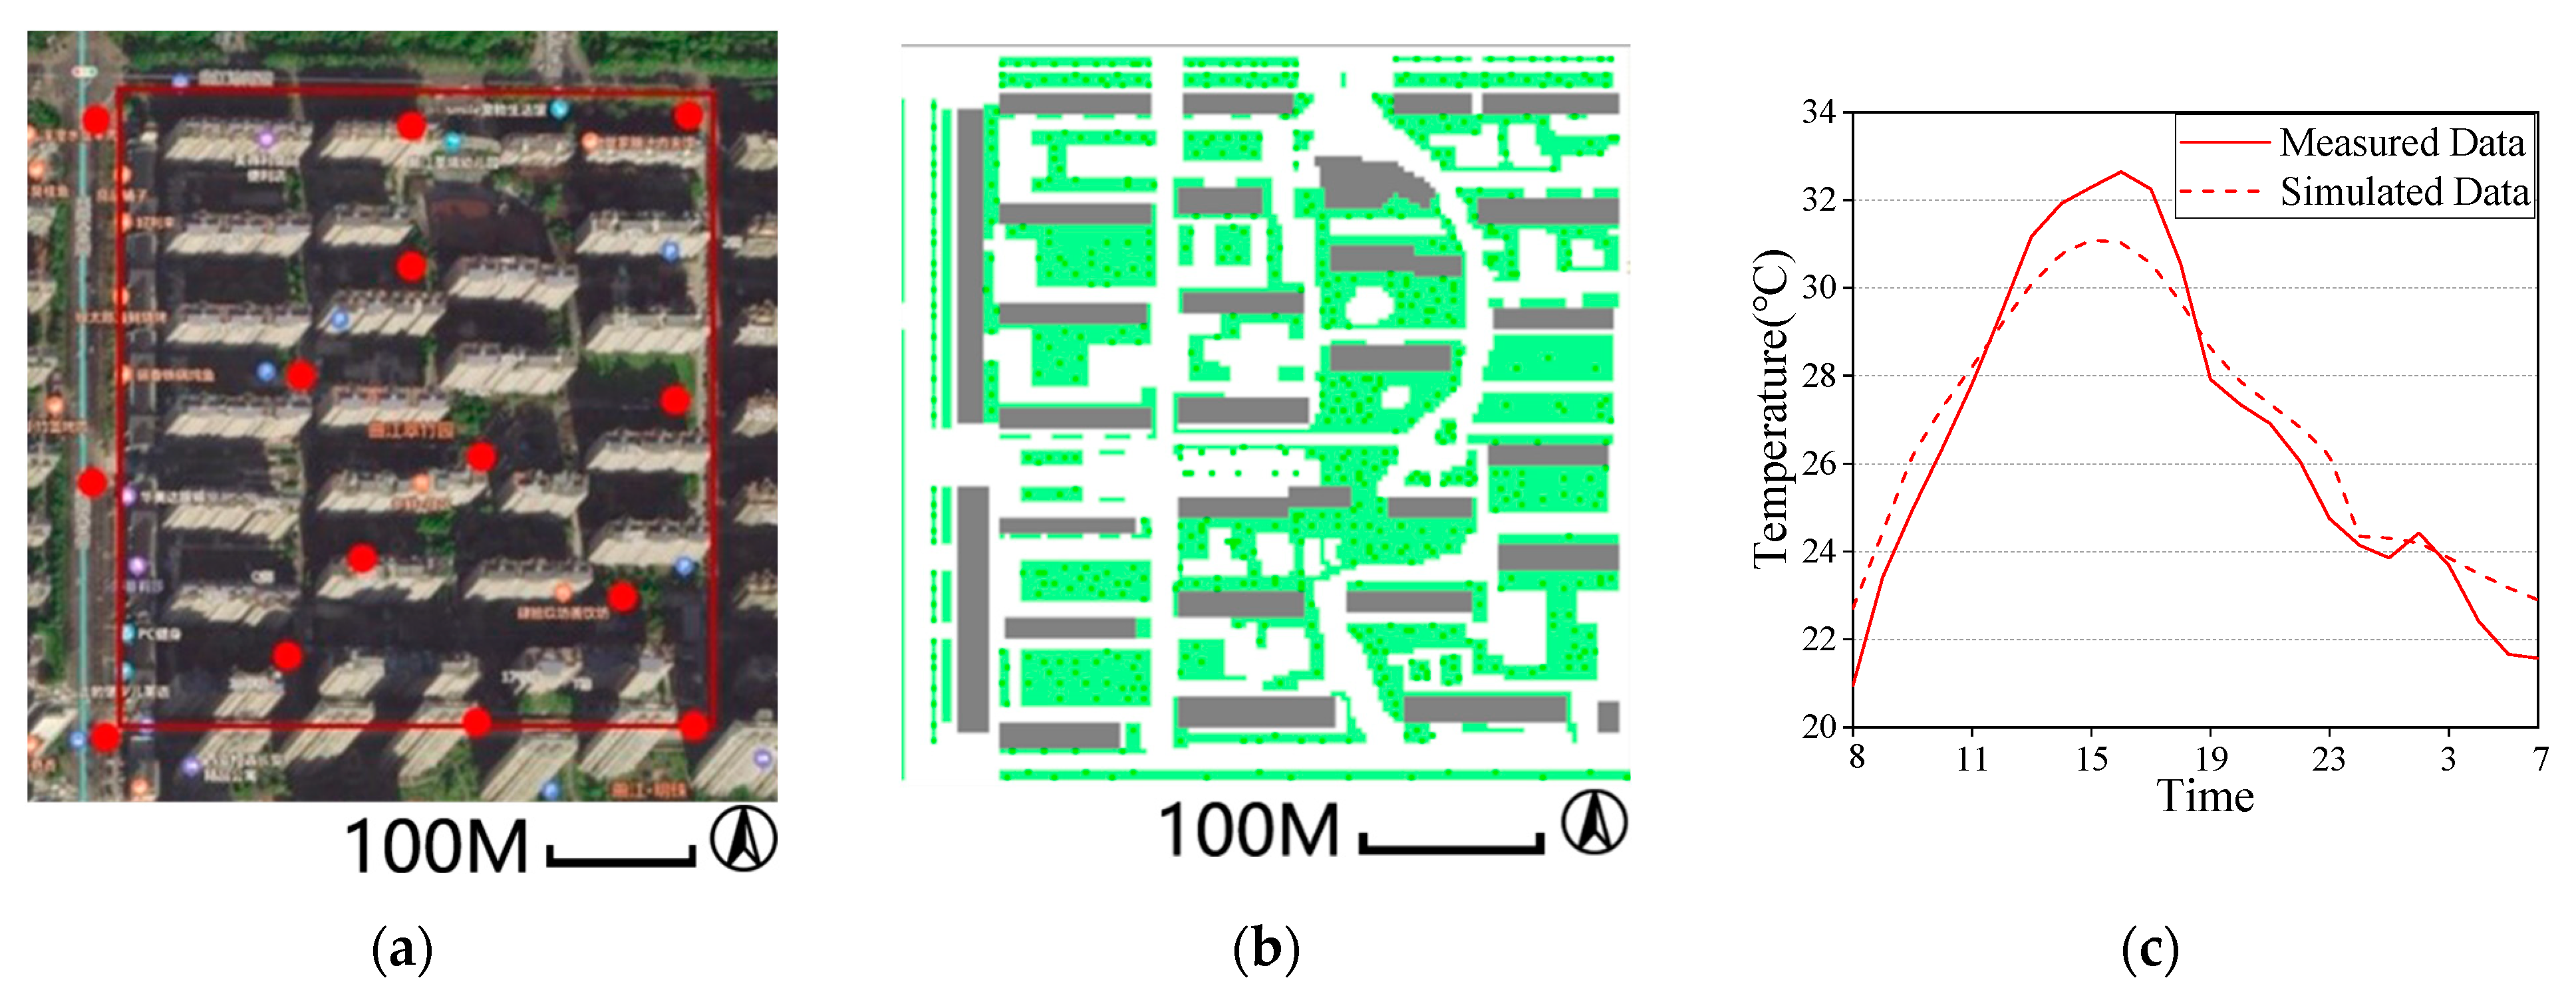
2.2. Environmental Simulation Software and Validation
2.3. Proposed Optimization Strategies
- Baseline Model (BM): This model was built based on field measurements of the residential districts.
- Grass Model (GM): This model increased the green space ratio of the residential districts by 10% by adding grass and reducing roads.
- Tree Model (TM): This model spread 10% more trees in residential districts while keeping the green space ratio unchanged. The dispersed planting of trees could make the improvement of outdoor thermal comfort more economical [32].
- Green Roof Model (GR): This model replaced building roofs with green roofs.
- Cool Pavement Model (CP): This model increased the solar reflectance of roads from 0.2 to 0.4.
- Cool Facade Model (CF): This model increased the solar reflectance of building facades from 0.5 to 0.8.
- Cool Community Model (CC): This model combined five optimization strategies simultaneously. The use of several methods in combination with other methods has been shown to be the most effective strategy [9].
2.4. Modeling and Initial Condition Setting
2.5. Assessing Parameters
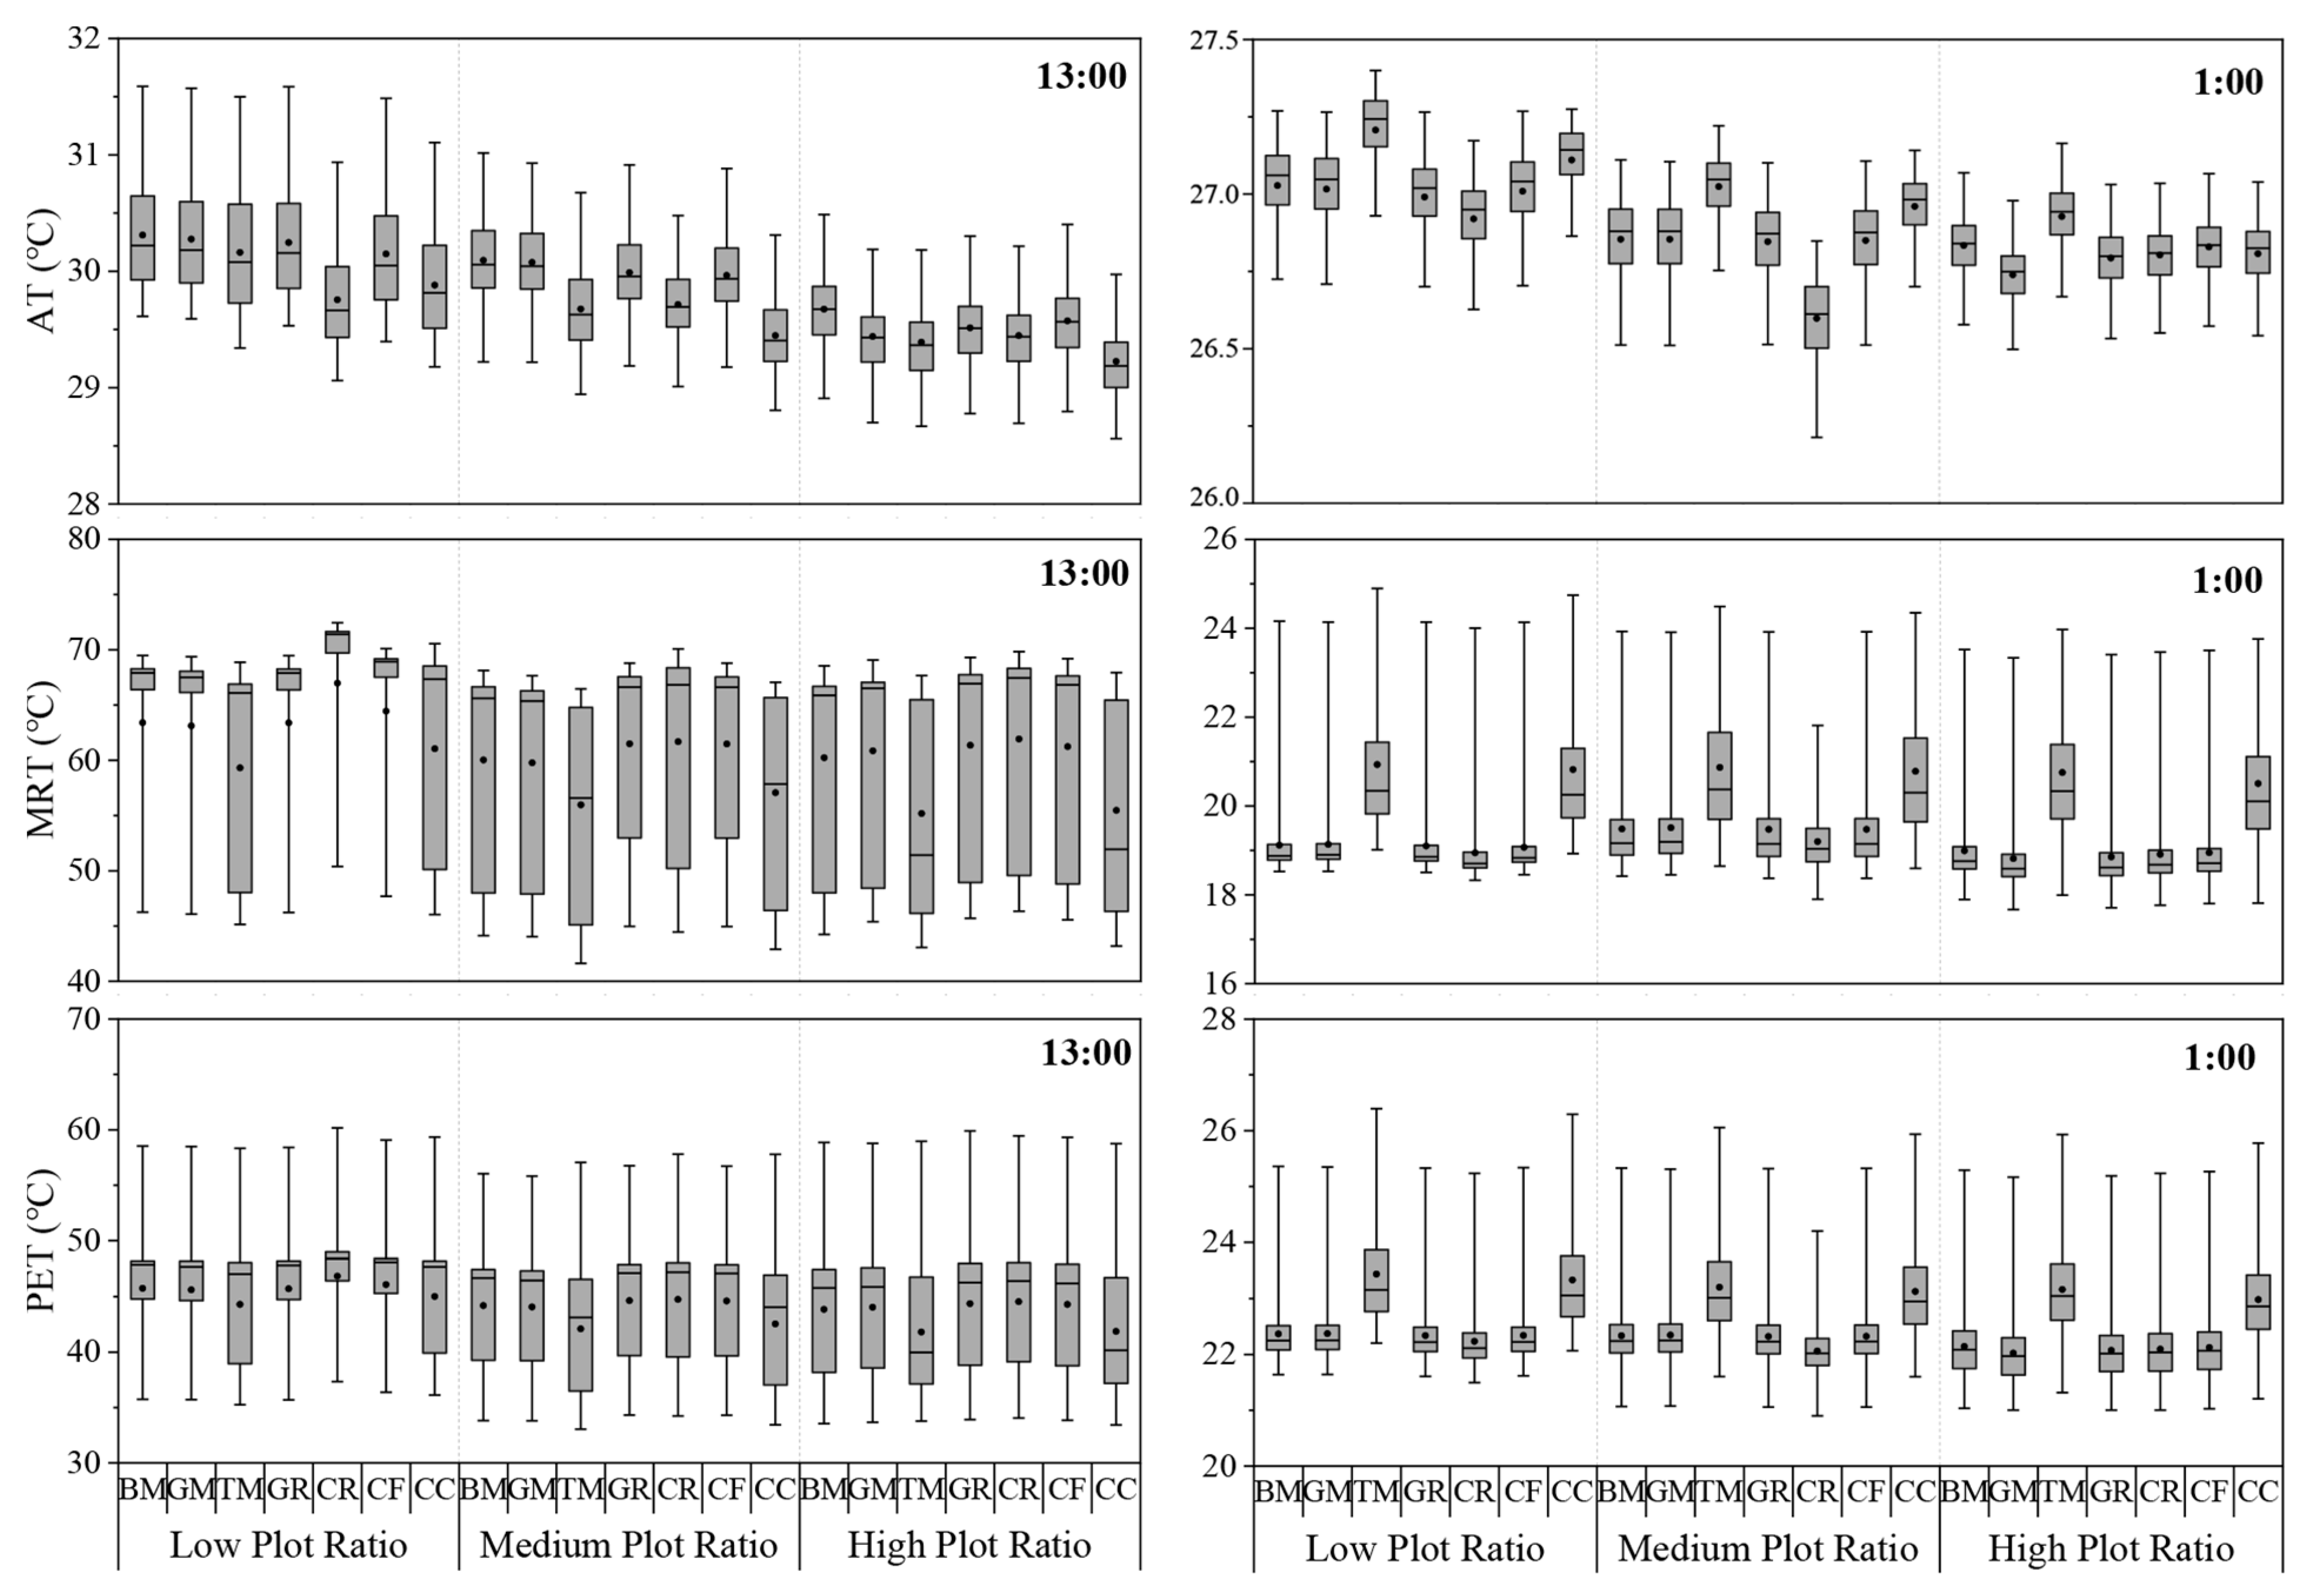
3. Results
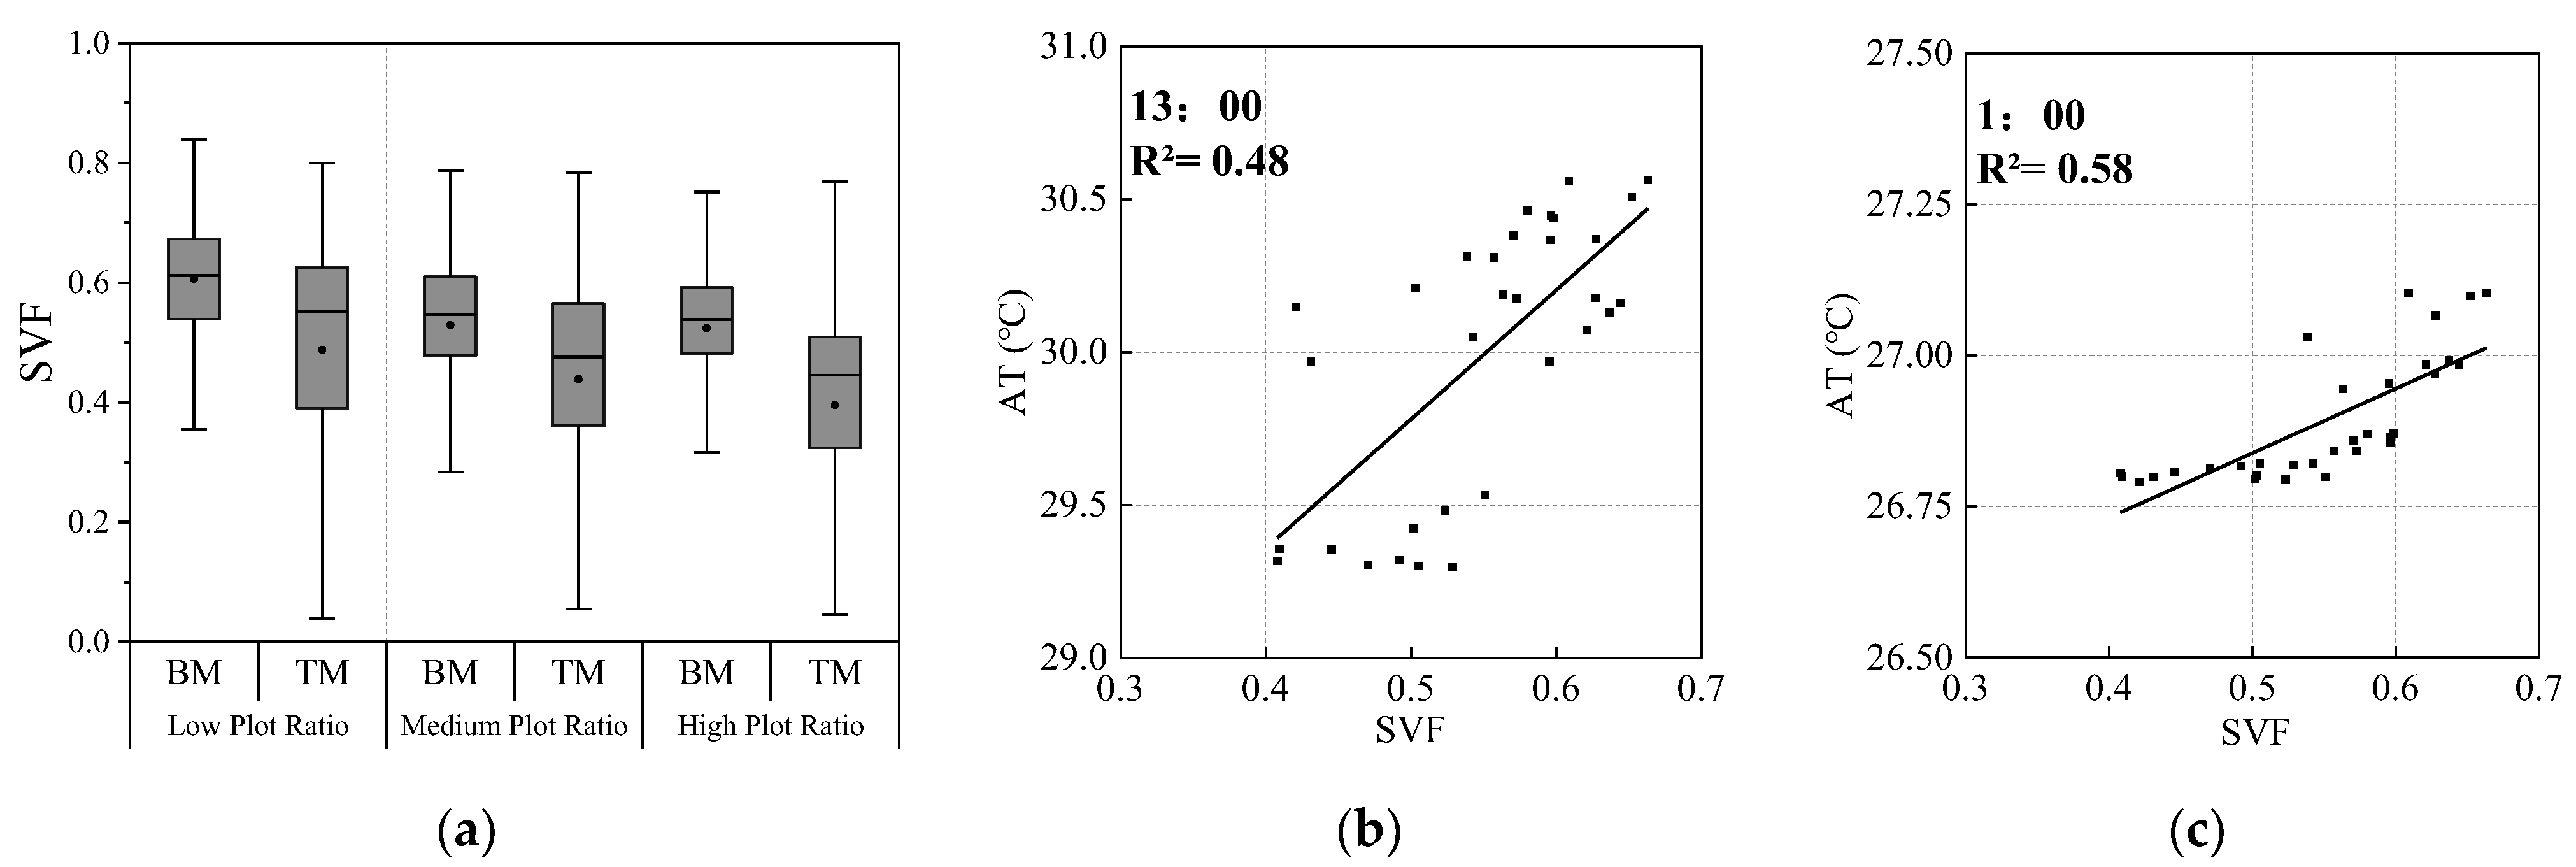
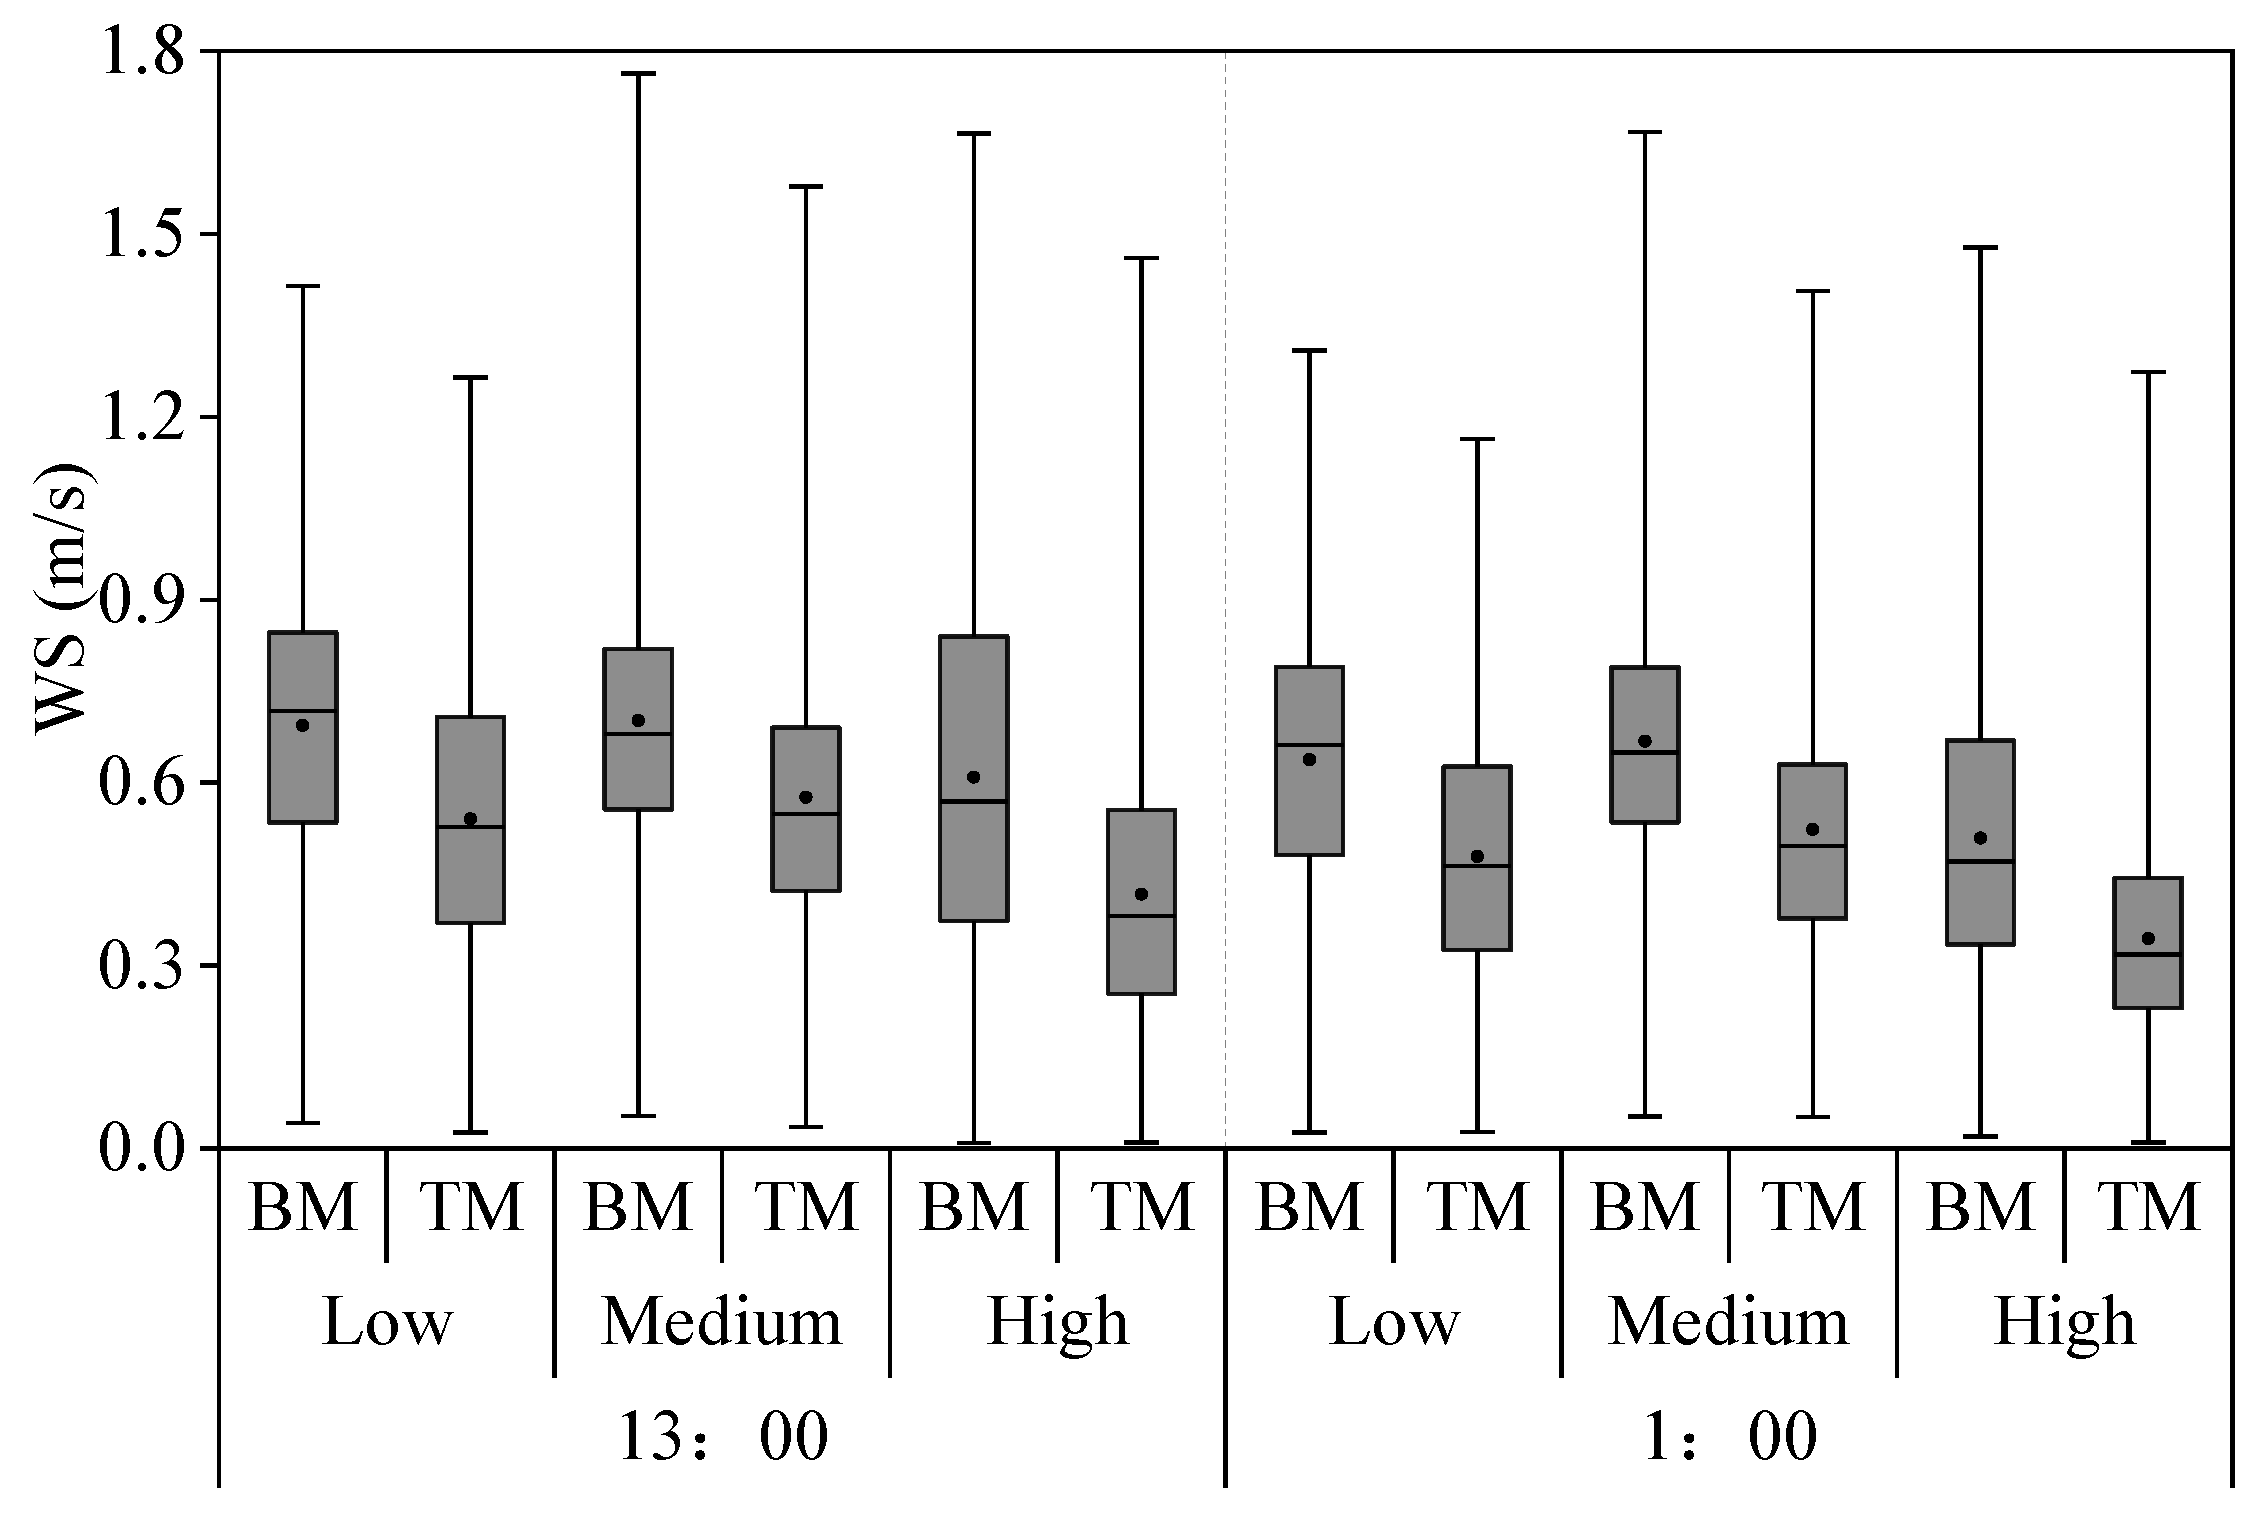
3.1. Basic Model Analysis
3.2. Optimization with Grass, Trees, and Green Roofs
3.3. Optimization with Cool Pavements and Cool Facades
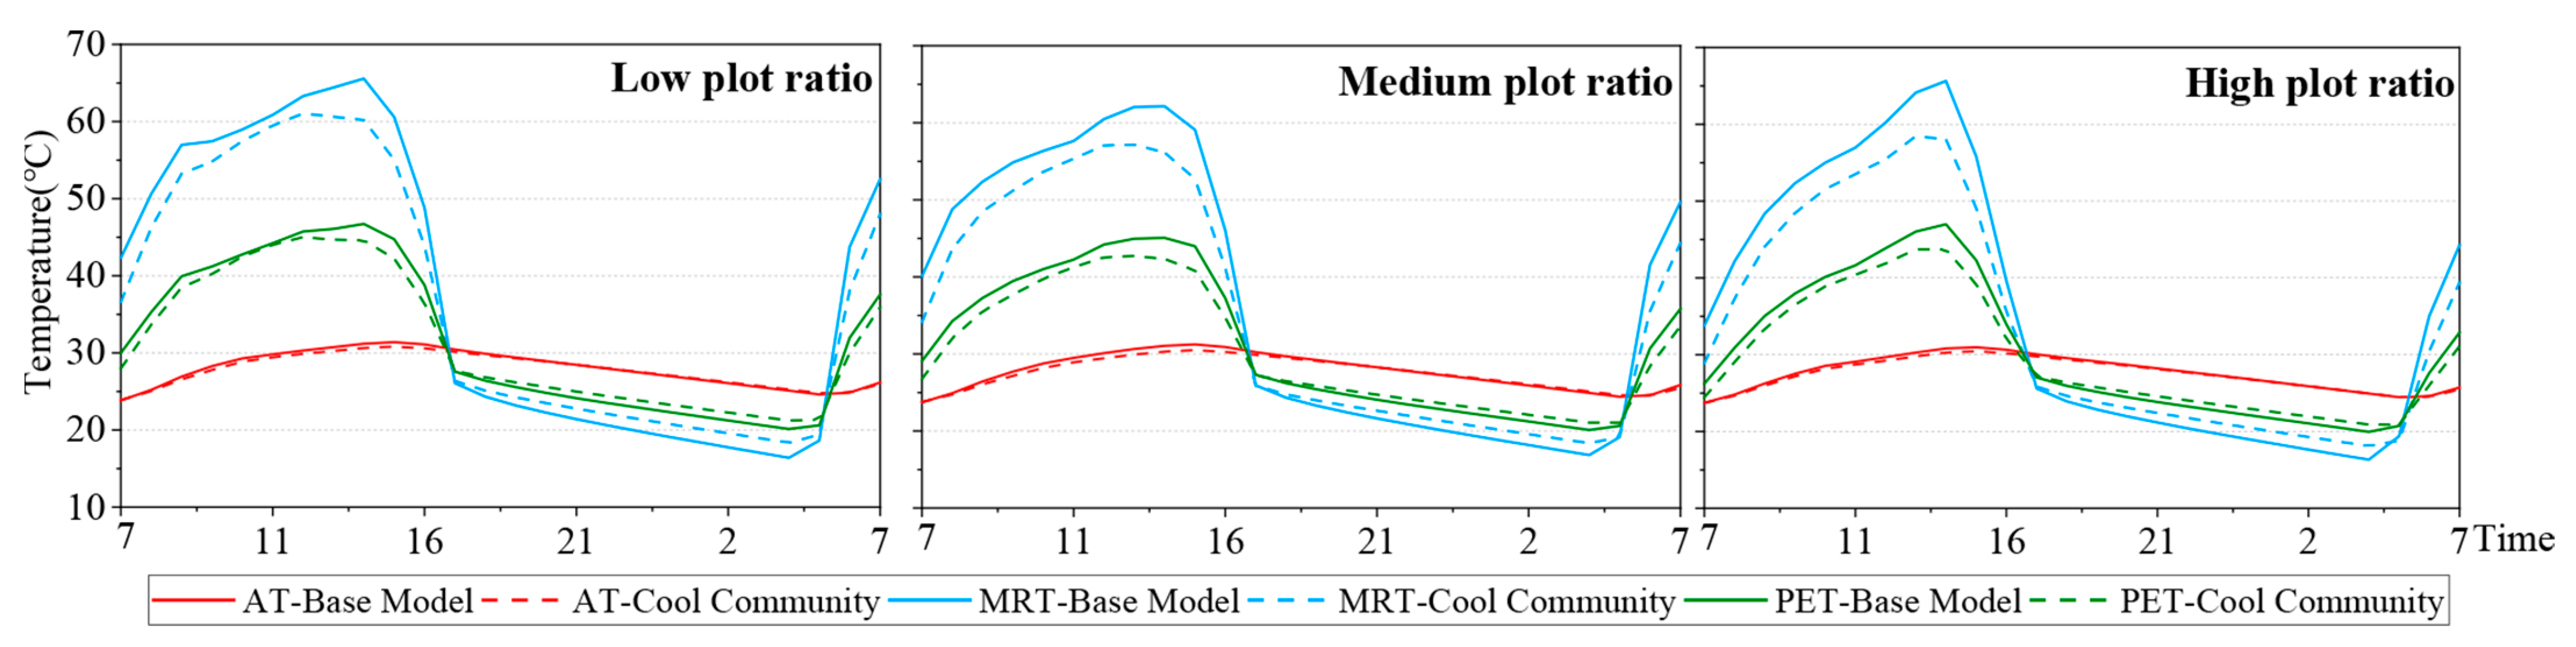
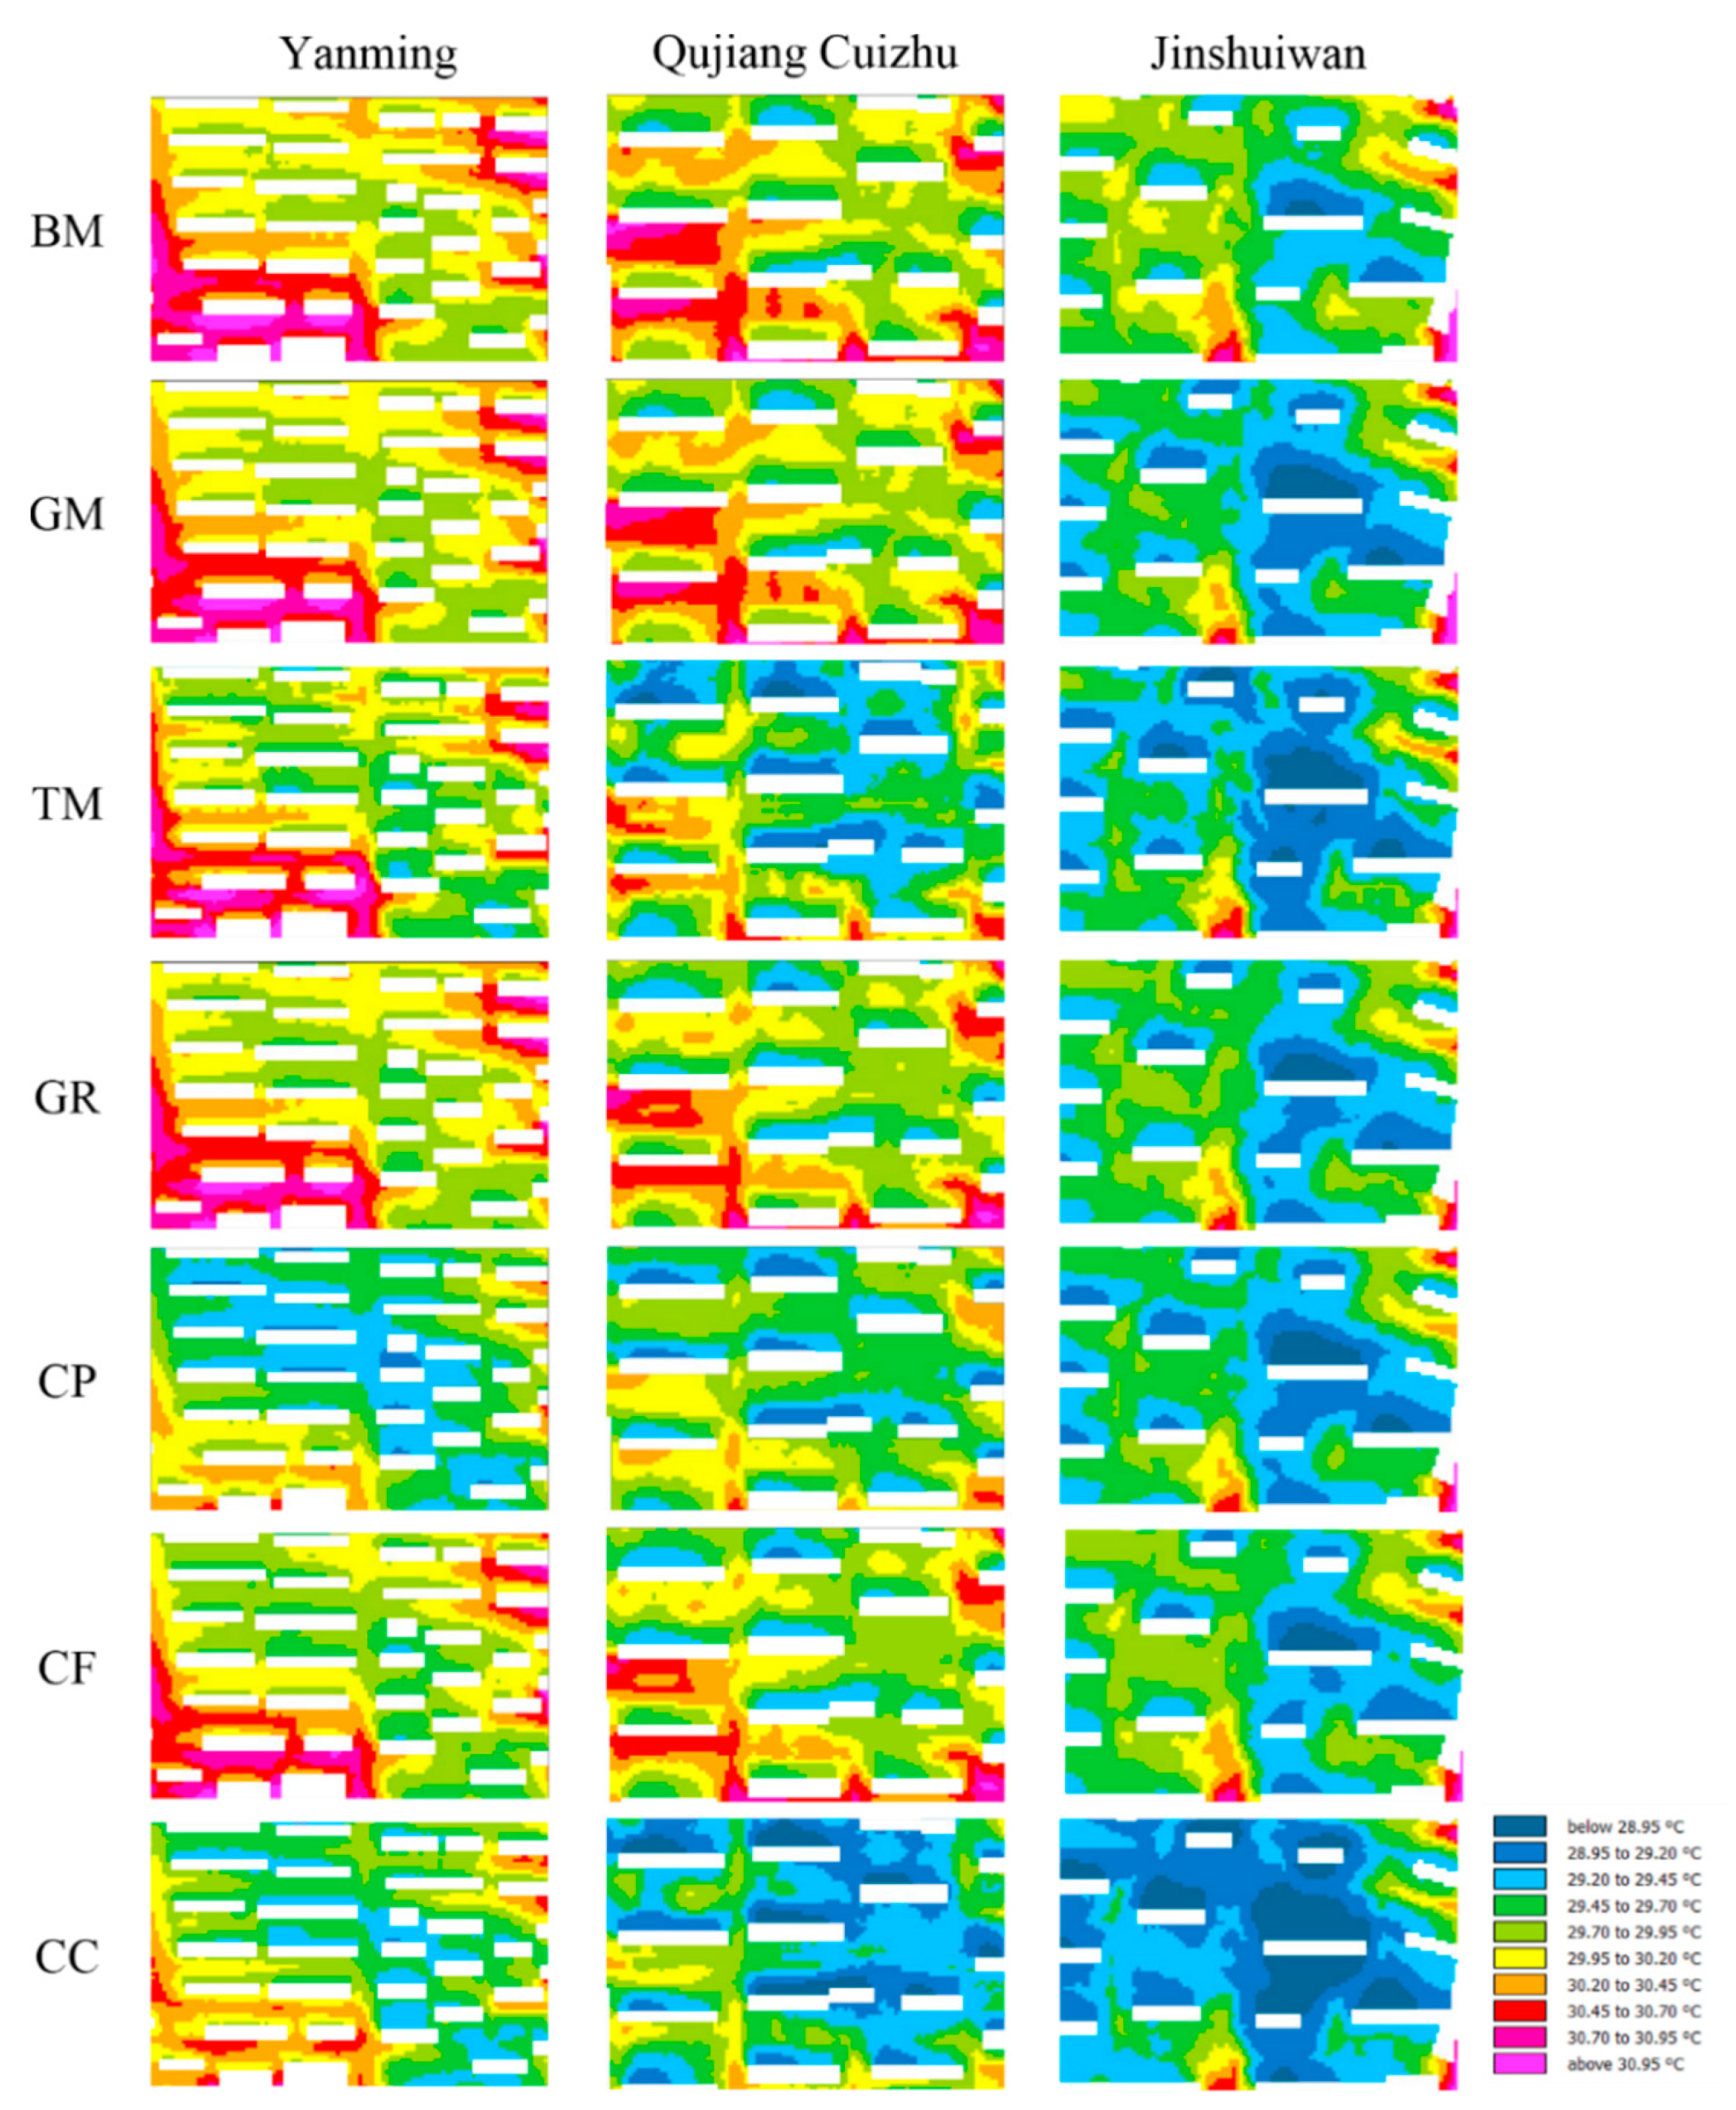
3.4. Optimization of Cool Community
4. Discussion
5. Conclusions
Author Contributions
Funding
Institutional Review Board Statement
Informed Consent Statement
Data Availability Statement
Conflicts of Interest
References
- Rydin, Y.; Bleahu, A.; Davies, M.; Davila, J.D.; Friel, S.; De Grandis, G.; Groce, N.; Hallal, P.C.; Hamilton, I.; Howden-Chapman, P.; et al. Shaping cities for health: Complexity and the planning of urban environments in the 21st century. Lancet 2012, 379, 2079–2108. [Google Scholar] [CrossRef]
- Kleerekoper, L.; van Esch, M.; Salcedo, T.B. How to make a city climate-proof, addressing the urban heat island effect. Resour. Conserv. Recycl. 2012, 64, 30–38. [Google Scholar] [CrossRef]
- Dhalluin, A.; Bozonnet, E. Urban heat islands and sensitive building design—A study in some French cities’ context. Sustain. Cities Soc. 2015, 19, 292–299. [Google Scholar] [CrossRef]
- Huynen, M.-M.; Martens, P.; Schram, D.; Weijenberg, M.P.; Kunst, A.E. The impact of heat waves and cold spells on mortality rates in the Dutch population. Environ. Health Perspect. 2001, 109, 463–470. [Google Scholar] [CrossRef] [PubMed]
- Priyadarsini, R. Urban heat island and its impact on building energy consumption. Adv. Build. Energy Res. 2009, 3, 261–270. [Google Scholar] [CrossRef]
- Li, X.; Zhou, Y.; Yu, S.; Jia, G.; Li, H.; Li, W. Urban heat island impacts on building energy consumption: A review of approaches and findings. Energy 2019, 174, 407–419. [Google Scholar] [CrossRef]
- O’Malley, C.; Piroozfar, P.; Farr, E.R.P.; Pomponi, F. Urban Heat Island (UHI) mitigating strategies: A case-based comparative analysis. Sustain. Cities Soc. 2015, 19, 222–235. [Google Scholar] [CrossRef]
- Kolokotroni, M.; Ren, X.; Davies, M.; Mavrogianni, A. London’s urban heat island: Impact on current and future energy consumption in office buildings. Energy Build. 2012, 47, 302–311. [Google Scholar] [CrossRef]
- Mohajerani, A.; Bakaric, J.; Jeffrey-Bailey, T. The urban heat island effect, its causes, and mitigation, with reference to the thermal properties of asphalt concrete. J. Environ. Manag. 2017, 197, 522–538. [Google Scholar] [CrossRef]
- Golden, J.S.; Kaloush, K.E. Mesoscale and microscale evaluation of surface pavement impacts on the urban heat island effects. Int. J. Pavement Eng. 2006, 7, 37–52. [Google Scholar] [CrossRef]
- Rizwan, A.M.; Dennis, L.Y.; Chunho, L. A review on the generation, determination and mitigation of Urban Heat Island. J. Environ. Sci. 2008, 20, 120–128. [Google Scholar] [CrossRef]
- Oke, T.R. Boundary Layer Climates; Routledge: London, UK, 2002. [Google Scholar]
- Memon, R.A.; Leung, D.Y.; Liu, C.-H. Effects of building aspect ratio and wind speed on air temperatures in urban-like street canyons. Build. Environ. 2010, 45, 176–188. [Google Scholar] [CrossRef]
- Wang, Y.; Akbari, H. Development and application of ‘thermal radiative power’ for urban environmental evaluation. Sustain. Cities Soc. 2015, 14, 316–322. [Google Scholar] [CrossRef]
- Ge, J.; Wang, Y.; Akbari, H.; Zhou, D. The effects of sky view factor on ground surface temperature in cold regions—A case from Xi’an, China. Build. Environ. 2022, 210, 108707. [Google Scholar] [CrossRef]
- Akbari, H.; Kolokotsa, D. Three decades of urban heat islands and mitigation technologies research. Energy Build. 2016, 133, 834–842. [Google Scholar]
- Rafiee, A.; Dias, E.; Koomen, E. Local impact of tree volume on nocturnal urban heat island: A case study in Amsterdam. Urban For. Urban Green. 2016, 16, 50–61. [Google Scholar] [CrossRef]
- Shashua-Bar, L.; Hoffman, M.E. Vegetation as a climatic component in the design of an urban street: An empirical model for predicting the cooling effect of urban green areas with trees. Energy Build. 2000, 31, 221–235. [Google Scholar] [CrossRef]
- Wong, N.H.; Tan, A.Y.K.; Tan, P.Y.; Wong, N.C. Energy simulation of vertical greenery systems. Energy Build. 2009, 41, 1401–1408. [Google Scholar] [CrossRef]
- Ismail, A.; Samad, M.H.A.; Rahman, A.M.A. The investigation of green roof and white roof cooling potential on single storey residential building in the Malaysian climate. World Acad. Sci. Eng. Technol. 2011, 52, 129–137. [Google Scholar]
- Taha, H. Urban climates and heat islands: Albedo, evapotranspiration, and anthropogenic heat. Energy Build. 1997, 25, 99–103. [Google Scholar] [CrossRef]
- Santamouris, M. Using cool pavements as a mitigation strategy to fight urban heat island—A review of the actual developments. Renew. Sustain. Energy Rev. 2013, 26, 224–240. [Google Scholar]
- Akbari, H.; Levinson, R. Evolution of Cool-Roof Standards in the US; Routledge: London, UK, 2013. [Google Scholar]
- Rossi, F.; Castellani, B.; Presciutti, A.; Morini, E.; Filipponi, M.; Nicolini, A.; Santamouris, M. Retroreflective façades for urban heat island mitigation: Experimental investigation and energy evaluations. Appl. Energy 2015, 145, 8–20. [Google Scholar] [CrossRef]
- Qin, Y. A review on the development of cool pavements to mitigate urban heat island effect. Renew. Sustain. Energy Rev. 2015, 52, 445–459. [Google Scholar] [CrossRef]
- GB 50137-2011; Code for Classification of Urban Land Use and Planning Standards of Development Land. Ministry of Housing and Urban-Rural Development of the People’s Republic of China: Beijing, China, 2011.
- Abdel-Ghany, A.; Al-Helal, I.; Shady, M. Human thermal comfort and heat stress in an outdoor urban arid environment: A case study. Adv. Meteorol. 2013, 2013, 693541. [Google Scholar] [CrossRef]
- Lai, D.; Guo, D.; Hou, Y.; Lin, C.; Chen, Q. Studies of outdoor thermal comfort in northern China. Build. Environ. 2014, 77, 110–118. [Google Scholar] [CrossRef]
- Fu, J.; Wang, Y.; Zhou, D.; Cao, S.-J. Impact of Urban Park Design on Microclimate in Cold Regions using newly developped prediction method. Sustain. Cities Soc. 2022, 80, 103781. [Google Scholar]
- Tan, Z.; Lau, K.K.-L.; Ng, E. Urban tree design approaches for mitigating daytime urban heat island effects in a high-density urban environment. Energy Build. 2016, 114, 265–274. [Google Scholar]
- Zhu, Z.; Zhou, D.; Wang, Y.; Ma, D.; Meng, X. Assessment of urban surface and canopy cooling strategies in high-rise residential communities. J. Clean. Prod. 2021, 288, 125599. [Google Scholar] [CrossRef]
- Yang, Y.; Zhou, D.; Wang, Y.; Ma, D.; Chen, W.; Xu, D.; Zhu, Z. Economical and outdoor thermal comfort analysis of greening in multistory residential areas in Xi’an. Sustain. Cities Soc. 2019, 51, 101730. [Google Scholar] [CrossRef]
- Zhang, L.; Zhan, Q.; Lan, Y. Effects of the tree distribution and species on outdoor environment conditions in a hot summer and cold winter zone: A case study in Wuhan residential quarters. Build. Environ. 2018, 130, 27–39. [Google Scholar]
- Xu, D.; Zhou, D.; Wang, Y.; Xu, W.; Yang, Y. Field measurement study on the impacts of urban spatial indicators on urban climate in a Chinese basin and static-wind city. Build. Environ. 2019, 147, 482–494. [Google Scholar] [CrossRef]
- Crank, P.J.; Sailor, D.J.; Ban-Weiss, G.; Taleghani, M. Evaluating the ENVI-met microscale model for suitability in analysis of targeted urban heat mitigation strategies. Urban Clim. 2018, 26, 188–197. [Google Scholar] [CrossRef]
- Chen, Y.; Wang, Y.; Zhou, D. Knowledge Map of Urban Morphology and Thermal Comfort: A Bibliometric Analysis Based on CiteSpace. Buildings 2021, 11, 427. [Google Scholar] [CrossRef]
- Wang, Y.P.; Berardi, U.; Akbari, H. Comparing the effects of urban heat island mitigation strategies for Toronto, Canada. Energy Build. 2016, 114, 2–19. [Google Scholar] [CrossRef]
- Erell, E.; Pearlmutter, D.; Williamson, T. Urban Microclimate: Designing the Spaces between Buildings; Routledge: London, UK, 2012. [Google Scholar]
- Ng, E.; Chen, L.; Wang, Y.N.; Yuan, C. A study on the cooling effects of greening in a high-density city: An experience from Hong Kong. Build. Environ. 2012, 47, 256–271. [Google Scholar] [CrossRef]
- Razzaghmanesh, M.; Beecham, S.; Salemi, T. The role of green roofs in mitigating Urban Heat Island effects in the metropolitan area of Adelaide, South Australia. Urban For. Urban Green. 2016, 15, 89–102. [Google Scholar] [CrossRef]
- Tan, C.L.; Wong, N.H.; Tan, P.Y.; Jusuf, S.K.; Chiam, Z.Q. Impact of plant evapotranspiration rate and shrub albedo on temperature reduction in the tropical outdoor environment. Build. Environ. 2015, 94, 206–217. [Google Scholar] [CrossRef]
- Köhler, M.; Schmidt, M.; Grimme, F.W.; Laar, M.; de Assunção Paiva, V.L.; Tavares, S. Green roofs in temperate climates and in the hot-humid tropics-far beyond the aesthetics. Environ. Manag. Health 2002, 13, 382–391. [Google Scholar] [CrossRef]
- Jandaghian, Z.; Akbari, H. The effects of increasing surface reflectivity on heat-related mortality in Greater Montreal Area, Canada. Urban Clim. 2018, 25, 135–151. [Google Scholar] [CrossRef]
- Alchapar, N.L.; Correa Cantaloube, E.N.; Canton, M.A. Solar reflectance index of pedestrian pavements and their response to aging. J. Clean Energy Technol. 2013, 1, 281–285. [Google Scholar] [CrossRef]
- Zauli Sajani, S.; Marchesi, S.; Lauriola, P.; Tomozeiu, R.; Botarelli, L.; Bonafè, G.; Guaragno, G.; Fiumi, F.; Zanelli, M.; Gherardi, L. UHI in the metropolitan cluster of bologna-modena: Mitigation and adaptation strategies. In Counteracting Urban Heat Island Effects in a Global Climate Change Scenario; Springer: Berlin/Heidelberg, Germany, 2016; pp. 131–200. [Google Scholar]
- Taslim, S.; Parapari, D.M.; Shafaghat, A. Urban design guidelines to mitigate urban heat island (UHI) effects in hot-dry cities. J. Teknol. 2015, 74, 119–124. [Google Scholar] [CrossRef] [Green Version]


| Name | Type | Plot Ratio | Green Rate | Road Cover | Average Building Height |
|---|---|---|---|---|---|
| Yanming District | Medium-rise and low development | 1.5 | 0.17 | 0.56 | 16 m |
| Qujiang Cuizhu District | High-rise and medium development | 2.1 | 0.35 | 0.44 | 36 m |
| Jinshuiwan District | High-rise and high development | 2.7 | 0.40 | 0.42 | 57 m |
| Yanming District | Qujiang Cuizhu District | Jinshuiwan District | |
|---|---|---|---|
| Satellite photos |  |  |  |
| BM |  |  |  |
| GM |  |  |  |
| TM |  |  |  |
Publisher’s Note: MDPI stays neutral with regard to jurisdictional claims in published maps and institutional affiliations. |
© 2022 by the authors. Licensee MDPI, Basel, Switzerland. This article is an open access article distributed under the terms and conditions of the Creative Commons Attribution (CC BY) license (https://creativecommons.org/licenses/by/4.0/).
Share and Cite
Zhang, X.; Wang, Y.; Zhou, D.; Yang, C.; An, H.; Teng, T. Comparison of Summer Outdoor Thermal Environment Optimization Strategies in Different Residential Districts in Xi’an, China. Buildings 2022, 12, 1332. https://0-doi-org.brum.beds.ac.uk/10.3390/buildings12091332
Zhang X, Wang Y, Zhou D, Yang C, An H, Teng T. Comparison of Summer Outdoor Thermal Environment Optimization Strategies in Different Residential Districts in Xi’an, China. Buildings. 2022; 12(9):1332. https://0-doi-org.brum.beds.ac.uk/10.3390/buildings12091332
Chicago/Turabian StyleZhang, Xuefeng, Yupeng Wang, Dian Zhou, Chao Yang, Huibin An, and Teng Teng. 2022. "Comparison of Summer Outdoor Thermal Environment Optimization Strategies in Different Residential Districts in Xi’an, China" Buildings 12, no. 9: 1332. https://0-doi-org.brum.beds.ac.uk/10.3390/buildings12091332