1. Introduction
Ongoing technological advancements have placed considerable pressure on engineers and architects to design structures that are thermally efficient and cost-effective, with the ultimate goal of enhancing the quality of the indoor thermal environment for occupants. This is particularly important due to the significant energy consumption associated with buildings, which accounts for approximately one third of global carbon emissions [
1,
2,
3]. Using data from the last ten years, it is seen that the building sector in Turkey consumes more energy than the industry and transportation sectors, with a share of 32.3% of total energy consumption, and that heating and cooling account for approximately 70% of total energy consumption in buildings [
4]. Many reports at the national, regional, and global levels highlighted the importance of radiant heating and cooling (RHC) over conventional systems in relation to “near-zero” energy consumption in buildings [
5,
6,
7].
Thermal comfort is a sensation that reflects a person’s satisfaction with the thermal environment they are in. The purpose of a heating and cooling system is to provide a suitable environment in terms of thermal comfort standards, which is known as International Organization for Standardization (ISO 7730) and ASHRAE 55 [
8,
9]. As a new type of air conditioning system, RHC systems have increased in popularity over the past decade and, therefore, can offer improved indoor quality with more energy-saving potential than traditional air conditioning systems [
10]. The RHC system uses the surrounding surfaces of the conditioning area as a heating or cooling source (depending on the application type), and heat exchange occurs by radiant and convective heat transfer mechanisms. In an RHC system, radiant heat transfer forms more than 50% of the total heat transfer between occupants and surfaces [
11]. Six main parameters affect thermal comfort: metabolic rate, clothing insulation, air temperature, mean radiant temperature (MRT), air velocity, and relative humidity. The MRT is defined as “
the temperature of a uniform, the black enclosure that exchanges the same amount of thermal radiation with the occupant as the actual enclosure” [
9]. It is a single value representing the entire body and can be considered the average temperature of the surrounding surfaces weighted by their view factors concerning the occupant.
RHC systems can also be defined as hydronic radiant systems and/or water-based surface-embedded heating and cooling systems as they are usually operated by water [
12]. RHC systems bring a significant advantage due to their compatibility with renewable energy sources, in particular with solar power. This compatibility results from the alignment of water temperatures provided by solar energy systems with the optimal range for radiant heating systems. Solar thermal collectors produce moderate water temperatures (38 °C to 60 °C) that efficiently integrate with radiant systems, promoting energy efficiency and sustainable heating practices [
13]. Stetiu [
14] showed that an office with a radiant cooling system had 30% less energy consumption and 27% less peak power demand than traditional all-air conditioning systems in the United States. Le Dreau [
15] investigated an office room with four different cooling solutions that were active: chilled beam, radiant floor, radiant wall, and radiant ceiling. It was observed that the radiant floor system was the most efficient way in terms of cooling needs thanks to its bigger view factor between a sitting person and the floor, while the second most efficient solution was the radiant ceiling system that managed to provide the most uniform comfort conditions in the area. One of the critical points was the thickness of insulation for optimized energy performance when the effectiveness of RHC systems is considered. Chen and Li [
16] worked on the energy, emission, and economic feasibilities of air-source heat pump-integrated underfloor heating/cooling systems in the summer and winter seasons. Compared to the current system, the radiant system consumed 12.3% less primary energy, emitted 36.9% more carbon dioxide, and saved operating expenses by 26.0%. Cvetkovic and Bojic [
17] performed an experimental study in a residential house in Serbia fitted with an RHC system. It was shown that the thickness of thermal insulation should be higher for the locations where the radiant panels were located. When the RHC system was considered in itself, the thermal insulation required for walls was thicker than needed for the radiant floor.
Among all six thermal comfort parameters, the MRT is one of the most challenging parameters to obtain since it does not depend only on the air temperature but also the temperature of surrounding surfaces that radiate heat towards the occupants. Measuring and calculating the MRT require specialized equipment and precise environmental data, which make it more complex compared to other thermal comfort parameters such as air temperature, relative humidity, air velocity, clothing insulation, and metabolic rate. Therefore, several measurement and calculation methods were developed with different equipment to solve this problem. Black globe thermometers, two-sphere radiometers, and constant-air-temperature sensors are commonly used to measure the MRT. Amongst others, the black globe thermometer is the most popular device in indoor environments due to its low cost, compactness, and ease of calculation [
18]. It is simply a thin-walled copper sphere painted black with a sensor placed at the center of the sphere [
19]. The standard globe has a 150 mm diameter and 0.4 mm thickness of copper. For a reliable measurement, the first globe thermometer needs to reach thermal equilibrium. Reading from the internal thermometer depends on convective and radiant heat transfer mechanisms. One of the severe disadvantages of the globe thermometer is the long-time requirement to reach its equilibrium before reading. To overcome this challenge, various diameters for the globe have been studied. Studies showed that the globe reaches thermal equilibrium quickly for smaller diameters, but this gained time costs its accuracy and causes a higher error incidence than the standard diameter [
20,
21,
22]. Kang et al. [
23] assessed the uncertainty of MRT estimates by grouping surfaces with similar temperature behavior. Using a measurement data-based simulation model and the Monte Carlo method, the study inferred that excluding similar surfaces had no significant effect on MRT uncertainty. When an adequate number of input surfaces were used, the difference between MRT and measurements of all surfaces was less than 1%. The study conducted by Tamrakar et al. [
24] aimed to evaluate the impact of variations in outdoor temperatures and wall thermal transmittance on the inside thermal environment. The researchers also examined whether the resultant conditions satisfied ergonomic guidelines for the ideal ratio of mean radiant temperature to outdoor temperature. The study found that MRT responses differed across five outdoor temperature scenarios and three types of exterior walls. Seated occupants had consistent MRT, while standing occupants had minor differences when near a window in all scenarios. However, when occupants were not equally positioned near the window, seated occupants experienced larger MRT variations compared to standing occupants.
In the context of large venues such as concert halls and stadiums, attaining uniform heat distribution presents unique challenges compared to smaller indoor spaces. While evaluating thermal conditions in such environments, it is essential to account for the distribution of the MRT. Lee et al. [
25] chose a stadium as a case study and made a comparison between the black globe temperature and infrared thermal imaging camera (IR camera) with calculated view factors. Results showed that there might be prominent differences in surface temperatures; thus, using an IR camera was proposed in such environments. Tan et al. [
26] investigated radiant temperatures with a 40 mm diameter grey globe thermometer in a tropical urban environment. It was seen that greeneries and trees had a reduction effect on the MRT during daytime while there was not a significant difference in the absence of sunlight. A similar study focused on urban environments was carried out by Park et al. [
27]. They investigated how pedestrian MRT varied with tree spacing using a new multilayer MRT model. Large trees were found to be more effective in reducing MRT and could be planted at wider intervals, while small trees showed an exponential MRT reduction as the spacing decreased. Guo et al. [
28] carried out a lab-scale experimental study and observed the change of air and mean radiant temperature at 1.3 m height over 48 h. It was deduced that the variation of mean radiant temperatures was up to 8 °C while air temperatures changed about 2 °C during the experiments. The influence of room geometry on mean radiant temperature was studied by Kalmar [
29] in rooms with the same width and height but different lengths. The study discovered that mean radiant temperature varies parabolically with room height and length, suggesting an optimal height for the minimal MRT. Occupant position in the room affected the values. Surface heating systems yielded lower MRT values, and thermal refurbishment led to decreased mean radiant temperature. Walikewitz et al. [
30] investigated the relation between the air and mean radiant temperatures for four different office rooms in a building located in Berlin/Germany. It was inferred that the difference between the two temperatures was not significant in most cases; however, the room with windows which faced southeast and southwest had the maximum deviation between air and radiant temperatures due to the existence of solar radiation. Hwang et al. [
31] investigated the impact of solar radiation on indoor thermal comfort in subtropical climates by conducting field measurements in six test cells with varying types of glass. The study found considerable increases in MRT near windows, reaching up to 50.8 °C for single-pane glass, while indoor temperatures remained stable between 25 °C and 27 °C regardless of glazing type. Another study assessed the effects of solar radiation on the indoor environment and thermal discomfort [
32]. The study showed that thermal discomfort and mean radiant temperature increased when the distance from the window decreased in a south-facing room. A comparative study was carried out by Özbey and Turhan [
33], which focused on a case study of an office building in a university. Different calculation methods were used to obtain mean radiant temperature compared with results from the black globe thermometer, and the study discovered that the methods based on angle factors and the radiant plane temperatures had similar trends. Also, mean radiant temperatures by these methods overestimated above 20 °C and underestimated below 20 °C due to sharp temperature changes in window temperatures on cloudy days.
There are a variety of measurement and calculation methods for determining MRT in indoor environments. Following the above-mentioned studies, this study aims to propose a calculation method for MRT distribution in a live space. Hereby, to counteract the drawbacks of the globe-based measurements, the method can be used as a reliable way of MRT calculation. To this end, an actively used office space is selected, and then the space is equipped with ground source heat pump (GSHP)-integrated hydronic radiant wall and ceiling panels for heating purposes. By using wall and ceiling panels at the same time, we can also consider the angle factors and compare with the global thermometer measurements. Based on the validation of the calculated and measured mean radiant temperatures, the predicted mean vote (PMV) and predicted percentage dissatisfied (PPD) deviations caused by the calculated mean radiant temperatures are compared with the experimental PMV and PPD. Two main original contributions can be counted for the present work. The first contribution is developing an easier method of monitoring the thermal conditions of the office space to determine the optimal position of the air temperature sensor in radiant systems controlled by PMV. The second is experimentally determining the thermal comfort conditions by implementing radiant systems to the walls and ceilings of a real-sized and actively used office room combined with the ground heat exchanger (GHE) system placed in the ground under the building foundation, which was experimentally validated before [
34,
35]. Consequently, it can be stated that studies related to energy-saving and sustainable building systems integrated with renewable energy systems are important for researchers and practitioners, especially when considering the approaches of nearly zero-energy buildings and decarbonization gains.
3. Mathematical Model and Experimental Verification
According to the definition of MRT, it should be calculated in relation to the human body surface area and the environment temperature in every orientation, but due to the complex shape of the human body, such a calculation is extremely difficult to perform [
39,
40,
41]. To overcome this challenge, the human body could be reduced to a spherical point located in a room for a more user-friendly calculation, and also, the best approximation to the globe thermometer can be provided. Therefore, in the present study, the view factor is calculated using Equation (2) [
42]:
where a and b represent the width and length of the surfaces, respectively, and c represents the distance between the surface and the measurement point. To apply this equation optimally to the test room, each wall in all directions (northwest, southeast, northeast, southwest, floor, and ceiling) was divided into smaller surfaces and a total of 27 surfaces were created, as shown in
Figure 6.
It can be said that the determination of MRT, which significantly affects the user’s sensation, is more challenging on thermal comfort than the other parameters. The measurement methods used to determine the MRT are as follows: black globe thermometer, two-sphere radiometer, constant-air-temperature sensor, and a method based on the measurement of the effective radiative flow. The central component of the black sphere thermometer is a black sphere that serves as the measuring device. The external surface of the sphere is designed to absorb radiation coming from the room’s walls, which allows for accurate temperature readings. The MRT measurement, when performed using a black sphere thermometer, is expressed as follows [
9]:
where h
cg is the convection coefficient between the surrounding air and surfaces of the globe thermometer. T
g and T
a are the surface temperature of the globe thermometer and ambient air temperature, respectively. V
a, D, and ε
g denote the air velocity, diameter, and emissivity of the globe thermometer, respectively.
The two-sphere radiometer is a device that uses two spheres with varying emissivity values. There is a difference in the amount of heat that is supplied to the two spheres due to the fact that the emittance of the black sphere is greater than that of the polished sphere, which results in the measurement of radiation. The MRT is formulated as follows:
where P
p and P
b represent the power supplied to the polished and black spheres, respectively. ε
b and ε
p are the emissivities of the black and polished spheres. T
s is the surface temperature of spheres. When using the constant air temperature sensor as the measurement method, the MRT is defined as follows:
where P
s, T
s, and ε
s are the power supplied to the sensor, surface temperature, and emissivity of the sensor, respectively. Another method is the one based on the measurement of the effective radiative flux. Here, the MRT is calculated as follows:
where E
eff represents the effective radiative flow, which is a measure of the net radiant heat exchange between the person or object and its surroundings. T
b is the background temperature.
The MRT is estimated using several calculation methods, each of which takes into consideration different factors and variables. These techniques provide important insights into the radiant heat exchange between the human body or an object and its surrounding surfaces. The first of these methods considers the temperatures of the various surrounding surfaces and the corresponding view factors, which represent the rate of radiation emitted by each surface toward the person or object of interest. The MRT is determined by calculating the weighted sum of temperatures raised to the fourth power based on the view factors. This equation is expressed as follows:
In the second method, assuming that the radiant heat exchange is proportional to the object surface area, the MRT is calculated by considering the surface areas and weighted average temperatures. The equation is given below:
The last method involves estimating temperatures in various planes and applying weighted coefficients to represent the importance of each direction in thermal radiation exposure. This allows for an approximation of the MRT for seated and standing positions. The corresponding MRT equations for the seated and standing person are presented below:
where T
pr denotes the plane radiant temperature. In this study, Equation (7) is specifically adopted for the accurate computation of the mean radiant temperature (MRT). This equation incorporates the temperatures of the surrounding surfaces as well as the view factors, resulting in enhanced precision during the MRT calculation process [
20]. Several assumptions were made in order to apply the mathematical model for the resolution of our physical problem:
- ○
Since the majority of construction materials in the test chamber have a high emissivity (ε > 0.9), it was assumed that all chamber surfaces were black.
- ○
Measurements were taken from one point on each glass surface on the hallway and the outdoor environment side. The temperature distribution was assumed to be uniform on the glass surfaces.
- ○
The floor surface temperature was assumed to be the average of temperature measurements obtained from the center of the floor and near the window.
- ○
In the developed model, MRT calculations were performed in the sitting position of the occupant (at a height of 1.1 m from the floor) in parallel to the ASHRAE standard [
9].
Recognizing the importance of surface temperature measurements in MRT calculations, a total of 23 T-type thermocouples were used on both heated and non-heated interior surfaces of the test room. For the surface temperatures within the test room, five thermocouples were placed on each radiant panel of the heated southeast wall and the heated northwest wall, and three thermocouples were used on the heated ceiling radiant panels for measurements. Additionally, surface temperatures of all non-heated surfaces in the test room (wall surfaces, corridor glass surface, external window surface, ceiling, and floor surfaces) were measured using 10 T-type thermocouples. The view factors for the five reference points in
Figure 5 were calculated in a three-dimensional coordinate system using Equation (2), and then implemented in the MATLAB environment. The computed view factors are provided in
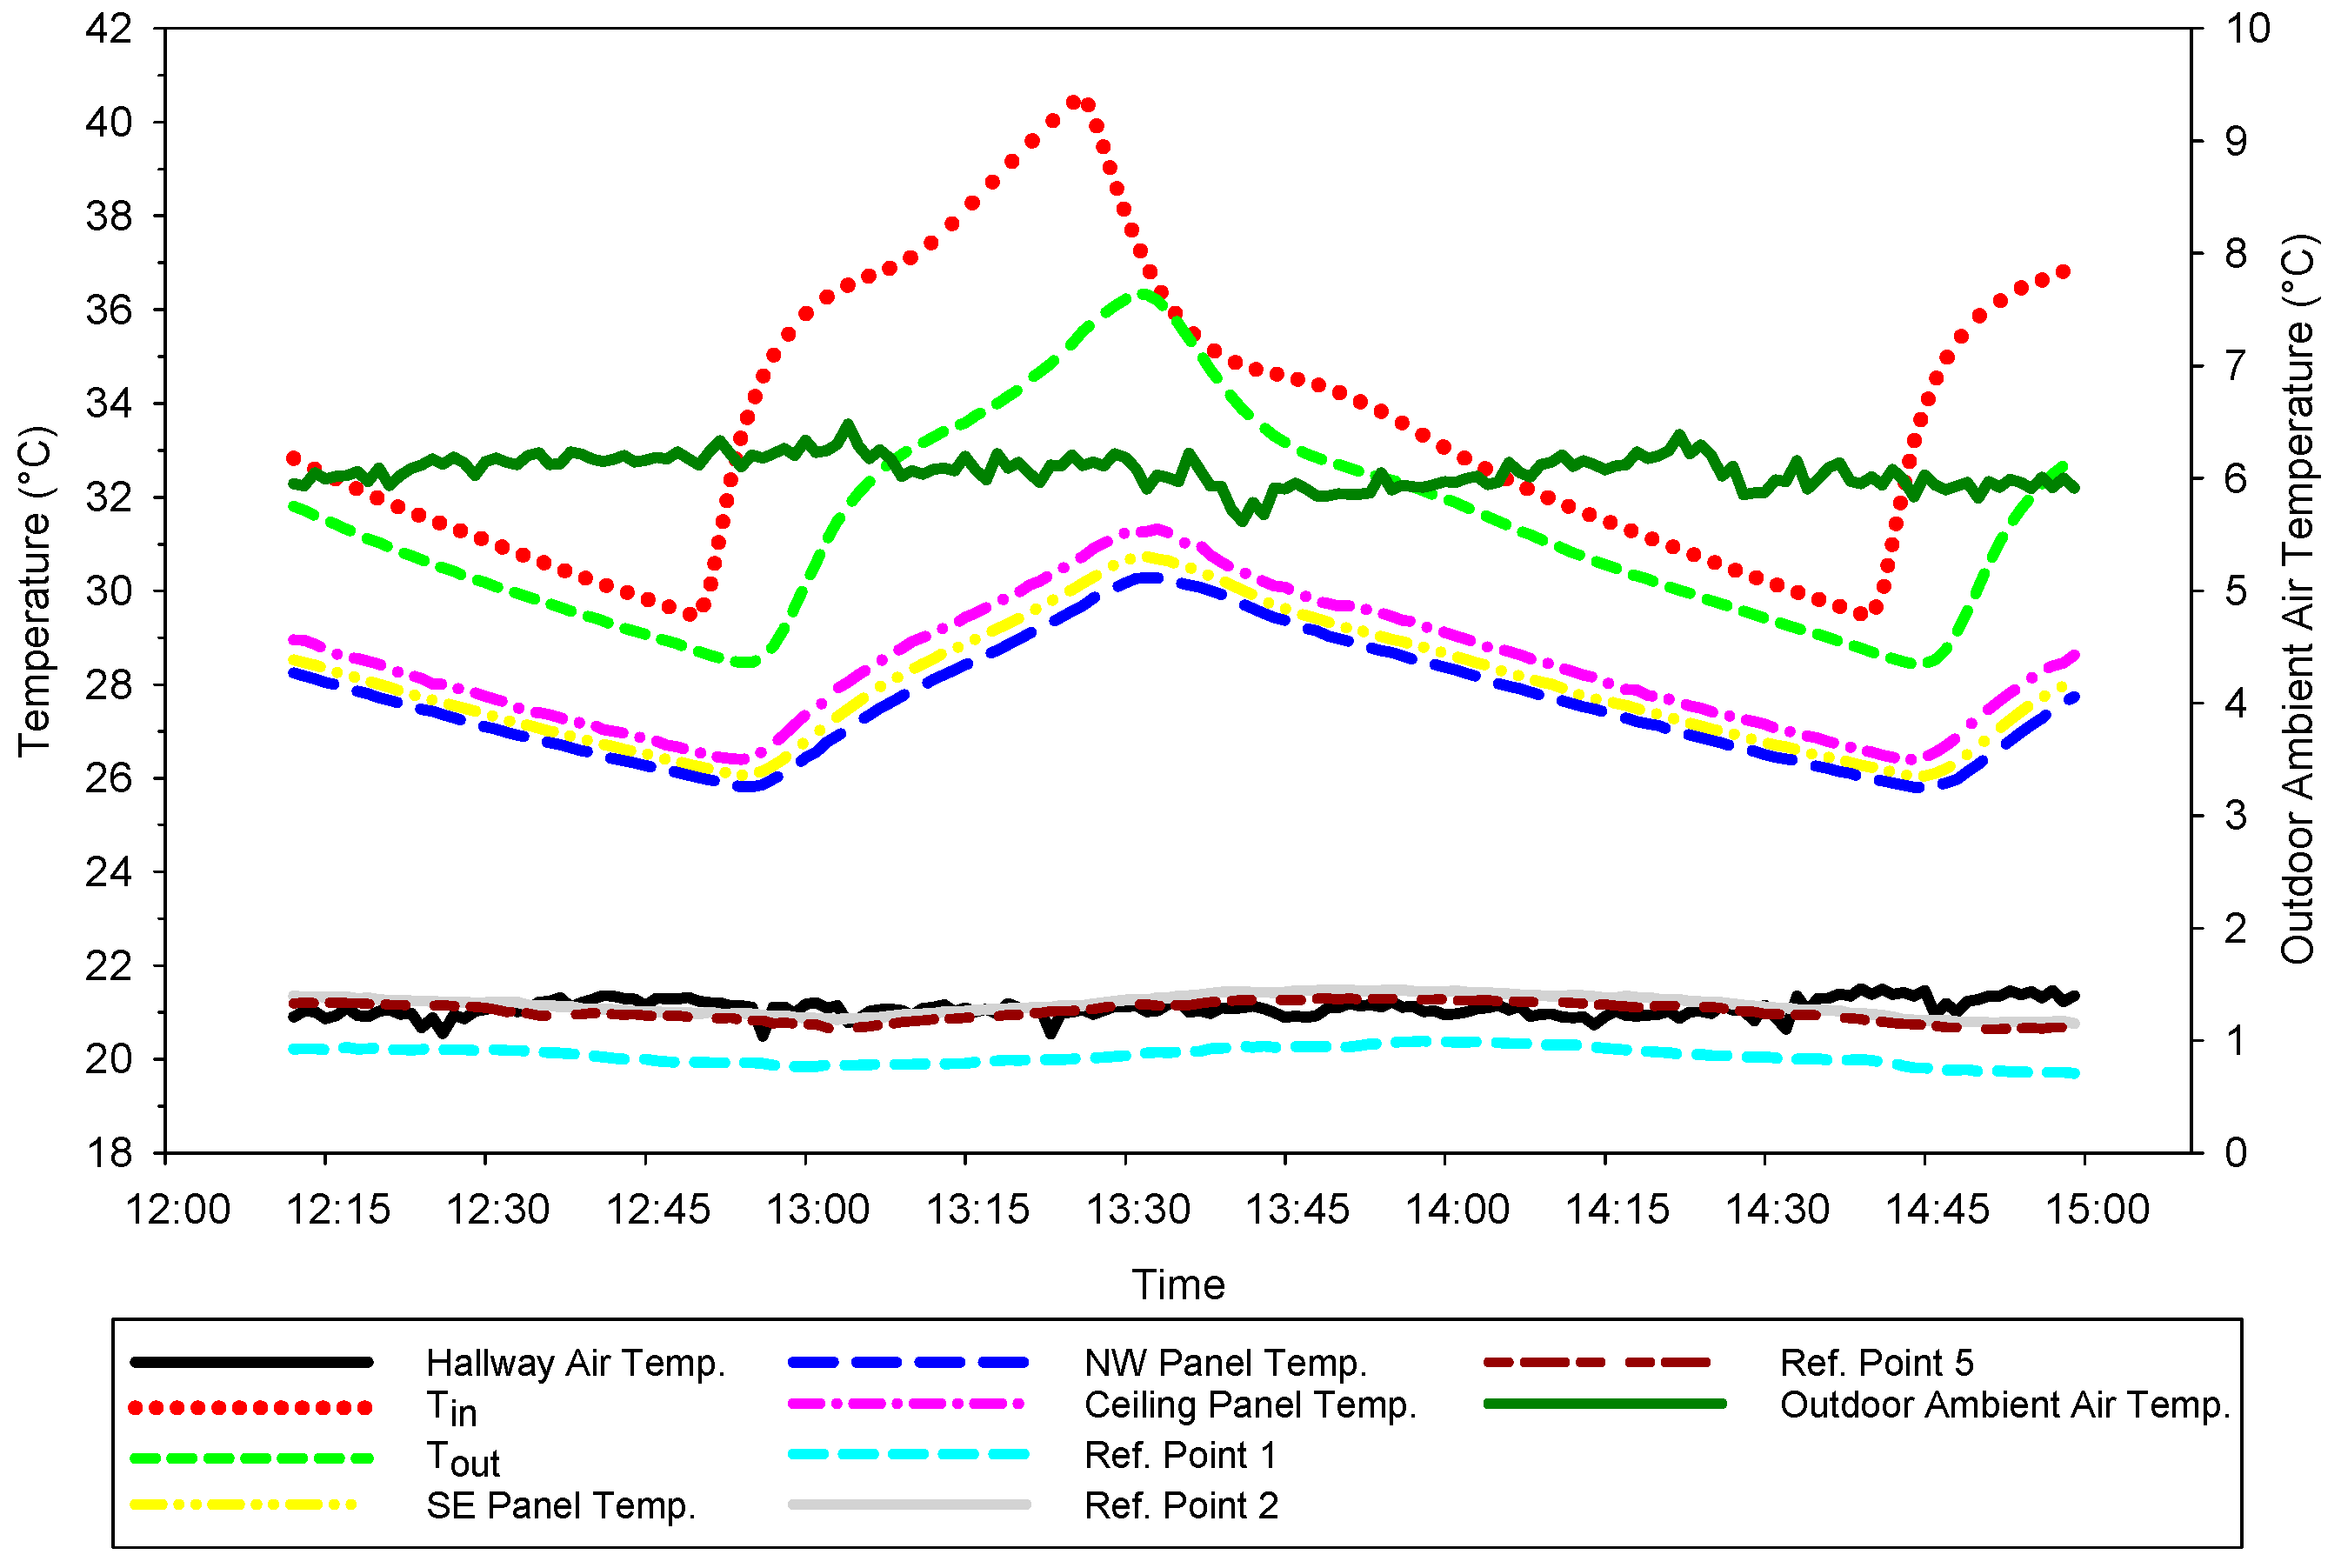
Table 4. The outdoor ambient temperature varied between 5.6 °C and 6.5 °C with an average value of 6.1 °C, so the outside air temperature was almost stable during the experiments. Furthermore, the average, highest, and lowest temperatures measured by thermocouples for the SE, NW, and ceiling radiant panels are provided in
Table 5.
The comparison of the radiant temperature calculated at different points of the test room with the radiant temperature measured using the globe sensor is represented in
Figure 7. The variations of the measured and calculated radiant temperature for Ref. Point 1 over time are depicted in
Figure 7a. The measured MRT with a globe thermometer changed from 21 °C to 21.3 °C, while the calculated MRT changed from 21.8 °C to 22.4 °C, and the average difference between the calculated and measured MRT was 1 °C. The reason for the significant temperature difference at this point can be attributed to the large size of the window surface, the absence of a homogeneous temperature distribution, and the fact that measurements were taken from a single point. Taking temperature measurements from different points on the window surface and using the average value of these temperatures in MRT calculations was considered to yield more consistent results in comparison to the measured MRT value.
The analysis of mean radiant temperature (MRT) measurements at Ref. Points 1 to 5 resulted in the computation of percentage average deviations between the measured and calculated values. The obtained deviations were found to be 4.7%, 2%, 3.6%, 0.6%, and 1.2%, respectively, for each reference point. These computed values serve as indicators of the discrepancies between the experimental measurements and the calculated MRT values, shedding light on the accuracy and reliability of the applied calculation method in relation to the actual measurements at the specified reference points.
As shown in
Figure 7b, the average difference of measured and calculated MRT at Ref. Point 2 was found to be 0.4 °C.
Figure 7c,d, representing Ref. Point 3 and Ref. Point 4, show the measured and calculated MRT values at a distance of 0.7 m from the southeast and northwest walls. As these walls contained six and nine radiant heating panels, it was reasonable to expect that the air and MRT would be higher than the other three reference points. The average of 168 air temperatures of these two points were 21.8 °C and 21.6 °C, while the average MRT temperatures were 24 °C and 23.6 °C, respectively. The difference between calculated and measured MRT at Ref. Point 4 was relatively smaller. The reason behind this was the unconditioned elevator shaft and fire escape behind the northeast wall.
Figure 7e shows the calculated and measured MRT values at Ref. Point 5 which was 1 m inside from the hallway side of the test room. The temperature differences between the calculated and measured MRT values on the hallway side (Ref. Point 5) were found to be quite low, similar to the values observed at Ref. Point 4. The independent conditioning of the hallway area of the building, resulting in a homogeneous temperature distribution on the hallway glass, contributed to the calculated MRT value closely matching the measured MRT value. The average difference between the calculated and measured MRT at Ref. Point 5 was found to be 0.4 °C.
4. Results and Discussion
In this section, the radiant temperature distribution in the XZ, YZ, and XY sections of the entire room was determined based on the reliability verification of the temperatures of the surrounding surfaces and view factors method. Moreover, the deviations of the calculated MRT in the comfort indices of the PMV and PPD were compared to the measured PMV and PPD.
Figure 7 illustrates the variations in mean radiant temperature along the northwest-southeast and northeast-southwest, at a height of 1.1 m above the floor, precisely determined through the mean radiant temperature calculation method. To facilitate a comparison between the average radiant temperature and the indoor air temperature values,
Figure 8 also presents the average air temperature values measured at the height of 1.1 m above the ground in five different locations across the room, using thermocouples on stands. When analyzing the variation in the MRT along a linear path characterized by constant y and z coordinates of 3.75 m and 1.1 m, respectively, the x coordinates were observed to vary within the range of 0.3 m to 6.7 m. Thereby, a total number of 641 points were created, each of which was 0.01 m away from the next point in the x-direction, and then the view factors for all these points according to 27 surfaces was calculated. A total of 107,688 MRT data were created; then, the average MRT for all 641 points was obtained from the created data. As it moved from the NW wall to the SE wall, the MRT first decreased until the bottom value of 22.08 °C at x = 3.33 m. Then, it started to rise as it approached the SE wall and reached the highest value on this line at 23.9 °C. Comparing the MRT in areas close to the wall and in the center of the room with the air temperatures reveals, as expected, that the difference is greater in areas close to the wall. There is a 1.3 °C difference between the air temperature and the MRT, particularly owing to the southwest wall’s high surface temperature. The difference between the average radiant temperature and the atmospheric temperature was observed to be 0.7 °C in the room’s center, where radiant effects were partially diminished. Considering the scale of the room, there are no significant temperature differences between the areas near the radiant panels and the room’s center. The reason for this is that the room can be heated from the ceiling and walls simultaneously.
As shown in
Figure 8, the MRT values were determined from the corridor side of the room to the window side of the room. While the x and z coordinates remained constant at 3.5 m and 1.1 m, respectively, the y coordinate varied between 0.3 m and 7.2 m. As a result, a line was created with 691 points, each of which is 0.01 m away from the next point in the y-direction. As can be seen in
Figure 7b, MRT values decreased as it moved from the SW (corridor side) to the NE (window side). At y = 0.3 m, MRT = 22.59 °C; at y = 6.7 m, MRT = 22.21 °C; and its lowest value MRT = 22.06 °C where y = 5.08 m. When examining the differences between MRT and air temperature, particularly near the hallway and window area, notable differences are observed, especially near the window area. At the location of Stand 1 near the window, there is a noticeable 1.8 °C difference between the calculated MRT value and the air temperature. This discrepancy is believed to be attributed to the measurement of temperature data from a single point on the glass surface during MRT computation. It is hypothesized that obtaining surface temperature data from various points on the glass surface could potentially mitigate this discrepancy.
Similarly, on the hallway side, albeit less pronounced than near the window, a difference of 1.4 °C is observed between the air temperature and MRT. It is assumed that acquiring temperature data from multiple points on the glass surfaces may yield improved outcomes, particularly in rooms where radiant effects are more prominent. Thus, the collection of temperature data from multiple points on the glass surfaces is postulated to lead to enhanced results in systems characterized by significant radiant effects.
Before proceeding to PMV-PPD calculations, this approach can be expanded and the MRT distribution observed at any desired plane. As this approach of creating multiple points in an order progresses from a line to a plane, two of the three coordinates change while the third remains constant.
Figure 9,
Figure 10 and
Figure 11 show how the calculated radiant temperature varies at all points of the test room in detail.
Figure 9 illustrates the distribution of mean radiant temperature (MRT) on three XZ planes located at distinct y coordinates: y = 0.3 m, y = 3.75 m, and y = 7.2 m. Each of these planes comprised 641 points in the x-direction, ranging from x = 0.3 m to x = 6.7 m, with an increment of 0.01 m. Similarly, there were 221 points in the z-direction, ranging from z = 0.3 m to z = 2.5 m, with the same 0.01 m increment. Consequently, a total of 141,661 points existed within the XZ planes, with each point corresponding to 168 MRT measurements. The contour lines depicted in
Figure 8 represent the MRT averages calculated for the points observed in the time interval between 12:12 and 14:59. The maximum MRT values found in the planes were 27.7 °C, 27.4 °C, and 27.4 °C, corresponding to the y coordinates of 0.3 m, 3.75 m, and 7.2 m, respectively. Conversely, the minimum temperatures observed were 21.6 °C, 21.1 °C, and 21.2 °C for the same y coordinates. The mean MRT values for the three planes (y = 0.3 m, y = 3.75 m, and y = 7.2 m) were 23.8 °C, 23.4 °C, and 23.6 °C, respectively. As predicted, areas proximate to the ceiling panels exhibited a notable prevalence of higher temperature distribution. It is evident that the temperature differentials exhibited a slight decrease when transitioning from the hallway area (y = 0.3 m) towards the window side (y = 7.2 m). Despite the high surface temperatures of the wall panels, it was observed that the MRT values did not exceed the reference temperature values recommended by ISO 7730 [
8] and ASHREA 55 [
43] standards, even near the panels.
Figure 10 illustrates how MRT changed on the YZ plane as well as the effects of plane positions in the x-direction on MRT. This plane had the same number of points in the z-direction as the XZ plane and 691 points in the y-direction between x = 0.3 m and y = 6.7 m, for a total of 152,711 points. Average MRT values were 24.47 °C, 23.03 °C, and 26.69 °C, with an x of 0.3 m, 3.5 m, and 6.7 m, respectively. When the average MRT values of the three planes were examined, it was found that there was approximately 1.5 °C difference in MRT with radiant wall panel sides compared to the middle of the test room. Based on these results and presuming that the tested room was utilized as a conference room, it can be speculated that the temperature difference perceived by occupants in the room’s center versus those near the room’s walls remains acceptable. As observed in
Figure 10, the MRT distribution shows that the sections close to the NW wall have temperature distributions that are lower than those close to the SE wall. That disparity can be attributed to the presence of an actively heated office room situated behind the southeast wall, while an unheated elevator shaft is situated behind the northwest wall. The MRT distribution on XY planes at different heights is shown in
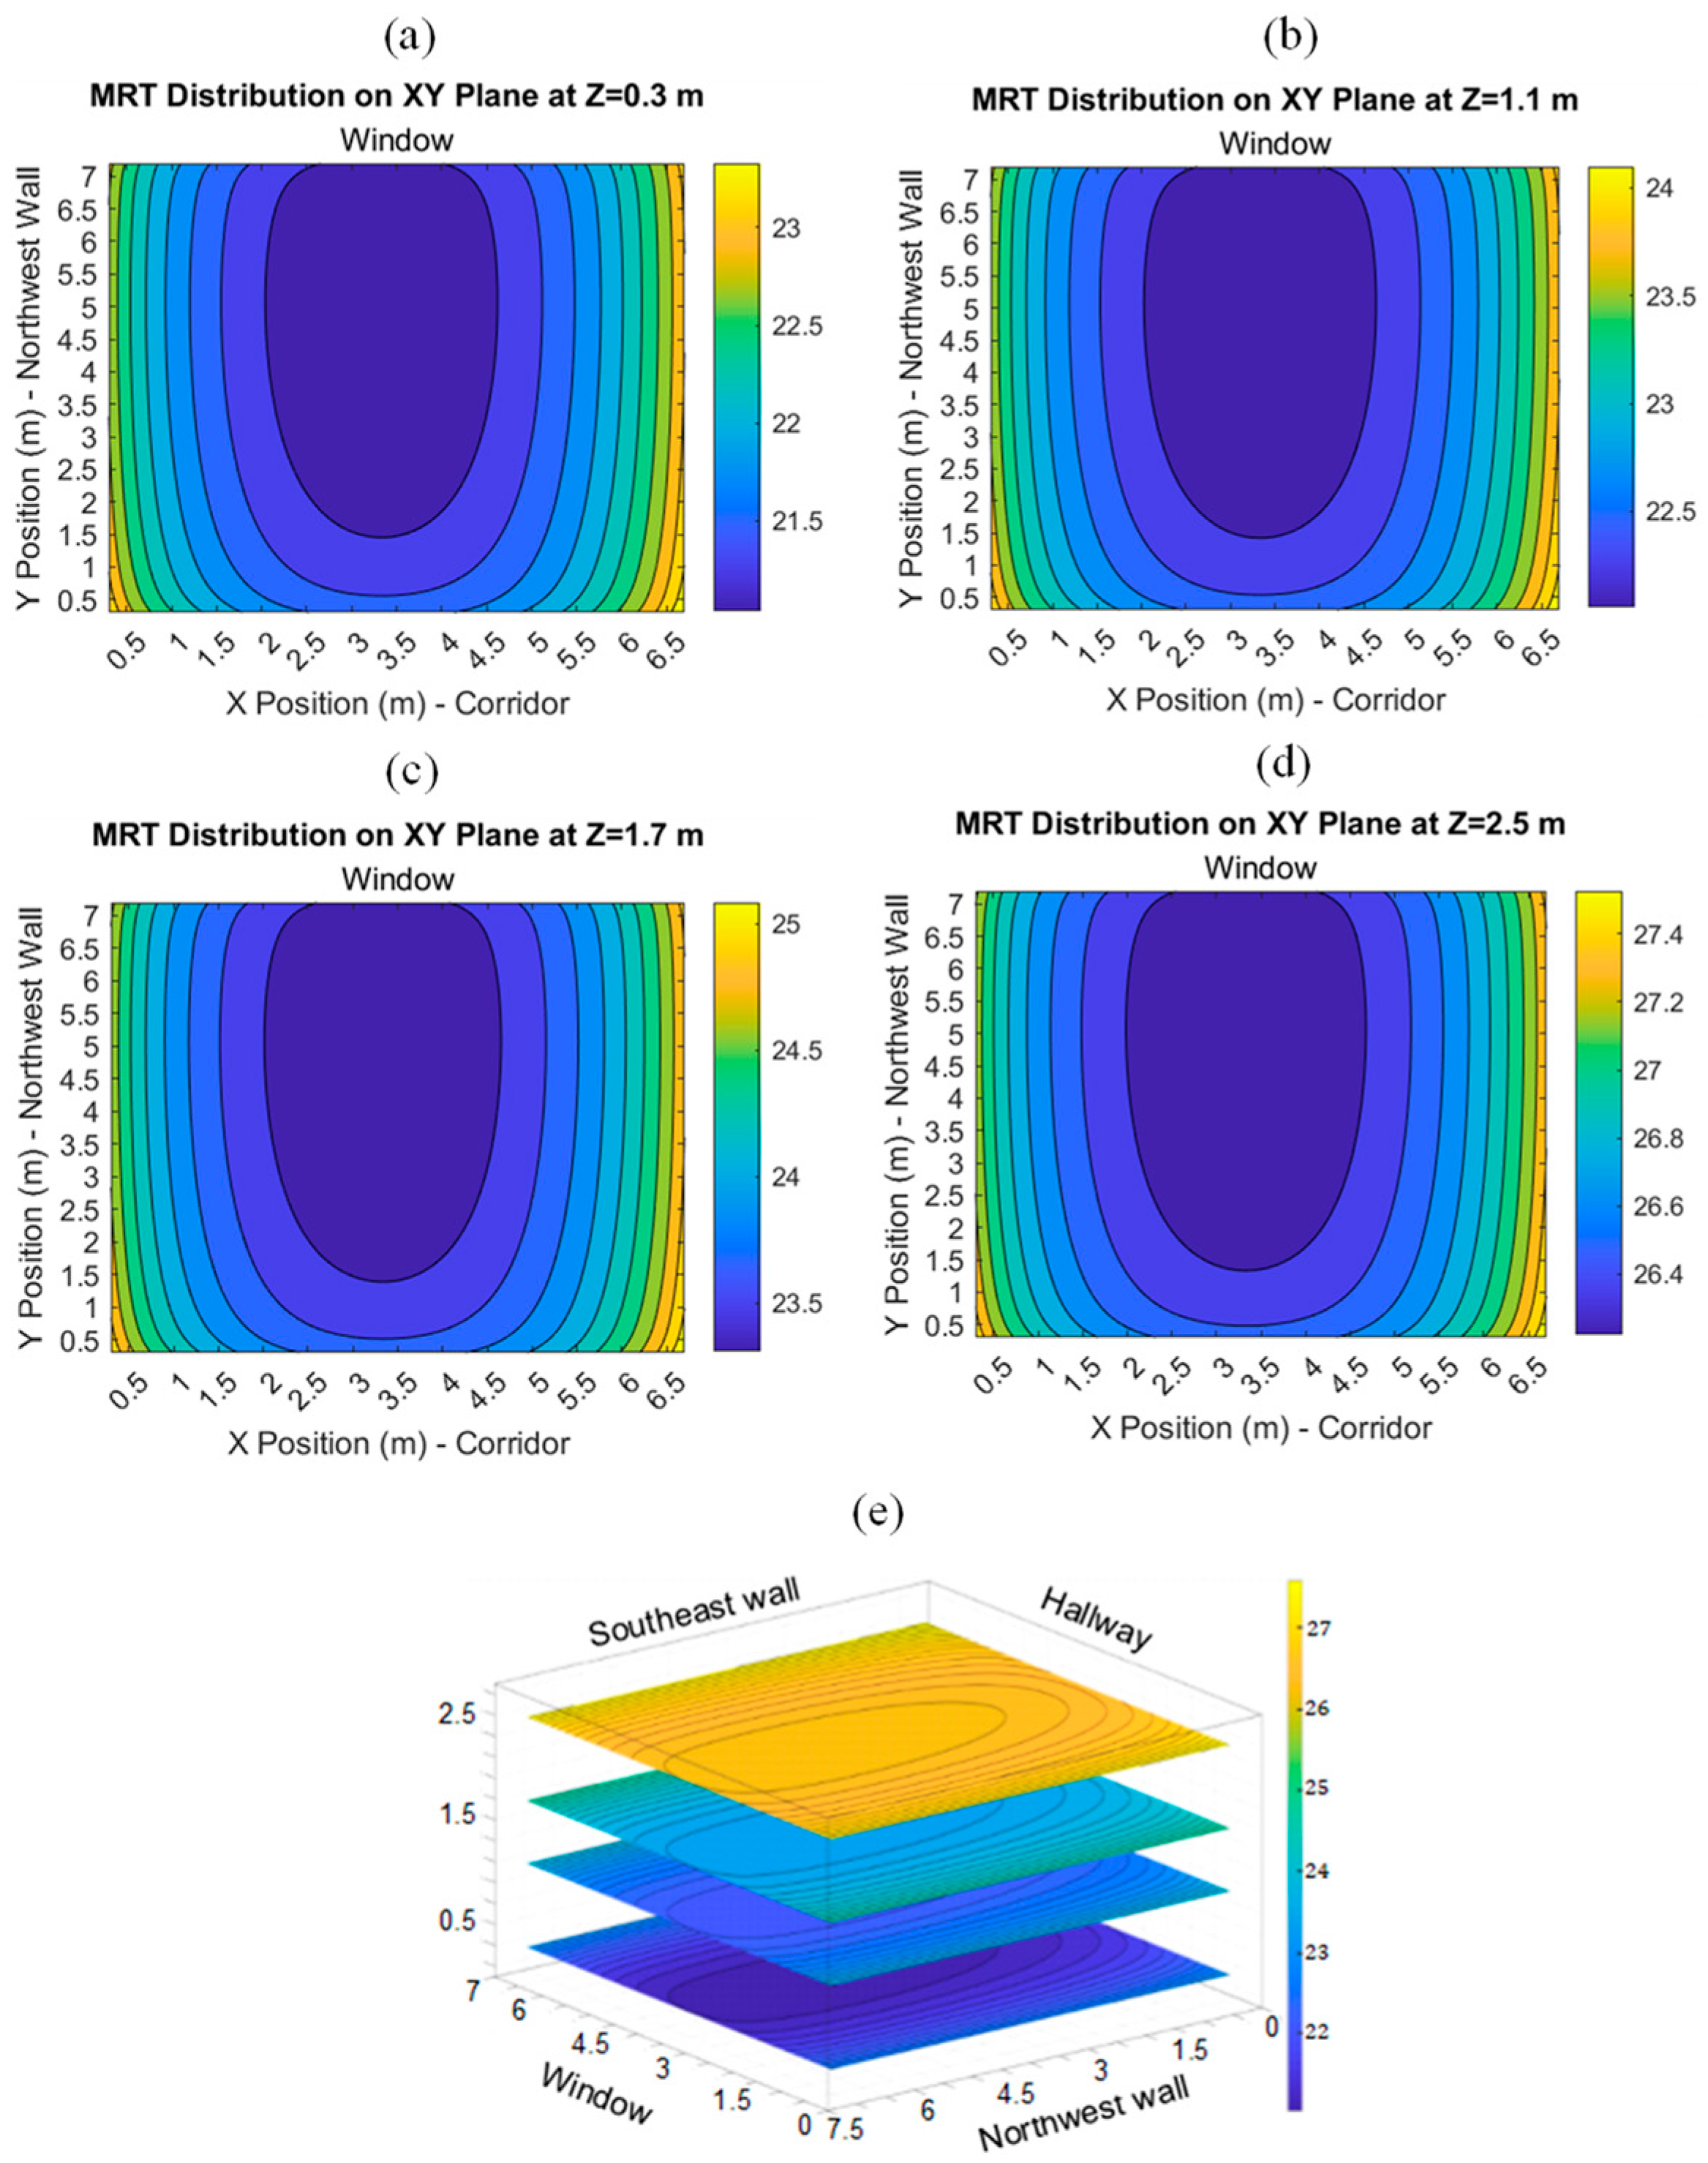
Figure 11. There were 442,408 points in one contour where x was between 0.3 m and 6.7 m, and y was between 0.3 m and 7.2 m. While creating these contours, 74,412,408 MRT data points were calculated for each contour. The lowest MRT values calculated at 0.3 m, 1.1 m, 1.7 m, and 2.5 m heights from the test room’s floor were 21.04 °C, 22.06 °C, 23.31 °C, and 26.22 °C, while the maximum MRT values were 21.04 °C, 22.06 °C, 23.31 °C, and 26.22 °C. The highest temperatures were found in the test room’s SW and SE corners, while the lowest temperatures were found in the room’s center near the window area.
The average MRT values at 0.3 m, 1.1 m, 1.7 m, and 2.5 m heights were 21.7 °C, 22.6 °C, 23.8 °C, and 26.6 °C, respectively. The average temperature difference between the height of 0.3 m and the head level of a standing individual at 1.7 m was calculated at 2.1 °C, thereby meeting the comfort criteria outlined in the ISO 7730 Standard A [
8]. As expected, the MRT distribution increased as it moved from the floor to the ceiling panels. As mentioned before, the temperature distribution near the SE wall was slightly higher than the NE wall. The reason behind this trend was that the elevator shaft was behind the NE wall, and there was a heated office behind the SE wall.
PMV and PPD were two indices employed for the assessment and prediction of thermal comfort. Both ASHRAE [
43] and ISO [
8] standards provide equations for calculating the PMV and PPD. In the present study, ISO 7730’s Equations (11)–(15) were utilized for this purpose. To compute the PMV, a MATLAB function was developed, incorporating various input parameters including metabolic rate, mechanical power, clothing surface area factor, air temperature, mean radiant temperature, air velocity, relative humidity, heat transfer coefficient, and clothing surface temperature.
Equations (12) and (13) were solved by iteration and pa was calculated using relative humidity. M and Icl refer to the metabolic rate and clothing insulation. ISO standardizes these parameters and offers tables for different situations. An office in a building was taken as the test room in this study, hence the M value was defined as sedentary activity and taken as 1.2 met. When it came to choosing the Icl parameter, since tests were taking place in February 2022, work clothing that fitted this category was chosen and an Icl of 1.00 clo (for underwear with short sleeves and legs, shirt, trousers, jacket, socks, and shoes) was determined. The effective mechanical power, W, was assumed to be 0 in this study.
The PMV and PPD values were measured every 20 min at five different locations in the test room.
Figure 12 shows the changes in heated and unheated surface temperatures, air temperatures, outdoor ambient temperatures, and hallway temperatures in the test room during the experiments. The corridor and outdoor ambient temperatures, which were the important parameters that would affect thermal comfort, almost never changed during the experiments. That was practically very useful when comparing measurements taken at various points throughout the room.
Several parameters including air temperature, air velocity, relative humidity, mean radiant temperature, metabolic rate, and clothing insulation were required according to the PMV and PPD equations. The metabolic rate and clothing insulation were predefined from the ISO standard tables; air temperature, relative humidity and air velocity were measured with a comfort device, and the MRT was measured with both a comfort device and Equation (7). The calculated MRTs were compared with globe thermometer measurements and approved in previous sections. Therefore, using the calculated MRT did not result in unacceptable deviations in the results.
When the dimensions of the testing room (7 × 7.5 × 2.8 m) were taken into the account, it might be somewhat challenging to ensure the level of thermal comfort was consistent throughout the entire space. Particularly during the heating seasons, localized disruptions may arise due to lower temperatures on cold wall and glass surfaces. To prevent this, wall and ceiling radiant heating systems have been included in many studies where they can be an alternative to conventional heating systems. Considering the size of the room, it was deemed necessary to measure the PMV and PPD values at various points using a thermal comfort device to ascertain the thermal comfort values in different regions of the test room. The MRT is a crucial factor affecting the radiant heat exchange between the human body and the environment, exerting a preponderant influence on thermal comfort indices like PMV and PPD [
44].
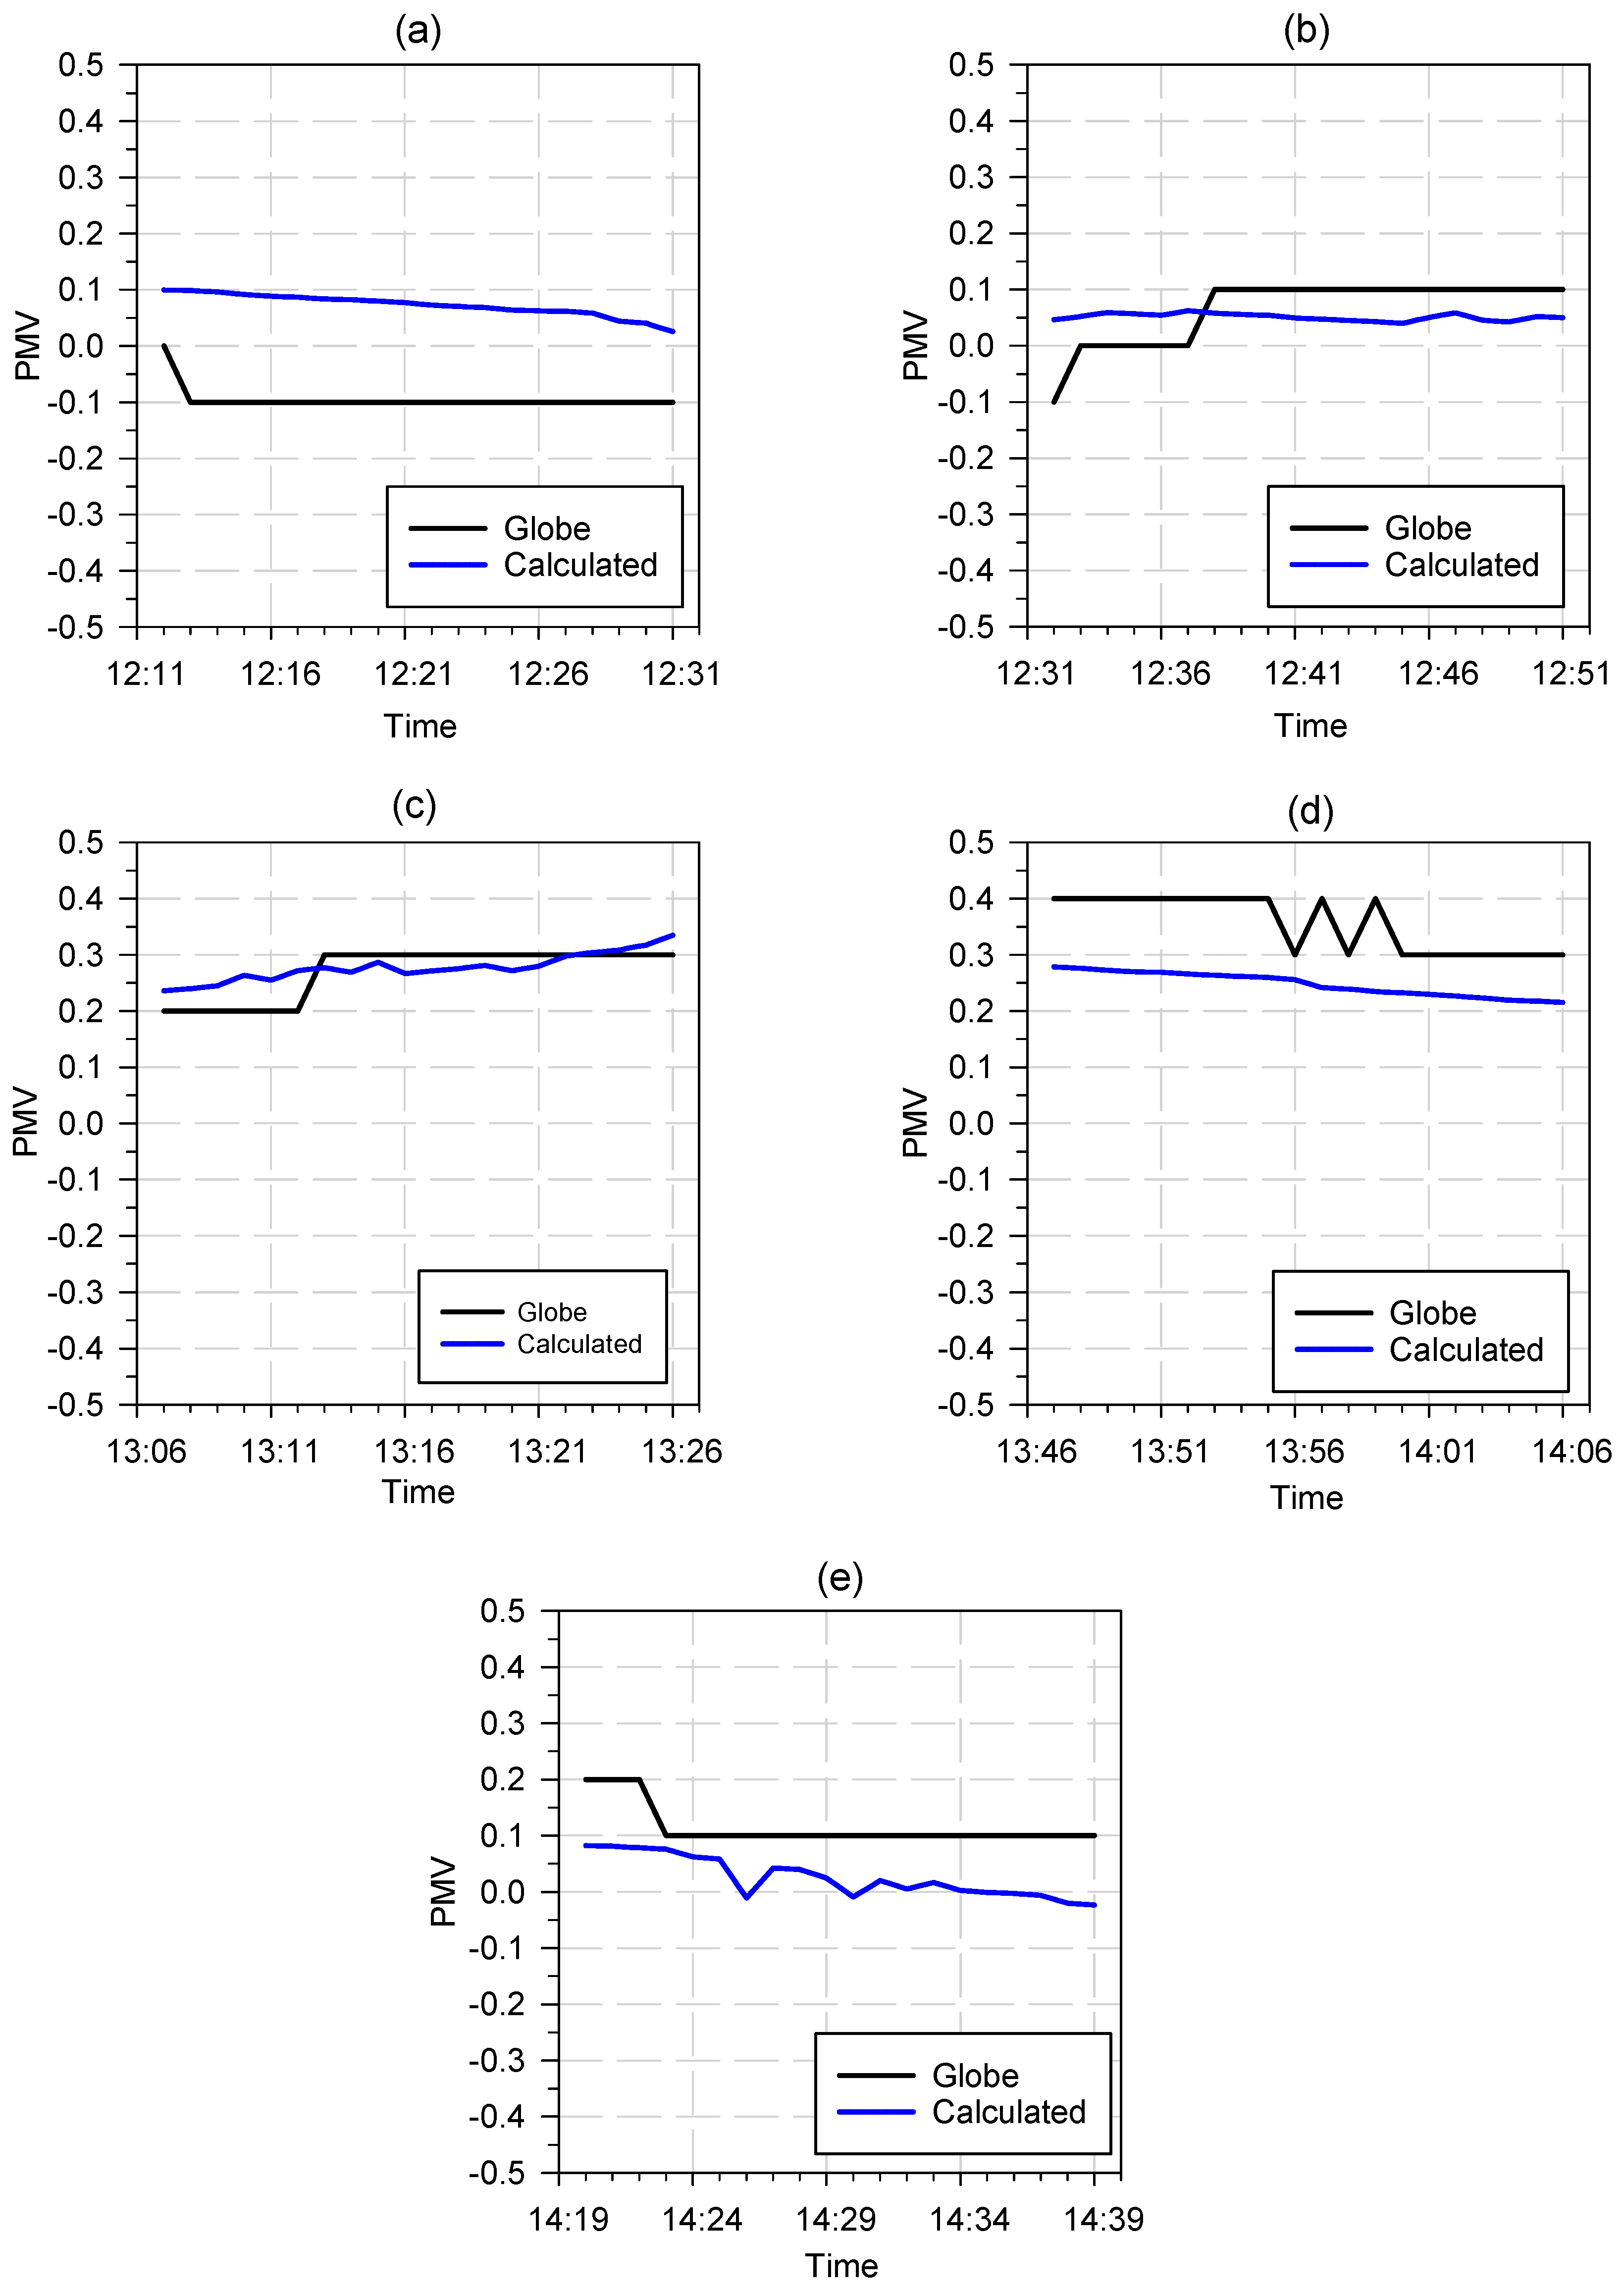
Figure 12 shows how the PMV and PPD values would change according to the measurement values, if the MRT value was calculated using Equation (7). The measured and calculated (via ISO 7730 Standard) trends of the PMV and PPD values are presented in
Table 6.
Table 7 shows the average parameters during the measurements at five points (see
Figure 7) in the test room. During the measurement of comfort at various locations within the test room, it was observed that the air velocity values remained extremely low, predominantly as a result of the occurrence of natural convection, and the average relative humidity was measured to be around 40%.
Figure 13a and
Figure 14a show the calculated and measured PMV and PPD values at Ref. Point 1 which was near the window.
The mean value average of the calculated and measured PMV are close to each other with 0.073 and −0.095, respectively. Similarly, the average calculated and measured PPD values were almost the same with 5.12% and 5.19%. It was observed that the temperature data taken from a single point on the glass surface resulted in a high error in the MRT calculation method based on the view factor, and, therefore, there was a significant difference between the measured and calculated PMV and PPD values, especially near the glass area (Ref. Point 1). To obtain more accurate results of the comfort indices in buildings with such a high glass ratio, it was necessary to take measurements from various sections of the glass surfaces, particularly during the heating seasons.
Figure 13b and
Figure 14b represent Ref. Point 2 that was in the middle of test room. While the calculated PMV and PPD values showed a more consistent pattern with an average of 0.051 PMV and 5.06%, the measured PMV and PPD values increased slightly at 12:37.
Figure 13c and
Figure 14c and
Figure 13d and
Figure 14d show a comparison of the measured and calculated PMV and PPD comfort values near the wall where the radiant panels were located. The existence of radiant panels on both walls caused the experimental and calculated PPD and PPV values to be high. The PMV and PPD values near both walls varied from 0.2 to 0.4 and from 5.8% to 7.2%, respectively, not meeting the ISO 7730 comfort standards in the A, B, and C category. The measured and calculated PMV and PPD values on the corridor side (
Figure 13e and
Figure 14e) were found to be quite well validated and meeting all ISO 7730 comfort standards.
The thermal comfort of living spaces with radiant systems can be controlled using many methods such as air temperature, operating temperature, model predictive control, and PMV. Although the air temperature-based thermostat control is an affordable and established way that has been used in many applications, some of previous efforts [
45,
46,
47,
48,
49,
50] also emphasized that this approach might be insufficient to provide the desired comfort conditions in radiant heating and cooling systems.
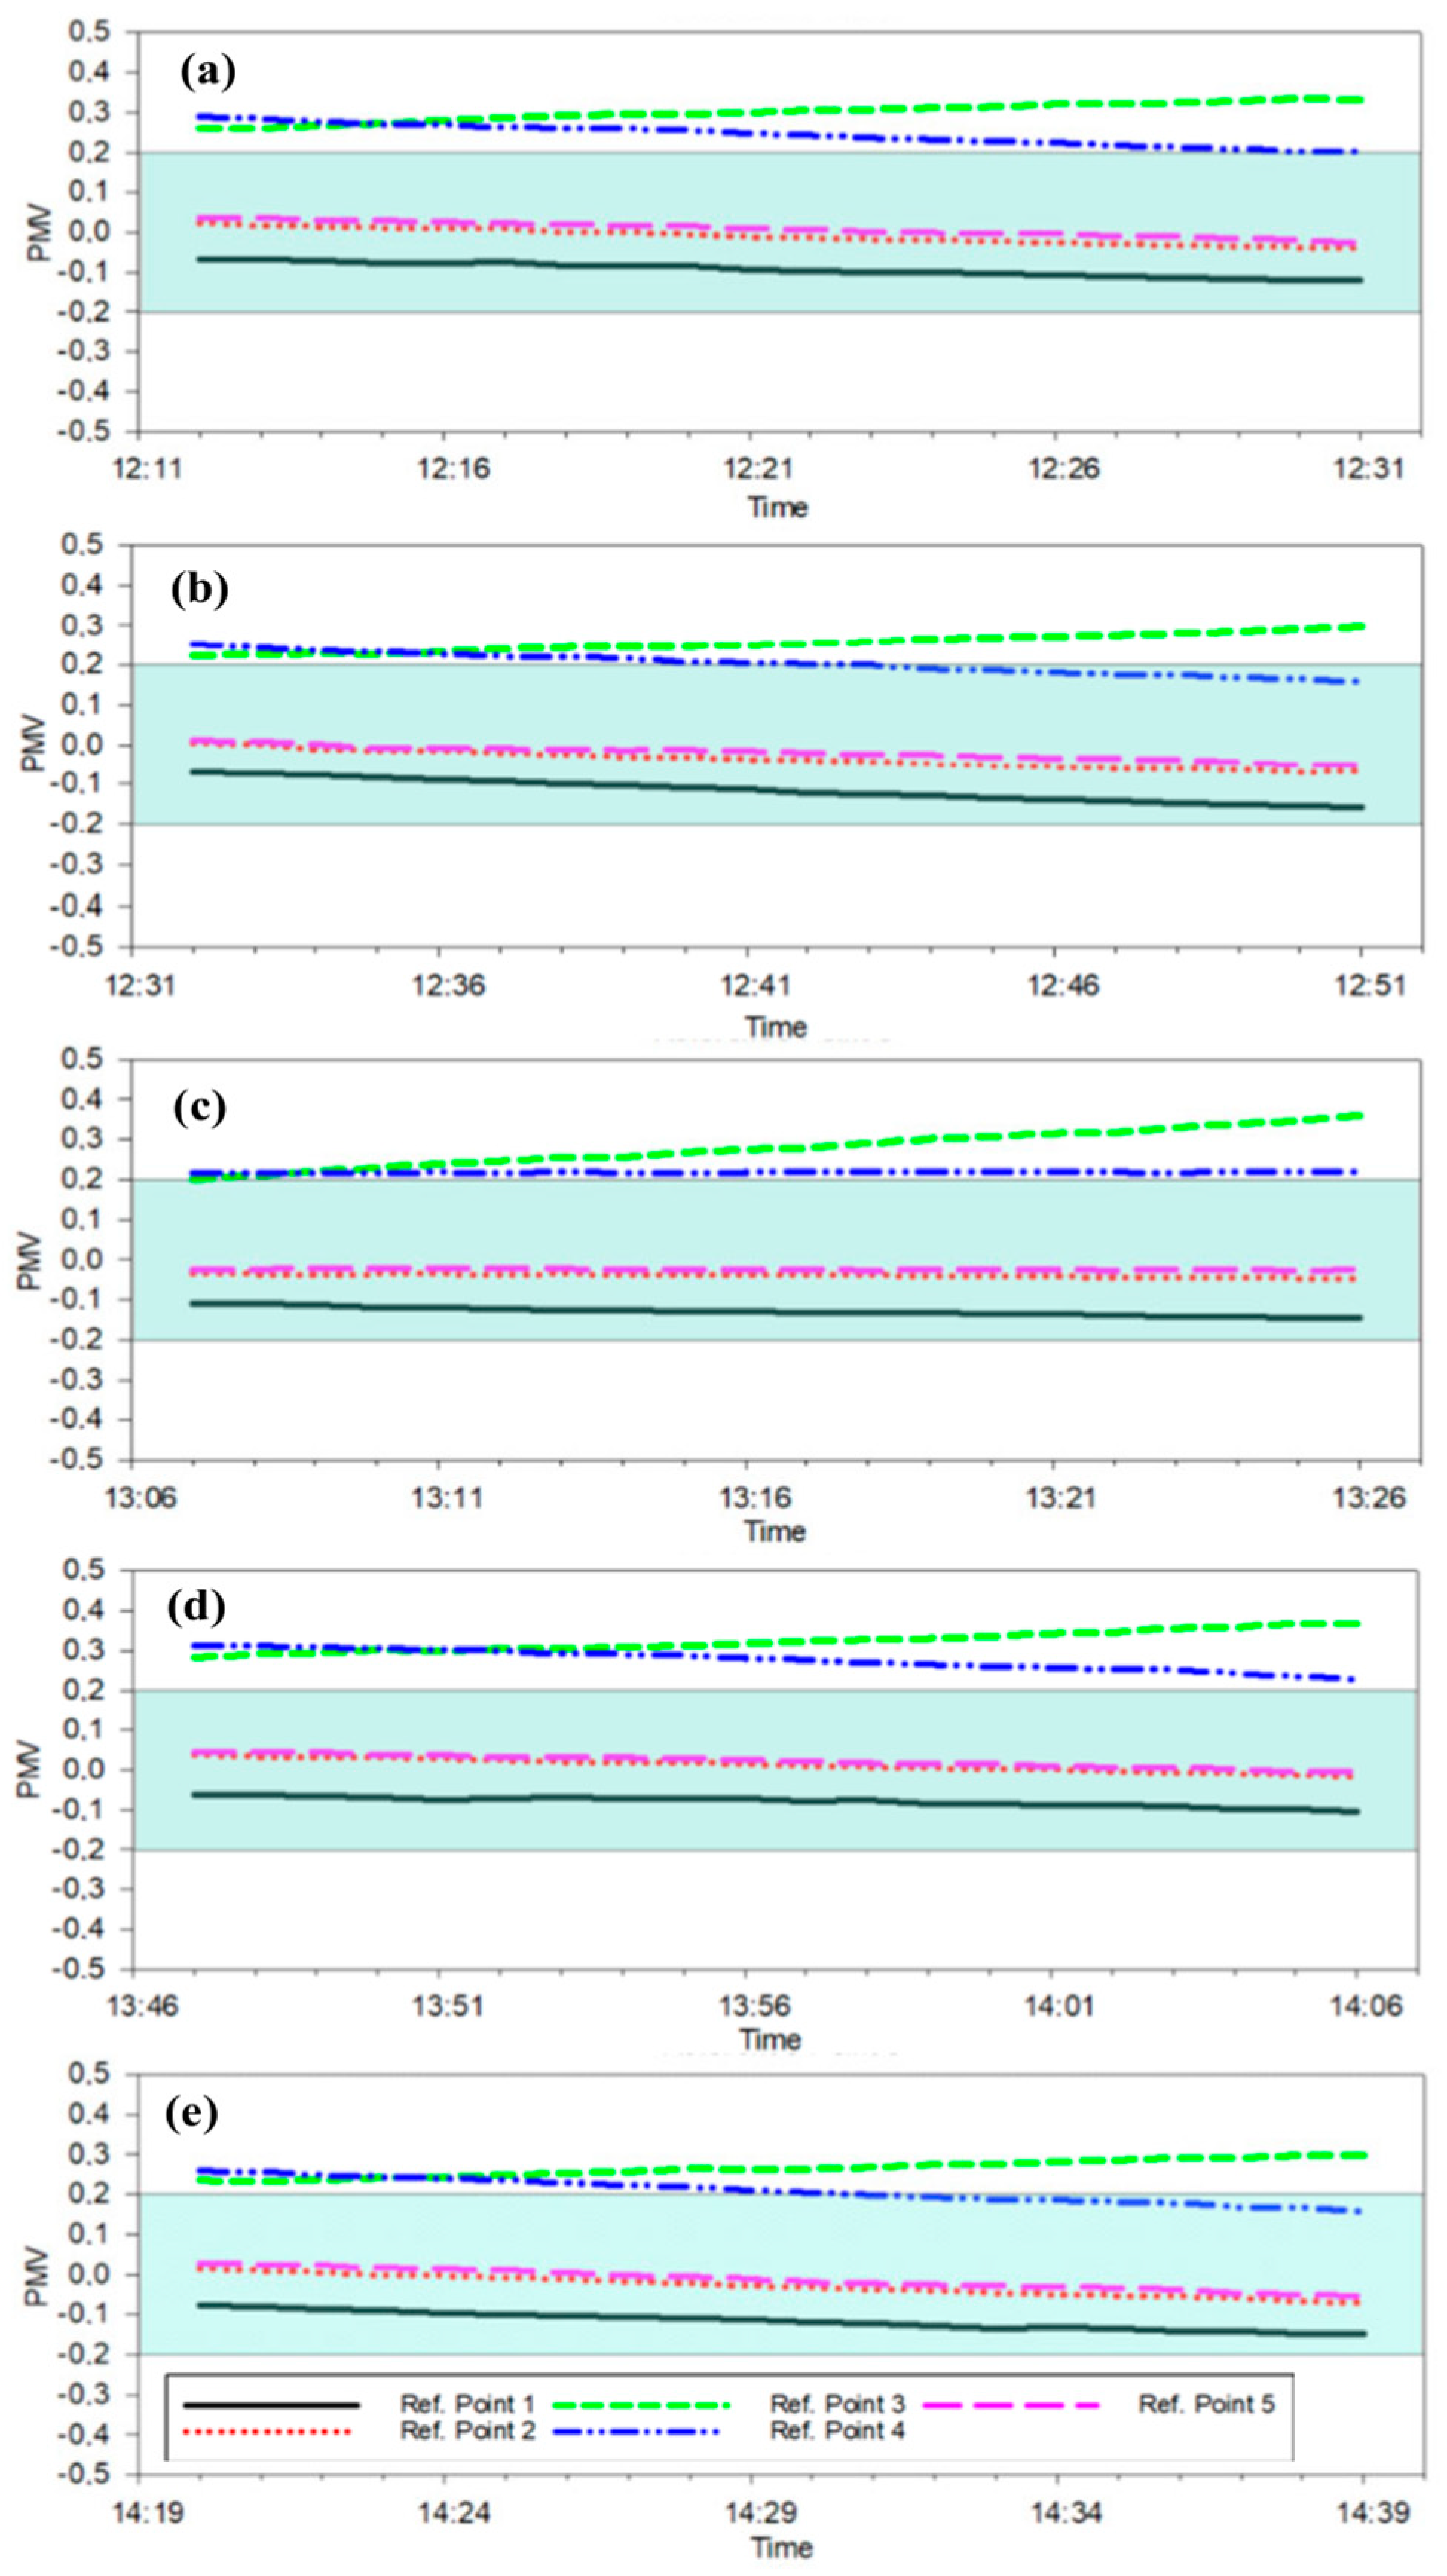
Figure 14 shows how the PMV comfort parameter varied in different areas of the room by measuring air and surface temperatures of the experimental room solely using T-type thermocouples. Since the test room was conditioned with radiant heating, the humidity value and air velocity were taken as 50% and 0.05 m/s, respectively, in the PMV calculation.
In
Figure 15a, when the air temperature parameter was taken from the thermocouple at point 3 or 4, the ISO 7730 category A comfort conditions could not be met. In other words, when the thermostat was set to point 3 or 4, the person sitting in point 1 would feel slightly warmer. The comfort conditions for an individual working at points 2 and 4 (
Figure 15b,e) were similar regardless of where the thermostat was located. It was observed that when the thermostat was set to point 3, two of the individuals would feel uncomfortable according to the category A of the ISO 7730 Standard, while it was partially uncomfortable when set to point 4, and comfortable when set to points 1 and 2. A person sitting at points 3 and 4 (
Figure 15c,d) naturally would feel warmer and more uncomfortable than other areas. Similarly, if the thermostat was placed in points 3 and 4, it could not meet the category A of the ISO 7730 Standard.
When all subfigures in
Figure 15 were evaluated, regardless of where an individual would sit in the room, category A could not be achieved when the thermostat is placed at point 3 or 4, whereas categories B and C of the relevant standard (ISO 7730) are achieved. Comfort conditions could be achieved at all points if the air temperature values were taken from points 1, 2, and 5.
Figure 15 can work with the help of a made-up scenario as well. For instance, Ref. Point 2 could be designated as a thermostat positioned on a meeting table situated in the central region of the office space, whereas Ref. Point 5 might represent an individual seated on a sofa. Moreover, points 1, 3, and 4 could symbolize individuals engaged in office work while seated at their respective desks. By employing this approach and utilizing data acquired from all the figures, a comprehensive assessment can be formulated.


