
Moisture Diffusion Coefficient of Concrete under Different Conditions
by
Fengbin Zhou
1, 
Wenhao Li
1,
Ying Hu
1,
Lepeng Huang
1,*,
Zhuolin Xie
1,
Jun Yang
2,
Daifeng Wu
2 and
Zhonghao Chen
3 1
School of Civil Engineering, Chongqing University, Chongqing 400045, China
2
Chongqing Urban Investment Infrastructure Construction Co., Ltd., Chongqing 400045, China
3
Department of Civil Engineering, Xi’an Jiaotong-Liverpool University, Suzhou 215123, China
*
Author to whom correspondence should be addressed.
Buildings 2023, 13(10), 2421; https://0-doi-org.brum.beds.ac.uk/10.3390/buildings13102421
Submission received: 22 August 2023
/
Revised: 19 September 2023
/
Accepted: 21 September 2023
/
Published: 22 September 2023
(This article belongs to the Special Issue Research on the Crack Control of Concrete)
Abstract
:Humidity change in concrete is the leading cause of concrete shrinkage. Moreover, the moisture diffusion coefficient of concrete is an essential parameter for assessing and predicting the internal moisture content of concrete. However, there is a lack of theoretical construction and experimental studies on the effect of different conditions, especially different constraints, on the moisture diffusion coefficient of concrete. Therefore, the internal humidity, pore structure parameters, and basic mechanical properties of concrete under different strength grades C30, C40, C50, and C60 (C stands for concrete and numbers indicate the strength class of the concrete), curing environments (dry and sealed curing conditions), and constraints were tested in this study. In addition, a calculation model of concrete’s internal humidity and humidity diffusion coefficient was established. The research findings show that the internal humidity of concrete decreased with age due to hydration and drying. External humidity had a significant effect on the moisture change of concrete, and the lower the external humidity, the larger the humidity diffusion coefficient and the faster the internal humidity of concrete decreases. Reinforcement (confinement) changes the pore structure parameters of the concrete, which in turn affects the transport of moisture within the concrete. The higher the reinforcement rate, the larger the pore structure parameters of the concrete, the larger the humidity diffusion coefficient, and the faster the concrete humidity decreases. The method proposed in the study can accurately predict the internal humidity of concrete using the humidity diffusion coefficient. The research results are a reference for preventing concrete shrinkage and cracking in construction.
1. Introduction
Concrete has become the most widely utilized construction material worldwide due to its advantages, namely ease of access to materials, ease of molding, durability, low energy consumption, and ease of compositing with other materials. The inspection results of the US National Cooperative Highway Research Program indicate that in 1995, approximately 100,000 concrete bridge deck slabs exhibited penetrating cracks at 1–3 m intervals within one month after the concrete was poured [1]. In China, the problem of concrete cracking is crucial. Survey results indicate that for transportation facilities, ranging from bridges and pavements to seaport engineering structures along the coast and from civil and commercial buildings to industrial buildings, concrete cracking is exceedingly prevalent, and this research problem has attracted extensive attention from the engineering community in recent years [2,3,4]. China’s concrete structures have been exposed to numerous problems associated with cracking during construction and operation, and the service life of many concrete structures is much lower than their design life, with cracks appearing within 3–5 years in some scenarios, and in other scenarios, the cracks exceeded the permissible crack widths even before the concrete structures were formally utilized, causing immense economic losses [5,6].
The shrinkage deformation of concrete Is one of the main characteristics of early-age concrete, and the low water-to-cement ratio, high compactness, high fluidity, and large amount of mineral admixtures exhibited by modern concrete may further increase the early deformation of concrete [7,8,9,10]. Due to the continuous improvements in the mechanical properties of concrete materials and structural design methods, cracks caused by direct loading rarely occur in concrete structures under normal usage [11,12,13]. The mainstream structural design method is largely based on the strength criterion for the design of structures, and concrete is regarded as a uniform, stable material with fixed strength. Therefore, its early instability and deformation characteristics are not considered in the design; consequently, the indirect effects (i.e., shrinkage, temperature, and deformation) considerably influence concrete cracking.
According to capillary pore stress theory, concrete shrinkage is mainly attributable to the capillary pore stress produced on the pore wall after the internal water is consumed [14]. Due to cement hydration and humidity diffusion, the internal humidity of concrete gradually decreases. Once the relative humidity begins to decrease, capillary pore tension is triggered, and the scale of the capillary pore tension then controls the macroscopic shrinkage deformation of the concrete; thus, the internal humidity change rule of concrete is necessary for analyzing concrete shrinkage deformation [15,16]. In an experimental study on the internal humidity of concrete, Persson [17] measured the changes in the humidity of concrete specimens exposed to air, immersion curing, and sealed conditions and established a simulation formula based on the water–cement ratio, cement hydration, or age. Kim et al. [18] used the sealed dry specimens to measure the humidity diffusion of concrete with different water–cement ratios and the internal humidity changes caused by cement hydration. The results indicated that the humidity decrease in concrete with a high water–cement ratio was mainly due to humidity diffusion, and the humidity decrease caused by cement hydration in concrete with a low water–cement ratio was more significant. Nillsson et al. [19] tested and measured the change rule associated with the relative humidity of concrete in seawater and natural environments. Andrade et al. [20] tested concrete exposed to outdoor temperature and humidity conditions. Parrot [21] and Nillsso et al. [19] experimentally measured the relative humidity in concrete specimens exposed to the natural environment or seawater.
The moisture diffusion coefficient is commonly utilized by researchers to predict the variation pattern of moisture inside concrete [22,23]. Most researchers have utilized a linear diffusion equation to predict moisture diffusion [24,25,26], which considers the moisture diffusion coefficient as a constant, and the obtained results exhibit some deviation from the experimental tests [27]. The rate of pore water migration in concrete is dependent on the pore structure characteristics and the cement paste distribution. Moreover, it is also closely related to the water in the pore space [28,29,30]; therefore, the moisture diffusion in concrete is highly nonlinear. Experimental studies have confirmed that the moisture diffusion coefficient is a function of the water–cement ratio and the maturity of the concrete and that linear equations are not applicable to the solution of the moisture transport problem of concrete [31]. Ayano [32] utilized the slice weighing method to obtain the water content of specimens at different ages and positions and assumed that the diffusion coefficient was an exponential equation related to the loss of water dispersion; thus, the researcher solved the nonlinear diffusion equation by combining the residual method and the nonlinear least squares method. Sakata and Kuramoto [33] and Akita et al. [34] calculated the diffusion coefficient by performing the Boltzmann transform on the diffusion equation, and the results were consistent with the experimental results obtained by Bazant and Najjar [31] using the slice method. In addition to the aforementioned studies, some scholars have recently utilized nonlinear diffusion equations to predict the moisture diffusion pattern of concrete [35,36,37]. However, the number of studies is overall insufficient for identifying a method with generalization to the vast majority of cases. Therefore, research on the theoretical solution of the concrete moisture field using a nonlinear method to validate the accuracy of the method under as many environmental conditions as possible is required.
Notably, the effect of confinement on moisture diffusion in concrete has been neglected by researchers. In engineering practice, concrete is always restrained by reinforcement. Studies have revealed that when lateral restraints are used to limit the expansion of concrete containing an expansive agent, the porosity, average pore diameter, and porosity content of concrete with lateral restraint can be reduced compared to those without lateral restraint [38,39]. Reinforcing steel inhibits the shrinkage effect of concrete and reduces the volume reduction due to shrinkage [40,41,42,43,44,45]. Therefore, a reasonable inference is that reinforcement changes the pore structure of concrete under shrinkage. However, at present, the exact effect is not clear. The pore structure of concrete is an important channel for moisture transport, and changes in the pore structure will likely lead to changes in the moisture transport pattern of concrete. Therefore, research on the effect of steel reinforcement on the pore structure of concrete and the moisture transport law is crucial.
Therefore, in this study, the internal humidity, pore structure, and basic mechanical properties of concrete with different strength grades (C30, C40, C50, and C60), curing environments (dry curing and sealing curing), and constraints were tested using a self-developed testing device, and the calculation model for the internal humidity of concrete and the moisture diffusion coefficient was established. The study revealed the changing rule of the humidity diffusion coefficient of concrete under different external environmental conditions and constraints and elucidated the effect of the internal pore structure of concrete on the moisture transport characteristics of concrete.
2. Theoretical Modeling
The method of calculating the moisture diffusion coefficient is derived in this study to analyze the moisture of concrete. Due to the rate of cement hydration and water diffusion in concrete being relatively slow, the relationship between internal humidity and water content in concrete can be approximated as linear [31,34,46,47]. Under test conditions, concrete undergoes humidity exchange in three dimensions (x, y, and z); thus, the humidity transport is three-dimensional. To simplify the calculation, the concrete is regarded as homogeneous and the humidity transport to be the same in the x, y, and z directions. Therefore, the moisture diffusion equation inside concrete due to drying action can be written as follows based on Fick’s second law:
where Hd denotes the humidity reduction due to the drying effect, t denotes the drying time, x denotes the distance of the interior of the concrete from the drying surface, and D denotes the concrete diffusion coefficient.
In the past, Equation (1) has been solved using the finite difference method, which simplifies the solution process; however, the interpretation of its calculation results is more complicated and should be facilitated by corresponding software programming. Therefore, this study attempts to solve Equation (1) using a Fourier transform.
Herein, only the outward diffusion of the concrete humidity is considered: the reverse of the humidity into the concrete is ignored. Therefore, in the humidity diffusion process, which follows the inside concrete–outside concrete direction, the concrete diffusion coefficient D must be greater than 0. Subsequently, let
where a denotes the parameter used for the calculation.
The Hd can be expressed as:
where u denotes the change in humidity inside the concrete due to moisture diffusion, and He denotes the ambient humidity of the concrete.
The concrete internal humidity is a function of space and time Hd (x,t); therefore, its boundary conditions can be expressed as follows:
where H0 denotes the initial humidity inside the coagulation.
Subsequently, the boundary condition of Equation (3) is expressed as follows:
Subsequently, the following equation is obtained:
where ut denotes the first-order partial derivative of the internal concrete humidity with respect to t and uxx denotes the second-order partial derivative of the internal concrete humidity with respect to x.
Notably, Equation (6) represents a semi-infinite boundary problem, and to solve it, it should be transformed into an infinite boundary problem, which can be expressed as follows:
where U denotes the change in humidity due to humidity diffusion considering infinite boundary conditions.
Subsequently, we obtain
where (x) denotes the change in humidity at each location at the initial moment due to humidity diffusion.
Consequently, the following equation is obtained:
Setting
where Ut denotes the first-order partial derivative of the internal moisture diffusion of concrete with respect to t under infinite boundary conditions, Uxx denotes the second-order partial derivative of the internal moisture diffusion of concrete with respect to x under infinite boundary conditions, X(x) denotes the change in humidity induced by the internal moisture diffusion of concrete on the x scale under infinite boundary conditions, and T(t) denotes the change in humidity induced by the internal moisture diffusion of concrete on the t scale under infinite boundary conditions.
Subsequently,
Namely,
Setting
where denotes the computational parameter.
Consequently,
From Equation (14), we obtain the following equation:
Order
Subsequently, the solution of Equation (14) is as follows:
At this point, α can assume any value, and Uα satisfies the superposition principle, namely
Therefore,
where denotes the change in humidity induced by the diffusion of humidity within the concrete on the α scale under infinite boundary conditions.
From the initial conditions, when t = 0,
From Fourier transforms, we obtain the following equations:
where denote the Fourier coefficients of the function .
Subsequently,
Further simplification yields the following expression:
The above Equation (24) includes the term “error function” which is a nonfundamental function in mathematics, namely
Subsequently, Equation (24) can be expressed as
Consequently, we obtain
From the assumptions of Equation (3), the following equation is obtained:
Considering the form of the error function, the error function does not exhibit an original function and cannot be solved by the classical Newton–Leibniz formula, but only an approximate calculation can be performed. Currently, commonly utilized computational methods include the complex trapezoidal product method [10,48] and the hyperbolic tangent function approximation method [49]. Herein, the results obtained from the hyperbolic tangent function approximation calculation method are utilized to approximate the error function; subsequently, Equation (28) can be expressed as follows:
Therefore, if the initial internal humidity, external ambient humidity, and the humidity diffusion coefficient of the concrete are obtained, the humidity distribution inside the concrete can be calculated using Equation (29).
Generally, the ambient humidity to which the concrete is subjected and the initial internal humidity are easily obtained. Therefore, to solve Equation (29), the value of the moisture diffusion coefficient D for concrete should be determined.
Synthesizing existing research results, the Boltzmann transform is applied herein to solve the diffusion coefficient inversely. When the concrete is dry on both sides except in the x-direction (no water loss on the bottom surface of the specimen), based on the linear relationship between internal humidity and moisture in concrete and Fick’s second law, the following expression is applicable:
Introducing the variable η
Let y = αx and z = βx; subsequently, Equation (30) can be expressed as follows:
Integrating Equation (32) between H and H0 yields the following equation:
From the test conditions, the dimensions of the specimen in the x, y, and z directions are 200 mm × 200 mm × 1000 mm; subsequently, we obtain α = 1 and β = 5.
Consequently, the moisture diffusion coefficient of concrete under test conditions can be expressed as follows:
Therefore, from the experimentally obtained Hd and the relationship between Hd and η, the humidity diffusion coefficient of the concrete can be calculated using Equation (34), as can the internal humidity of the concrete.
In previous studies, the variation in internal humidity with age under sealed and dry conditions was experimentally obtained for each concrete grade. Therefore, the moisture diffusion coefficient of concrete can be obtained by inverting Equation (34). The decrease in humidity in concrete is due to a combination of cement hydration and drying effects. Therefore, in calculating the moisture diffusion coefficient of concrete, the moisture drop due to concrete hydration should be deducted from the total moisture reduction.
Because the discrete humidity values obtained from the tests cannot be directly substituted into Equation (34) to invert the moisture diffusion coefficient of concrete, this study proposes a mathematical model for the relationship between Hd and η based on Akita’s research results [34]; by approximating the fitting of the test results, the humidity value is calculated as follows:
where a, b, c, and d denote the coefficients of the model. These coefficients can be obtained by fitting the test results.
To validate theoretical model, we conduct experiments in the next section.
3. Experimental Design
3.1. Concrete Mixing Ratio
Past studies have confirmed that the various aspects of the performance of concrete of different strengths differ significantly. Therefore, four commonly used concrete strengths (C30, C40, C50, and C60) were selected to study the variation in their internal humidity and humidity diffusion coefficient under different conditions. Cement, water, fly ash, sand, coarse aggregate, and water reducing agent were used to prepare the concrete used for the experiment and the amount of these materials required per cubic meter of the mixture was prepared, as shown in Table 1. The percentage content of SiO2, CaO, Al2O3, Fe2O3, MgO, and SO3 in cement and fly ash is shown in Table 2. The specific surface area of cement and fly ash were 3471 and 4680 cm2/g. The density was 3.10 and 2.22 g/cm3, respectively.
3.2. Basic Concrete Performance Tests
To understand the basic mechanical properties of the ordinary and high-strength concrete utilized herein, this study was conducted according to GB/T 50081-2002 [50]; thus, the cubic compressive strength, split tensile strength, and static compressive elastic modulus of the concrete were tested.
The basic mechanical properties of concrete specimens were tested after 3, 7, and 28 days of curing. The specimens used for the basic mechanical tests were subjected to the same curing conditions as those used for the moisture tests.
The test results of cubic compressive strength, split tensile strength, and static modulus of elasticity of the concrete samples with four mixing ratios at different ages are listed in Table 3.
3.3. Concrete Internal Humidity and Shrinkage
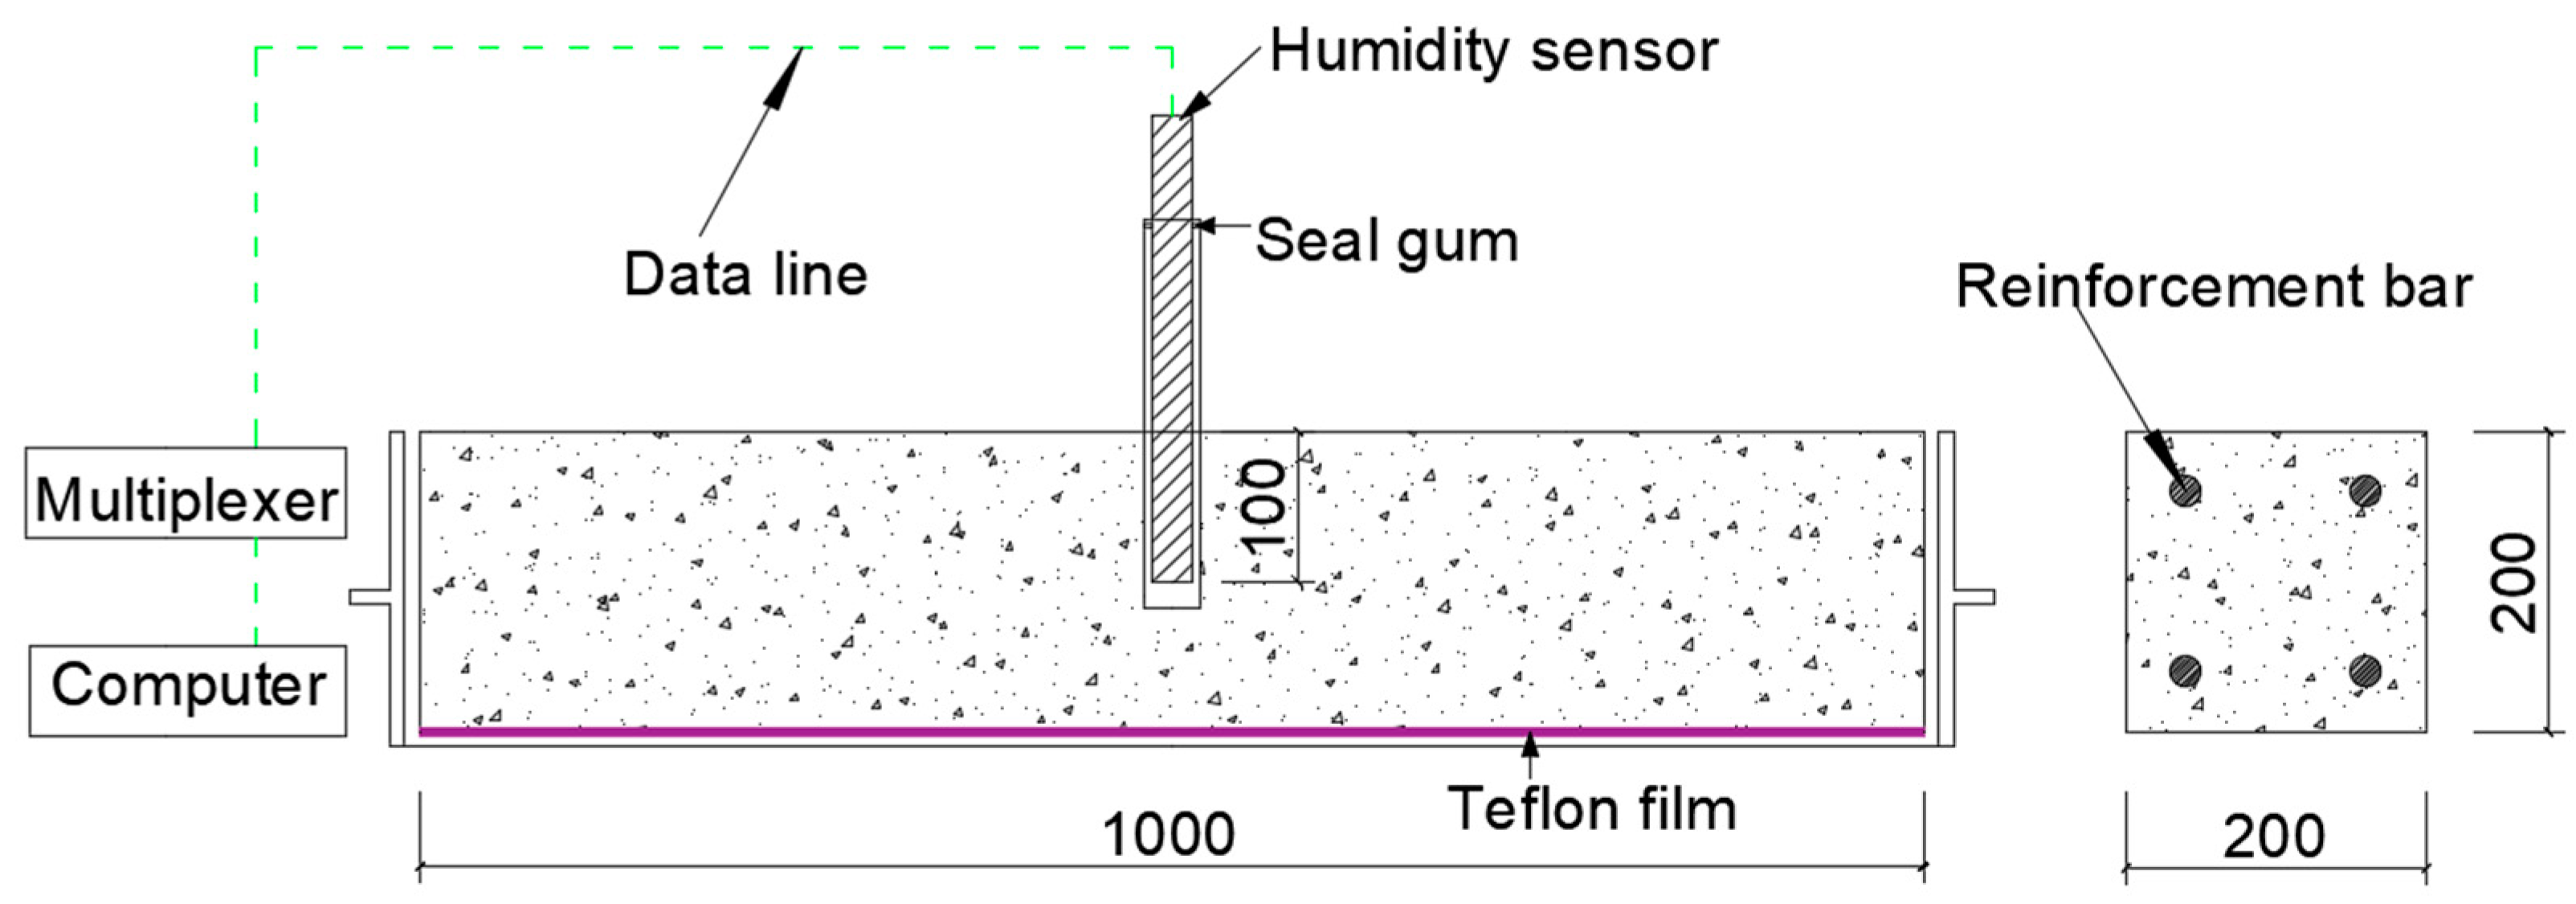
The molds used to form the specimens discussed in this chapter were composed of Plexiglas. The specimen dimensions were 200 mm × 200 mm × 1000 mm (width, height, and length). Meanwhile, two pieces of 1 mm-thick Teflon film were placed at the bottom of the mold to reduce the friction between the bottom of the specimen and the concrete.
The humidity inside the concrete was measured using a humidity sensor with a 3% accuracy for relative humidity. The humidity sensor is a moisture-sensitive capacitance type, which comprises polymer film capacitors, such as polystyrene, polyimide, and caseinate acetate fiber. When the ambient humidity is altered, the dielectric constant of the moisture-sensitive capacitor changes; thus, its capacitance also changes in proportion to the relative humidity, from which the change in external humidity can be obtained. The humidity sensors were placed 100 mm from the top surface of the concrete to test the humidity changes inside the concrete. To install the humidity sensor inside the concrete, a PVC pipe with an inner diameter of 20 mm and a thin PVC sheet covering the bottom end were used. Two rectangular holes were cut close to the bottom of the PVC pipe to allow the sensors to test the humidity inside the concrete. To prevent fresh concrete from flowing into the PVC pipe during the pouring process, a thin steel pipe with an outer diameter of 20 mm was inserted into the PVC pipe before pouring the concrete. The PVC and the thin steel pipes were inserted 100 mm from the top surface of the mold before the concrete was poured. When the concrete started to set, the thin steel pipe was pulled out, and the humidity sensor was inserted into the PVC pipe. To prevent humidity exchange between the inside of the PVC pipe and the outside environment, the top of the PVC pipe was sealed with a sealant and a polyethylene film (Figure 1).
To measure the internal humidity and determine pore structure change rule of concrete under different curing and external environments, two types of concrete curing methods were designed, namely dry curing and sealed curing. For dry components, the external humidity was set to 35, 50, and 65%. For the dry curing specimens, after the concrete was first set and demolded and the installation of humidity sensors, the test began. For the sealed curing specimens, immediately after the installation of the moisture sensor, the whole specimen was sealed on six sides with aluminum foil tape to prevent the exchange of moisture between the concrete and the outside environment; thus, the humidity change due to cement hydration was obtained.
To investigate the effect of constraints on the moisture of concrete, unconfined and confined specimens were used in this study. In the restrained specimens, four reinforcement bars were placed into four sides of the cross-sections of the restrained specimen to meet the reinforcement ratio requirements (Figure 1). The modulus of elasticity of the steel bar was 20.6 × 10⁴ MPa, the yield strength was 400 × 104 MPa, and the ultimate strength was 580 × 104 MPa. Specific experimental information is tabulated in Table 4 (without constraints) and Table 5 (with constraints). All the components were tested at a room temperature of 25 °C. The internal humidity of the concrete test lasted for a total of 28 days. The internal humidity data of the concrete were automatically read and recorded by a computer every 0.5 days. Three specimens of each type were evaluated, and the data analyzed in the following sections were derived from the average of the data obtained from three specimens under the same test conditions.
3.4. Pore Structure Test
This study was conducted to test the pore structure parameters of concrete of different strength classes and different ages (3 days, 7 days, and 28 days) to reveal the relationship between pore structure and humidity and humidity diffusion coefficient. The pore structure of concrete specimen blocks can be analyzed using mercury-in-pressure (MIP); thus, some concrete pore structure parameters, such as porosity, mean pore size, and median pore size can be obtained.
For porosity testing, the samples used were obtained from specimens of the same concrete grade and curing conditions as the specimens tested for internal moisture. When the test age was attained, the specimen was removed, and the concrete on the specimen was drilled with a drilling machine. Afterward, the specimen was crushed, and after removing the coarse aggregate, it was placed in acetone to terminate the cement hydration process. Before starting the test, the specimens were dried in a high-temperature vacuum (>150 °C) and placed in a desiccator. The test results are derived from the average of the test results of the six test samples.
4. Results and Discussion
4.1. Concrete Internal Humidity
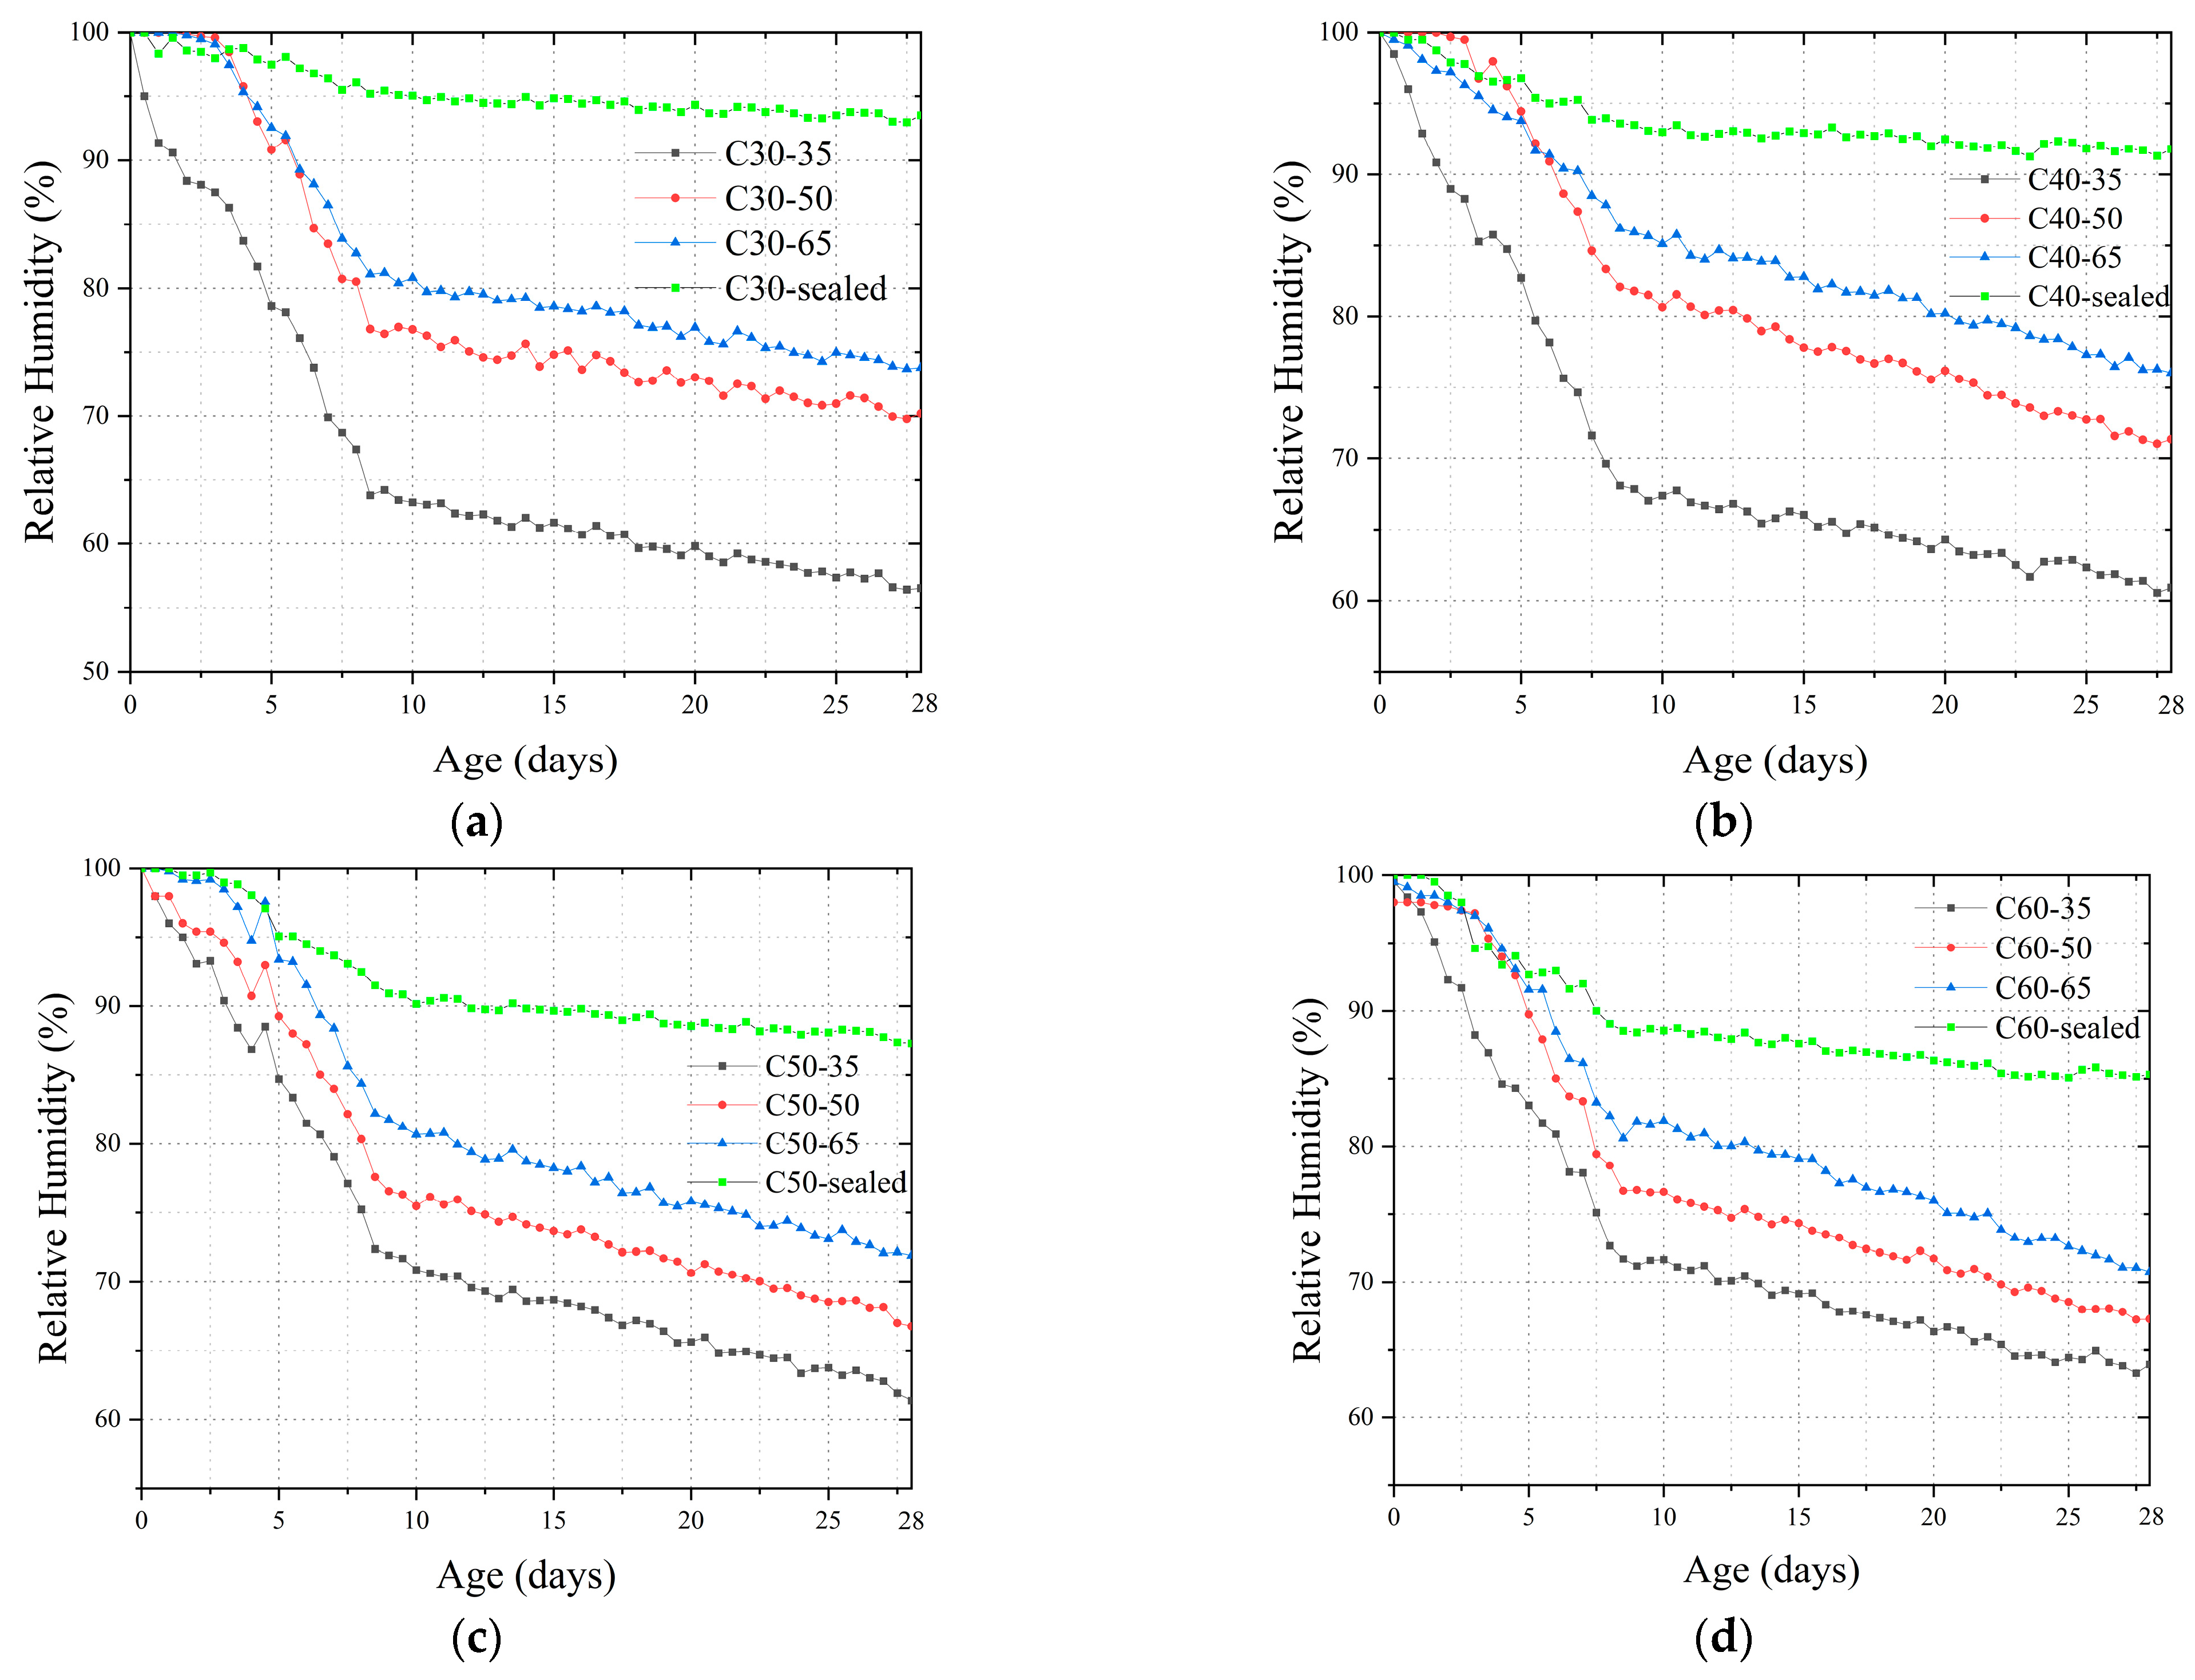
Figure 2 demonstrates the change rule of internal humidity with age for all specimens. Overall, the change in the internal humidity of concrete can be divided into two stages: Stage I (rapid decline in humidity) mainly occurs in concrete after pouring for 0–8 days. In this stage, the humidity in the concrete continued to decline rapidly. Stage II (slowly decreasing humidity) mainly occurred 8–28 days after concrete casting, in which the rate of decreasing humidity of concrete decreased and eventually stabilized. This phenomenon can be explained as follows: In the early age of concrete, the water in concrete was rapidly consumed due to intense hydration. Meanwhile, the drying effect was intense due to the large gradient of humidity between the interior and exterior of the concrete. Under the two effects, the internal humidity of concrete decreases rapidly. With the gradual slowing down of hydration and decrease in the internal and external humidity gradient, the water consumption rate in the concrete slowed down, and the concrete humidity decreased at a lower rate and gradually stabilized. Regarding sealed elements, the elements were sealed with aluminum foil tape. The water inside the component was not exchanged with the outside environment, and only the hydration of the cement inside the concrete consumed the water in the concrete. The hydration of high-strength-grade concrete was more intense due to its lower water–cement ratio. As a result, the rate of decrease of humidity inside the concrete increased with the increase in cement strength, and at the age of 28 days, the humidities of C30, C40, C50, and C60 sealed members were 93, 92, 87, and 85%, respectively.
In drying members, in addition to the consumption of water by the hydration of cement, the drying action also consumes the water inside the concrete, which makes the humidity of the concrete decrease faster and the final humidity lower. From the experimental results, the lower the humidity of the external environment, the stronger the drying effect and the faster the humidity of concrete decreases. Taking C30 concrete as an example, when the external humidity was 35, 50, and 65%, the internal humidity of the concrete specimen was 56, 70, and 74%, respectively, at 28 days.
4.2. Concrete Moisture Diffusion Coefficient
The concrete moisture diffusion coefficients for specimens C30-35, C30-50, C30-65, C40-35, C40-65, C50-35, C50-50, C60-35, C60-50, C60-65, C30-65-1, C30-65-3, C30-65-6, C60-65-1, C60-65-3, and C60-65-6 can be calculated using Equations (34) and (35), where H0, a, b, c, and d represent calculation parameters of the humidity value fitting model (Equation (35)), and it can be obtained from the results of the fitting tests, as shown in Table 6. In addition, average fitting error is obtained between the experimental and fitted values of humidity diffusion at each age of the specimens.
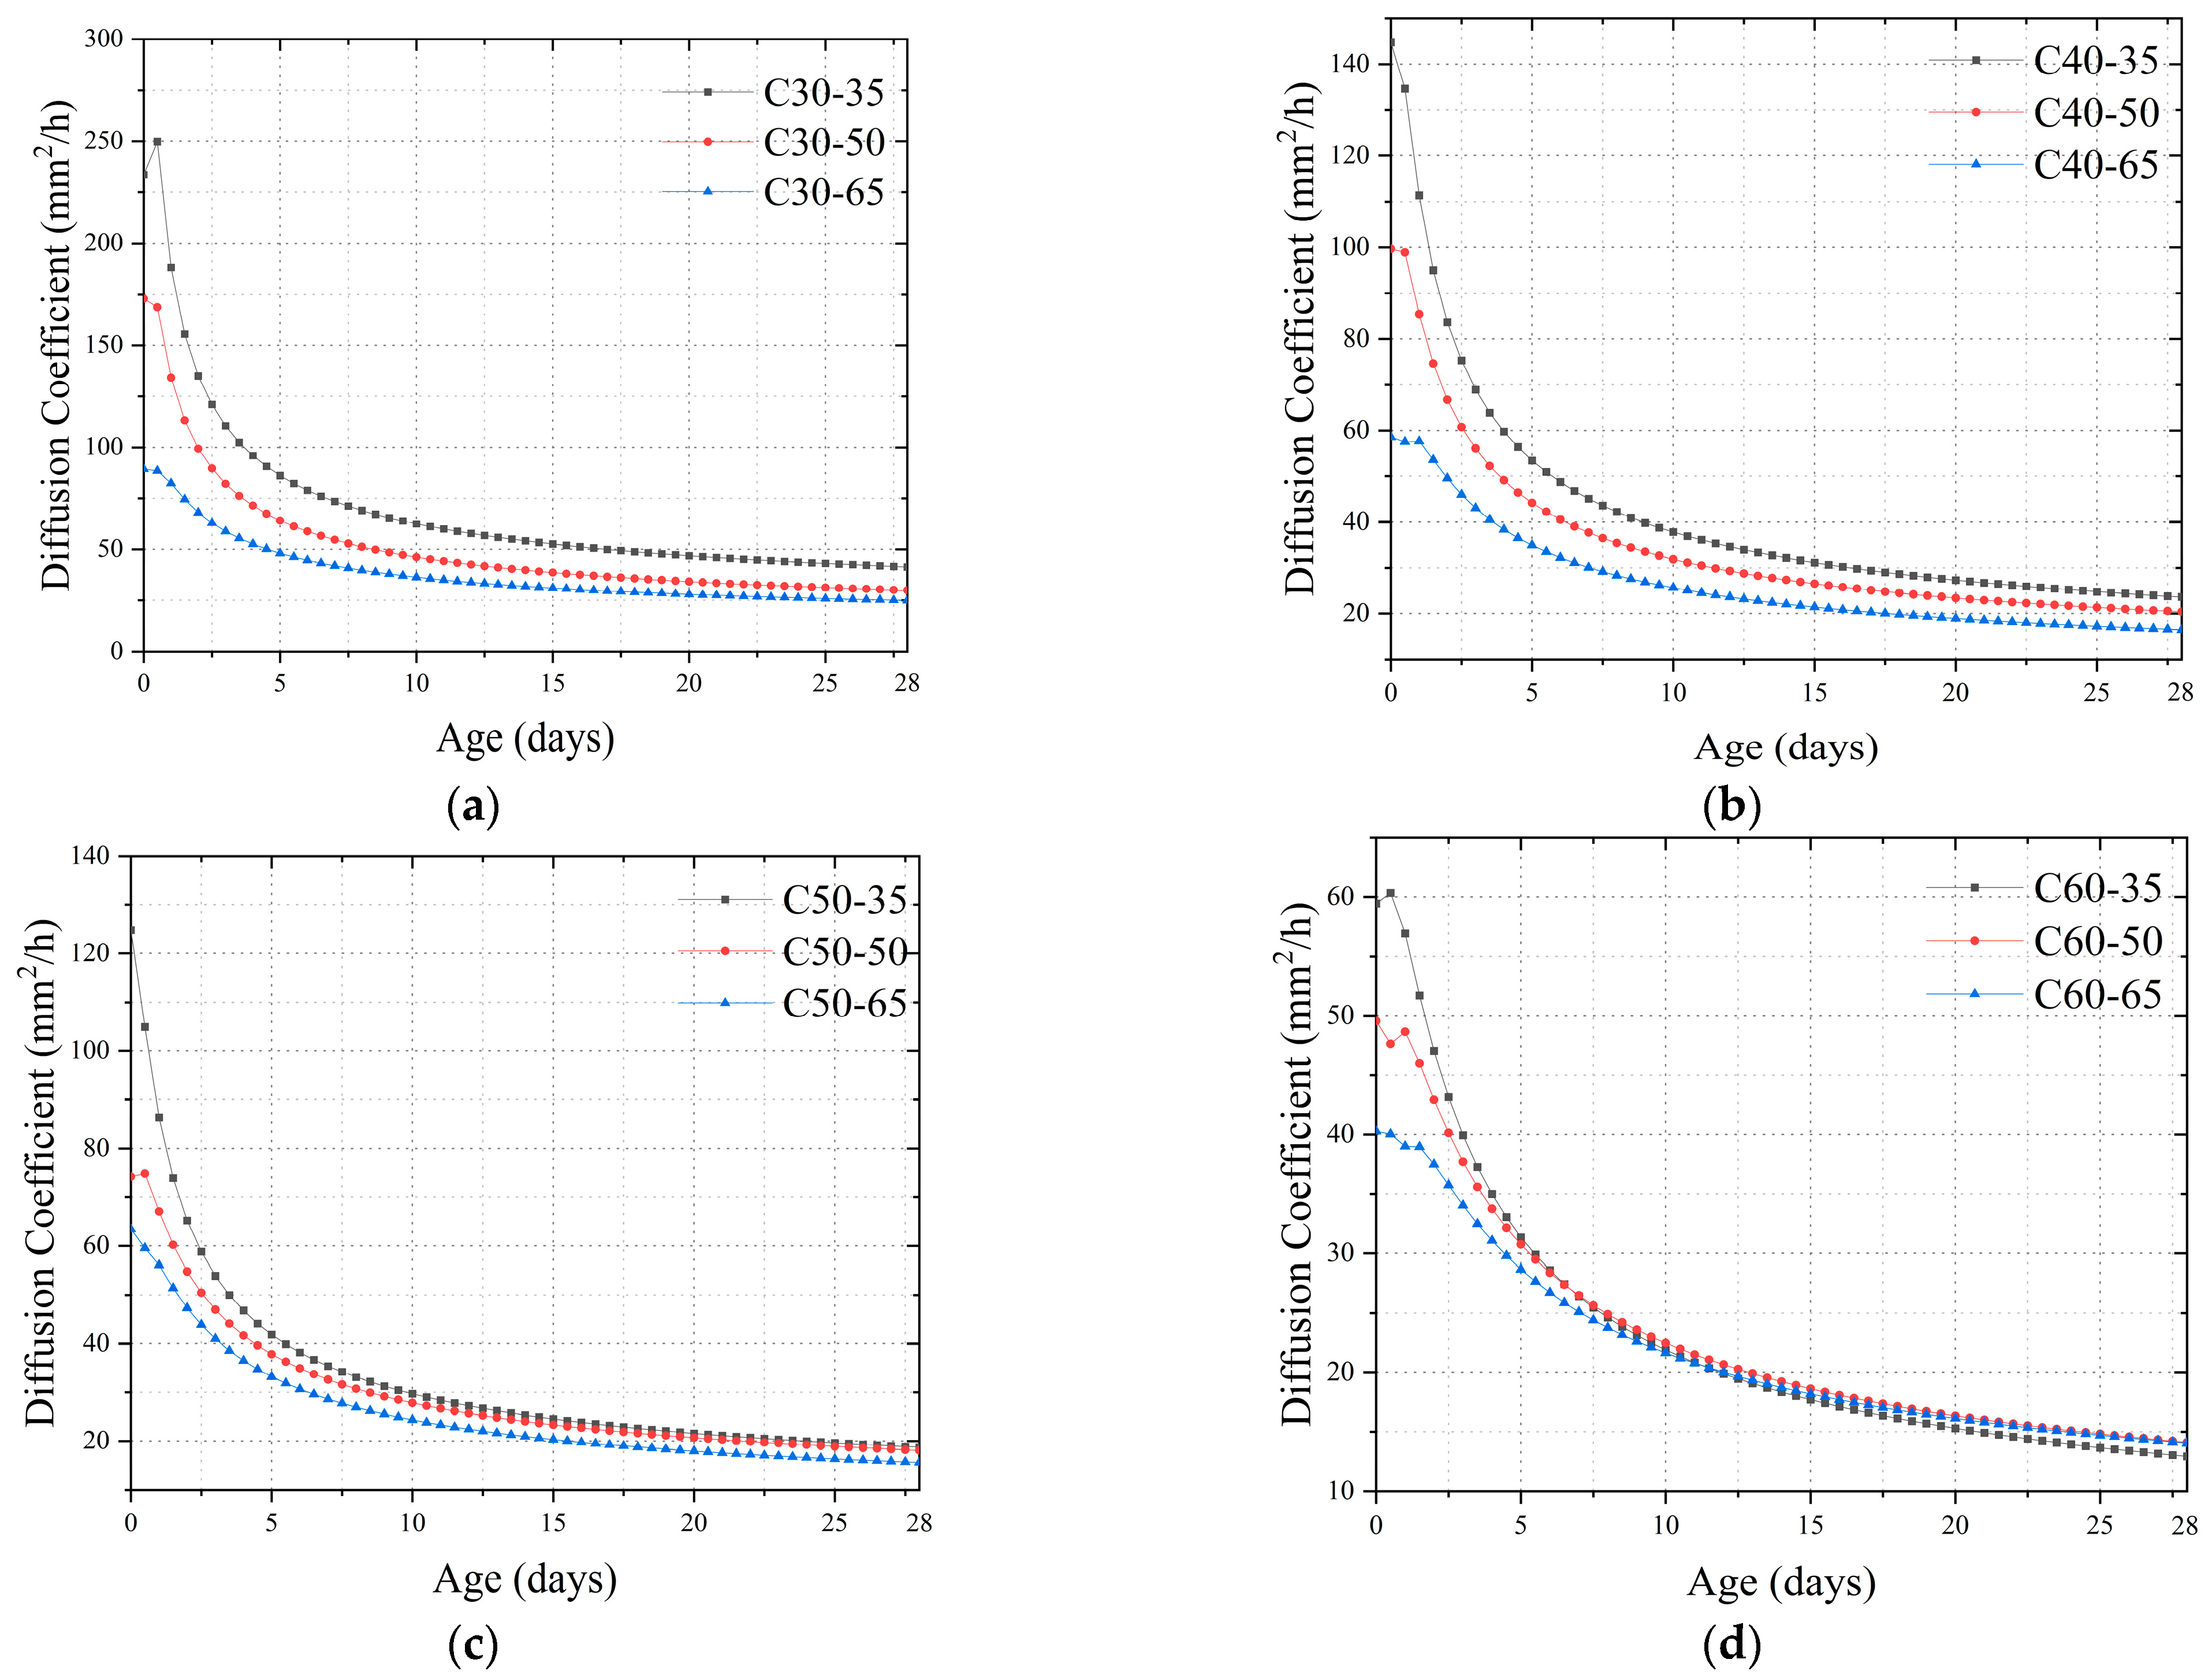
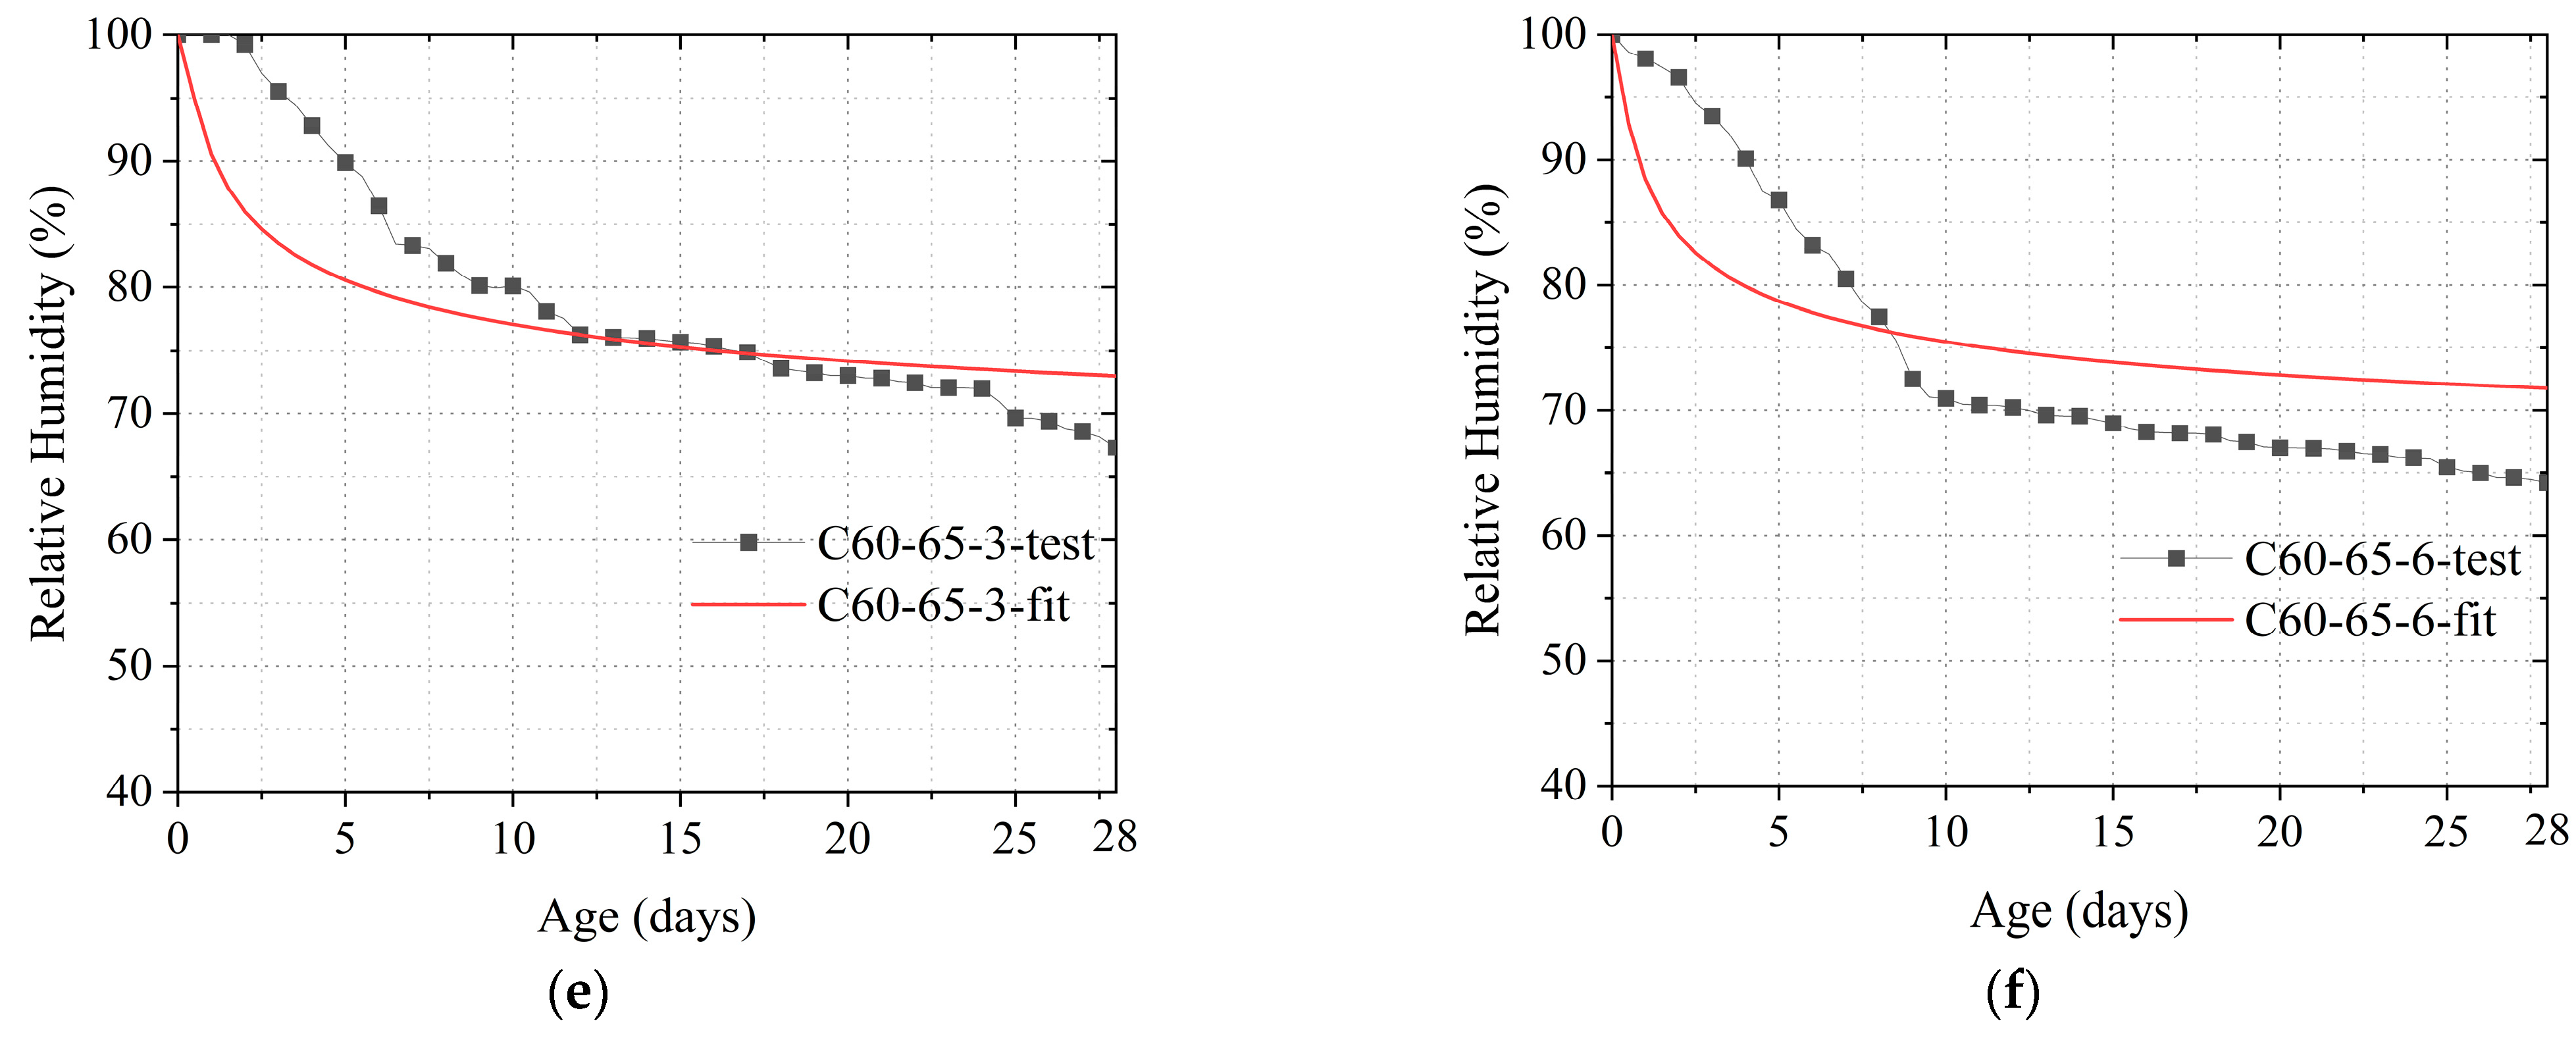
Figure 3 shows the variation rule of the moisture diffusion coefficient of concrete with age under different external environments and strength grades. The test results reveal that the moisture diffusion coefficient of concrete changes with age. Its age-based change rule can be divided into three stages. Stage I (rapid decline stage of diffusion coefficient): After going through the stage of 100% humidity in the previous period, the humidity of the concrete starts to decrease rapidly, which is from 0 days to 1 day after the concrete cures, during which the humidity diffusion coefficient of the concrete rapidly decreases. Stage II (slow decline stage): this period occurs from 1 day to 8 days after concrete placement. Stage III (stabilization stage): when the age of concrete exceeds 8 days, the change of concrete humidity diffusion coefficient is no longer significant for both ordinary and high-strength concrete.
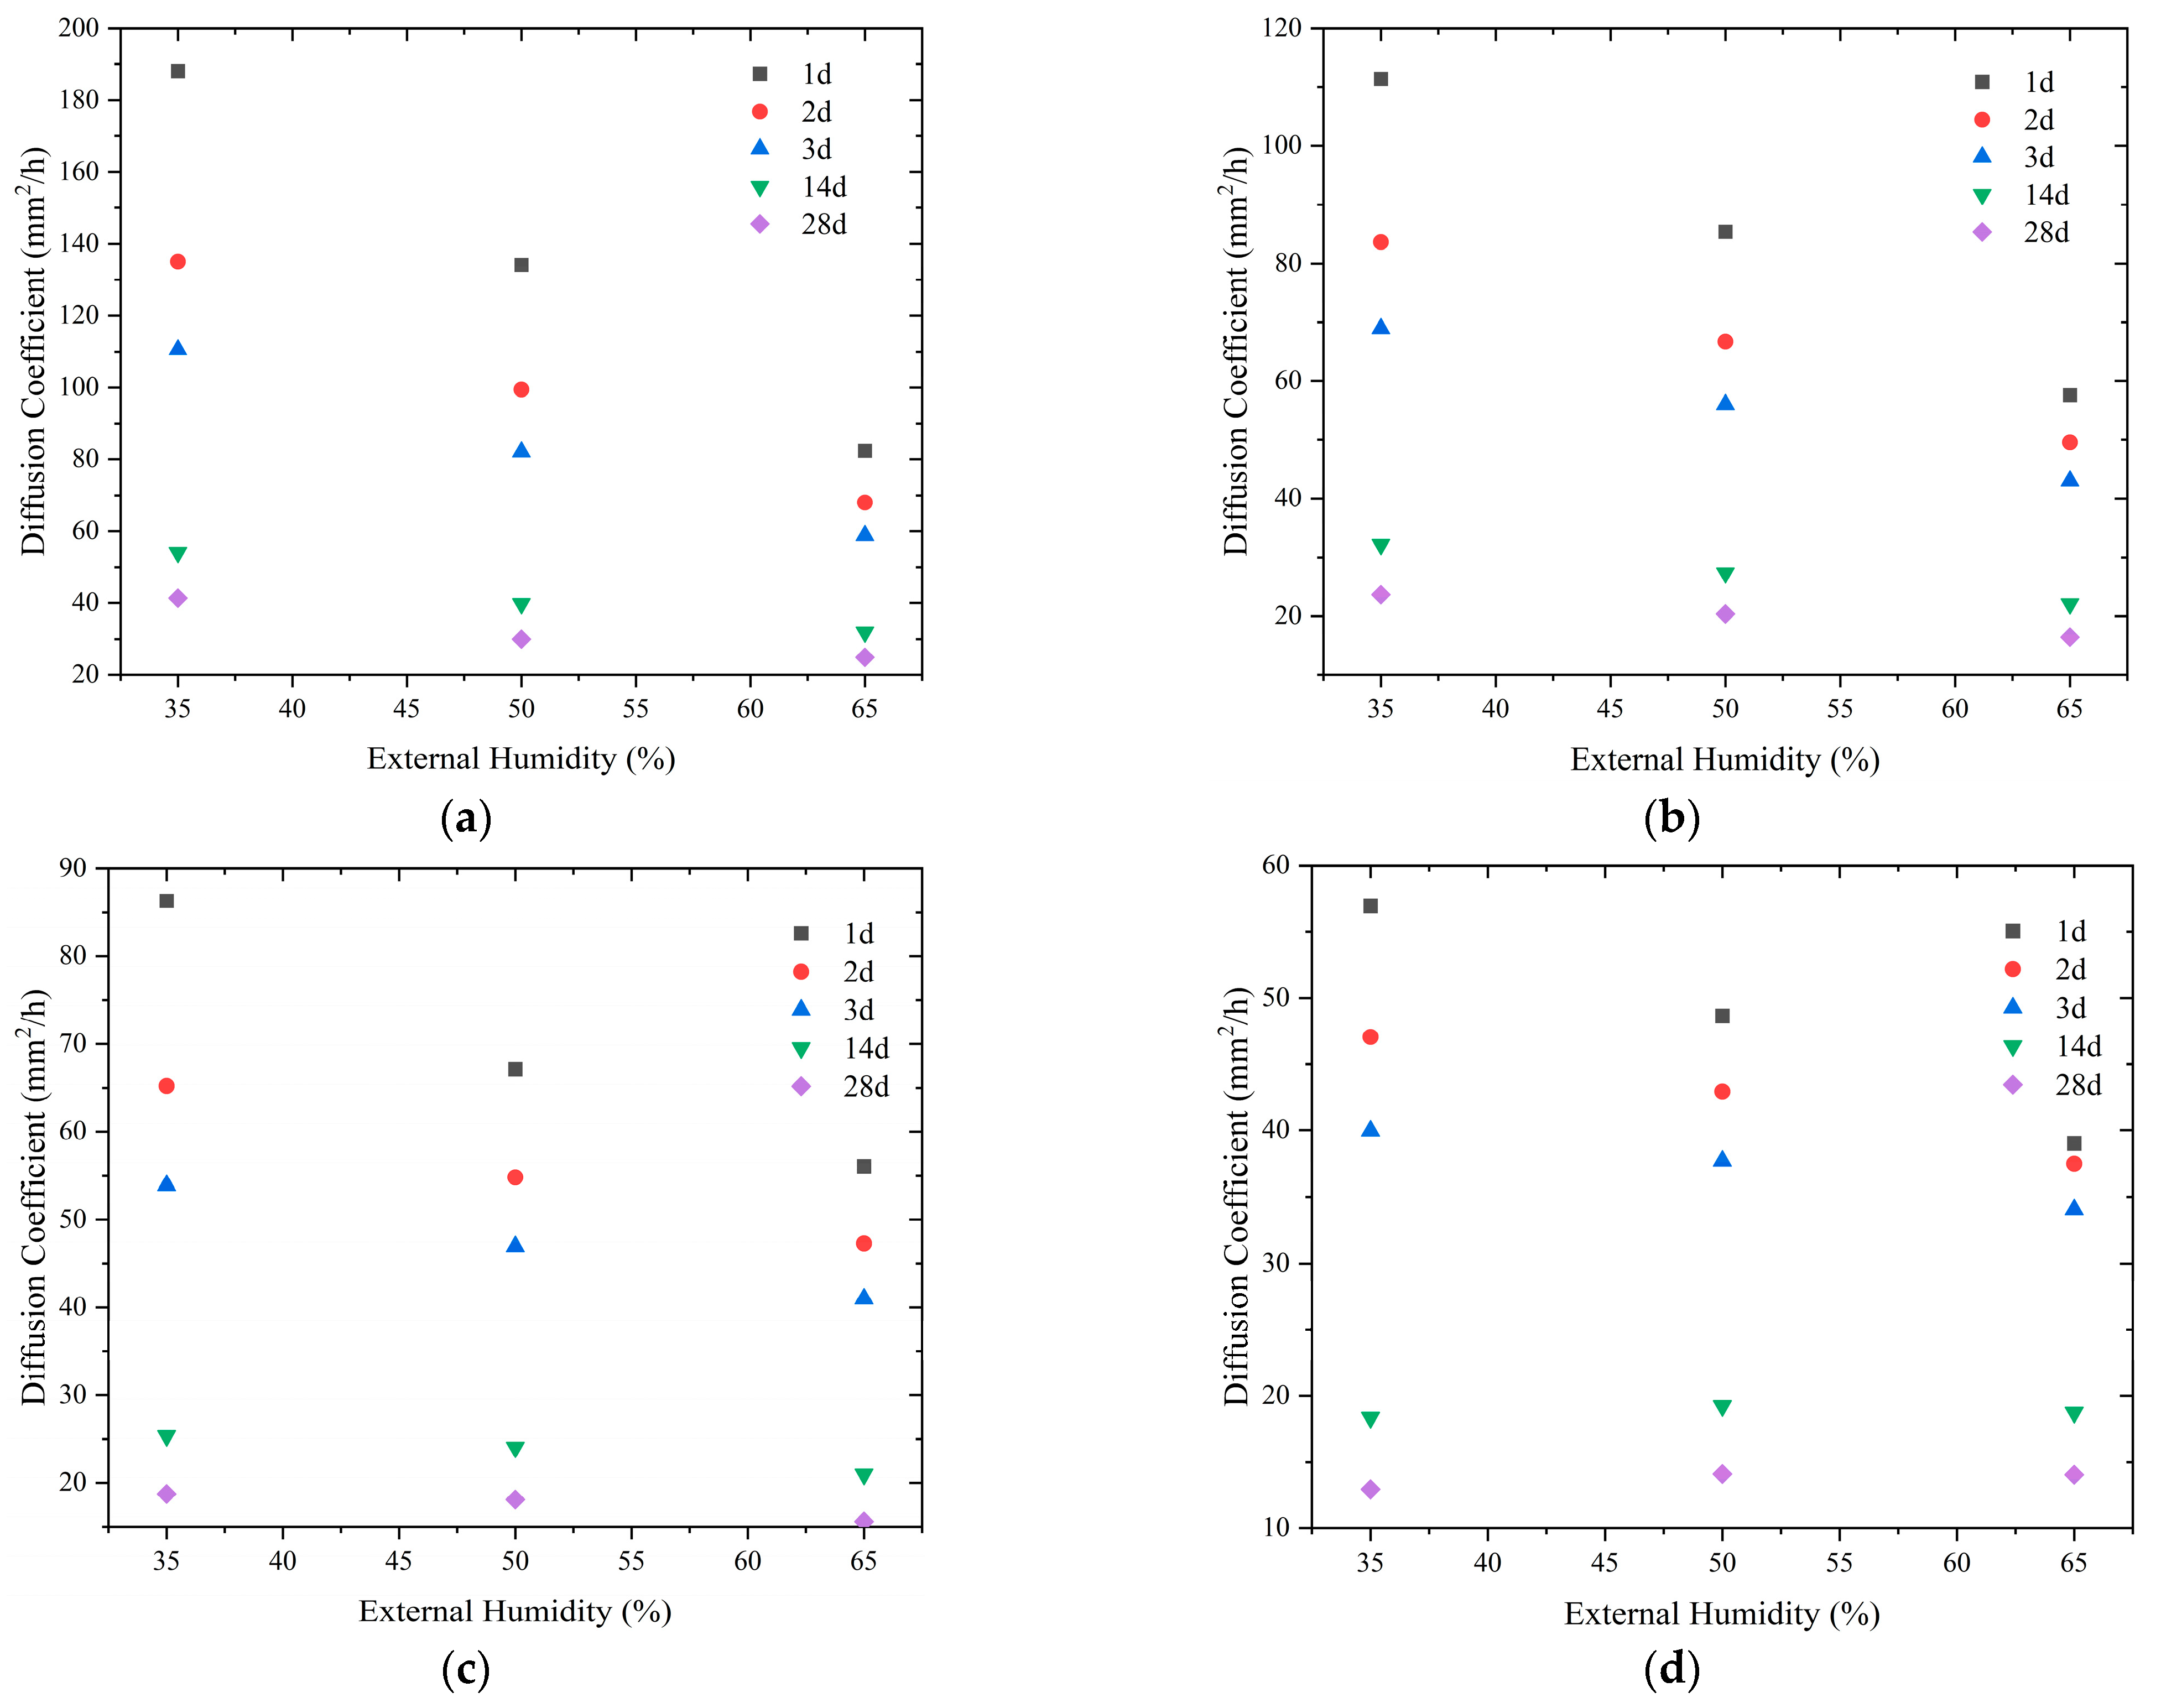
The external humidity environment has a significant effect on the moisture diffusion coefficient of concrete. When the external humidity of concrete is lower, the moisture diffusion coefficient of concrete is higher. Taking C30 concrete as an example, at the age of 3 days, the humidity diffusion coefficient of concrete in a 35% external humidity environment is 110.5 mm2/h. With the increase in external humidity to 50% and 65%, the humidity diffusion coefficient decreases to 68.9 mm2/h and 53.8 mm2/h, which is a decrease of 41.6 mm2/h and 56.7 mm2/h, respectively. This phenomenon occurs because when the concrete is poured, the internal humidity is significantly higher than the external humidity, and the lower the external humidity, the more significant the drying effect, which is reflected in the diffusion coefficient, and the higher the diffusion coefficient value. As can be seen in Figure 4, there is a linear relationship between the moisture diffusion coefficient of concrete and the external humidity. However, there are differences in the ratio between them at different strength classes as well as at different ages. In general, the effect of external humidity on the humidity diffusion coefficient decreases with age and concrete strength.
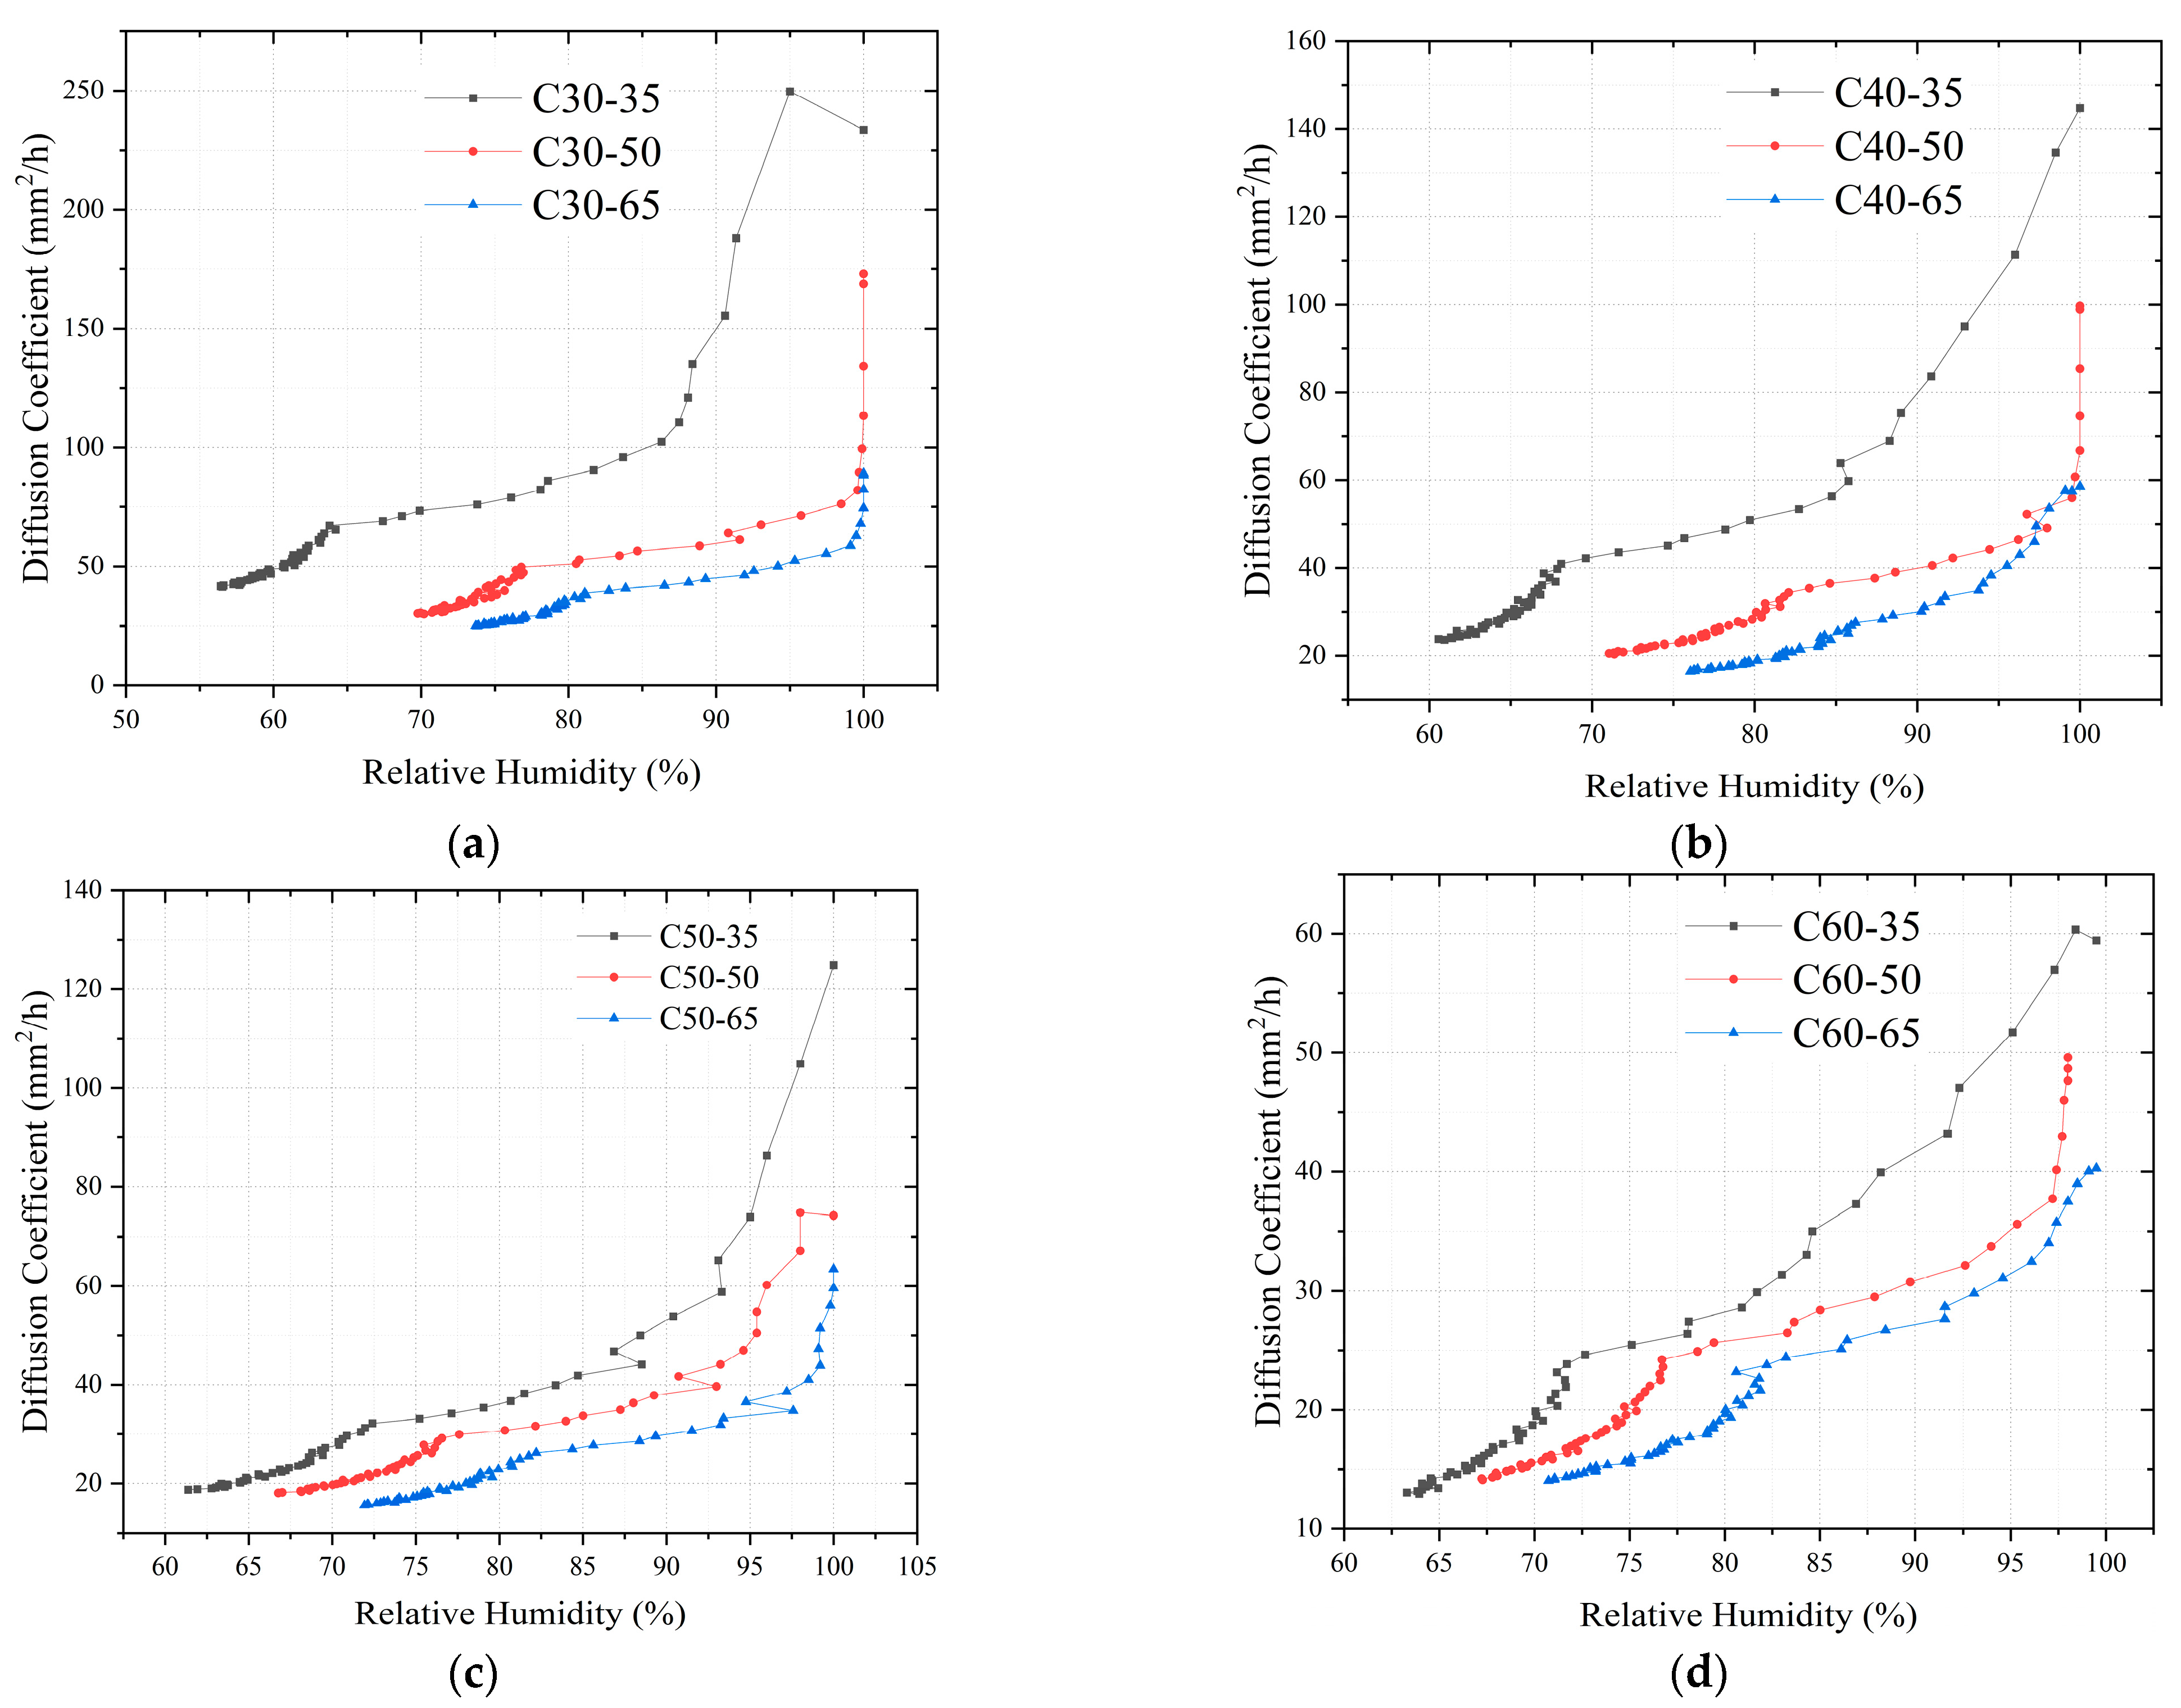
Figure 5 shows the moisture diffusion coefficients of C30, C40, C50, and C60 concrete for different humidity conditions to elucidate the relationship between the moisture diffusion coefficient of concrete and its internal humidity. Noticeably, a satisfactory correlation exists between the humidity diffusion coefficient of concrete and the relative humidity inside the concrete. The moisture diffusion coefficient of concrete gradually decreases when the humidity decreases. The development of the moisture diffusion coefficient of concrete with humidity can be approximately divided into three stages. When the RH is >95%, the diffusion coefficient decreases rapidly. When the RH is 80–95%, the diffusion coefficient decreases slowly. When the RH is <80%, the reduction rate in the humidity diffusion coefficient decreases significantly. This humidity diffusion coefficient change rule can be explained as follows: when the humidity is >95%, the water content of concrete is higher; meanwhile, the water inside the concrete is mainly liquid water. The diffusion of internal water is also dominated by the evaporation and flow of liquid water, which leads to a higher humidity diffusion coefficient. When the RH is within 80–95%, the water in the concrete changes from mainly liquid water to the liquid water–gaseous water state. During water diffusion, the proportion of gaseous water diffusion gradually increases, which leads to a decrease in the moisture diffusion coefficient. When the RH is <80%, the water in the concrete mainly exists in the gaseous state, and the water content is further decreased, which immensely lowers the value of the diffusion coefficient.
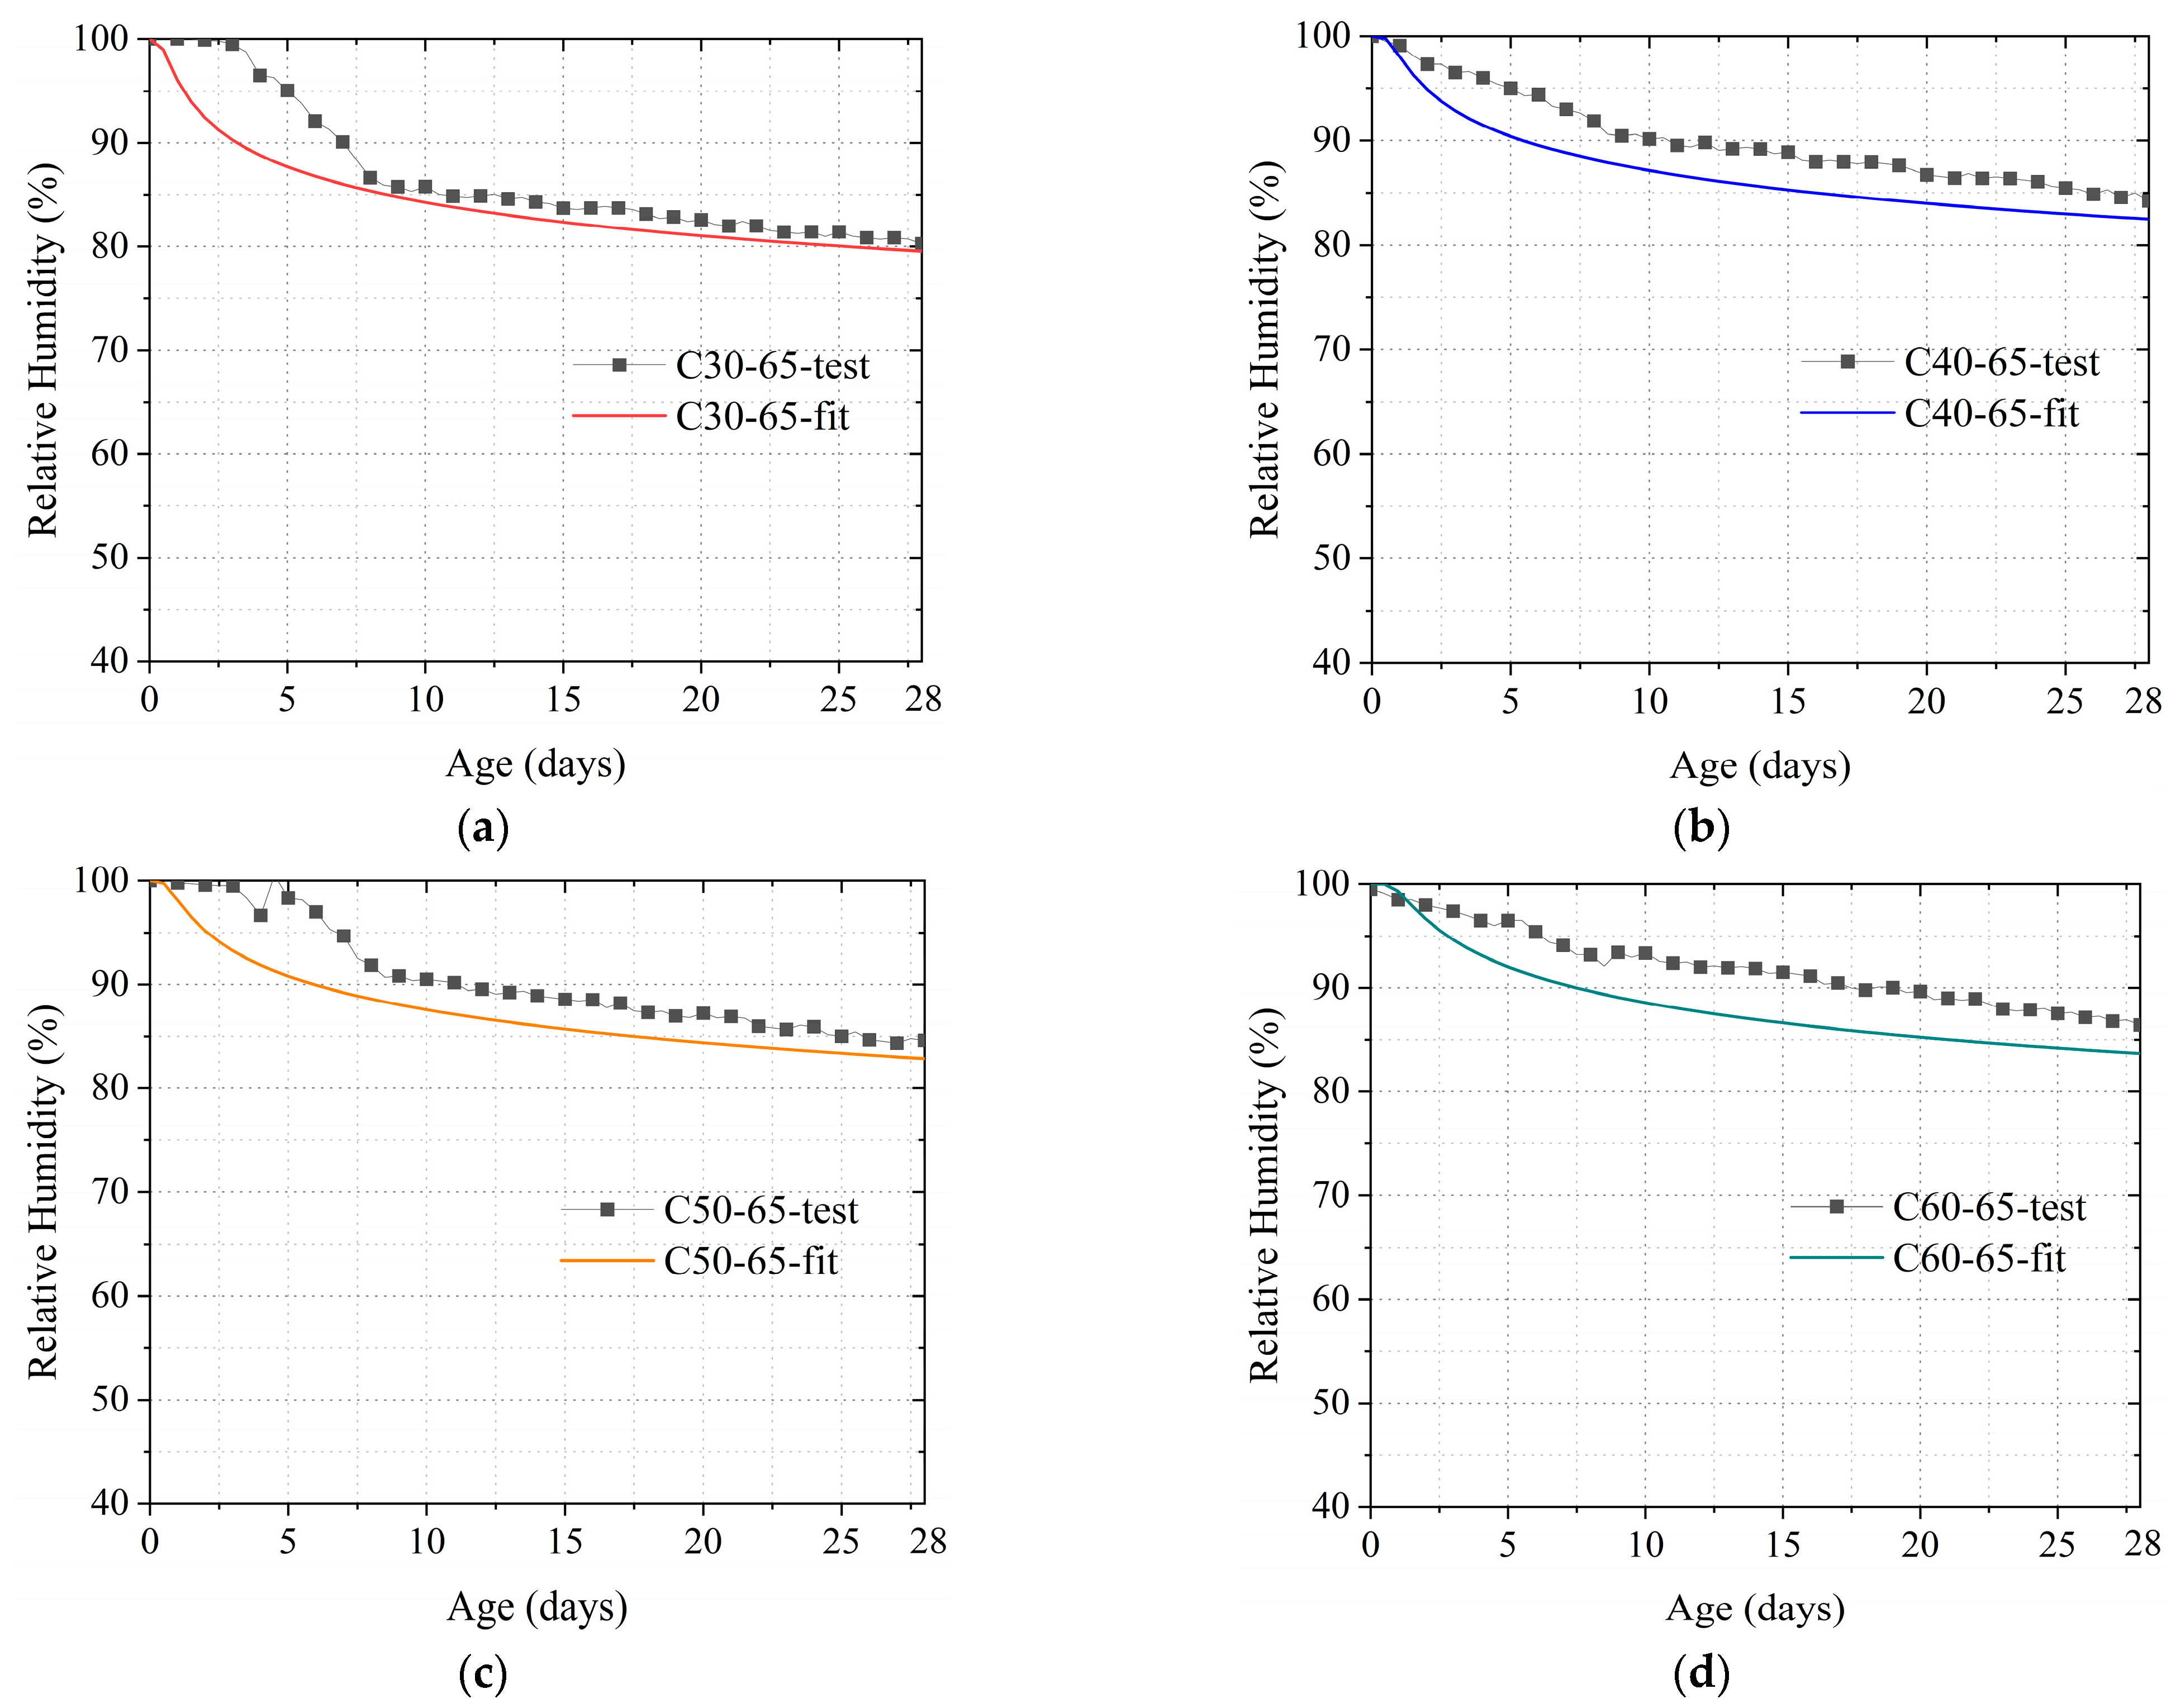
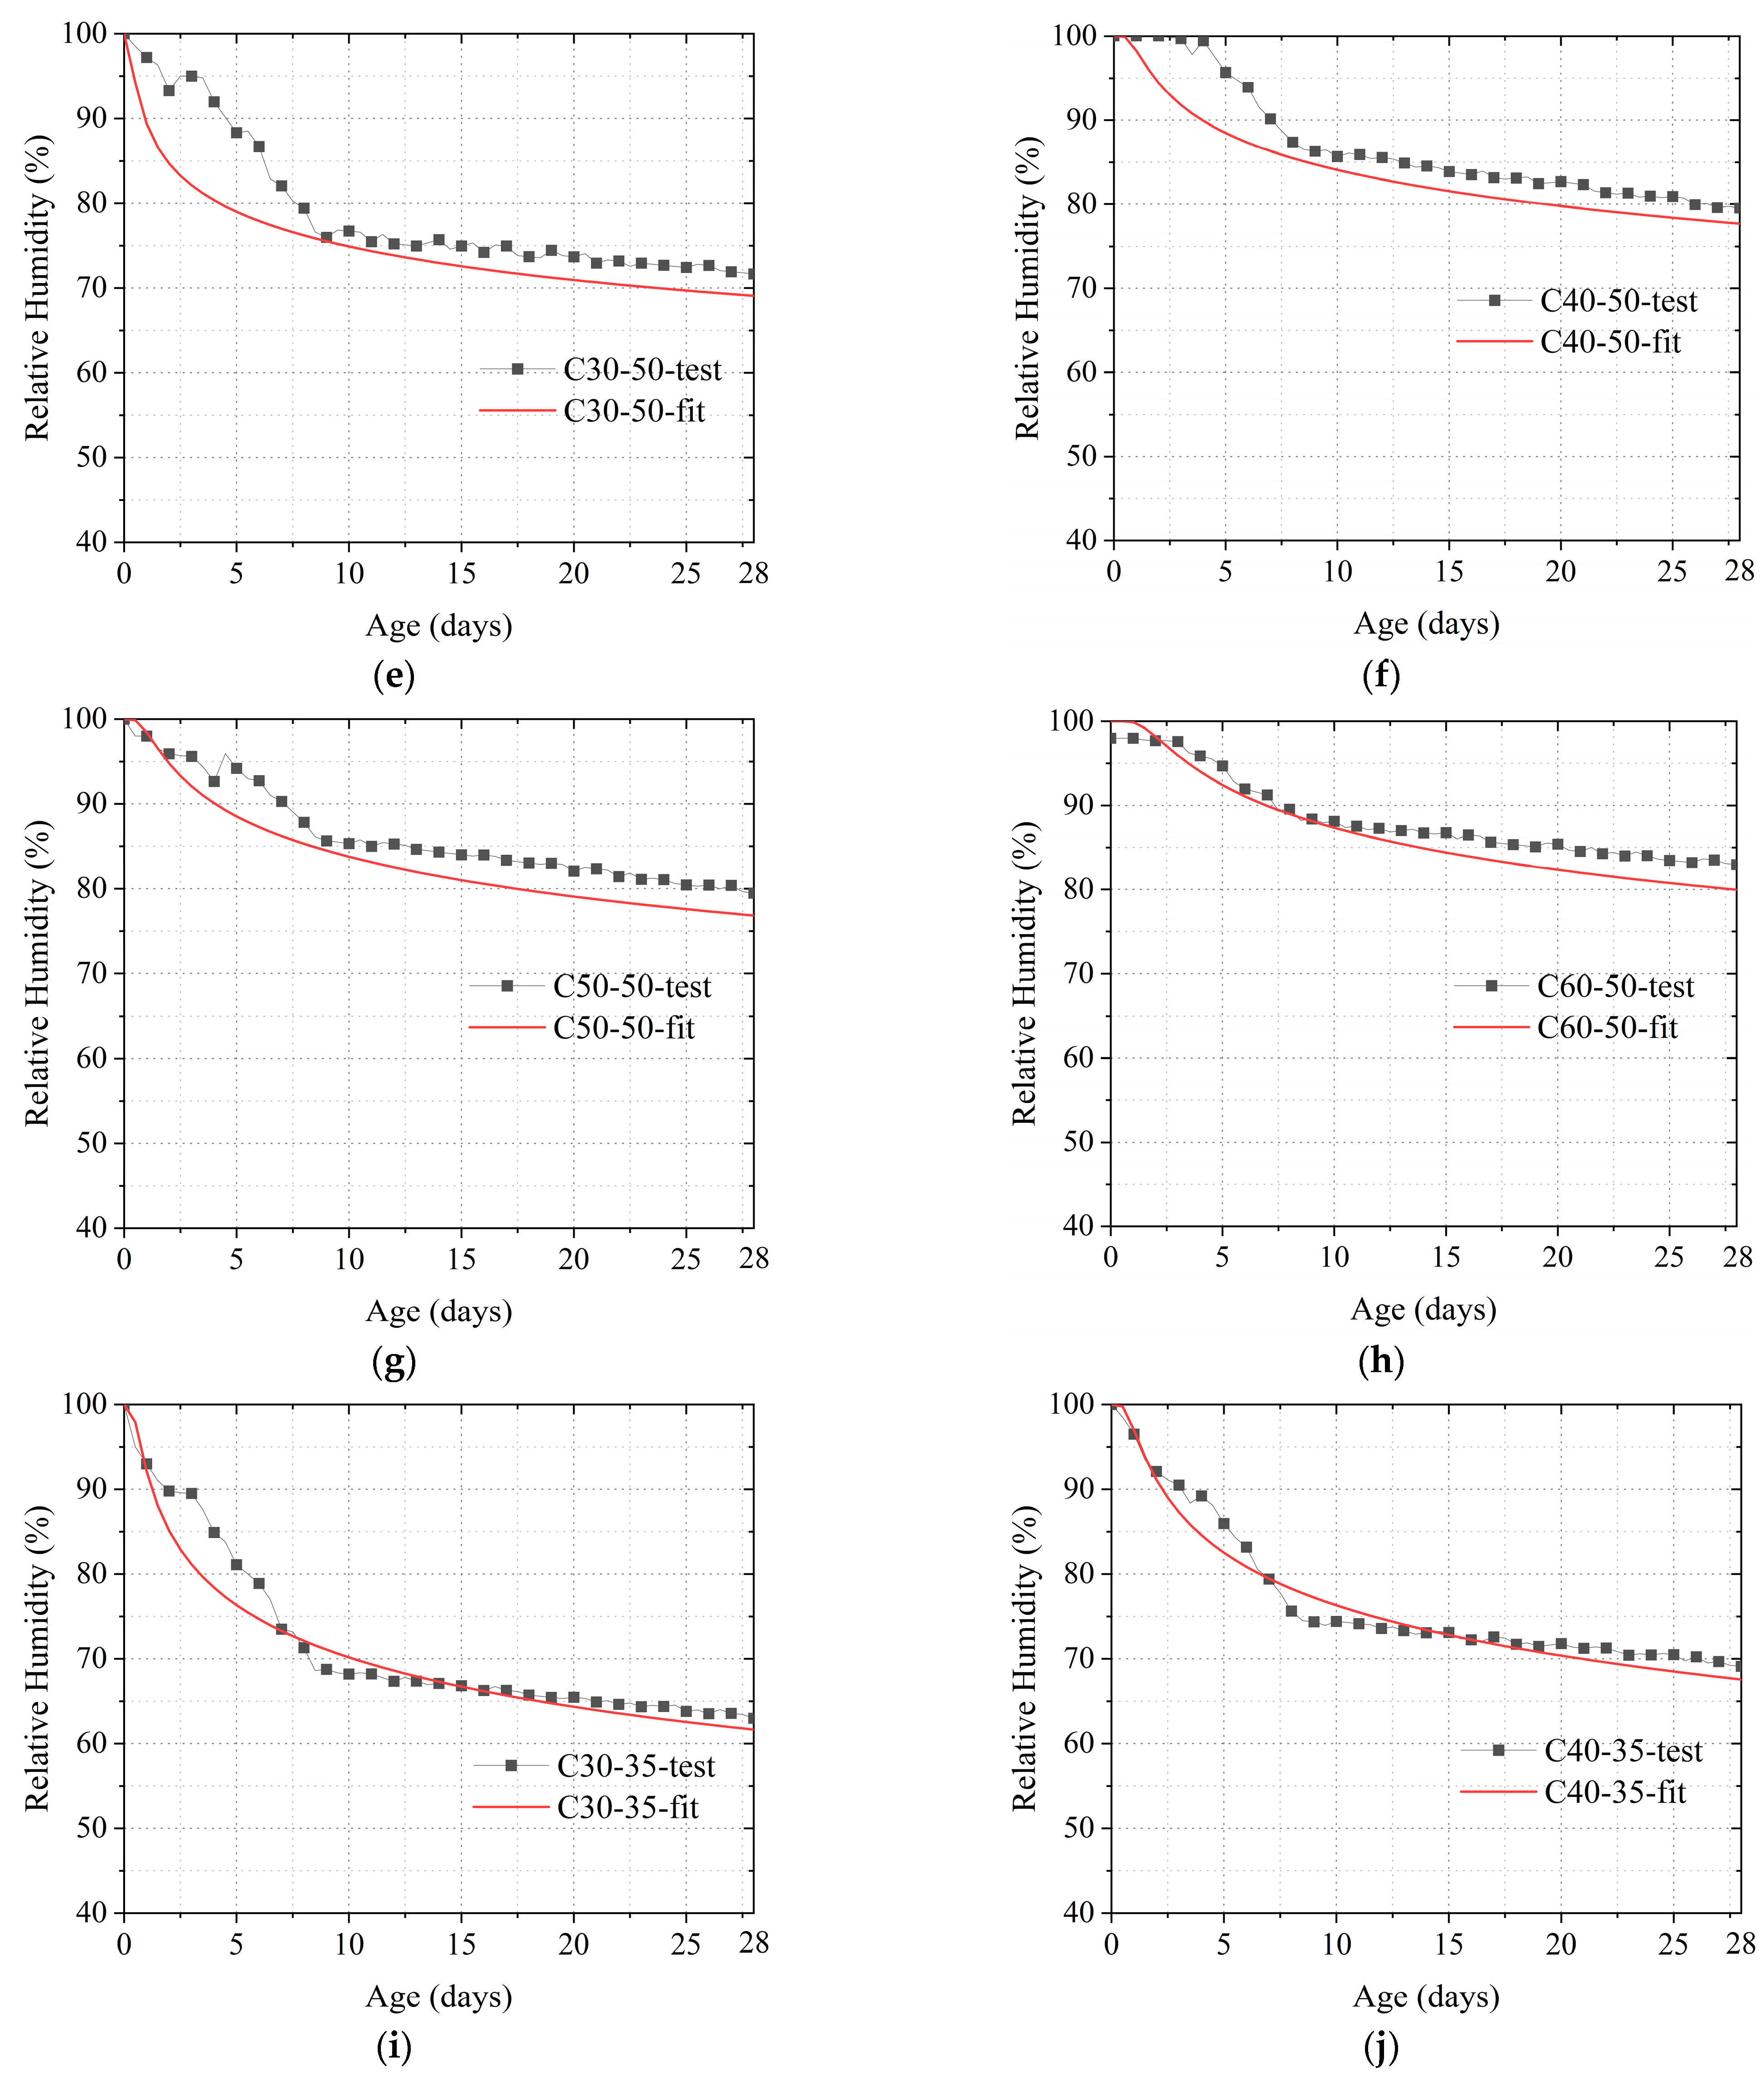
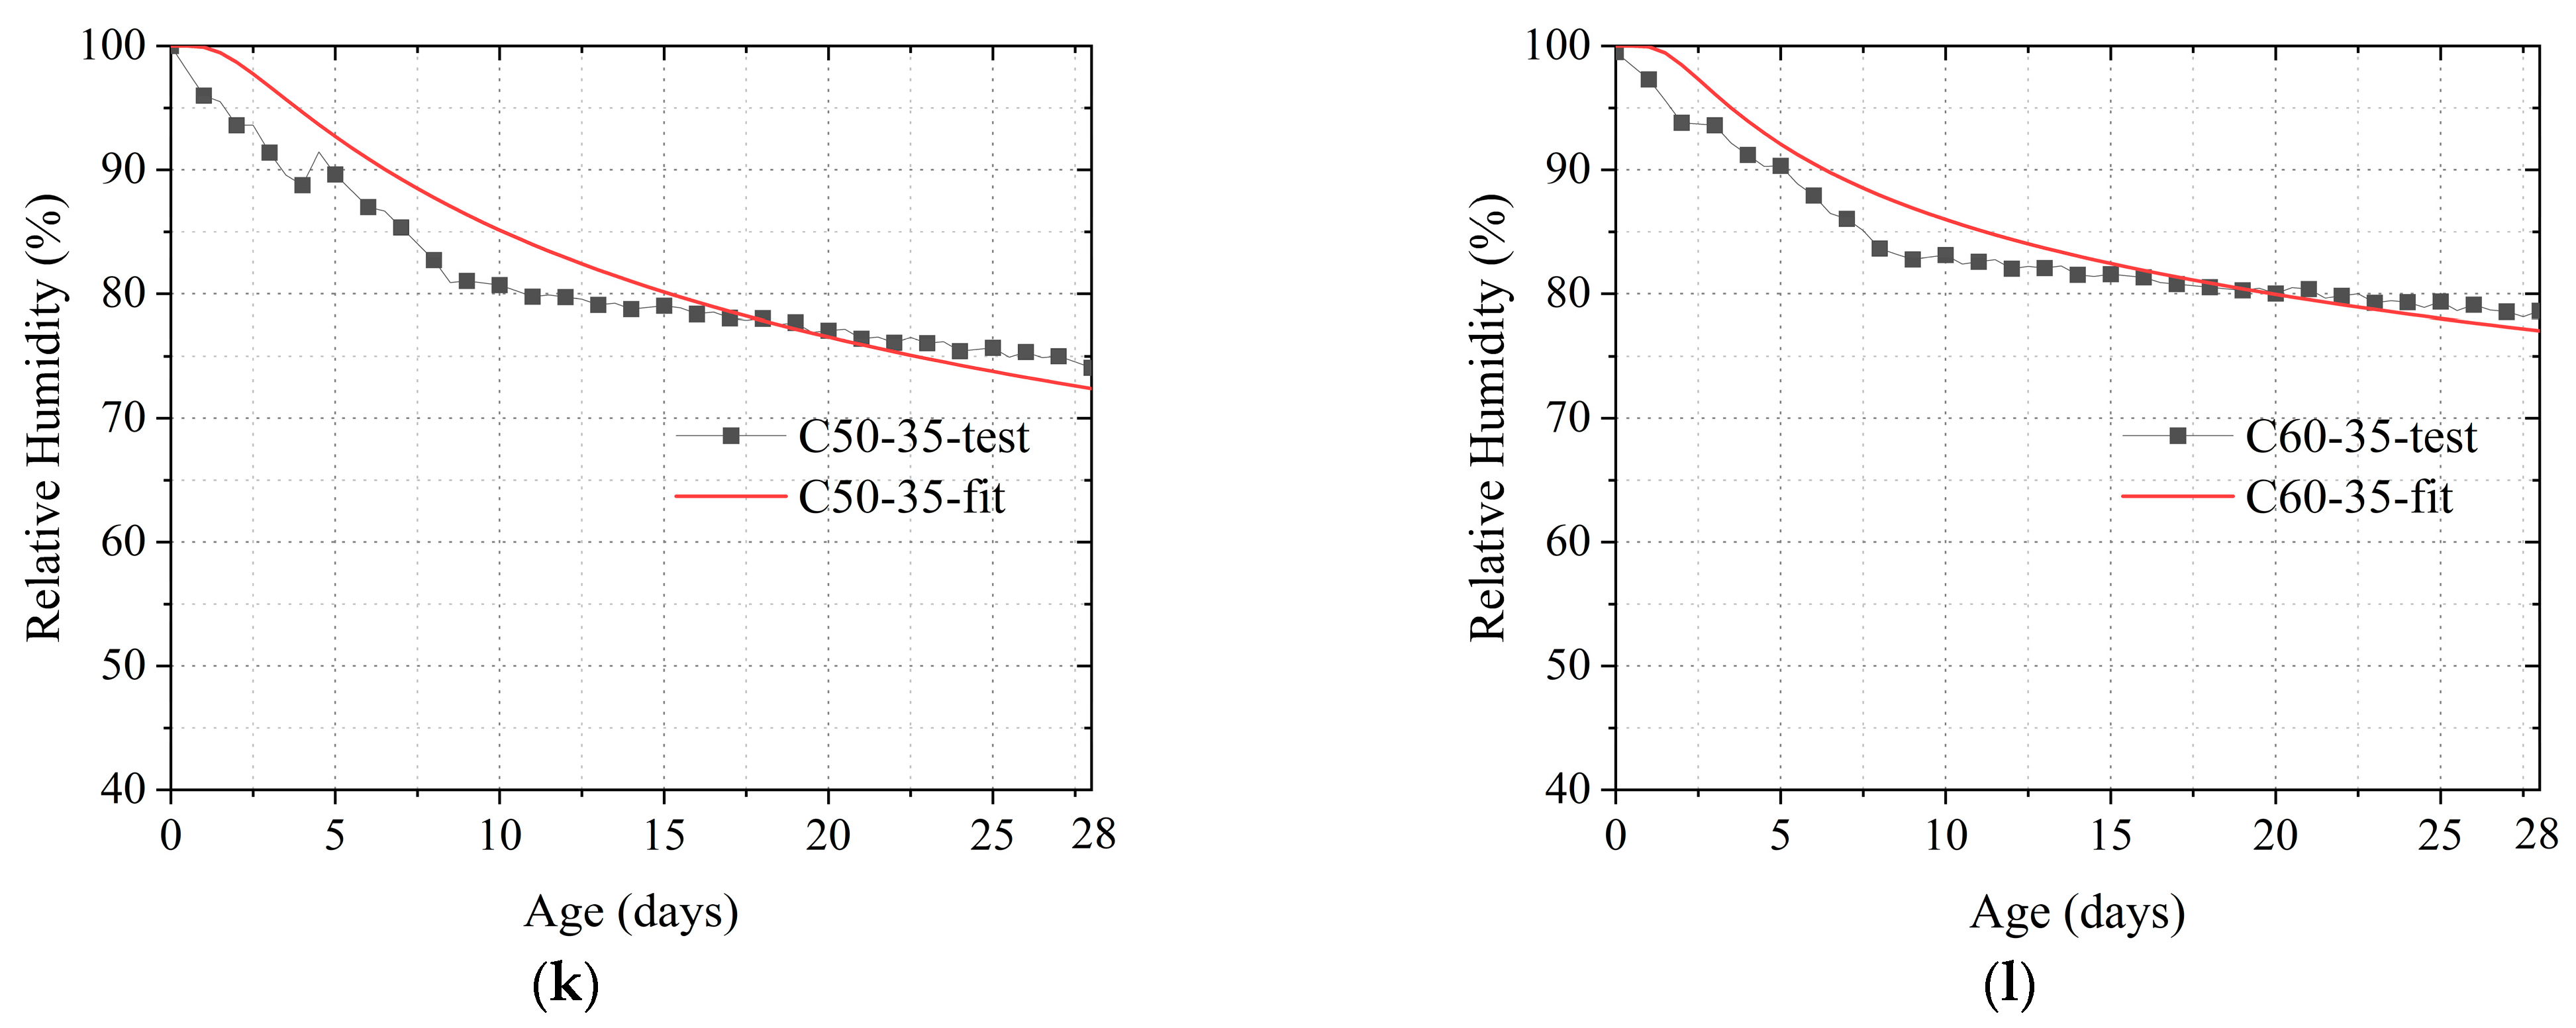
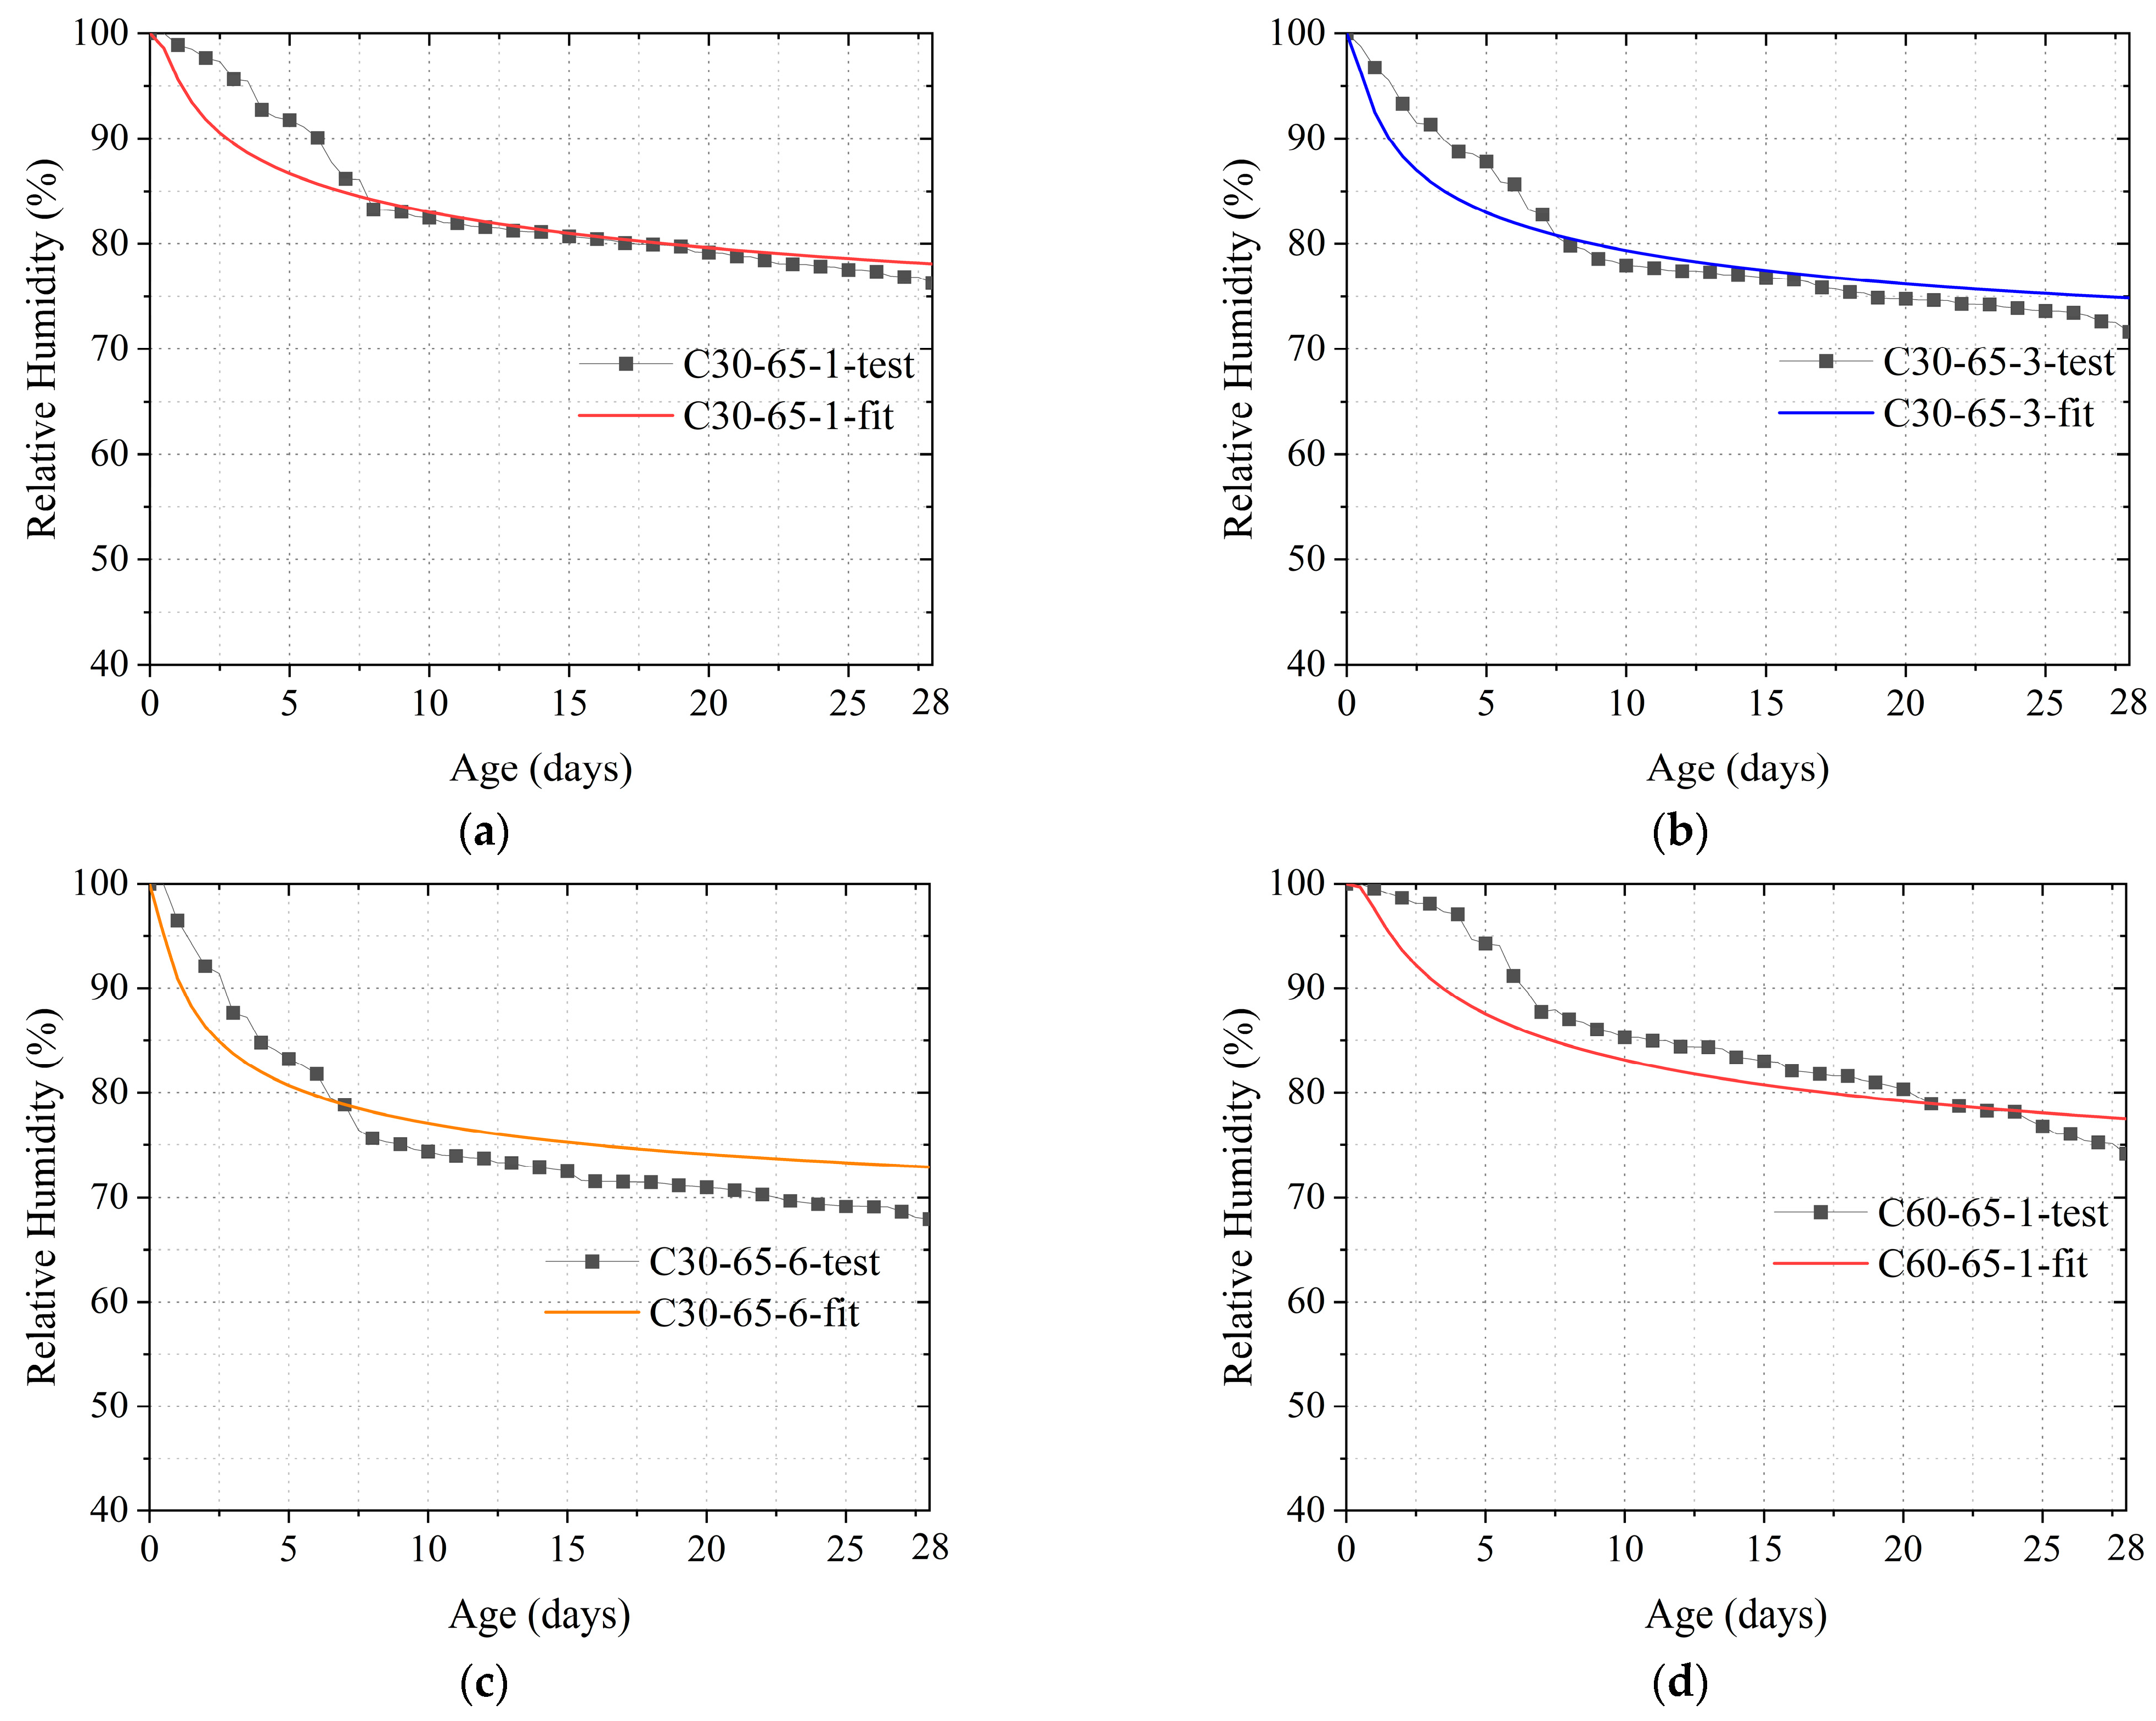
After obtaining the moisture diffusion coefficient of the concrete, the internal moisture can be calculated using Equation (29). In this study, the humidity in the middle of the specimen was determined. Therefore, x = 100 when calculating the internal moisture. Figure 6 and Figure 7 depict the calculated results of the internal humidity of concrete using Equation (29) as compared to the test results. Notably, these test results refer to the results obtained by subtracting the decrease in humidity due to cement hydration (i.e., the humidity test results of the sealed curing specimens) from the humidity test results of the dry specimens. The comparison results reveal that the calculated models are largely consistent with the test results. The average error over the whole age period was approximately 5%. However, while the computational method has better predictions overall, the overall predictions are not sufficient for earlier ages (up to 2 days). The aforementioned may be related to the distortion of the model, which is attributable to the insufficient understanding of the internal humidity of early-age concrete and the selection of the error function. However, the model can generally predict the internal humidity of concrete satisfactorily, and the error results in an amplification of the internal gradient of concrete due to diffusion; thus, the calculation of concrete shrinkage and shrinkage cracking by the humidity is conservative. Therefore, this type of error is deemed acceptable.
4.3. Effect of Concrete Strength on Moisture Diffusion Coefficient
The effect of different concrete strengths on the diffusion coefficient of humidity for the same external ambient humidity condition is depicted in Figure 8. The diffusion coefficient versus time curves for different concrete strengths under the same external humidity conditions reveal that when the concrete strength is higher, the diffusion coefficient under the same external humidity conditions is lower. In the early concrete-formation stage, this difference is quite apparent. This phenomenon is explained below.
4.4. Effect of Pore Structure on the Moisture Diffusion Coefficient of Concrete
The pore structure parameters were determined via a mercury pressure test. The distribution of the microporous structure and pore characterization parameters for each type of specimen at different ages is depicted in Table 7. The table indicates that in the same specimen, the pore structure parameters of concrete decrease with age. For example, the average pore diameter, middle pore diameter, critical diameter, and porosity of the C30-65 specimen obtained at 3 days were 24.45 nm, 65.17 nm, 61.79 nm, and 22.52%, respectively, which were 5.1 nm, 26.13 nm, 21.29 nm, and 6.20% higher than those at 28 days, respectively. This phenomenon can be explained as follows: with age, the hydration of cement continues to develop, and the hydration products gradually fill the voids in the concrete. Meanwhile, according to capillary tension theory, due to the consumption of water, capillary stress will be generated on the pore walls in the concrete. Under the action of capillary stress, the distance between concrete pore walls and micro-cracks decreases, which significantly contributes to the decrease in pore structure parameters.
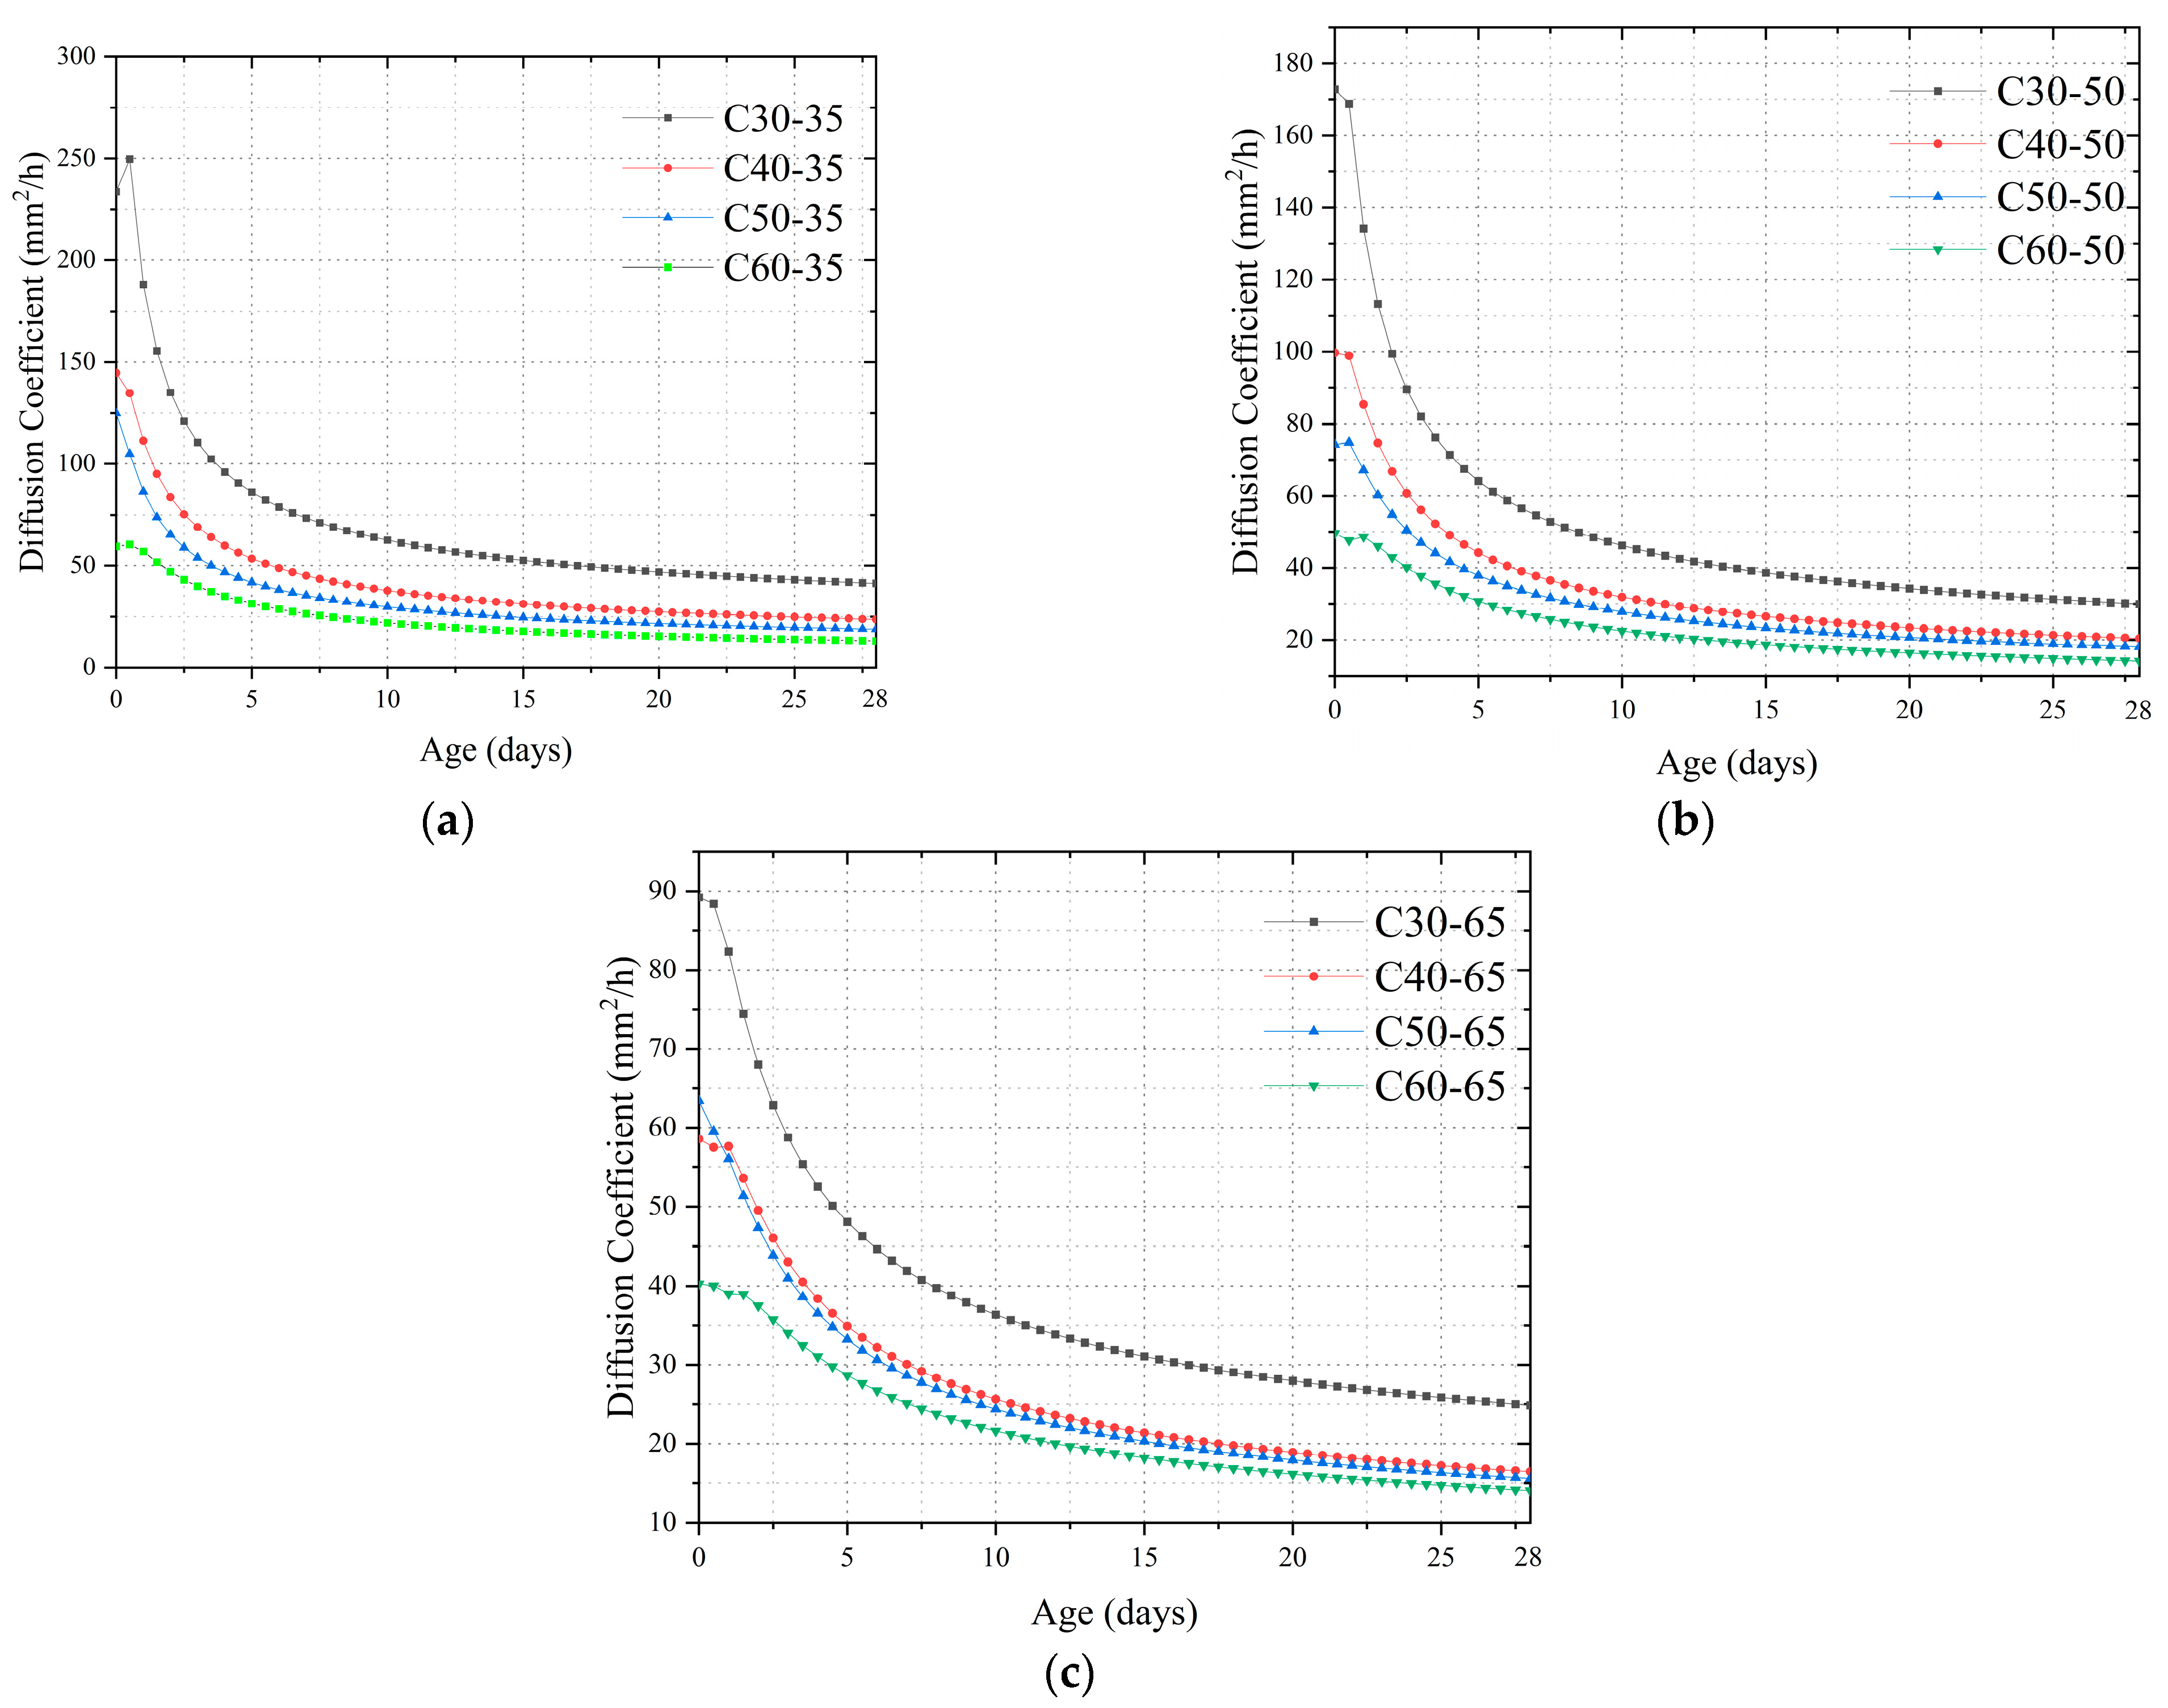
Figure 9 shows the relationship between reinforcement rate and pore structure parameters of concrete at 28 days. Noticeably, the pore structure parameters of concrete increase as the reinforcement ratio increases in concrete specimens of the same strength class. For example, the porosity of the C30-65 (ρ = 0%) concrete specimen at 28 days was 2.89, 5.29, and 7.52% lower than that of C30-65-1 (ρ = 0%), C30-65-3 (ρ = 0%), and C30-65-6 (ρ = 0%), respectively. This phenomenon was also observed in other pore structure parameters as well as in the specimens of the C60 group. This phenomenon is mainly due to the reinforcement hindering the reduction of the pore structure parameters of the concrete due to capillary pore stresses. At 3 days and 7 days of age, the above laws still hold.
When capillary pore stresses are generated in the internal pore walls of concrete due to water loss, the capillary stresses will result in a reduction in the pore wall size. In the restrained specimen, both the capillary stress and the restrained tensile stress generated by the reinforcement act on the pore wall due to the restraining effect of the reinforcement. The stress generated by concrete () in the restrained specimen can be expressed as follows:
where is the combined capillary pore stress acting on the pore wall, Es is the modulus of elasticity of concrete, Ere is the modulus of elasticity of steel reinforcement, ρ is the reinforcement ratio, μ is the Poisson’s ratio of concrete, and a and γ are calculation parameters. The above equation shows that the confining stress of the reinforcement increases with the increase in the reinforcement ratio. In this case, it will decrease the stress ensemble acting on the pore walls of the concrete. This indicates that the extent of decrease in the pore structure parameters of the concrete due to the action of capillary stresses decreases as the reinforcement ratio increases. This agrees with the experimental results that indicate that the pore structure size of the specimens increases with increasing reinforcement rate.
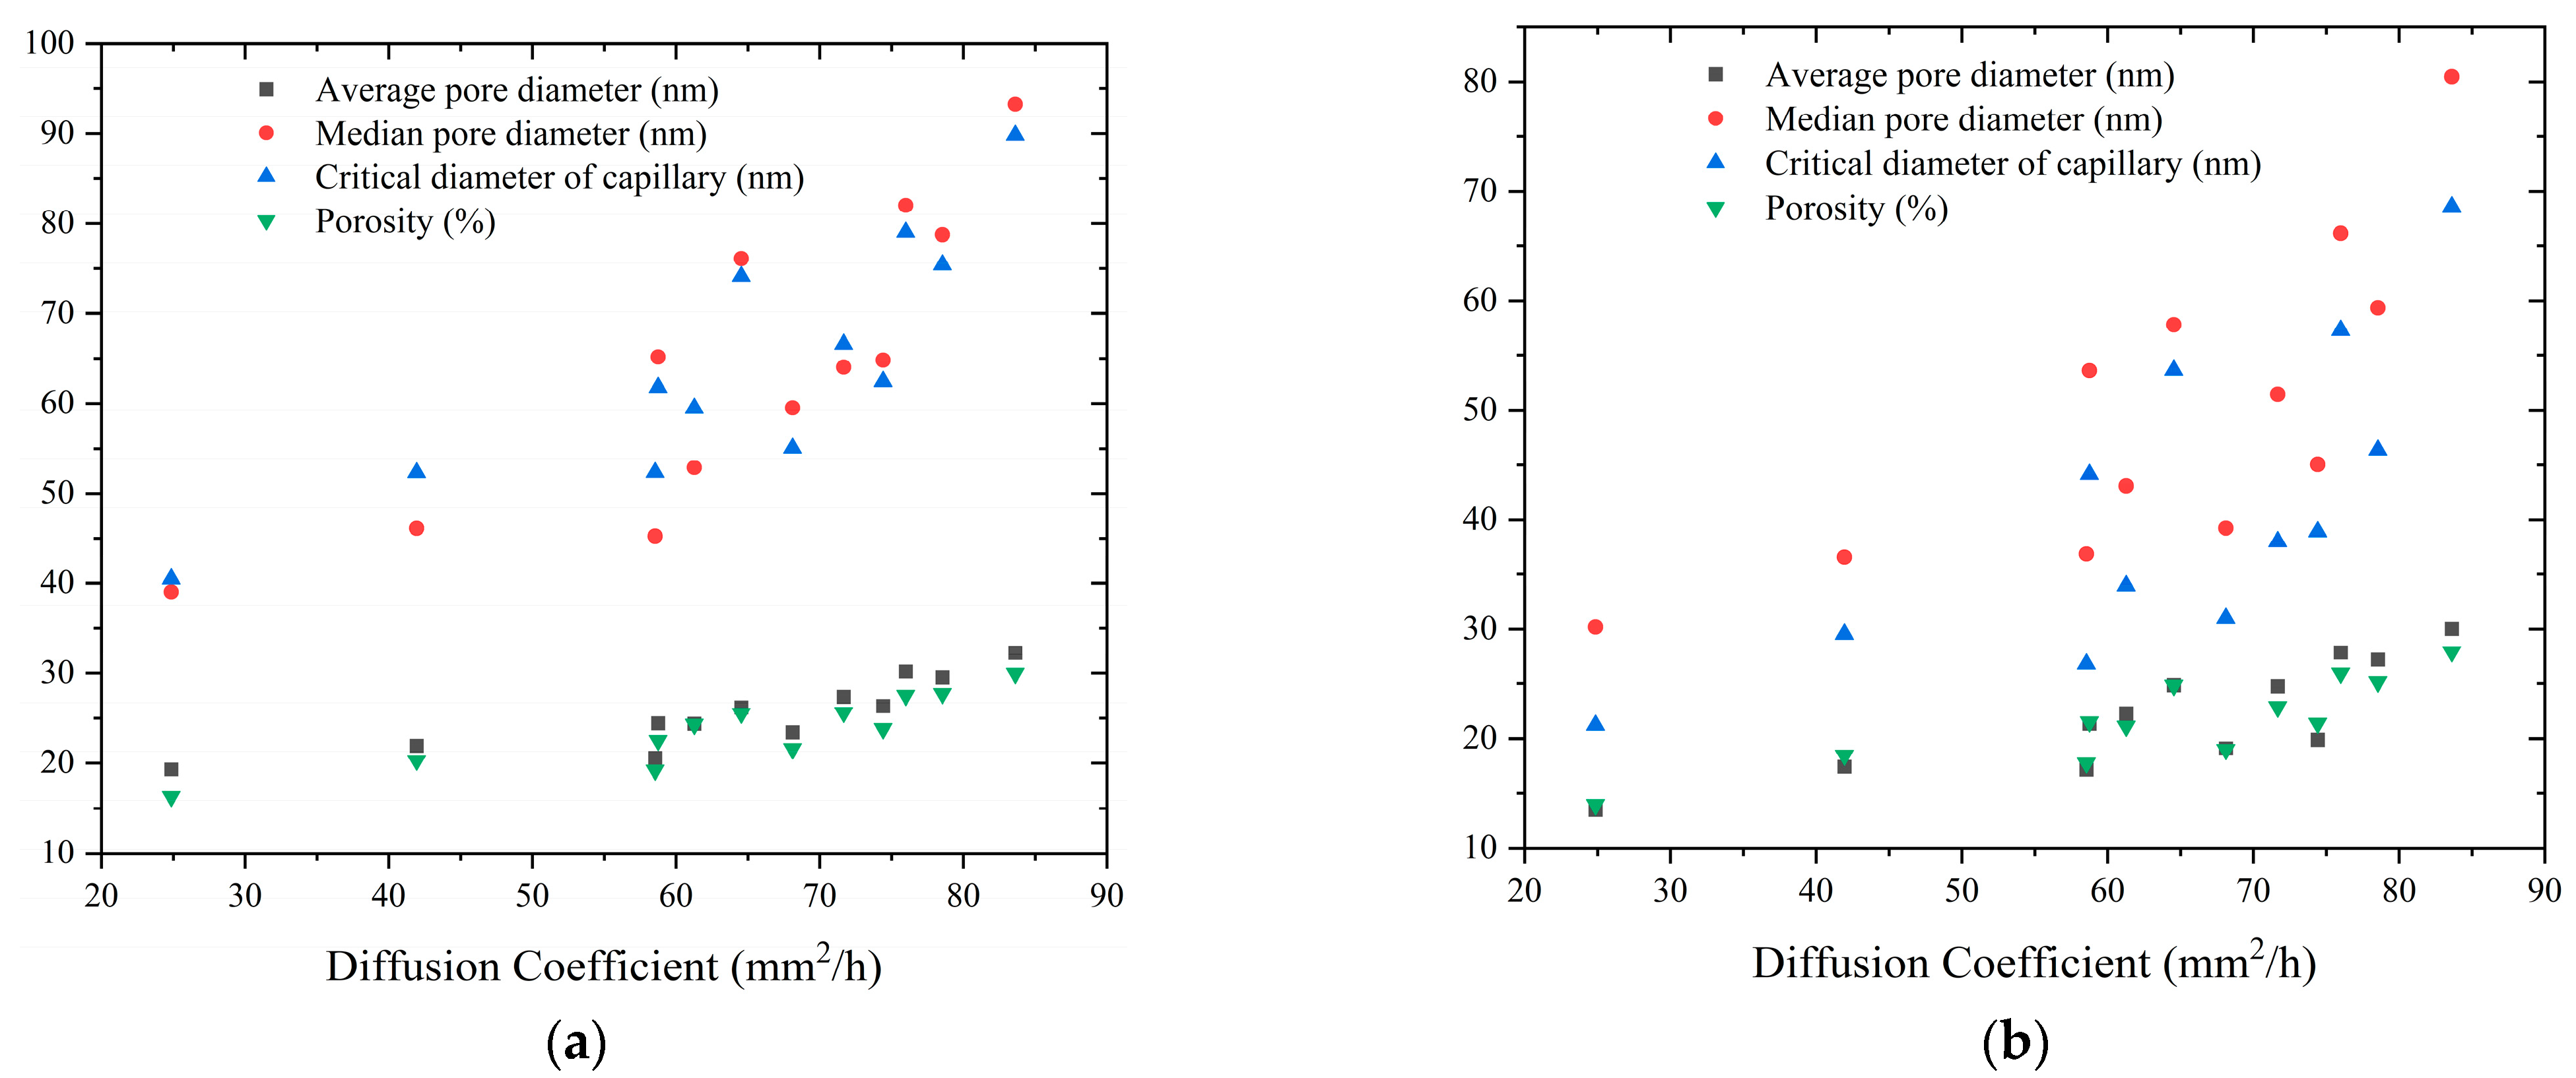
Figure 10 shows the relationship between the concrete pore structure parameters and the humidity diffusion coefficient, indicating that the humidity diffusion coefficient increases as the concrete pore structure parameters increase.
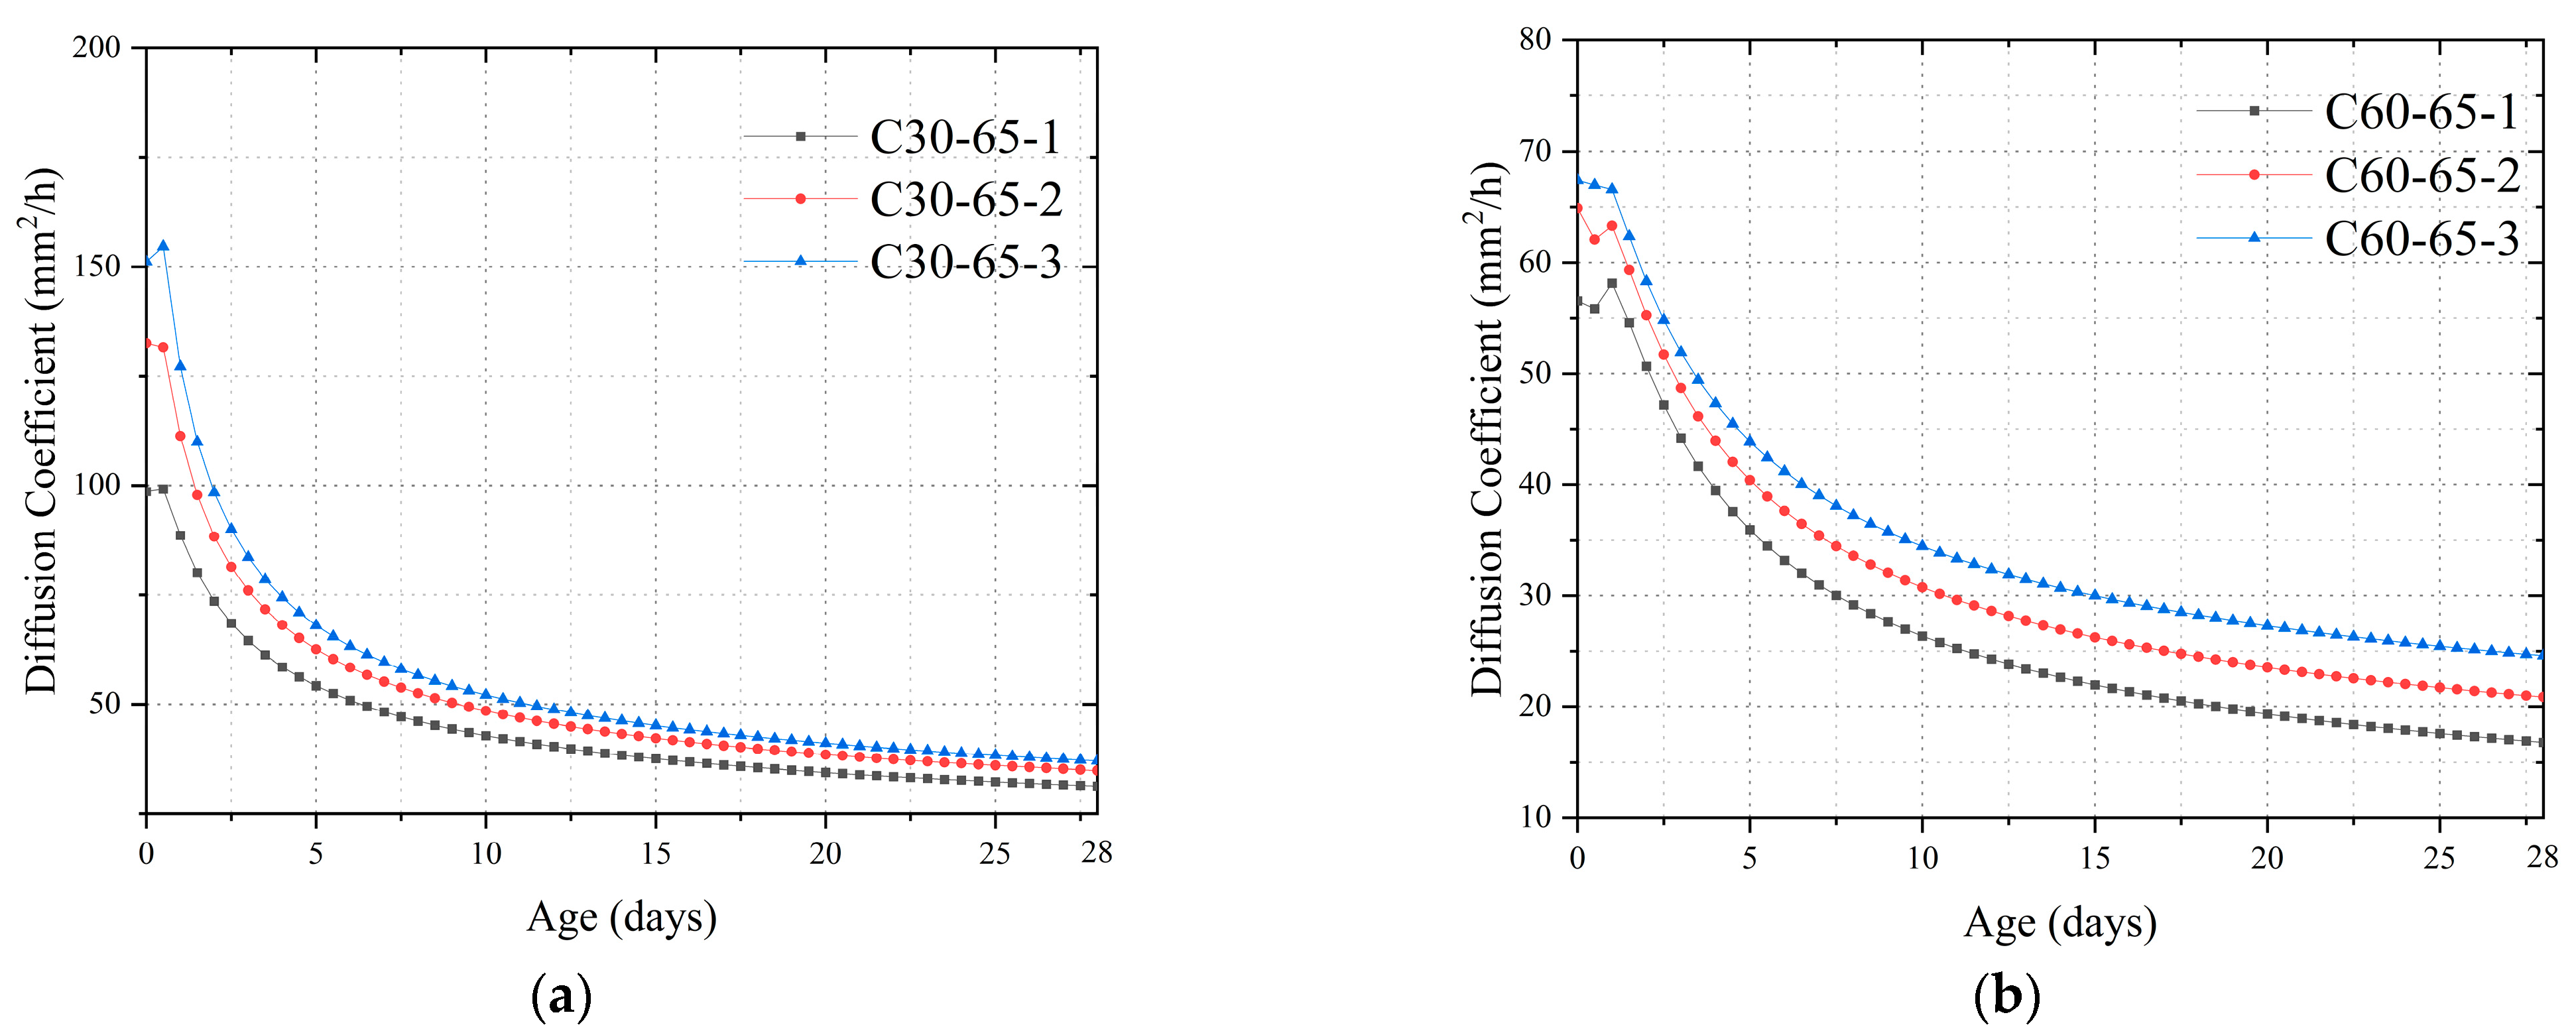
Because pores are the main channel for moisture diffusion in concrete, when the constraint affects the pore structure of concrete, it also affects its moisture diffusion capacity. Figure 11 shows the effect of different constraints (reinforcement ratio) on the moisture diffusion coefficient for the same external ambient humidity and concrete strength. The curve of the moisture diffusion coefficient of concrete with time shows that the higher the internal constraint of concrete, the higher the moisture diffusion coefficient of concrete at the same moment. Taking C30 concrete as an example, the moisture diffusion coefficient of the C30-65 (ρ = 0%) specimen at the age of 3 days was lower than that of C30-65-1 (ρ = 1.14%), C30-65-3 (ρ = 3.24%), and C30-65-3 (ρ = 6.56%) by 5.80 mm2/h, 34.05 mm2/h, and 51.13 mm2/h, respectively.
5. Conclusions
In this study, a method for calculating the internal humidity of concrete using the concrete humidity diffusion coefficient was theoretically derived. The internal humidity, pore structure parameters, and mechanical properties of concrete under different strength classes, curing conditions, and constraints were tested. The test results were used to investigate the influence laws of these conditions on the concrete humidity and humidity diffusion coefficient.
The following conclusions can be drawn from the results:
- The internal humidity of concrete varies with age. As the age increases, the internal humidity of concrete decreases and gradually stabilizes. Due to more intense hydration, the internal humidity of high-strength concrete decreases more rapidly under sealed conditions. The internal humidity of specimens under dry conditions decreases faster than that of sealed specimens due to the drying effect. For the same concrete strength class, the lower the external humidity and the higher the reinforcement rate, the faster the internal humidity of the concrete decreases.
- The moisture diffusion coefficient of concrete can be divided into a rapid decline phase (0–1 day), a slow decline phase (1–8 days), and a stabilization phase (after 8 days) as the age increases. Due to the existence of a humidity gradient, the lower the external environmental humidity, the higher the humidity diffusion coefficient of concrete for the same concrete strength class and reinforcement ratio, and the two exhibit a linear relationship. With the increase in age and concrete strength, the influence of external humidity on the humidity diffusion coefficient of concrete weakens. Meanwhile, along with the gradual decrease in the internal humidity of concrete, the humidity diffusion coefficient of concrete also gradually decreases, and it is more difficult for the water in concrete to be transmitted to the external environment.
- At the same age, high-strength concrete has smaller pore structure parameters, which makes transporting water in high-strength concrete difficult. As a result, the moisture diffusion coefficient of concrete decreases as the concrete strength class increases for the same external humidity and reinforcement ratio. The method proposed in this study for calculating the internal humidity of concrete using the humidity diffusion coefficient is accurate.
- Reinforcing bars create confining tensile stresses inside the concrete, which changes the pore structure inside the concrete. For the same concrete strength, the higher the reinforcement rate, the larger the pore structure parameters of concrete (average pore diameter, median pore diameter, critical diameter of capillary, and porosity). Because the pore structure is the main transport channel for water in concrete, the higher the reinforcement ratio, the greater the moisture diffusion coefficient of the concrete and the faster the moisture in the concrete decreases for the same external humidity and concrete strength.
Author Contributions
F.Z. and W.L.: Conceptualization, Investigation, Methodology, Data curation, Writing—original draft, Writing—review and editing, Formal analysis. L.H.: Supervision, Resources, Project administration, Funding acquisition Writing—original draft, Writing—review and editing, Visualization. Y.H., Z.X., J.Y., D.W. and Z.C.: Writing—original draft, Writing—review and editing. All authors have read and agreed to the published version of the manuscript.
Funding
This research received no external funding.
Data Availability Statement
Not applicable.
Acknowledgments
The authors acknowledge the financial support for publication fees by the School of Civil Engineering, Chongqing University, China. Additionally, the authors are very grateful to Lin Chen for his contribution to this paper.
Conflicts of Interest
The authors declare no conflict of interest.
References
- Krauss, P.D.; Rogalla, E.A. Transverse Cracking in Newly Constructed Bridge Decks; National Academy of Sciences: Washington, DC, USA, 1996. [Google Scholar]
- Chen, L.; Huang, L.; Hua, J.; Chen, Z.; Wei, L.; Osman, A.I.; Fawzy, S.; Rooney, D.W.; Dong, L.; Yap, P.-S. Green construction for low-carbon cities: A review. Environ. Chem. Lett. 2023, 21, 1627–1657. [Google Scholar] [CrossRef]
- Zhou, F.; Jiang, H.; Huang, L.; Hu, Y.; Xie, Z.; Zeng, Z.; Liu, M.; Wang, B.; Zhou, X. Early Shrinkage Modeling of Complex Internally Confined Concrete Based on Capillary Tension Theory. Buildings 2023, 13, 2201. [Google Scholar] [CrossRef]
- Huang, L.; Hua, J.; Kang, M.; Zhou, F.; Luo, Q. Capillary tension theory for predicting shrinkage of concrete restrained by reinforcement bar in early age. Constr. Build. Mater. 2019, 210, 63–70. [Google Scholar] [CrossRef]
- Tran, N.P.; Gunasekara, C.; Law, D.W.; Houshyar, S.; Setunge, S.; Cwirzen, A. A critical review on drying shrinkage mitigation strategies in cement-based materials. J. Build. Eng. 2021, 38, 102210. [Google Scholar] [CrossRef]
- Wang, X.; Song, P.; Yu, H.; Taylor, P.; Sadati, S.; Freeseman, K.; Ning, Y. Extended life concrete bridge decks utilizing internal curing to reduce cracking–Materials characterization and engineering demonstration. Constr. Build. Mater. 2021, 275, 122163. [Google Scholar] [CrossRef]
- Miao, Y.; Lu, Z.; Wang, F.; Wang, H.; Li, Y.; Lin, J.; Jiang, J. Shrinkage cracking evolvement in concrete cured under low relative humidity and its relationship with mechanical development. J. Build. Eng. 2023, 72, 106670. [Google Scholar] [CrossRef]
- Yu, S.; Sun, Z.; Qian, W.; Yu, J.; Yang, J. A meshless method for modeling the microscopic drying shrinkage cracking processes of concrete and its applications. Eng. Fract. Mech. 2023, 277, 109014. [Google Scholar] [CrossRef]
- Shen, D.; Kang, J.; Jiao, Y.; Li, M.; Li, C. Effects of different silica fume dosages on early-age behavior and cracking resistance of high strength concrete under restrained condition. Constr. Build. Mater. 2020, 263, 120218. [Google Scholar] [CrossRef]
- Klemczak, B.; Knoppik-Wróbel, A. Reinforced concrete tank walls and bridge abutments: Early-age behaviour, analytic approaches and numerical models. Eng. Struct. 2015, 84, 233–251. [Google Scholar] [CrossRef]
- Chen, L.; Chen, Z.; Zhang, Y.; Liu, Y.; Osman, A.I.; Farghali, M.; Hua, J.; Al-Fatesh, A.; Ihara, I.; Rooney, D.W. Artificial intelligence-based solutions for climate change: A review. Environ. Chem. Lett. 2023, 21, 2525–2557. [Google Scholar] [CrossRef]
- Chen, L.; Msigwa, G.; Yang, M.; Osman, A.I.; Fawzy, S.; Rooney, D.W.; Yap, P.-S. Strategies to achieve a carbon neutral society: A review. Environ. Chem. Lett. 2022, 20, 2277–2310. [Google Scholar] [CrossRef]
- Farghali, M.; Osman, A.I.; Mohamed, I.M.; Chen, Z.; Chen, L.; Ihara, I.; Yap, P.-S.; Rooney, D.W. Strategies to save energy in the context of the energy crisis: A review. Environ. Chem. Lett. 2023, 21, 2003–2039. [Google Scholar] [CrossRef] [PubMed]
- Deysel, R.C.; Boshoff, W.P.; Smit, M.S. Implementing capillary pressure control measures to prevent plastic shrinkage cracking in concrete. Constr. Build. Mater. 2023, 397, 132407. [Google Scholar] [CrossRef]
- Liang, S.; Liu, Y.; Song, G.; Yan, H.; Song, B.; Liu, J. Effect of sulfoaluminate expansive additive on mechanical properties, internal relative humidity, and shrinkage of early-age mortar. Case Stud. Constr. Mater. 2023, 19, e02226. [Google Scholar] [CrossRef]
- Wang, Y.; Zhu, J.; Guo, Y.; Wang, C. Early shrinkage experiment of concrete and the development law of its temperature and humidity field in natural environment. J. Build. Eng. 2023, 63, 105528. [Google Scholar] [CrossRef]
- Persson, B. Moisture in concrete subjected to different kinds of curing. Mater. Struct. 1997, 30, 533–544. [Google Scholar] [CrossRef]
- Kim, J.-K.; Lee, C.-S. Moisture diffusion of concrete considering self-desiccation at early ages. Cem. Concr. Res. 1999, 29, 1921–1927. [Google Scholar] [CrossRef]
- Nilsson, L.-O. Long-term moisture transport in high performance concrete. Mater. Struct. 2002, 35, 641–649. [Google Scholar] [CrossRef]
- Andrade, C.; Sarría, J.; Alonso, C. Relative humidity in the interior of concrete exposed to natural and artificial weathering. Cem. Concr. Res. 1999, 29, 1249–1259. [Google Scholar] [CrossRef]
- Parrott, L. Some effects of cement and curing upon carbonation and reinforcement corrosion in concrete. Mater. Struct. 1996, 29, 164–173. [Google Scholar] [CrossRef]
- Wang, J.; Li, H.; Wang, Z.; Yi, Z.; Huang, F. Humidity field and moisture transfer of concrete with different pre-saturated recycled sand. Constr. Build. Mater. 2023, 382, 131338. [Google Scholar] [CrossRef]
- Shen, D.; Liu, C.; Wang, M.; Jin, X.; Tang, H. Prediction model for internal relative humidity in early-age concrete under different curing humidity conditions. Constr. Build. Mater. 2020, 265, 119987. [Google Scholar] [CrossRef]
- Tazawa, E.-I.; Miyazawa, S. Influence of cement and admixture on autogenous shrinkage of cement paste. Cem. Concr. Res. 1995, 25, 281–287. [Google Scholar] [CrossRef]
- Tazawa, E.-I.; Miyazawa, S. Experimental study on mechanism of autogenous shrinkage of concrete. Cem. Concr. Res. 1995, 25, 1633–1638. [Google Scholar] [CrossRef]
- Aitcin, P.-C. Demystifying autogenous shrinkage. Concr. Int. 1999, 21, 54–56. [Google Scholar]
- Ni, W.-M. The Mathematics of Diffusion; SIAM: Philadelphie, PA, USA, 2011. [Google Scholar]
- Park, S.-S.; Kwon, S.-J.; Jung, S.H.; Lee, S.-W. Modeling of water permeability in early aged concrete with cracks based on micro pore structure. Constr. Build. Mater. 2012, 27, 597–604. [Google Scholar] [CrossRef]
- Linderoth, O.; Johansson, P.; Wadsö, L. Development of pore structure, moisture sorption and transport properties in fly ash blended cement-based materials. Constr. Build. Mater. 2020, 261, 120007. [Google Scholar] [CrossRef]
- Huang, L.M.; Tang, L.P.; Lofgren, I.; Olsson, N.; Yang, Z.H.; Li, Y.Q. Moisture and ion transport properties in blended pastes and their relation to the refined pore structure. Cem. Concr. Res. 2022, 161, 106949. [Google Scholar] [CrossRef]
- Bažant, Z.; Najjar, L. Nonlinear water diffusion in nonsaturated concrete. Matériaux Constr. 1972, 5, 3–20. [Google Scholar] [CrossRef]
- Ayano, T.; Wittmann, F.H. Drying, moisture distribution, and shrinkage of cement-based materials. Mater. Struct. 2002, 35, 134–140. [Google Scholar] [CrossRef]
- Sakata, K. A study on moisture diffusion in drying and drying shrinkage of concrete. Cem. Concr. Res. 1983, 13, 216–224. [Google Scholar] [CrossRef]
- Akita, H.; Fujiwara, T.; Ozaka, Y. A practical procedure for the analysis of moisture transfer within concrete due to drying. Mag. Concr. Res. 1997, 49, 129–137. [Google Scholar] [CrossRef]
- Ba, M.F.; Qian, C.X.; Gao, G.B. Nonlinear calculation of moisture transport in underground concrete. Comput. Concr. 2014, 13, 361–375. [Google Scholar] [CrossRef]
- Rahimi-Aghdam, S.; Rasoolinejad, M.; Bažant, Z.P. Moisture diffusion in unsaturated self-desiccating concrete with humidity-dependent permeability and nonlinear sorption isotherm. J. Eng. Mech. 2019, 145, 04019032. [Google Scholar] [CrossRef]
- Lin, G.; Liu, Y.; Xiang, Z. Numerical modeling for predicting service life of reinforced concrete structures exposed to chloride environments. Cem. Concr. Compos. 2010, 32, 571–579. [Google Scholar] [CrossRef]
- Wang, A.; Sun, D.; Deng, M.; Chen, X.; Zhang, F. Influence of restraint on pore structures and air permeability of concrete containing MgO-type expansive agent. Asian J. Chem. 2013, 25, 5532. [Google Scholar] [CrossRef]
- Zhang, R.; Wang, Q.; Ma, L. Relations between pore structure and creep characteristics of concrete under micro-expanding and lateral restraints. J. Chin. Ceram. Soc. 2015, 7, 585–593. [Google Scholar]
- Yoo, D.-Y.; Park, J.-J.; Kim, S.-W.; Yoon, Y.-S. Influence of reinforcing bar type on autogenous shrinkage stress and bond behavior of ultra high performance fiber reinforced concrete. Cem. Concr. Compos. 2014, 48, 150–161. [Google Scholar] [CrossRef]
- Sule, M.; van Breugel, K. The effect of reinforcement on early-age cracking due to autogenous shrinkage and thermal effects. Cem. Concr. Compos. 2004, 26, 581–587. [Google Scholar] [CrossRef]
- Huang, L.; Hua, J.; Kang, M.; Zhang, A. Influence of reinforcement configuration on the shrinkage and cracking potential of high-performance concrete. Constr. Build. Mater. 2017, 140, 20–30. [Google Scholar] [CrossRef]
- Yoo, D.-Y.; Park, J.-J.; Kim, S.-W.; Yoon, Y.-S. Early age setting, shrinkage and tensile characteristics of ultra high performance fiber reinforced concrete. Constr. Build. Mater. 2013, 41, 427–438. [Google Scholar] [CrossRef]
- Ming, K. Research on Restrained Deformation Properties of Reinforced Concrete Members due to Early Shrinkage during Construction. Ph.D. Thesis, Chongqing University, Chongqing, China, 2010. [Google Scholar]
- Radlinska, A.; Weiss, J. Quantifying variability in assessing the risk of early-age cracking in restrained concrete elements. In Brittle Matrix Composites 8; Elsevier: Amsterdam, The Netherlands, 2006; pp. 331–342. [Google Scholar]
- Zhang, J.; Huang, Y.; Qi, K.; Gao, Y. Interior relative humidity of normal-and high-strength concrete at early age. J. Mater. Civ. Eng. 2012, 24, 615–622. [Google Scholar] [CrossRef]
- Zhang, J.; Qi, K.; Huang, Y. Calculation of moisture distribution in early-age concrete. J. Eng. Mech. 2009, 135, 871–880. [Google Scholar] [CrossRef]
- Deboodt, T.; Fu, T.; Ideker, J.H. Evaluation of FLWA and SRAs on autogenous deformation and long-term drying shrinkage of high performance concrete. Constr. Build. Mater. 2016, 119, 53–60. [Google Scholar] [CrossRef]
- Shen, D.; Liu, K.; Ji, Y.; Shi, H.; Zhang, J. Early-age residual stress and stress relaxation of high-performance concrete containing fly ash. Mag. Concr. Res. 2018, 70, 726–738. [Google Scholar] [CrossRef]
- GB/T50081-2002; Standard for Test Method of Mechanical Properties on Ordinary Concrete. Ministry of Construction of the People’s Republic of China and General Administration of Quality Supervision. Inspection and Quarantine of the People’s Republic of China: Beijing, China, 2003.
Figure 1.
RH test setup for the concrete (all the dimensions are in mm).

Figure 2.
Changes in the internal humidity of concrete: (a) C30; (b) C40; (c) C50; (d) C60.

Figure 3.
Development of the moisture diffusion coefficient of concrete with age: (a) C30; (b) C40; (c) C50; (d) C60.
Figure 3.
Development of the moisture diffusion coefficient of concrete with age: (a) C30; (b) C40; (c) C50; (d) C60.

Figure 4.
Relationship between moisture diffusion coefficient and external humidity: (a) C30; (b) C40; (c) C50; (d) C60.
Figure 4.
Relationship between moisture diffusion coefficient and external humidity: (a) C30; (b) C40; (c) C50; (d) C60.

Figure 5.
Development of diffusion coefficients of drying components at different internal humidities: (a) C30; (b) C40; (c) C50; (d) C60.
Figure 5.
Development of diffusion coefficients of drying components at different internal humidities: (a) C30; (b) C40; (c) C50; (d) C60.

Figure 6.
Comparison of calculated and actual internal humidity values of concrete without constraint conditions: (a) C30-65; (b) C40-65; (c) C50-65; (d) C60-65; (e) C30-50; (f) C40-50; (g) C50-50; (h) C60-50; (i) C30-35; (j) C40-35; (k) C50-35; (l) C60-35.
Figure 6.
Comparison of calculated and actual internal humidity values of concrete without constraint conditions: (a) C30-65; (b) C40-65; (c) C50-65; (d) C60-65; (e) C30-50; (f) C40-50; (g) C50-50; (h) C60-50; (i) C30-35; (j) C40-35; (k) C50-35; (l) C60-35.


Figure 7.
Comparison of calculated and actual internal humidity values of concrete under constraint conditions: (a) C30-65-1; (b) C30-65-3; (c) C30-65-6; (d) C60-65-1; (e) C60-65-3; (f) C60-65-6.
Figure 7.
Comparison of calculated and actual internal humidity values of concrete under constraint conditions: (a) C30-65-1; (b) C30-65-3; (c) C30-65-6; (d) C60-65-1; (e) C60-65-3; (f) C60-65-6.


Figure 8.
Effect of different concrete strengths on the humidity diffusion coefficient for the same external ambient humidity: (a) RH = 35%; (b) RH = 50%; (c) RH = 65%.
Figure 8.
Effect of different concrete strengths on the humidity diffusion coefficient for the same external ambient humidity: (a) RH = 35%; (b) RH = 50%; (c) RH = 65%.

Figure 9.
Relationship between reinforcement ratio and pore structure parameters at 28 days: (a) C30; (b) C60.
Figure 9.
Relationship between reinforcement ratio and pore structure parameters at 28 days: (a) C30; (b) C60.

Figure 10.
Relationship between concrete pore structure parameters and humidity diffusion coefficient: (a) C30; (b) C60.
Figure 10.
Relationship between concrete pore structure parameters and humidity diffusion coefficient: (a) C30; (b) C60.

Figure 11.
Relationship between constraint conditions and diffusion coefficients: (a) C30; (b) C60.


Table 1.
Concrete mix proportion.
| Concrete | Cement (kg/m3) | Water (kg/m3) | Fly Ash (kg/m3) | Sand (kg/m3) | Coarse Aggregate (kg/m3) | Water Reducing Agent (kg/m3) |
|---|---|---|---|---|---|---|
| C30 | 336 | 195 | 69 | 705 | 1094 | 9.9 |
| C40 | 365 | 185 | 65 | 685 | 1090 | 10.4 |
| C50 | 394 | 175 | 61 | 665 | 1086 | 10.9 |
| C60 | 423 | 166 | 58 | 645 | 1083 | 11.4 |
Table 2.
Chemical compositions and physical properties of the cementitious materials.
| Composition (%) | Cement | Fly Ash |
|---|---|---|
| SiO2 | 21.47 | 49.47 |
| CaO | 65.77 | 4.45 |
| Al2O3 | 5.47 | 20.67 |
| Fe2O3 | 4.28 | 14.32 |
| MgO | 1.44 | 1.17 |
| SO3 | 0.52 | 1.40 |
Table 3.
Basic mechanical properties of concrete.
| Basic Properties | Concrete Strength | Curing Condition | Age (Days) | ||
|---|---|---|---|---|---|
| 3 | 7 | 28 | |||
| Cube compressive strength (MPa) | C30 | Dry | 15.3 | 21.3 | 34.5 |
| Sealed | 17.1 | 21.4 | 39.5 | ||
| C40 | Dry | 25.1 | 31.0 | 45.4 | |
| Sealed | 27.0 | 32.0 | 48.5 | ||
| C50 | Dry | 34.0 | 40.6 | 55.0 | |
| Sealed | 36.5 | 42.0 | 56.5 | ||
| C60 | Dry | 44.0 | 53.0 | 63.0 | |
| Sealed | 46.5 | 59.4 | 68.0 | ||
| Splitting tensile strength (MPa) | C30 | Dry | 2.2 | 3.7 | 4.3 |
| Sealed | 2.4 | 4.1 | 4.4 | ||
| C40 | Dry | 2.5 | 4.1 | 4.7 | |
| Sealed | 2.7 | 4.2 | 4.7 | ||
| C50 | Dry | 2.9 | 4.4 | 5.0 | |
| Sealed | 3.1 | 4.5 | 5.1 | ||
| C60 | Dry | 3.4 | 4.7 | 5.4 | |
| Sealed | 3.5 | 4.9 | 5.6 | ||
| Static modulus of elasticity (×104 MPa) | C30 | Dry | 1.6 | 1.7 | 2.9 |
| Sealed | 1.7 | 2.0 | 2.9 | ||
| C40 | Dry | 1.8 | 2.1 | 3.0 | |
| Sealed | 1.6 | 2.2 | 3.0 | ||
| C50 | Dry | 2.0 | 2.3 | 3.1 | |
| Sealed | 2.1 | 2.4 | 3.2 | ||
| C60 | Dry | 2.5 | 2.5 | 3.2 | |
| Sealed | 2.4 | 2.6 | 3.4 | ||
Table 4.
List of experiments under unconstrained conditions.
| No. | Concrete Strength | External Humidity (%) | Curing Condition |
|---|---|---|---|
| C30-35 | C30 | 35 | Dry |
| C30-50 | C30 | 50 | Dry |
| C30-65 | C30 | 65 | Dry |
| C30-Sealed | C30 | - | Sealed |
| C40-35 | C40 | 35 | Dry |
| C40-50 | C40 | 50 | Dry |
| C40-65 | C40 | 65 | Dry |
| C40-Sealed | C40 | - | Sealed |
| C50-35 | C50 | 35 | Dry |
| C50-50 | C50 | 50 | Dry |
| C50-65 | C50 | 65 | Dry |
| C50-Sealed | C50 | - | Sealed |
| C60-35 | C60 | 35 | Dry |
| C60-50 | C60 | 50 | Dry |
| C60-65 | C60 | 65 | Dry |
| C60-Sealed | C60 | - | Sealed |
Table 5.
List of experiments under constraints.
| No. | Concrete Strength | External Humidity (%) | Reinforcement Ratio (%) | Curing Condition | Reinforcement Bar Diameter (mm) |
|---|---|---|---|---|---|
| C30-65-1 | C30 | 65 | 1.14 | Dry | 12 |
| C30-65-3 | C30 | 65 | 3.24 | Dry | 20 |
| C30-65-6 | C30 | 65 | 6.56 | Dry | 28 |
| C60-65-1 | C60 | 65 | 1.14 | Dry | 12 |
| C60-65-3 | C60 | 65 | 3.24 | Dry | 20 |
| C60-65-6 | C60 | 65 | 6.56 | Dry | 28 |
Table 6.
Calculation model parameters.
| No. | H0 | a | b | c | d | Average Fitting Error |
|---|---|---|---|---|---|---|
| C30-35 | 98.7 | 0.020 | 8.1 | 3.8 | 1.7 | 1.1% |
| C30-50 | 98.5 | 0.014 | 7.6 | 3.5 | 1.9 | 0.3% |
| C30-65 | 99.0 | 0.015 | 16 | 4.5 | 2.3 | 2.1% |
| C40-35 | 98.5 | 0.015 | 8.5 | 3.0 | 2.0 | 0.9% |
| C40-50 | 98.5 | 0.010 | 16.0 | 3.6 | 2.4 | 4.6% |
| C40-65 | 98.6 | 0.013 | 21.0 | 3.5 | 2.6 | 6.5% |
| C50-35 | 99.1 | 0.005 | 40.0 | 4.0 | 2.8 | 1.4% |
| C50-50 | 98.5 | 0.008 | 18.0 | 3.8 | 2.6 | 0.7% |
| C50-65 | 98.6 | 0.009 | 20.0 | 3.5 | 2.7 | 4.1% |
| C60-35 | 98.8 | 0.010 | 15.0 | 2.5 | 2.6 | 2.9% |
| C60-50 | 99.4 | 0.012 | 15.0 | 3.0 | 2.6 | 3.1% |
| C60-65 | 99.6 | 0.015 | 15.0 | 3.2 | 2.6 | 5.2% |
| C30-65-1 | 98.5 | 0.011 | 15.0 | 6.0 | 2.3 | 6.2% |
| C30-65-3 | 99.4 | 0.010 | 19.0 | 6.0 | 2.3 | 4.2% |
| C30-65-6 | 99.5 | 0.011 | 25.0 | 6.0 | 2.3 | 2.2% |
| C60-65-1 | 98.5 | 0.016 | 10.0 | 3.0 | 2.3 | 0.05% |
| C60-65-3 | 99.0 | 0.016 | 12.0 | 4.0 | 2.3 | 2.9% |
| C60-65-6 | 99.0 | 0.015 | 13.0 | 5.0 | 2.3 | 5.6% |
Table 7.
Pore characteristic parameters of specimens.
| Age (Days) | Average Pore Diameter (nm) | Median Pore Diameter (nm) | Critical Diameter of Capillary (nm) | Porosity (%) | D (mm2/h) | |
|---|---|---|---|---|---|---|
| C30-65 | 3 | 24.45 | 65.17 | 61.79 | 22.52 | 13.21 |
| 7 | 21.94 | 46.13 | 52.30 | 20.32 | 10.24 | |
| 28 | 19.30 | 39.04 | 40.50 | 16.32 | 14.92 | |
| C30-65-1 | 3 | 26.20 | 76.10 | 74.12 | 25.54 | 12.96 |
| 7 | 24.39 | 52.88 | 59.49 | 24.31 | 11.75 | |
| 28 | 20.58 | 45.25 | 52.34 | 19.21 | 13.19 | |
| C30-65-3 | 3 | 30.17 | 82.02 | 79.03 | 27.56 | 11.22 |
| 7 | 27.41 | 64.04 | 66.60 | 25.64 | 11.34 | |
| 28 | 23.42 | 59.51 | 55.07 | 21.61 | 15.45 | |
| C30-65-6 | 3 | 32.26 | 93.27 | 89.82 | 29.97 | 8.88 |
| 7 | 29.53 | 78.76 | 75.43 | 27.75 | 13.72 | |
| 28 | 26.35 | 64.83 | 62.46 | 23.84 | 16.31 | |
| C60-65 | 3 | 21.35 | 53.61 | 44.13 | 21.52 | 10.08 |
| 7 | 17.41 | 36.53 | 29.55 | 18.47 | 17.80 | |
| 28 | 13.50 | 30.19 | 21.23 | 13.94 | 28.67 | |
| C60-65-1 | 3 | 24.87 | 57.81 | 53.65 | 24.83 | 13.30 |
| 7 | 22.28 | 43.07 | 33.95 | 21.13 | 20.58 | |
| 28 | 17.14 | 36.83 | 26.78 | 17.74 | 17.25 | |
| C60-65-3 | 3 | 27.85 | 66.13 | 57.29 | 25.94 | 11.89 |
| 7 | 24.75 | 51.46 | 37.99 | 22.88 | 17.49 | |
| 28 | 19.10 | 39.23 | 31.00 | 19.01 | 19.84 | |
| C60-65-6 | 3 | 30.01 | 80.45 | 68.58 | 27.92 | 7.88 |
| 7 | 27.20 | 59.36 | 46.34 | 25.15 | 8.59 | |
| 28 | 19.90 | 45.04 | 38.91 | 21.41 | 12.69 |
Disclaimer/Publisher’s Note: The statements, opinions and data contained in all publications are solely those of the individual author(s) and contributor(s) and not of MDPI and/or the editor(s). MDPI and/or the editor(s) disclaim responsibility for any injury to people or property resulting from any ideas, methods, instructions or products referred to in the content. |
© 2023 by the authors. Licensee MDPI, Basel, Switzerland. This article is an open access article distributed under the terms and conditions of the Creative Commons Attribution (CC BY) license (https://creativecommons.org/licenses/by/4.0/).
Share and Cite
MDPI and ACS Style
Zhou, F.; Li, W.; Hu, Y.; Huang, L.; Xie, Z.; Yang, J.; Wu, D.; Chen, Z. Moisture Diffusion Coefficient of Concrete under Different Conditions. Buildings 2023, 13, 2421. https://0-doi-org.brum.beds.ac.uk/10.3390/buildings13102421
AMA Style
Zhou F, Li W, Hu Y, Huang L, Xie Z, Yang J, Wu D, Chen Z. Moisture Diffusion Coefficient of Concrete under Different Conditions. Buildings. 2023; 13(10):2421. https://0-doi-org.brum.beds.ac.uk/10.3390/buildings13102421
Chicago/Turabian StyleZhou, Fengbin, Wenhao Li, Ying Hu, Lepeng Huang, Zhuolin Xie, Jun Yang, Daifeng Wu, and Zhonghao Chen. 2023. "Moisture Diffusion Coefficient of Concrete under Different Conditions" Buildings 13, no. 10: 2421. https://0-doi-org.brum.beds.ac.uk/10.3390/buildings13102421
Note that from the first issue of 2016, this journal uses article numbers instead of page numbers. See further details here.