Article

Early Shrinkage Modeling of Complex Internally Confined Concrete Based on Capillary Tension Theory

1
School of Civil Engineering, Chongqing University, Chongqing 400045, China
2
Chongqing Urban Investment Infrastructure Construction Co., Ltd., Chongqing 400045, China
3
China Metallurgical Construction Engineering Group Co., Ltd., Chongqing 400084, China
4
Department of Civil Engineering, Xi’an Jiaotong-Liverpool University, Suzhou 215123, China
*
Author to whom correspondence should be addressed.
Submission received: 8 August 2023 / Revised: 25 August 2023 / Accepted: 26 August 2023 / Published: 29 August 2023
(This article belongs to the Special Issue Research on the Crack Control of Concrete)

Abstract

:
This paper evaluates the shrinkage performance of concrete under complex internal constraint environments comprising steel plates, studs, and reinforcement to investigate their respective influence laws on the shrinkage performance of concrete. An early shrinkage model of concrete under complex internal constraints was established based on the theory of capillary tension, and the effects of steel plate, nails, and steel reinforcement on the shrinkage performance of concrete were theoretically analyzed. Six sets of concrete-constrained shrinkage tests and pore structure tests were then performed under different internal constraint conditions with the steel plate thickness, reinforcement diameter, and stud-related parameters (stud diameter, height, and spacing) as research variables. The test results demonstrate that the pore structure of concrete increases with the increase in the constraint coefficient, and that the increase in the pore structure will cause a decrease in the capillary pore stress, which is the driving force of concrete shrinkage. Its decrease will inevitably lead to a decrease in concrete shrinkage. By comparing the calculated values of the shrinkage model with the measured values, it is found that the average value of the prediction error is less than 15%, which reveals that the predicted values of shrinkage are in good agreement with the measured values and proves that the model can effectively predict the shrinkage of concrete that is restrained by steel plates, pins, and reinforcing bars.

1. Introduction

In recent years, steel plate–concrete shear walls have been widely used in buildings in high-intensity seismic zones because of their full hysteresis curve and high energy dissipation capacity [1,2,3]. The structural system in which they are used is very wide and can be mainly categorized into the following four structural systems: frame-core, frame tube-core, mega-frame-core, and mega-frame-core-mega bracing [4]. The core portion in the above four systems is generally composed of steel–concrete combined shear walls. Despite its engineering applications, the tendency of the steel–concrete combined shear wall toward shrinkage cracking is being gradually realized. Researchers in various countries have also conducted extensive research on steel–concrete combined shear wall cracking problems over the past decades, but the main direction of research is the structural form of the steel–concrete combined shear wall as well as research into their force performance [5,6]. Existing steel–concrete combined shear wall cracking analysis and control is based on the reinforced concrete structure of cracking as established from actual projects. However, this cracking control method is unsatisfactory, steel–concrete combined shear wall cracks occur prominently in the early stage as the concrete cracks at that stage severely affect the waterproofing of the building, leading to corrosion and other effects that result in these early-stage steel–concrete combined shear wall cracks [7]. This further reduces the structural bearing capacity of the steel–concrete combined shear wall, and, if the cracks progress beyond a certain extent, the durability of the structure will be fully compromised. Theoretically, the steel plate–concrete combination shear wall withstands less than the normal load in the early stage, so its early cracking is mostly caused by deformation. Non-load cracks occur in concrete at an early stage mainly due to the early shrinkage of concrete and the limitation in its shrinkage due to the corresponding internal and external constraints.
As the water in the concrete is gradually consumed by hydration and drying, capillary pore stresses will occur in the pores of the concrete [8]. The stresses cause the distance between particles within the concrete to decrease, resulting in a macroscopic decrease in the volume of the concrete, a phenomenon known as shrinkage [9]. Concrete shrinkage deformation in the early stage is subjected to the external constraints of the neighboring components. The concrete will be subjected to constrained tensile stresses internally because the internal reinforcing bars, steel plates, and other constraining components will not produce shrinkage deformation. Meanwhile, because the early tensile strength of the concrete is not high, when the constrained tensile stress exceeds the tensile strength of concrete, cracks are produced [10,11]. On the one hand, from the point of view of shrinkage deformation, and due to the high structural performance requirements for steel plate–concrete combined shear walls in many projects, high-strength concrete (C60 and above strength grade) is often used in the steel plate–concrete combined shear wall. The water–cement ratio of high-strength concrete is lower than that in weaker concretes, leading to the resulting shrinkage deformation in its early stage being more significant than that of ordinary concrete [12]. On the other hand, from the perspective of internal constraints, the steel plate–concrete combined shear wall is arranged with dense reinforcement, bolts, and steel plates, which leads to stronger internal constraints for the contraction deformation of high-strength concrete [13]. Under such strong internal constraints, high-strength concrete is subject to stronger internal constraints on tensile stresses, which is one of the reasons for the cracking problem in steel–concrete combined shear walls.
Researchers have conducted a series of studies on the confined shrinkage of concrete. For example, Doo-YeolYoo et al. [14] studied the effects of shrinkage reducers and different reinforcement ratios on the shrinkage properties of ultra-high performance fiber-reinforced concrete (UHPFRC). The results of the study revealed that the shrinkage stress of UHPFRC with a low reinforcement ratio was lower, and using more shrinkage reducers could effectively reduce the shrinkage stress of UHPFRC. Shen Dejian et al. [15] conducted a related study on the effects of curing temperature on the shrinkage properties of high-strength concrete. Their results demonstrate that the shrinkage deformation of high-strength concrete under 100% constraint increased with the increase in curing temperature, and the risk of cracking increased. Ehsan Negahban et al. [16] studied the restrained shrinkage and creep behaviors of geopolymer concrete (GPC). Their results demonstrate that GPC had 38–57% less restrained shrinkage than normal concrete. Inamullah Khan et al. [17] conducted a series of experiments to assess the influences of early-age shrinkage on cracking in reinforced-concrete (RC) members subjected to internal restraint and found that the magnitude of the restrained shrinkage depends on the reinforcement ratio. Some researchers [18] experimentally studied the effects of various admixtures, including expansion agents, internal curing agents, and internal curing agent compounding, on the early shrinkage and cracking of concrete based on early flat-plate constrained cracking. Huang L et al. [19] investigated the effects of steel plates and pins on the shrinkage properties and cracking properties of high-strength concrete and found that the thickness of steel plates and their modulus of elasticity lead to an increase in the shrinkage and deformation of high-strength concrete. Moreover, the risk of cracking increased with the modulus of elasticity, whereas the inhibition of concrete shrinkage by the steel plate decreased with the increase in the distance between the concrete and the steel plate. Further, the cracking of high-strength concrete subjected to steel plate and studs may start from the bottom and develop along the boundary of the studs.
These results of concrete-constrained shrinkage reveal the way that scholars are becoming increasingly concerned to study the shrinkage performance of concrete under various constrained states, and the factors studied have included admixtures, curing conditions, mineral admixtures, and internal and external constraints. Further, constrained tests tend to increasingly involve uniaxial constrained tests to quantitatively analyze the shrinkage performance of constrained concrete as a method of predicting its risk of cracking [20,21,22]. However, the current research on the internal restraint of concrete focuses on the internal restraint of steel reinforcement by considering the influence of reinforcement rate, elastic modulus of steel reinforcement, and reinforcement method on the shrinkage performance of concrete. However, in an actual steel plate–concrete combined shear wall, not only is the internal restraint of steel reinforcement present, but the complex internal restraint of a steel plate, spigot, and steel reinforcement exists. However, research on the shrinkage performance of concrete under this type of complex internal restraint is lacking. Therefore, more research on this type of complex internal constraint is needed.
In this study, a strain analysis model of concrete under complex constraints of steel plates, bolts, and steel bars was established first based on the theory of capillary tension. Subsequently, experiments were conducted to explore the shrinkage deformation ability of concrete under internal constraints (steel plates, bolts, and steel bars). The main variables of the experiment were steel plate thickness, steel bar diameter, bolt diameter, bolt spacing, and bolt length. The experiments include basic mechanical, restrained shrinkage, and pore structure tests. Using the above data, the influence of steel plates, bolts, and steel bars on the restraint capacity of concrete shrinkage was analyzed, and the correctness and applicability of the established theoretical model were verified.

2. Experimental Design

2.1. Concrete Mixing Ratio

High-strength concrete (C60) was used to make the specimens. The cementitious materials used to configure the concrete specimens contained P.O 42.5R ordinary silicate cement and Chengdu Bolei Class I fly ash. Pebble gravel with a maximum nominal size of 31.5 mm was used as coarse aggregate, and pebble mechanism medium sand was used as fine aggregate. Zhongjian polyhydroxylic acid high-efficiency water reducer ZJC-01 was used as an additive. This is a colorless transparent or light-yellow liquid with a pH of 6–7, a water reduction rate of 40%, and an apparent viscosity of 675 mPa.S. The concrete mix ratio is presented in Table 1.

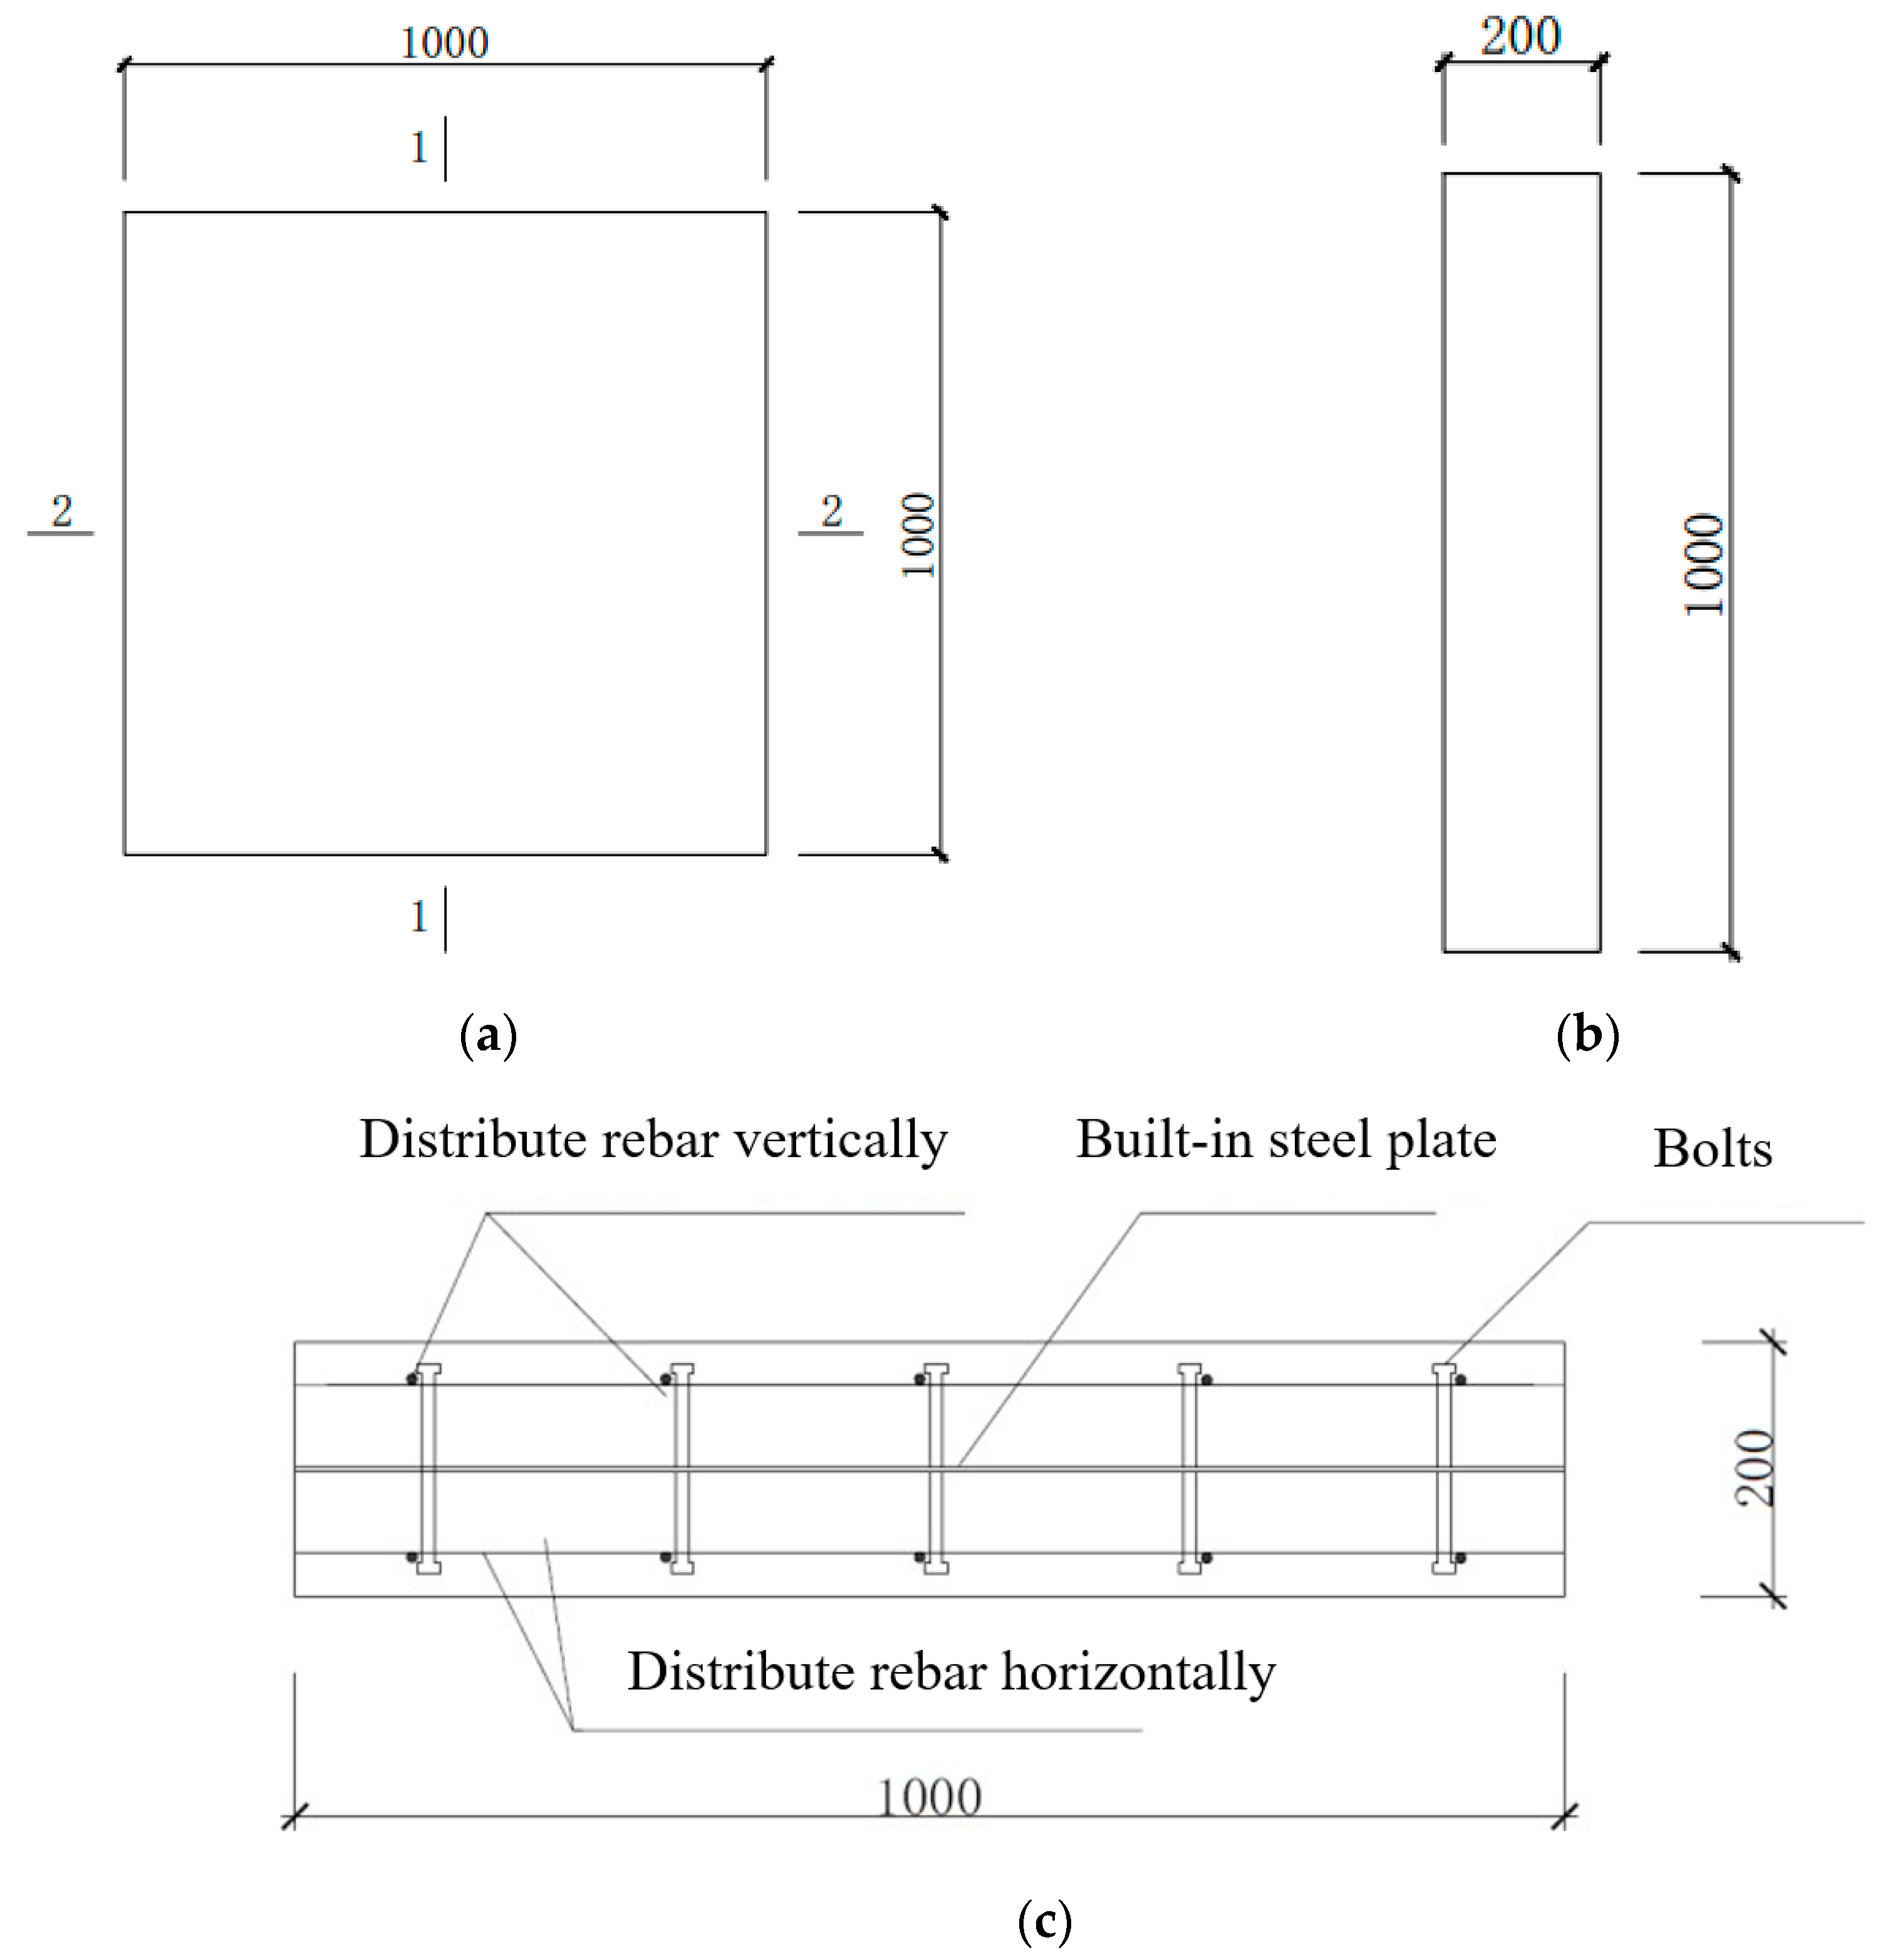
2.2. Specimen Design

The specimens used in the test had the dimensions of an actual steel plate–concrete shear wall and a similar arrangement of the internal restraining members, which was designed based on the JGJT 380-2015 [23], GB 50010-2010 (2015 edition) [24], JGJ 3-2010 [25], and JGJ 138-2016 [26] with GB 50011-2010 (2016 edition) [27].
To study the effect of the steel plate, spigot, and steel reinforcement on the shrinkage properties of concrete, six internally restrained concrete specimens and one plain concrete specimen were designed based on the “basic analysis mold” proposed in Section 3.1 of this article. The height of the specimens was 1000 mm, the cross-section size was 1000 × 200 mm, and the span-to-height ratio was 1.0, whereas the size of the steel plate was 1000 × 1000 mm (see Figure 1a,b), and the S1 specimen parameter design is as follows:
  • Steel strength is Q235B, and thickness is 10 mm;
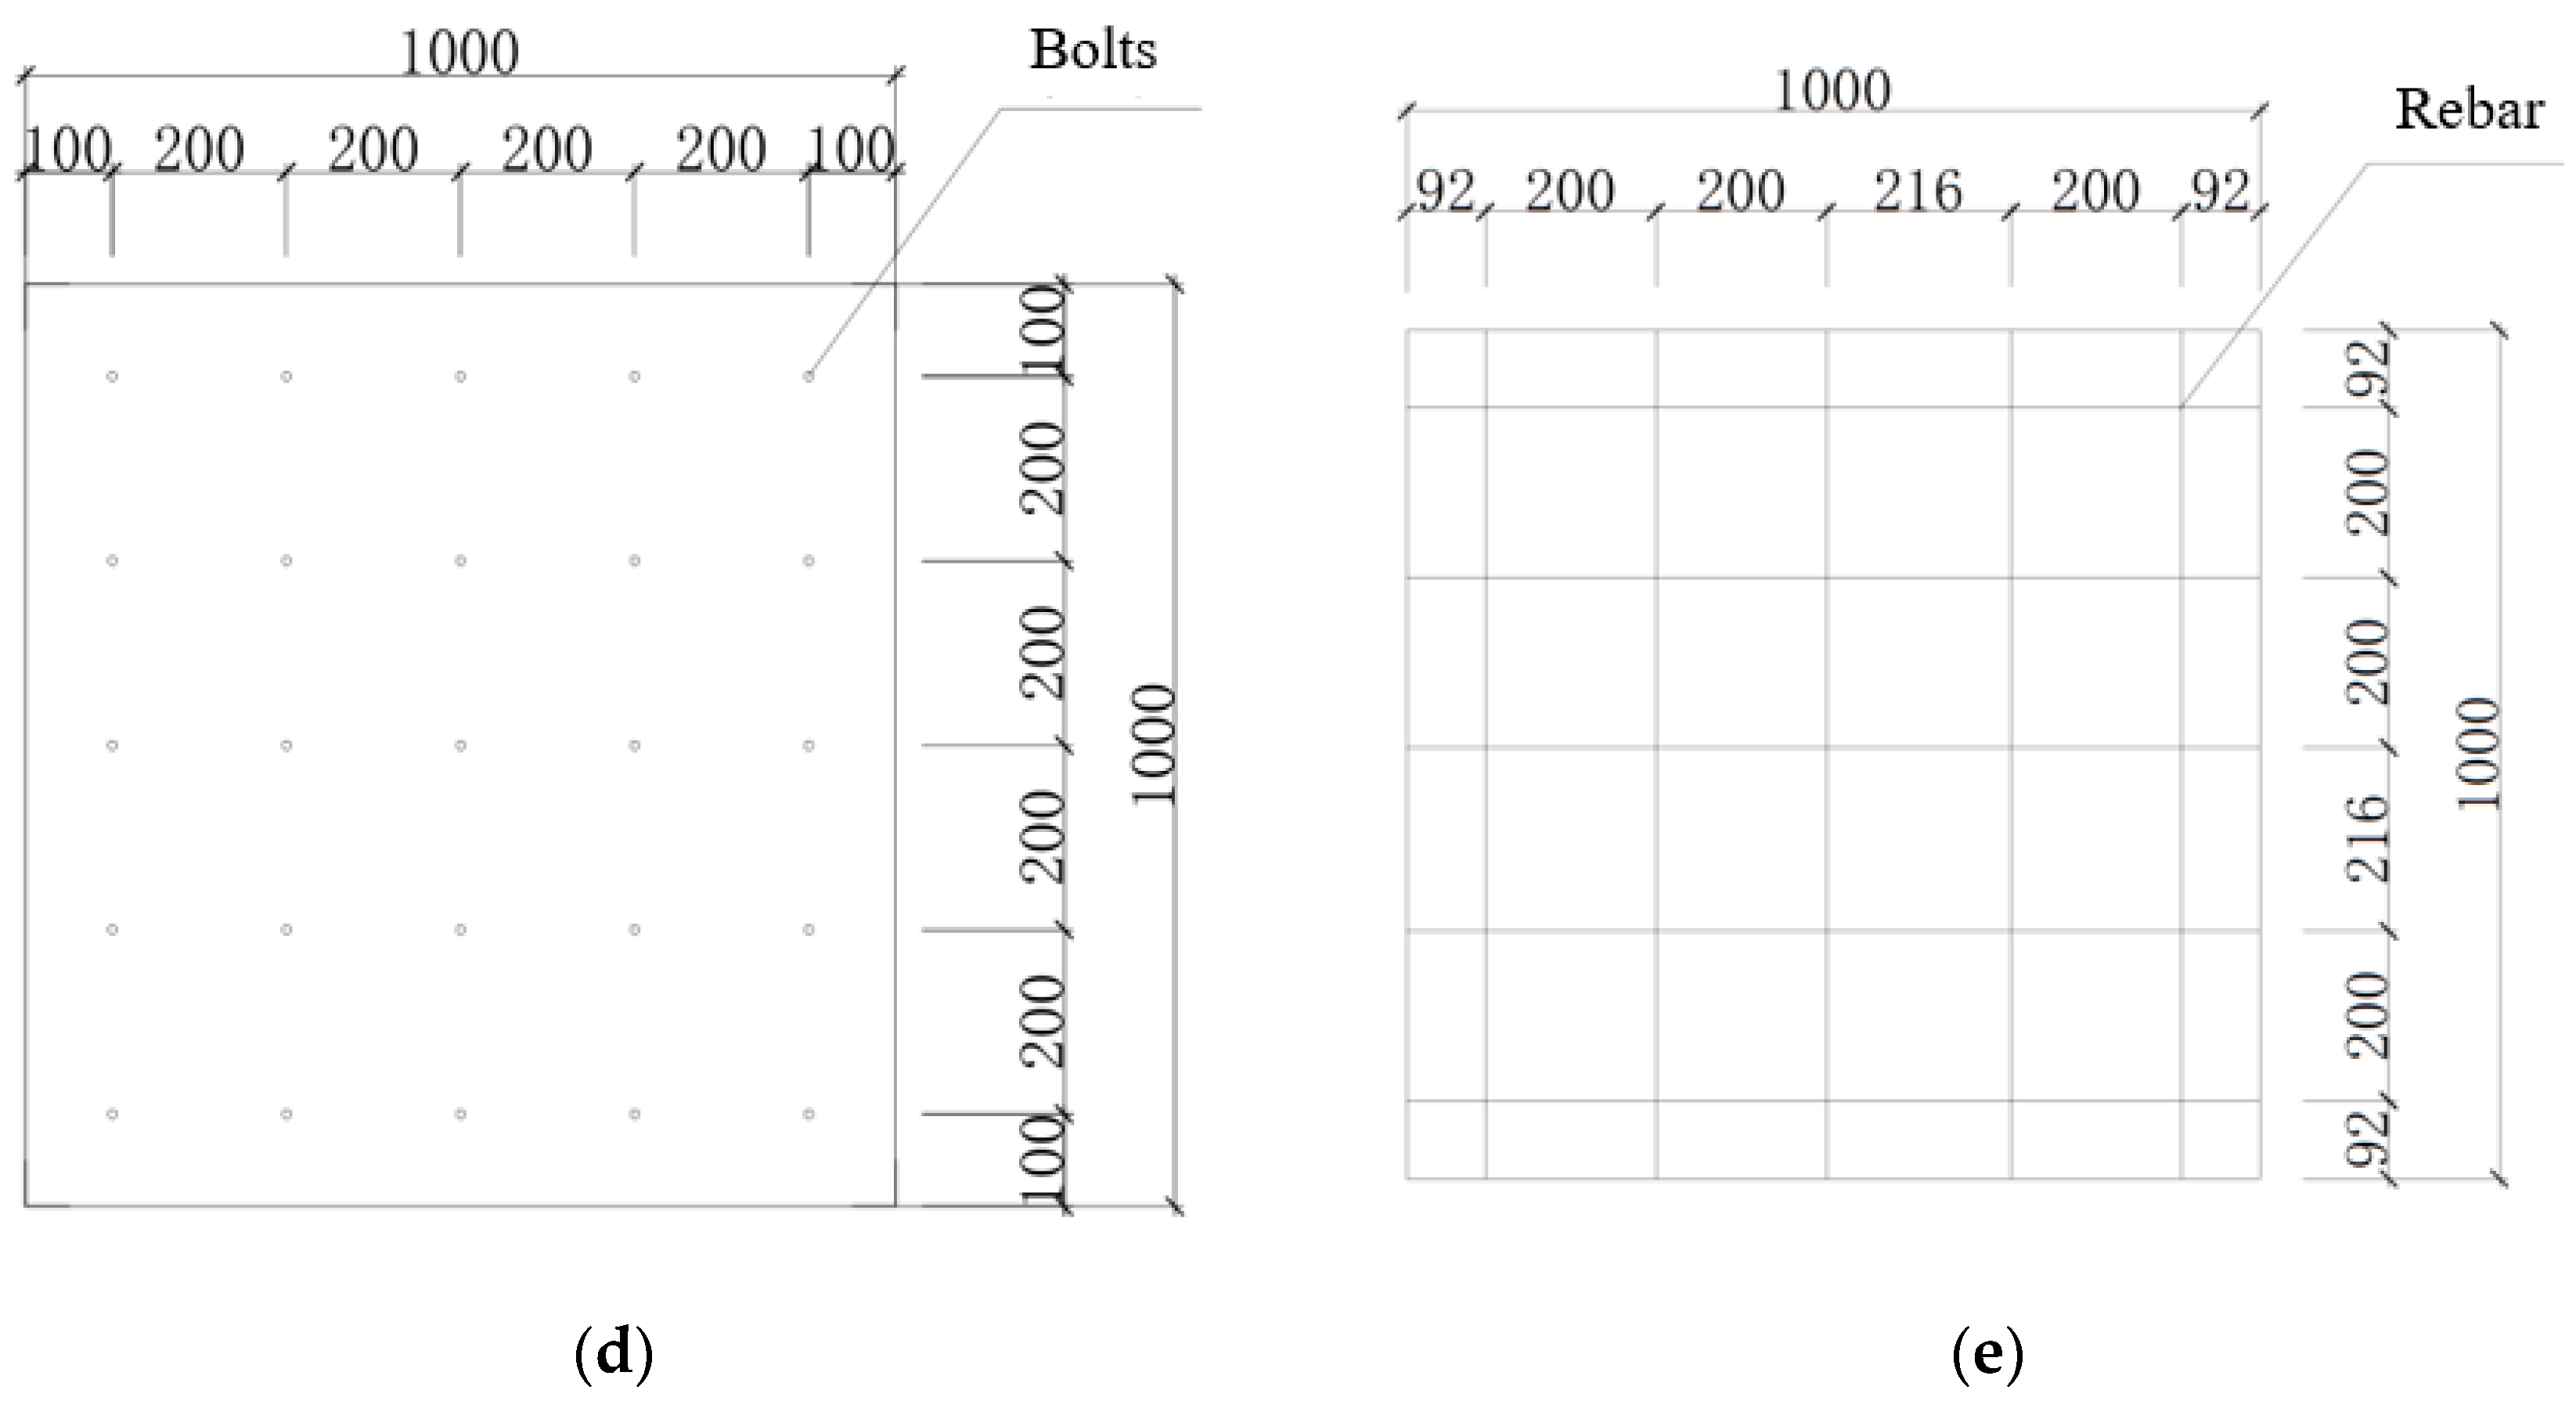
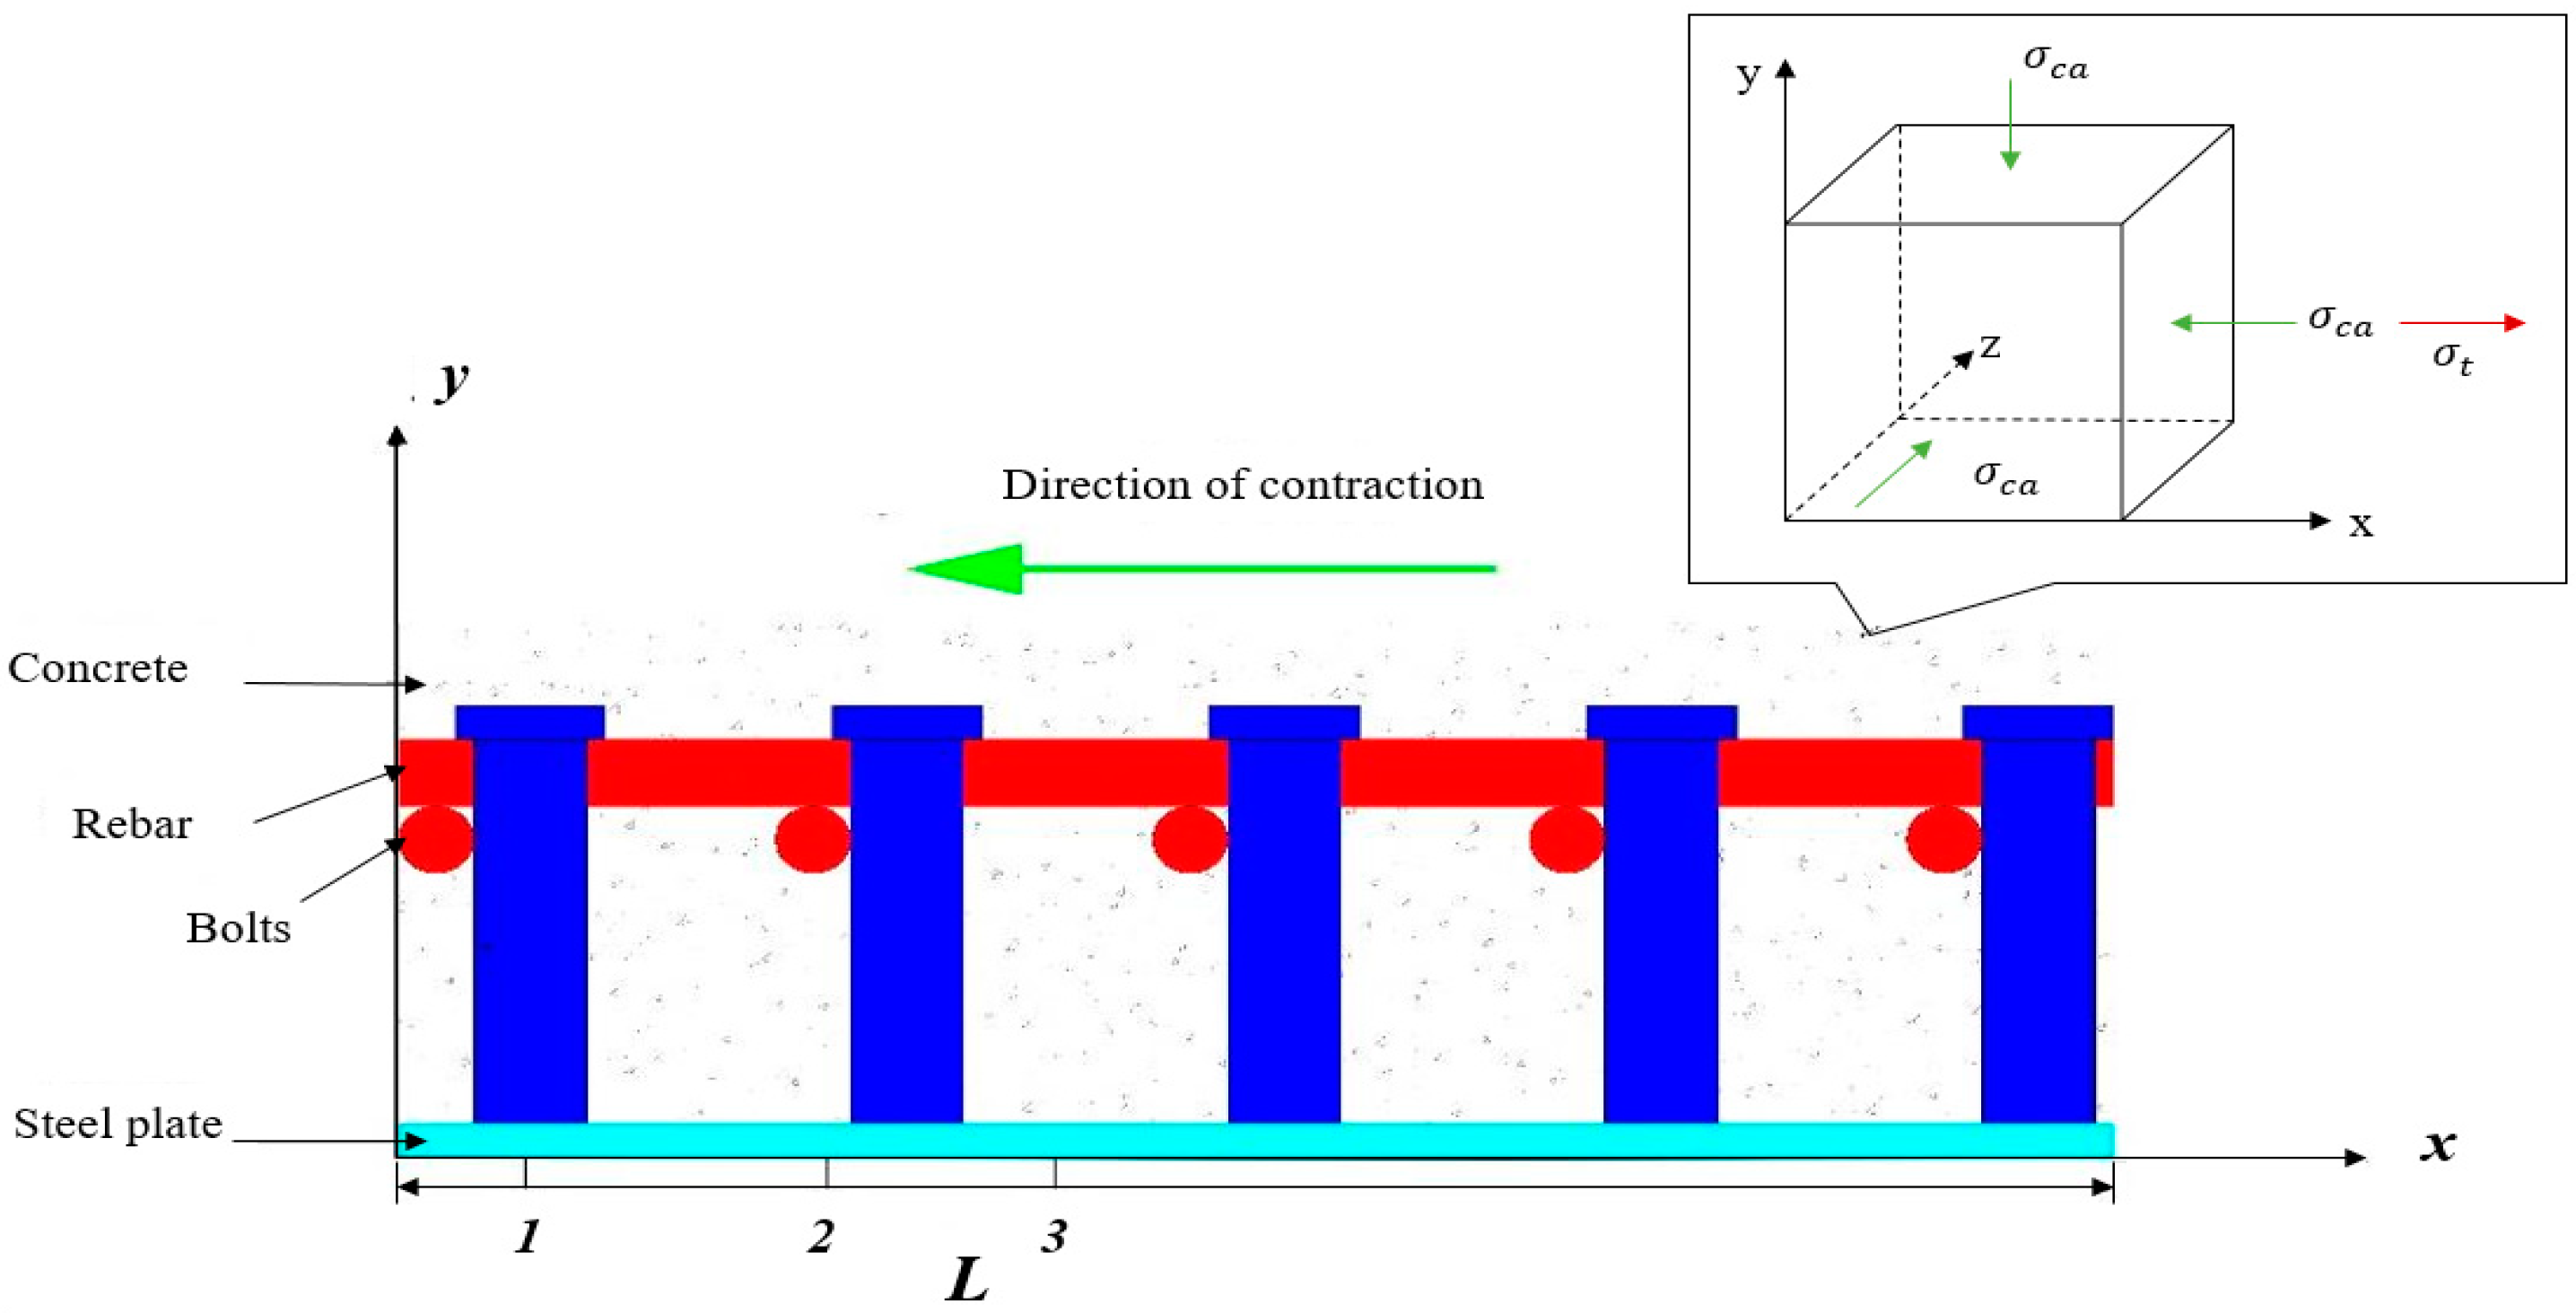
  • The diameter of the bolts is 16 mm, the length is 80 mm, and it is welded on both sides of the steel plate in a square arrangement, as shown in Figure 1d;
  • Horizontal distribution reinforcement is Φ10@200, and longitudinal horizontal reinforcement is Φ10@200. These are bidirectionally arranged along the test specimen in two layers, with the same diameter of reinforcement in both directions. The studs are passed through the distribution reinforcement mesh, as shown in Figure 1c,e.
In the test, the connection between the studs and the steel plate was welded to ensure synergy between the steel plate and concrete, and the studs passed through the reinforcement network to strengthen the effective bond between the concrete and the steel plate. The thickness of the steel plate, diameter of the reinforcement bars, diameter of the studs, length of the studs, and the stud spacing were respectively changed to form six restrained concrete specimens. Finally, one plain concrete specimen was designed for the sealed curing condition. The specimen design details are shown in Table 2.

2.3. Performance Testing

2.3.1. Mechanical Properties Testing

The cubic compressive strength, split tensile strength, and static compressive elastic modulus of concrete cured for 3 d, 7 d, 14 d, and 28 d were tested. The test methods were performed according to GBT 50081-2019 [28]. The test results are listed in Table 3.

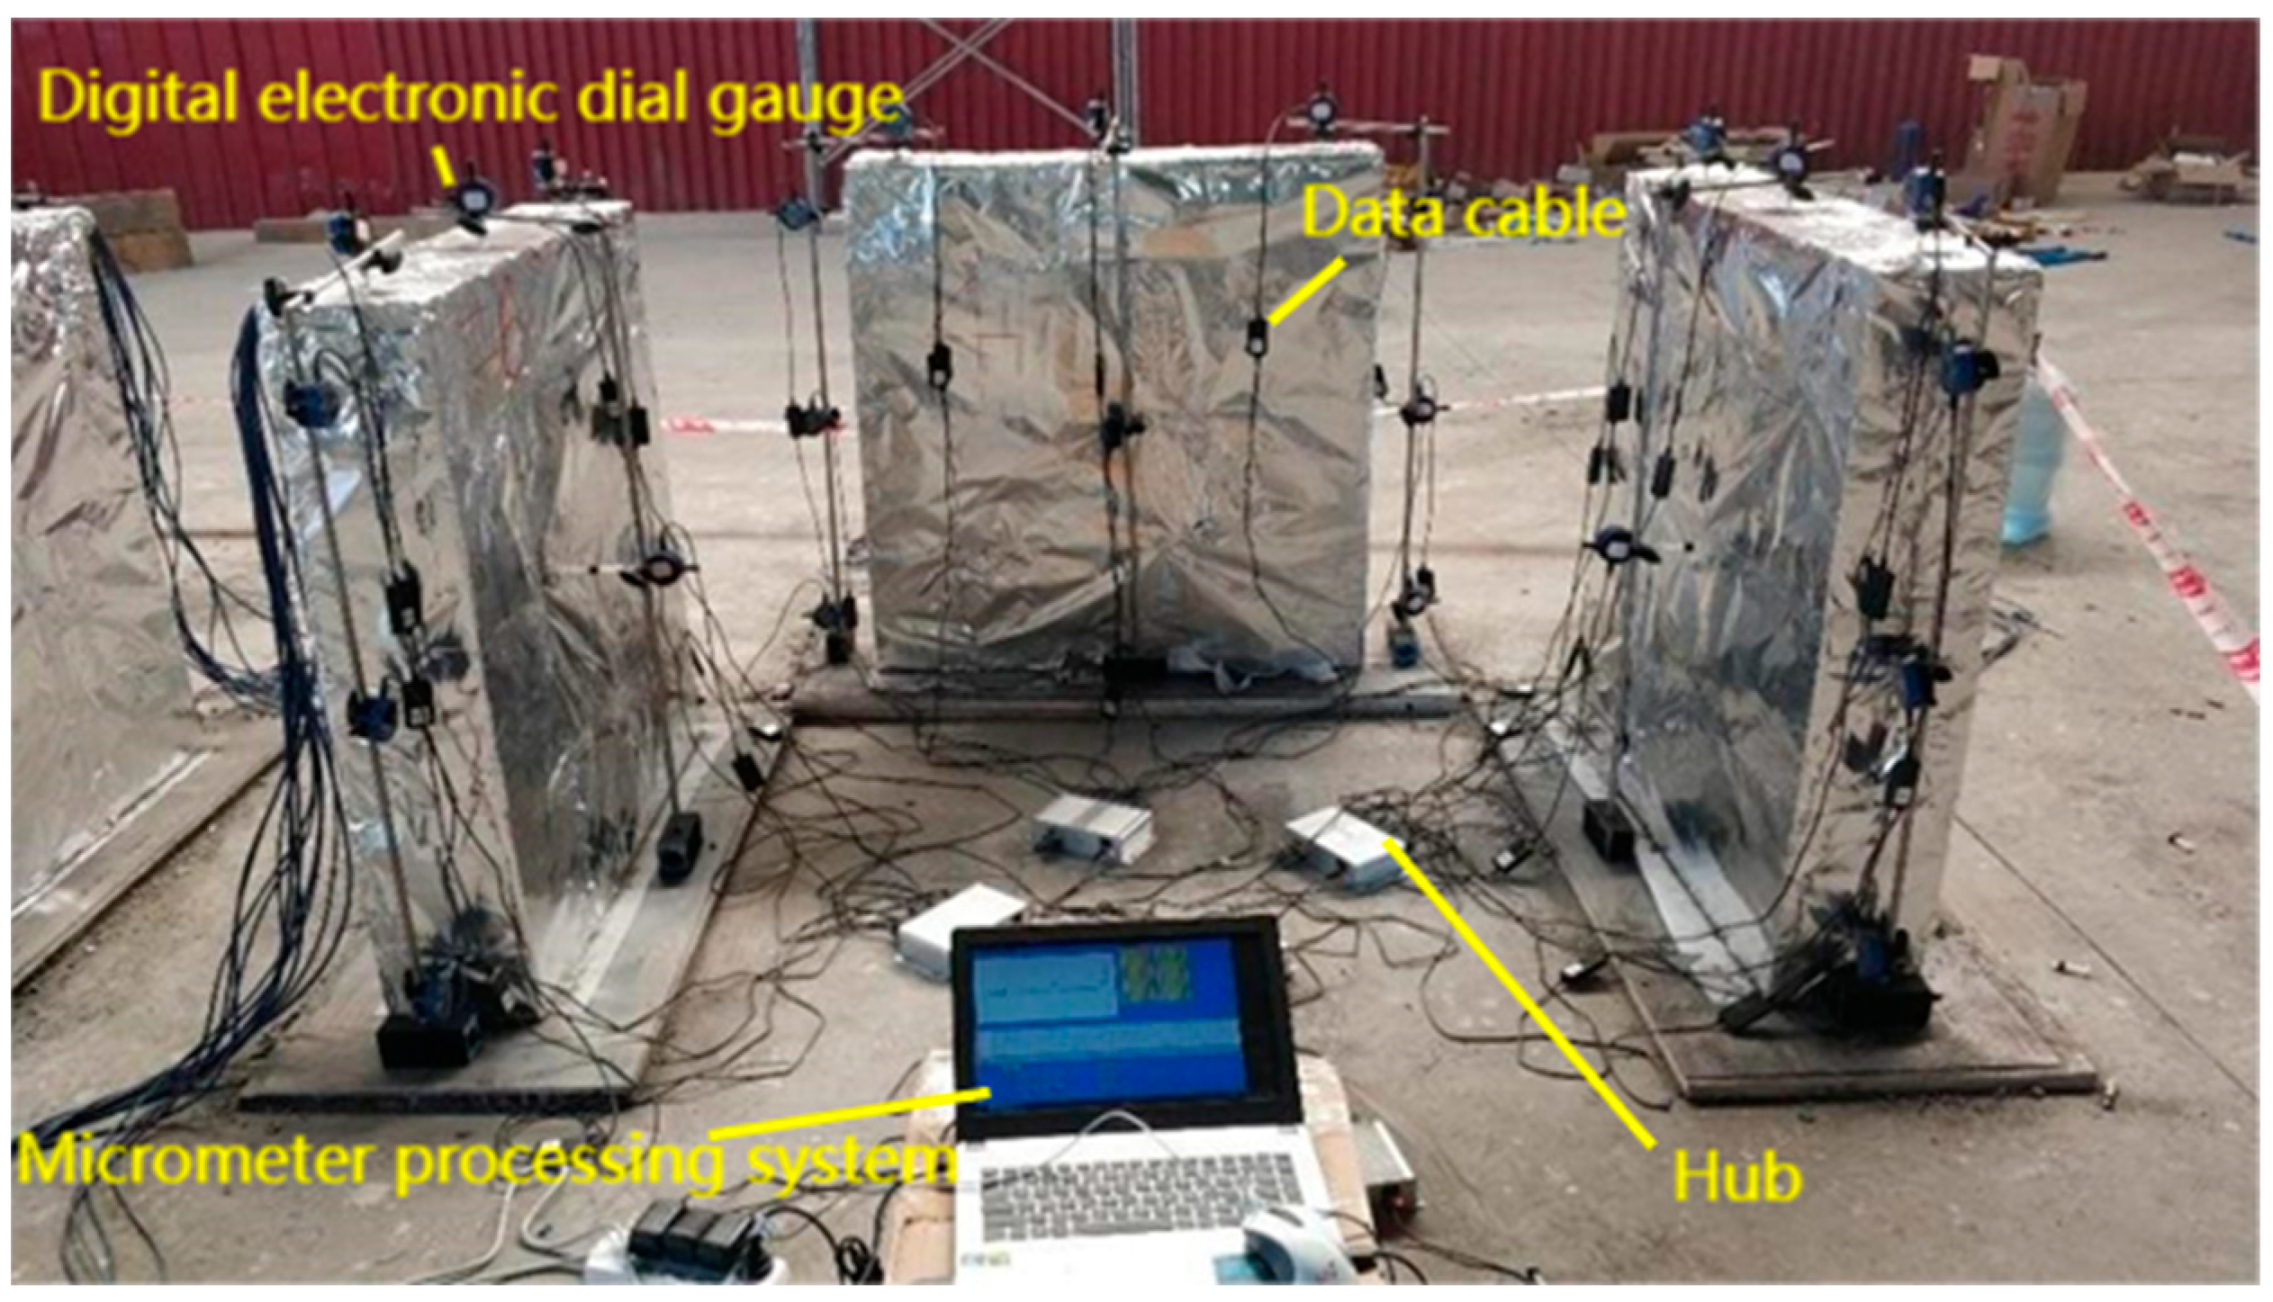
2.3.2. Concrete Restraint Shrinkage Test

To measure the shrinkage deformation of concrete in the longitudinal direction, three measurement points were arranged 100 mm, 500 mm, and 900 mm from the bottom of the specimen, termed measurement points 1, 2, and 3, respectively, and the arrangement of the shrinkage measurement points is shown in Figure 2. The data were collected using the automated collection equipment, which consists of a displacement transducer (micrometer), main (sub) hub, laptop computer, and micrometer processing system, as shown in Figure 3.
When measuring the shrinkage displacement of concrete, the measuring point bolts should be pre-embedded at the corresponding positions. After the initial set of concrete is removed, the bolts should be screwed back to their original positions. Then, the digital electronic dial gauge should be installed at the corresponding measuring point position in the longitudinal direction. The dial gauge head should be in full contact with the bolt, and the position should be adjusted so that the instrument is horizontally and vertically aligned with the measuring point. Then, the dial gauge should be connected to the data line, the data cable to the diversity cable, the diversity cable to a main hub, and the main hub to the laptop using a USB adapter, with recording being conducted automatically.

2.3.3. Concrete Pore Structure Test

The specimens used for the concrete pore structure tests had the same specifications as those used for the shrinkage tests. At each test age (3, 14, and 28 d), the specimens were drilled, some samples of concrete materials were collected, and the concrete was crushed with a sieve to select concrete particles with sizes between 2.5 mm and 5 mm, ensuring that the volume of each particle was less than 1 cm3. Subsequently, the hydration of the concrete was prevented using acetone, and the specimens were dried in a vacuum dryer. Finally, the internal pore structure of the concrete was tested using an AUTOIV9510 fully automated mercury porosimeter.

3. Shrinkage Modeling of Concrete with Complex Internal Constraints Based on Capillary Tension Theory

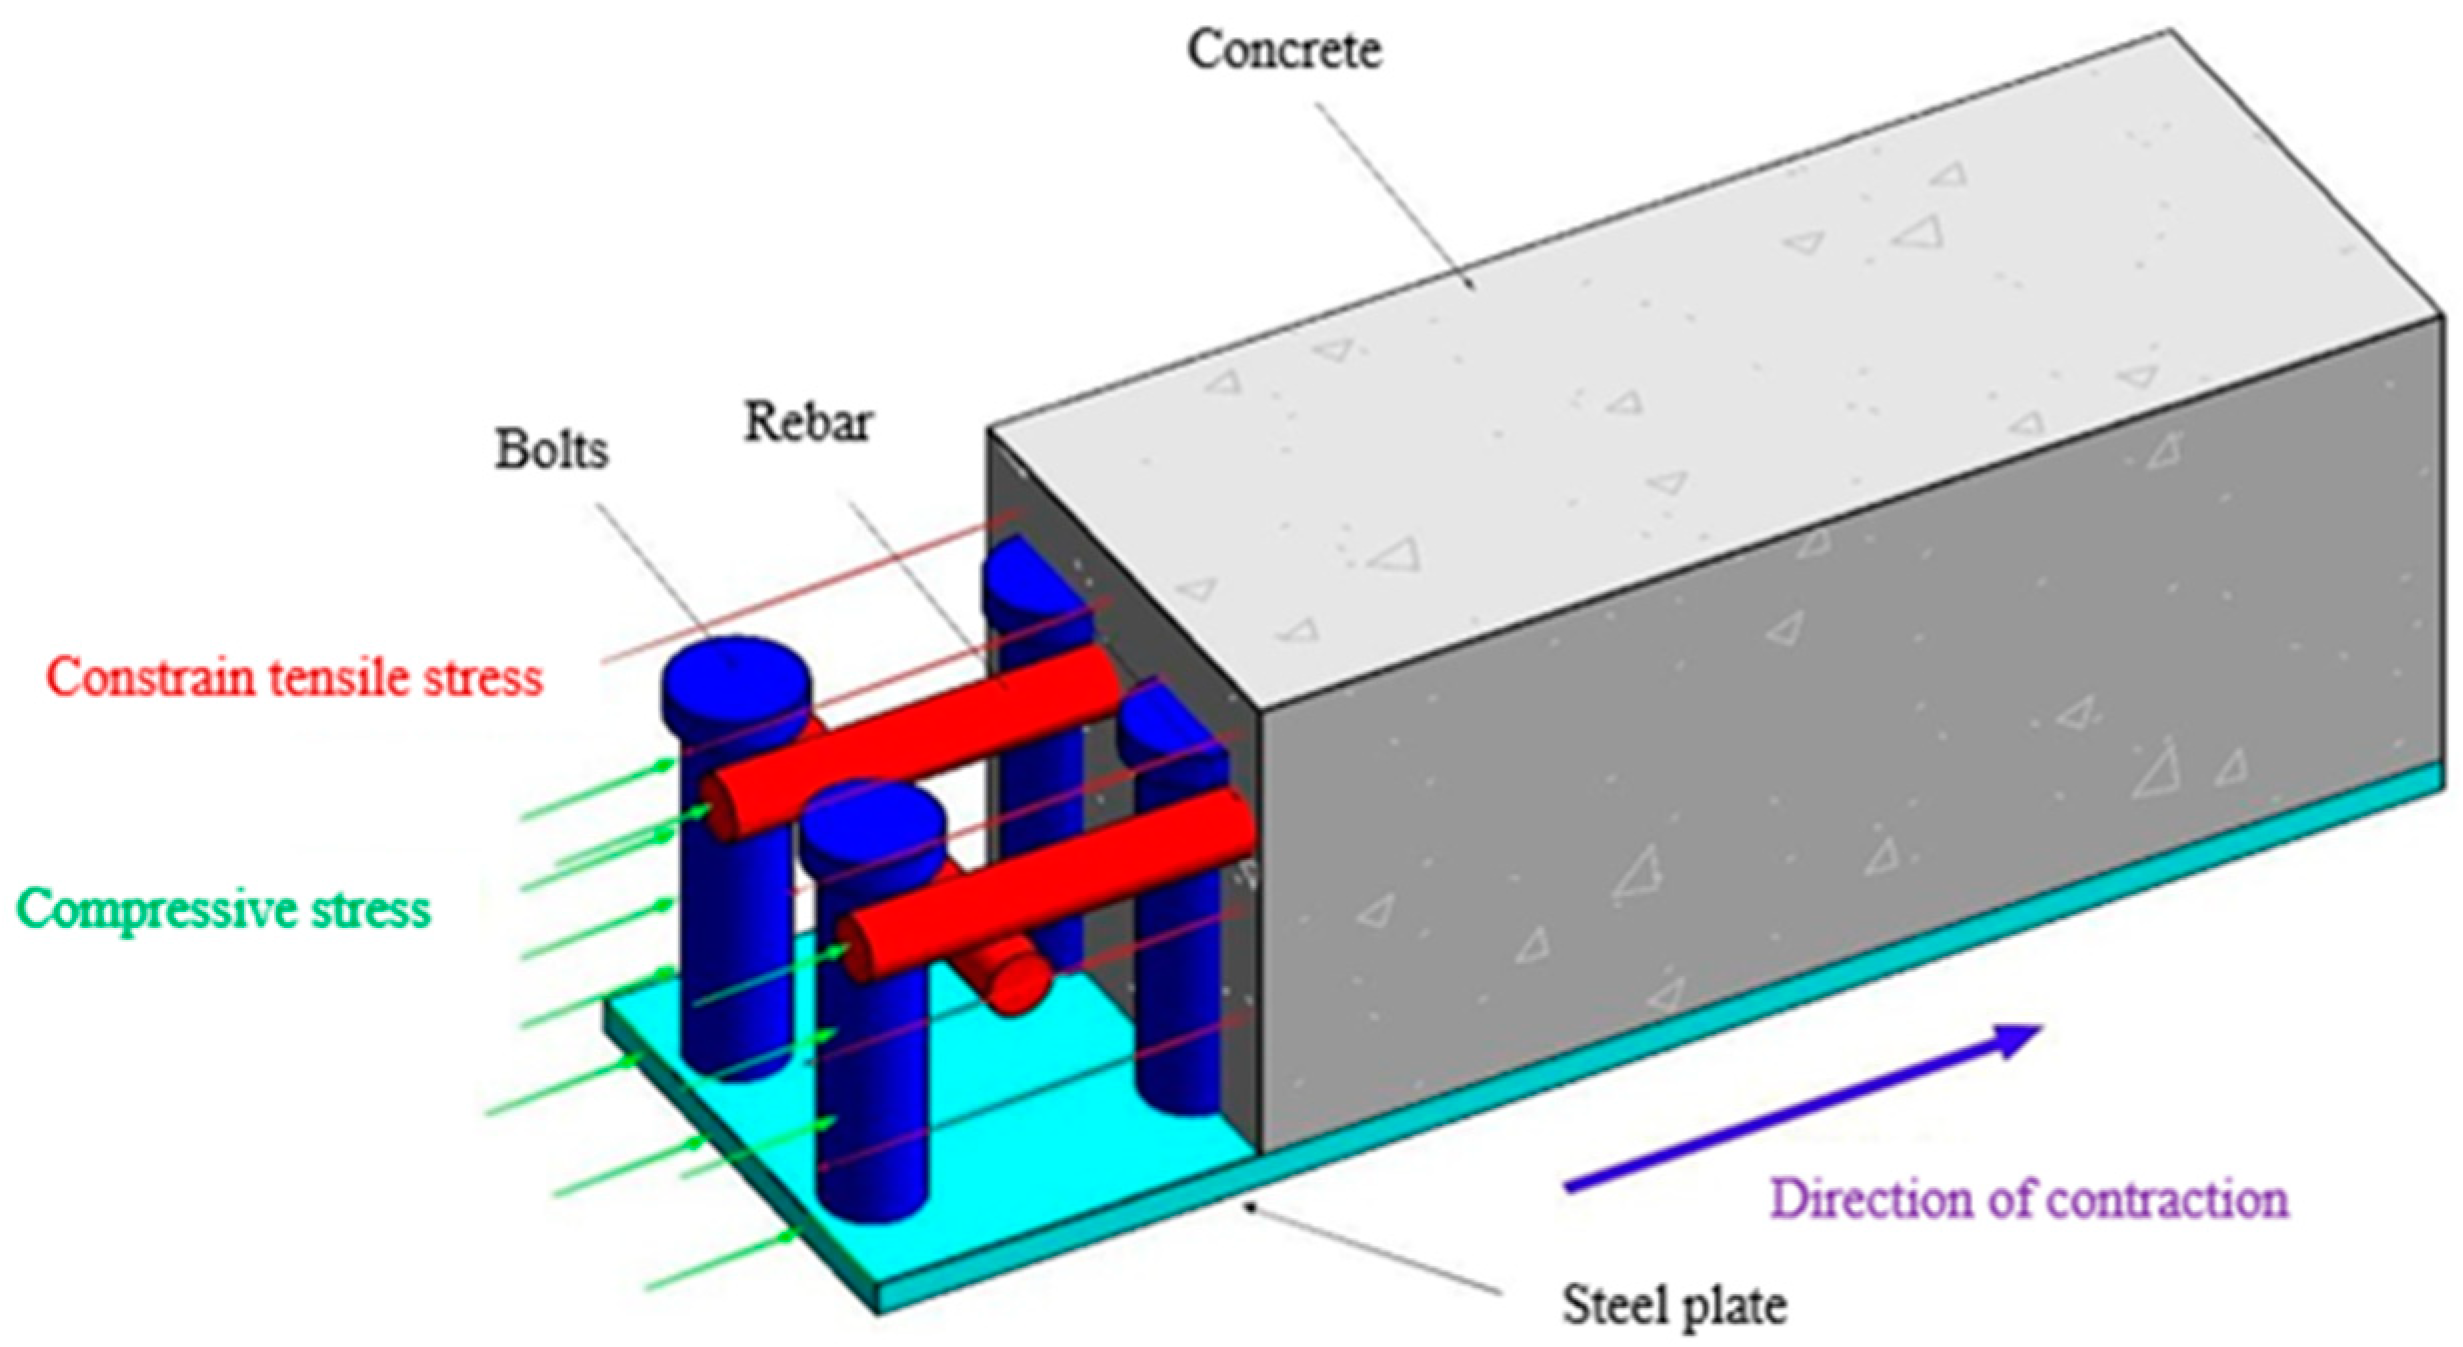
3.1. Shrinkage Modeling of Concrete with Complex Internal Constraints

Capillary tension theory has been shown to better explain and predict the shrinkage of plain concrete. Therefore, in this section, a model of concrete shrinkage subjected to the joint constraints of a steel plate, studs, and reinforcement is developed based on capillary tension theory. When concrete shrinks under capillary stress, the steel plate and studs themselves do not deform. Therefore, restraining shear stress is generated at the interface between the steel plate, studs, and concrete. This shear stress leads to compressive stresses in the steel plate, studs, and reinforcement, whereas restraining tensile stresses will be formed inside the concrete in the direction opposite to the direction of contraction of the concrete, as shown in Figure 4.
According to the above basic principles, a concrete constrained shrinkage model with a total length of L, n bolts with a diameter of d, and N reinforcement bars (divided into transverse and longitudinal reinforcement bars) with a diameter of D, is established, which is constrained by the steel plate, bolts, and reinforcement bars. A concrete unit in the constrained model is taken as the object of analysis, as shown in Figure 5.
According to the theory of capillary tension, when the water in concrete is consumed, the capillary stress generated on the walls of the concrete capillaries becomes the main driving force for the shrinkage of concrete, and the capillary stress ( σ c a ) that causes the shrinkage of concrete can be expressed as follows:
σ c a = Δ P = 2 γ cos θ r
where γ is the surface tension of the capillary wall, which is equal to 7.28 × 10⁻² N/m at 20 °C; θ denotes the contact angle at the liquid–solid interface (0 for concrete); and r refers to the most accretive pore size of the pores.
Due to discontinuities in the arrangement of studs and reinforcement, three typical cross-sections in concrete are constrained by steel plates, studs, and reinforcement, namely, cross-section 1 with steel plates, concrete, studs, and longitudinal reinforcement; cross-section 2 with steel plates, concrete, transverse reinforcement, and longitudinal reinforcement; and cross-section 3 with steel plates, concrete and longitudinal reinforcement, as shown in Figure 6. The total length of the model with type 1 cross-section is nd, the total length of the model with type 2 cross-section is ND, and the total length of the model with type 3 cross-section is LndND. To simplify the analysis, the diameters of the heads of the studs were replaced by the diameters of the stud rods in this model, and the projected area of the studs was used to represent the cross-sectional area of the studs in cross-section 1.
In the length direction (x-direction) of the specimen, the concrete is subjected to capillary pore stresses and confining tensile stresses. In this study, the primarily considered restraining effect is that of steel plates and pins in the length direction (x), so only capillary stresses act on the concrete units in the width direction (y) and height direction (z). According to the theory on the mechanics of materials, the strain in the x direction of concrete in sections 1, 2 and 3 can be expressed as
ε c i = 1 E S C [ σ x μ ( σ y + σ z ) ] = 1 E S C [ ( σ c a σ t i ) μ ( σ c a + σ c a ) ] = 1 2 μ E S C σ c a 1 E S C σ t i
where ε c i is the strain of the concrete in section i in the restrained member and i = 1, 2, 3 in this study; Esc is the modulus of elasticity of the concrete with respect to the capillary pore stresses; σ t i is the restrained tensile stresses on the concrete in section i, i = 1, 2, 3; and μ is the Poisson’s ratio.
The total displacement of the whole concrete specimen under shrinkage stress (ΔL) can be expressed as
Δ L = ε c - 1 n d + ε c - 2 N D + ε c - 3 ( L n d N D )
The total strain of the whole constrained model can then be expressed as
ε c t o t a l = Δ L L = ε c 1 n d + ε c 2 N D + ε c 3 ( L n d N D ) L
where ε c t o t a l is the total strain in the concrete restrained by the steel plate, pins, and reinforcement.
An arbitrary length (l) of confined concrete containing only one section on the model is considered. The concrete, steel plates, pins, and horizontal reinforcement in this section have the same displacement under capillary pore stresses, as required by the deformation coordination:
δ c - 1 = δ sp - 1 = δ st - 1 = δ s 1 - 1
where δ c 1 , δ s p 1 , δ s t 1 , and δ s 1 1 are the displacements of concrete, steel plates, pins, and longitudinal reinforcement under capillary pore stresses for type 1 concrete with a length of l.
It can be inferred that
δ c 1 l = δ s p 1 l = δ s t 1 l = δ s 1 1 l = δ c 1 = δ s p 1 = δ s t 1 = δ s 1 1
A constrained concrete containing only 2 sections of any length (l) on the model is considered. From the deformation coordination requirement, the following can be derived:
ε c 2 = ε s p 2 = ε s t 2 = ε s 2 2
A constrained concrete containing only three sections of any length (l) on the model is considered. From the deformation coordination requirement, the following can be derived:
δ c 2 = δ s p 3 = δ s 1 3
Organizing the above equation yields
ε c 1 = 2 γ ( 1 2 μ ) r 1 E S C + A s p 1 A c 1 E s p + A s t 1 A c 1 E s t + A s 1 1 A c 1 E S ε c 2 = 2 γ ( 1 2 μ ) r 1 E S C + A s p 2 A c 2 E s p + A s 1 2 A c 2 E S + A s 2 2 A c 2 E S ε c 2 = 2 γ ( 1 2 μ ) r 1 E S C + A s p 3 A c 3 E s p + A s 1 3 A c 3 E S
Substituting Equation (9) into Equation (4) yields
ε c t o t a l = 2 γ ( 1 2 μ ) r [ n d L 1 E S C + A s p 1 A c 1 E s p + A s t 1 A c 1 E s t + A s 1 1 A c 1 E S + N D L 1 E S C + A s p 2 A c 2 E s p + A s 1 2 A c 2 E S + A s 2 1 A c 2 E S + ( L nd N D L ) 1 E S C + A s p 3 A c 3 E s p + A s 1 3 A c 3 E S ]
Letting ρ = n d / L and ρ = N D / L , the equation for the shrinkage strain of concrete restrained by steel plates, pins, and reinforcement can be derived as
ε c t o t a l = 2 γ ( 1 2 μ ) r [ ρ 1 E S C + A s p 1 A c 1 E s p + A s t 1 A c 1 E s t + A s 1 1 A c 1 E S + ρ 1 E S C + A s p 2 A c 2 E s p + A s 1 2 A c 2 E S + A s 2 1 A c 2 E S + ( 1 ρ ρ ) 1 E S C + A s p 3 A c 3 E s p + A s 1 3 A c 3 E S ]
It can be reordered as follows:
1 E S C + A s p 1 A c 1 E s p + A s t 1 A c 1 E s t + A s 1 1 A c 1 E S = A 1 E S C + A s p 2 A c 2 E s p + A s 1 2 A c 2 E S + A s 2 1 A c 2 E S = B 1 E S C + A s p 3 A c 3 E s p + A s 1 3 A c 3 E S = C
Finally, the following is obtained:
ε c t o t a l = 2 γ ( 1 2 μ ) r ( ρ A + ρ B + 1 ρ ρ C )

4. Hole Structures in Complex Internally Confined Concrete

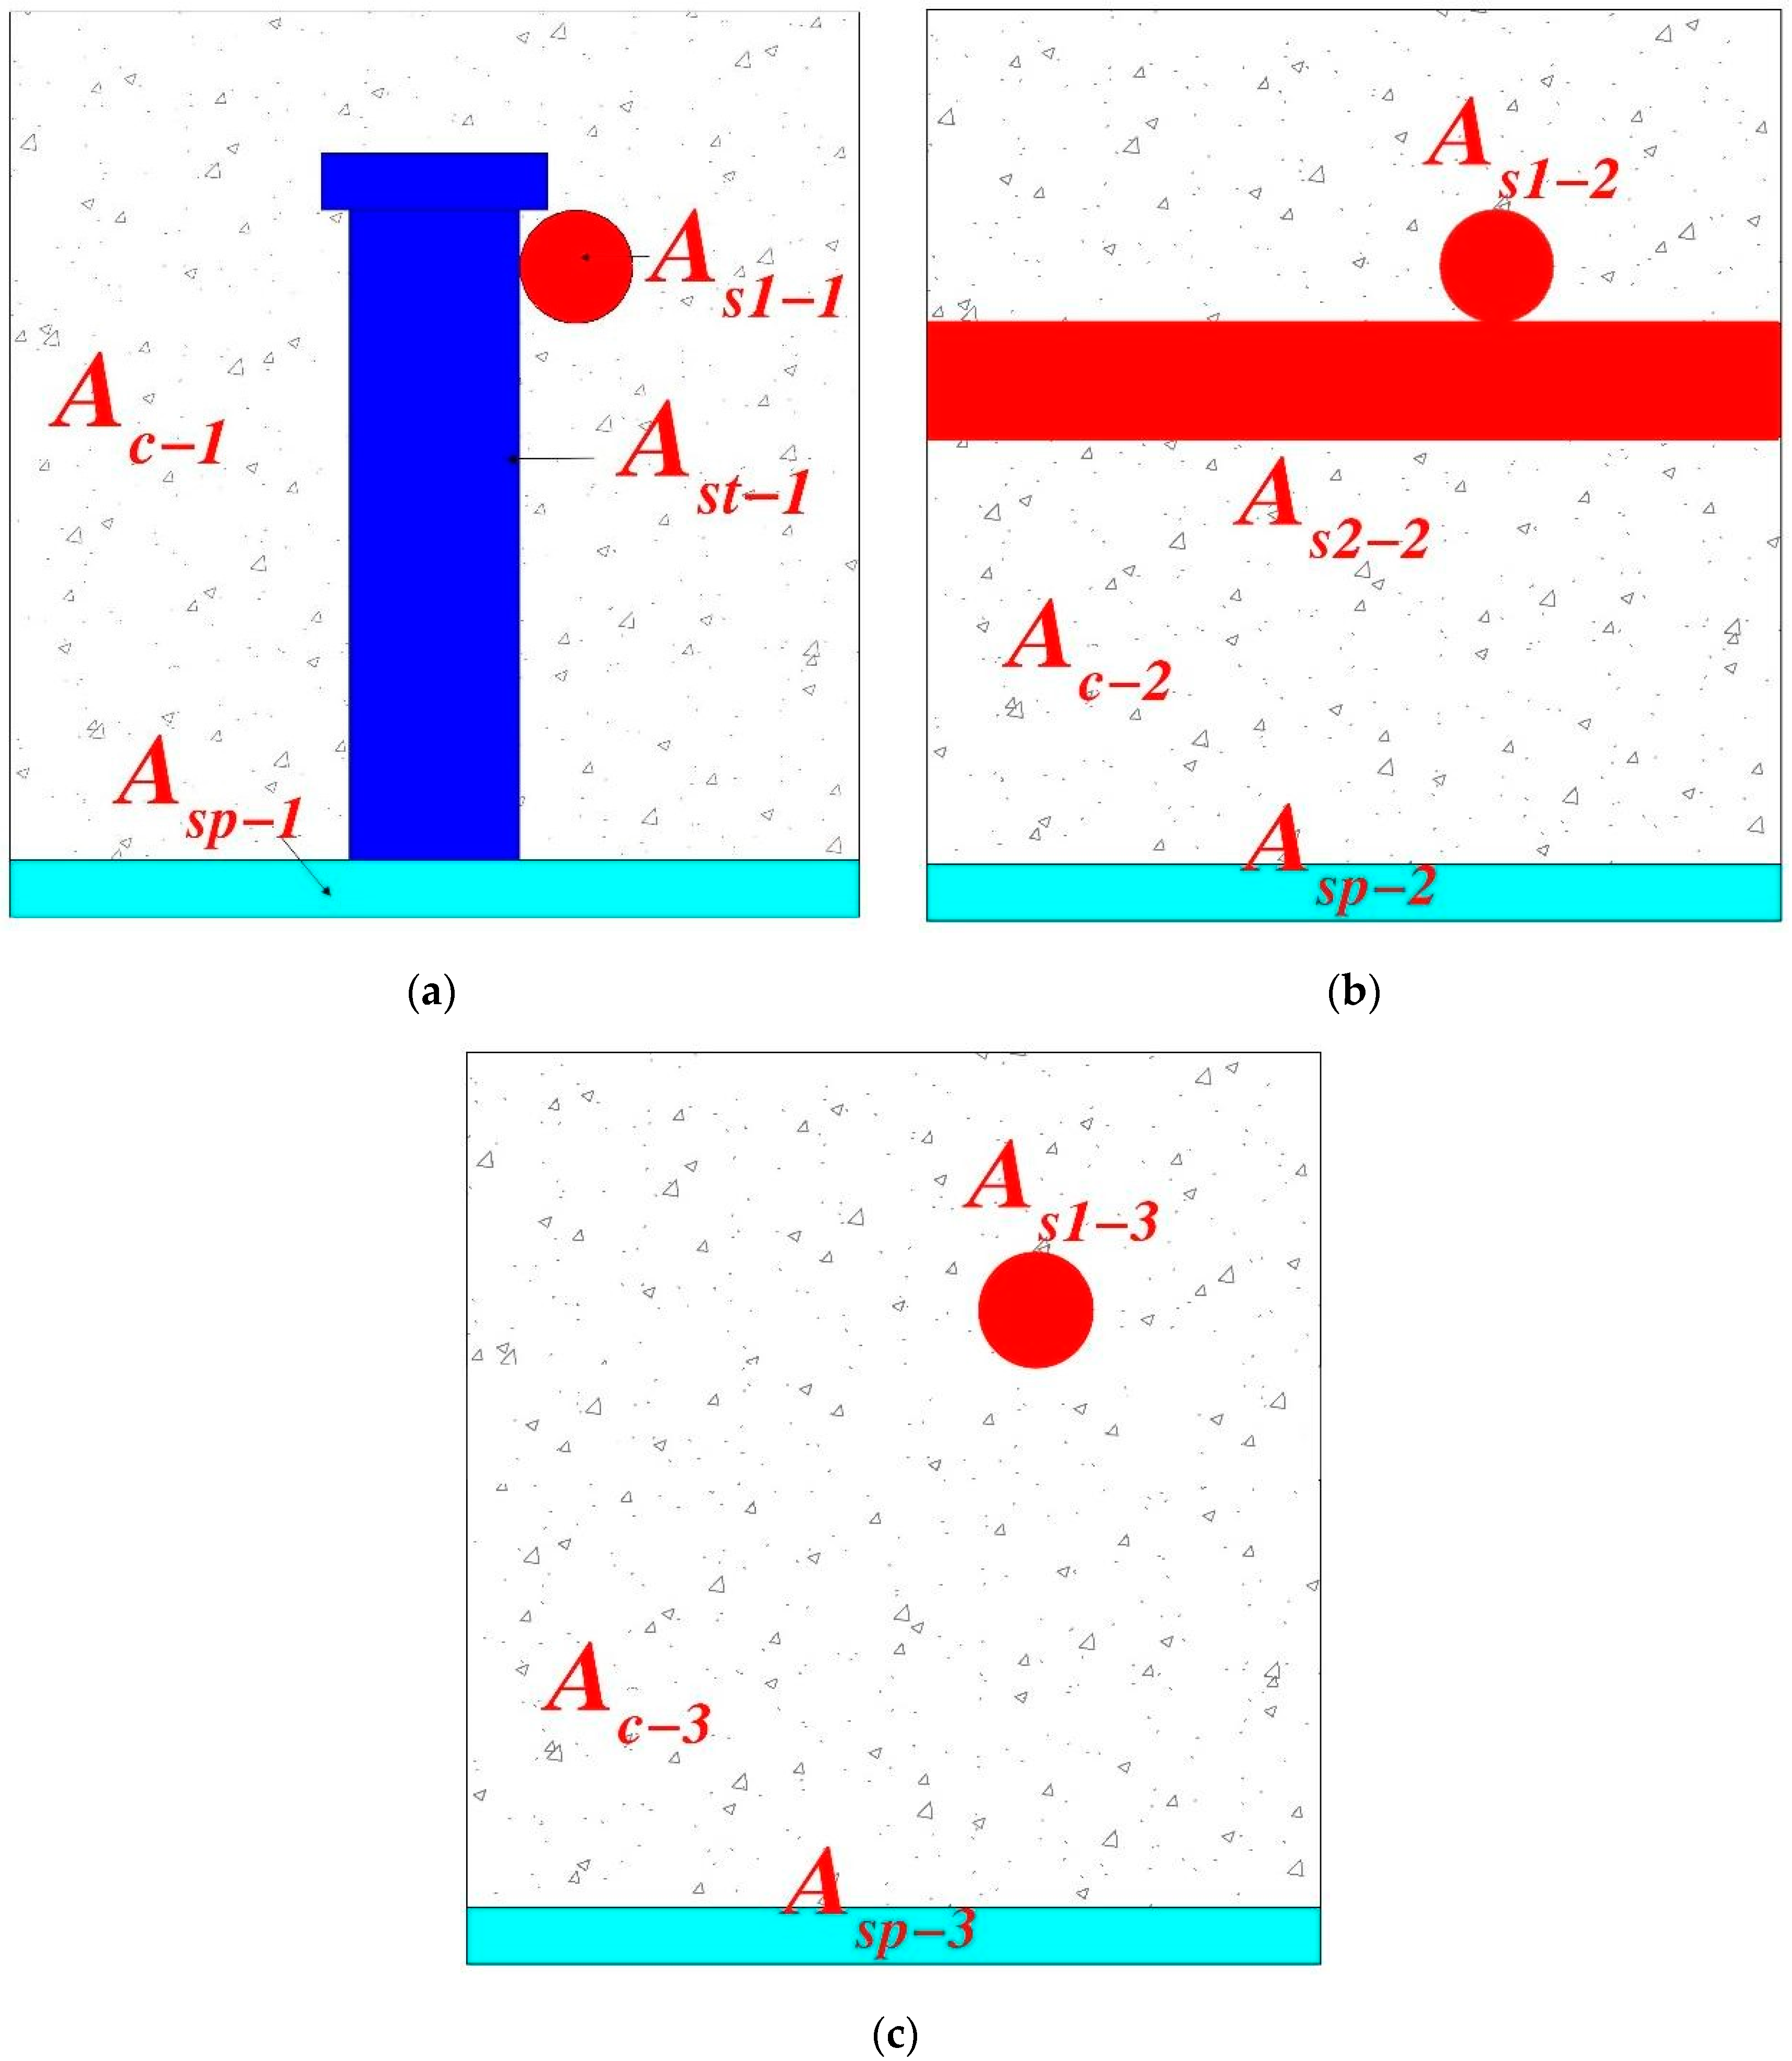
4.1. Confinement Factor of Concrete by Steel Plates, Pins, and Reinforcement Bars

From Equation (11), the average combined force σ ¯ c t o t a l exerted on the concrete hole wall throughout the specimen with the joint restraint of the steel plate, studs, and reinforcement can be expressed as
σ ¯ c t o t a l = E S C 2 γ ( 1 2 μ ) r [ ρ 1 E S C + A s p 1 A c 1 E s p + A s t 1 A c 1 E s t + A s 1 1 A c 1 E S + ρ 1 E S C + A s p 2 A c 2 E s p + A s 1 2 A c 2 E S + A s 2 1 A c 2 E S + ( 1 ρ ρ ) 1 E S C + A s p 3 A c 3 E s p + A s 1 3 A c 3 E S ]
To measure the restraining effect of steel plates, bolts, and reinforcement on concrete, a parameter λ called the restraining coefficient is proposed:
λ = 1 ( 1 2 μ ) [ ρ 1 E S C + A s p 1 A c 1 E s p + A s t 1 A c 1 E s t + A s 1 1 A c 1 E S + ρ 1 E S C + A s p 2 A c 2 E s p + A s 1 2 A c 2 E S + A s 2 1 A c 2 E S + ( 1 ρ ρ ) 1 E S C + A s p 3 A c 3 E s p + A s 1 3 A c 3 E S ]
Equation (14) shows that the constraint factor will increase when the thickness of the steel plate is increased, increasing the diameter of the reinforcement and the diameter and height of the studs while decreasing the spacing of the studs at the same age (constant concrete Esc).
Substituting λ into Equation (13) yields the following:
σ ¯ c t o t a l = 1 λ E S C 2 γ r
The confinement coefficients at 3, 7, and 28 d for each specimen in this study are presented in Table 4. Among these, the elastic modulus Esc of concrete relative to the capillary stress can be converted from the static compressive elastic modulus Ec of concrete. The ratio of Ec to Esc varies between 2.5 and 3.5 as the concrete strength increases. In this study, the ratio was set to 3.2. The static compressive modulus of elasticity of concrete at various ages is listed in Table 3, and the Poisson’s ratio of concrete is taken to be 0.2 as per the relevant specification. Accordingly, the constraints on the concrete in each specimen are as follows: S5 < S1 < S4 < S6 < S3 < S2.

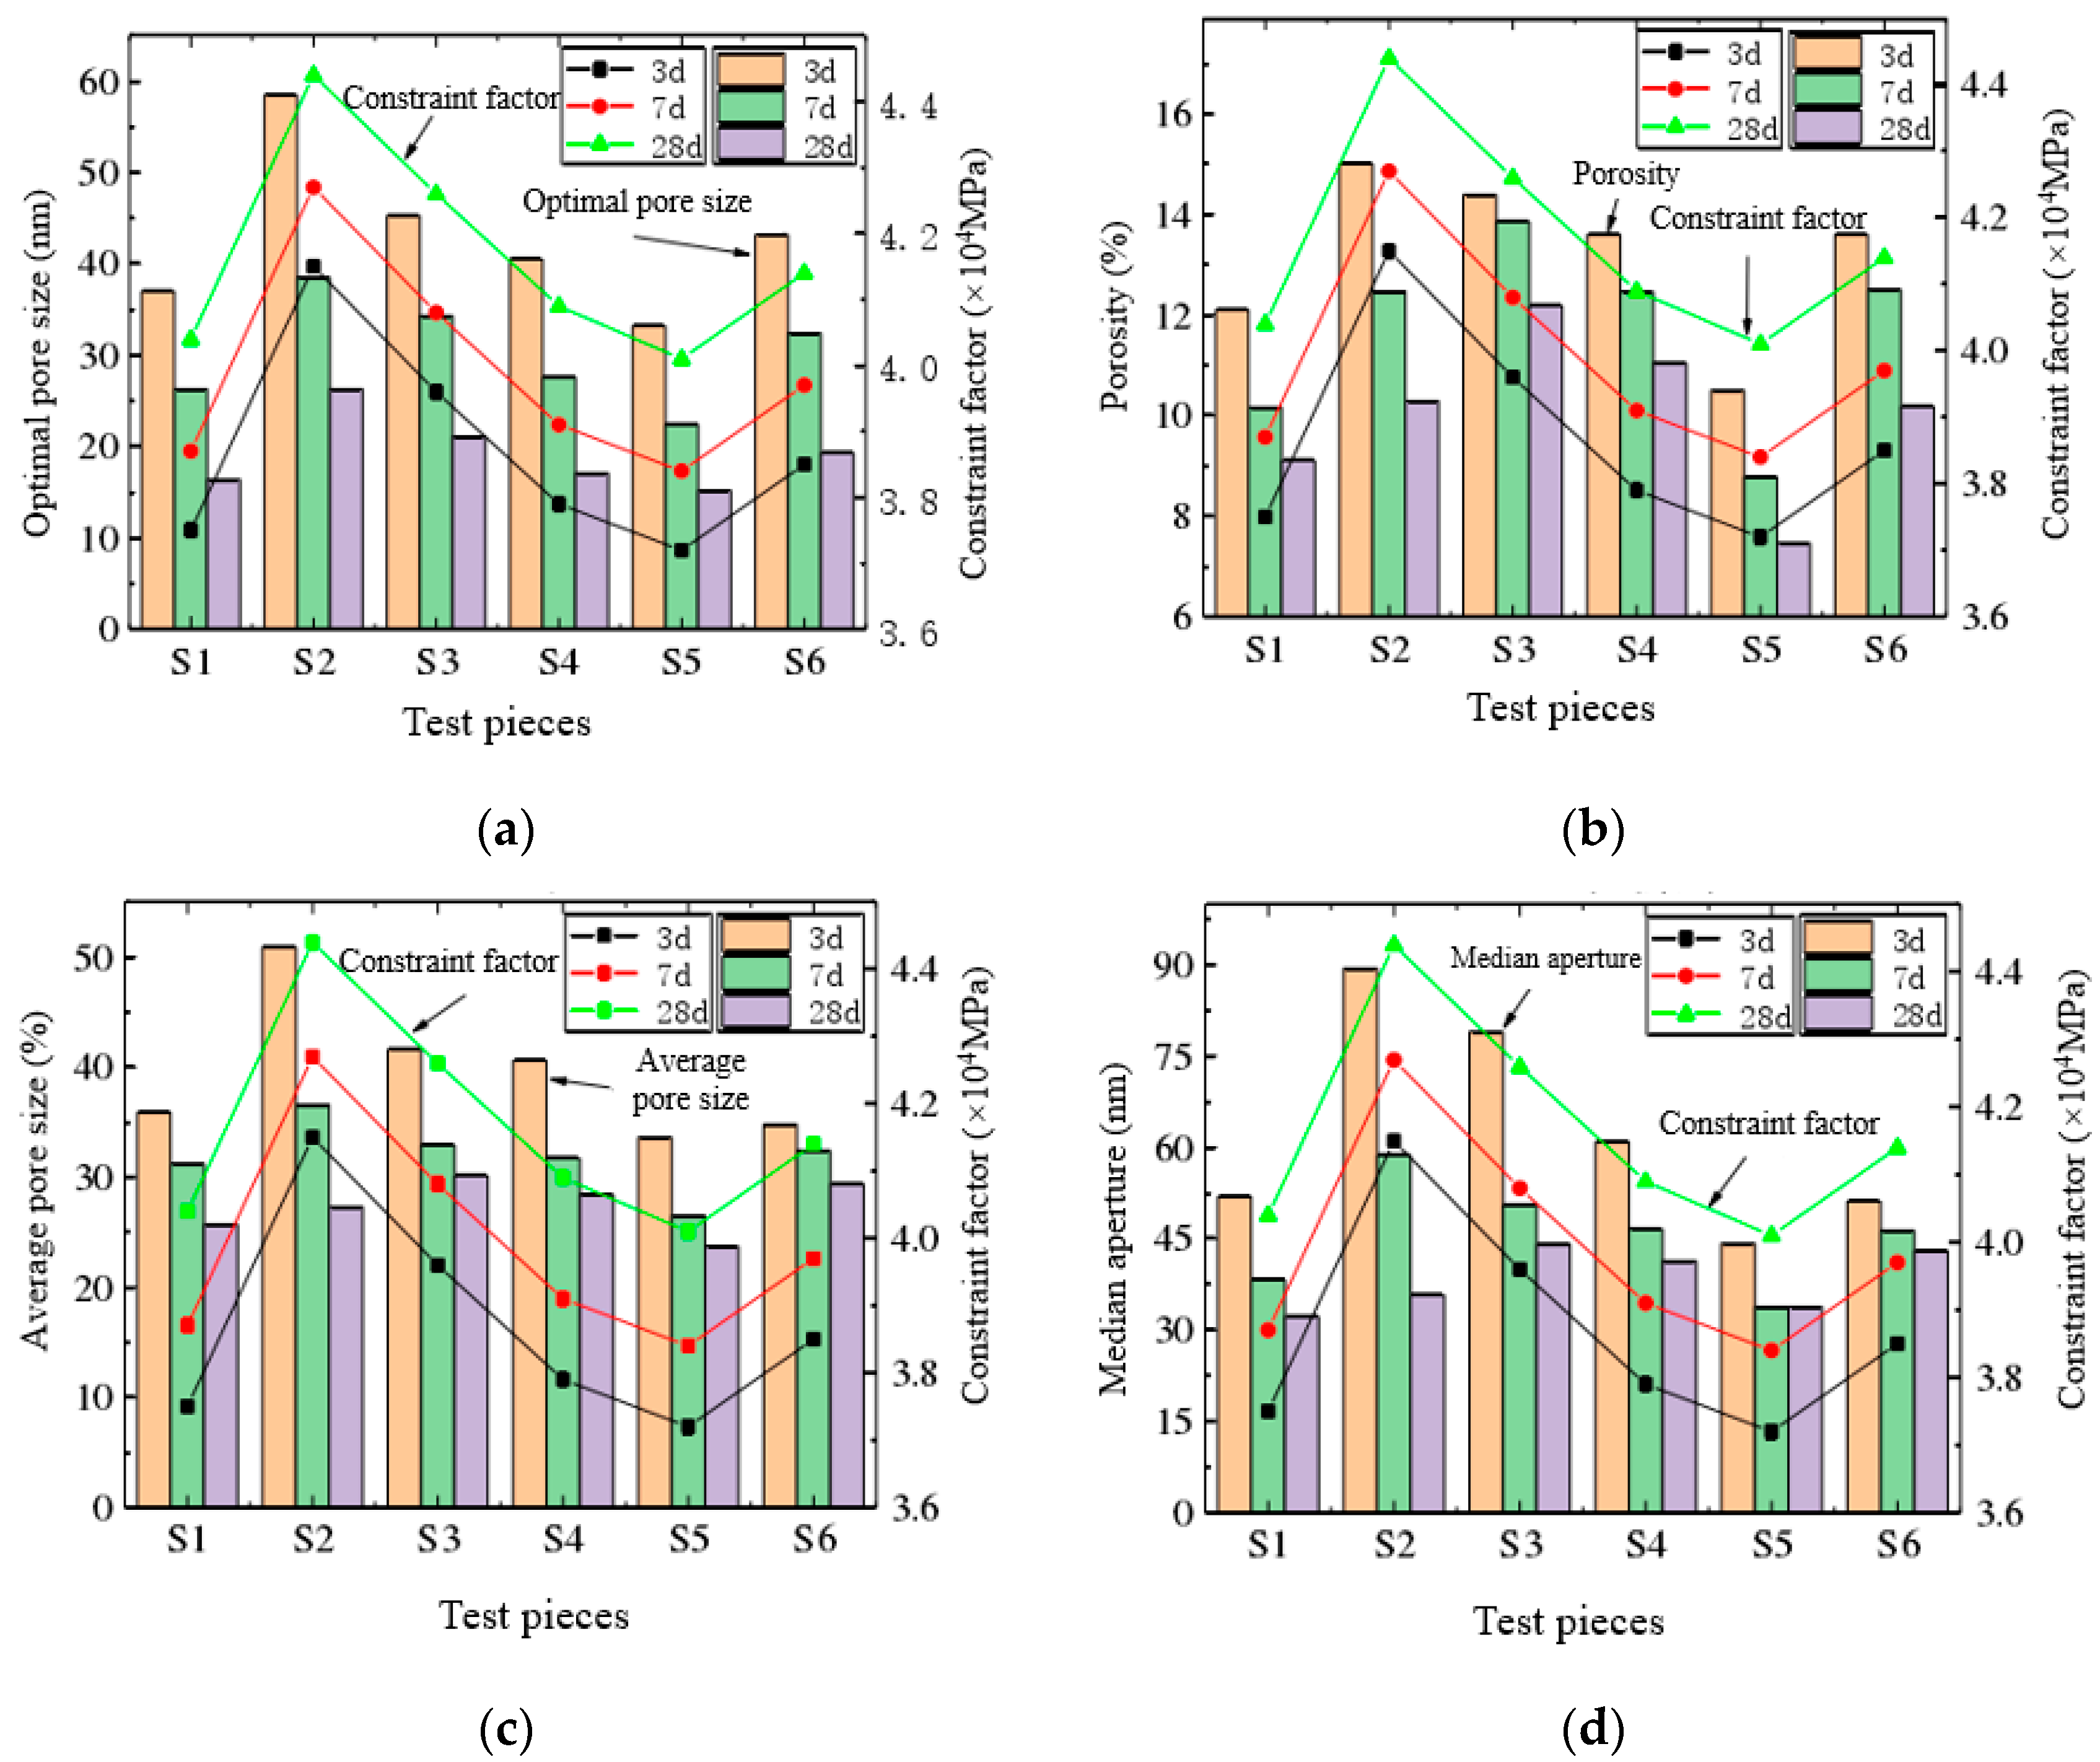
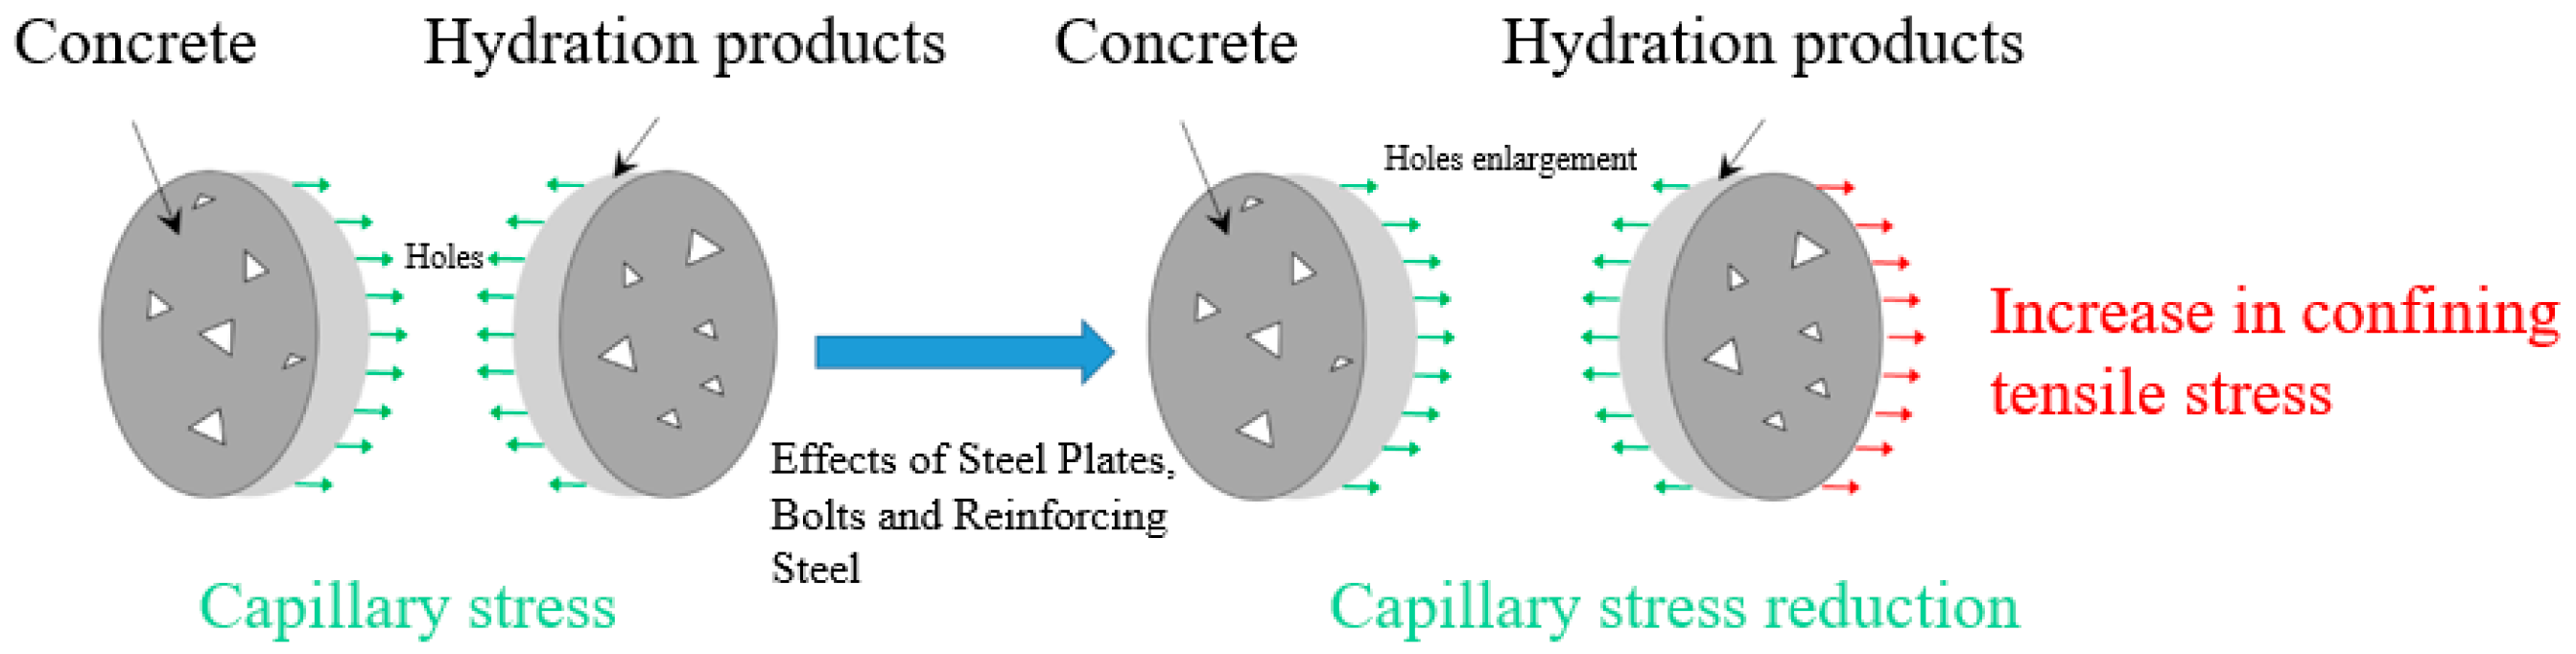
4.2. Influence of Steel Plates, Pins, and Reinforcement on the Structure of Concrete Holes

Figure 7 shows the variation in the internal pore structure parameters (the most cumulative pore size, porosity, average pore size, and median pore size) of concrete with a constraint coefficient. Noticeably, the pore structure of concrete changes with the configuration of steel plates, bolts, and steel bars. Testing the pore structure of concrete with different bolt configurations reveals that increasing the diameter of the bolt will increase the pore structure of concrete when the height and spacing of the bolt remain unchanged. For example, when the height of the stud is maintained at 80 mm and the spacing between the studs is maintained at 200 mm, the S1 specimen with a stud diameter of 16 mm has the highest cumulative pore size, porosity, average pore size, and median pore size of 37.0 nm, 12.1%, 35.9 nm, and 51.9 nm at 3 d aging, respectively. Compared with the S4 specimen with a 19 mm diameter stud, the same parameters were reduced by 3.5 nm, 1.5%, 4.7 nm, and 9.0 nm, respectively.
Reducing the spacing of studs expands the pore structure of concrete when the thickness of the steel plate, diameter of the reinforcement, and height and diameter of the studs are kept constant. For example, when the heights of the studs were both 80 mm and the diameters of the studs were both 16 mm, the highest cumulative pore size, porosity, mean pore size, and median pore size was observed in the S3 specimen with a 100 mm stud spacing, corresponding to 45.3 nm, 14.4%, 41.6 nm, and 79.0 nm, respectively, at 3 d. These were higher than those of the same parameters of the S1 specimen with 200 mm stud spacing, which were 8.3 nm, 2.3%, 5.7 nm and 27.1 nm, respectively.
When the plate thickness, rebar diameter, spigot diameter, and spigot spacing were kept constant, increasing the spigot height expanded the pore structure of the concrete. For example, when the spacings of the studs were all 200 mm and the diameters of the studs were all 16 mm, the highest cumulative pore size, porosity, average pore size, and median pore size were observed in the S5 specimen with a stud height of 60 mm at 3 d, corresponding to 33.2 nm, 10.5%, 33.6 nm, and 44.2 nm, respectively. These represented a decrease compared with the same parameters in the S1 specimen with a stud height of 80 mm by 3.8 nm, 1.6%, 2.2 nm, and 7.7 nm, respectively.
The effect of steel reinforcement on the pore structure of concrete can be determined by comparing the pore structure of these specimens when the thickness of the steel plate is the same as the relevant parameters of the studs (diameter, height, and spacing). Testing the pore structure of concrete with different reinforcement configurations reveals that increasing the diameter of the reinforcement will expand the pore structure. For example, when the thickness of the steel plate was 10 mm, the heights of the studs were all 80 mm, the spacing of the studs were all 200 mm, and the diameters of the studs were all 16 mm. Moreover, the highest cumulative pore size, porosity, average pore size, and median pore size were observed in specimen S6 with a 12 mm reinforcement diameter at 7 d corresponding to 32.4 nm, 12.5%, 32.4 nm, and 46.3 nm, respectively, which were lower than those of a similar specimen S1 by 6.1 nm, 2.3%, 1.2 nm, and 8.1 nm.
The effect of reinforcement on the pore structure of concrete can be investigated by comparing the pore structure of these specimens when the reinforcement parameters are the same as the relevant parameters of the studs (diameter, height, and spacing). By testing the pore structure of concrete with different steel plate configurations, we observed that increasing the thickness of the steel plate expands the pore structure of concrete. For example, when the diameter of the reinforcement is 10 mm, the height of the studs is 80 mm, the spacing of the studs is 200 mm, and the diameter of the studs is 16 mm. Moreover, the highest cumulative pore size, porosity, average pore size, and median pore size were observed in the S2 specimens with a steel plate thickness of 12 mm after 3 d, corresponding to 58.5 nm, 15.0%, 50.9 nm, and 89.4 nm, which were higher than those of S1 specimens equipped with steel plates with a thickness of 10 mm, whose values were 21.5 nm, 2.9%, 15.0 nm, and 37.5 nm, respectively.
As shown in Equation (15), the combined force exerted on the concrete pore walls in the restrained specimens decreased with the increase in the restraining coefficient. Therefore, the stronger the restraint of the concrete by steel plate, studs, and reinforcement, the smaller is the combined force on the concrete pore walls and the lower the shrinkage in the concrete pore structure caused by the combined force, leading to an increase in the pore structure parameters of the concrete. This is consistent with experimental findings; for example, with the same diameter of reinforcement and the same parameters related to bolts, the constraint coefficient of the S1 specimen is less than that of the S2 specimen. Moreover, at 7 d, the highest cumulative pore size, porosity, mean pore size, and median pore size were observed in the S2 specimen, corresponding to 58.5 nm, 15.0%, 50.9 nm, and 89.4 nm, which is higher than that of the same parameter of the S1 member at the same age, whose values were 21.5 nm, 2.9%, 15.0 nm, and 37.5 nm, respectively. This can be interpreted as an increase in the confinement coefficient of S2 due to the increase in the thickness of the steel plate, and the increase in the confinement coefficient leads to a decrease in the combined force applied to the concrete pore walls. Further, the pore structure parameter of the S2 specimen increased in this case. The changes in the pore structure parameters of the concrete due to changes in the diameter of the reinforcement and the parameters of the studs were also observed in the tests.

5. Shrinkage of Complex Internally Confined Concrete

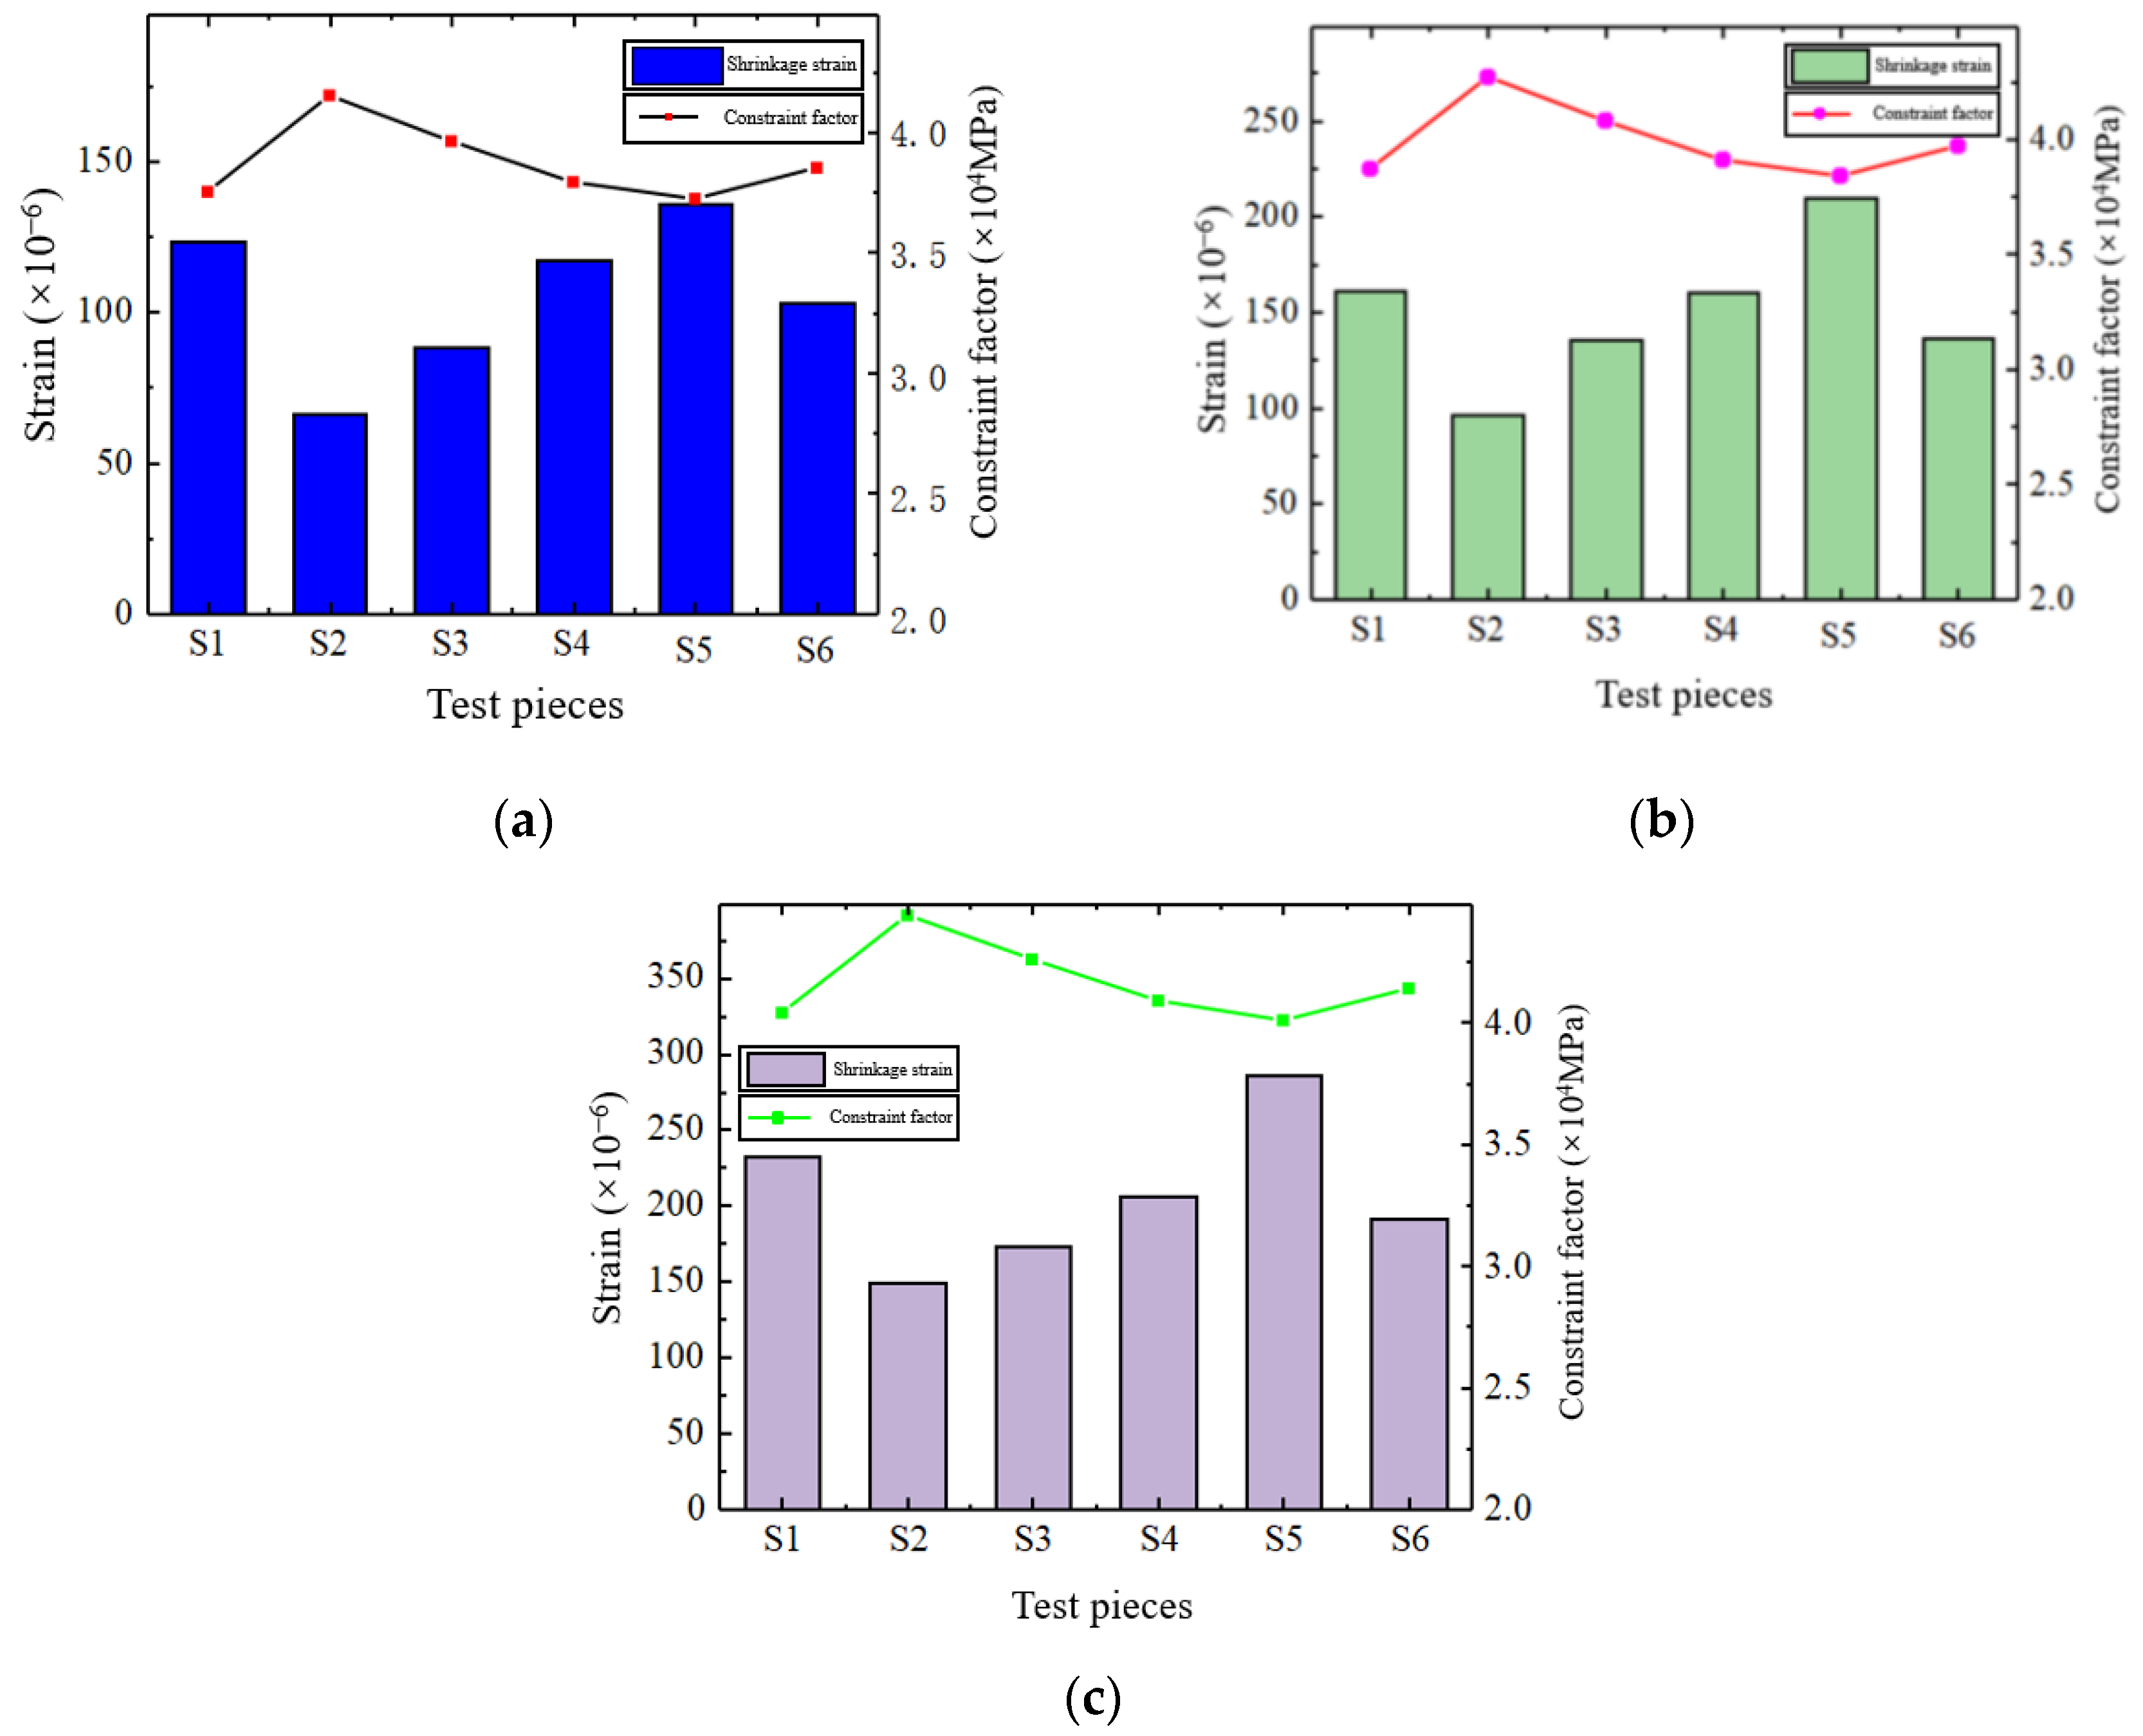
5.1. Effect of Constraint Factor on Concrete Shrinkage

The relationship between the shrinkage deformation of concrete and the constraint coefficient at different ages is shown in Figure 8. Noticeably, for the concrete specimens constrained by the steel plate, studs, and reinforcement, the shrinkage strain is affected by the thickness of the steel plate, diameter of the reinforcement, and the parameters related to the studs when the studs have the same diameter, height, and spacing, and the diameter of the reinforcement is kept the same. When the materials used for the steel plate are the same, the thicker the plate is, the smaller the shrinkage of concrete, as shown in Equations (11) and (15). At the same age, the greater the thickness of the steel plate is, the greater the constraint factor. An increase in the constraint factor leads to a decrease in the combined force acting on the concrete, which results in a decrease in the shrinkage of the concrete. In this study, specimen S2, with a steel plate thickness of 12 mm, has constraint coefficients of 4.15 × 10⁴ MPa, 4.27 × 10⁴ MPa, and 4.44 × 10⁴ MPa at the ages of 3, 7, and 28 d, respectively, which were higher than the constraint coefficients of specimen S1 with a steel plate thickness of 10 mm at the same ages, corresponding to 0.4 × 10⁴ MPa, 0.4 × 10⁴ MPa, and 0.4 × 10⁴ MPa, respectively. The shrinkage values of the S2 specimens at 3, 7, and 28 d were 66 με, 97 με, and 149 με, which were 46.4%, 39.8%, and 35.8% lower than the shrinkage values of the S1 specimens, respectively.
Figure 8 shows that, when the thickness of the steel plate and the diameter of the reinforcement bars are kept constant, the shrinkage values of the concrete are related to the relevant parameters of the studs (diameter, height, and spacing). Moreover, when the height of the studs is kept at 80 mm, and the spacing of the studs is kept at 200 mm, comparing the shrinkage data of the concrete from S1 to S4 revealed that the increase in the diameter of the studs increased the restraining capacity of the studs on the concrete (constraint factor rises), resulting in a decrease in concrete shrinkage (see Figure 8). This result is also observed in Equations (11) and (15). At the same age, the larger the diameter of the studs, the greater the constraint factor. An increase in the constraint factor leads to a decrease in the combined force acting on the concrete, which results in a decrease in the shrinkage of the concrete. In this study, the constraint coefficients of specimen S4 at 3, 7, and 28 d were 3.79 × 10⁴ MPa, 3.91 × 10⁴ MPa, and 4.09 × 10⁴ MPa, respectively, which were higher than those of specimen S1 at the same ages by 0.04 × 10⁴ MPa, 0.04 × 10⁴ MPa, and 0.05 × 10⁴ MPa, respectively. Regarding the constraint coefficients of specimen S4 at ages of 3, 7, and 28 d, the shrinkage values were 117 με, 160 με, and 206 με, respectively, which were lower than those of specimen S1 by 6.33 με, 0.67 με, and 25 με.
When the thickness of the steel plate, diameter of the reinforcement, diameter of the studs, and the spacing of the studs were kept constant, increasing the height of the studs increased the restraining ability of the studs on the concrete (the restraining coefficient rises), as revealed by comparing the concrete shrinkage data of S1 and S5, which led to a decrease in the shrinkage of the concrete (see Figure 8). At the same age, the greater the height of the stud is, the greater the constraint factor. The increase in the constraint factor leads to a decrease in the combined force acting on the concrete, which results in a decrease in the shrinkage of the concrete. In this study, the constraint coefficients of specimen S1 at the ages of 3, 7, and 28 d were 3.75 × 10⁴ MPa, 3.87 × 10⁴ MPa, and 4.04 × 10⁴ MPa, respectively, which were higher than those of specimen S5 at the same ages by 0.03 × 10⁴ MPa, 0.03 × 10⁴ MPa, and 0.03 × 10⁴ MPa, respectively. The constraint coefficients of specimen S1 at ages of 3, 7, and 28 d for the shrinkage values were 124 με, 161 με, and 232 με, respectively, which were 12 με, 48 με, and 53 με less than those of the S5 specimens.
When the plate thickness, rebar diameter, spigot diameter, and spigot height were kept constant, decreasing the spacing of the spigots increased the ability of the spigot to confine the concrete (confinement coefficient rises), which leads to a decrease in the shrinkage of the concrete, as revealed by comparing the concrete shrinkage data of S1 and S3. The same results are obtained from Equations (11) and (15). At the same age, the smaller the spacing of the studs is, the greater the constraint factor. The increase in the constraint factor leads to a decrease in the combined force acting on the concrete, which results in a decrease in the shrinkage of the concrete. In this study, the constraint coefficients of specimen S3 at the ages of 3, 7, and 28 d were 3.96 × 10⁴ MPa, 4.08 × 10⁴ MPa, and 4.26 × 10⁴ MPa, respectively, which were higher than those of specimen S1 at the same ages by 0.21 × 10⁴ MPa, 0.21 × 10⁴ MPa, and 0.22 × 10⁴ MPa, respectively. For the constraint coefficients of specimen S3 at ages of 3, 7, and 28 d, the shrinkage values were 88 με, 136 με, and 174 με, respectively, which were 28.8%, 15.6%, and 25.1% lower than those of the S4 specimens.
When the thickness of the steel plate and the parameters related to the bolts (height, spacing, and diameter) were kept constant, the shrinkage of the concrete was affected by the diameter of the reinforcement bars, as revealed by comparing the concrete shrinkage data of S1 and S6. Moreover, when the diameter of the reinforcement bars is larger, the shrinkage of the concrete is smaller (see Figure 8). This result is corroborated by Equations (11) and (15). At the same age, the larger the diameter of the reinforcement, the larger is the constraint factor. An increase in the constraint coefficient leads to a decrease in the combined force acting on the concrete, which results in a decrease in the shrinkage of the concrete. In this study, the constraint coefficients of specimen S6 at the ages of 3, 7, and 28 d were 3.85 × 10⁴ MPa, 3.97 × 10⁴ MPa, and 4.14 × 10⁴ MPa, respectively, which were higher than those of specimen S1 at the same ages by 0.1 × 10⁴ MPa, 0.1 × 10⁴ MPa, and 0.1 × 10⁴ MPa, respectively. Moreover, the constraint coefficients of specimen S6 at 3, 7, 28 d corresponded to shrinkage values of S6 103 με, 136 με, and 191 με, respectively, which were 16.7%, 15.4%, and 17.7% less than those of the S1 specimen.

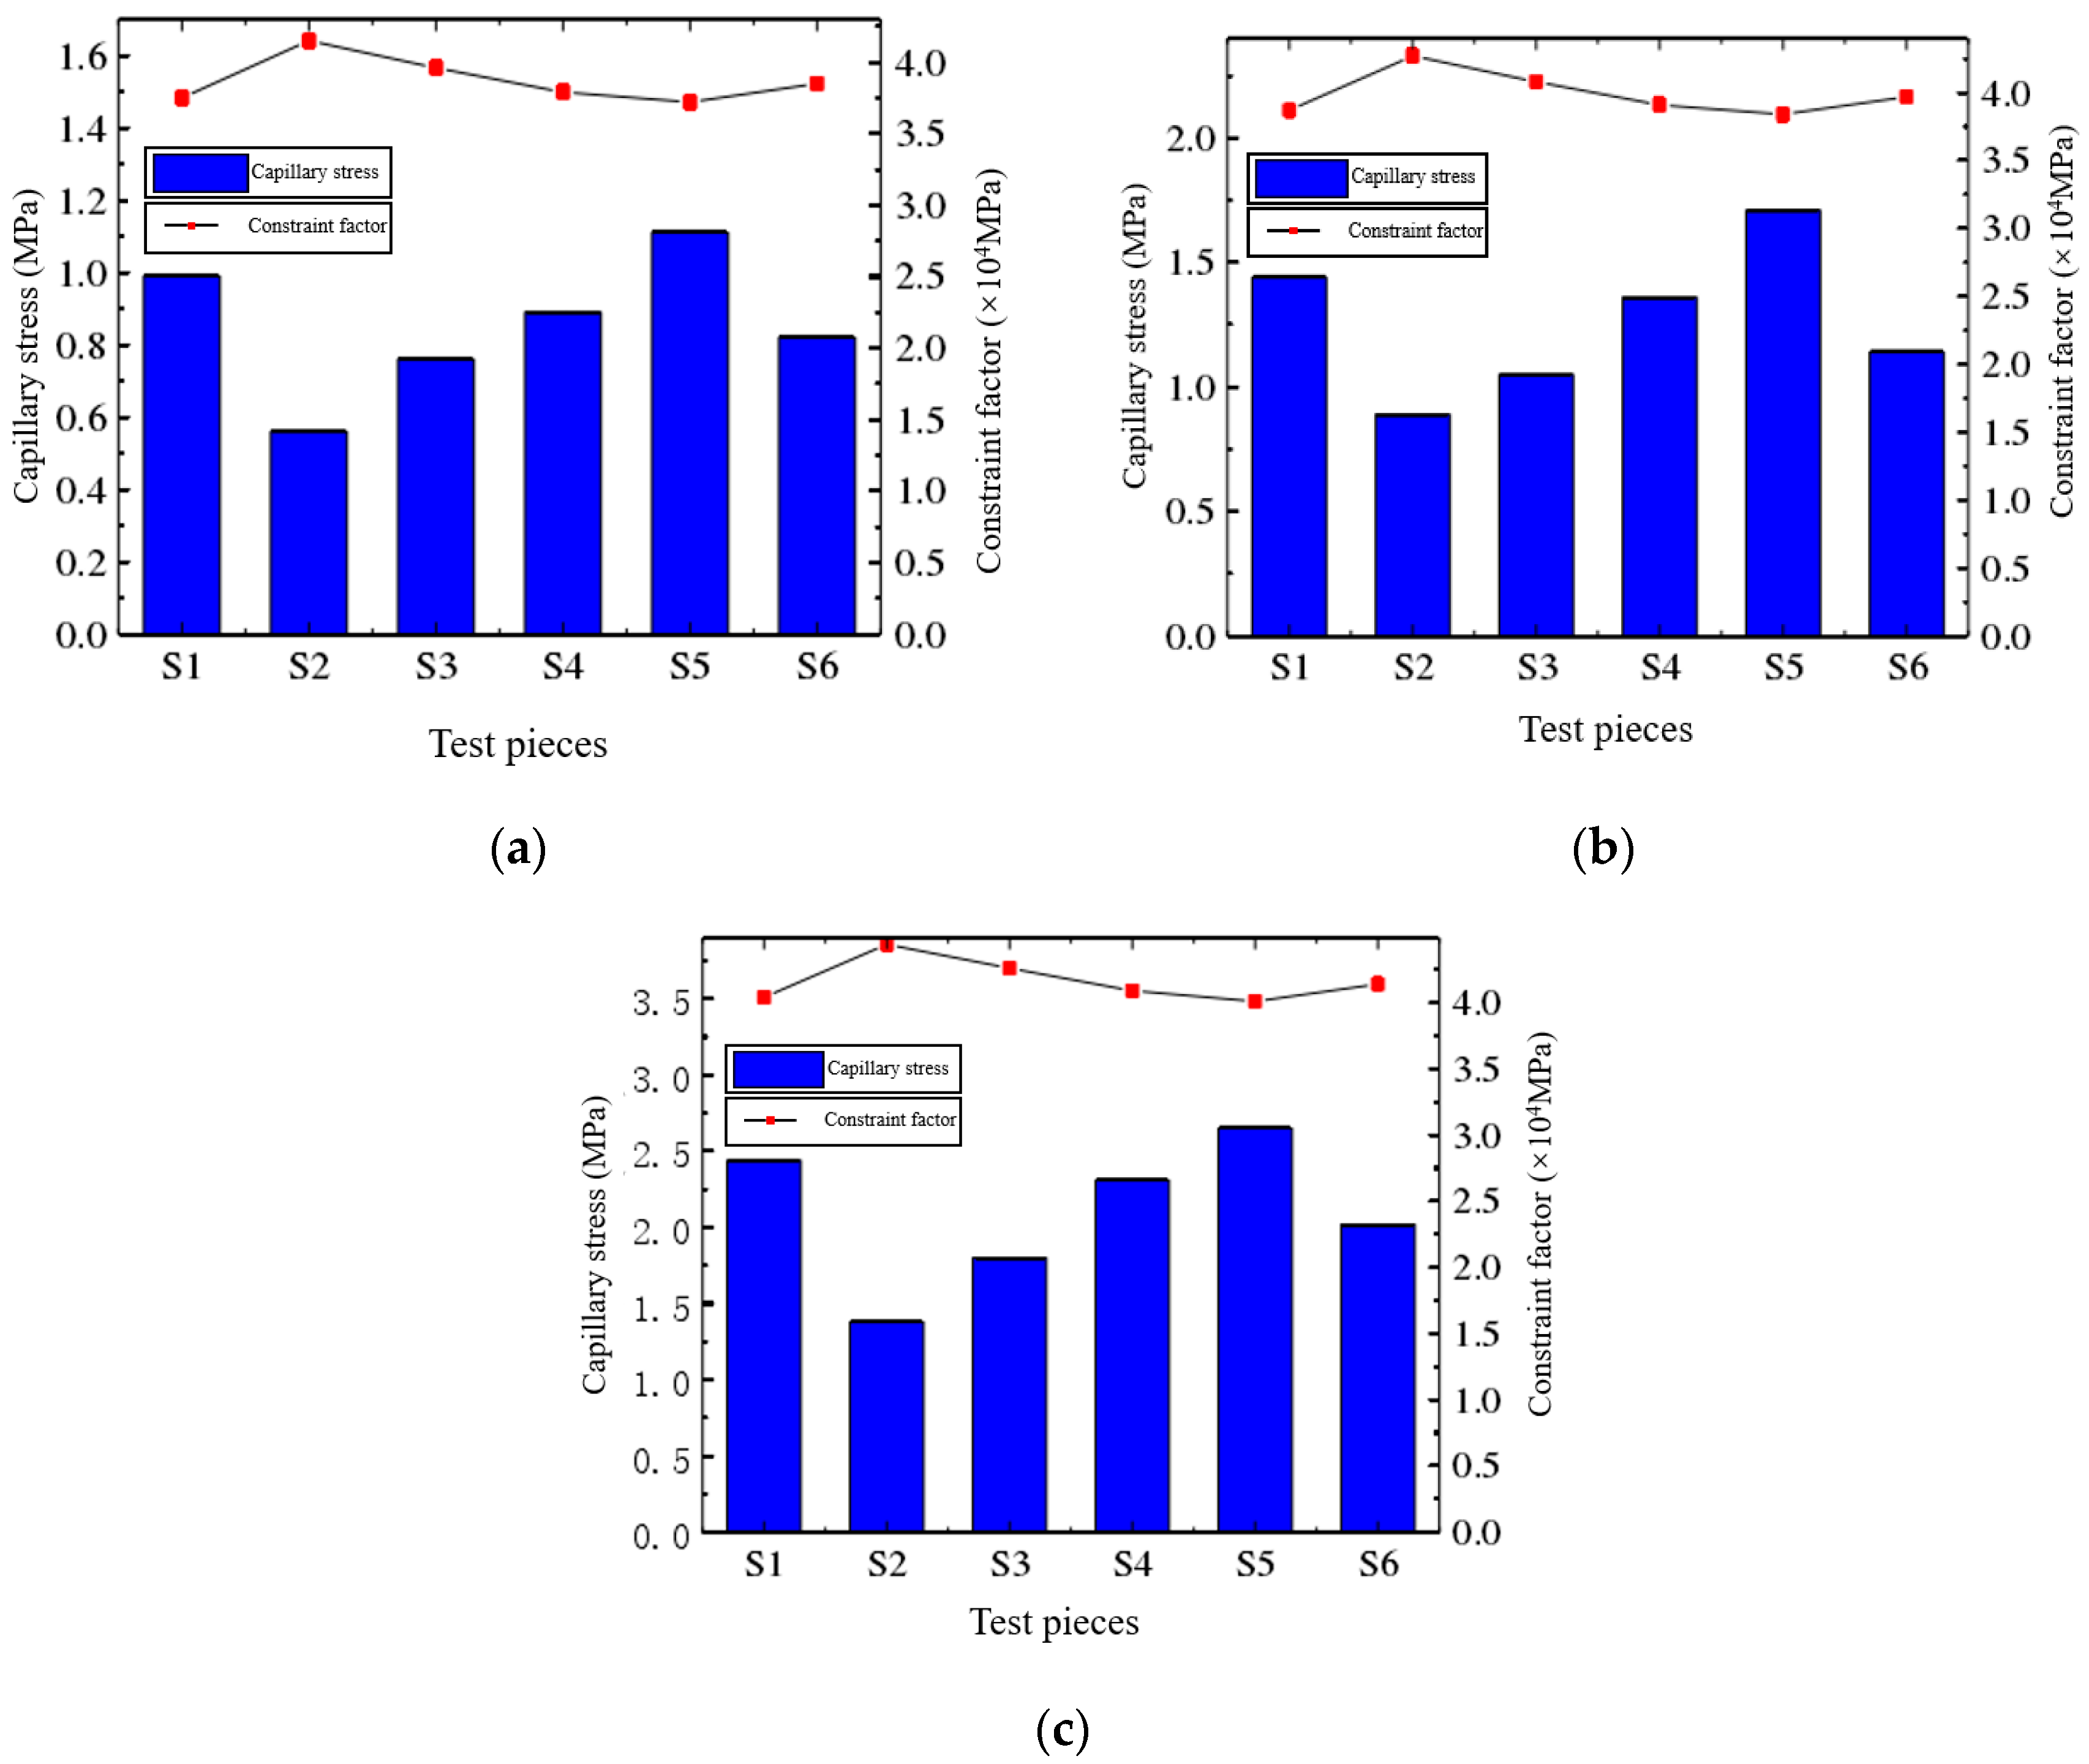
5.2. Effect of Constraint Coefficient on Capillary Pore Stresses

Capillary pore stress is the main driver of shrinkage deformation in concrete. Table 5 and Figure 9 present the capillary pore stresses for each specimen at 3, 7, and 28 d. The test results reveal that the capillary pore stresses are affected by the thickness of steel plates, the diameter of reinforcement, and the relevant parameters of studs in concrete specimens restrained by steel plates, studs, and reinforcement because changing the respective parameters at the same age changes the restraining coefficients of the concrete. Moreover, greater restraining coefficients of the concrete result in the pore structural parameters (the maximum allowable pore diameters, porosity, average pore size, median pore size, and others) of the restraining specimen increasing, which, according to Equation (1), leads to a reduction in capillary pore stress in concrete.
Table 5 and Figure 9 reveal that the thicker the steel plate, the lower the capillary pore stresses when the diameter, height, and spacing of the studs are kept constant and the diameters of the reinforcement and the material used for the steel plate are the same. This is because the constraint factor increases when the thickness of the steel plate is greater at the same age. The increase in the confinement factor causes the pore structure of the confined specimen to expand, leading to a decrease in the capillary pore stress in concrete (see Figure 9). In this study, the constraint coefficients of specimen S1 and specimen S2 were sequentially increased, and a sequential decrease in their capillary pore stresses was observed in the tests. For example, at the ages of 3, 7, and 28 d, the capillary pore stresses of specimen S2 were 0.56 MPa, 0.89 MPa, and 1.40 MPa, respectively, which were 0.42, 0.55, and 1.01 lower than the capillary pore stresses of specimen S1 at the same ages.
The analysis in Figure 9 reveals that, when the steel plate thickness and the diameter of the reinforcement bars remain unchanged, the concrete capillary pore stress is related to the stud parameters (diameter, height, and spacing). Moreover, when the height of the studs was kept at 80 mm and the spacing of the studs at 200 mm, the capillary pore stresses of the concrete in contrasting test specimens S1 and S4 reveal that the increase in the diameter of the studs increased the capacity (constraint coefficient increases) of the studs to restrain the concrete (constraint coefficient rises), decreasing the capillary pore stress of the concrete (see Figure 9). For example, the confinement coefficients of specimen S4 at the ages of 3, 7, and 28 d were 3.79 × 10⁴ MPa, 3.91 × 10⁴ MPa, and 4.09 × 10⁴ MPa, respectively, which were higher than those of specimen S2 at the same ages by 0.04 × 10⁴ MPa, 0.04 × 10⁴ MPa, and 0.05 × 10⁴ MPa, and the corresponding capillary pore stresses were reduced from 0.99 MPa, 1.44 MPa, and 2.44 MPa in specimen S1 to 0.89 MPa, 1.36 MPa, and 2.31 MPa in specimen S4.
When the thickness of the steel plate, diameter of the reinforcement, diameter of the studs, and spacing of the studs were kept constant, increasing the height of the studs increased the ability of the studs to restrain the concrete (the restraining coefficient rises), as revealed by the comparisons of the concrete capillary pore stress data of specimens S1 and S5 in Figure 9, which leads to a decrease in the capillary pore stresses of the concrete (see Figure 9). For example, at the ages of 3, 7, and 28 d, the confinement coefficients of the S1 specimens with a stud height of 80 mm were 3.75 × 10⁴ MPa, 3.87 × 10⁴ MPa, and 4.04 × 10⁴ MPa, respectively, which were higher than the confinement coefficients of the S5 specimens configured with a stud height of 60 mm at the same ages, which corresponded to 0.03 × 10⁴ MPa, 0.03 × 10⁴ MPa, and 0.03 × 10⁴ MPa, respectively. Moreover, the capillary pore stresses of the S1 specimen at 3, 7, and 28 d were 0.99 MPa, 1.44 MPa, and 2.44 MPa, respectively, which were, respectively, 0.12 MPa, 0.27 MPa, and 0.21 MPa lower than those of the S5 specimen.
When the thickness of the steel plate, diameter of the reinforcement, diameter of the studs, and height of the studs were kept constant, comparing the concrete capillary pore stress data of specimens S1 and S3 in Figure 9 reveals that the reduction in the spacing of the studs increases the ability of the studs to restrain the concrete (the restraining coefficient rises), which leads to a decrease in the capillary pore stresses of the concrete (see Figure 9). For example, at the ages of 3, 7, and 28 d, the constraint coefficients of the S3 specimens configured with a stud spacing of 100 mm were 3.96 × 10⁴ MPa, 4.08 × 10⁴ MPa, and 4.26 × 10⁴ MPa, respectively, which were higher than the constraint coefficients of S1 specimens configured with a stud spacing of 200 mm at the same ages, corresponding to 0.21 × 10⁴ MPa, 0.21 × 10⁴ MPa, and 0.22 × 10⁴ MPa, respectively. Moreover, the capillary pore stresses of the S3 specimens at 3, 7, and 28 d were 0.76 MPa, 1.05 MPa, and 1.80 MPa, respectively, which in turn were 0.22 MPa, 0.40 MPa, and 0.64 MPa lower than the capillary pore stresses of the S1 specimens.
When the thickness of the steel plate and the relevant parameters (height, spacing, and diameter) of the bolts were kept constant, the capillary pore stress of the concrete was affected by the diameter of the reinforcement bars, as revealed by the comparison of specimens S1 and S6 in Figure 9. When the diameter of the reinforcement bars was larger, the capillary pore stress of the concrete was smaller. This is because, at the same age, the larger the diameter of the reinforcement bar, the larger the confinement coefficient, which expands the pore structure of the confined specimen, as shown in Equation (1), leading to a decrease in the capillary pore stress in concrete. In this study, the constraint coefficients of specimens S1 and S6 increased due to the larger diameter of the reinforcement bars. Accordingly, a sequential decrease in their capillary pore stresses was observed in the tests. For example, the confinement coefficients of specimen S6 at 3, 7, and 28 d were 3.85 × 10⁴ MPa, 3.97 × 10⁴ MPa, and 4.09 × 10⁴ MPa, respectively, which were higher than the confinement coefficients of specimen S1 at the same ages by 0.1 × 10⁴ MPa, 0.1 × 10⁴ MPa, and 0.1 × 10⁴ MPa, respectively, and those of the S6 specimen at the ages of 3, 7, and 28 d. The capillary pore stresses of the S6 specimen at 3, 7, and 28 d of age were 0.82 MPa, 1.14 MPa, and 2.02 MPa, respectively, which were 0.16 MPa, 0.30 MPa, and 0.42 MPa lower than those of the S1 specimen.

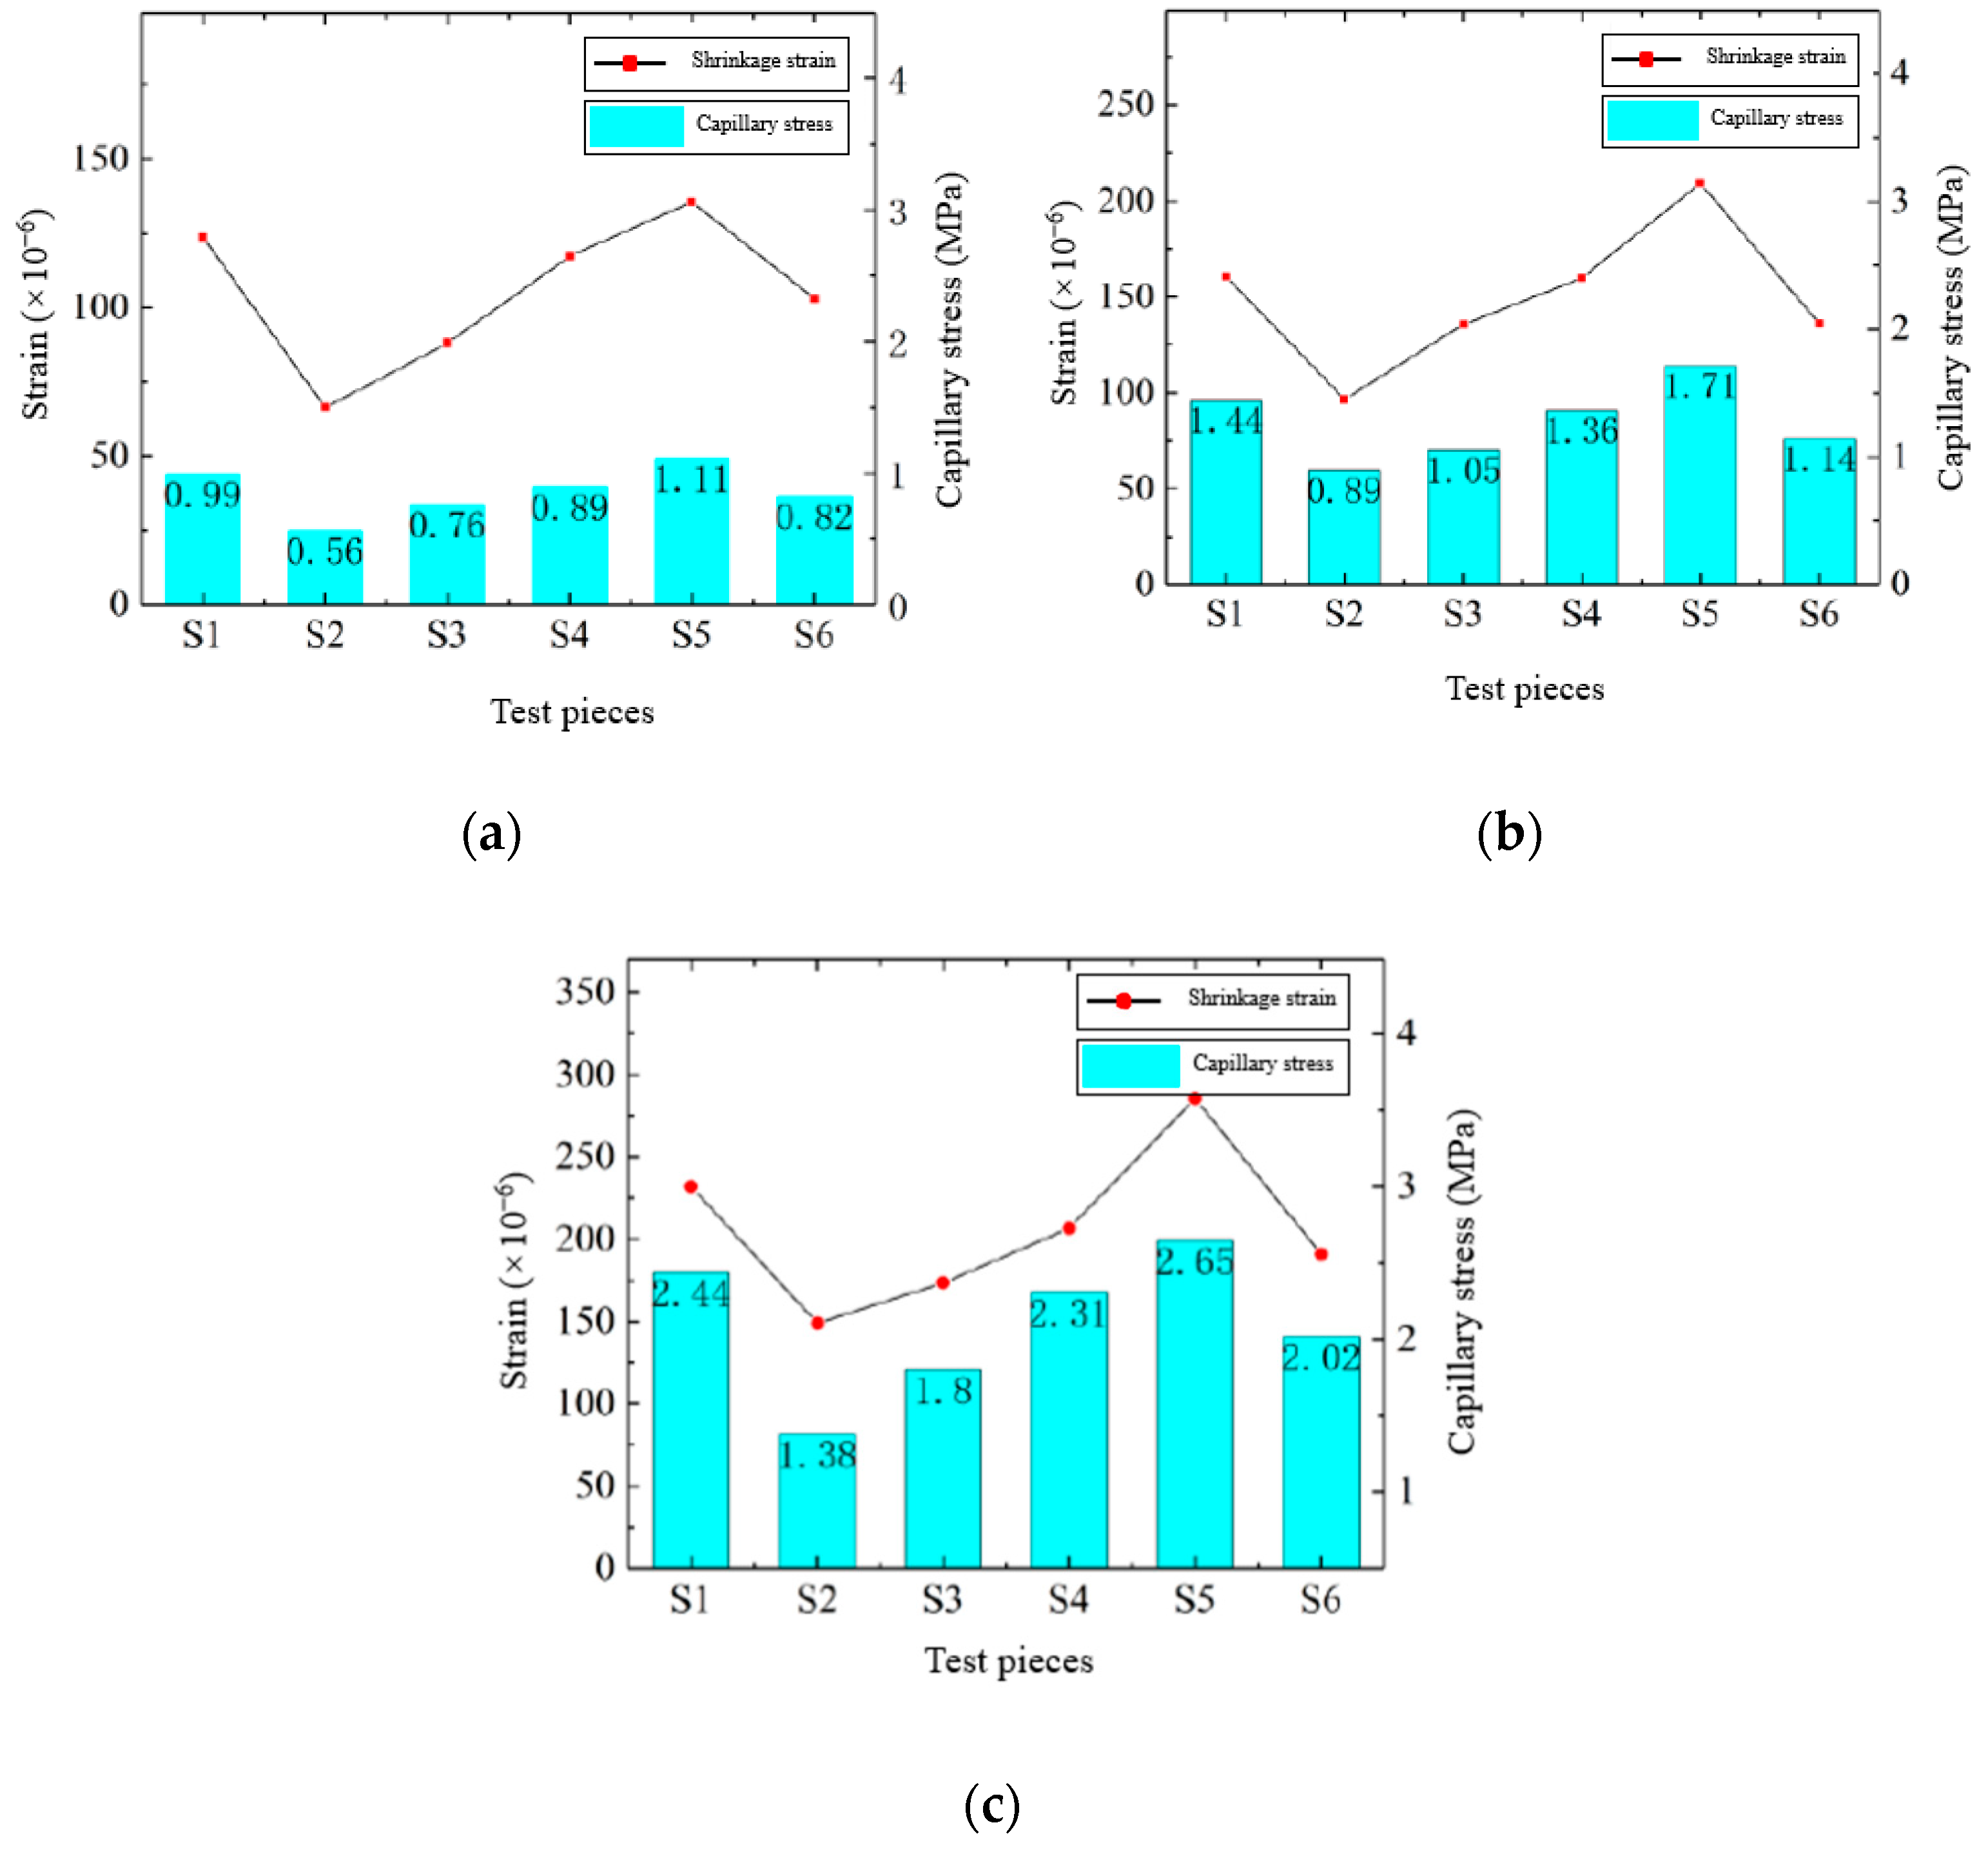
5.3. Effect of Capillary Pore Stress on Concrete Shrinkage

The relationship between the capillary pore stress and concrete shrinkage of specimens at different ages is shown in Figure 10. Noticeably, the greater the capillary pore stress, the greater the shrinkage deformation of concrete. Meanwhile, according to the previous analysis, the concrete capillary pore stress decreases with the increase in the constraint coefficient, which suggests that the constraining effect of the steel plate, studs, and rebar on the shrinkage of the concrete is not only due to the increase in the constraining tensile stress because of the coordination of the deformation between the concrete, the steel plate, the studs, and the steel rebar but also the decrease in the capillary pore stress in the concrete due to the presence of the steel plate, studs, and rebar; the principle of this action is shown in Figure 11.

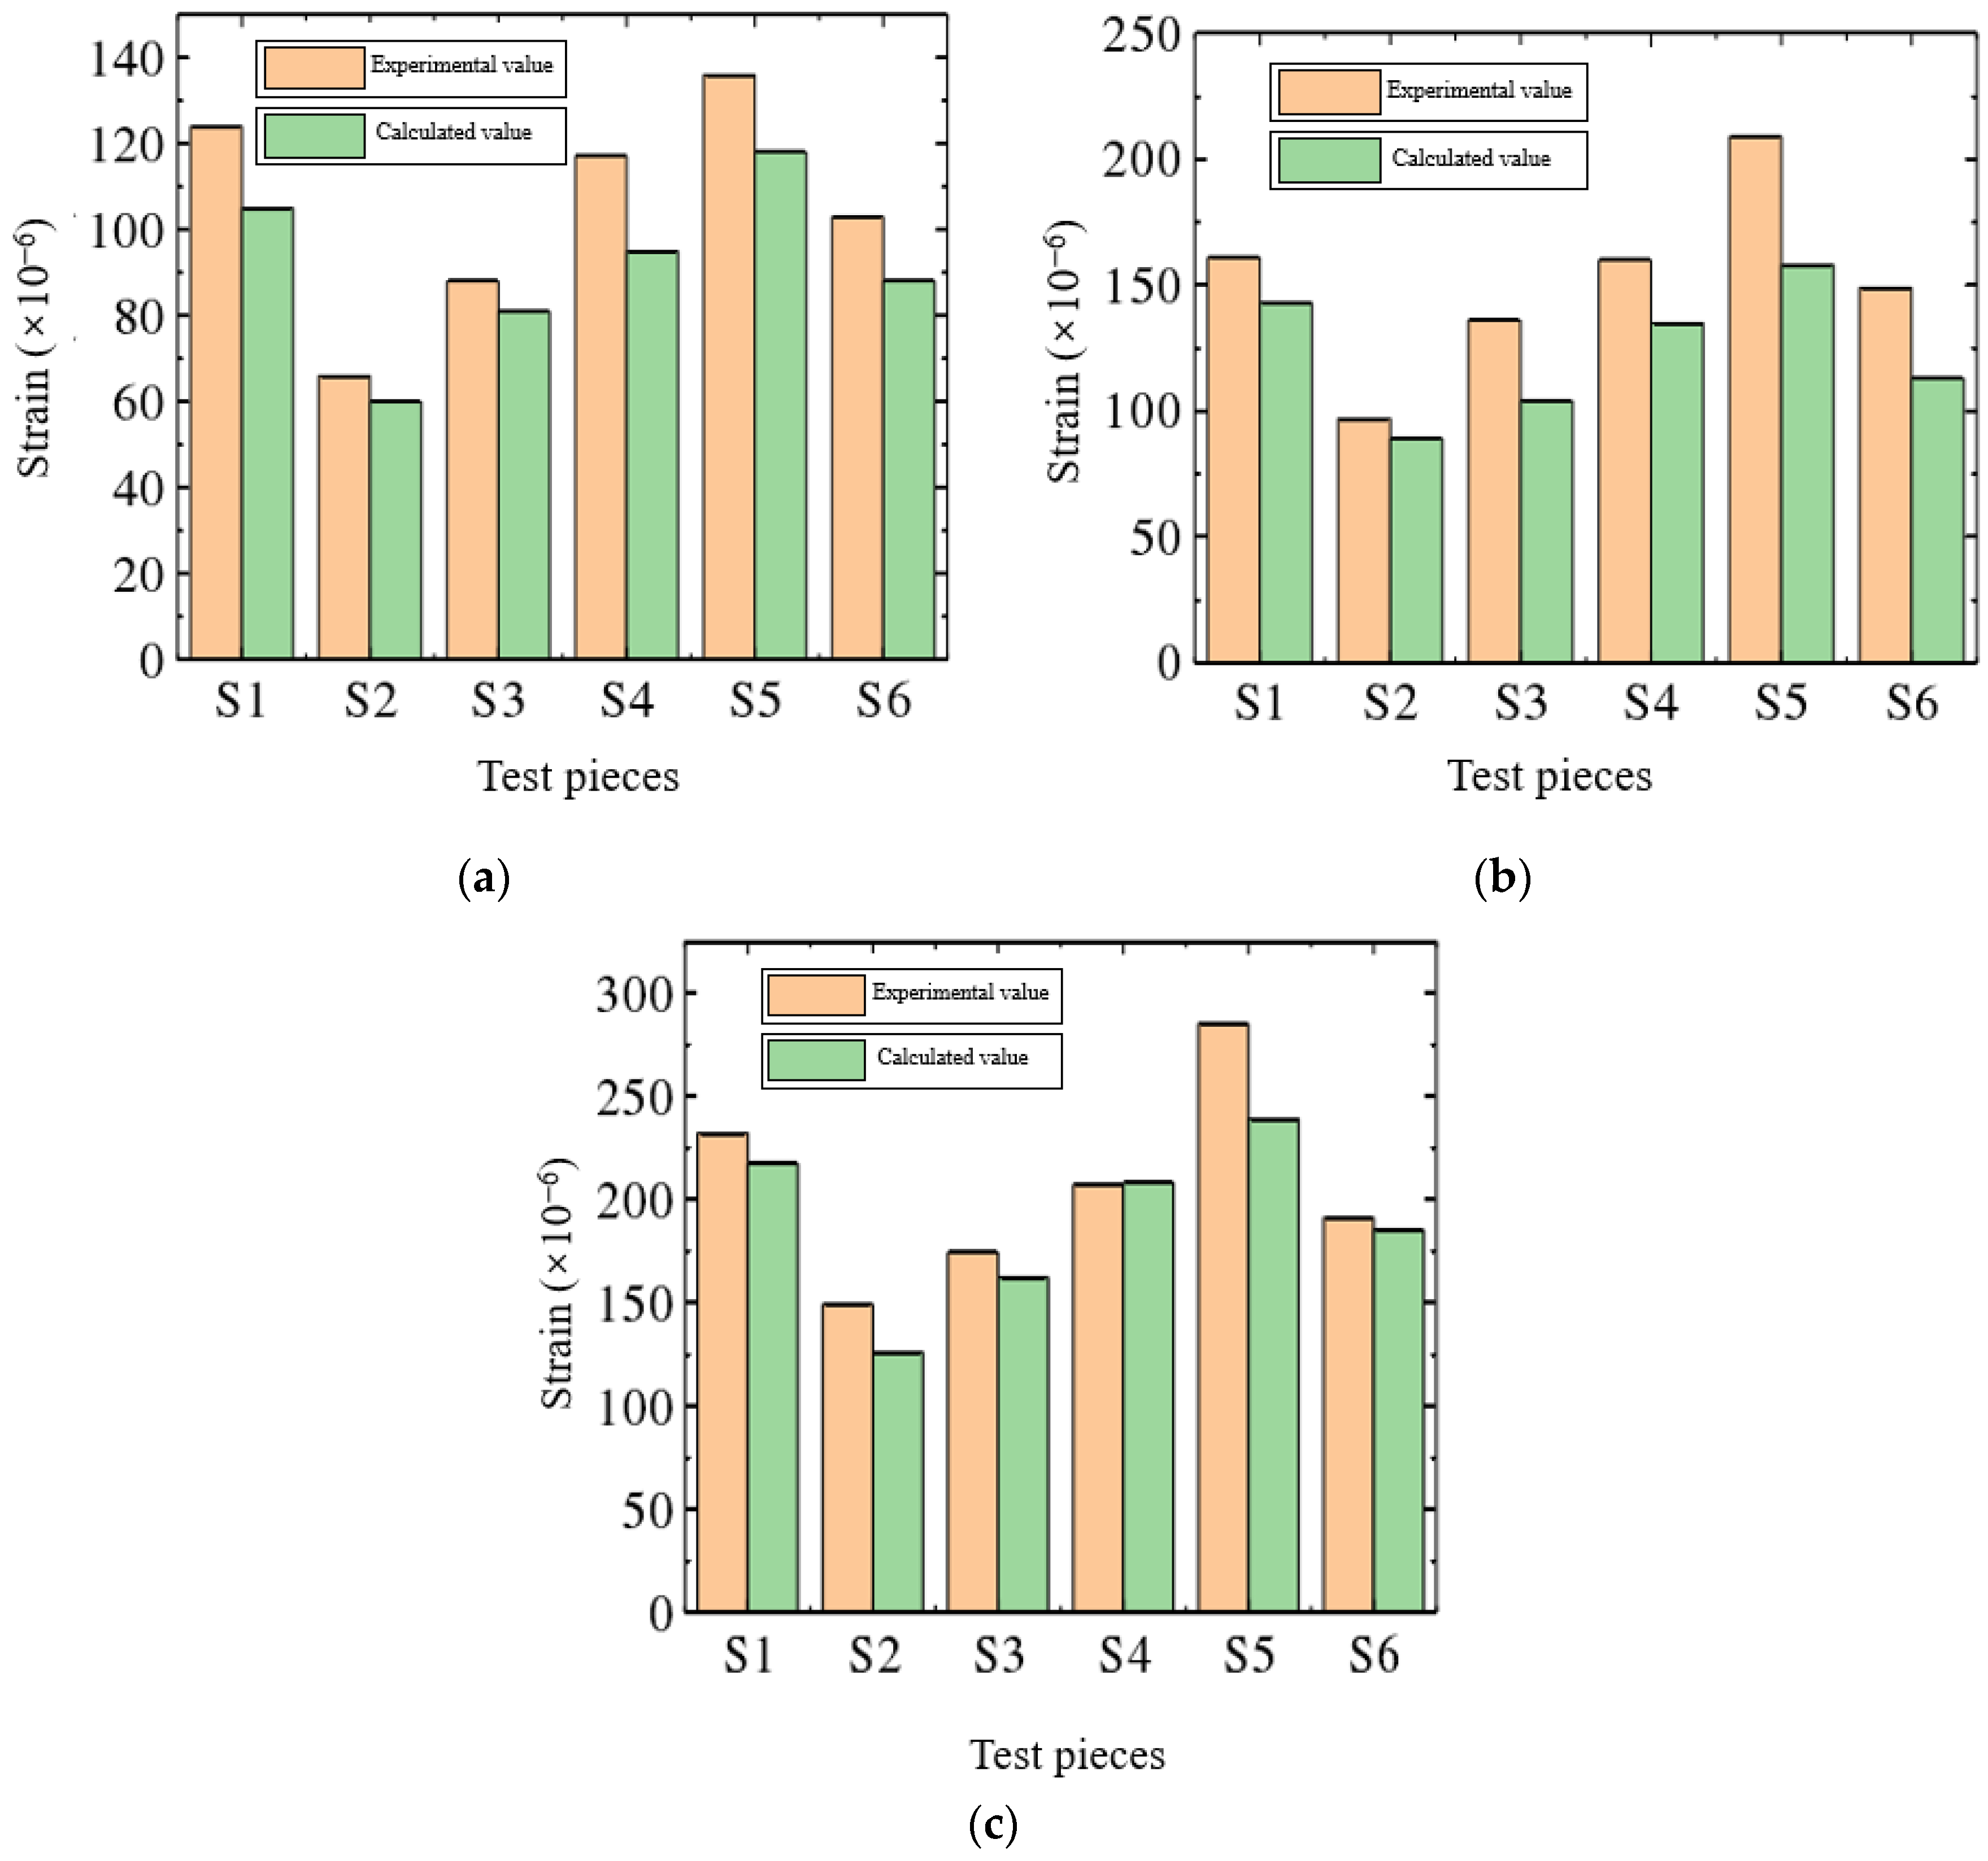
5.4. Shrinkage Prediction of Complex Internally Confined Concrete

The prediction of shrinkage in restrained concrete is important for assessing the risk of concrete shrinkage cracking. In this paper, a prediction model for the shrinkage of concrete restrained by steel plates, spigots, and reinforcement is derived based on the capillary pore stress theory (Equation (11)). To verify the accuracy of this model, the shrinkage test values of various types of restrained concrete specimens at the ages of 3, 7, and 28 d were compared with the calculated values obtained through shrinkage modeling. The modulus of elasticity of steel plates and spigots was taken as 206,000 MPa, as suggested in GB 50017-2017 [29]. The maximum number of holes for each type of specimen at each age is given in Figure 7.
Table 6 and Figure 12 present the results of the comparison between the shrinkage test results and the predicted values derived from the shrinkage model calculation. Figure 12 shows that the calculated values are in good agreement with the measured values, and the average value of the prediction error was calculated to be less than 15%, which indicates that the constrained concrete shrinkage model proposed in this paper can effectively predict the shrinkage of concrete constrained by steel plates, pins, and reinforcement.

6. Conclusions

Through experiments and theoretical analysis, this study investigates the early shrinkage and pore structure of concrete under complex internal constraints. The following conclusions are drawn based on the research results:
  • The degree of the restraining of concrete by the steel plate, studs, and reinforcement is expressed by the restraining coefficient λ. The larger the restraining coefficient, the stronger the restraining effect. The constraint coefficient increases with the increase in the steel plate thickness, reinforcement diameter, stud diameter, and stud height, and increases with the decrease in stud spacing.
  • Steel plates, studs, and reinforcement have an important effect on concrete shrinkage, which decreases with the increase in the thickness of the steel plate, diameter of the reinforcement, diameter of the studs, and the height of the studs and increases with the increase in the stud spacing. This effect is not only due to the coordination of the deformation of the steel plate, studs, and reinforcement but also because the increase in the corresponding parameter increases the constraint coefficient. Moreover, the constraint factor will lead to a reduction in the capillary pore stress, which leads to a decrease in the shrinkage of the concrete.
  • Comparing the measured shrinkage strain values of restrained concrete at the ages of 3, 7, and 28 d with the predicted values of the shrinkage model revealed that the average error predicted during each age was below 15%. This proves that the shrinkage model is feasible for predicting the shrinkage strain of concrete under the joint constraints of steel plates, bolts, and steel bars.
The shrinkage of concrete, especially under constraint conditions, is a complex problem. Therefore, there are still some issues that need further research in this study. For example, this article only considers the shrinkage deformation of concrete in the one-dimensional length direction, while in practical engineering, the shrinkage deformation of steel plate concrete composite shear walls is three-dimensional, which is different from the actual situation. In future, it will be necessary to conduct further research on three-dimensional shrinkage deformation. In addition, although there are currently no reports on the impact of “size effect” on concrete shrinkage test results, whether there will be size effects and what impact size effects will have when many constraint conditions are added to concrete is also one of the research subjects worth examining in the future.

Author Contributions

F.Z. and H.J.: conceptualization, investigation, methodology, investigation, data curation, writing—original draft, writing—review and editing, formal analysis, L.H.: supervision, resources, project administration, funding acquisition writing—original draft, writing—review and editing, visualization. Y.H., Z.X., Z.Z., M.L., B.W. and X.Z.: writing—original draft, writing—review and editing. All authors have read and agreed to the published version of the manuscript.

Funding

This research received no external funding.

Data Availability Statement

Not applicable.

Acknowledgments

The authors greatly acknowledge the financial support for publication fees by the School of Civil Engineering, Chongqing University, China. Also, the authors are very grateful to Lin Chen for his contribution to this paper.

Conflicts of Interest

The authors declare no conflict of interest.

References

  1. Guo, D.; Ma, Y.; Zhao, G.; Zhang, M.; Qiu, J. Seismic behavior of steel-plate encased concrete shear wall with paralleled circular CFST columns: Laboratory test and numerical simulation. Structures 2023, 49, 240–255. [Google Scholar] [CrossRef]
  2. Wang, W.; Ren, Y.; Lu, Z.; Song, J.; Han, B.; Zhou, Y. Experimental study of the hysteretic behaviour of corrugated steel plate shear walls and steel plate reinforced concrete composite shear walls. J. Constr. Steel Res. 2019, 160, 136–152. [Google Scholar] [CrossRef]
  3. Zhang, J.; Li, X.; Cao, W.; Yu, C. Seismic behavior of composite shear walls incorporating high-strength materials and CFST boundary elements. Eng. Struct. 2020, 220, 110994. [Google Scholar] [CrossRef]
  4. Li, B.; Li, J.; Xu, W. Dynamic Time Analysis of the Composite Shear Wall on the Grid-Tube-Type Double Steel Plate Wall with Infilled Concrete; IOP Conference Series: Earth and Environmental Science; IOP Publishing: Bristol, UK, 2021; p. 012008. [Google Scholar]
  5. Ge, W.; Zhang, Z.; Xu, W.; Ashour, A.; Jiang, H.; Sun, C.; Song, S.; Cao, D. Seismic response of grid tubular-double steel plate concrete composite shear walls and combined system subjected to low reversed cyclic loading. Eng. Struct. 2022, 256, 114028. [Google Scholar] [CrossRef]
  6. Zhang, Z.; Xu, W.; Ge, W.; Abbas, E.M.A.; Jiang, H.; Wang, Y.; Yao, S. Seismic performance of grid tubular-double steel plate concrete composite shear wall. J. Constr. Steel Res. 2022, 189, 107077. [Google Scholar] [CrossRef]
  7. Xiang, T.; Liu, J.; Lv, Z.; Wei, F.; Liu, Q.; Zhang, Y.; Ren, H.; Zhou, S.; Chen, D. The effect of silicon-based waterproof agent on the wettability of superhydrophobic concrete and enhanced corrosion resistance. Constr. Build. Mater. 2021, 313, 125482. [Google Scholar] [CrossRef]
  8. Wang, L.; Yu, Z.; Liu, B.; Zhao, F.; Tang, S.; Jin, M. Effects of Fly Ash Dosage on Shrinkage, Crack Resistance and Fractal Characteristics of Face Slab Concrete. Fractal Fract. 2022, 6, 335. [Google Scholar] [CrossRef]
  9. Safiuddin, M.; Kaish, A.B.M.A.; Woon, C.-O.; Raman, S.N. Early-Age Cracking in Concrete: Causes, Consequences, Remedial Measures, and Recommendations. Appl. Sci. 2018, 8, 1730. [Google Scholar] [CrossRef]
  10. Shen, D.; Kang, J.; Liu, C.; Li, M.; Wei, Y.; Zhou, L. Effect of temperature rise inhibitor on early-age behavior and cracking resistance of high strength concrete under uniaxial restrained condition. J. Build. Eng. 2023, 64, 105588. [Google Scholar] [CrossRef]
  11. Ali, B.; Hawreen, A.; Ben Kahla, N.; Talha Amir, M.; Azab, M.; Raza, A. A critical review on the utilization of coir (coconut fiber) in cementitious materials. Constr. Build. Mater. 2022, 351, 128957. [Google Scholar] [CrossRef]
  12. Shang, M.; Qiao, H.; He, Z.; Zhang, Y.; Liu, X.; Zhang, Y.; Wang, J. Study on the shrinkage mechanism and prediction model of high-strength specified density concrete based on the internal curing micro-pump effect of MSW incineration tailings. Constr. Build. Mater. 2023, 372, 130804. [Google Scholar] [CrossRef]
  13. Shen, D.; Li, C.; Liu, C.; Li, M.; Kang, J. Experimental investigations on early-age tensile creep of internally cured high strength concrete under different initial stress/strength ratios. Constr. Build. Mater. 2020, 265, 120313. [Google Scholar] [CrossRef]
  14. Yoo, D.-Y.; Banthia, N.; Yoon, Y.-S. Effectiveness of shrinkage-reducing admixture in reducing autogenous shrinkage stress of ultra-high-performance fiber-reinforced concrete. Cem. Concr. Compos. 2015, 64, 27–36. [Google Scholar] [CrossRef]
  15. Shen, D.; Jiang, J.; Shen, J.; Yao, P.; Jiang, G. Influence of curing temperature on autogenous shrinkage and cracking resistance of high-performance concrete at an early age. Constr. Build. Mater. 2016, 103, 67–76. [Google Scholar] [CrossRef]
  16. Negahban, E.; Bagheri, A.; Sanjayan, J. One-Year study of restrained shrinkage and creep behaviours of geopolymer concrete. Constr. Build. Mater. 2023, 376, 131057. [Google Scholar] [CrossRef]
  17. Khan, I.; Xu, T.; Castel, A.; Gilbert, R.I. Early-age tensile creep and shrinkage-induced cracking in internally restrained concrete members. Mag. Concr. Res. 2019, 71, 1167–1179. [Google Scholar] [CrossRef]
  18. Gao, Z. Research on Evaluation Technique of Concrete Cracking Performance under Restraint Condition. For. Chem. Rev. 2022, 1034–1041. Available online: https://www.forestchemicalsreview.com/index.php/JFCR/article/view/986 (accessed on 1 August 2023).
  19. Huang, L.; Hua, J.; Kang, M.; Luo, Q.; Zhou, F. Influence of Steel Plates and Studs on Shrinkage Behavior and Cracking Potential of High-Performance Concrete. Materials 2019, 12, 342. [Google Scholar] [CrossRef]
  20. Chen, L.; Chen, Z.; Zhang, Y.; Liu, Y.; Osman, A.; Farghali, M.; Hua, J.; Al-Fatesh, A.; Ihara, I.; Rooney, D.; et al. Artificial intelligence-based solutions for climate change: A review. Environ. Chem. Lett. 2023. [Google Scholar] [CrossRef]
  21. Chen, L.; Huang, L.; Hua, J.; Chen, Z.; Wei, L.; Osman, A.; Fawzy, S.; Rooney, D.; Dong, L.; Yap, P. Green construction for low-carbon cities: A review. Environ. Chem. Lett. 2023, 21, 1627–1657. [Google Scholar] [CrossRef]
  22. Chen, L.; Msigwa, G.; Yang, M.; Osman, A.; Fawzy, S.; Rooney, D.; Yap, P. Strategies to achieve a carbon neutral society: A review. Environ. Chem. Lett. 2022, 20, 2277–2310. [Google Scholar] [CrossRef] [PubMed]
  23. JGJT380-2015; Technical Specification for Steel Plate Shear Walls. Ministry of Housing and Urban-Rural Development of the People’s Republic of China: Beijing, China, 2016.
  24. GB50010-2010; Concrete Structural Design Code. Ministry of Housing and Urban-Rural Development of the People’s Republic of China: Beijing, China, 2015.
  25. JGJ3-2010; Technical Specification for High-Rise Buildings with Concrete Structures. Ministry of Housing and Urban-Rural Development of the People’s Republic of China: Beijing, China, 2010.
  26. JGJ138-2016; Combined Structural Design Specification. Ministry of Housing and Urban-Rural Development of the People’s Republic of China: Beijing, China, 2016.
  27. GB50011-2010; Seismic Design Code for Buildings. Ministry of Housing and Urban-Rural Development of the People’s Republic of China and General Administration of Quality Supervision, Inspection and Quarantine of the People’s Republic of China: Beijing, China, 2016.
  28. GBT50081-2019; Test Methods of Physical and Mechanical Properties of Concrete. Ministry of Housing and Urban-Rural Development of the People’s Republic of China and the State Administration of Market Supervision and Administration of the People’s Republic of China: Beijing, China, 2019.
  29. GB50017-2017; Steel Structure Design Standard. Ministry of Housing and Urban-Rural Development of the People’s Republic of China: Beijing, China, 2017.
Figure 1. Size and construction of specimens: (a) Elevation of the test piece; (b) 1-1 Cross-section; (c) 2-2 Cross-section; (d) Test piece S1 bolt arrangement drawing; (e) Test piece S1 rebar layout drawing.
Buildings 13 02201 g001aBuildings 13 02201 g001b
Figure 2. Arrangement of measuring points for shrinkage of restrained concrete: (a) elevation plan; (b) side view.
Buildings 13 02201 g002
Figure 3. Automatic acquisition equipment.
Buildings 13 02201 g003
Figure 4. Basic analysis mold.
Buildings 13 02201 g004
Figure 5. Concrete element analysis model.
Buildings 13 02201 g005
Figure 6. Three typical sections in restrained concrete: (a) Type 1 cross-section; (b) Type 2 cross-section; (c) Type 3 cross-section.
Buildings 13 02201 g006
Figure 7. Variation in concrete pore structure with constraint coefficient: (a) optimal pore size; (b) porosity; (c) average pore size; (d) median aperture.
Buildings 13 02201 g007
Figure 8. Diagram of shrinkage of concrete with constraint coefficient: (a) 3 days of age; (b) 7 days of age; (c) 28 days of age.
Buildings 13 02201 g008
Figure 9. Relationship between capillary stress and constraint coefficient of concrete at different ages: (a) 3 days of age; (b) 7 days of age; (c) 28 days of age.
Buildings 13 02201 g009
Figure 10. Effect of capillary stress on shrinkage of concrete at different ages: (a) 3 days of age; (b) 7 days of age; (c) 28 days of age.
Buildings 13 02201 g010
Figure 11. Schematic of the effect of steel plate, stud, and steel bar on the shrinkage of concrete.
Buildings 13 02201 g011
Figure 12. Comparison of test results and calculated values at different ages: (a) 3 days of age; (b) 7 days of age; (c) 28 days of age.
Buildings 13 02201 g012
Table 1. Concrete mix ratio (kg/m3).
Water to Binder
Ratio
CementCourse AggregateSandWaterFly AshAdditive
0.2948210646801544812.7
Table 2. Specimen design.
No.Section Size (mm)Plate Thickness (mm)Distribution Rebar Straight Diameter (mm)Bolt Diameter
(mm)
Bolt Height
(mm)
Bolt Spacing
(mm)
Curing
Condition
P1000 × 20000000Sealed
S11000 × 20010101680200Sealed
S21000 × 20012101680200Sealed
S31000 × 20010101680100Sealed
S41000 × 20010101980200Sealed
S51000 × 20010101670200Sealed
S61000 × 20010121680200Sealed
Table 3. Specimen information.
Basic PropertiesAge (Days)
371428
Cube compressive strength (MPa)42.848.256.461.0
Splitting tensile strength (MPa)3.84.14.55.2
Elastic modulus (Gpa)30.032.335.035.5
Table 4. λ of constraint coefficient of steel plate, stud, and reinforcement on concrete.
No.Constraint Factor (×104 MPa)
3 Days7 Days28 Days
S13.753.874.04
S24.154.274.44
S33.964.084.26
S43.793.914.09
S53.723.844.01
S63.853.974.14
Table 5. Capillary stress of concrete at different ages.
No.Capillary Stress (MPa)
3 Days7 Days28 Days
S10.991.442.44
S20.560.891.38
S30.761.051.80
S40.891.362.31
S51.111.712.65
S60.821.142.02
Table 6. Comparison of test results and calculated values.
No.3 Days7 Days28 Days
Tested ValuesCalculated ValuesRelative ErrorTested ValuesCalculated ValuesRelative ErrorTested ValuesCalculated ValueRelative Error
S112410515.0%16114310.9%2322205.3%
S266609.5%97898.4%14912516.3%
S388817.7%13610423.4%1741626.8%
S41179519.1%16013515.7%2072080.9%
S513611813.2%20916919.2%28523916.4%
S61038814.9%13611316.8%1911824.7%
Disclaimer/Publisher’s Note: The statements, opinions and data contained in all publications are solely those of the individual author(s) and contributor(s) and not of MDPI and/or the editor(s). MDPI and/or the editor(s) disclaim responsibility for any injury to people or property resulting from any ideas, methods, instructions or products referred to in the content.

