
Analyzing the Spatial Interaction Characteristics of Urban Area Shared Bicycle Systems: A Case Study of Beijing’s Central Area
1
School of Architecture and Urban Planning, Beijing University of Civil Engineering and Architecture, Beijing 100044, China
2
Research Center for Urban Big Data Applications, Beijing University of Civil Engineering and Architecture, Beijing 100044, China
3
School of Geomatics and Urban Spatial Informatics, Beijing University of Civil Engineering and Architecture, Beijing 100044, China
*
Author to whom correspondence should be addressed.
Buildings 2023, 13(10), 2646; https://0-doi-org.brum.beds.ac.uk/10.3390/buildings13102646
Submission received: 25 September 2023
/
Revised: 16 October 2023
/
Accepted: 19 October 2023
/
Published: 20 October 2023
(This article belongs to the Special Issue Advanced Studies in Urban and Regional Planning)
Abstract
:Shared bicycle systems play a crucial role in promoting sustainable urban transportation, addressing challenges such as traffic congestion and air pollution. Understanding the spatiotemporal patterns of shared bike usage is essential for optimizing bike-sharing infrastructure and improving transportation planning. In this study, we analyzed 2.4 million records of shared bicycle data to explore the spatial distribution, interaction patterns, and flow dynamics within Beijing’s urban central area. We found that bike distribution peaks during commuting hours, particularly in central regions with employment centers. Complex networks are an important method for studying travel flows. Through a spatial interaction network, we identified key streets with high node strength and popularity, often concentrated in central areas. They experience heavy shared bicycle use during peak hours due to their employment-centric location. Conversely, peripheral areas see increased usage in the evenings, reflecting distinct commuting patterns. The morning exhibits higher positive central values compared to the evening, while negative values show the opposite trend. Based on these findings, we recommend enhancing bike infrastructure in high-density areas with bike lanes and ample shared bikes during peak hours. Implementing mixed-use zoning policies in the central region can reduce traffic congestion. Expanding shared bike services to peripheral regions can promote equitable access. This research underscores the importance of considering spatial and temporal factors in urban transportation planning. Future work should incorporate additional data sources, explore environmental impacts, and analyze usage in different seasons and special events, further contributing to sustainable urban mobility development.
1. Introduction
Urban transportation systems play a crucial role in shaping the livability and sustainability of cities, and these roles are even more pronounced in larger cities with high levels of economic development [1,2]. With the increasing challenges posed by rapid urbanization and population growth, cities worldwide are seeking efficient and sustainable transportation alternatives, primarily due to the growing concerns of urban environment pollution [3,4]. Shared bicycles have emerged as a popular mode of transportation, offering a flexible and eco-friendly solution for short-distance trips, contributing to the development of urban transportation systems in more environmentally conscious ways [5,6]. Shared bicycles play a crucial role in integrating into the overall urban transportation system. To begin, they serve as a complement to urban public transportation, offering a solution for the last mile, thus alleviating the pressure on public transit during peak hours. These systems have the potential to alleviate traffic congestion, reduce carbon emissions, and improve urban mobility [7,8]. Shared bicycles can integrate with other transportation modes such as subways, buses, and electric scooters, enabling multimodal travel. This enhances the convenience of urban residents’ journeys, reduces private car usage, and mitigates issues related to traffic congestion and environmental pollution. Beijing, as the capital of China, faces unique transportation challenges due to its immense population and complex urban structure [9]. The city’s transportation infrastructure must accommodate the needs of millions of residents and ensure smooth mobility within its vast territory [10,11]. In recent years, shared bicycle systems have gained significant popularity in Beijing, providing an affordable and convenient transportation option for both daily commuters and occasional users. The extensive adoption of shared bicycles has raised intriguing questions regarding their usage patterns, spatial distribution, and interactions with other transportation modes [12,13].
Numerous studies conducted worldwide have extensively explored various aspects of shared bicycle systems, shedding light on user behavior, system performance, and spatial–temporal usage patterns [14,15]. These investigations have significantly contributed to understanding the factors that influence shared bicycle usage. Factors such as trip distance, weather conditions, availability of docking stations, and demographic characteristics of users have been identified as key determinants affecting the adoption and utilization of shared bicycles [16]. For instance, studies have revealed that shorter trip distances are more likely to be covered by shared bicycles, as they provide a convenient and time-efficient mode of transportation for short-distance travel. Similarly, the presence of docking stations in close proximity to popular destinations significantly influences the usage patterns of shared bicycles [17]. Furthermore, researchers have focused on analyzing the spatial distribution of shared bicycles and identifying hotspots of high demand. Spatial analysis plays a crucial role in understanding the spatial patterns and dynamics of shared bicycle usage [18,19]. By employing techniques such as Geographic Information Systems (GIS) and spatial clustering algorithms, researchers have successfully identified areas with high demand and concentrated shared bicycle activity [20,21]. These hotspots are typically characterized by their proximity to transportation hubs, commercial centers, educational institutions, and residential areas, reflecting the diverse needs and preferences of users in different locations [22,23].
However, despite the existing body of research, there remains a significant knowledge gap in comprehensively examining the spatiotemporal dynamics of shared bicycle usage within the central area of Beijing, particularly during peak hours of pedestrian activity [24]. The central area of Beijing encompasses the economic and administrative center of the city, hosting a substantial population and a multitude of industrial establishments [25]. As a result, this area experiences high volumes of pedestrian traffic during peak hours, presenting unique challenges for transportation planning and management [26,27]. In summertime, shared bicycles serve as a pivotal urban transportation option. High temperatures can cause discomfort for pedestrians or public transit commuters, but shared bicycles swiftly move people between points, mitigating heat-related inconveniences. Shared bicycles’ eco-friendly attributes are accentuated in summer, reducing urban air pollution in contrast to temperature-induced pollution. Their cost-effectiveness is advantageous, especially for summer travelers. Thus, shared bicycles offer both a convenient mode of travel in extreme summer conditions and contribute significantly to advancing sustainable urban development.
Shared bicycles have distinct peak usage times within Beijing’s transportation network on a daily, weekly, monthly, and yearly basis. Typically, daily peaks occur during the morning and evening rush hours, catering to residents’ commuting needs. Weekly trends predominantly focus on workdays, with reduced usage on weekends, although there may be a slight increase during leisure or special event periods. Monthly usage patterns are influenced by seasons and weather, with more activity during the summer compared to winter. Yearly peak usage times are often linked to seasons and special events, such as increased usage during the Spring Festival. Furthermore, shared bicycles are closely associated with commuting time and travel duration. They reduce commuting time, making them especially suitable for individuals working close to their destination, as cycling is faster than walking. Simultaneously, the quick accessibility of shared bicycles reduces waiting time and addresses the issue of parking difficulties.
From a methodological point of view, complex network analysis is a valuable approach for studying urban transportation systems [28,29,30]. It provides a holistic understanding of the dynamics and interconnections within these complex systems by representing transportation infrastructure, flows, and interactions as nodes and edges. In urban transportation research, complex network analysis has been applied to areas such as traffic flow, public transportation systems, and shared mobility services [31,32]. It allows researchers to examine network properties and understand the resilience and robustness of urban mobility networks. By identifying critical nodes or links, infrastructure planning can be guided to enhance overall network performance [33]. Complex network analysis has also been used to study traffic congestion patterns and identify influential nodes or bottlenecks. Centrality measures help pinpoint locations where congestion accumulates and spreads, informing targeted interventions to alleviate congestion and improve traffic flow efficiency [34]. In public transportation, complex network analysis explores the structure and dynamics of transit systems. By analyzing passenger flows and interactions between different lines or modes, researchers gain insights into system performance and identify areas for improvement in terms of connectivity and service quality [35,36]. Additionally, complex network analysis has been applied to shared mobility services like bike-sharing and ride-sharing systems. It helps understand usage patterns, spatial distributions, and the impact of factors such as network connectivity and user behavior on system performance [28]. This knowledge supports optimizing station placement, rebalancing strategies, and demand forecasting for more efficient and sustainable shared mobility services. Overall, complex network analysis offers an integrative approach to studying urban transportation systems. It captures the complex interactions and dependencies between transportation infrastructure, flows, and users, supporting evidence-based decision-making, policy formulation, and urban planning efforts to create efficient, sustainable, and resilient urban transportation systems [11,37]. Previous studies have primarily utilized complex network methods to investigate spatial interactions between different regions, with limited focus on researching internal population flow patterns within a specific area. We employed this approach to analyze the overall spatial flow patterns within the region.
Three problems are proposed and resolved in this paper. What are the network characteristics and interaction patterns of shared bicycles in urban areas? What are the travel patterns of shared bicycles during peak periods in the city? How do the travel patterns during morning and evening peak periods differ? To address these issues, this study attempts to (i) construct a spatial interaction network of shared bicycles in urban areas and investigate the interaction patterns using various network statistical indicators; (ii) develop an interaction model based on shared bicycle data during peak periods in the city to examine the travel characteristics; (iii) compare and analyze the travel patterns during morning and evening peak periods.
This paper is structured as follows: The second part presents the research area and data sources, as well as the principles employed for network construction and the selection of indicators for the network model. In the third part, the network structure and the analysis of network indicators are discussed. The fourth part comprises the conclusions drawn from the study and a detailed discussion of the findings.
2. Materials and Methods
2.1. Research Data
The central area of Beijing, comprising Dongcheng District, Xicheng District, Haidian District, Fengtai District, Shijingshan District, and Chaoyang District, is situated in the central part of the city. This area is densely populated, accounting for approximately 60% of the total population of Beijing, and accommodates nearly 70% of its industrial establishments. Due to its central location and economic significance, the central area experiences high volumes of pedestrian traffic, particularly during peak hours. Furthermore, shared bicycles are extensively utilized within this region, contributing to the overall transportation landscape. For the purpose of this study, the research scope focuses on the intersection of the operational area of shared bicycles with the central area of the capital. By examining this specific region, we can gain valuable insights into the dynamics of shared bike usage in an area of high pedestrian activity and economic concentration. The selected study area encompasses over 90% of the central area of the capital, ensuring comprehensive coverage for the analysis.
To illustrate the location of the study area within Beijing, Figure 1 presents a visual representation. It highlights the spatial extent of the central area of the capital and its intersection with the operational area of shared bicycles. This depiction aids in understanding the geographical context of the study and provides a clear reference for subsequent analyses. In summary, the central area of the capital, situated in the central part of Beijing, serves as the focal point of this study. Its significance lies in its high population density, concentration of industrial establishments, and the substantial usage of shared bicycles. By investigating the region where the central area intersects with the operational area of shared bicycles, we aim to uncover valuable insights into the spatiotemporal dynamics of shared bike usage in an area characterized by heavy pedestrian traffic and economic activity. The location of the study area within Beijing is visually represented in Figure 1.
The shared bicycle data utilized in this research are derived from collaborative data with enterprises. This dataset comprises shared bicycle location data within the central area of the capital. We continuously gathered location data for all shared bicycles within the study area throughout the data collection period. Each data entry includes attributes such as bicycle ID, time, and latitude–longitude coordinates, totaling 2.4 million records. Taking into account the impact of the COVID-19 pandemic, data collection was conducted during the morning peak hours (6:00–9:00) and evening peak hours (17:00–20:00) in July 2021. During this period, the pandemic situation in Beijing was relatively optimistic, with minimal impact on travel. Consequently, residents were more inclined to use shared bicycles for commuting.
The collected data underwent preprocessing, beginning with data screening. Records associated with abnormal weather conditions, such as precipitation or high temperatures, were excluded. Subsequently, the data format was transformed from CSV to Shapefile for spatial intersection processing with administrative division data. This conversion facilitated spatial analysis and integration with administrative boundary information.
For the analysis of the spatial distribution and changes in shared bicycles before and after the entire commuting period, the study focused on examining the spatial distribution changes of shared bicycles during the morning and evening peak hours. The starting times of 6:00 and 17:00 were defined as the beginning of the morning and evening peak hours, respectively, while the ending times of 9:00 and 20:00 were defined as the end of the morning and evening peak hours, respectively. The data corresponding to the starting and ending times were associated with bicycle IDs and spatially intersected with the street administrative divisions, allowing the identification of the streets where each bicycle started and ended, thus generating street-level origin–destination (OD) trajectories.
After filtering out abnormal data, a challenge emerged: the remaining data often had discontinuous dates. To facilitate rigorous experimental validation, our study required a continuous dataset spanning several consecutive working days. Therefore, data from 6 July, 7 July, and 8 July 2021 were meticulously chosen due to being representative of typical working days. These specific dates provided the necessary continuous data over a three-day period, free from irregularities, and reflective of regular daily resident mobility patterns. The list of experimental data used in this study is presented in Table 1. The administrative division data for the central area of the capital can be downloaded from the OpenStreetMap website (https://www.openstreetmap.org/, (accessed on 1 August 2021)). Please note that Table 1 and the provided website link are for illustrative purposes and should be replaced with the actual references and data sources used in the research.
2.2. Research Methods
2.2.1. Construction Method of Spatial Interaction Network for Shared Bicycle System
In the realm of complex systems, various interaction relationships found in the real world can be effectively organized and analyzed using complex network theory [34]. Complex networks serve as highly abstract representations of these intricate systems, where individual entities are abstracted as nodes, and the relationships between these entities are depicted as edges in the network [35]. When a network consists of a large number of nodes and edges, it is referred to as a complex network, exhibiting two fundamental characteristics: small-worldness and scale-free property [38].
In the context of urban areas, streets play a crucial role as an important spatial scale for analysis, especially when considering administrative divisions. Exploring the characteristics of streets within urban settings directly supports the decision-making processes at the neighborhood level [39,40]. Consequently, when constructing a spatial interaction network for shared bicycles in urban areas, the first step involves abstracting streets as network nodes based on the principles of complex network theory. The travel behavior between streets is then captured as directed edges in the network, with each edge’s weight representing the volume of bicycle usage. Through the establishment of a travel relationship matrix among streets within the central area of the city, the construction of the network is successfully accomplished. By leveraging the framework of complex network theory, this approach enables a comprehensive understanding of the interplay between streets and the dynamics of shared bicycle usage. Relevant metrics from complex network theory can be utilized to quantify the flow characteristics between streets. Quantifying and visualizing spatial interactions form the basis of a spatial interaction network. The resulting spatial interaction network provides a powerful tool for examining the patterns and characteristics of shared bicycle systems within urban areas.
2.2.2. Network Analysis Methods
In the field of complex network theory, there exists a range of metrics and methods concerning nodes, edges, and network construction. Given that the network constructed in this paper is a directed weighted network, the network’s edges possess two distinct attributes: direction and weight. Although complex network theory offers a range of network statistical metrics, the number of metrics suitable for assessing directed and weighted spatial interaction networks is limited. These metrics should be capable of considering the network’s overall characteristics while allowing for a qualitative or quantitative evaluation and analysis of edge direction and magnitude. Consequently, this study opted to employ three metrics, namely network density, node strength, and degree centrality. These three metrics enable a comprehensive analysis of the network from various perspectives. Network density assesses the connectivity density within the network, while node strength evaluates the capacity of nodes to absorb or emit traffic. Degree centrality, on the other hand, provides insights into the flow of traffic into and out of nodes. Utilizing the three mentioned indicators allows for research from different perspectives, including the overall network, node mobility, and attraction of traffic. This enables a comprehensive analysis of spatial interaction networks’ interaction patterns.
Network density is used to reflect the degree of connectivity between nodes, where nodes in this study represent streets [11,30]. A higher value of node strength indicates a stronger relationship and a greater level of mutual influence between nodes. The calculation formula is shown in Equation (1), where represents the network density, denotes the number of nodes (i.e., streets), and represents the number of edges in the network.
Node strength is defined as the sum of the weights of all edges connected to that node, which reflects the magnitude of travel associated with the street. The calculation formula is shown in Equation (2), where represents the node strength of node , denotes the set of nodes connected to node , and represents the weight of the edge connecting nodes and .
In a directed network, node strength can be divided into in-strength and out-strength based on the direction of edges, allowing the calculation of net flow ratio (). The calculation is described in Equations (3)–(5), where and represent the in-strength and out-strength of node , respectively, represents the set of nodes that flow towards node , represents the edge weight, represents the set of nodes to which node flows, and represents the net flow ratio. When the NFR is greater than zero, it indicates that the in-strength of the node is greater than the out-strength, indicating an increase in prominence, and vice versa [29].
Centrality is one of the indicators used to study the state and function of networks, reflecting the status of nodes in the network. The higher the centrality of a node, the greater its influence on the network. Degree centrality normalizes the node degree and is used for comparisons between networks at different scales. It represents the proportion of other nodes connected to a specific node and is an important indicator for reflecting network centrality. The calculation formula for degree centrality is shown in Equation (6), where represents the degree centrality of node , represents the degree of the node, and represents the total number of nodes.
In directed networks, degree centrality can be categorized based on the direction of edges. Using out-degree centrality and in-degree centrality, the capabilities of nodes to send and receive traffic can be represented. The calculations are shown in Equations (7)–(10), where and represent the out-degree centrality and in-degree centrality of a node, respectively. represents the flow from node to , and is the total number of nodes. The and metrics are defined to measure the ability of nodes to attract and export traffic in a directed network, with traffic tending to leave nodes with larger values and flow towards nodes with larger values.
2.2.3. Technical Approach
The technical approach of this study is illustrated in Figure 2. In the proposed methodology, the first step involves extracting the operational range of shared bikes from the shared bike data. This is achieved by identifying the boundaries within which the bikes operate. The operational scope is then overlapped with the urban administrative boundary data, enabling the identification of the specific area of interest for this study. Next, street units are selected as the network nodes. These street units are extracted from the study area and serve as the fundamental components of the spatial interaction network. By representing each street unit as a node, the network can capture the spatial relationships and interactions between different streets.
To construct the spatial interaction network, the shared bike trajectory data are subjected to two essential preprocessing steps: outlier data cleansing and format conversion. Outliers, which may arise due to various factors, are removed from the trajectory data to ensure the accuracy and reliability of subsequent analyses. Additionally, the data are converted into a suitable format that facilitates the construction of the network. The OD trajectories are then extracted from the preprocessed shared bike data. Each OD trajectory represents the movement between two locations within the study area. These trajectories are used as the edges of the spatial interaction network, connecting the corresponding street units.
With the network structure established, a range of network statistical indicators are applied to analyze the spatial interaction patterns within the urban street network. These indicators provide insights into various aspects of the network, such as node connectivity, traffic flow, and centrality measures. By examining these network characteristics, a comprehensive understanding of the spatial interactions facilitated by shared bikes in the urban environment can be obtained.
3. Results
3.1. Spatial Distribution of Shared Bikes
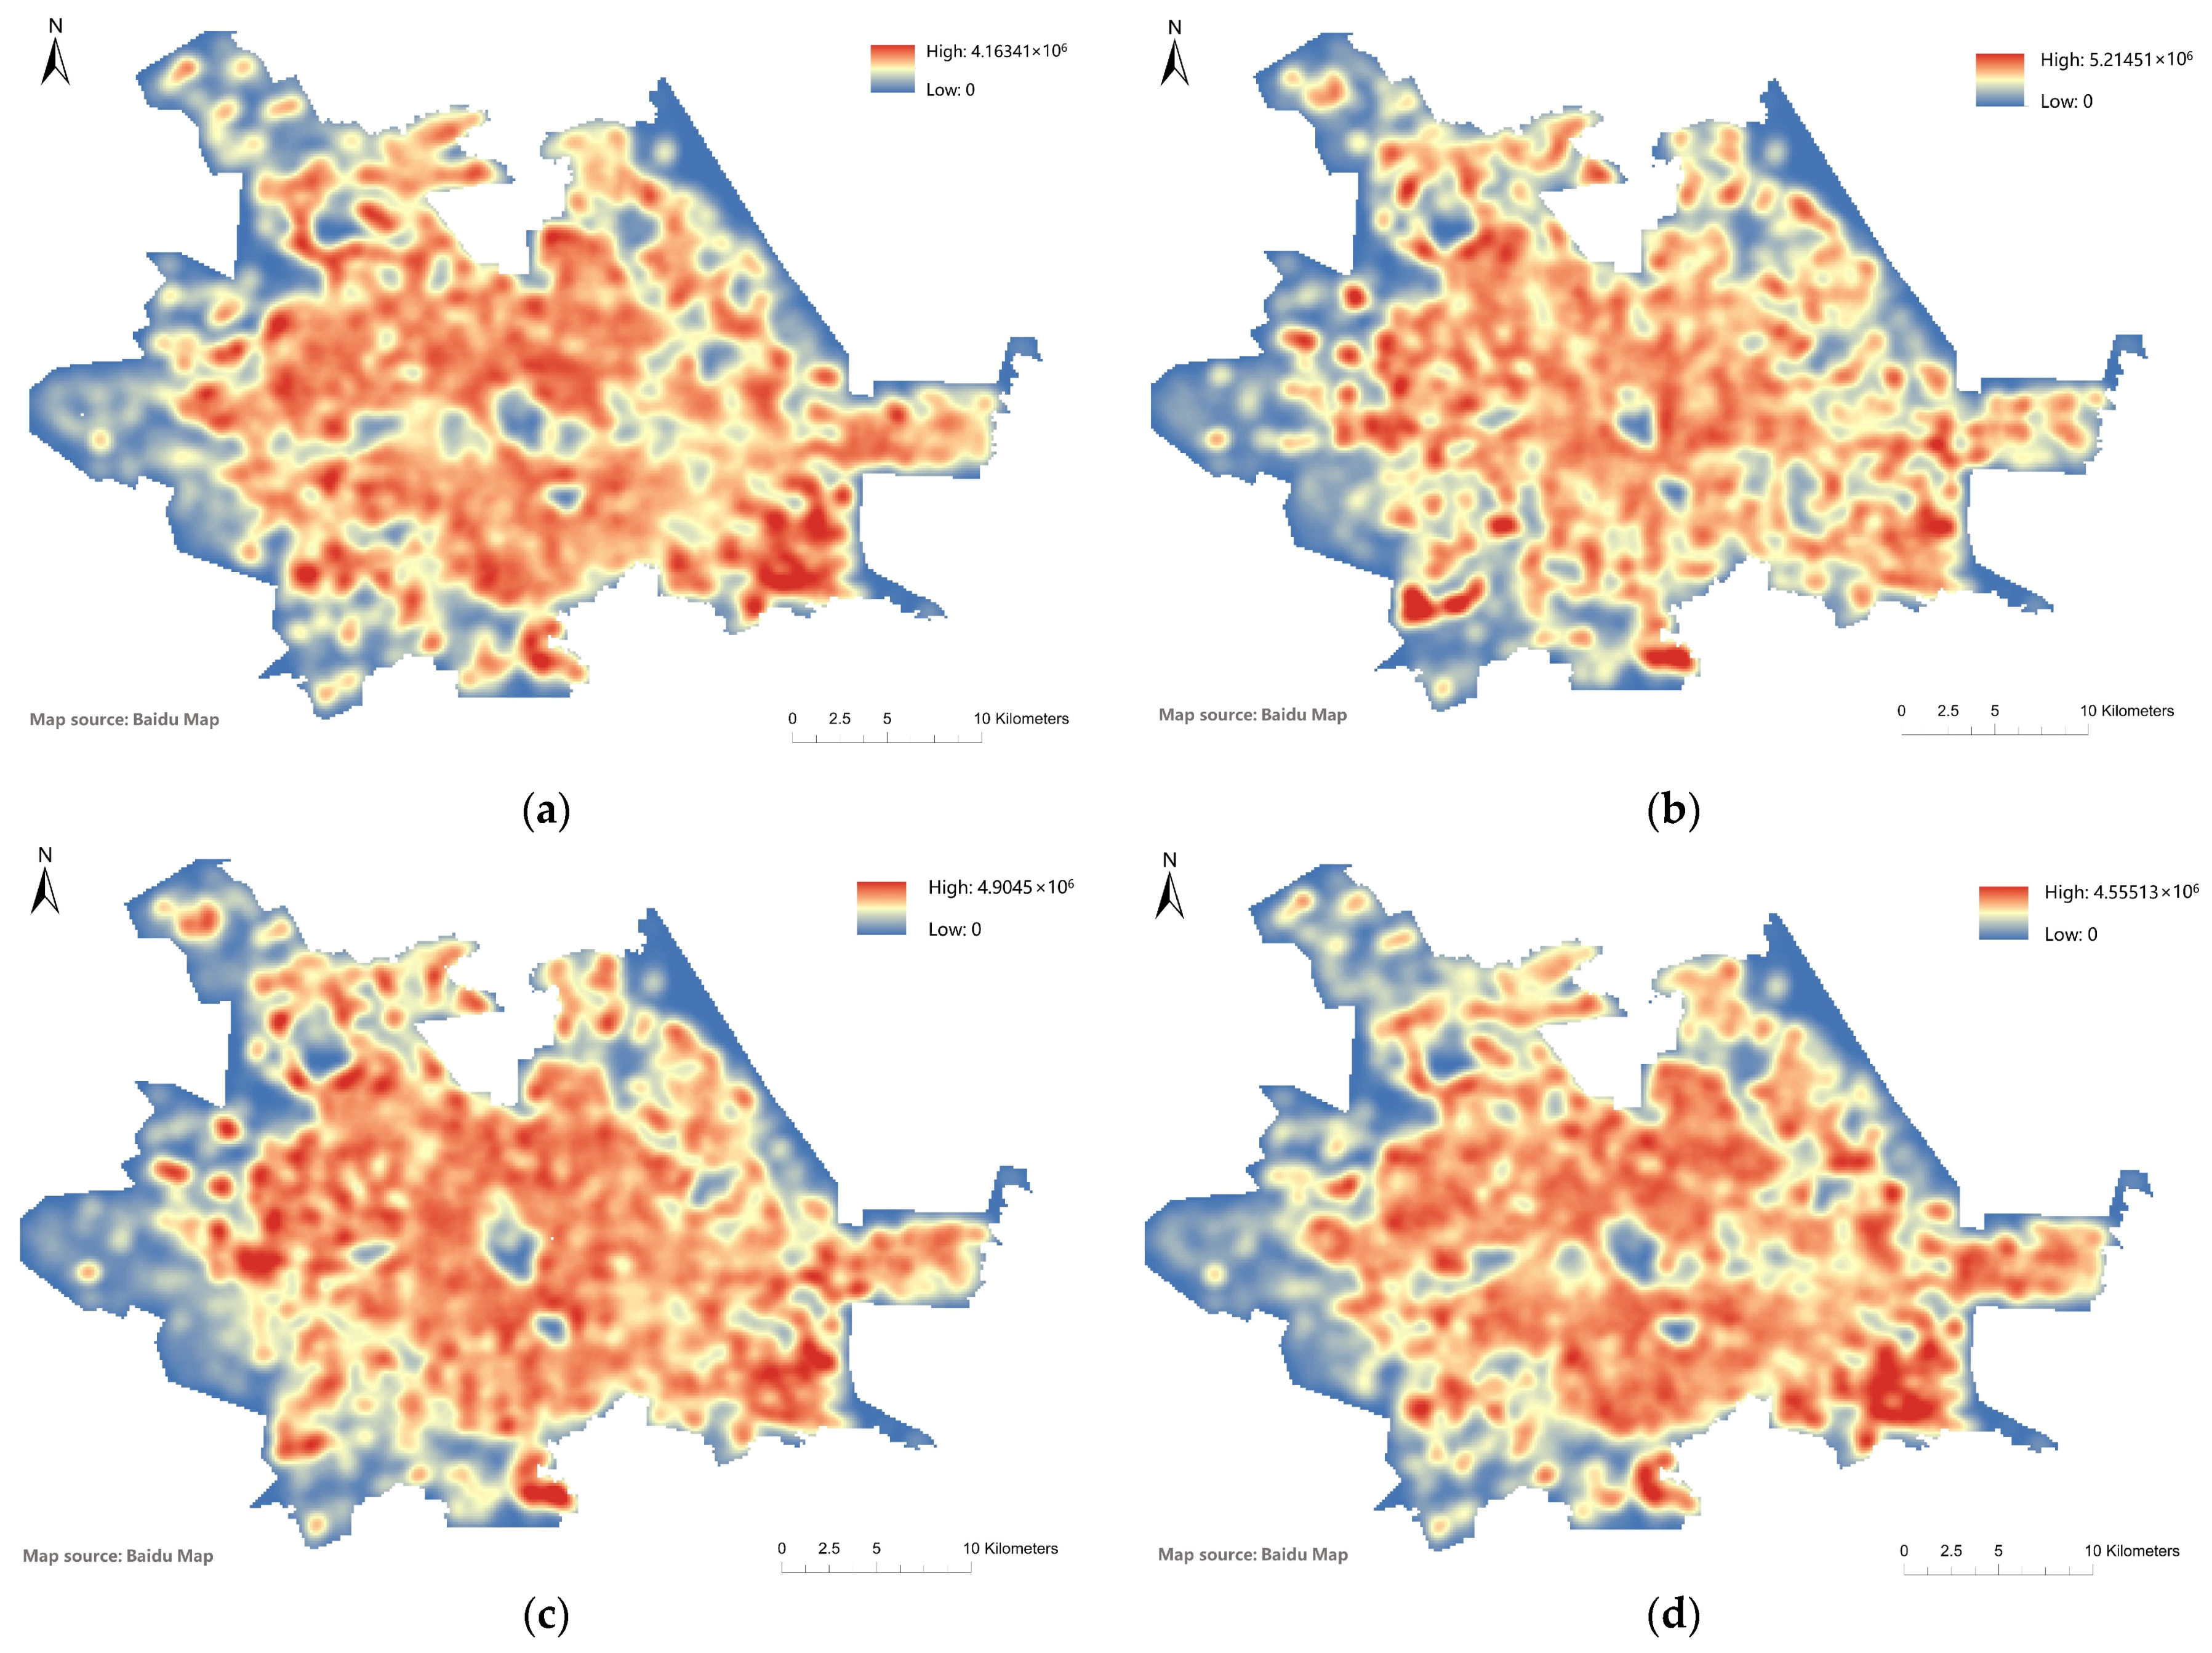
We used kernel density estimation (KDE) to calculate and visualize the spatial distribution of shared bicycle data. Data from three working days in July, specifically July 6th, July 7th, and July 8th, were aggregated at four specific time points: 6:00 AM, 9:00 AM, 5:00 PM, and 8:00 PM. The calculation and visualization of kernel density values are shown in Figure 3. From the range of kernel density values, it is apparent that the KDE values at 9:00 AM and 5:00 PM are higher than those at 6:00 AM and 8:00 PM. Since kernel density reflects the density of data distribution in spatial dimensions, the analysis suggests that the spatial distribution of shared bikes is more concentrated at 9:00 AM and 5:00 PM. This indicates that in the morning, bicycle trip destinations are spatially concentrated, whereas in the evening, bicycle trip origins are more clustered. Considering that shared bicycles are commonly used as commuting tools during weekday peak hours, this observation has implications. On one hand, it suggests that the employment areas in the core of Beijing, as compared to residential areas, have a more concentrated geographical distribution. On the other hand, by comparing the kernel density value ranges between 6:00 AM and 8:00 PM and between 9:00 AM and 5:00 PM, we found that shared bicycle usage is higher and more concentrated in the morning than in the evening. This indicates that more people opt for shared bicycles as a mode of transportation in the morning and switch to other modes in the evening. This could be attributed to the morning trips being primarily for commuting, which are more concentrated. In the evening, trip purposes become more diverse, leading to a variety of transportation modes being used.
3.2. Analysis of Spatial Interaction Network for Shared Bikes
3.2.1. Spatial Distribution of Shared Bikes
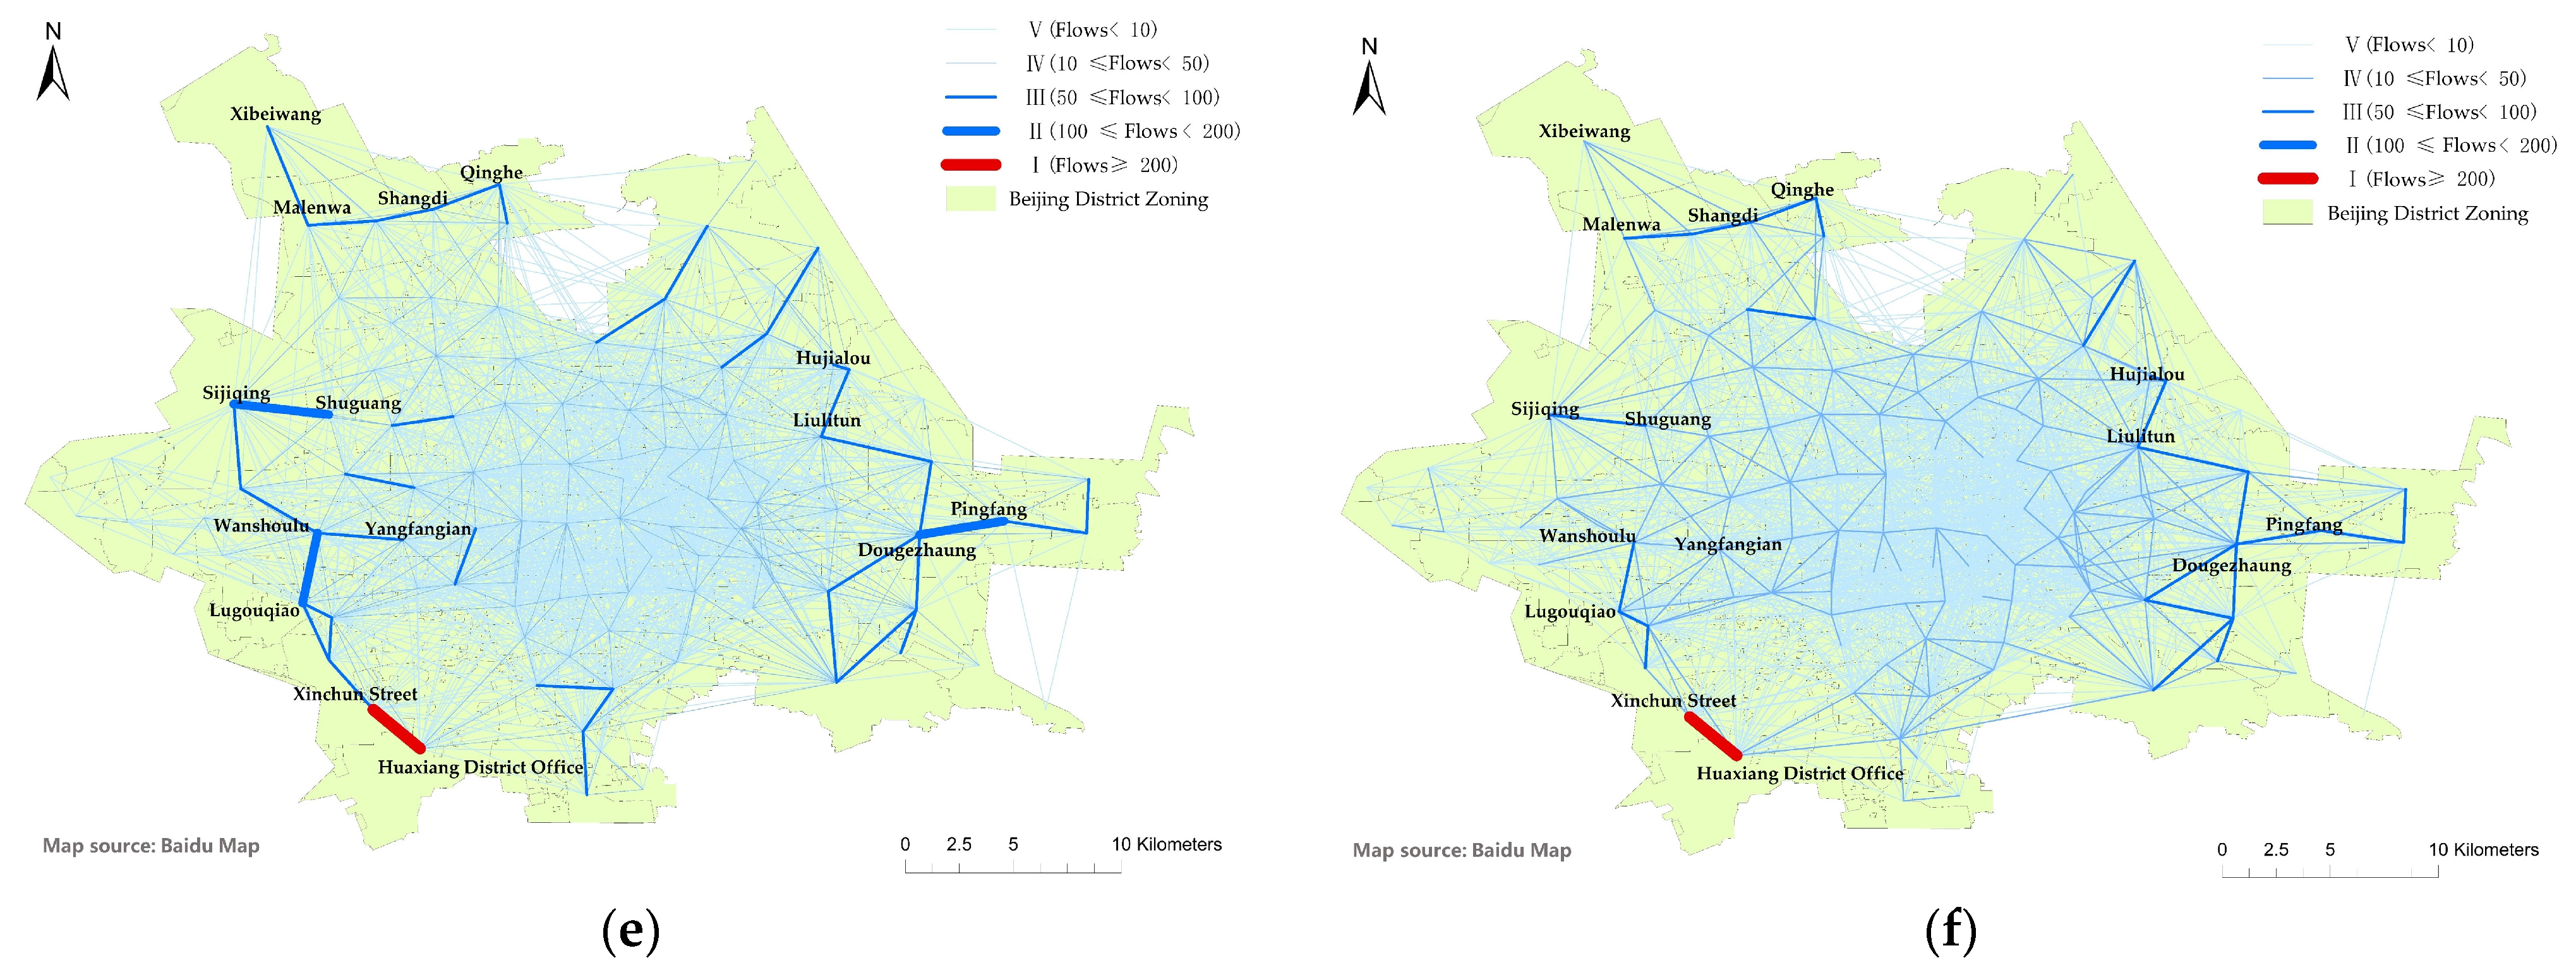
In this study, we adopted the principles of complex network theory to construct a spatial interaction network for shared bikes. The network was established by considering streets as nodes and representing the interactions between streets as directed edges. The weight of each edge was determined by the volume of shared bike usage, reflecting the intensity of interaction between streets. To build the network, we created a travel matrix that captures the travel relationships among streets within the urban central area. The network construction, analysis, and visualization were performed using the network library in Python, in conjunction with ArcGIS software. The resulting spatial interaction network is visualized in Figure 4, where the width of the lines corresponds to the magnitude of the flow between streets. In this case, the use of the early period means 6:00–9:00 and the use of the night period means 17:00–20:00. This visualization allows us to visually assess the patterns and dynamics of shared bicycle movements within the study area. Thicker lines indicate higher flow volumes, indicating streets with greater usage and stronger connections with other streets. To further analyze the characteristics of the spatial interaction network, we calculate the network density for each network. Network density quantifies the level of connectivity within a network by measuring the proportion of existing connections compared to the total number of possible connections.
Table 2 presents the network density values for the spatial interaction networks under investigation. Higher network density values indicate a denser network with stronger interconnectivity between streets, implying a higher potential for shared bicycle flow and interactions among streets.
Upon examining the network density values presented in Table 2 and analyzing the spatial structure of the network depicted in Figure 4, it becomes evident that interactions between streets that are geographically distant from each other are relatively infrequent. Most of the interaction activities occur between adjacent streets, such as the substantial pedestrian flow observed daily between the Hua Xiang District Office and Xin Cun Street. This observation indicates that shared bicycles are primarily used for short-distance trips between neighboring streets, especially during weekdays. This finding is consistent with previous research results.
Furthermore, the visualization results also show that edges with higher flow volumes are primarily distributed on the periphery of the study area, while the central area of the study region exhibits fewer high-flow interactions. The reason for this travel pattern may be attributed to the distinct characteristics of the peripheral areas of Beijing’s core region, where the boundaries between employment and residential zones are more pronounced. In contrast, the central area of Beijing’s core region is characterized by a more complex mix of attributes, often resulting from historical or cultural factors. Employment units and residential communities are intermixed spatially in this central area. Such spatial attributes often lead to a certain degree of road congestion within the region.
3.2.2. Spatial Characteristics Analysis
Figure 5 illustrates the visualization and analysis of node strength within the spatial interaction network. In this analysis, dot size corresponds to the node strength, offering insights into the relative significance of various streets. Upon examining the figure, it becomes evident that streets with higher node strength can be categorized into two distinct groups. The first category encompasses streets with more substantial weighted edges. These streets, including Dougezhuang District Office, Pingfang District Office, Huaxiang District Office, Lugouqiao Street, Hujialou Street, and Xincun Street, boast a greater number of significant connections with other streets. Their node strength is primarily influenced by the presence of these strong connections, signifying their role in facilitating interactions within the network. The second category comprises streets with a higher degree of interaction with numerous other streets. Streets like Wanshou Road Street, Liulitun Street, and Yangfangdian Street fall into this category, characterized by their popularity and extensive connections to other streets within the network.
Based on the findings above, two recommendations can be made. Firstly, there is a need to enhance the infrastructure of important streets. Streets with higher node strength, such as Dougezhuang District Office, Pingfang District Office, Huaxiang District Office, Lugouqiao Street, Hujialou Street, and Xincun Street, play a crucial role in facilitating interactions within the network. Therefore, urban planners and policymakers should consider investing in bicycle infrastructure in these areas, including dedicated bike lanes and parking facilities. Ensuring an adequate supply of shared bikes during peak commuting hours is also vital. On the other hand, there is a need to expand the shared bike services. Streets with higher node strength, such as Wanshou Road Street, Liulitun Street, and Yangfangdian Street, stand out due to their popularity and extensive connections to other streets within the network. To promote equitable access to sustainable transportation modes, expanding shared bike services to neighboring areas could be considered, making these services more accessible to a broader range of people.
The analysis of the spatial interaction network involves calculating the net flow ratio (NFR) based on the in-degrees and out-degrees of nodes. Figure 6 presents the visualization and analysis of the NFR, with dot size representing the magnitude of the NFR value. Positive NFR values are depicted in red, while negative values are depicted in green. Upon examining the figure, distinct patterns emerge during the early time period. Streets with NFR values greater than zero, indicating an increasing flow of shared bicycles, are primarily concentrated in the central area of the study region. Notable examples include Jinrong Street and Chongwenmenwai Street. These streets exhibit higher levels of activity and are characterized by a higher influx of shared bicycle usage during peak hours. Conversely, streets with NFR values less than zero, indicating a decreasing flow of shared bicycles, are primarily located near the periphery of the study region. This category includes streets such as Lugouqiao Street, Fangzhuang District Office, Huaxiang District Office, and Shibalidian District Office. The reduced NFR values in these areas suggest a lower demand for shared bicycles during the same time period.
During the late time period, there is a reversal in the spatial distribution of activity within the study region. Central streets, which previously showed higher levels of activity, now exhibit decreased activity. Conversely, peripheral streets show increased activity, suggesting a higher demand for shared bicycles during this period. These observations are consistent with weekday commuting patterns when shared bicycles are frequently used for transportation to and from work. The central streets in the central district are more likely to be associated with employment areas, whereas the periphery mainly consists of residential areas.
The traffic flow on streets during the early time period corresponds to the flow in the opposite direction during the late time period. This phenomenon can be attributed to the temporal variations in travel patterns and the changing dynamics of shared bicycle usage. Moreover, the relationship between Insurplus and Outsurplus, as defined by Equations (9) and (10), indicates that they are opposite to each other. Leveraging this understanding, the present study focuses on comparing the Insurplus values during the early time period with the Outsurplus values during the late time period, as depicted in Figure 7. The findings consistently demonstrate that streets with positive Insurplus values exhibit a higher Insurplus during the early time period compared to the Outsurplus during the late time period. Conversely, for streets with negative Insurplus values, the opposite trend is observed. On one hand, they indicate that for the same street, the demand for shared bikes is generally higher during the early time period than during the late time period. This suggests a temporal preference for shared bicycle usage, potentially influenced by factors such as work commutes and daily activity patterns.
On the other hand, the results also indicate that streets with higher centrality in the network tend to experience a significant influx of shared bicycle usage during the early hours, followed by an efflux during the later part of the day. This observed pattern can be attributed to the distribution of employment centers and residential areas within the study region. Streets with greater centrality, often situated in the central area, typically function as primary employment hubs where commuters gather during peak hours, resulting in a heightened inflow of shared bicycle usage. Conversely, during the late hours, the outflow of shared bicycles from these central streets may be influenced by various factors, such as commuters returning home or engaging in recreational activities in peripheral areas.
4. Discussion and Conclusions
In this study, we applied complex network theory to construct and analyze a spatial interaction network of shared bicycles in the central urban area of Beijing. Our analysis focused on understanding the spatial interaction patterns of shared bicycle usage and their variations. We conducted an analysis of the spatial interaction characteristics of intra-regional traffic flow, providing valuable insights for urban planning and achievable transportation development. Several key findings have emerged from our investigation.
Regarding the spatial distribution of shared bikes, we employed kernel density estimation to visualize the concentration of bike usage during different time periods. Our results indicated that bike distribution was more concentrated during peak commuting hours, with destinations being more centralized in the early time period and origins being more centralized in the late time period. This suggests that shared bikes serve as a popular commuting option during weekdays, with employment areas exhibiting a higher concentration in the central region compared to residential areas.
Additionally, through the construction of a spatial interaction network, we conducted an analysis of the network structure and pinpointed key streets characterized by higher node strength and popularity. These streets can be categorized into two groups: those with substantial edge weights, signifying significant bicycle usage, and those engaged in interactions with a greater number of other streets, rendering them more favored within the network. In the network, streets with elevated node strength are typically situated in the central region, playing pivotal roles in fostering interactions within the network. These central streets generally bear a heavier load of shared bicycle usage during peak hours, which is associated with their positioning as employment hubs. In contrast, streets in peripheral areas undergo increased usage during the evening, reflecting distinct commuting patterns, with central areas being more employment-oriented and periphery areas primarily residential. Furthermore, the usage of shared bicycles exhibits pronounced variations across different time periods. There is a higher demand in the morning, likely influenced by work commutes and daily activity patterns. Conversely, during the evening, substantial outflows signify diverse travel needs, potentially influenced by factors such as commuters returning home or engaging in recreational activities in peripheral regions.
Based on the conclusions drawn above, given the concentration of shared bicycle usage during the morning peak hours, urban planners should consider enhancing bicycle infrastructure in areas with high employment and residential density. This may involve the addition of bike lanes, parking facilities, and ensuring an adequate supply of shared bicycles during peak commuting hours. Considering the complex mix of employment and residential areas within the central area of Beijing, urban planning policies should be implemented to encourage mixed-use zoning, thereby reducing traffic congestion. This can be achieved by promoting the development of mixed-use buildings, which can help reduce the need for long-distance commuting. Given the higher concentration of shared bicycles in peripheral areas, city authorities may contemplate expanding shared bicycle services to neighboring regions, promoting more equitable access to this sustainable mode of transportation. In conclusion, our study contributes to a deeper understanding of the spatiotemporal dynamics of shared bike usage in the urban central area. The findings emphasize the importance of considering both spatial and temporal factors in planning bike-sharing systems and urban transportation strategies. The insights gained from this research can inform policymakers and urban planners in optimizing the allocation of resources, improving transportation infrastructure, and promoting sustainable urban mobility.
There are certain limitations to this study. Firstly, the data used in this research were limited to just three days in the summer (6 July, 7 July, and 8 July 2021). Secondly, the variety of network indicators used in this study could be further expanded. Future research directions can build upon this study to further explore and address several aspects. Firstly, incorporating additional data sources, such as weather conditions and demographic information, could provide a more comprehensive understanding of the factors influencing shared bike usage patterns. Secondly, investigating the impact of bike-sharing systems on traffic congestion, air quality, and public health would contribute to a broader assessment of the benefits and challenges associated with promoting sustainable urban mobility. Additionally, exploring the spatiotemporal dynamics of shared bikes in different seasons and during special events or holidays could provide insights into the adaptability and resilience of bike-sharing systems. Lastly, integrating advanced analytical techniques, such as machine learning and predictive modeling, could enhance the accuracy of predicting bike usage demand and support more efficient resource allocation. By addressing these research directions, we can continue to advance our understanding of shared bike systems and contribute to the development of sustainable and efficient urban transportation networks.
Author Contributions
Conceptualization, D.T., Z.W., and Y.S.; data curation, D.T. and Z.W.; formal analysis, D.T. and Z.W.; funding acquisition, D.T.; investigation, Z.W.; project administration, D.T.; resources, D.T. and Y.S.; software, Z.W.; supervision, Y.S.; writing—original draft, D.T. All authors have read and agreed to the published version of the manuscript.
Funding
This work was supported by the Study on the Updating Assessment Technique of the Central City of Megacities under Multi-source Data–Beijing as an Example (2021-K-014), the Beijing Key Laboratory of Urban Spatial Information Engineering (20230110).
Institutional Review Board Statement
Not applicable.
Informed Consent Statement
Not applicable.
Data Availability Statement
Not applicable.
Acknowledgments
The authors would like to thank all of the reviewers for their valuable contributions to this work.
Conflicts of Interest
The authors declare no conflict of interest.
References
- Fishman, E. Bikeshare: A Review of Recent Literature. Transp. Rev. 2016, 36, 92–113. [Google Scholar] [CrossRef]
- Chen, D.; Hu, W.; Li, Y.; Zhang, C.; Lu, X.; Cheng, H. Exploring the temporary and spatial effects of city size on regional economic integration: Evidence from the Yangtze River Economic Belt in China. Land Use Policy 2023, 132, 106770. [Google Scholar] [CrossRef]
- Wang, J.; Huang, J.; Dunford, M. Rethinking the Utility of Public Bicycles: The Development and Challenges of Station-Less Bike Sharing in China. Sustainability 2019, 11, 1539. [Google Scholar] [CrossRef]
- Guo, K.; Cao, Y.; Wang, Z.; Li, Z. Urban and industrial environmental pollution control in China: An analysis of capital input, efficiency and influencing factors. J. Environ. Manag. 2022, 316, 115198. [Google Scholar] [CrossRef] [PubMed]
- Shen, S.; Wei, Z.Q.; Sun, L.J.; Su, Y.Q.; Wang, R.C.; Jiang, H.M. The Shared Bicycle and Its Network—Internet of Shared Bicycle (IoSB): A Review and Survey. Sensors 2018, 18, 2581. [Google Scholar] [CrossRef] [PubMed]
- Ling, S.; Ma, S.; Jia, N. Sustainable urban transportation development in China: A behavioral perspective Frontiers of Engineering. Management 2022, 9, 16–30. [Google Scholar]
- Zhao, D.; Ong, G.P. Geo-Fenced Parking Spaces Identification for Free-Floating Bicycle Sharing System. Transp. Res. Part Policy Pract. 2021, 148, 49–63. [Google Scholar] [CrossRef]
- Gao, K.; Yang, Y.; Li, A.; Li, J.; Yu, B. Quantifying Economic Benefits from Free-Floating Bike-Sharing Systems: A Trip-Level Inference Approach and City-Scale Analysis. Transp. Res. Part Policy Pract. 2021, 144, 89–103. [Google Scholar] [CrossRef]
- Chen, Z.; van Lierop, D.; Ettema, D. Dockless Bike-Sharing Systems: What Are the Implications? Transp. Rev. 2020, 40, 333–353. [Google Scholar] [CrossRef]
- Chen, X.; Ma, Z.; Ye, G.; Li, Z. Usage Behavior and Satisfaction Analysis of Free-Floating Bicycle Sharing System Service: Evidence from a Chinese University Campus. Res. Transp. Bus. Manag. 2022, 43, 100703. [Google Scholar] [CrossRef]
- Hu, L.; Wen, Z.; Wang, J.; Hu, J. Spatial Interaction Analysis of Shared Bicycles Mobility Regularity and Determinants: A Case Study of Six Main Districts, Beijing. ISPRS Int. J. Geo-Inf. 2022, 11, 477. [Google Scholar] [CrossRef]
- Li, Y.; Zhu, Z.; Guo, X. Operating Characteristics of Dockless Bike-Sharing Systems near Metro Stations: Case Study in Nanjing City, China. Sustainability 2019, 11, 2256. [Google Scholar] [CrossRef]
- Garcia-Gutierrez, J.; Romero-Torres, J.; Gaytan-Iniestra, J. Dimensioning of a Bike Sharing System (BSS): A Study Case in Nezahualcoyotl, Mexico. Procedia-Soc. Behav. Sci. 2014, 162, 253–262. [Google Scholar] [CrossRef]
- Torrisi, V.; Ignaccolo, M.; Inturri, G.; Tesoriere, G.; Campisi, T. Exploring the Factors Affecting Bike-Sharing Demand: Evidence from Student Perceptions, Usage Patterns and Adoption Barriers. Transp. Res. Procedia 2021, 52, 573–580. [Google Scholar] [CrossRef]
- Parkes, S.D.; Marsden, G.; Shaheen, S.A.; Cohen, A.P. Understanding the Diffusion of Public Bikesharing Systems: Evidence from Europe and North America. J. Transp. Geogr. 2013, 31, 94–103. [Google Scholar] [CrossRef]
- Wang, X.; Sun, H.; Zhang, S.; Lv, Y.; Li, T. Bike Sharing Rebalancing Problem with Variable Demand. Phys. Stat. Mech. Its Appl. 2022, 591, 126766. [Google Scholar] [CrossRef]
- Dell’Amico, M.; Iori, M.; Novellani, S.; Subramanian, A. The Bike Sharing Rebalancing Problem with Stochastic Demands. Transp. Res. Part B Methodol. 2018, 118, 362–380. [Google Scholar] [CrossRef]
- Chen, J.; Yang, Z.; Cheng, P.; Shu, Y. Rebalancing Bike-Sharing System with Deep Sequential Learning. IEEE Intell. Transp. Syst. Mag. 2020, 13, 92–98. [Google Scholar] [CrossRef]
- Maas, S.; Nikolaou, P.; Attard, M.; Dimitriou, L. Spatial and Temporal Analysis of Shared Bicycle Use in Limassol, Cyprus. J. Transp. Geogr. 2021, 93, 103049. [Google Scholar] [CrossRef]
- Faghih-Imani, A.; Eluru, N. Incorporating the Impact of Spatio-Temporal Interactions on Bicycle Sharing System Demand: A Case Study of New York CitiBike System. J. Transp. Geogr. 2016, 54, 218–227. [Google Scholar] [CrossRef]
- Elhenawy, M.; Komol, M.R.; Masoud, M.; Liu, S.Q.; Ashqar, H.I.; Almannaa, M.H.; Rakha, H.A.; Rakotonirainy, A. A Novel Crowdsourcing Model for Micro-Mobility Ride-Sharing Systems. Sensors 2021, 21, 4636. [Google Scholar] [CrossRef] [PubMed]
- Hu, J.-W.; Creutzig, F. A Systematic Review on Shared Mobility in China. Int. J. Sustain. Transp. 2022, 16, 374–389. [Google Scholar] [CrossRef]
- Lin, P.; Weng, J.; Hu, S.; Alivanistos, D.; Li, X.; Yin, B. Revealing Spatio-Temporal Patterns and Influencing Factors of Dockless Bike Sharing Demand. IEEE Access 2020, 8, 66139–66149. [Google Scholar] [CrossRef]
- Tao, F.; Wang, C. In Response to Green Travel, Full Coverage of Shared Bicycles in Beijing before the End of the Year. Beijing Commercial Daily, 23 September 2021. [Google Scholar]
- Xing, Q.; Chen, Z.; Zhang, Z.; Huang, X.; Leng, Z.; Sun, K.; Chen, Y.; Wang, H. Charging Demand Forecasting Model for Electric Vehicles Based on Online Ride-Hailing Trip Data. IEEE Access 2019, 7, 137390–137409. [Google Scholar] [CrossRef]
- Qiao, Z.; Xu, X.; Wu, F.; Luo, W.; Wang, F.; Liu, L.; Sun, Z. Urban Ventilation Network Model: A Case Study of the Core Zone of Capital Function in Beijing Metropolitan Area. J. Clean. Prod. 2017, 168, 526–535. [Google Scholar] [CrossRef]
- Zacharias, J. Environmental Correlates of Dock-Less Shared Bicycle Trip Origins and Destinations. J. Transp. Geogr. 2021, 92, 103013. [Google Scholar] [CrossRef]
- Harris, J.K. Introduction to Exponential Random Graph Models; Shanghai People’s Publishing House and Gezhi Publishing House: Shanghai, China, 2016. [Google Scholar]
- Li, X.; Li, W.; Zeng, M.; Zheng, R.; Li, M. Network-Based Methods for Predicting Essential Genes or Proteins: A Survey. Brief. Bioinform. 2020, 21, 566–583. [Google Scholar] [CrossRef]
- Ryan, L.; D’Angelo, A. Changing Times: Migrants’ Social Network Analysis and the Challenges of Longitudinal Research. Soc. Netw. 2018, 53, 148–158. [Google Scholar] [CrossRef]
- Zhang, W.; Chong, Z.; Li, X.; Nie, G. Spatial Patterns and Determinant Factors of Population Flow Networks in China: Analysis on Tencent Location Big Data. Cities 2020, 99, 102640. [Google Scholar] [CrossRef]
- Wang, X.; Ding, S.; Cao, W.; Fan, D.; Tang, B. Research on Network Patterns and Influencing Factors of Population Flow and Migration in the Yangtze River Delta Urban Agglomeration, China. Sustainability 2020, 12, 6803. [Google Scholar] [CrossRef]
- Chong, Z.; Pan, S. Understanding the Structure and Determinants of City Network through Intra-Firm Service Relationships: The Case of Guangdong-Hong Kong-Macao Greater Bay Area. Cities 2020, 103, 102738. [Google Scholar] [CrossRef]
- Zhou, Q. Hotspots Detection and Dynamic Analysis from Trajectory Data Based on Spatio-Temporal Data Field Clustering and Complex Network. Master’s Thesis, Wuhan University, Wuhan, China, 2017. [Google Scholar]
- Freeman, L.C. A Set of Measures of Centrality Based on Betweenness. Sociometry 1977, 40, 35–41. [Google Scholar] [CrossRef]
- Gutiérrez-Moya, E.; Lozano, S.; Adenso-Díaz, B. Analysing the Structure of the Global Wheat Trade Network: An ERGM Approach. Agronomy 2020, 10, 1967. [Google Scholar] [CrossRef]
- Borgnat, P.; Robardet, C.; Abry, P.; Flandrin, P.; Rouquier, J.-B.; Tremblay, N. A Dynamical Network View of Lyon’s Vélo’v Shared Bicycle System. Dyn. Complex Netw. Vol. 2 Appl. Time-Varying Dyn. Syst. 2013, 2, 267–284. [Google Scholar] [CrossRef]
- Chen, Q.; Wu, T.-T.; Fang, M. Detecting Local Community Structures in Complex Networks Based on Local Degree Central Nodes. Phys. Stat. Mech. Its Appl. 2013, 392, 529–537. [Google Scholar] [CrossRef]
- Watts, D.J.; Strogatz, S.H. Collective Dynamics of ‘Small-World’ Networks. Nature 1998, 393, 440–442. [Google Scholar] [CrossRef] [PubMed]
- Barabási, A.-L.; Albert, R. Emergence of Scaling in Random Networks. Science 1999, 286, 509–512. [Google Scholar] [CrossRef]
Figure 1.
Research scope map.

Figure 2.
Technical approach.

Figure 3.
Shared bicycle space distribution: (a) 6:00; (b) 9:00; (c) 17:00; (d) 20:00.

Figure 4.
Visualization of spatial interaction networks: (a) July 6 early period network; (b) July 7 early period network; (c) July 8 early period network; (d) July 6 night period network; (e) July 7 night period network; (f) July 8 night period network.
Figure 4.
Visualization of spatial interaction networks: (a) July 6 early period network; (b) July 7 early period network; (c) July 8 early period network; (d) July 6 night period network; (e) July 7 night period network; (f) July 8 night period network.


Figure 5.
Node strength statistics: (a) July 6 early period; (b) July 7 early period; (c) July 8 early period; (d) July 6 night period; (e) July 7 night period; (f) July 8 night period.
Figure 5.
Node strength statistics: (a) July 6 early period; (b) July 7 early period; (c) July 8 early period; (d) July 6 night period; (e) July 7 night period; (f) July 8 night period.


Figure 6.
NFR analysis chart: (a) July 6 early period; (b) July 7 early period; (c) July 8 early period; (d) July 6 night period; (e) July 7 night period; (f) July 8 night period.
Figure 6.
NFR analysis chart: (a) July 6 early period; (b) July 7 early period; (c) July 8 early period; (d) July 6 night period; (e) July 7 night period; (f) July 8 night period.


Figure 7.
Degree centrality analysis plot: (a) July 6 degree centrality; (b) July 7 degree centrality; (c) July 8 degree centrality.
Figure 7.
Degree centrality analysis plot: (a) July 6 degree centrality; (b) July 7 degree centrality; (c) July 8 degree centrality.


Table 1.
List of experimental data.
| Data Name | Data Format | Data Collection Time | Data Size | Field Name | Field Explanation |
|---|---|---|---|---|---|
| Bicycle sharing data | CSV | 6 July, 7 July and 8 July, 2021 | 2.4 million records | TIME | Data collection time |
| BICYCLE_ID | Bicycle ID number | ||||
| LATITUDE | Latitude/° | ||||
| LONGITUDE | Longitude/° | ||||
| Administrative district data | Shapefile | April 2021 | 122 | FID | Street serial number |
| SHAPE | Element type | ||||
| NAME | Street name |
Table 2.
Network basic attribute statistics.
| Time Period | Network Density | ||
|---|---|---|---|
| July 6 | July 7 | July 8 | |
| 6:00–9:00 | 0.1661699 | 0.1715215 | 0.1764666 |
| 17:00–20:00 | 0.1793117 | 0.1650673 | 0.1791085 |
Disclaimer/Publisher’s Note: The statements, opinions and data contained in all publications are solely those of the individual author(s) and contributor(s) and not of MDPI and/or the editor(s). MDPI and/or the editor(s) disclaim responsibility for any injury to people or property resulting from any ideas, methods, instructions or products referred to in the content. |
© 2023 by the authors. Licensee MDPI, Basel, Switzerland. This article is an open access article distributed under the terms and conditions of the Creative Commons Attribution (CC BY) license (https://creativecommons.org/licenses/by/4.0/).
Share and Cite
MDPI and ACS Style
Tian, D.; Wen, Z.; Sun, Y. Analyzing the Spatial Interaction Characteristics of Urban Area Shared Bicycle Systems: A Case Study of Beijing’s Central Area. Buildings 2023, 13, 2646. https://0-doi-org.brum.beds.ac.uk/10.3390/buildings13102646
AMA Style
Tian D, Wen Z, Sun Y. Analyzing the Spatial Interaction Characteristics of Urban Area Shared Bicycle Systems: A Case Study of Beijing’s Central Area. Buildings. 2023; 13(10):2646. https://0-doi-org.brum.beds.ac.uk/10.3390/buildings13102646
Chicago/Turabian StyleTian, Dongwei, Zheng Wen, and Yao Sun. 2023. "Analyzing the Spatial Interaction Characteristics of Urban Area Shared Bicycle Systems: A Case Study of Beijing’s Central Area" Buildings 13, no. 10: 2646. https://0-doi-org.brum.beds.ac.uk/10.3390/buildings13102646
Note that from the first issue of 2016, this journal uses article numbers instead of page numbers. See further details here.