Article

Managing Safety Risks from Overlapping Construction Activities: A BIM Approach

by
Armin Rashidi Nasab
1,*,
Hassan Malekitabar
2,
Hazem Elzarka
1,*,
Ala Nekouvaght Tak
3 and
Khashayar Ghorab
4
1
Department of Civil, Architectural Engineering, and Construction Management, University of Cincinnati, Cincinnati, OH 45220, USA
2
School of Civil Engineering, Iran University of Science and Technology, University St., Hengam St., Resalat Square, Tehran 13114-16846, Iran
3
Institute for Creative Technologies, University of Southern California, Playa Vista, CA 90094, USA
4
Department of Civil Engineering, University of Calgary, 2500 University Drive NW, Calgary, AB T2N 1N4, Canada
*
Authors to whom correspondence should be addressed.
Submission received: 25 September 2023 / Revised: 17 October 2023 / Accepted: 17 October 2023 / Published: 20 October 2023
(This article belongs to the Special Issue Occupational Health in the Construction Industry)

Abstract

:
Addressing safety risks in construction is an ongoing priority, and integrating safety considerations into construction scheduling is a crucial aspect of this effort. A notable challenge is the safety risk posed by concurrent tasks, which has received limited attention in prior research. This study aims to address this research gap by introducing a novel Building Information Modeling (BIM)-based model that assesses the increased hazardousness resulting from overlapping construction activities. Historically, research has predominantly focused on individual task safety, with less emphasis on the risks associated with overlapping activities. Our innovative approach introduces the concept of a ‘source–target’ match, which evaluates the degree of hazardousness escalation when activities overlap. Drawing on data from the Occupational Safety and Health Administration (OSHA) and the National Institute for Occupational Safety and Health (NIOSH) fatal accident reports, we extracted 11 hazardous and 9 susceptibility attributes to build a source–target match table. This table reveals the characteristics of activities that generate hazardous conflicts when overlapping. The key contribution of this research is the assessment, prioritization, and visualization of risk levels in a BIM environment. This framework empowers safety managers to proactively address safety risks resulting from overlapping construction activities, ultimately reducing accidents in the construction industry. By shedding light on this overlooked aspect of construction safety, our research highlights the importance of integrating safety considerations into construction scheduling and provides a practical tool for mitigating risks, enhancing workplace safety, and ultimately improving project outcomes.

1. Introduction

The construction industry faces a concerning statistic: the rate of fatalities is 50% higher compared to other industries [1]. Despite the stringent safety standards set by organizations like the Occupational Safety and Health Administration (OSHA) and the substantial investments made by construction companies in pursuit of accident-free projects, construction accidents continue to occur at an alarming rate [1]. Addressing the root causes of safety risks demands advanced techniques and a collaborative, multidisciplinary approach [2].
While safety procedures often target high-risk situations associated with specific project activities [3,4], construction sites frequently host numerous small teams, or subcontractors, engaged in diverse tasks in close proximity to each other [5]. However, a critical aspect remains unaddressed: the impact of overlapping conflicts between project activities on safety. When two or more hazardous activities are scheduled concurrently, they not only accumulate risk [6] but also synergistically heighten safety risks by affecting each other. Surprisingly, this increased risk factor has received limited attention in prior research.
In bustling construction environments, it is common for multiple tasks to be scheduled simultaneously, leading to a higher incidence of accidents. Workers may be aware of safety risks associated with their own tasks but lack knowledge or training to manage safety hazards arising from other concurrent activities. These overlapping conflicts, while essential for efficiency, can result in unforeseen safety hazards [7]. For instance, the simultaneous positioning of surveying instruments and excavation by heavy equipment operators may lead to accidents [8]. Similarly, activities like pouring column concrete and installing reinforcement in elevated slabs can overlap, increasing the risk of accidents. Unfortunately, safety evaluations often focus on individual tasks, leaving the risks from overlapping activities unassessed [9].
Behm’s study in 2005 revealed that 42% of construction injuries could be linked to design-related factors [7]. These injuries might have been prevented had safety been a design consideration. Designing for safety is now recognized as pivotal in mitigating safety hazards; however, designers do not consistently prioritize safety criteria in their daily work. Construction managers commonly aim to reduce accidents by addressing hazards similar to those previously encountered. Integrating safety planning into construction scheduling can be a proactive approach to identifying potential safety risks before the commencement of each activity, significantly reducing the accident rate [10].
In the complex realm of construction projects, Building Information Modeling (BIM) has become an invaluable tool for safety managers to identify and understand risks more effectively and enhance the dynamic visualization of safety procedures [11,12]. This research introduces a BIM-based framework to identify a previously overlooked safety risk arising from overlapping activities. The process involves three key steps: (1) defining conditions under which overlapping activities intensify the risk, (2) prioritizing risky activities with overlapping conflicts through risk assessment, and (3) automating and visualizing the identification process using BIM to enhance accessibility for safety managers.
This paper is organized as follows:
  • Section 2 reviews relevant literature on overlapping construction activities, risk assessment, and the role of BIM in identifying safety issues.
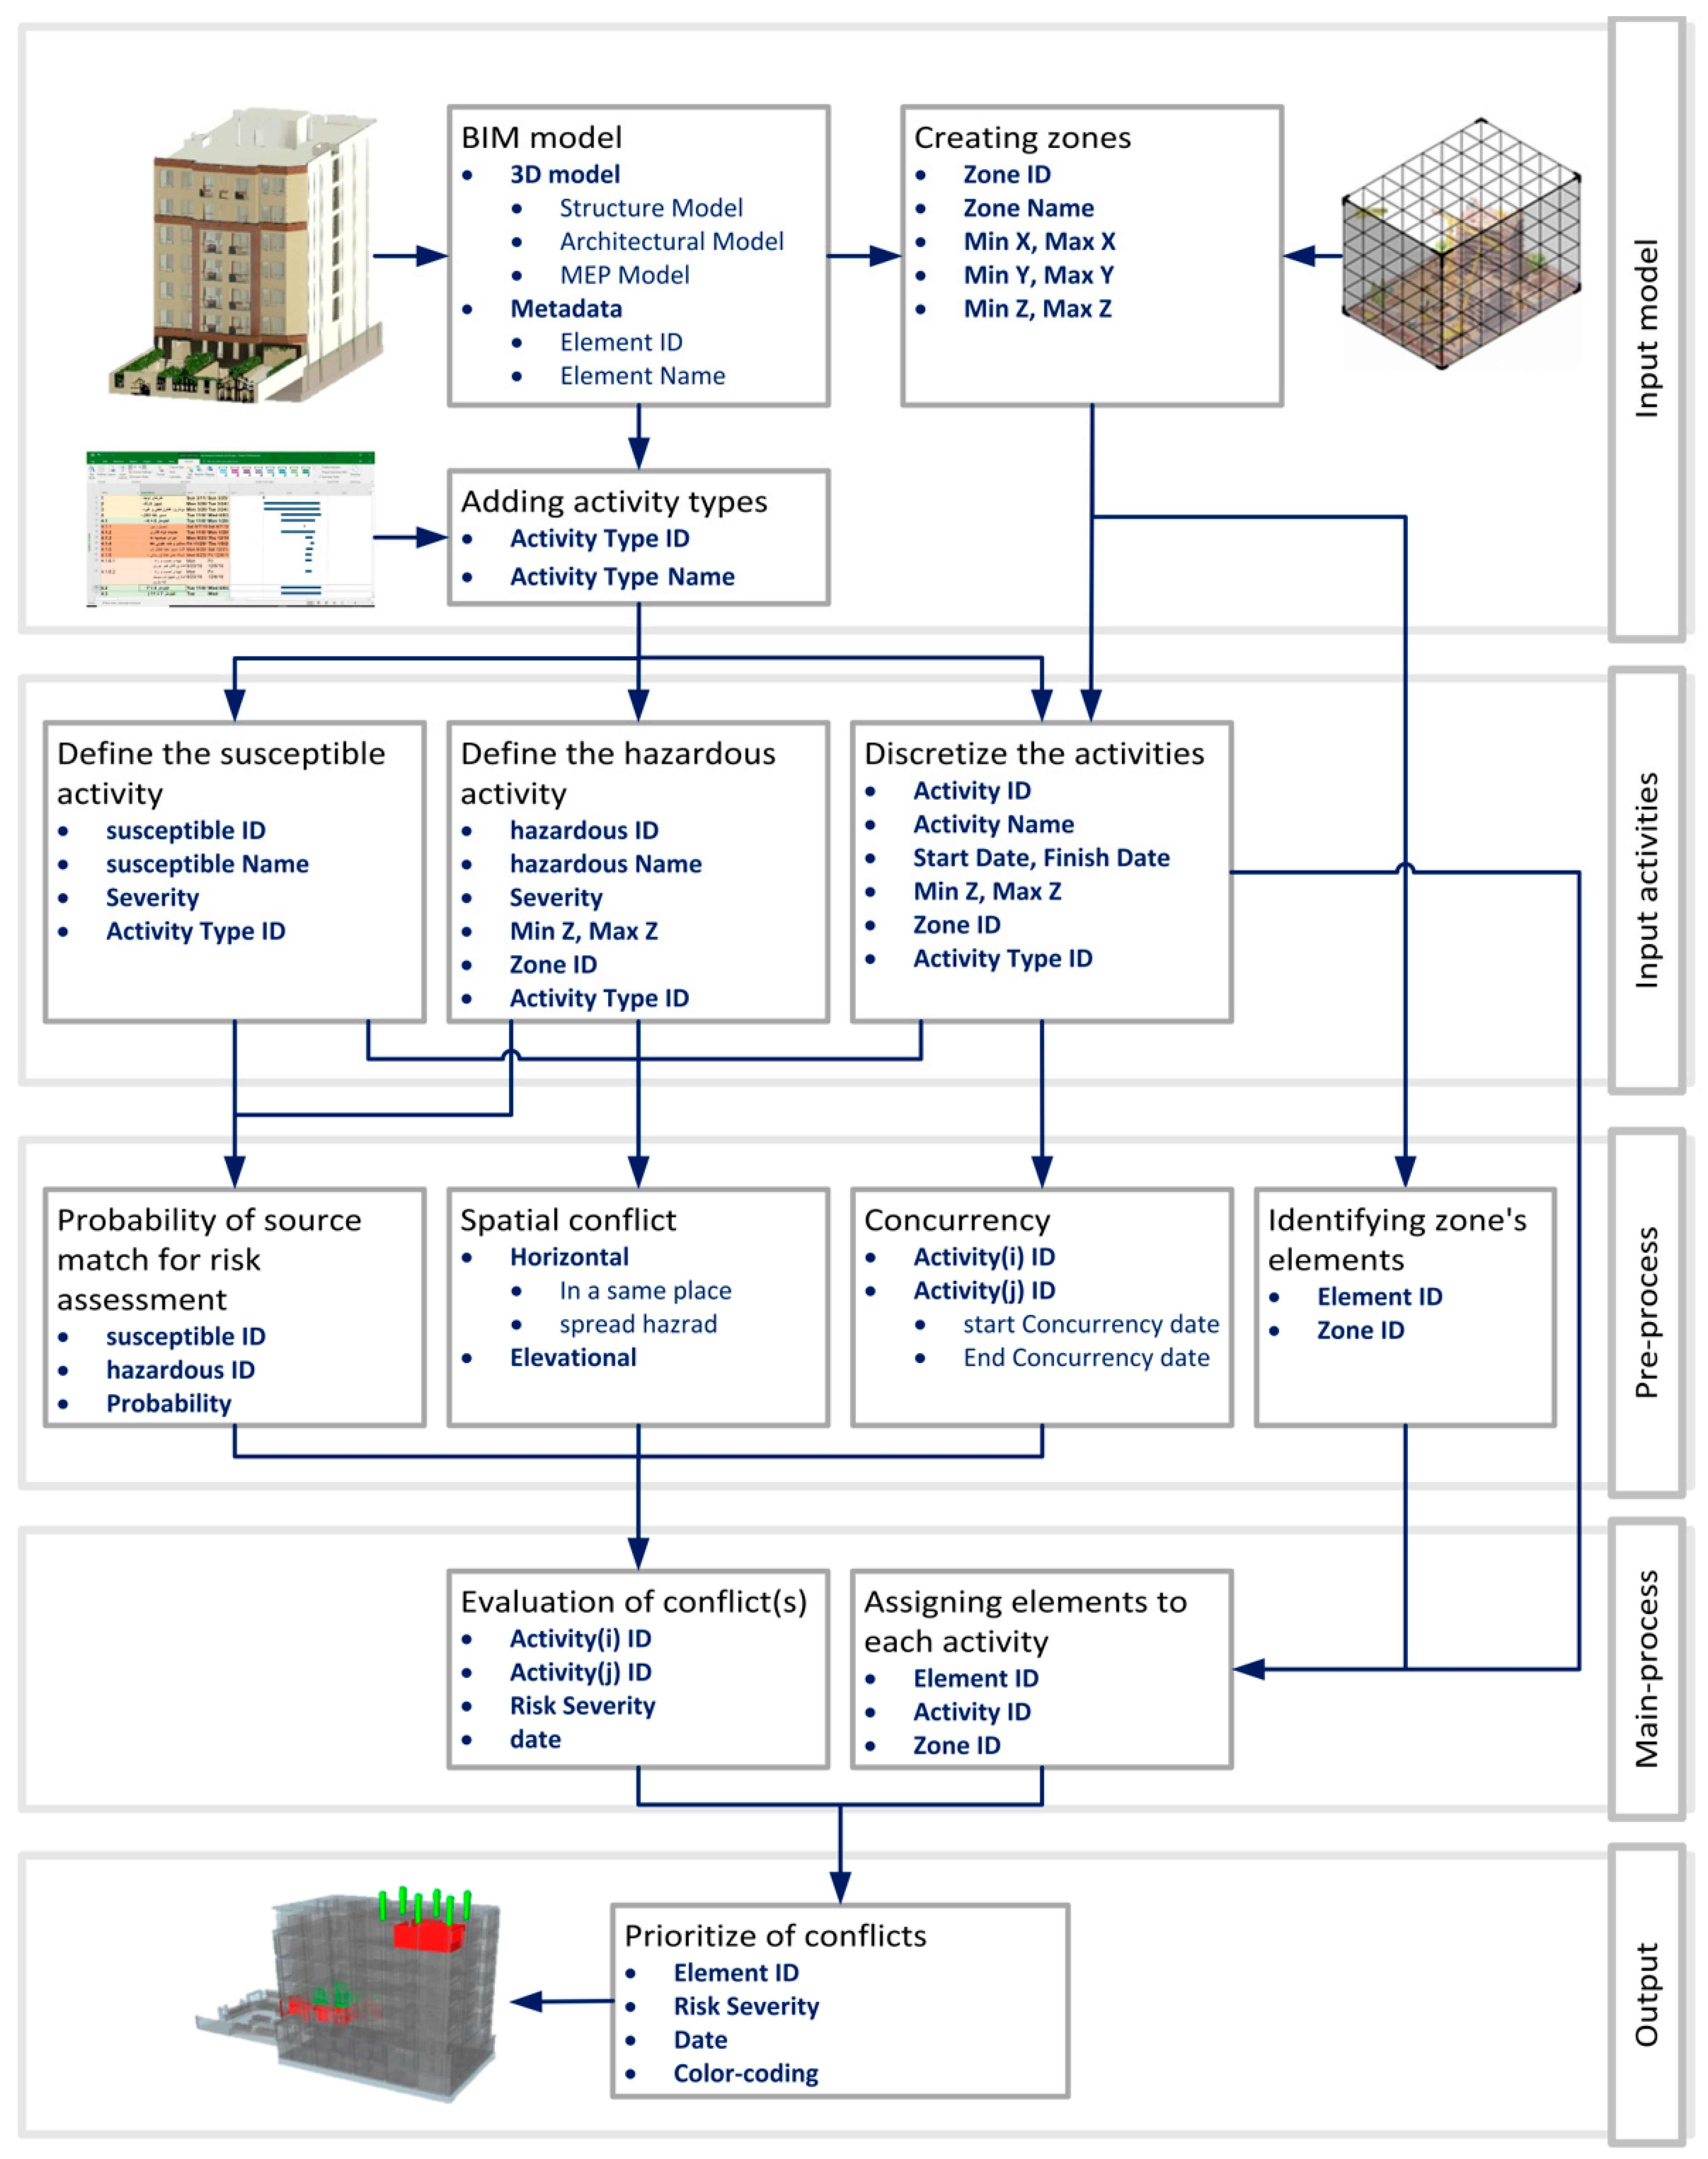
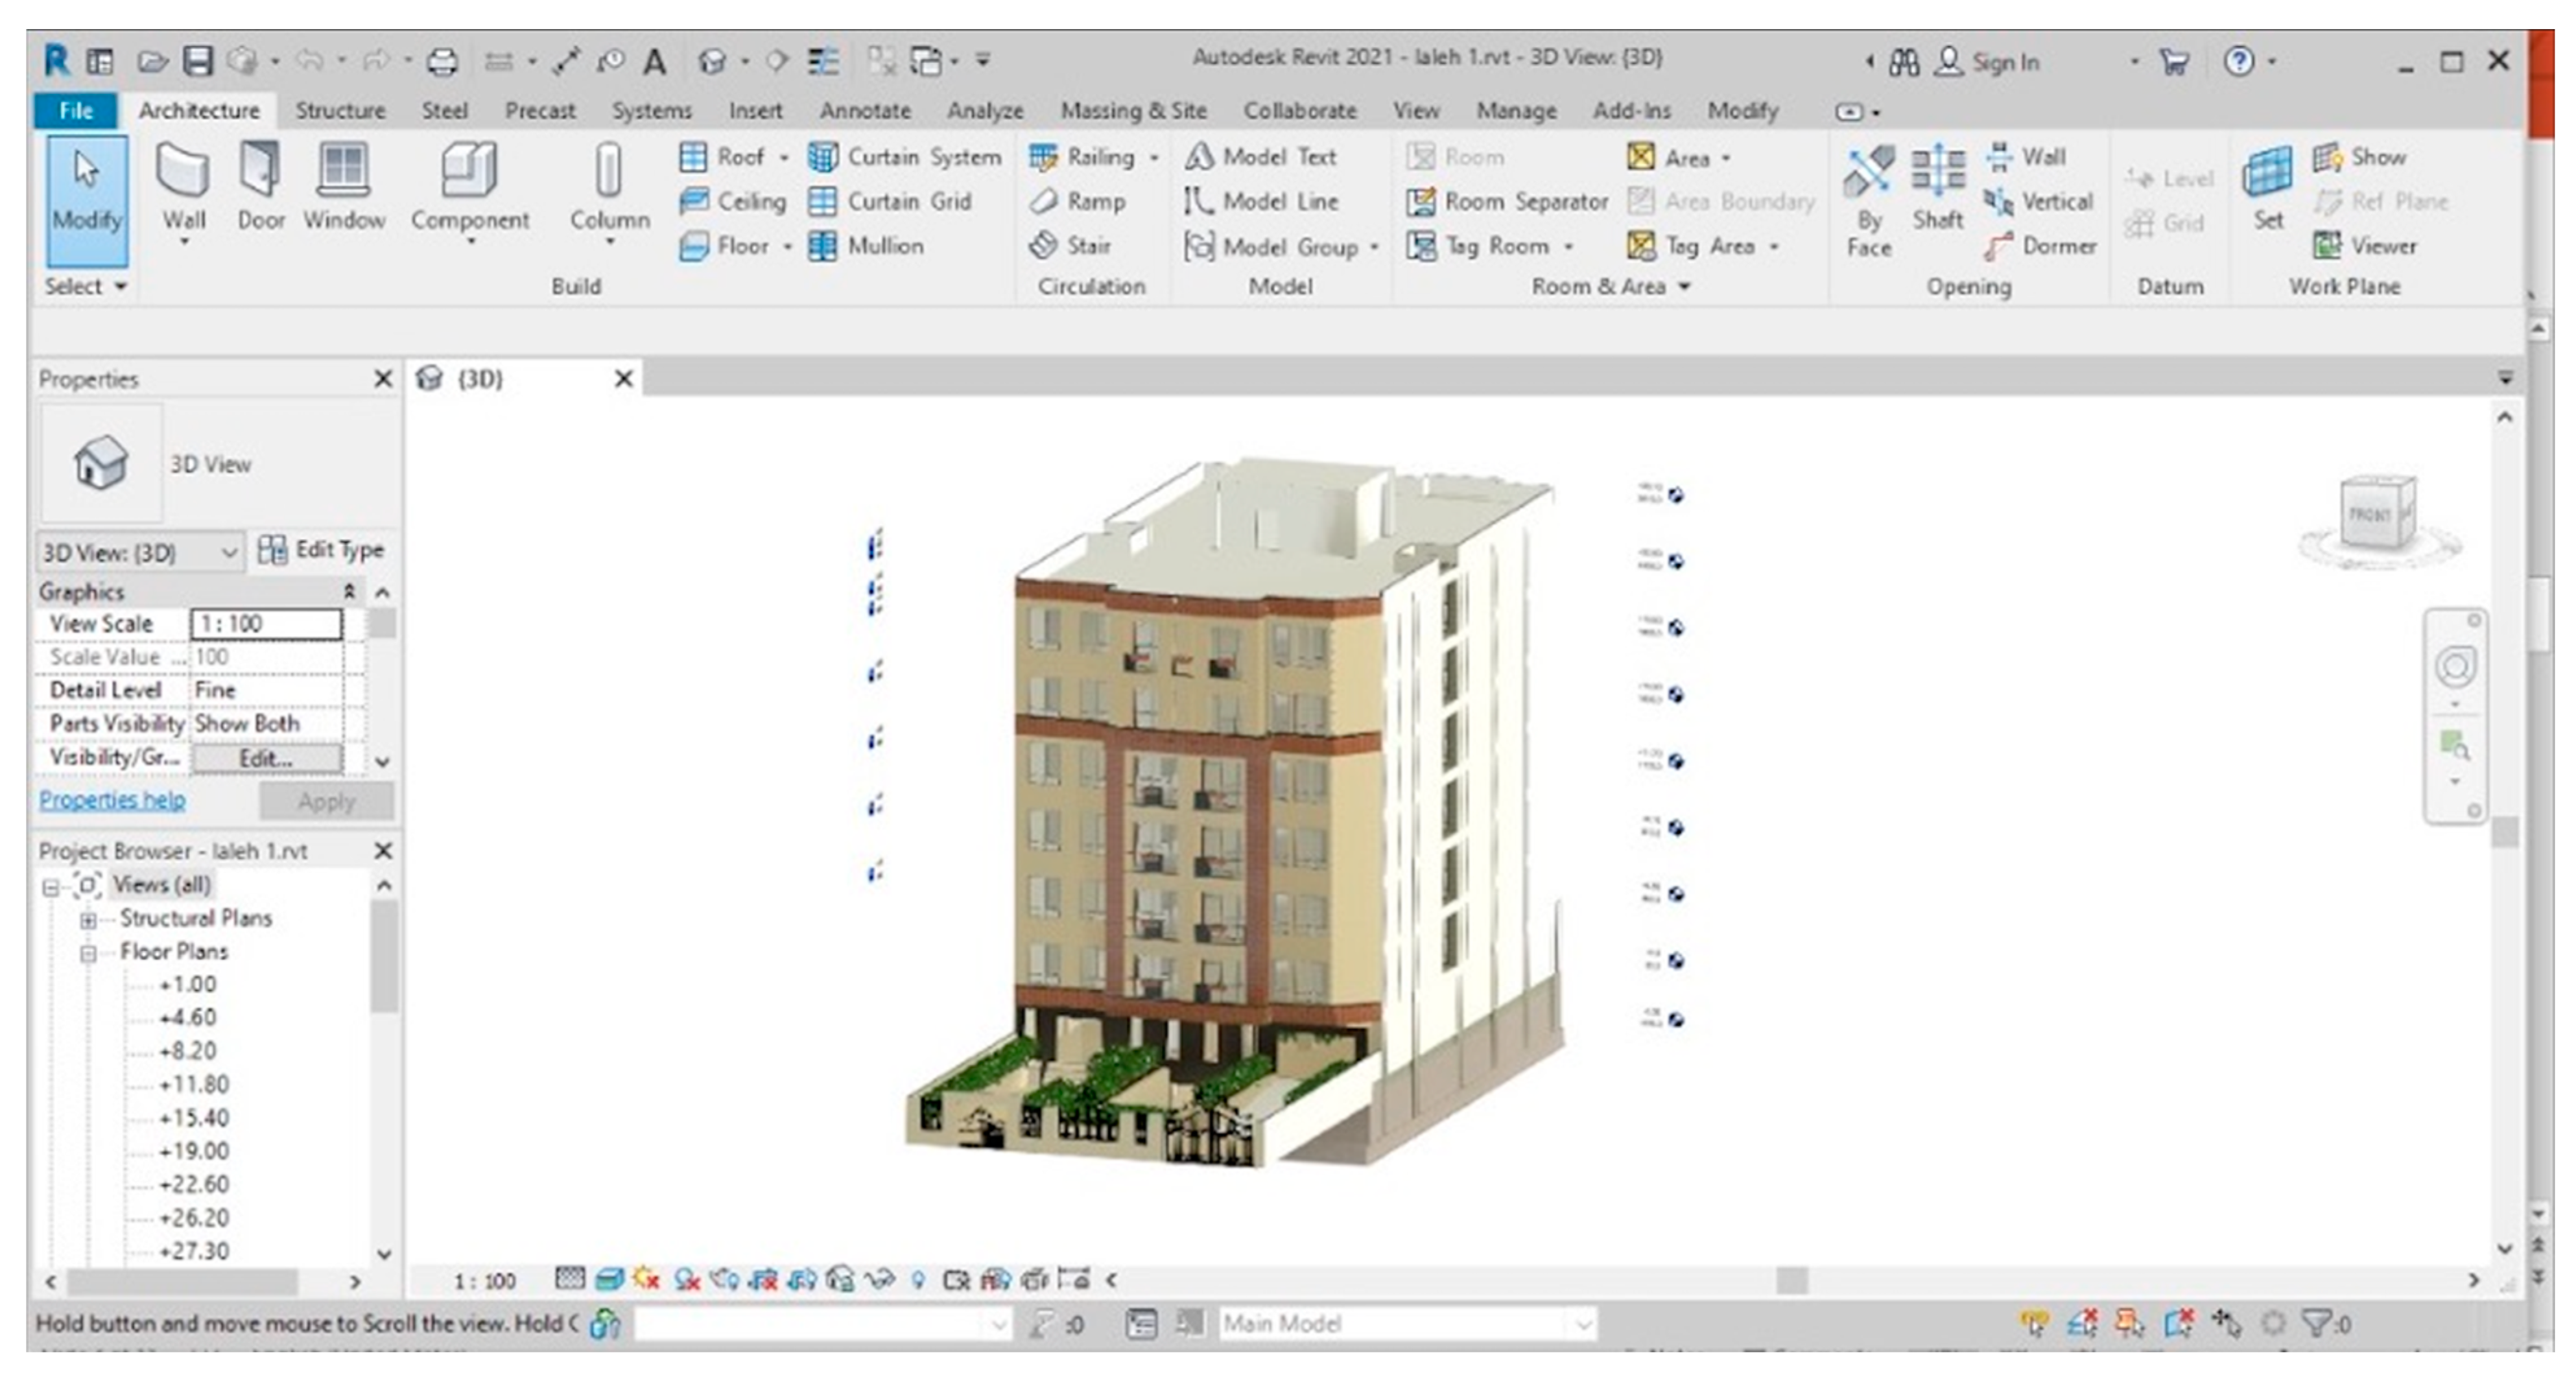
  • Section 3 introduces the proposed framework, detailing how overlapping activities are captured and how a BIM model can be implemented.
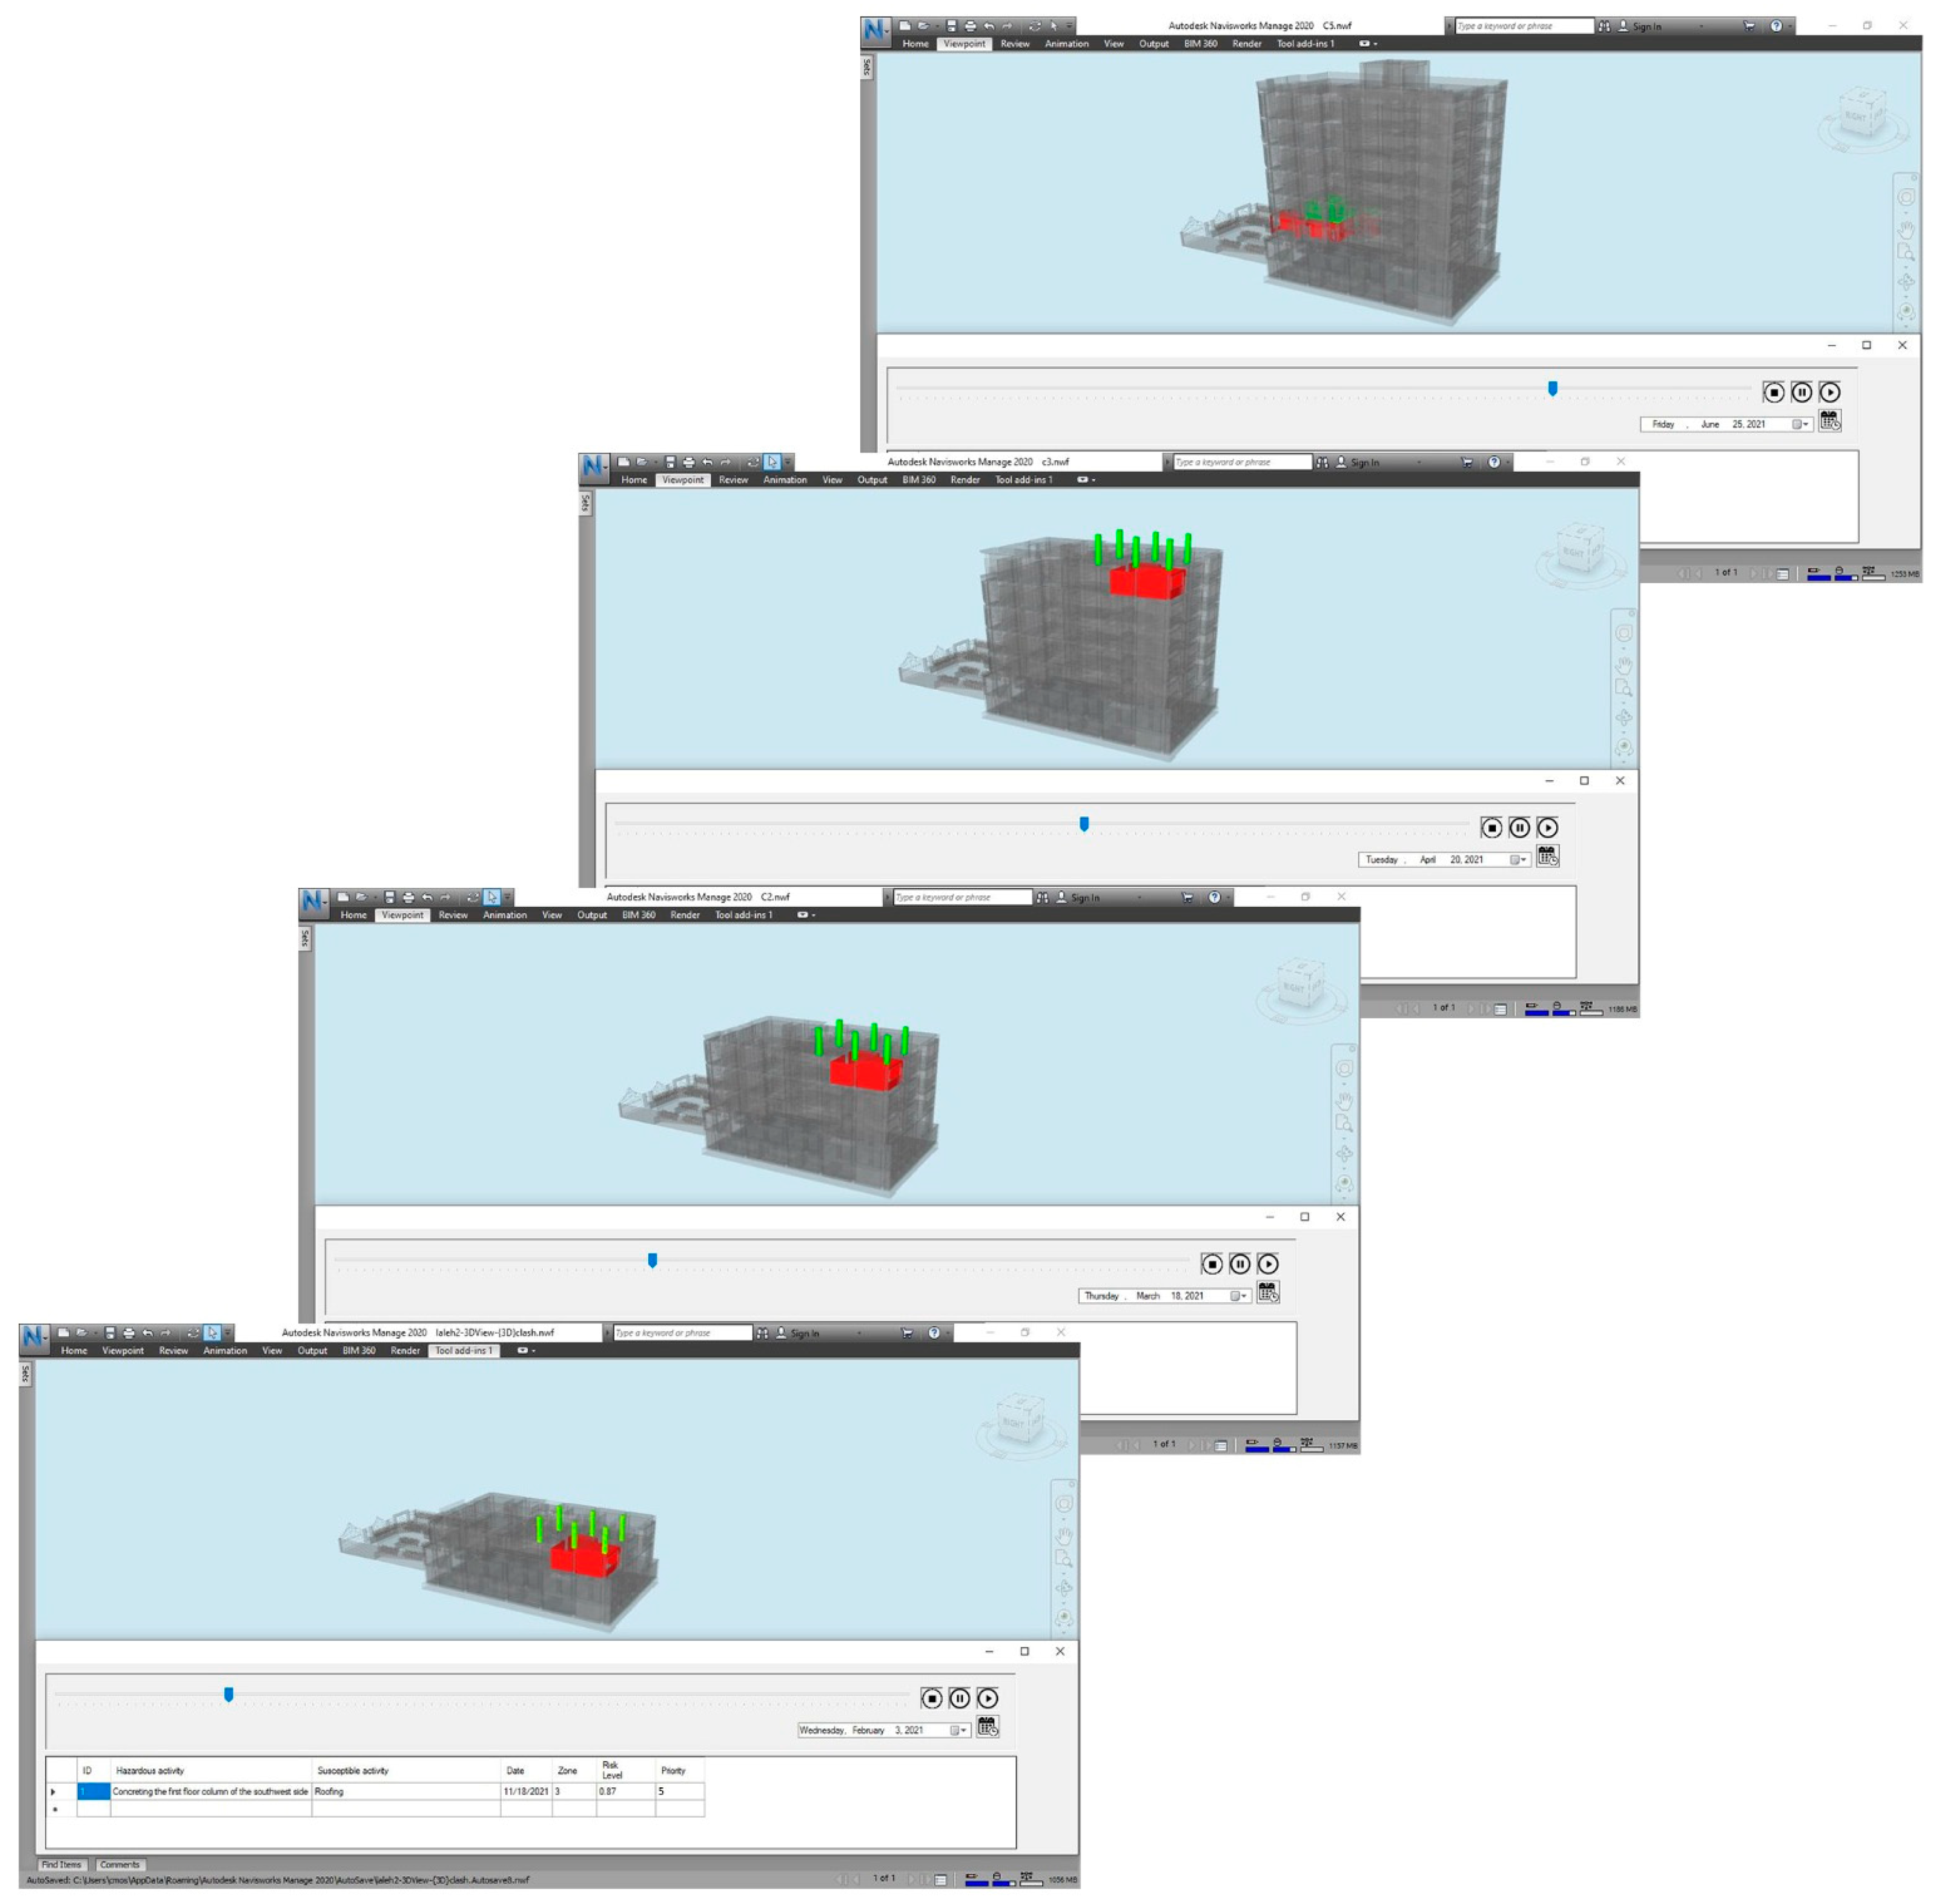
  • Section 4 presents the findings, including a case study illustrating the model’s practical application.
  • Finally, Section 5 and Section 6 provide a discussion of our findings and conclude the paper.

2. Literature Review

A significant body of research has addressed unsafe conditions at construction project sites. Kartam (1997) found construction accidents to be the source of many human tragedies, delays in activities, and lack of worker motivation [5]. He believed an essential step for mitigating construction hazards is considering safety at the planning stage. He introduced a Critical Path Method (CPM)-based system to manage safety activities and predict unsafe risks. Kartam’s research is one of the earliest research projects that suggests considering safety in construction scheduling. Zolfagharian et al. (2014) collected information on high-risk construction accidents to evaluate the risk parameters of every project task [8]. They combined this information with the project schedule in an automated module, which anticipated the rate of accidents in each activity to assist safety managers before the start of the activities. Mirzaei et al. (2018) concluded that conflicts frequently occur when the workspace shared by different activities was not evaluated in the construction time–space and proposed a time–space conflict model using 4D-BIM to decrease workspace conflicts among workers’ movements during different stages of construction activities [6]. They mainly focused on conflict between two support platform spaces, conflict between two labor workspaces, and conflict between a labor workspace and a support platform space. Moon et al. developed a schedule–workspace system to manage workspaces that have overlaps with each other [13]. They asserted that simultaneous workspaces increase conflict between resources; therefore, they implemented a platform using BIM and a genetic algorithm (GA) to decrease the level of overlap between scheduled workspaces. Yi and Langford considered the issue of scheduled-based safety risks, to minimize accidents [14]. They believed that in a hazardous environment, they should either pay attention to jobs related to the hazards or the hazardous environment should be eliminated. They concluded that to prevent such dangerous activities, they need to be either rescheduled or relocated; then, using risk assessment of activities, they could identify risky situations where and when they can happen. Martinez et al. used the unmanned aerial system to minimize job site conflicts and collisions, after implementing flight tests they could decrease safety risks probabilities such as worker distraction by more than 40% [15]. Khodabandelu et al. (2020) developed an Agent-Based Modeling (ABM) simulation to decrease collision possibilities between cranes [16]. Their model mitigated overlap risks while increasing crane productivity and schedule time. Guo et al. (2018) highlighted the peer pressure effect and developed a Behavior-Based Safety (BBS) program to prevent unsafe behavior [17].
Project managers have felt unable to fully identify the safety risks when the tasks get complicated [18,19]. Mohandes and Zhang asserted there has been always a lack of comprehensive studies in considering risk parameters, so they conducted a Holistic Occupational Health and Safety Risk Assessment Model (HOHSRAM), and they could assess all the crucial risk parameters using the integration of logarithmic fuzzy ANP, interval-valued Pythagorean fuzzy TOPSIS, and grey relational analysis [20]. Cagno et al. (2001) asserted that improvements in safety measures were highly dependent on risk assessments [21]. Sanni-Anibire et al. (2019) confirmed this association by developing a risk assessment approach and establishing risk scores and weights for every construction hazard in various projects [1].
Okpala et al. (2020) surveyed the different technologies for mitigating safety risks throughout the project life cycle. They stated that BIM substantially improves the identification of unsafe situations before the beginning of construction [22]. While asserting that safety management will start from planning to implementation, Chantawit et al. (2005) found it difficult to analyze what, when, where, and why safety measures are needed. They introduced 3D and 4D-CAD visualization systems that made hazard prevention much more convenient for safety managers [23]. At present, growing technologies such as BIM facilitate planning with more detail and fewer weaknesses. Kassem et al. developed a 4D tool for workspace management to identify spatial and temporal conflicts in site activities [24]. Lu et al. developed a quantitative method in order to automatically assess the safety risks using BIM, which helps architects and structure engineers to use alternative designs easily [25]. They calculated risk assessments using three indexes: likelihood, consequences, and exposure. Nekouvaght Tak et al. conducted a 4D crane simulation framework in the BIM environment to detect potential spatial conflicts related to the crane [26]. The frameworks were verified using three case studies in Alberta, Canada. Recent advancements have further expanded this potential through the introduction of the 8D BIM concept [27]. The eighth dimension of BIM revolves around the integration of health, safety, and well-being of the building’s occupants into the modeling process. This dimension aids in creating a holistic view of safety, mapping the risks associated with both the construction phase and the end-user phase into the BIM model. By doing so, the entire lifecycle of a construction project, from inception to decommissioning, is taken into consideration, ensuring that every potential risk is accounted for. This way, 8D BIM not only provides an in-depth visualization of potential spatial conflicts but also ensures the building’s design is ergonomically sound and safe for its end-users. The emphasis here is on predicting and eliminating risks even before they manifest, making proactive safety measures an integral part of the construction process. Therefore, as the construction industry evolves, 8D BIM is anticipated to play an increasingly pivotal role in merging technological advancements with a strong commitment to safety [28].
Previous studies mainly focused on conflict of either time or space between activities but did not adequately consider the hazardous impact of one activity on another [5,6]. This research introduces a new BIM-based approach to the identification of activities that overlap with each other, occur at the same location, and interfere with each other in a way that intensifies risky accidents in the construction industry.

3. Methodology

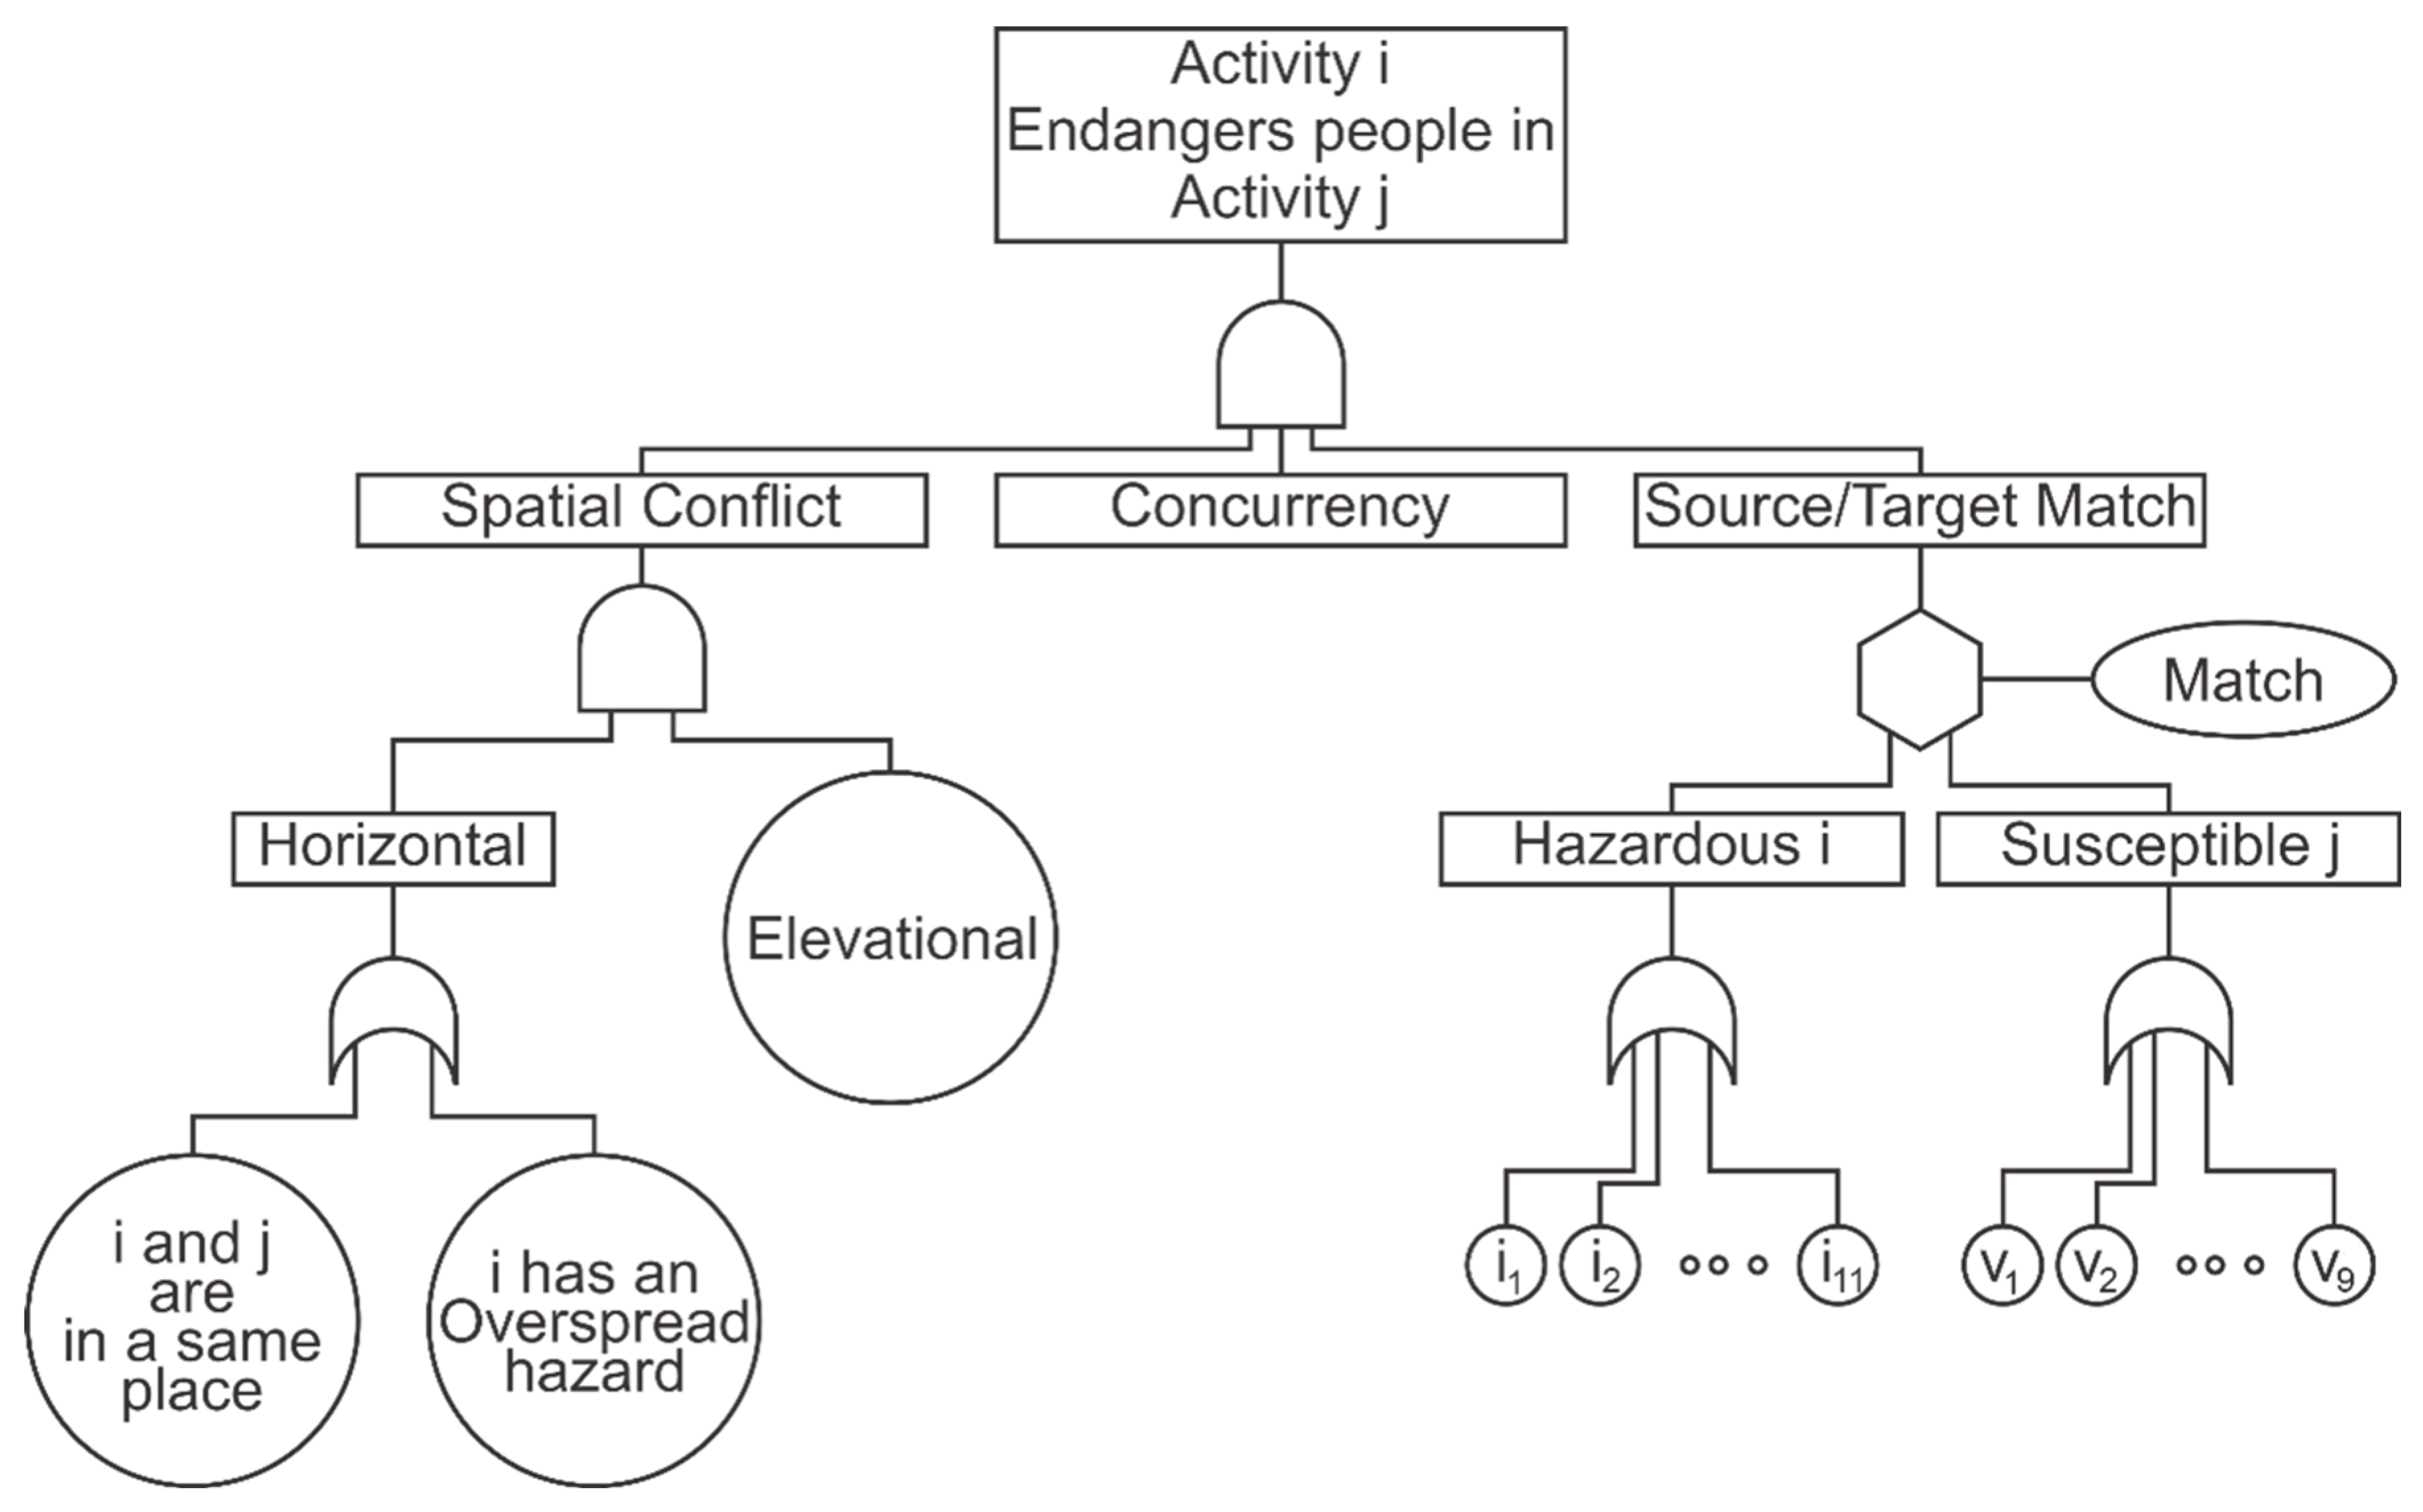
3.1. Degree of Hazardousness from Overlapping Activities

The degree of hazardousness from overlapping activities will be first discussed in this section. As shown in Figure 1, a Fault Tree Analysis (FTA) was used to logically describe the anticipated degree of hazardousness from overlapping construction activities. As shown in Figure 1, the three main factors that have an impact on the anticipated degree of hazardousness resulting from two overlapping activities are (1) the activities’ spatial overlap, (2) the activities’ concurrency, and (3) the activities’ source–target match, which is a newly introduced parameter that is described later. It should be noted that the absence of any of these factors will eliminate the hazardousness that may result from the two overlapping activities.
On the other hand, if the three factors co-exist, Equation (1) can be used to determine the degree of hazardousness. An activity that poses risks to workers performing another activity that coincides in time, place, and height generates an overlapping conflict with that activity according to Equation (1), where F (i, j) = overlapping conflict of activity i and j. The overlapping conflict is explained in the three steps below.
F   ( i .   j ) = S p a t i a l   o v e r l a p × C o n c u r r e n c y × S o u r c e / T a r g e t   M a t c h

3.1.1. Source–Target Match

Source–target match seeks to examine the degree to which two overlapping activities will affect each other. A construction activity has characteristics that may increase the safety risks of all overlapping activities. These characteristics are referred to in this research as “Hazardous” attributes. For example, “exposure to debris and unstable situations” and “possible falling from height” are “Hazardous” attributes associated with the excavation activity. Excavation typically involves loading trucks with debris, which can fall while loading and pose a danger to workers engaged in other close-by activities and passersby. At the same time, construction activity may be susceptible to external factors caused by other activities that increase the safety risks of the activity. These characteristics are referred to in this research as “Susceptibility” attributes. For example, “lack of site space” and “distraction” are “Susceptibility” attributes associated with the construction surveying activity. When there is limited space to work and various distractions are present, the safety of surveyors and other workers can be compromised because of the increased risk of collisions, limited visibility, tripping hazards, workplace stress, and communication challenges. The Source–Target Match concept encompasses a comprehensive table meticulously developed through an exhaustive analysis of OSHA and National Institute for Occupational Safety and Health (NIOSH) reports. This table includes both hazardous and susceptible attributes, providing a thorough overview of potential safety risks in overlapping scenarios. Each attribute is accompanied by an associated severity and probability value, facilitating a more precise assessment of the risk factor associated with overlapping conflicts. Further elaboration on this process will be provided in Section 3.2.

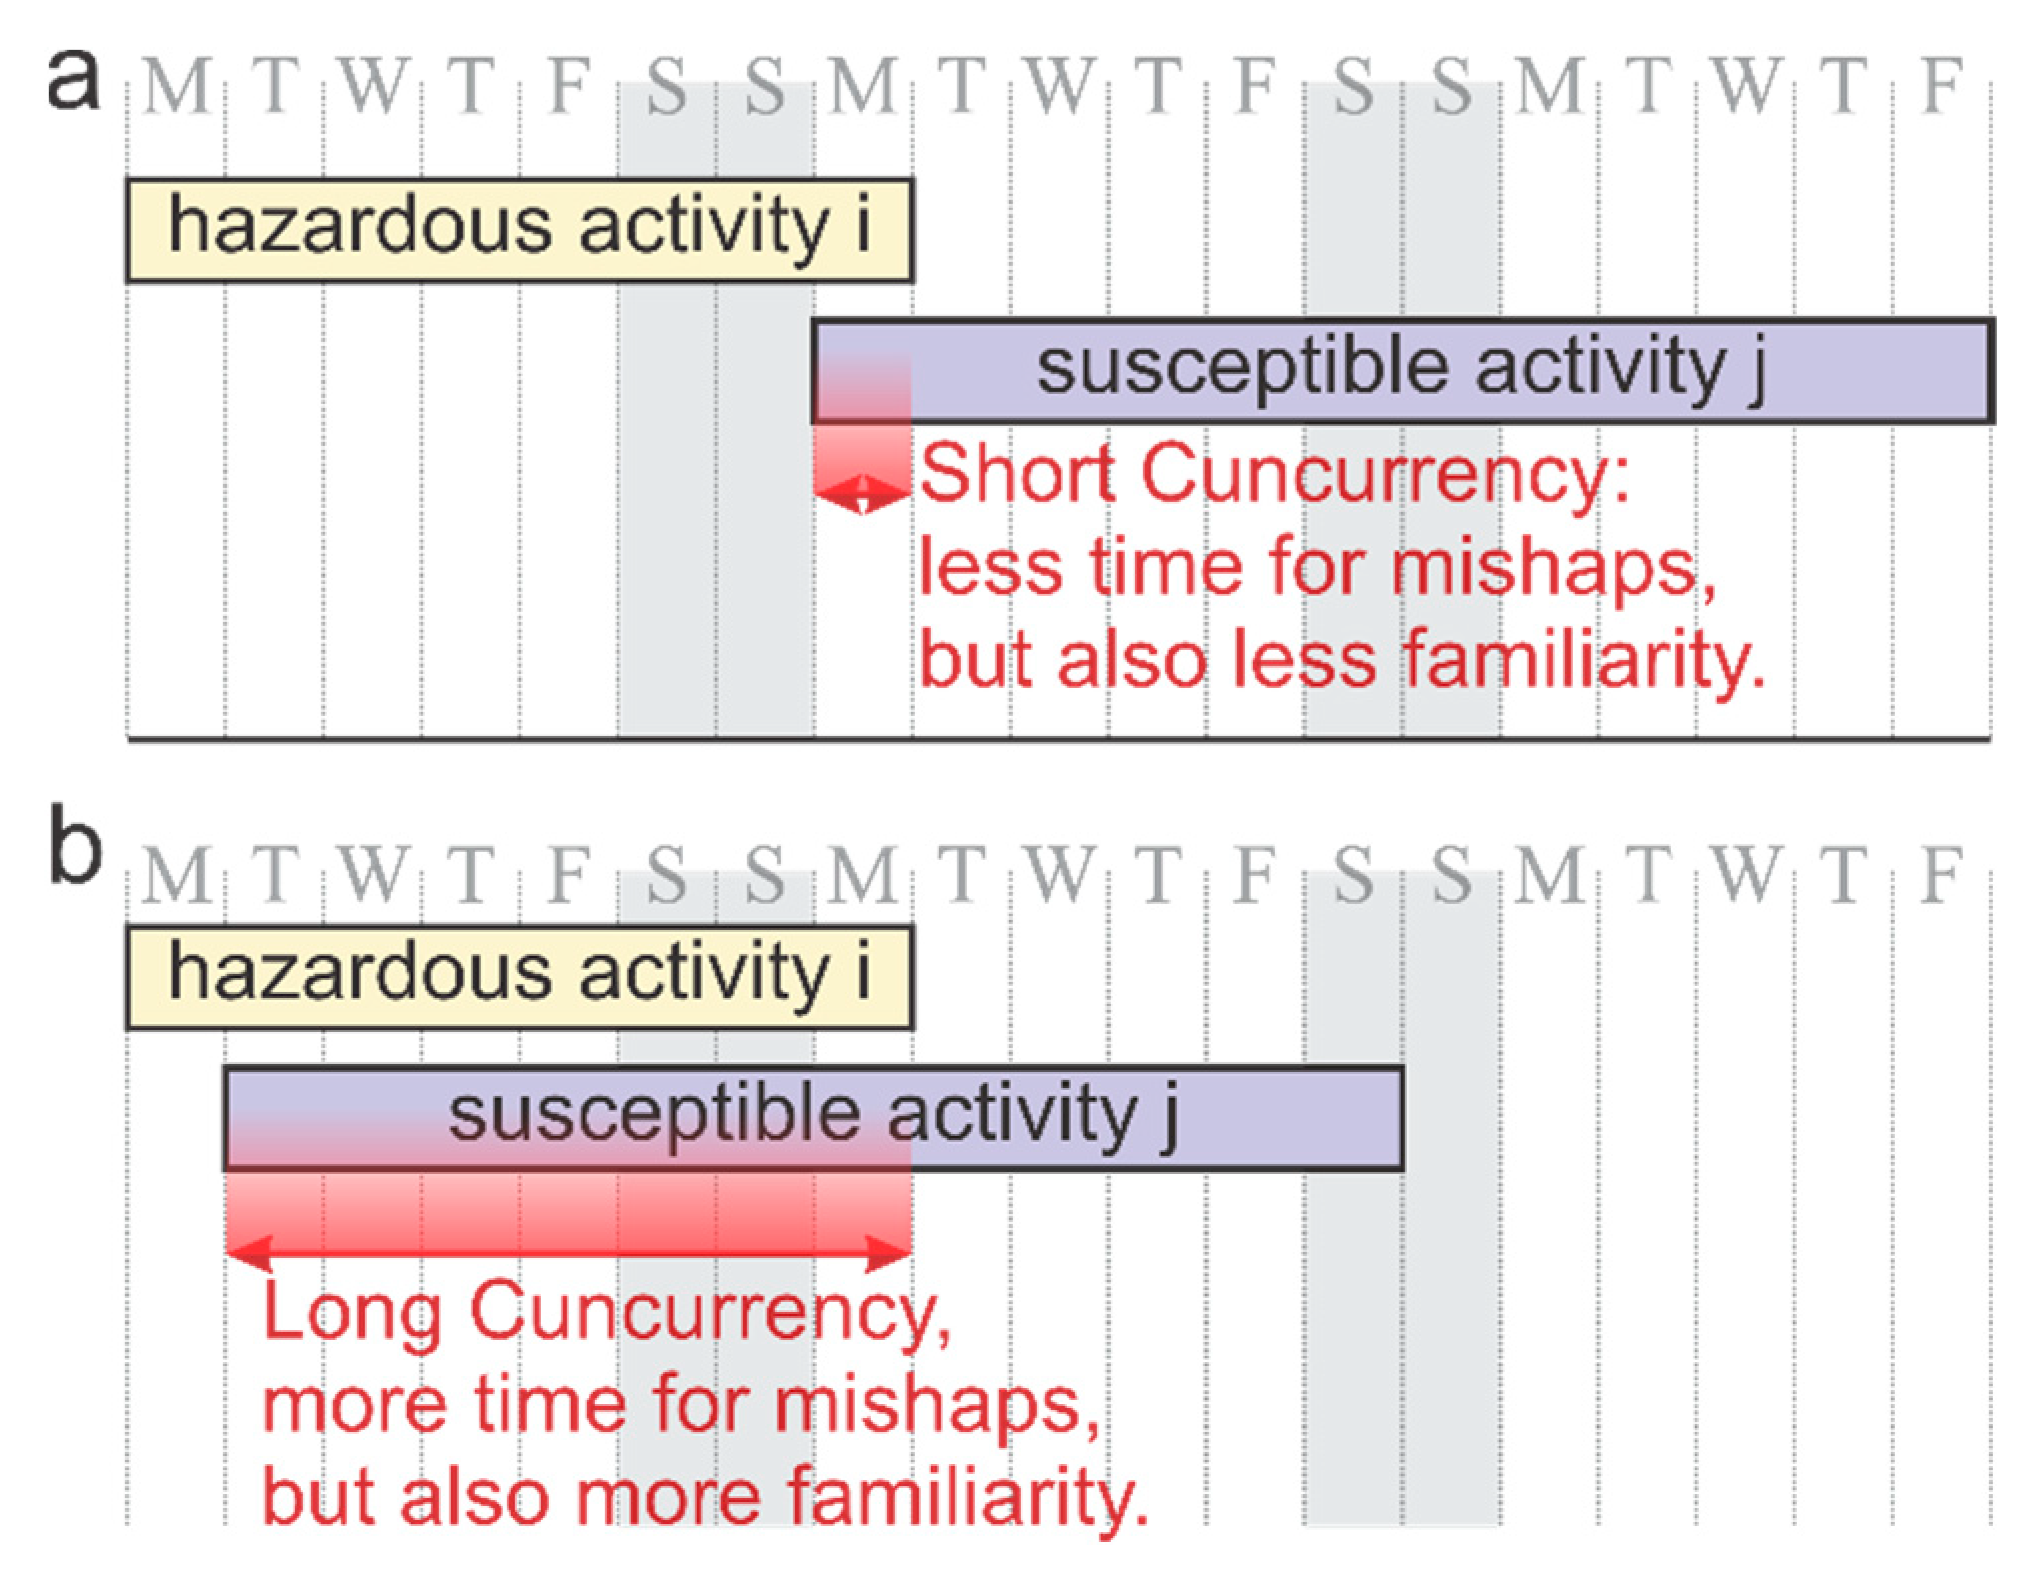
3.1.2. Concurrency of Two Activities

The pivotal chain contributing to increased safety risks among construction activities is the concurrency, which occurs when two or more activities on a construction site take place simultaneously within a shared timeframe. To quantitatively assess concurrency, project management tools, such as Microsoft Project, are often employed to meticulously schedule and organize project activities. This scheduling approach facilitates the determination of the precise start and end dates of each activity, allowing project managers and safety professionals to identify instances of overlap. In the context of our study, we examine two activities, denoted as activities i and j, and classify them as concurrent if they share at least one working day in common. This definition of concurrency provides a foundation for evaluating the potential risks associated with activities that overlap in time.
The duration of overlapping activities plays a crucial role in assessing safety risks. As illustrated in Figure 2, there exists a fundamental correlation between the duration of overlap and the nature of the risks involved. A short period of concurrency between a hazardous activity (i) and a susceptible activity (j) offers limited time for potential mishaps to occur. However, it also implies less time for the workers in the two activities to become familiar with each other’s presence and get prepared for potential hazards. Conversely, a longer concurrency duration allows more time for mishaps to potentially take place but also increases the familiarity between the activities, potentially leading to a reduction in safety risks. It is essential to clarify that our current research does not delve into the intricate dynamics of how risk probabilities shift with varying durations of overlap. This question remains open: Does a longer concurrency period significantly elevate the probability of accidents, or does the increased familiarity between tasks effectively mitigate the dangers posed by overlapping activities? These intriguing aspects of safety risk assessment warrant further investigation.

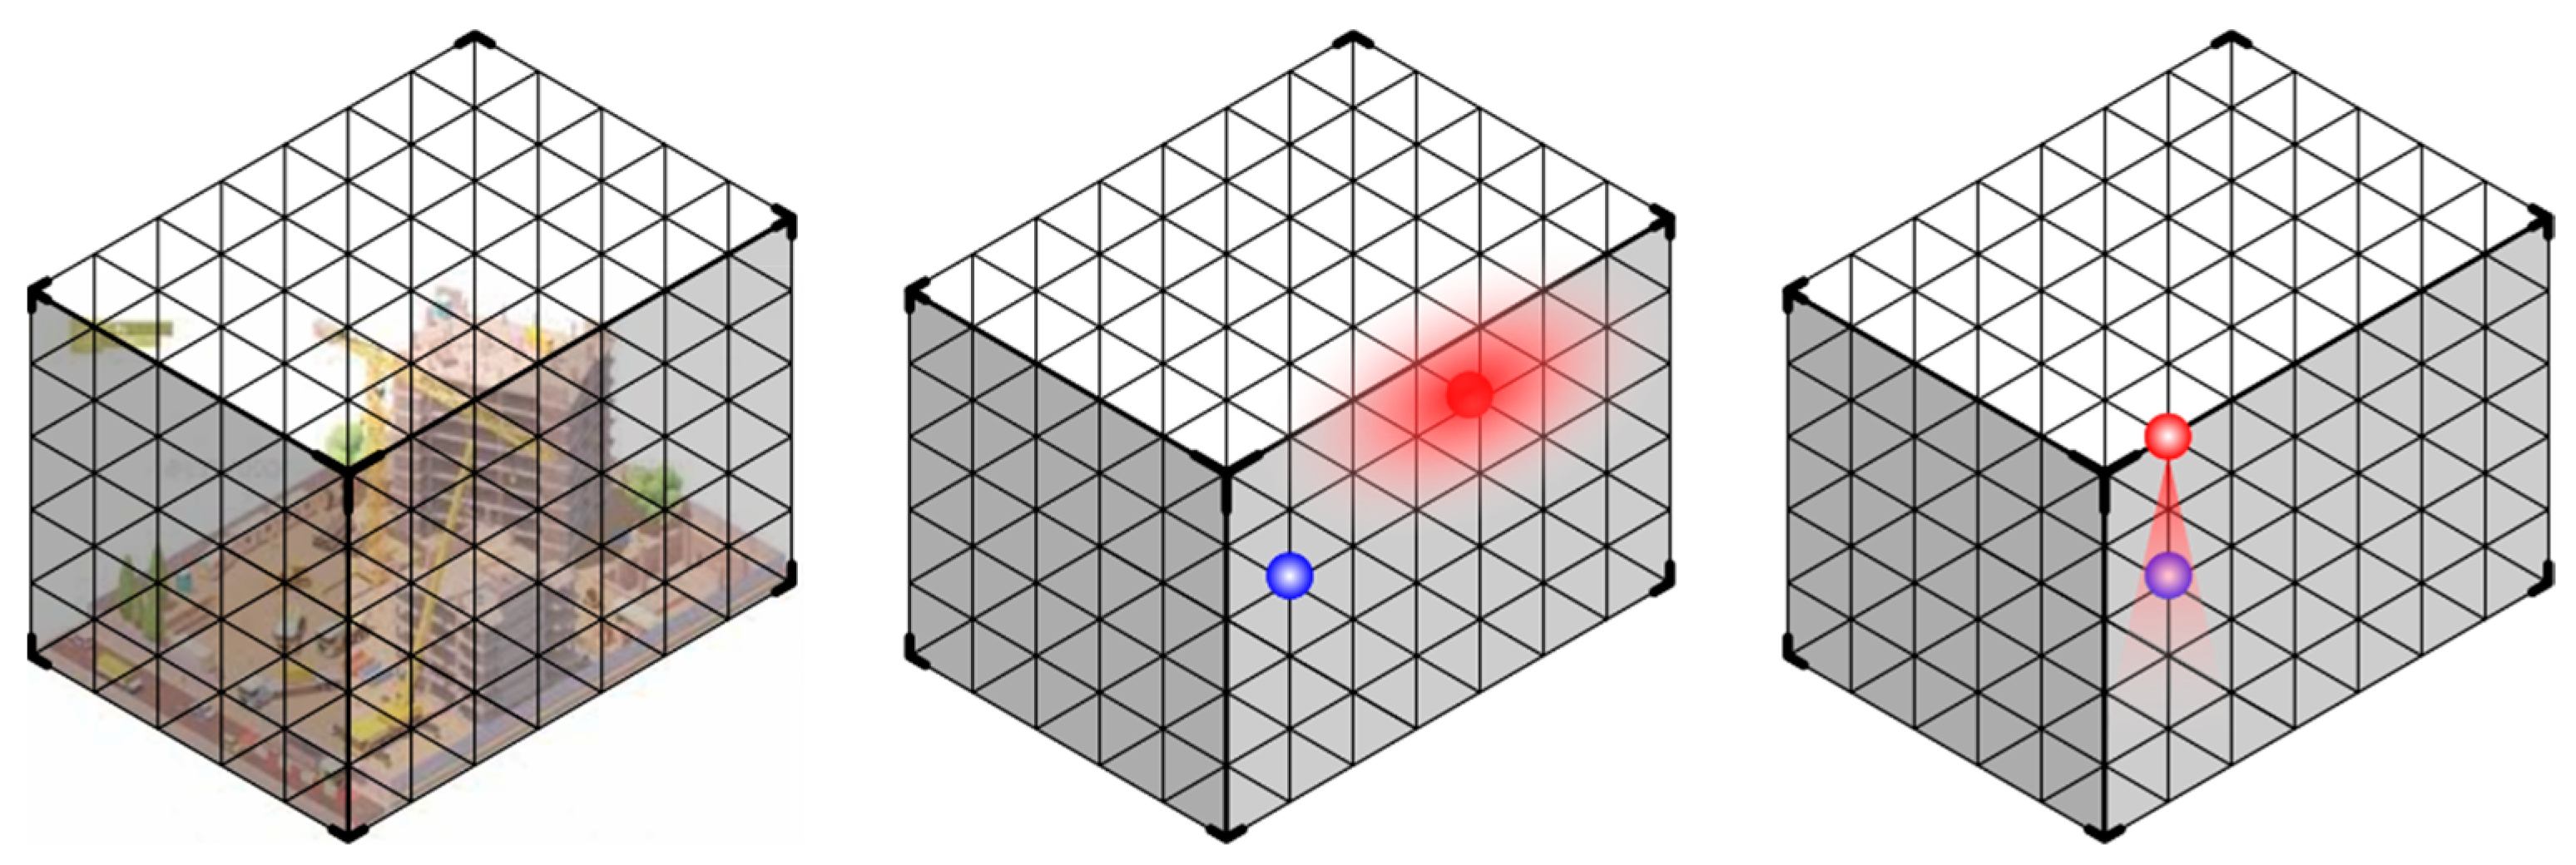
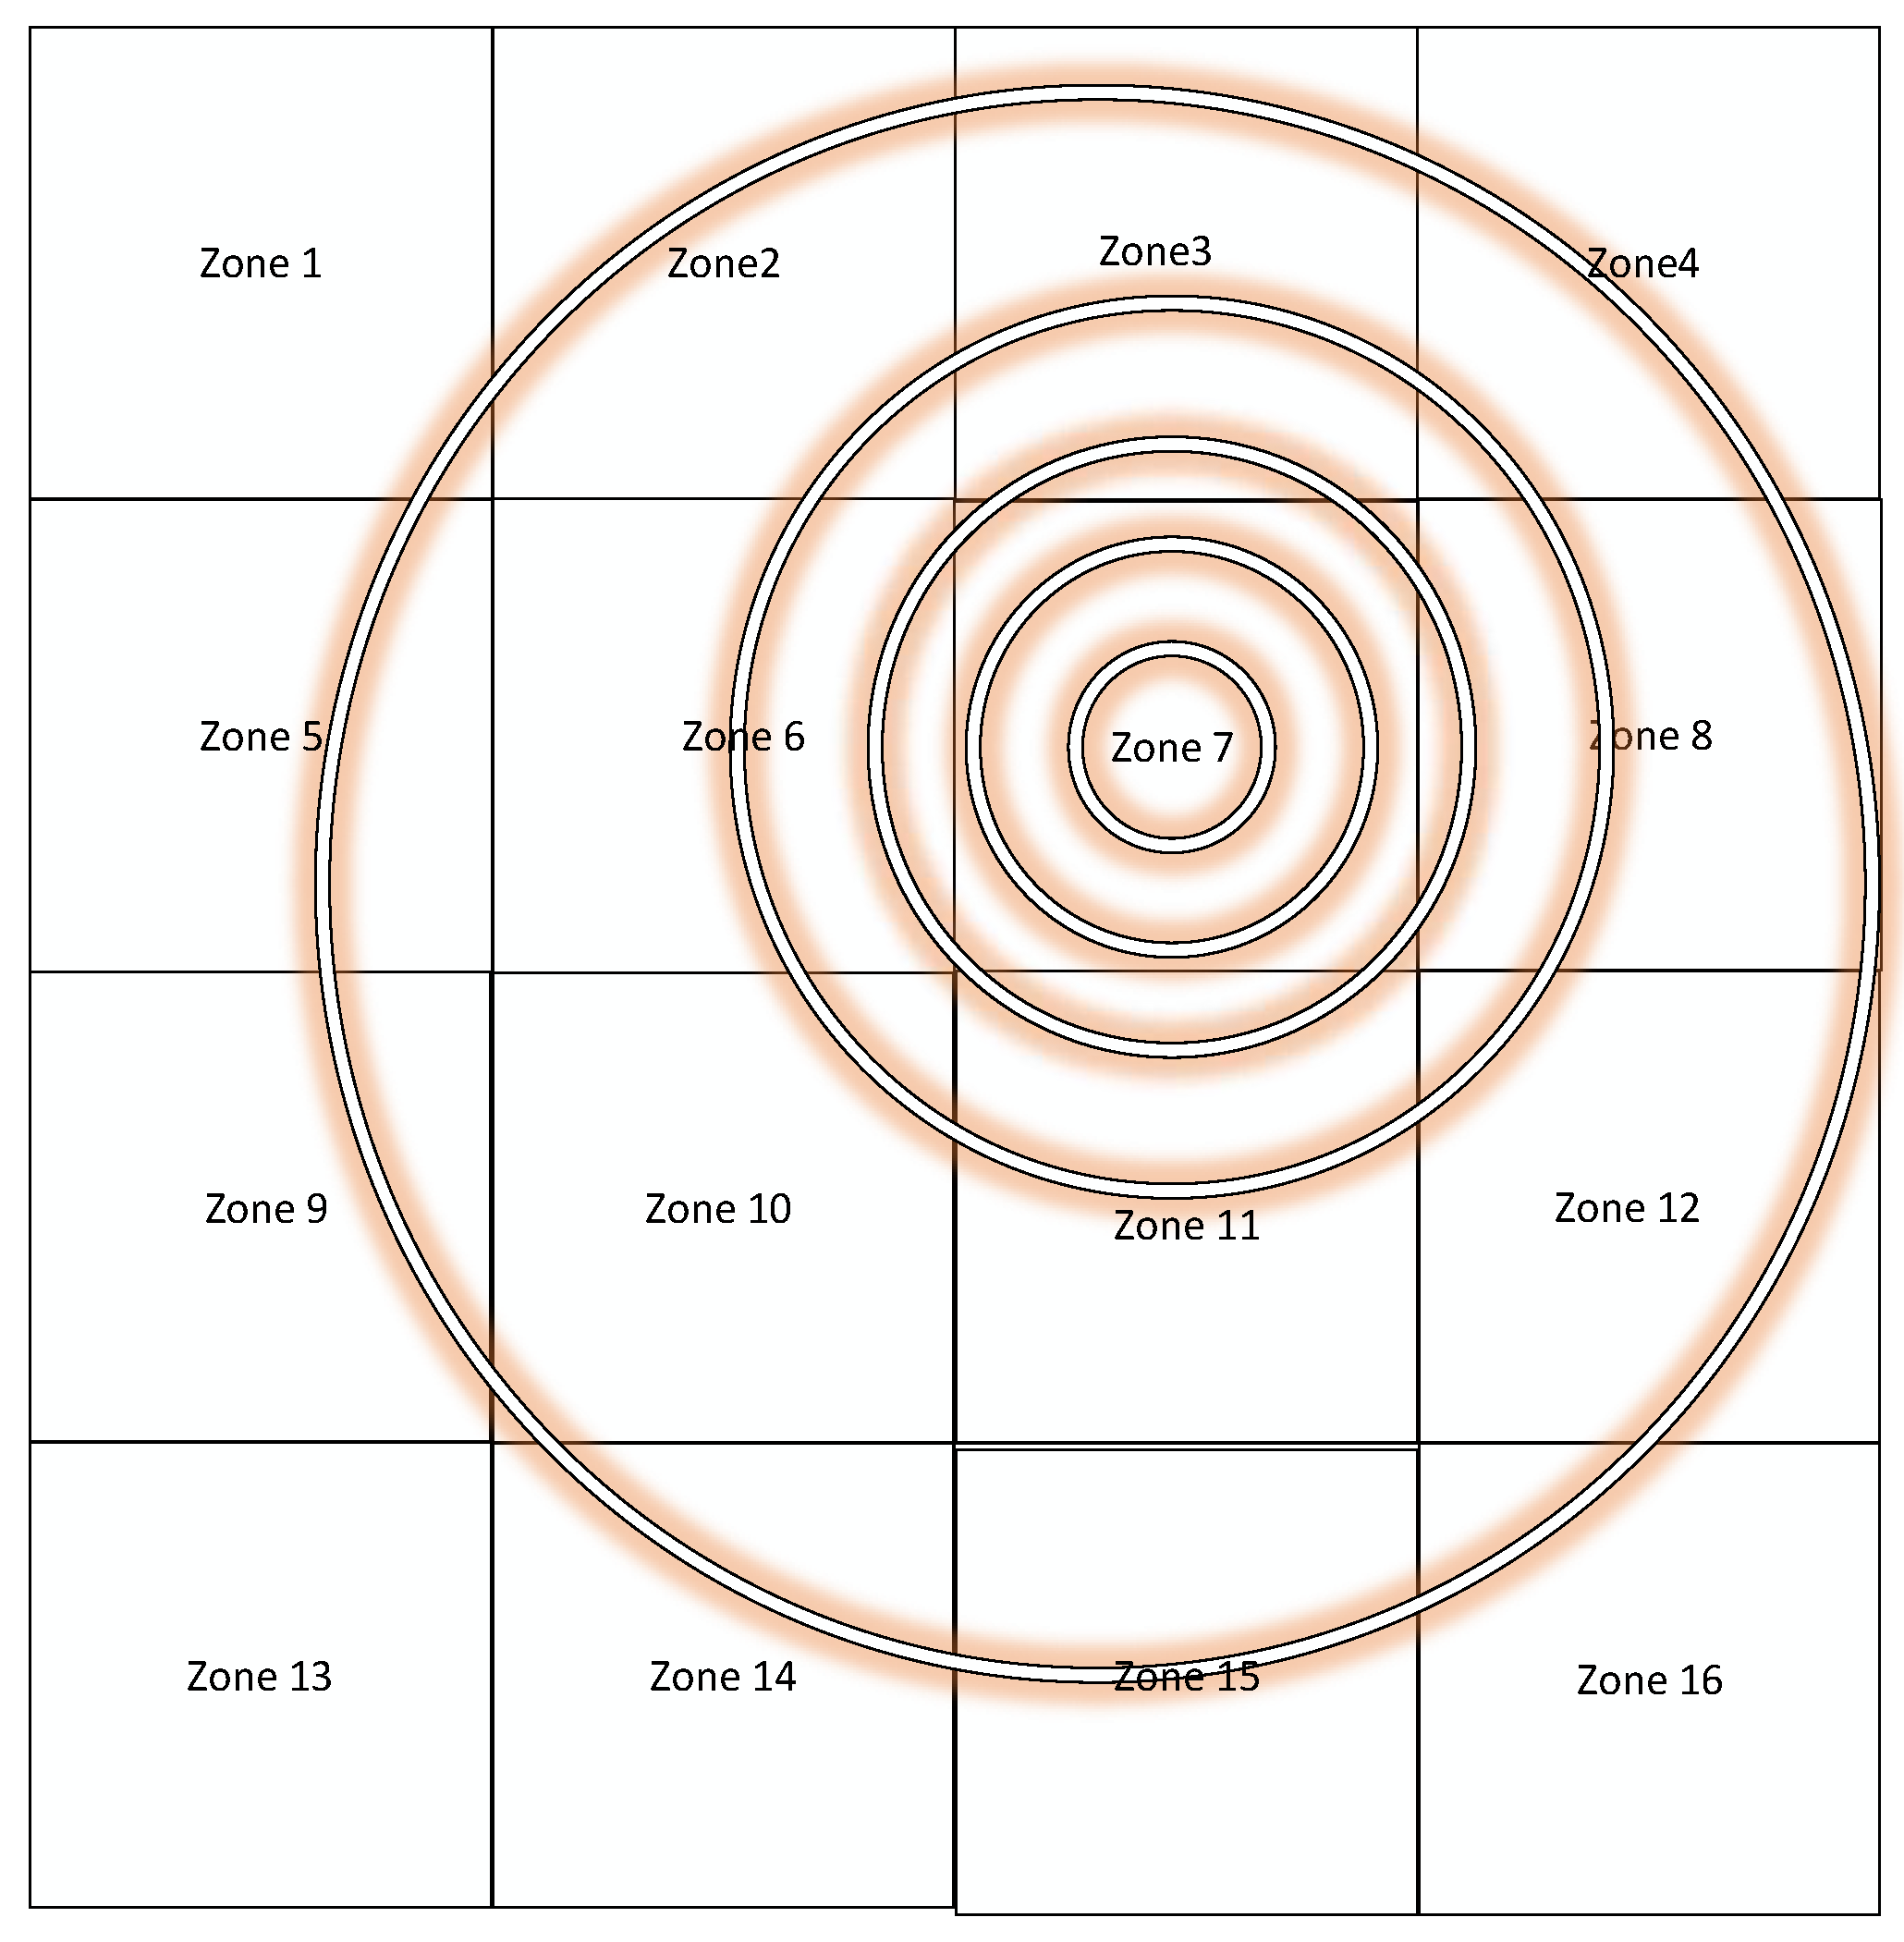
3.1.3. Spatial Conflict

Spatial conflict is another condition that must be present for an overlap conflict to occur, and it includes both elevational and horizontal conflict. The elevational category involves activities such as machinery or equipment operations at varying heights, which can cause distractions or obstructions to other tasks. For instance, elevated operations, such as crane movements, may interfere with ground-level tasks, creating a vertical conflict. This interference can disrupt the workflow and pose safety hazards, particularly when elevated equipment crosses paths with activities on the ground. Elevational conflict does not simply mean being at the same height; two activities with different heights may also influence each other. As it is shown in Figure 3, on a concrete framed building, when the “rebar welding” activity, represented by a red circle, is taking place in level 2, it may cause a distraction for the “rebar installation” activity taking place in level 1 and represented by a blue circle. Thus, it is necessary to consider the elevation of activities and also the height effect of hazardous attributes.
As seen in Equation (2), to identify an elevational conflict, the elevation ranges of the susceptible activity (j) and the hazard produced by the hazardous activity (i) must coincide; that is, the result of Equation (2) must be positive. Otherwise, there will be no interference and thus no conflict. The parameters used in Equation (2) are:
Zmin (j) = minimum height of susceptible activity, Zmax (i) = maximum height of hazardous activity, Zmax (H) = maximum height effect of hazardous attribute, Zmin (H) = minimum height effect of hazardous attribute.
M i n   ( Z m a x   ( j ) ,   Z m a x   ( i ) + Z m a x ( H ) M a x   ( Z m i n   ( j ) ,   Z m i n   ( i ) Z m i n ( H ) > 0
The second condition of special conflict is horizontal conflict. Horizontal conflicts pertain to activities with extensive spatial demands that conflict with tasks in adjacent zones or overlap workspace, leading to equipment or personnel obstructing neighboring zones. For example, large machinery operations may conflict with tasks in nearby areas, impeding the smooth progress of work and potentially causing safety risks. These horizontal conflicts result from the spatial overlap of activities and the limited physical space available on construction sites. A construction site can be divided into zones to assess the hazard spread from an activity, say activity (i), to which activity (j) is exposed if placed in the same zone as activity (i) or the hazard is able to spread over other zones. The activity shown in zone 7 of Figure 4 spreads its hazard over other zones except zone 13. In fact, not only two activities in the same zone could have horizontal conflict, but hazardous activity that can spread over other zones can be considered as horizontal conflict. Therefore, to assess the horizontal conflict, we need to divide the construction site into different zones.

3.2. Data Gathering

A database of hazardous and susceptible attributes was extracted from three primary sources: (1) the vivid narrations provided by the National Institute of Occupational Safety and Health (NIOSH) [29], named Fatal Accident Circumstances and Health Epidemiology (FACE), which contains over 200 reports; (2) 70 reports with a similar approach to that of NIOSH FACE which was provided by the Occupational Safety and Health Administration (OSHA) [30], called Fatal Facts; and (3) many scientific papers with accident causation analysis were also reviewed [31,32,33,34,35,36,37,38,39,40,41,42]. The adequacy of the number of accidents was verified when evidence of data saturation appeared as recommended by Malekitabar et al. [18] and Eisenhardt [43]. An example can clarify how the hazardous and susceptible attributes were extracted from the reports. The NIOSH FACE report number 2005-11 states that on 13 August 2005, in the US state of North Carolina, a worker was hit by a bulldozer traveling in reverse [29], despite all the alarms and warnings sent to the worker and vehicle, the worker is died from multiple blunt force injuries. By reviewing this report, we can extract “machinery with moving parts” as a hazardous attribute and “exposure to heavy materials and equipment” as a susceptible attribute. Another accident took place on 19 April 2012, from NIOSH FACE (2012-02), where a Spanish worker fell from 13.5 feet off the roof onto asphalt; it was reported that the worker had been distracted. From this report, we can extract “distraction” as a hazardous attribute and “exposure to falling from the height” as a susceptible attribute for roofers.
Not all overlapping conflict attributes impose the same, certain level of risk on each other [20]. When excavators are operating, surveyors are exposed to a higher risk level than truck drivers. The truckers, in contrast, are more susceptible to electric shocks as their vehicle might cut a temporary overhead line the electricians have installed. Therefore, the probability and severity of each conflict need to be assessed separately. Considering two activities nominated for a conflict assessment, a source–target match table evaluates the concordance probability of every hazardous attribute in one activity with every susceptible property in the other. In the absence of quantitative measurements, the probability that a hazardous attribute matched a susceptible one was determined using an expert group panel. In this study, ten panelists participated, as Adler and Ziglio suggested that a reasonable result can be achieved with 10–15 experts [44]. This panel included an academician well-versed in construction safety, an expert in Building Information Modeling (BIM), and industry professionals with substantial experience in overseeing safety protocols on construction sites. In addition to these, we also integrated perspectives from site managers, safety inspectors, and construction planners. Each participant brought unique expertise and perspectives, ensuring a well-rounded understanding and robustness of our research findings. All participants possessed four characteristics based on the research of Tersine and Riggs [45]: 1—having a high-performance record, 2—having adequate time, 3—putting in enough effort, and 4—having high rationality. Severity was scored from 0 to 10, where 0 represents the lowest severity and 10 represents the highest severity, and scoring probability from 0 to 5, where 0 represents the lowest probability and 5 represents the highest probability.

3.3. Implementation

As stated by Perlman et al. (2014) [19] and Chantawit et al. (2005) [23], safety risk identification is difficult without new technologies when data are complicated. BIM is thus used to automate the decision process introduced in this research and to visualize the conflicts in the four stages summarized in Figure 5.
In the input model stage, a building will be modeled using Autodesk Revit® software (2021 Version) with all construction components including architectural, structural, and Mechanical, Electrical, and Plumbing (MEP) information as well as their element IDs to visualize the conflicts. The model is then imported into Navisworks Manage software (2021 Version) to capture all the activities related to the project; duration, start date, and finish date will be captured as well to evaluate concurrency of activities in the next stages. The other things that need to be captured in this stage to measure the spatial conflict are the height of each activity, which is called Zmin/Zmax (i) and Zmin/Zmax (j) based on Equation (2), and the zone of each activity, which will be defined by min and max of x, y, z using the Application Programming Interface (API) according to their coordinates. Then an operator with general construction knowledge links the 3D components to the activity types. In this way, a 4D model is developed, providing a graphical overview of the involved processes and activity dependencies.
The Pre-Process stage reviews the overlapping conflict essentials that appeared in the first FTA level shown in Figure 1. Firstly, susceptibility and hazardousness attributes, together with their probability and their severity are needed. After extracting them using three sources which are explained in Section 3.1.1, severity and the probability of susceptibility and hazardousness attributes for each activity will be assigned. A hazardous activity imposes one or many hazards, each with severity as an integer, an indicator of whether it spreads over other zones as a Boolean, and relative elevational range above or beneath the host activity as two numbers referred to as Zmax (H) and Zmin (H) based on Equation (2). In fact, all characteristics of overlapping conflicts including spatial conflict, concurrency, and source–target match are assigned at this stage for analysis in the next step.
The main process stage assigns a Risk Factor (RF) to each conflict and couples them with the element ID, activity ID, and zone ID to facilitate the visualization. This process goes through all the activities and calls the routines stated before to check for any overlapping conflicts between the concurrent activities. All calculations are implemented by the API; Figure 5 shows the main module workflow. The evaluation of risk factors depends on the probability and severity of the conflicts, the likelihood of a hazard’s potential that results in damage defined as probability, and the extent of the damage which could be related to accidents defined as severity [8,46,47]. Equation (3) measures spatial overlap, concurrency, and source–target match where i = hazardous activity, j = susceptible activity, F (i, j) = overlapping conflict of activity i and j, Xi = severity of hazardous activity, Yj = severity of susceptible activity, Pij = probability of hazardous and susceptible match-based source–target match table, Tij = concurrency of the activities, Eij = elevational exposure, Hij= horizontal exposure. It is worth mentioning that spatial overlap and concurrency are Boolean, and the risk factor rate is measured by using the severity and probability of the source–target match table. Equation (4) calculates and sums the RFs of every ID set where x* = the conflict’s score between each two activities. Using the summation risk level of each activity, the model is able to prioritize overlapping conflict using Table 1, where an activity with a scale of 1 and risk level of 0–0.2 is considered “Insignificant” conflict, which means it has minimal impact on the project; however, an activity with the scale of 5 and risk level of 0.8–1.00 is considered a “Catastrophic” conflict which brings a large number of fatalities.
Finally, in the output stage using the total RF, date, element IDs, and a light color code, based on Table 1, of each conflict, to ensure clarity and specificity in visualizing safety risks within the BIM model, a comprehensive visualization protocol is employed. Once the risk factors are meticulously calculated for every activity, the model’s elements are color-coded, providing an immediate visual cue to the associated risks. This not only makes it straightforward for stakeholders to immediately discern the severity of potential conflicts but also facilitates swift decision-making. Using a gradient color scheme, risks are depicted on a spectrum, ranging from minimal (green) to significant or catastrophic (red). The color intensity increases with the potential severity of the hazard. Hovering over or selecting a particular element can display a detailed risk analysis tooltip, providing more in-depth information about the associated risks. This dynamic approach ensures that all project stakeholders, from site managers to workers, can intuitively understand and act upon the risk data encapsulated within the model, ensuring enhanced safety protocols and efficient risk management throughout the project lifecycle.
Risk Factor = Probability × Severity
F   ( i .   j ) = Source Target Match   ×   Concurrency   ×   Spatial   overlap   =   i   jXi   Yj ×   Pij   × Tij   × Eij × Hij
i = hazardous activity
j = susceptible activity
F (i, j) = overlapping conflict of activity i and j
Xi = severity of hazardous activity
Yj = severity of the susceptible activity
Pij = probability of hazardous and susceptible match-based source–target match table
Tij = concurrency of the activities
Eij = elevational exposure
Hij = horizontal exposure
Risk   Level   of   each   activity   = 0 n x *   Risk   Level   of   Each   Activity  

3.4. Validation of the Model

Given the uncertain and potentially hazardous nature of accidents in the construction industry, conducting direct tests to determine whether the identified high-priority conflicts would lead to actual accidents is both impractical and ethically questionable. As such, our validation approach primarily relied on expert judgment. We consulted with two industry experts, each possessing substantial experience and expertise in construction safety and project management. These experts were presented with our model and the identified high-priority conflicts. Their task was to evaluate the model and confirm whether the conflicts we identified align with the most dangerous events commonly observed in the construction industry. The experts’ unanimous agreement that our identified conflicts correspond to the industry’s most perilous occurrences serves as a form of face validity [48] and initial validation for our model.

4. Results

4.1. Hazardous and Susceptible Attributes

After reviewing accident reports from OSHA, NIOSH, and reviewed papers, it was found that evidence of data saturation in repeating accidents occurred after the first hundred reports. However, the remaining reports and papers were reviewed to ensure a comprehensive analysis. The main themes found in the reviewed accident literature and reports can be summarized in terms of an activity’s “Hazardous attributes,” and an activity’s “Susceptible attributes” refer to the characteristics of the activity that pose a risk or danger to safety, health, the environment, or other aspects of well-being to workers performing an overlapping activity. We identified 11 “Hazardous attributes” in this research as shown in Table 2, and nine “Susceptible attributes” shown in Table 3, where the first column shows the attribute which is extracted, and the second column shows the description of the attribute. Then, the probability of their match was assessed in Table 4 by the expert group panel as explained in Section 3.2. They ranked the probability from 0 to 5 where 0 represents the lowest probability and 5 represents the highest probability. For example, “site slipperiness” as a hazardous attribute has the highest probability with “exposure to falling from height” as a susceptible attribute, while it has the lowest probability with “exposure to electric shock” as shown in Table 4. Using hazardous and susceptible attributes and their probability match table, we are able to identify the type of conflict an activity has with another one and also calculate the risk factor of each activity containing overlapping conflict.

4.2. Case Study

The proposed model analyzes a seven-story residential concrete building as shown in Figure 6, the construction schedule of which comes from Navisworks, and the AEC and MEP from Revit. The LOD 300 in this framework is sufficient since it allows us to link the work breakdown structure to it. Each roof is divided into four zones, A, B, C, and D, and for simplicity, general activities such as surveying, material handling, demolishing, excavation, paving, formwork installation, reinforcement installation, column concrete pouring, rebar welding, roof installation, MEP installations, and interior finishes have been considered as follows:
  • Surveying involves measuring and mapping the land to determine boundaries and elevations, which is crucial for planning and designing.
  • Material handling indicates the transporting of the materials, equipment, and waste to and from the construction site.
  • Demolishing refers to the process of removal of existing structures and preparing the site for new construction.
  • Excavation refers to removing soil and rocks to create a foundation for the building.
  • Paving is the process of laying a smooth surface to create driveway and sidewalks
  • Formwork installation is a temporary structure used to shape fresh concrete until it gains its strength.
  • Reinforcement installation refers to steel bars placed within formwork as part of the roof installation
  • Rebar Welding is the process of joining metal bars within roofs by melting them together using heat.
  • Column concrete pouring refers to pouring concrete into the formwork for vertical structure columns.
  • Roof installation is the process of installing an upper covering of the building using various materials; in this project, a mixture of concrete and metal bars was used
  • MEP installation refers to setting up the heating, air conditioning, electrical systems, and plumbing within the building
  • Interior finishes refer to painting, ceiling finishing, drywalling, and installing fixtures
After running the process using the proposed model, 75 overlapping conflicts among activities were found, as shown in Table 5. Six catastrophic conflicts were marked as priority 5 and 22 insignificant overlapping conflicts were marked as priority 1. Examples of different conflicts are shown in Table 6, indicating that activities such as roof installation, column concrete pouring, and rebar welding, which typically happen at height, are riskier than activities like material handling and paving. This may be due to the high number of accidents that occur due to the falling from height. It is worth mentioning that while the proposed model can be implemented in all kinds of projects, the type of conflict varies based on the type, scheduling, and size of the project. Therefore, overlapping conflicts identified in this case study cannot be considered a rule of thumb for other projects.
To understand how the RF for each conflict has been calculated, Table 7 represents overlapping conflicts between “column concrete pouring (i)” as a hazardous activity that matches the “roof installation (j)” susceptibilities. A construction activity involving pouring concrete in columns can increase safety hazards for another construction activity involving roof installation in elevated slabs, especially if both activities are happening concurrently or in close proximity. The increased safety hazards can result from falling objects, concrete overflow or spillage, dust, and debris, noise distraction, vibrations, limited workspace, material handling, etc. Using Equation (3) by knowing the parameters of each activity such as scheduling for evaluating the concurrency (Tij), zone, and height to evaluate the elevational and horizontal exposure (Eij, Hij), as well as the probability of each attribute (Pij) from Table 4 and their severity (Xi, Yj), the risk factor for each overlapping conflict can be calculated. The severity of each hazardous and susceptible attribute is in the range of 0 to 10 and their probability of matching is in the range of 0 to 5; therefore, the minimum RF score for each conflict can be zero and the maximum can be 500 (10 × 10 × 5 = 500). Since all conflicts correspond to 11 hazardous and 9 susceptible attributes, there are 99 types of conflicts that can occur between each pair of activities with the maximum summation RF of 49,500 (500 × 99 = 49,500). It is shown that there are 36 different types of conflicts that can occur between column concrete pouring and roof installation activity. The most probable conflict with an RF of 450 out of 500, labeled “1-G” and represented by a yellow box in Table 7, refers to “machinery with moving parts” being hazardous to workers susceptible to “exposure to the displacement of heavy things”. After checking concurrency and spatial conflict among these two attributes, a severity of 10 for machinery with moving parts, and a severity of 9 for exposure to the displacement of heavy things, with a probability match of 5, results in an RF of 450. The reason for the high number of hazardous conflicts involving machinery with moving parts could be due to crane buckets used for transferring concrete to columns which can cause many accidents. Other overlapping conflicts include “4-F”, that is, “lack of site space”, which is hazardous to workers susceptible to “exposure to light and sparks”. The sum of all overlapping conflicts in Table 7 using Equation (4), is the RF of column concrete pouring and roof installation activities which is 8030 out of 49,500.
The nature of the conflicts and how the model captures and evaluates them are better understood through the example in Table 8. A matrix of hazardous (i) and susceptible (j) activities is analyzed to assess the RF of two selected activities for each overlapping conflict. The first column represents hazardous activity (i) with 20 activities which have been divided into four different zones (A, B, C, and D). The first row represents susceptible activities (j), similar to hazardous activity, with 20 activities divided into four zones. Note that the activities listed in Table 8 pertain exclusively to the sixth floor and do not encompass all activities within the entire project. All activities are checked against each other to find the overlapping conflict among them. For this purpose, spatial conflict, concurrency, and source–target match of each pair of activities that have been selected are analyzed to calculate their RF. The sixth floor, for example, reflects 16 overlapping conflicts. Column concrete pouring and roof installation activities are represented by a yellow box shown in Table 8, marked as a priority 5, which indicates “catastrophic” severity. It means safety managers should pay attention to these two activities more than lower priorities; however, activities such as formwork and reinforcement installation in zones A and C have an RF of 4620 marked as “moderate” overlapping conflict with column concrete pouring in zone A and C, so they are in the third place of importance compared to “catastrophic” conflicts; interior finishing activities have least overlapping conflict, and only interior finishing activity in zone C have “moderate” risk with framing and drywall activity at zone C. Because the maximum RF score of conflicts in this case study is 8737 out of 49,500, using Table 1, the first 20% of conflicts are marked as priority 1 and the last 20% RF scores are marked as priority 5. For example, an RF of 8030 out of 8737 falls to the upper 20% of RF levels, so it is given a priority 5, or an RF of 688 out of 49,500 falls to the range of 0–20% risk levels and is given priority 1. It should be noted that missing one of the essential conditions of overlapping conflicts will result in an RF of zero.
The output model shown in Figure 7 visualizes the conflict between column concrete pouring and interior finishing (drywalling) in zone C. The slider below the model area assists the safety manager in performing a day-by-day review of every project step to decide about possible safety conflicts between the activities. It mainly gives the safety reviewer information like hazardous and susceptible activities, date of conflict, zone, and risk level. All possible conflicts have a background assessment accessible as in Table 7, the summary of which shows more details to the safety reviewer than the report.
While this study was limited to identifying conflicts, some safety measures could be implemented to reduce hazards. These measures include:
  • Scheduling: If possible, schedule these activities at different times or in separate areas of the construction site. Ensure that the installation of reinforcement in elevated slabs is completed or temporarily halted before concrete pouring begins to avoid potential clashes.
  • Safety training: Ensure that all workers involved in these activities receive appropriate safety training and are aware of potential hazards resulting from overlapping activities.
  • Zoning: Establish safety zones to prevent workers from entering areas where concrete is being poured.
  • Environmental controls: Implement measures to control dust and debris generated during concrete pouring, such as water spraying or dust collection systems.
  • Personal protective equipment (PPE): Require all workers to wear appropriate PPE, including helmets, safety glasses, and high-visibility vests, to enhance their safety and visibility on the construction site.
  • Temporary Access: Provide safe and clear temporary access routes for workers on the elevated slab to reach their work areas, even during concrete pouring activities.
  • Communication: Implement effective communication protocols and systems, such as radios or hand signals, to maintain clear communication between workers in both activities. Emphasize the importance of communication and situational awareness.
  • Supervision: Assign competent supervisors to oversee both activities and ensure that safety protocols are followed. Conduct regular safety inspections and audits to identify and address potential hazards.
  • Barriers and safety nets: Install physical barriers or safety nets beneath the columns being poured to catch falling objects or concrete spillage. This helps protect workers on the elevated slab

5. Discussion

While the construction industry has long been aware of the inherent risks associated with individual activities, overlapping construction activities introduce another layer of complexity to safety assessment. Many authors have diagnosed the accident-prone construction industry with a wide variety of working groups from different trades who may be unaware of hazards from neighboring activities [3,5,8]. Authors believe that unfamiliarity of workers with the hazards around them predispose them to higher numbers of accidents. Accident causation models and safety standards substantially evaluate the safe methods for every construction activity, and research is needed to identify how workers are exposed to hazards from activities other than what they have been trained in.
This research developed a model to identify “overlapping conflicts” between activities. We believe overlapping conflicts are expected when simultaneous activities with a physical influence path suffer from a third parameter called the source–target match. A review of 300+ accident synopses led us to a summary of 11 hazardousness and 9 susceptibility attributes a construction activity might have. For example, “distraction” as a hazardous attribute can create extra noise, light, vibration, smell, or any other attribute that distracts or unnecessarily attracts other people, or “exposure from falling from a height” as a susceptible attribute can alert proximate workers to the areas that increase the probability of falling such as working on scaffolding. We used the probability of each hazard matching a susceptibility to assess the probability of every cell of the source–target match table. Using the activities’ characteristics such as start and end dates, height, location (zone), and their hazardous and susceptible attributes, conflicts are then given priority based on their total RF. Finally, an automated BIM tool visualizes the model so that a safety expert or manager can decide the most worrying conflicts. It is worth mentioning that the integration of cutting-edge technologies such as BIM, machine learning, and AI has significantly streamed the decision-making process, allowing for more accurate accident prediction in the construction industry, infrastructure management, roads, and bridges [54,55].
The model was implemented on a sample building model, and the results revealed 75 conflicts that were neglected before. These overlooked conflicts can be considered blind spots in traditional evaluations, underscoring the need for a more comprehensive approach like the proposed research. Pouring concrete in columns and roof installation in elevated slabs are two critical construction activities that often occur sequentially or concurrently in building construction. The safety hazards associated with one activity can indeed increase the risks for the other. Activities such as roof installation and column concrete pouring, rebar welding and reinforcement installation, excavating, and material handling are always considered the most dangerous activities that can take place at the same time, and many injuries happen when these activities occur together. Focusing on the hazards pertaining to each activity without considering hazards stemming from neighboring activities can expose workers to unforeseen hazards. For example, column concrete pouring and roof installation activities are two separate activities that can take place at the same time and in the same location. Each activity has its own hazards that need to be prevented, but considering safety risks stemming from both activities showed that machinery with moving parts as a hazardous attribute from column concrete pouring activity can make workers susceptible to exposure to the displacement of heavy things from roof installation activity. This risk could be overlooked without considering overlapping conflicts. Efficiency of visual tools, like BIM, can make the decision much easier for safety managers. Prioritizing and visualizing the overlapping conflicts aid in intuitive understanding of safety risks. As the construction industry progresses, the projects become increasingly intricate and complex [26]. Addressing the challenges of today and anticipating those of tomorrow requires innovative approaches to safety. Our research not only proposes a pioneering method for assessing overlapping conflicts, but also paves the way for a more integrated and technologically advanced future in construction safety, ensuring both improved efficiency and enhanced safety of workers.
After implementing the proposed model, it becomes evident that while numerous studies have delved into identifying and categorizing individual construction risks, few have holistically approached the issue of overlapping conflicts. Kartam (1997) and others [3,5,8] emphasize the importance of understanding individual construction risks, particularly during the planning phase. However, our study uniquely underscores the significance of simultaneous activities and their compound risks. For instance, while Mirzaei et al. (2018) proposed models to decrease workspace conflicts [6], our research extends beyond the singular scope of spatial and concurrent considerations to factor in the hazardous impacts that one activity might have on another. Similarly, while Zolfagharian et al. (2014) and Moon et al. integrated safety measures into project scheduling [8,13], we further this paradigm by integrating overlapping risks into BIM visualizations. The introduction of the “overlapping conflict” concept, as we have proposed, fills a notable gap in the current literature, emphasizing overlapping conflicts where activities intersect in time, space, and hazard potential. Our model not only aligns with the sentiments of Okpala et al. (2020) and Chantawit et al. (2005) regarding the significance of BIM in safety management [22,23], but also pioneers an innovative methodology that enhances the depth and breadth of hazard analysis within the BIM environment.

6. Conclusions

In this study, a specific type of conflict, called “overlapping conflict” was proposed, which had been neglected by previous research and could increase the number of accidents in the construction industry. This research developed a framework for defining overlapping conflict among activities using not only time–space conflict but also source–target matching of those conflicts. Our finding can be summarized as follows:
  • This research introduces the concept of overlapping conflicts, which broadens our understanding of safety risks in the construction industry
  • A meticulous analysis resulted in identification of eleven hazardous and nine susceptible attributes; moreover, the probability and severity of their matches were assessed.
  • To provide a practical dimension to this study, a case study was used to verify the process
  • The risk factor associated with each overlapping conflict was assessed and then prioritized to further analyze the conflicts
  • This research provides an actionable framework using BIM, proposing a real-world tool for supervision and evaluation of overlapping construction activities
Although this research investigates a new type of construction hazard, its core concept can unveil the main reason for accidents in many other industries. The model presented here equips safety supervisors with a BIM-based monitoring tool whose decision on decoupling or distancing unsafely conflicting activities goes beyond the scope of this research.
This study is limited to identifying and prioritizing the conflicts, while the treatment, safety mitigation strategies, and monitoring updates and communications of which can be a good topic for future research. Integrated management of all overlapping and multiple-node influences that make the nature of construction complex is possibly the next service BIM will offer to the industry. Moreover, as previously noted, this study did not evaluate the duration of concurrent conflicts; therefore, it can be a valuable area for future research. A more refined analysis of hazardous and susceptibility attributes presents a potential topic for future research. We also recognize the need to further explore and integrate a comprehensive range of factors, including types of activities, workforce experience, regulatory compliance, and communication dynamics, to develop holistic safety management strategies that encompass hazard identification and mitigation across the construction industry.

Author Contributions

Conceptualization, A.R.N., H.M. and H.E.; Methodology, A.R.N., H.M. and H.E.; Software, A.N.T. and K.G.; Validation, A.R.N.; Formal analysis, A.R.N.; Investigation, A.R.N.; Resources, A.R.N.; Data curation, A.R.N.; Writing—original draft, A.R.N.; Writing—review & editing, A.R.N., H.M. and H.E.; Visualization, A.N.T. and K.G.; Supervision, A.R.N., H.M. and H.E.; Project administration, A.R.N., H.M. and H.E. All authors have read and agreed to the published version of the manuscript.

Funding

This research received no external funding.

Data Availability Statement

No new original data is generated in this study. Tables and figures represent data processed in an artificial, sample case study. However all the data presented in this study are available on request from the corresponding author.

Conflicts of Interest

The authors declare no conflict of interest.

Abbreviations

APIApplication Programming Interface
BIMBuilding Information Modeling
CPMCritical Path Method
FACEFatal Accident Circumstances and Health Epidemiology
FTAFault Tree Analysis
LODLevel of Development
MEPMechanical, Electrical, and Plumbing
NIOSHNational Institute for Occupational Safety and Health
OSHAOccupational Safety and Health Administration
RFRisk Factor

References

  1. Sanni-Anibire, M.O.; Mahmoud, A.S.; Hassanain, M.A.; Salami, B.A. A risk assessment approach for enhancing construction safety performance. Saf. Sci. 2020, 121, 15–29. [Google Scholar] [CrossRef]
  2. Lee, Y.-C.; Shariatfar, M.; Rashidi, A.; Lee, H.W. Evidence-driven sound detection for prenotification and identification of construction safety hazards and accidents. Autom. Constr. 2020, 113, 103127. [Google Scholar] [CrossRef]
  3. Morteza, A.; Ilbeigi, M.; Schwed, J. A Blockchain Information Management Framework for Construction Safety. In Proceedings of the ASCE International Conference on Computing in Civil Engineering 2021, Orlando, FL, USA, 12–14 September 2021; pp. 342–349. [Google Scholar]
  4. Ojha, A.; Seagers, J.; Shayesteh, S.; Habibnezhad, M.; Jebelli, H. Construction safety training methods and their evaluation approaches: A systematic literature review. In Proceedings of the 8th International Conference on Construction Engineering and Project Management, Hong Kong, China, 7–8 December 2020; pp. 188–197. [Google Scholar]
  5. Kartam, N.A. Integrating Safety and Health Performance into Construction CPM. J. Constr. Eng. Manag. 1997, 123, 121–126. [Google Scholar] [CrossRef]
  6. Mirzaei, A.; Nasirzadeh, F.; Jalal, M.P.; Zamani, Y. 4D-BIM Dynamic Time–Space Conflict Detection and Quantification System for Building Construction Projects. J. Constr. Eng. Manag. 2018, 144, 04018056. [Google Scholar] [CrossRef]
  7. Behm, M. Linking construction fatalities to the design for construction safety concept. Saf. Sci. 2005, 43, 589–611. [Google Scholar] [CrossRef]
  8. Zolfagharian, S.; Irizarry, J.; Ressang, A.; Nourbakhsh, M.; Gheisari, M. Automated safety planning approach for residential construction sites in Malaysia. Int. J. Constr. Manag. 2014, 14, 134–147. [Google Scholar] [CrossRef]
  9. Alirezaei, S.; Taghaddos, H.; Ghorab, K.; Tak, A.N.; Alirezaei, S. BIM-augmented reality integrated approach to risk management. Autom. Constr. 2022, 141, 104458. [Google Scholar] [CrossRef]
  10. Cao, Y.; Miraba, S.; Rafiei, S.; Ghabussi, A.; Bokaei, F.; Baharom, S.; Haramipour, P.; Assilzadeh, H. Economic application of structural health monitoring and internet of things in efficiency of building information modeling. Smart Struct. Syst. 2020, 26, 559–573. [Google Scholar]
  11. Omer, M.M.; Mohd-Ezazee, N.M.A.; Lee, Y.S.; Rajabi, M.S.; Rahman, R.A. Constructive and Destructive Leadership Behaviors, Skills, Styles and Traits in BIM-Based Construction Projects. Buildings 2022, 12, 2068. [Google Scholar] [CrossRef]
  12. Rajabi, M.S.; Radzi, A.R.; Rezaeiashtiani, M.; Famili, A.; Rashidi, M.E.; Rahman, R.A. Key Assessment Criteria for Organizational BIM Capabilities: A Cross-Regional Study. Buildings 2022, 12, 1013. [Google Scholar] [CrossRef]
  13. Moon, H.; Kim, H.; Kim, C.; Kang, L. Development of a schedule-workspace interference management system simultaneously considering the overlap level of parallel schedules and workspaces. Autom. Constr. 2014, 39, 93–105. [Google Scholar] [CrossRef]
  14. Yi, K.-J.; Langford, D. Scheduling-Based Risk Estimation and Safety Planning for Construction Projects. J. Constr. Eng. Manag. 2006, 132, 626–635. [Google Scholar] [CrossRef]
  15. Martinez, J.G.; Albeaino, G.; Gheisari, M.; Issa, R.R.; Alarcón, L.F. iSafeUAS: An unmanned aerial system for construction safety inspection. Autom. Constr. 2021, 125, 103595. [Google Scholar] [CrossRef]
  16. Khodabandelu, A.; Park, J.; Arteaga, C. Crane operation planning in overlapping areas through dynamic supply selection. Autom. Constr. 2020, 117, 103253. [Google Scholar] [CrossRef]
  17. Guo, B.H.; Goh, Y.M.; Wong, K.L.X. A system dynamics view of a behavior-based safety program in the construction industry. Saf. Sci. 2018, 104, 202–215. [Google Scholar] [CrossRef]
  18. Malekitabar, H.; Ardeshir, A.; Sebt, M.H.; Stouffs, R. Construction safety risk drivers: A BIM approach. Saf. Sci. 2016, 82, 445–455. [Google Scholar] [CrossRef]
  19. Perlman, A.; Sacks, R.; Barak, R. Hazard recognition and risk perception in construction. Saf. Sci. 2014, 64, 22–31. [Google Scholar] [CrossRef]
  20. Mohandes, S.R.; Zhang, X. Developing a Holistic Occupational Health and Safety risk assessment model: An application to a case of sustainable construction project. J. Clean. Prod. 2021, 291, 125934. [Google Scholar] [CrossRef]
  21. Cagno, E.; Di Giulio, A.; Trucco, P. An algorithm for the implementation of safety improvement programs. Saf. Sci. 2001, 37, 59–75. [Google Scholar] [CrossRef]
  22. Okpala, I.; Nnaji, C.; Karakhan, A.A. Utilizing Emerging Technologies for Construction Safety Risk Mitigation. Pr. Period. Struct. Des. Constr. 2020, 25, 04020002. [Google Scholar] [CrossRef]
  23. Chantawit, D.; Hadikusumo, B.H.; Charoenngam, C.; Rowlinson, S. 4DCAD-Safety: Visualizing project scheduling and safety planning. Constr. Innov. 2005, 5, 99–114. [Google Scholar]
  24. Kassem, M.; Dawood, N.; Chavada, R. Construction workspace management within an Industry Foundation Class-Compliant 4D tool. Autom. Constr. 2015, 52, 42–58. [Google Scholar] [CrossRef]
  25. Lu, Y.; Gong, P.; Tang, Y.; Sun, S.; Li, Q. BIM-integrated construction safety risk assessment at the design stage of building projects. Autom. Constr. 2021, 124, 103553. [Google Scholar] [CrossRef]
  26. Tak, A.N.; Taghaddos, H.; Mousaei, A.; Bolourani, A.; Hermann, U. BIM-based 4D mobile crane simulation and onsite operation management. Autom. Constr. 2021, 128, 103766. [Google Scholar] [CrossRef]
  27. Sampaio, A.Z.; Constantino, G.B.; Almeida, N.M. 8D BIM Model in Urban Rehabilitation Projects: Enhanced Occupational Safety for Temporary Construction Works. Appl. Sci. 2022, 12, 10577. [Google Scholar] [CrossRef]
  28. Charef, R. The use of Building Information Modelling in the circular economy context: Several models and a new dimension of BIM (8D). Clean. Eng. Technol. 2022, 7, 100414. [Google Scholar] [CrossRef]
  29. NIOSH. Fetality Assessment and Control Evaluation (FACE). 2012. Available online: http://www.cdc.com.gov/niosh/face/faceweb.html (accessed on 23 March 2006).
  30. OSHA. Fetal Facts. 2014. Available online: http://www.osha.gov/publication/fetalfacts.html (accessed on 23 March 2006).
  31. Pinto, A.; Nunes, I.L.; Ribeiro, R.A. Occupational risk assessment in construction industry—Overview and reflection. Saf. Sci. 2011, 49, 616–624. [Google Scholar] [CrossRef]
  32. Zhou, Z.; Goh, Y.M.; Li, Q. Overview and analysis of safety management studies in the construction industry. Saf. Sci. 2015, 72, 337–350. [Google Scholar] [CrossRef]
  33. Pillay, M. Accident Causation, Prevention and Safety Management: A Review of the State-of-the-art. Procedia Manuf. 2015, 3, 1838–1845. [Google Scholar] [CrossRef]
  34. Choi, S.D.; Guo, L.; Kim, J.; Xiong, S. Comparison of fatal occupational injuries in construction industry in the United States, South Korea, and China. Int. J. Ind. Ergon. 2019, 71, 64–74. [Google Scholar] [CrossRef]
  35. Camino López, M.A.; Ritzel, D.O.; Fontaneda, I.; González Alcantara, O.J. Construction industry accidents in Spain. J. Saf. Res. 2008, 39, 497–507. [Google Scholar] [CrossRef] [PubMed]
  36. Hamid, A.R.; Noor Azmi, M.R.; Aminudin, E.; Jaya, R.P.; Zakaria, R.; Zawawi, A.M.; Yahya, K.; Haron, Z.; Yunus, R.; Saar, C.C. Causes of fatal construction accidents in Malaysia. IOP Conf. Ser. Earth Environ. Sci. 2019, 220, 012044. [Google Scholar] [CrossRef]
  37. Shafique, M.; Rafiq, M. An Overview of Construction Occupational Accidents in Hong Kong: A Recent Trend and Future Perspectives. Appl. Sci. 2019, 9, 2069. [Google Scholar] [CrossRef]
  38. Zhu, R.; Hu, X.; Hou, J.; Li, X. Application of machine learning techniques for predicting the consequences of construction accidents in China. Process. Saf. Environ. Prot. 2021, 145, 293–302. [Google Scholar] [CrossRef]
  39. Zhou, Z.; Irizarry, J.; Guo, W. A network-based approach to modeling safety accidents and causations within the context of subway construction project management. Saf. Sci. 2021, 139, 105261. [Google Scholar] [CrossRef]
  40. Saloniemi, A.; Oksanen, H. Accidents and fatal accidents—Some paradoxes. Saf. Sci. 1998, 29, 59–66. [Google Scholar] [CrossRef]
  41. Winge, S.; Albrechtsen, E. Accident types and barrier failures in the construction industry. Saf. Sci. 2018, 105, 158–166. [Google Scholar] [CrossRef]
  42. Xu, Q.; Xu, K. Analysis of the Characteristics of Fatal Accidents in the Construction Industry in China Based on Statistical Data. Int. J. Environ. Res. Public Health 2021, 18, 2162. [Google Scholar] [CrossRef]
  43. Eisenhardt, K.M. Building theories from case study research. Acad. Manag. Rev. 1989, 14, 532–550. [Google Scholar] [CrossRef]
  44. Adler, M.; Ziglio, E. Gazing into the Oracle: The Delphi Method and Its Application to Social Policy and Public Health; Jessica Kingsley Publishers: London, UK, 1996. [Google Scholar]
  45. Tersine, R.J.; Riggs, W.E. The delphi technique: A long-range planning tool. Bus. Horizons 1976, 19, 51–56. [Google Scholar] [CrossRef]
  46. Carter, G.; Smith, S.D. Safety Hazard Identification on Construction Projects. J. Constr. Eng. Manag. 2006, 132, 197–205. [Google Scholar] [CrossRef]
  47. Manuele, F.A. Achieving risk reduction, effectively. Process Saf. Environ. Prot. 2006, 84, 184–190. [Google Scholar] [CrossRef]
  48. Lucko, G.; Rojas, E.M. Research Validation: Challenges and Opportunities in the Construction Domain. J. Constr. Eng. Manag. 2010, 136, 127–135. [Google Scholar] [CrossRef]
  49. Li, J.; Li, H.; Wang, H.; Umer, W.; Fu, H.; Xing, X. Evaluating the impact of mental fatigue on construction equipment operators’ ability to detect hazards using wearable eye-tracking technology. Autom. Constr. 2019, 105. [Google Scholar] [CrossRef]
  50. Zhao, D.; McCoy, A.P.; Kleiner, B.M.; Smith-Jackson, T.L. Control measures of electrical hazards: An analysis of construction industry. Saf. Sci. 2015, 77, 143–151. [Google Scholar] [CrossRef]
  51. Hamid, A.R.; Majid, M.Z.; Singh, B. Causes of accidents at construction sites. Malays. J. Civ. Eng. 2008, 20, 242–259. [Google Scholar]
  52. Kartam, A.N.; Bouz, R.G. Fatalities and injuries in the Kuwaiti construction industry. Accid. Anal. Prev. 1998, 30, 805–814. [Google Scholar] [CrossRef]
  53. Tam, C.; Zeng, S.; Deng, Z. Identifying elements of poor construction safety management in China. Saf. Sci. 2004, 42, 569–586. [Google Scholar] [CrossRef]
  54. Rashidi Nasab, A.; Elzarka, H. Predicting Ohio Bridges Deteriorations Using Multi-Target Machine Learning Algorithms, International Conference on Transportation and Development (2023). In Proceedings of the International Conference on Transportation and Development (ICTD 2024), Atlanta, GA, USA, 15–18 June 2024. Scheduled to Be Held. [Google Scholar]
  55. Rashidi Nasab, A.; Elzarka, H. Optimizing Machine Learning Algorithms for Improving Prediction of Bridge Deck Deterioration: A Case Study of Ohio Bridges. Buildings 2023, 13, 1517. [Google Scholar] [CrossRef]
Figure 1. Fault Tree Analysis of overlapping conflicts.
Buildings 13 02647 g001
Figure 2. Concurrency of two activities: (a) short concurrency (1 day overlap); (b) long concurrency (7 day overlap). Letters in grey represent days of the week.
Buildings 13 02647 g002
Figure 3. Three-dimensional elevation hazard spread. On a concrete framed building, when the “rebar welding” activity (red circle) is taking place in level 2, it may cause a distraction for the “rebar installation” activity taking place in level 1 (blue circle).
Buildings 13 02647 g003
Figure 4. Hazard spread.
Buildings 13 02647 g004
Figure 5. From Data to Output Out: The BIM Workflow.
Buildings 13 02647 g005
Figure 6. Sample project modeled in Revit.
Buildings 13 02647 g006
Figure 7. High-risk conflicts highlighted using the Navisworks API.
Buildings 13 02647 g007
Table 1. Priority of activities’ risk levels.
ScaleRisk LevelDescriptionPriority
10–0.2First aid injuries only and/or minimal impactInsignificant
20.2–0.4Minor injuries and/or short-term impactMinor
30.4–0.6Serious injuries and/or significant impactModerate
40.6–0.8Fatalities and/or major short-term impactMajor
50.8–1.00Large number of fatalities and/or major long-term impactCatastrophic
Table 2. Hazardous attributes.
AttributeDescriptionStudies
Construction equipment hazardsHazards caused by heavy equipment and sharp angles used in construction activityLi. et al. (2019) [49]
Sparks and lightsActivity generates sparks and lights that reduce visibility and cause distractionZhao et al. (2015) [50]
Heavy materials and equipment at site Heavy materials used in the activity can intentionally or inadvertently fall or fly, posing risks to workers at the same elevationsLi. et al. (2019) [49]
Lack of site spaceActivity increases space congestion, causing additional safety risks to workers performing another activityMirzaie et al. (2018) [6]
Electric shockActivity involves electric installation which if not completed correctly can increase risk of electric shock for workers performing another activity Zhao et al. (2015) [50]
Sharp materialsActivity generates materials cut at sharp angles with no caps or coversLee et al. (2020) [2]
Severe impactActivity involves moving objects that can pose safety risks to workers performing another activityLee et al. (2020) [2]
DistractionActivity generates extra noise, vibration, smell, or any other feature that distracts or unnecessarily attracts workers performing another activityHamid et al. (2008) [51]
Heavy materials and equipment at heightMaterials or objects at higher level falling on people at lower levels.Li. et al. (2019) [49]
Displacement of wide and long and large materialsTheir installation, transportation, and inertia, and the space they occupyLi. et al. (2019) [49]
Site slipperinessCreating slippery surfaces as oil or paint leakHamid et al. (2008) [51]
Table 3. Susceptible attributes.
AttributeDescriptionStudies
Exposure to distractionWorkers need to be focused and any distractions may result in accidents.Hamid et al. (2008) [51]
Exposure to slipperinessWorkers can easily experience imbalance or lack of controlHamid et al. (2008) [51]
Exposure to falling from heightProximity to the areas that increase the probability of falling, such as working on scaffoldingKartam and Bouz (1998) [52]
Exposure to debris and unstable situationsUnmanaged debris and poor housekeepingTam et al. (2004) [53]
Exposure to heavy materials and equipmentWorkers have to work unprotected, or walk or stay close to unstable heavy objectsLi. et al. (2019) [49]
Exposure to light and sparksWorkers are not given light and spark protection equipment as per their standard work procedureZhao et al. 2015 [50]
Exposure to displacement of heavy materialsWorkers find their way onto the path of moving materialsLi. et al. (2019) [49]
Exposure to sharp equipmentWorkers with body parts unprotected against sharp material Lee et al. (2020) [2]
Exposure to electric shockWorkers untrained or unprotected against electricityZhao et al. 2015 [50]
Table 4. Source–target match table.
SusceptibleExposure to DistractionExposure to SlipperinessExposure to Falling from HeightExposure to Debris and Unstable SituationsExposure to Heavy Materials and EquipmentExposure to Light and SparksExposure to Displacement of Heavy MaterialsExposure to Sharp EquipmentExposure to Electric Shock
HazardousCodeABCDEFGHI
Construction equipment hazards1433244533
Sparks and lights2332244520
Heavy materials and equipment at site3000054200
Lack of site space4000045200
Electric shock5000042000
Sharp materials6024500400
Severe impact7220011050
Distraction8000044003
Heavy materials and equipment at height9203032304
Displacement of wide and long and large materials10030042000
Site slipperiness11035022300
Table 5. Risk profile in the case study project.
Risk LevelPriorityConflicts
0.8–1.056
0.6–0.8423
0.4–0.6310
0.2–0.4214
0–0.2122
Sum = 75
Table 6. Some examples of overlapping conflicts.
Activity iZoneActivity jZoneRisk LevelPriority
Column concrete pouringA, B, C, DRoof InstallationA, B, C, D0.85
Formwork installationC, DRoof installationC, D0.875
ExcavationA, B, C, DMaterial handlingA, B, C, D0.64
Reinforcement installationBRebar weldingB0.674
Reinforcement installationDRebar weldingC0.473
Formwork installationA, BMaterial handlingA, B0.282
Material handling A, B, C, DReinforcement installationA, B, C, D0.171
Table 7. Conflict of Column Concrete Pouring and Roof Installation at Zone C.
SusceptibleExposure to DistractionExposure to SlipperinessExposure to Falling from HeightExposure to Debris and Unstable SituationsExposure to Heavy Materials and EquipmentExposure to Light and SparksExposure to the Displacement of Heavy ThingsExposure to Sharp EquipmentExposure to Electric Shock
HazardousCodeABCDEFGHI
Machinery with moving parts10270216144360360450162162
Sparks and lights201206464160160200480
Heavy materials and equipment at site3000040032016000
Lack of site space4000032040016000
Electric shock5000000000
Sharp materials60600000000
Sever impact7000000000
Distraction800002002000090
Heavy materials and equipment at height90024003002003000240
Displacement of wide and long and large materials10024000320160000
Site slipperiness110180240012012018000
Table 8. Sixth Floor Conflicts.
SusceptibleReinforcement Installation Zone AReinforcement Installation Zone BReinforcement Installation Zone CReinforcement Installation Zone DColumn Concrete Pouring Zone AColumn Concrete Pouring Zone BColumn Concrete Pouring Zone CColumn Concrete Pouring Zone DRoof Installation Zone ARoof Installation Zone BRoof Installation Zone CRoof Installation Zone DMEP Installation Zone AMEP Installation Zone BMEP Installation Zone CMEP Installation Zone DInterior Finishes Zone AInterior Finishes Zone BInterior Finishes Zone CInterior Finishes Zone D
HazardousCode1234567891011121314151617181920
Reinforcement installation zone A100000462000000000000000
Reinforcement installation zone B200000668600000000000000
Reinforcement installation zone C300000462066860000000000000
Reinforcement installation zone D400000046200000000000000
Column concrete pouring zone A500000000000000000000
Column concrete pouring zone B607240000000000000000000
Column concrete pouring zone C700724000000008030000000000
Column concrete pouring zone D800000000000873800000000
Roof Installation zone A90000006880000000000000
Roof Installation zone B100000006880000000000000
Roof Installation zone C1100000038980000000000000
Roof Installation zone D120000006880000000000000
MEP installation zone A1300000000000000000000
MEP installation zone B1400000000000000000585400
MEP installation zone C1500000000000000000000
MEP installation zone D1600000000000000000000
Interior finishes zone A1700000000000000000000
Interior finishes zone B1800000000000005854000000
Interior finishes zone C1900000000006048000000000
Interior finishes zone D2000000000000000000000
Disclaimer/Publisher’s Note: The statements, opinions and data contained in all publications are solely those of the individual author(s) and contributor(s) and not of MDPI and/or the editor(s). MDPI and/or the editor(s) disclaim responsibility for any injury to people or property resulting from any ideas, methods, instructions or products referred to in the content.

