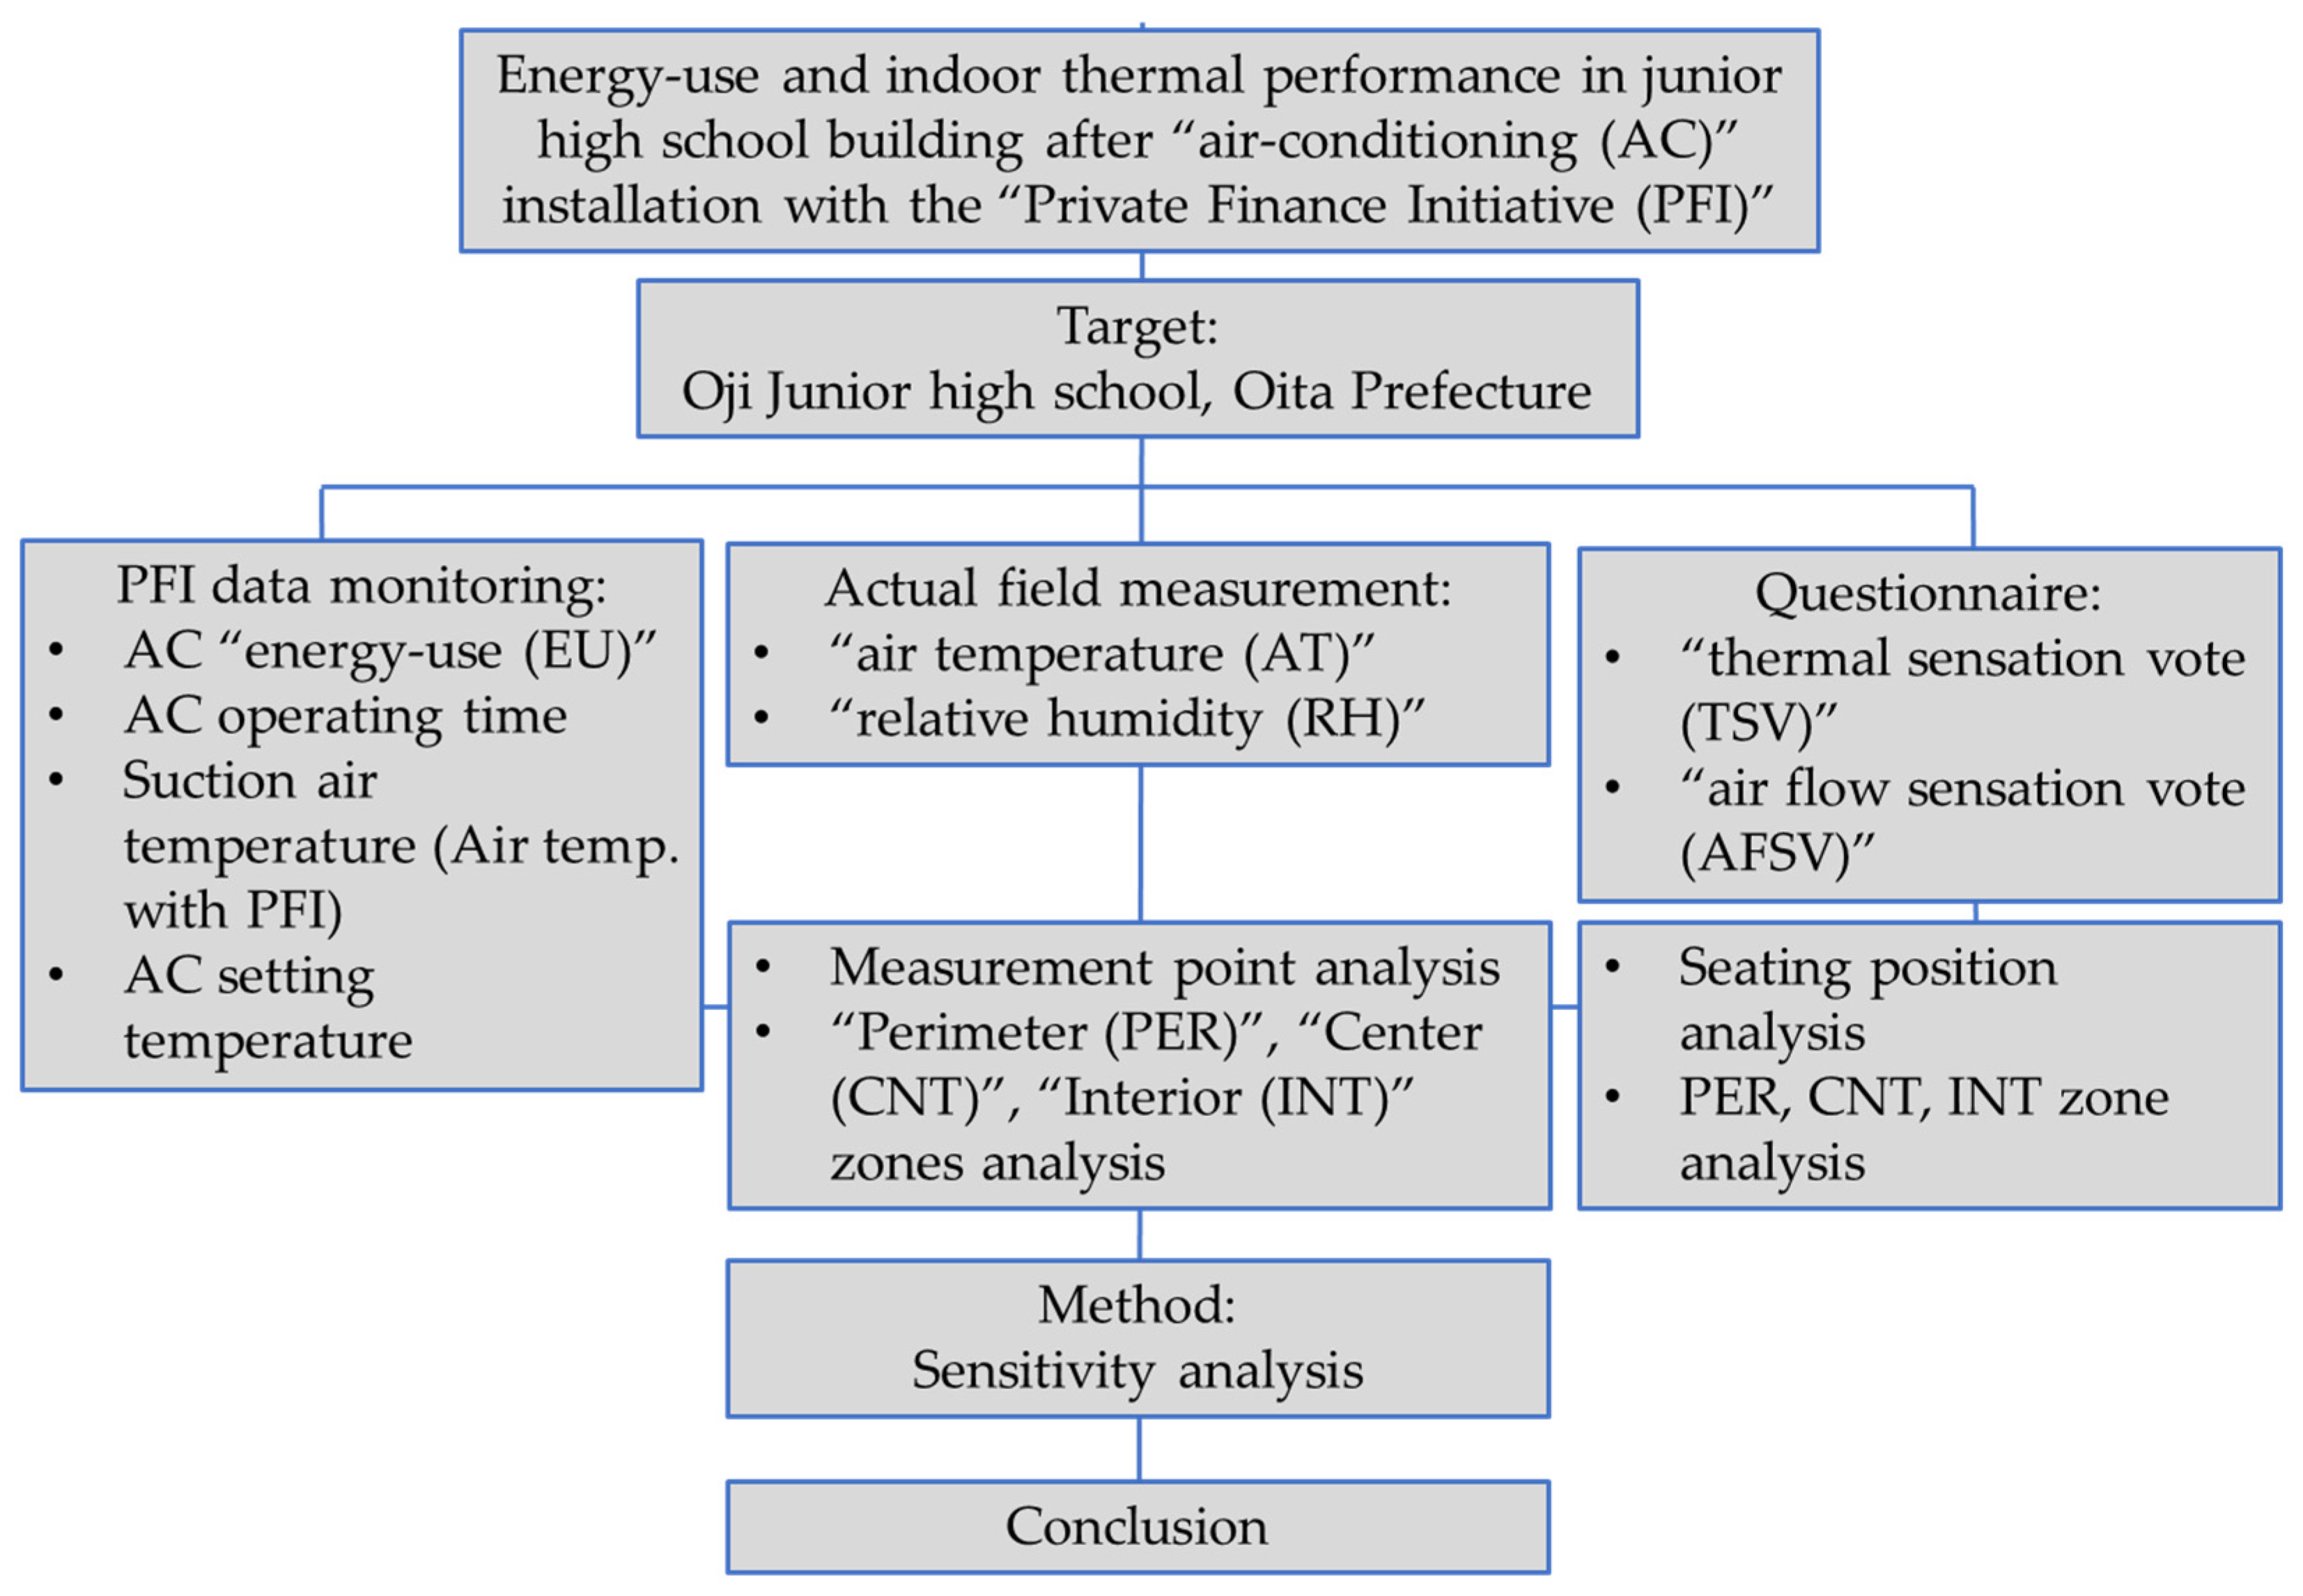
Figure 1.
Research framework.
Figure 1.
Research framework.
Figure 2.
Field measurement condition (a) Inside a typical classroom of Oji Oita Junior High School and (b) the position of the measurement item, TR-72NW.
Figure 2.
Field measurement condition (a) Inside a typical classroom of Oji Oita Junior High School and (b) the position of the measurement item, TR-72NW.
Figure 3.
Measurement points and zoning.
Figure 3.
Measurement points and zoning.
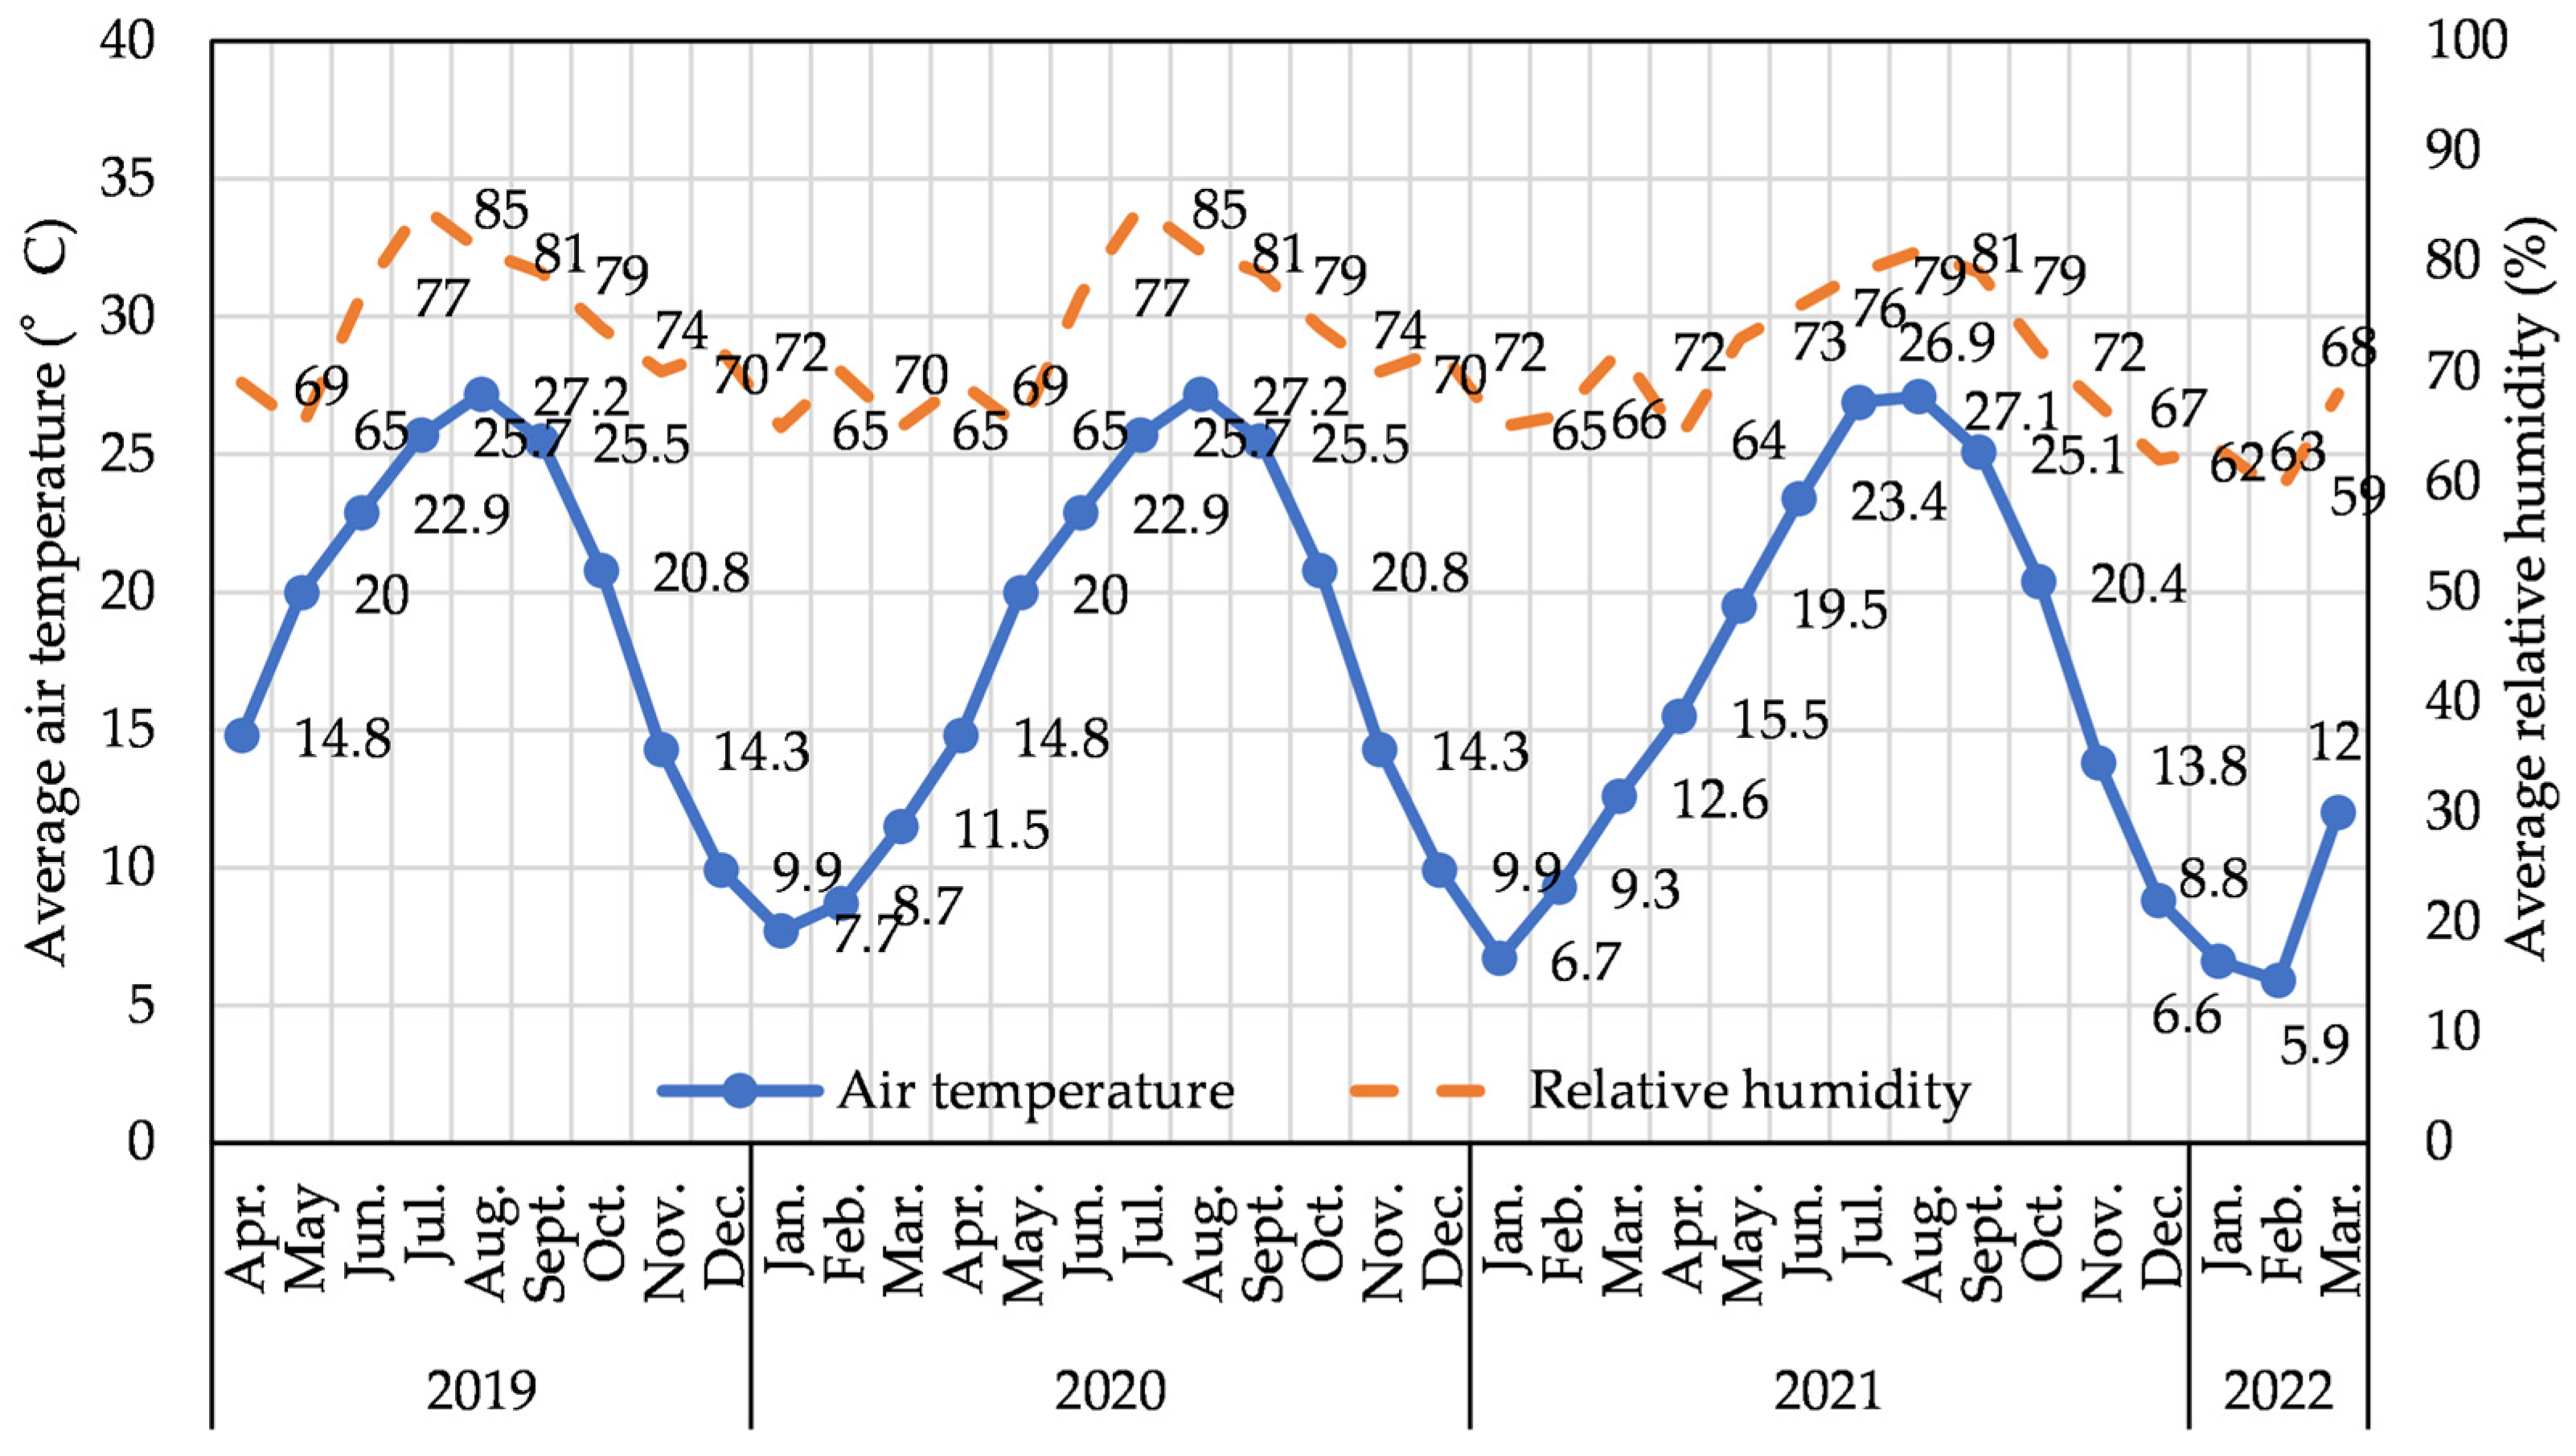
Figure 4.
Oita City April 2019–March 2022 monthly air temperature and relative humidity.
Figure 4.
Oita City April 2019–March 2022 monthly air temperature and relative humidity.
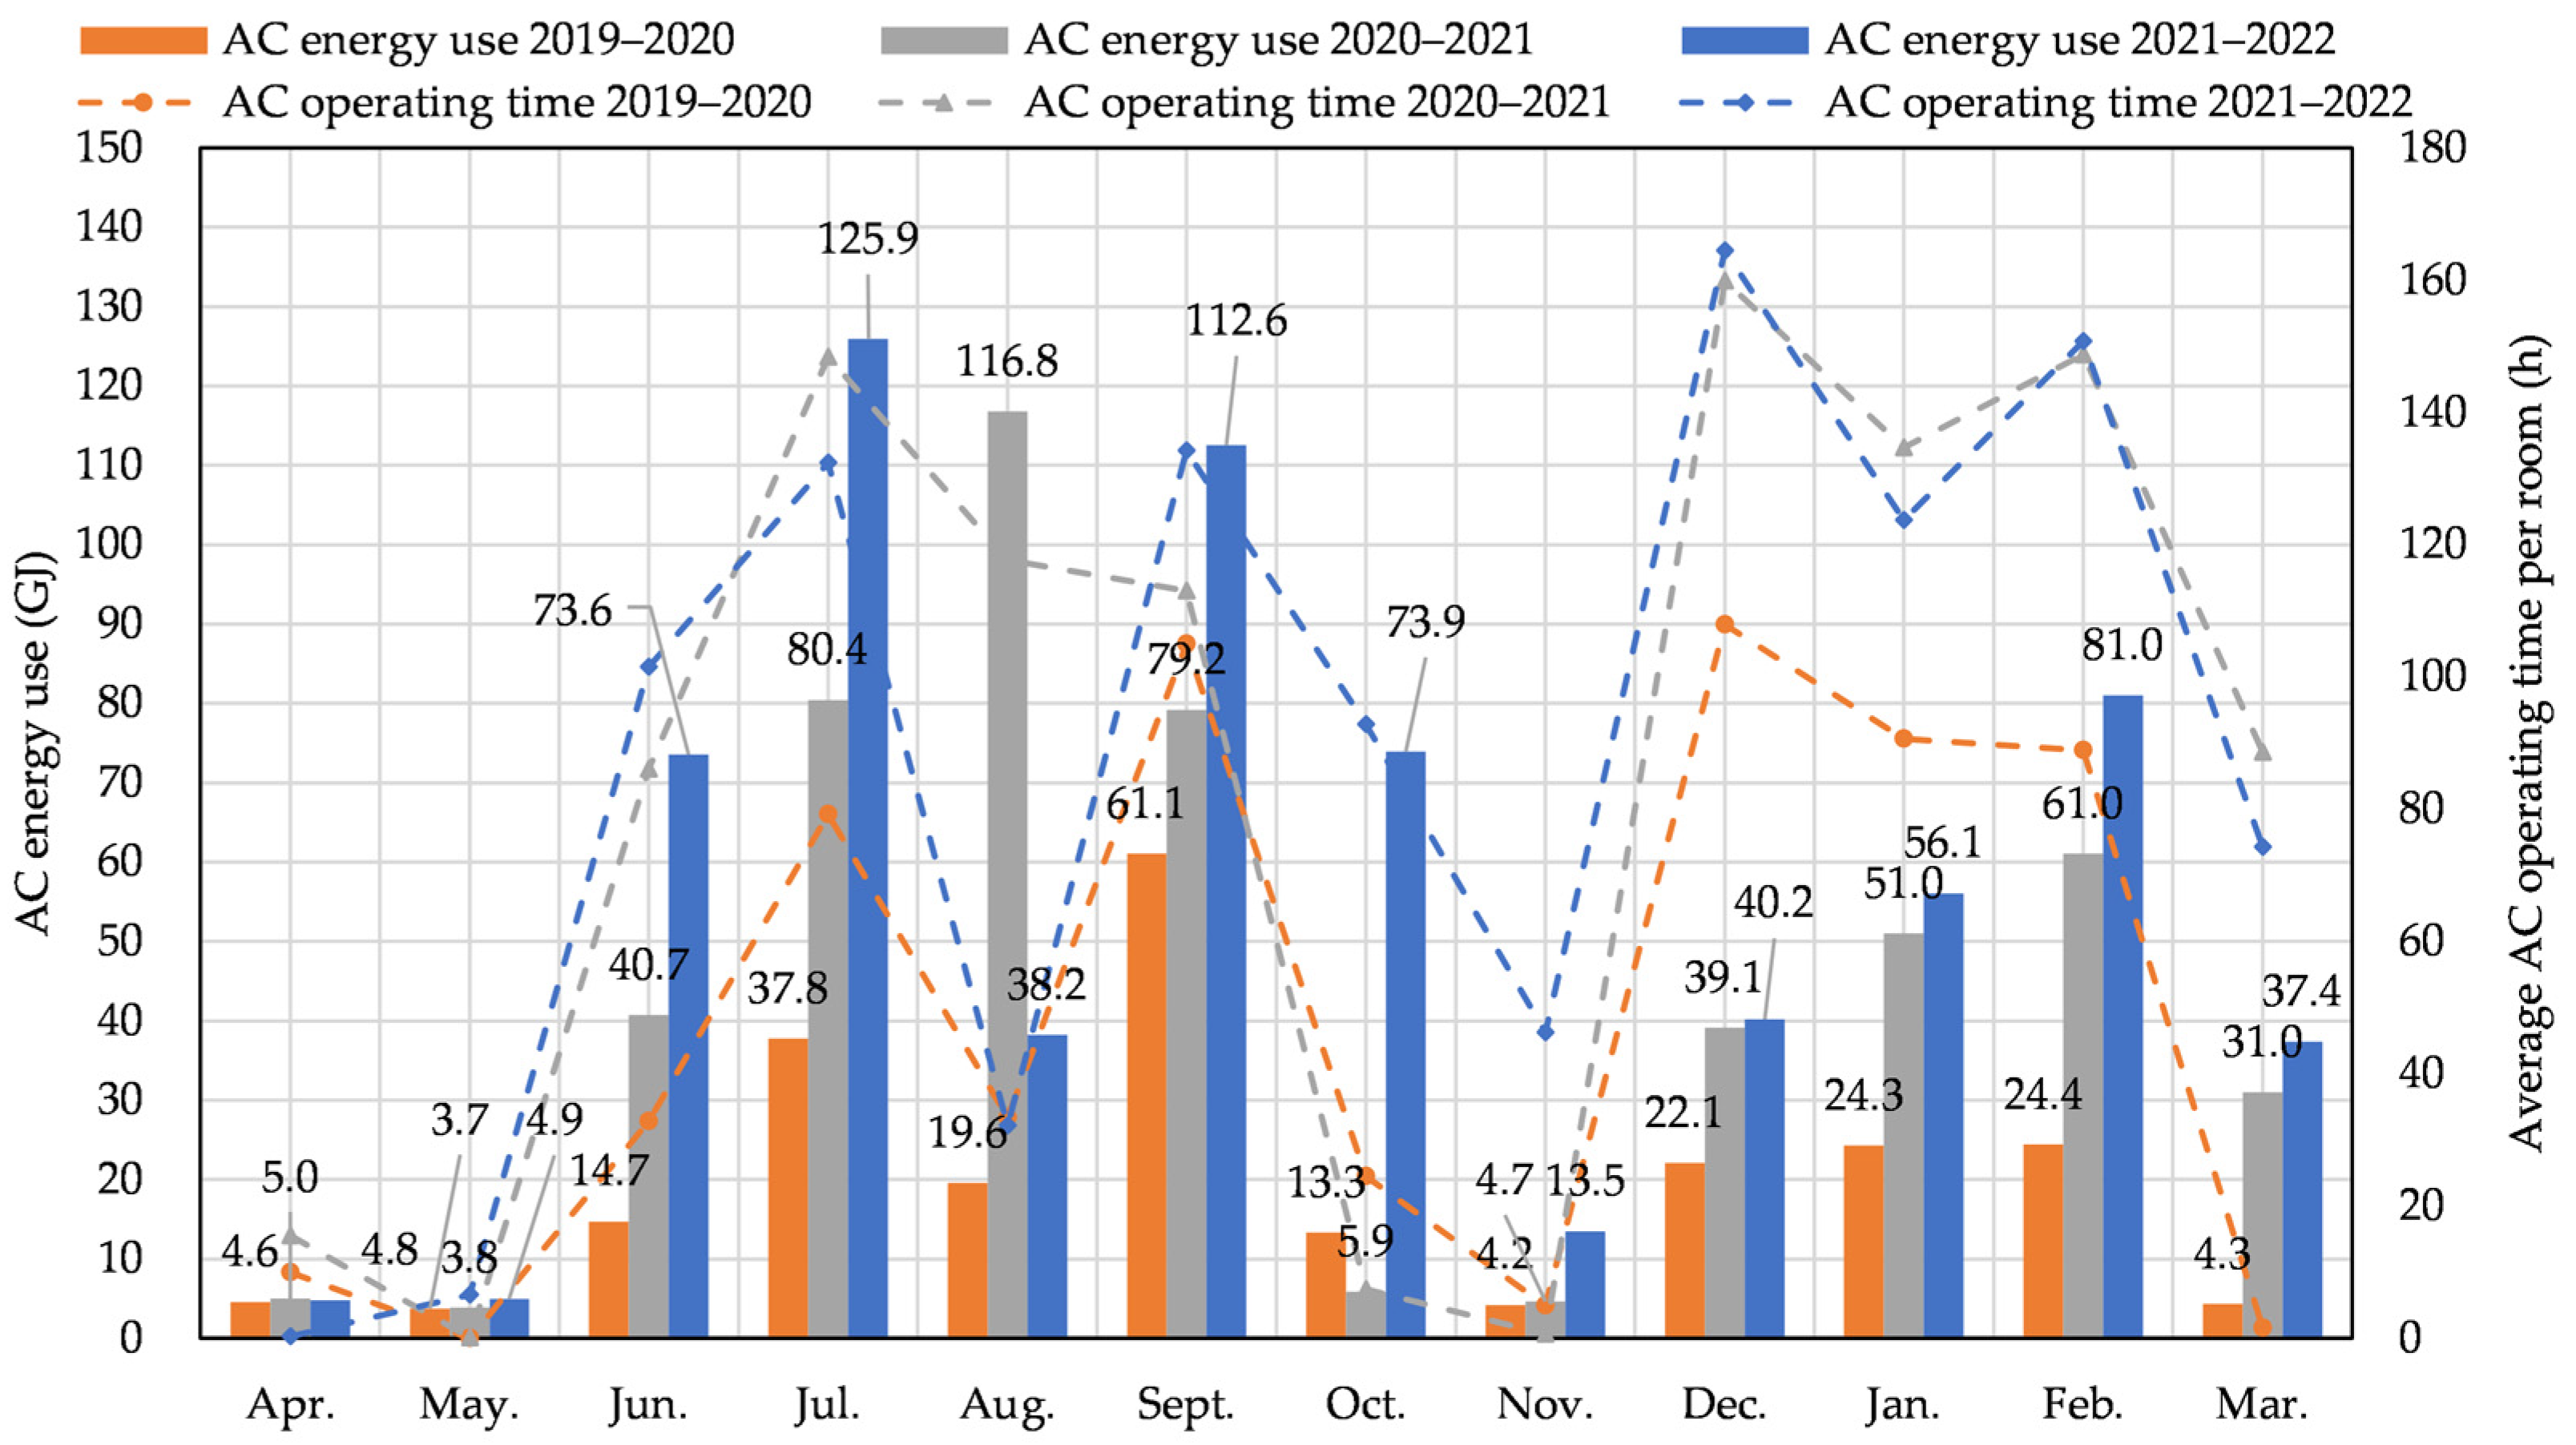
Figure 5.
Oji Junior High School’s AC EU and AC operating time (2019–2022).
Figure 5.
Oji Junior High School’s AC EU and AC operating time (2019–2022).
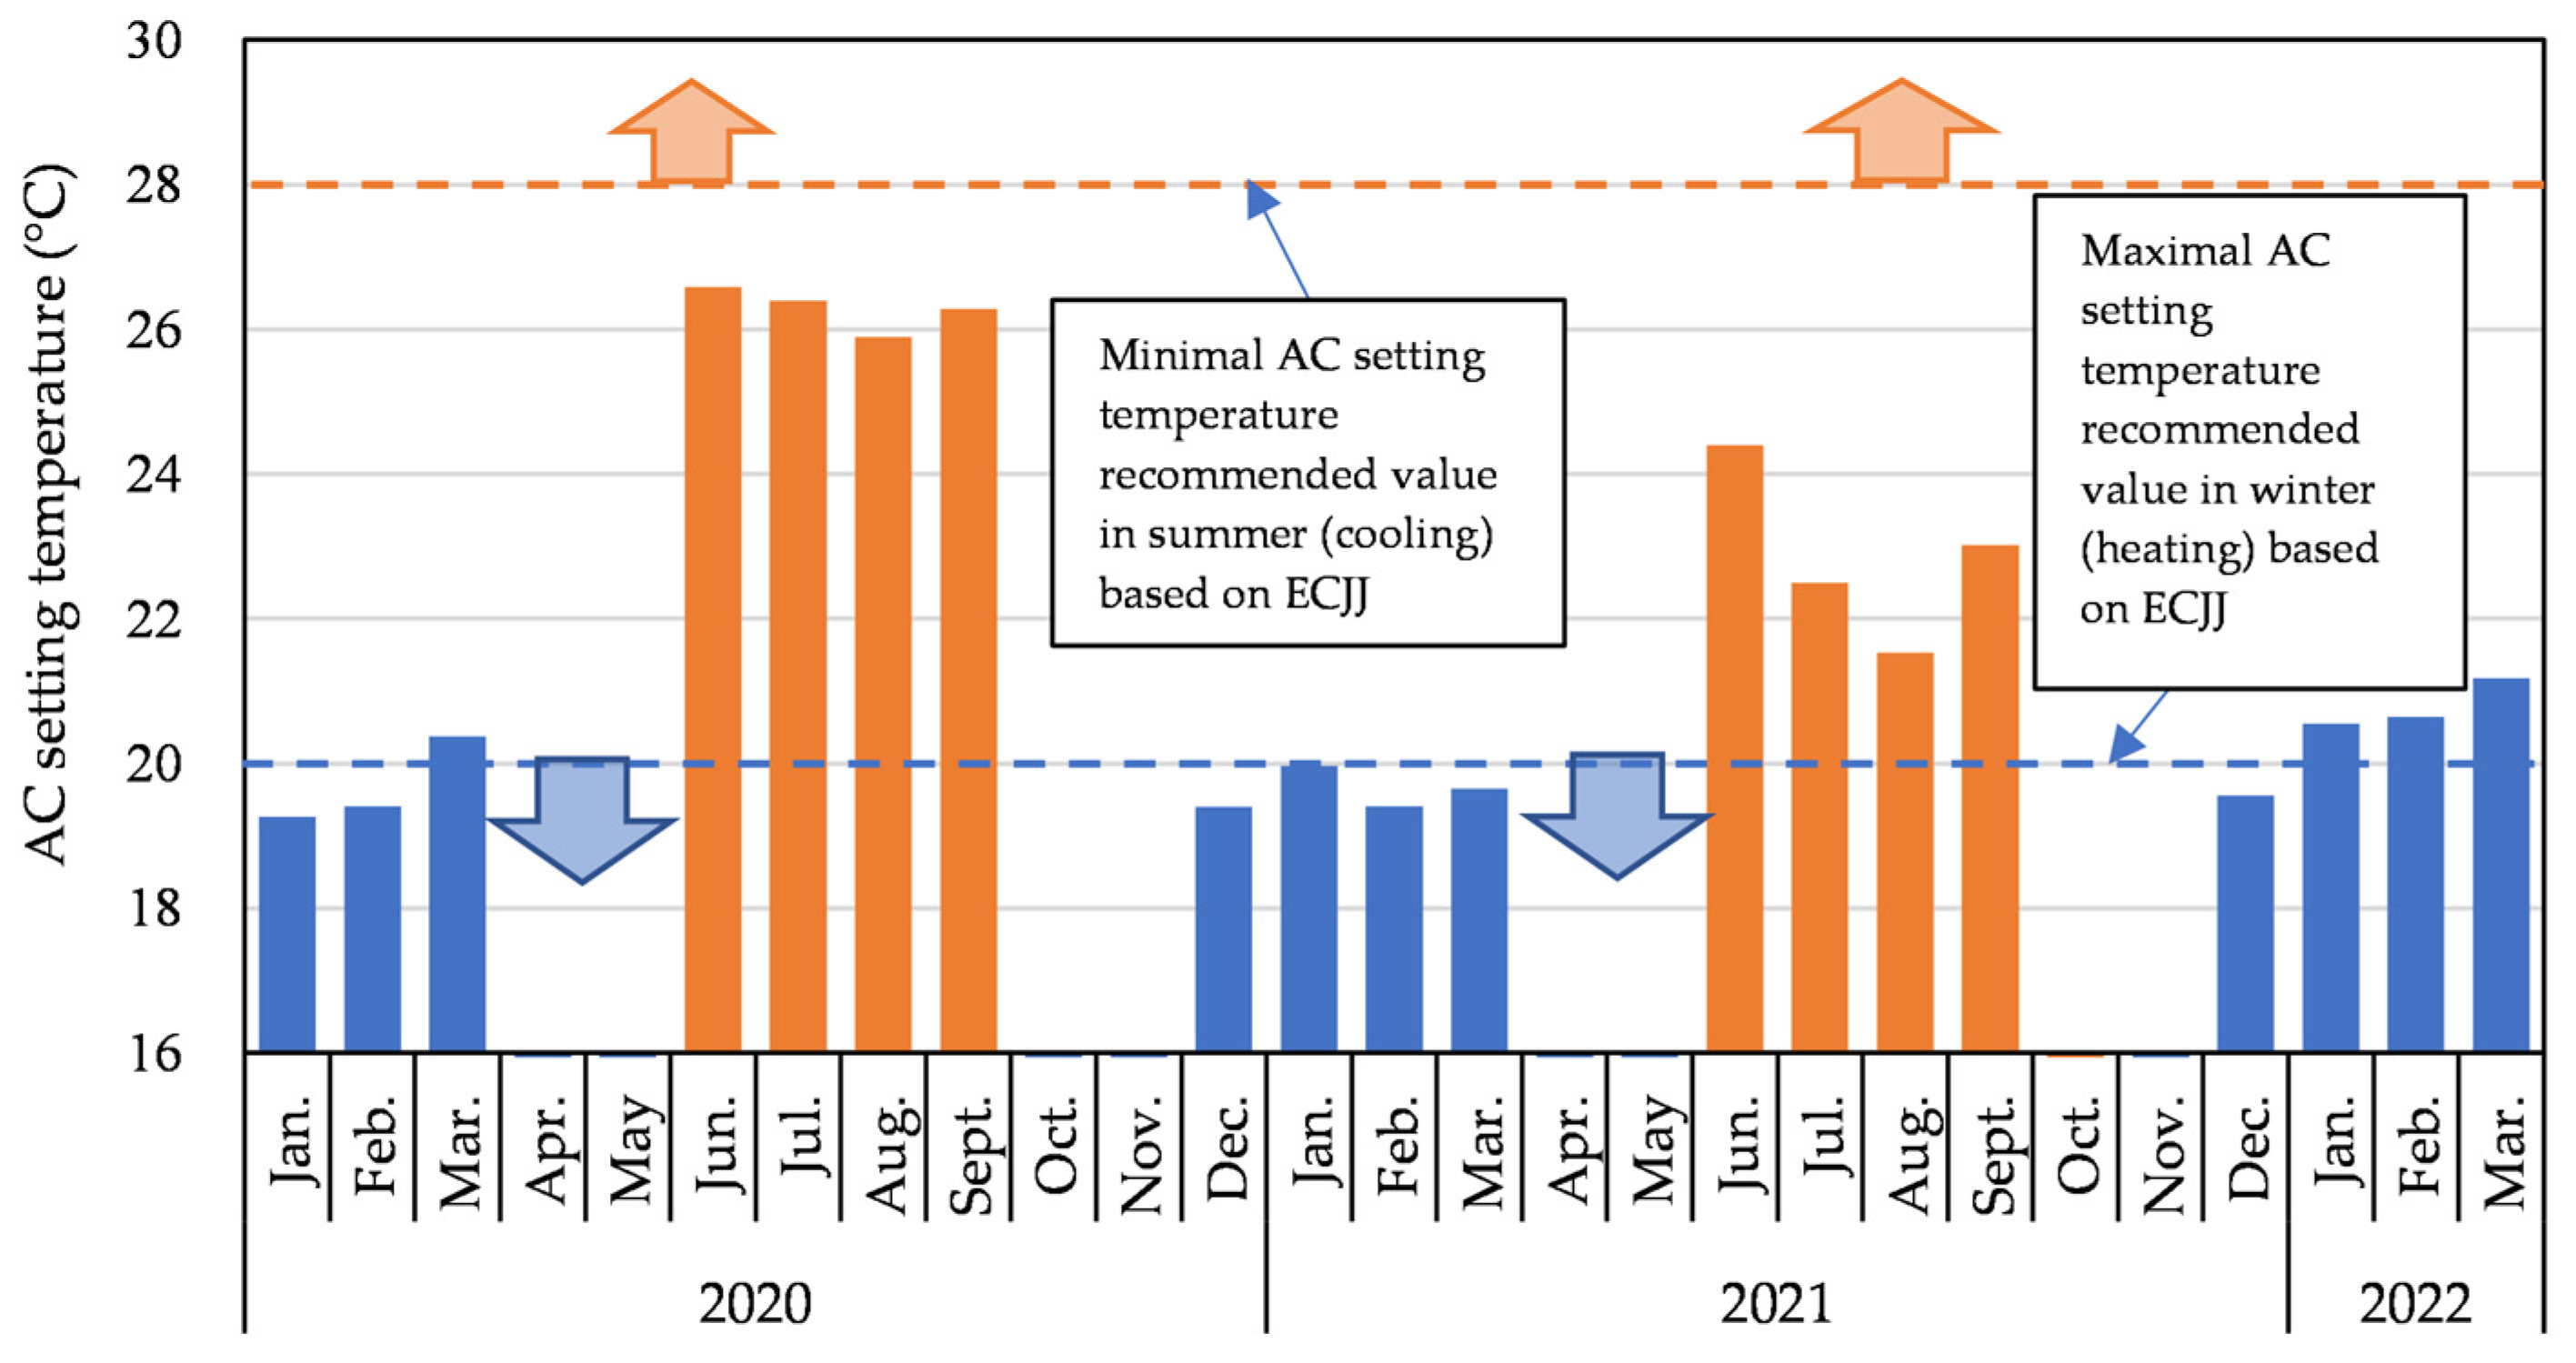
Figure 6.
Oji Junior High School’s AC setting temperature (2020–2022).
Figure 6.
Oji Junior High School’s AC setting temperature (2020–2022).
Figure 7.
Outdoor summer air temperature and relative humidity in measurement time.
Figure 7.
Outdoor summer air temperature and relative humidity in measurement time.
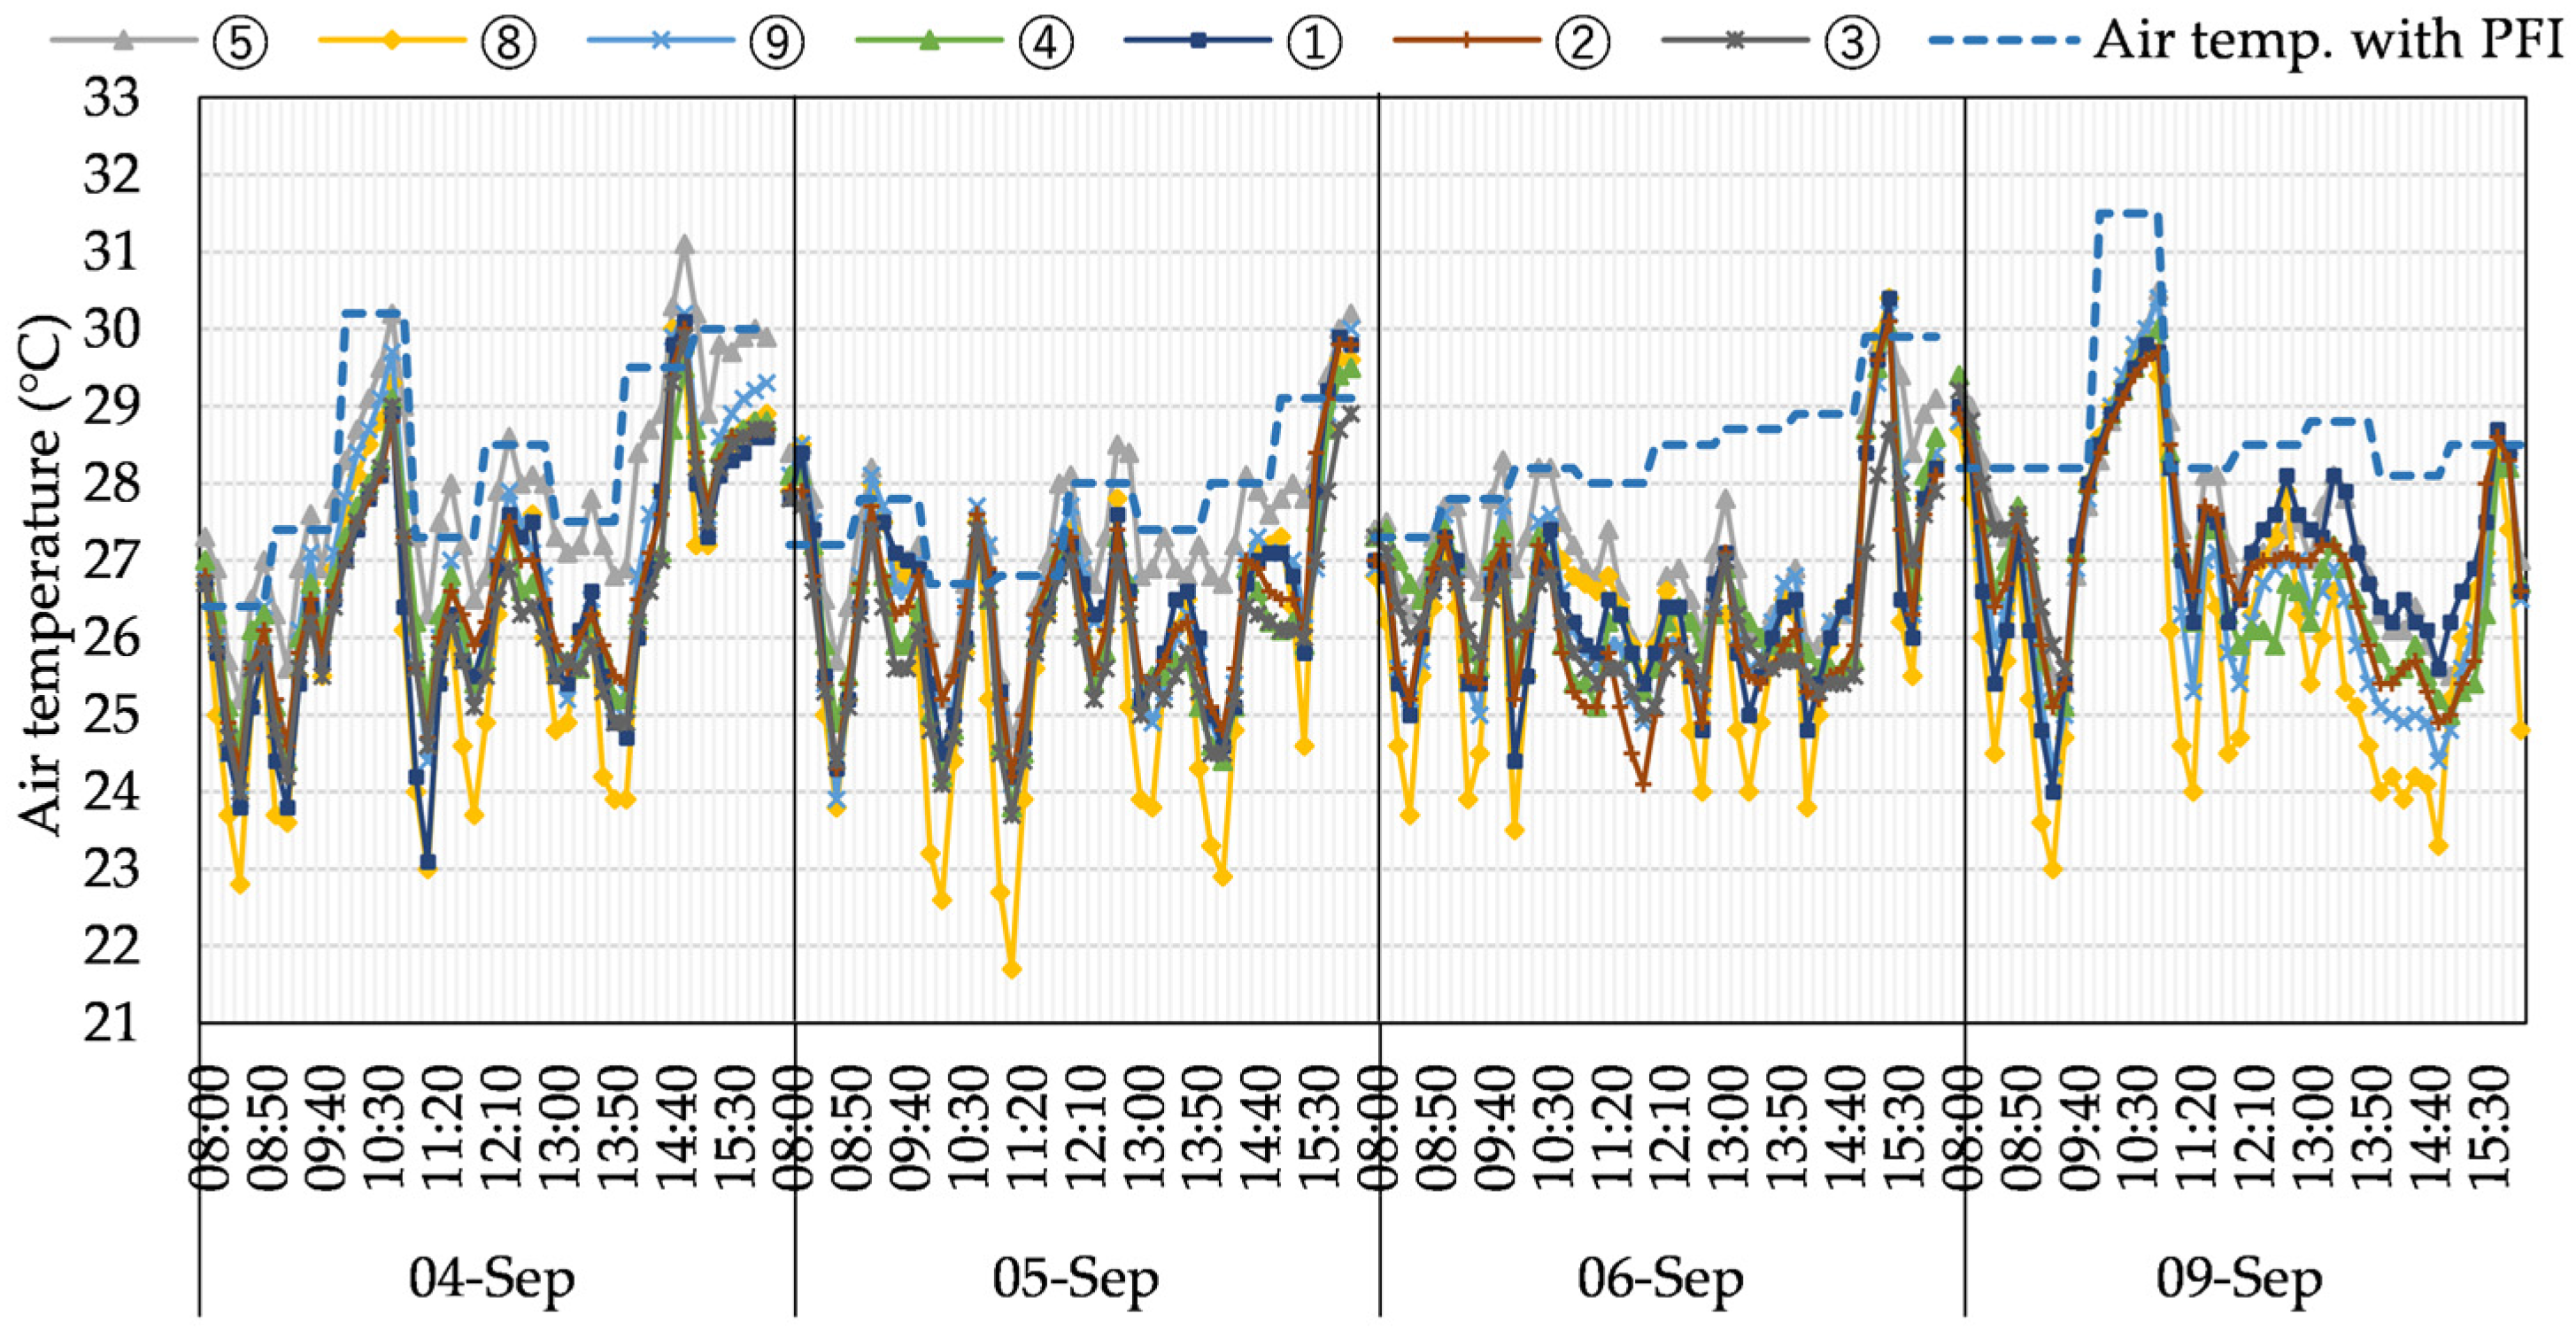
Figure 8.
Summer air temperature for class A.
Figure 8.
Summer air temperature for class A.
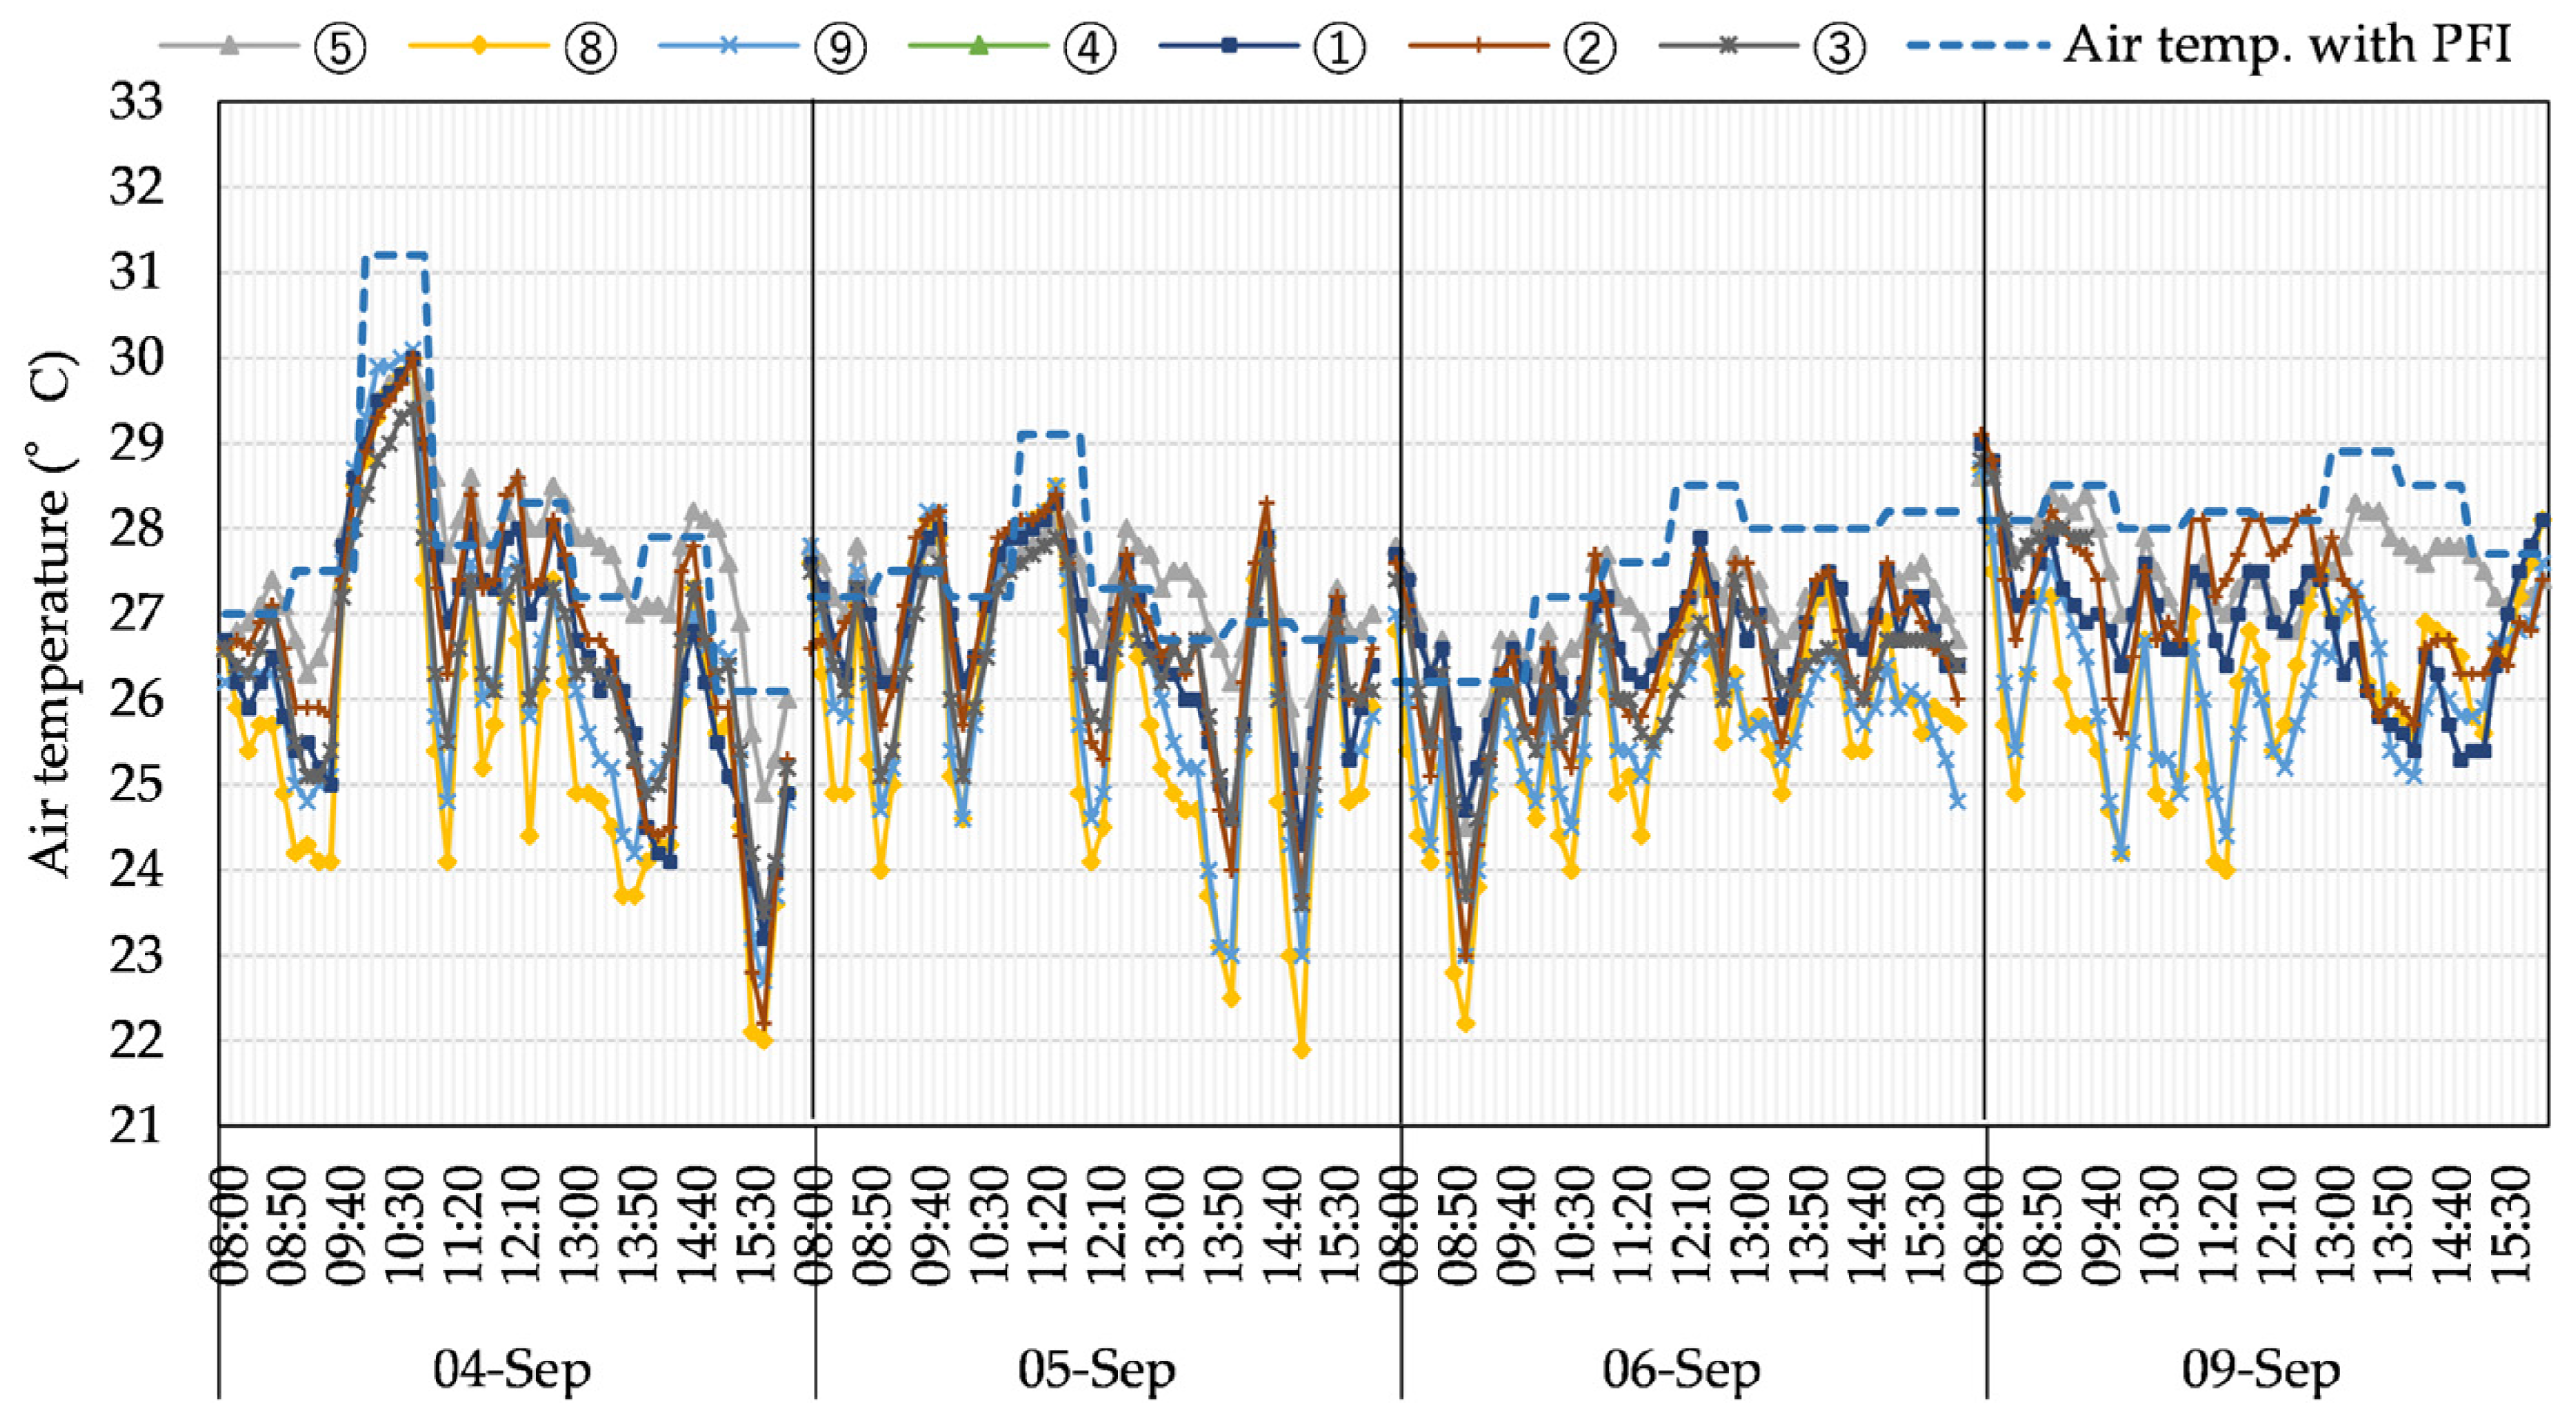
Figure 9.
Summer air temperature for class B.
Figure 9.
Summer air temperature for class B.
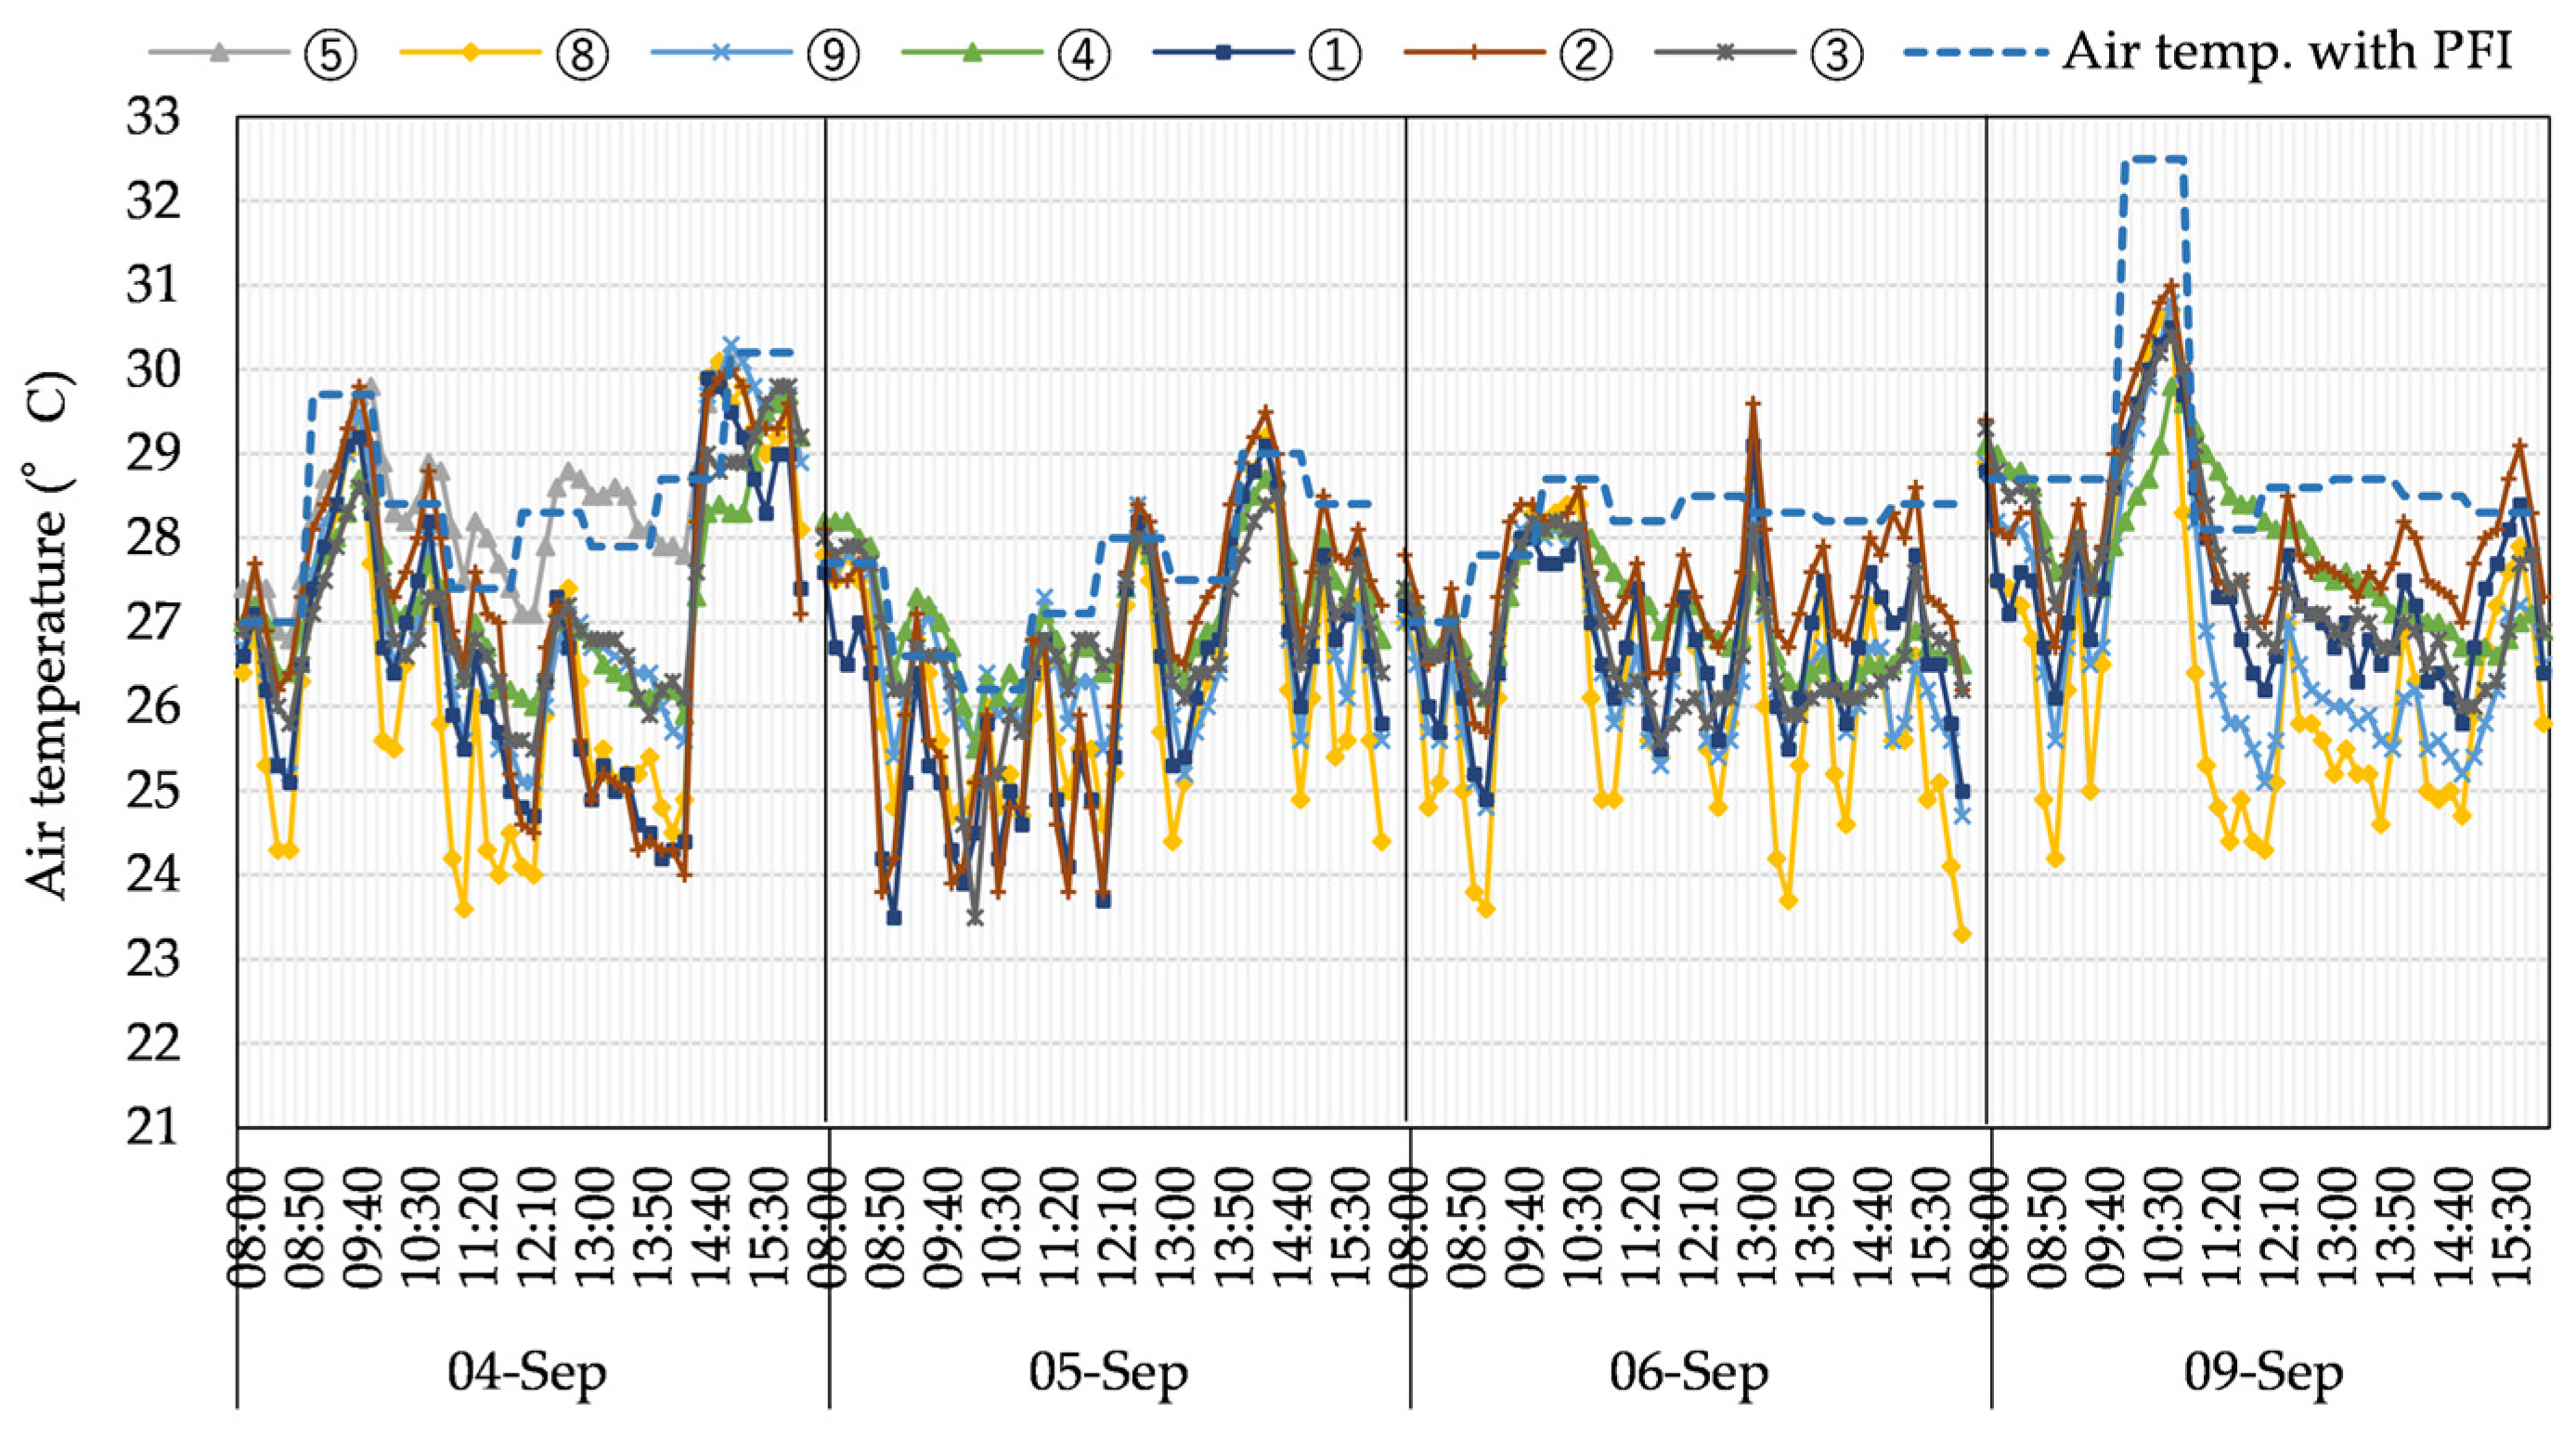
Figure 10.
Summer air temperature for class C.
Figure 10.
Summer air temperature for class C.
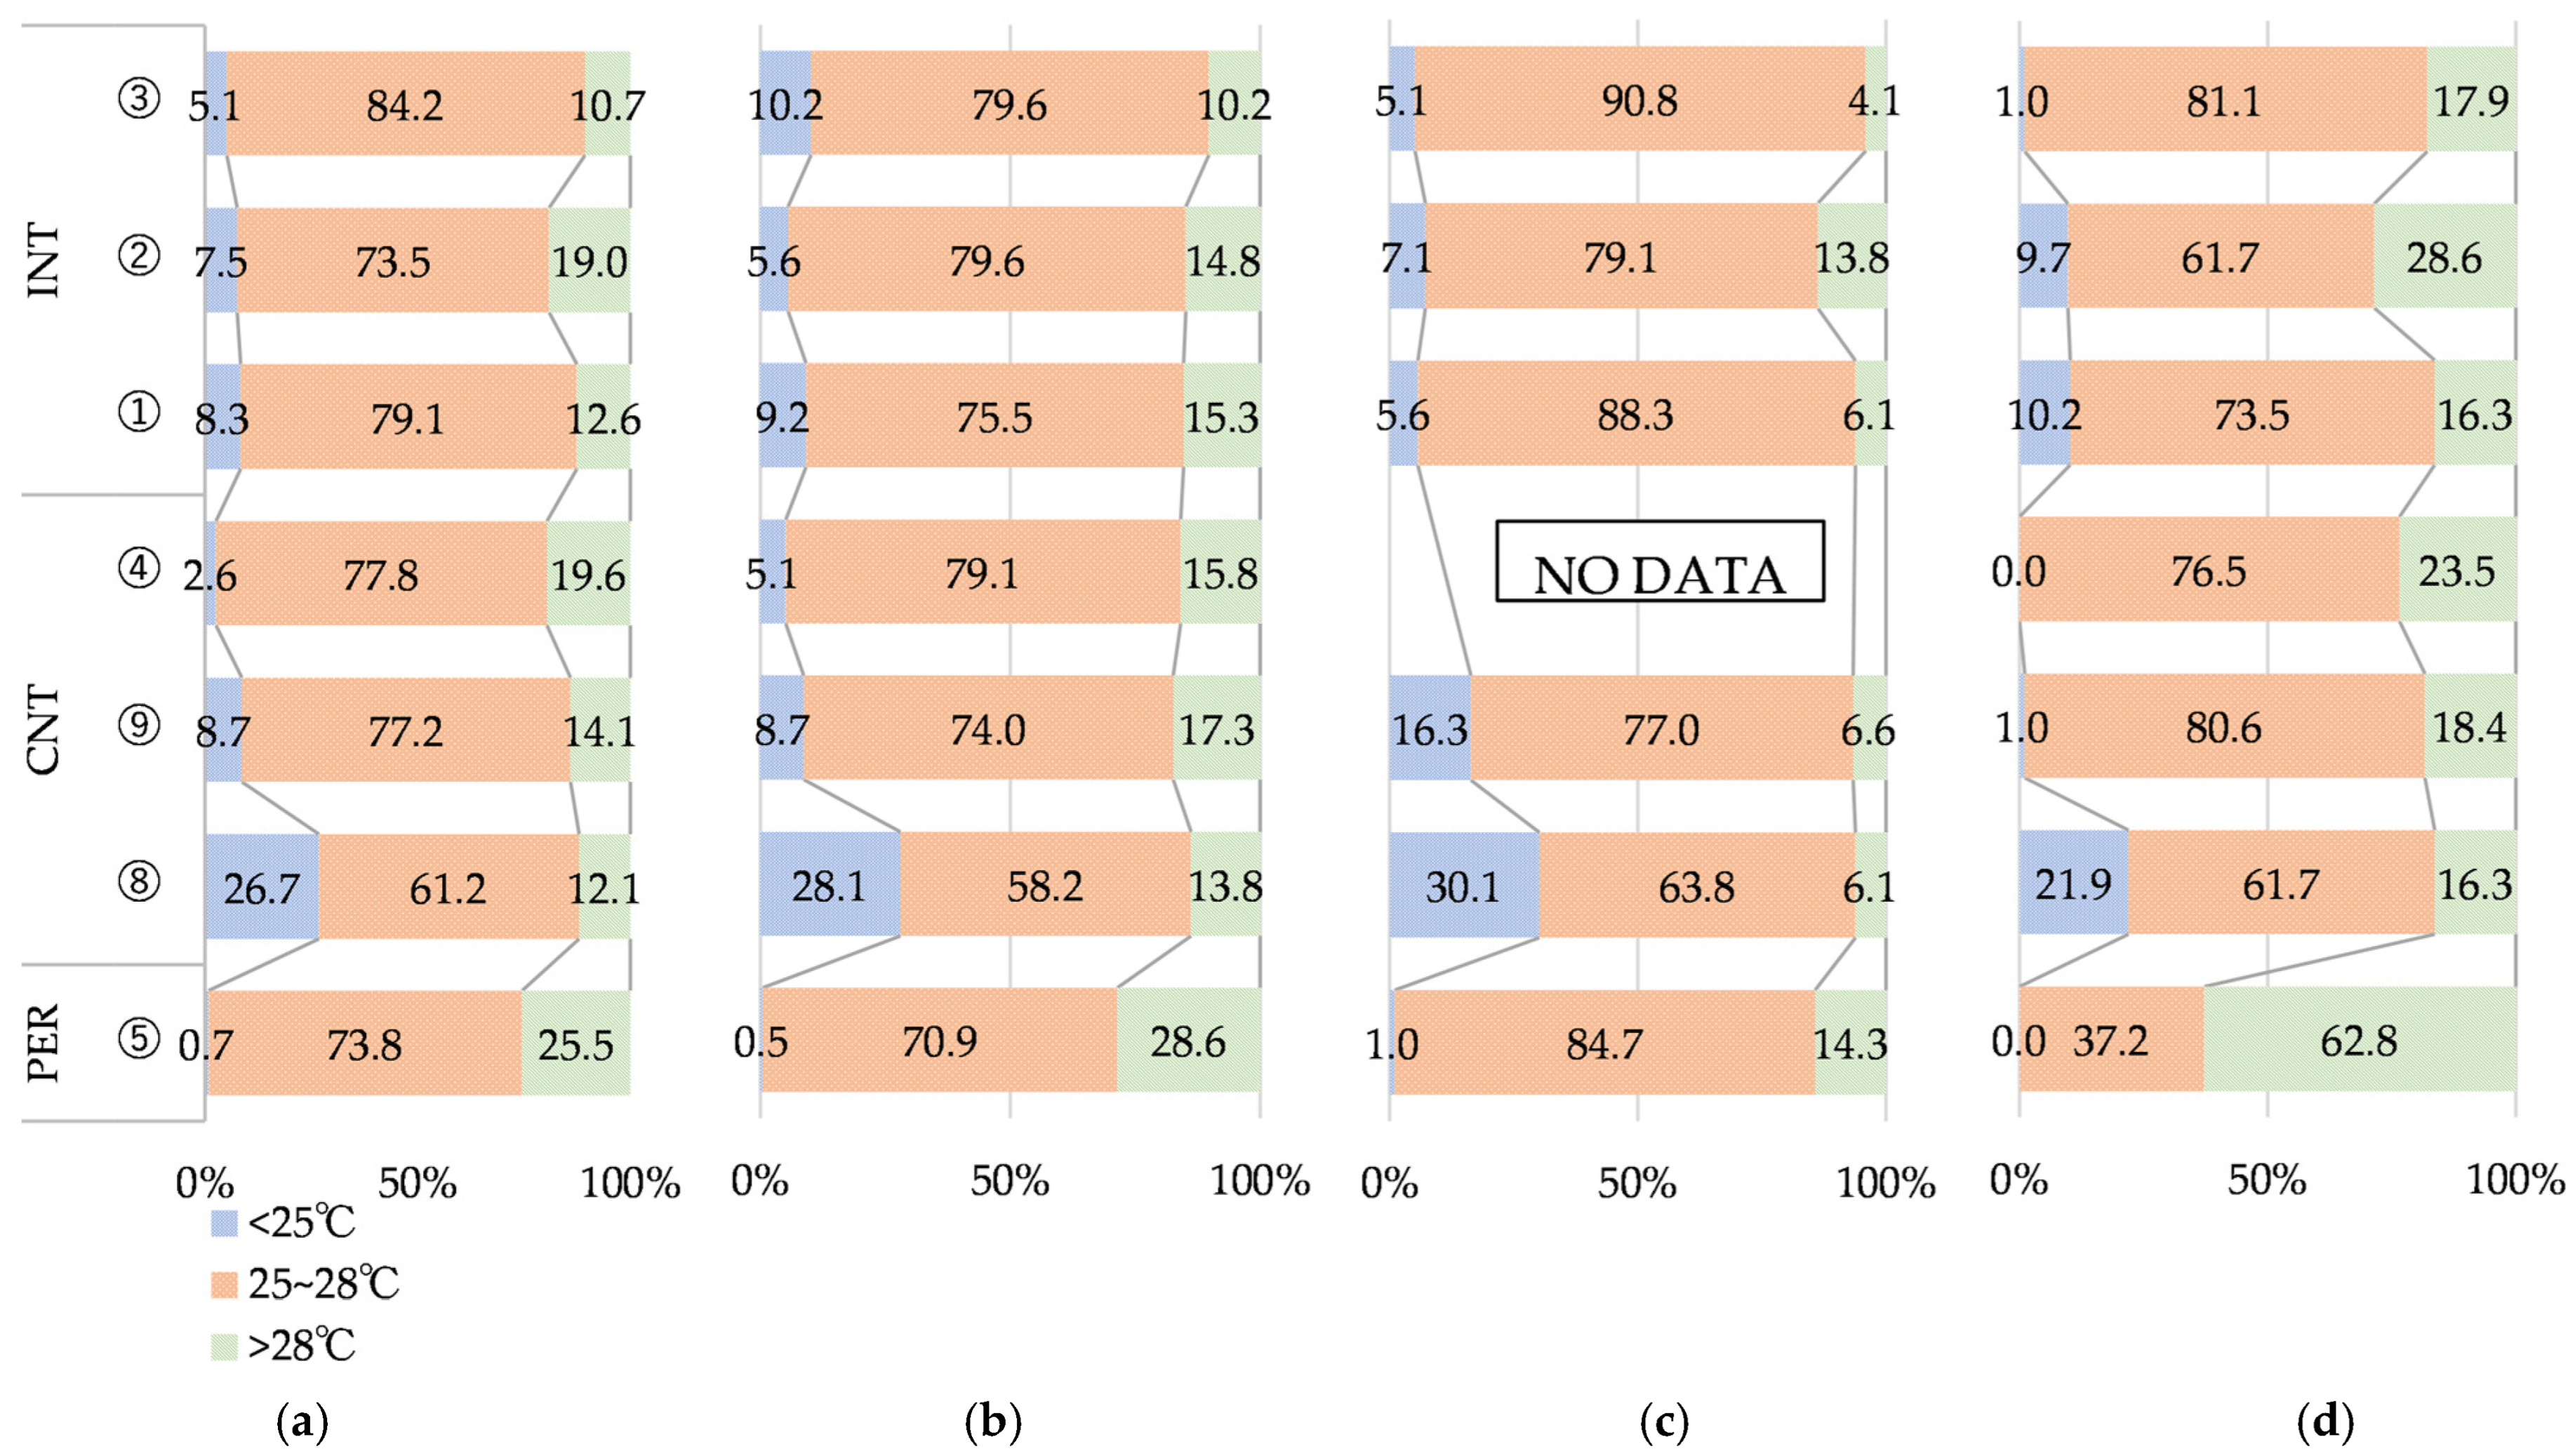
Figure 11.
Summer air temperature comfort range percentage for the (a) total average and in (b) class A, (c) class B, and (d) class C.
Figure 11.
Summer air temperature comfort range percentage for the (a) total average and in (b) class A, (c) class B, and (d) class C.
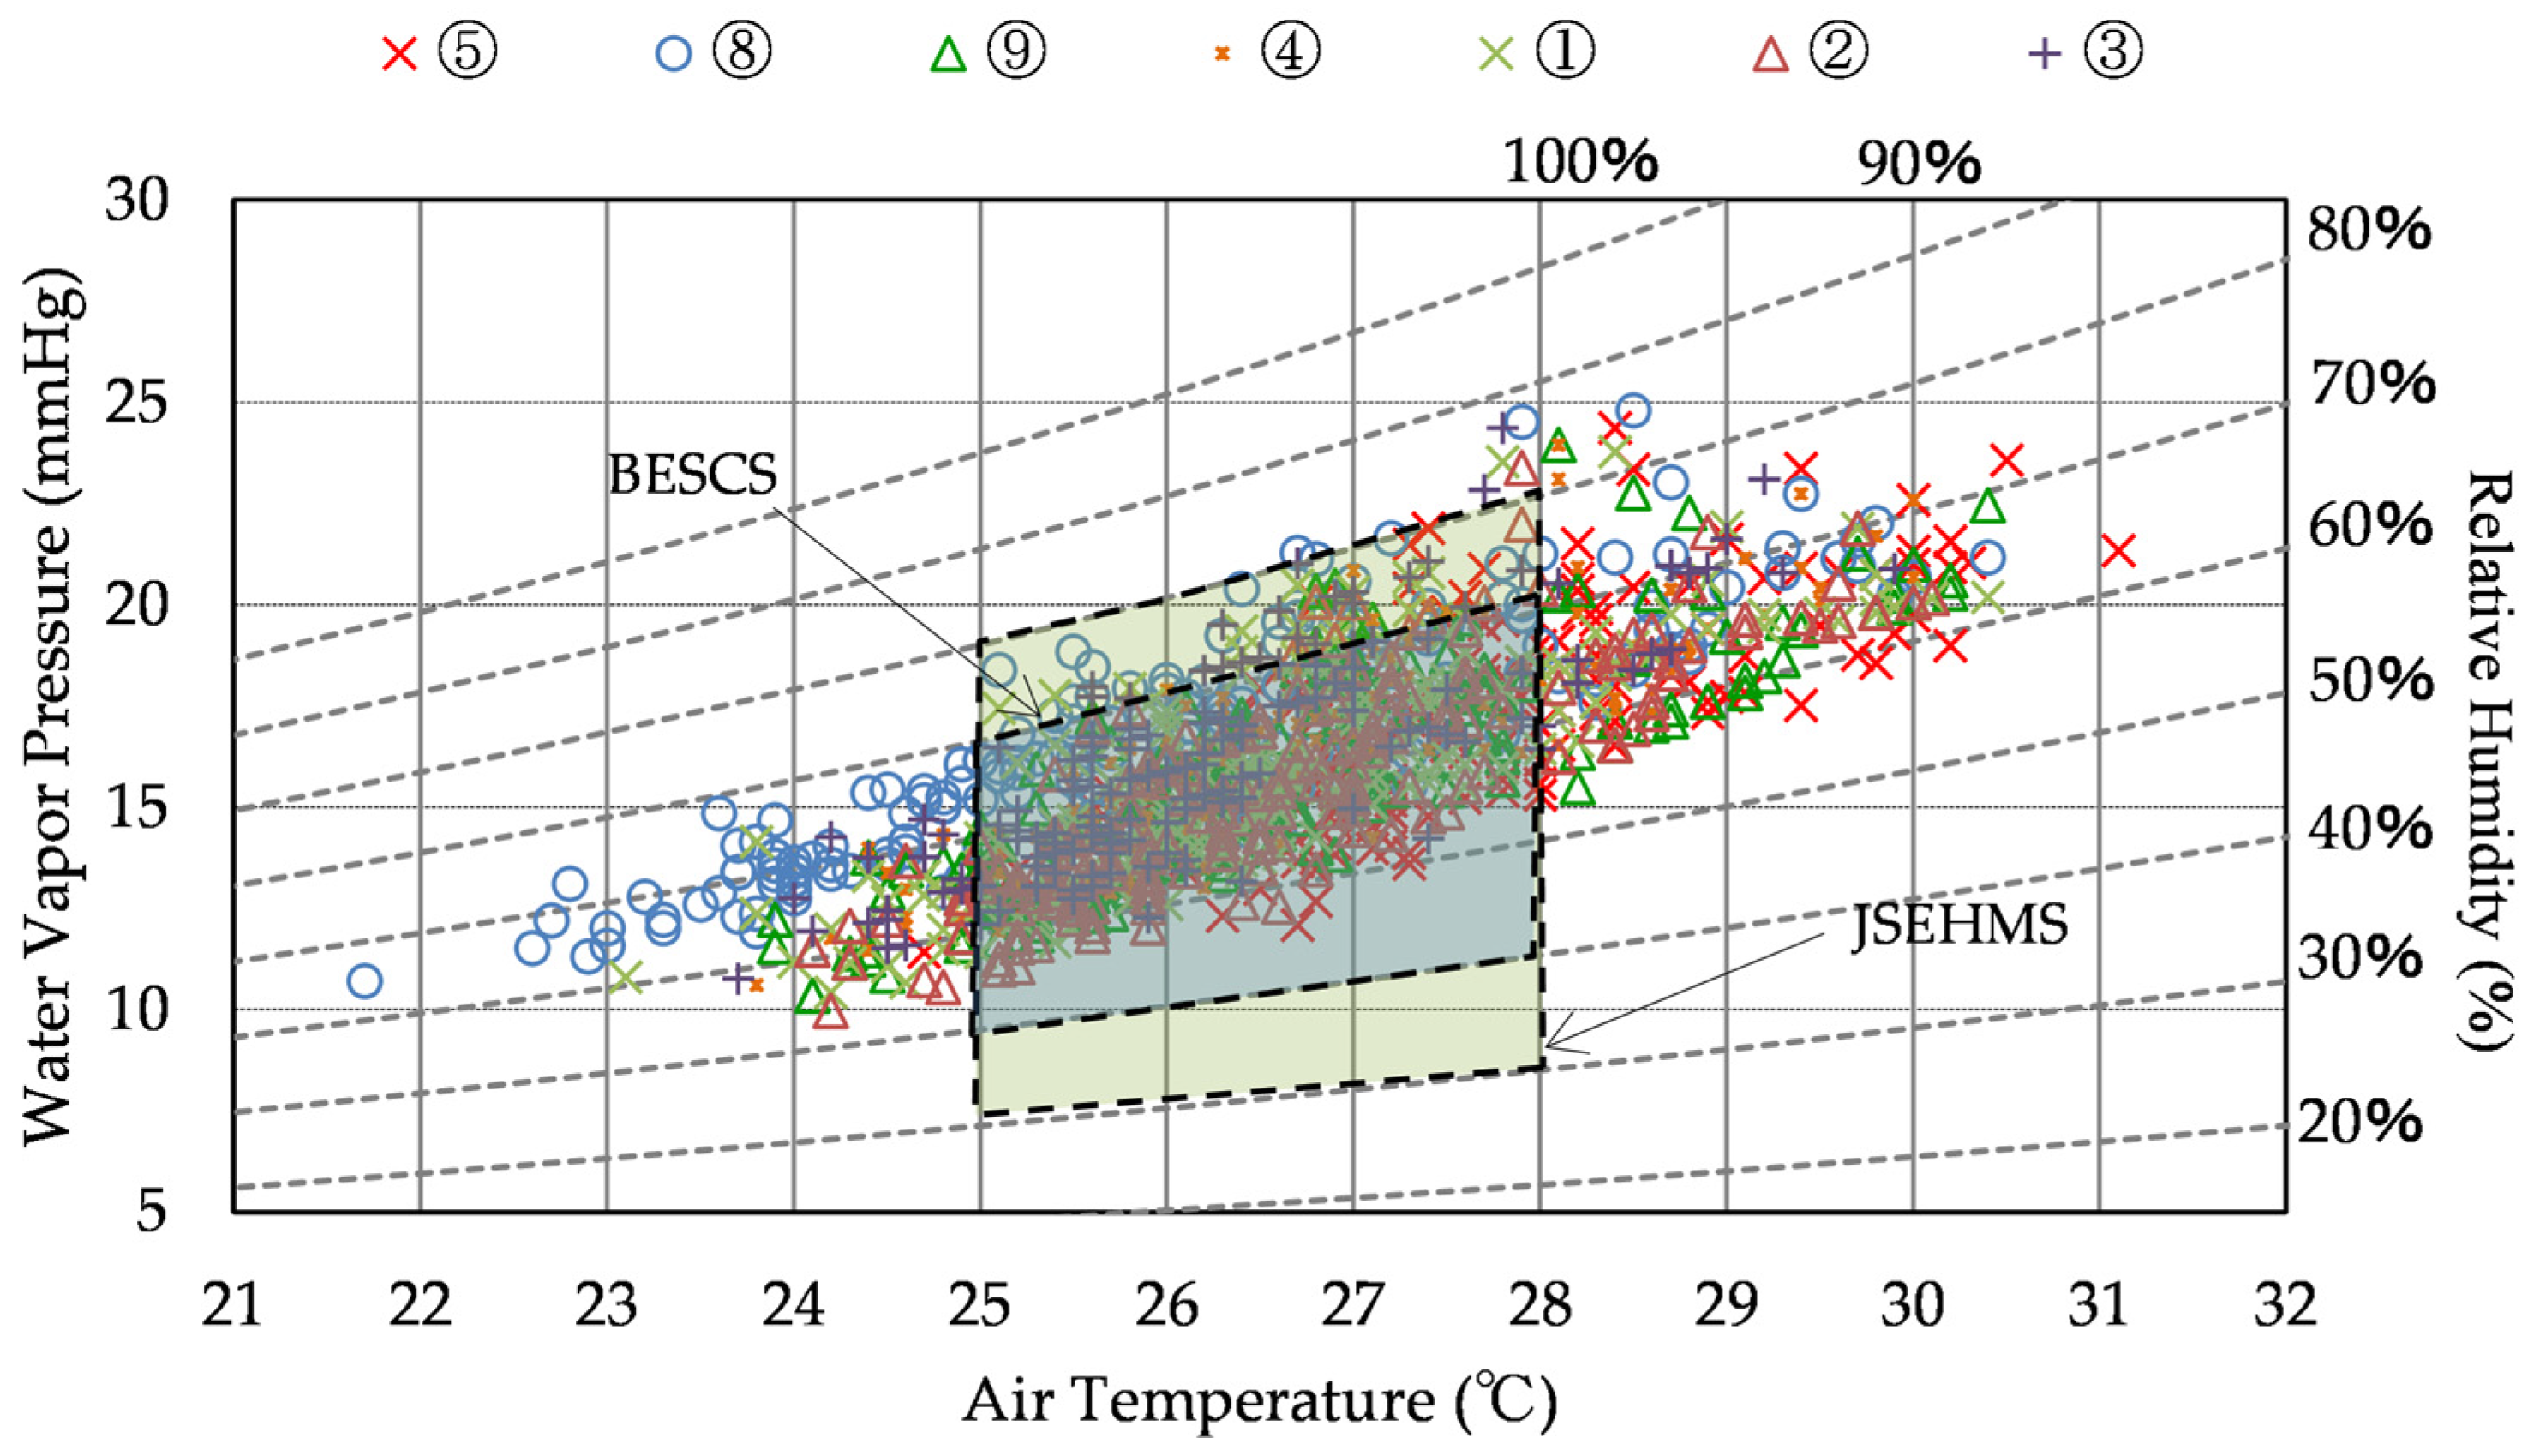
Figure 12.
Summer psychometric chart for class A.
Figure 12.
Summer psychometric chart for class A.
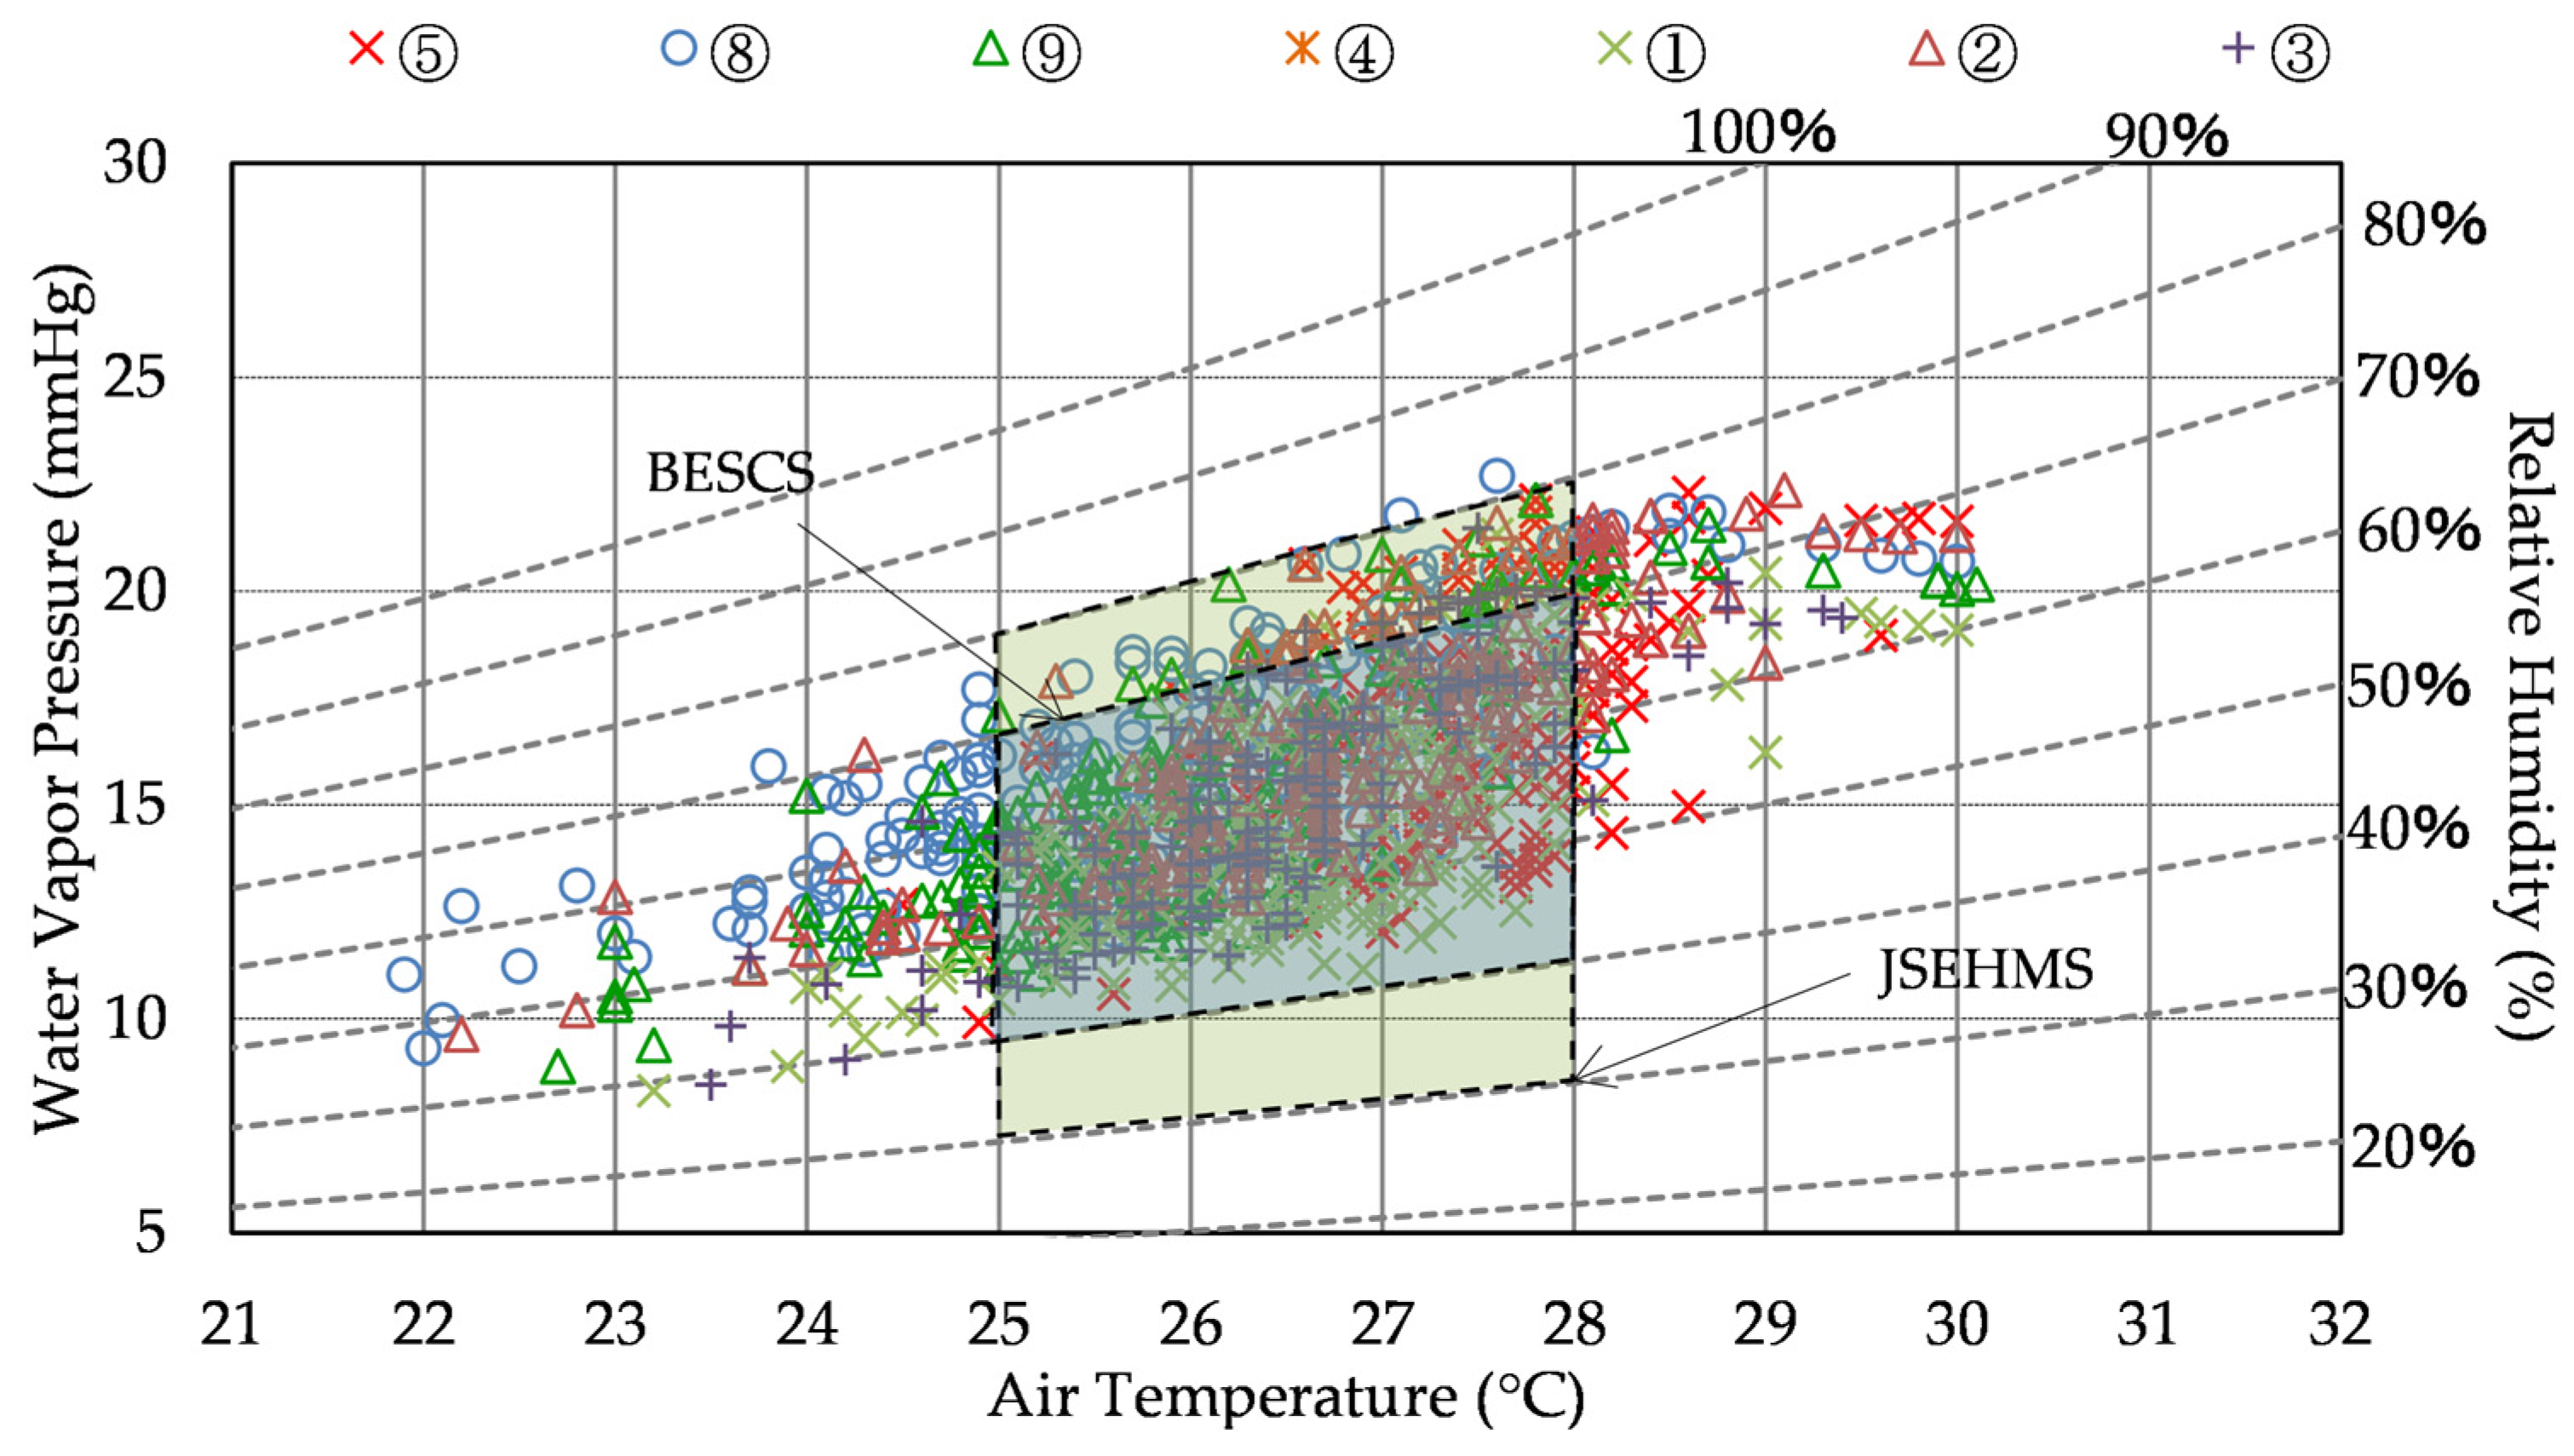
Figure 13.
Summer psychometric chart for class B.
Figure 13.
Summer psychometric chart for class B.
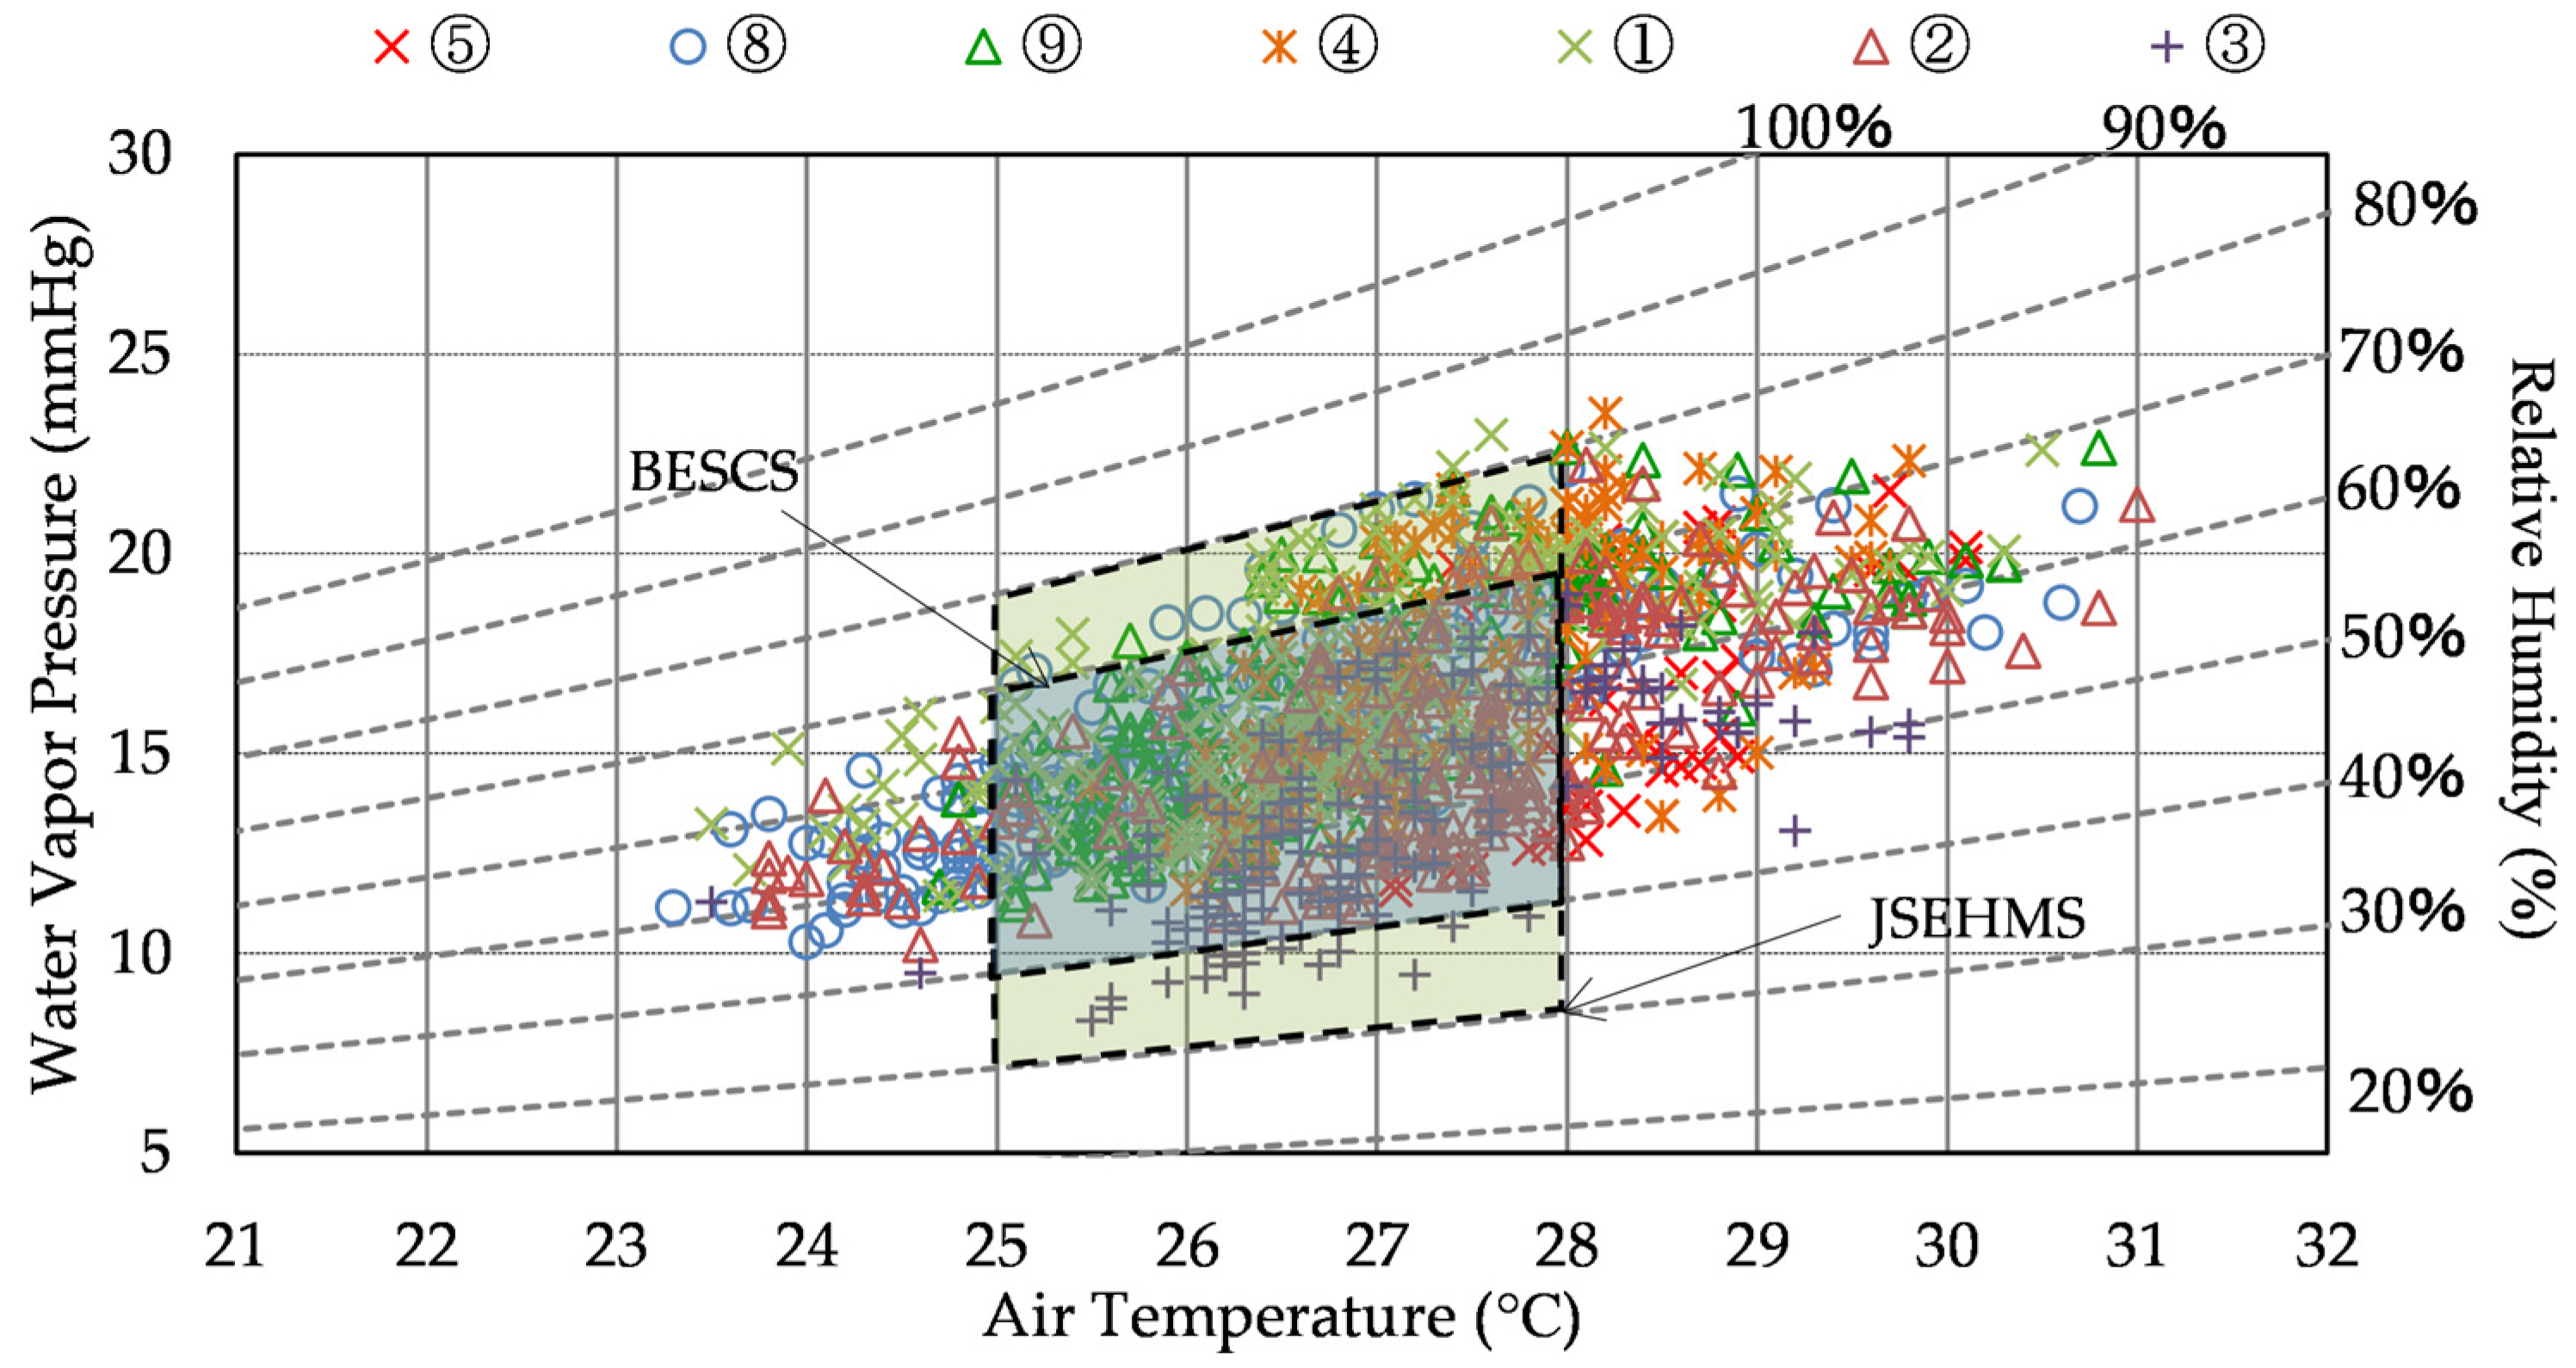
Figure 14.
Summer psychometric chart for class C.
Figure 14.
Summer psychometric chart for class C.
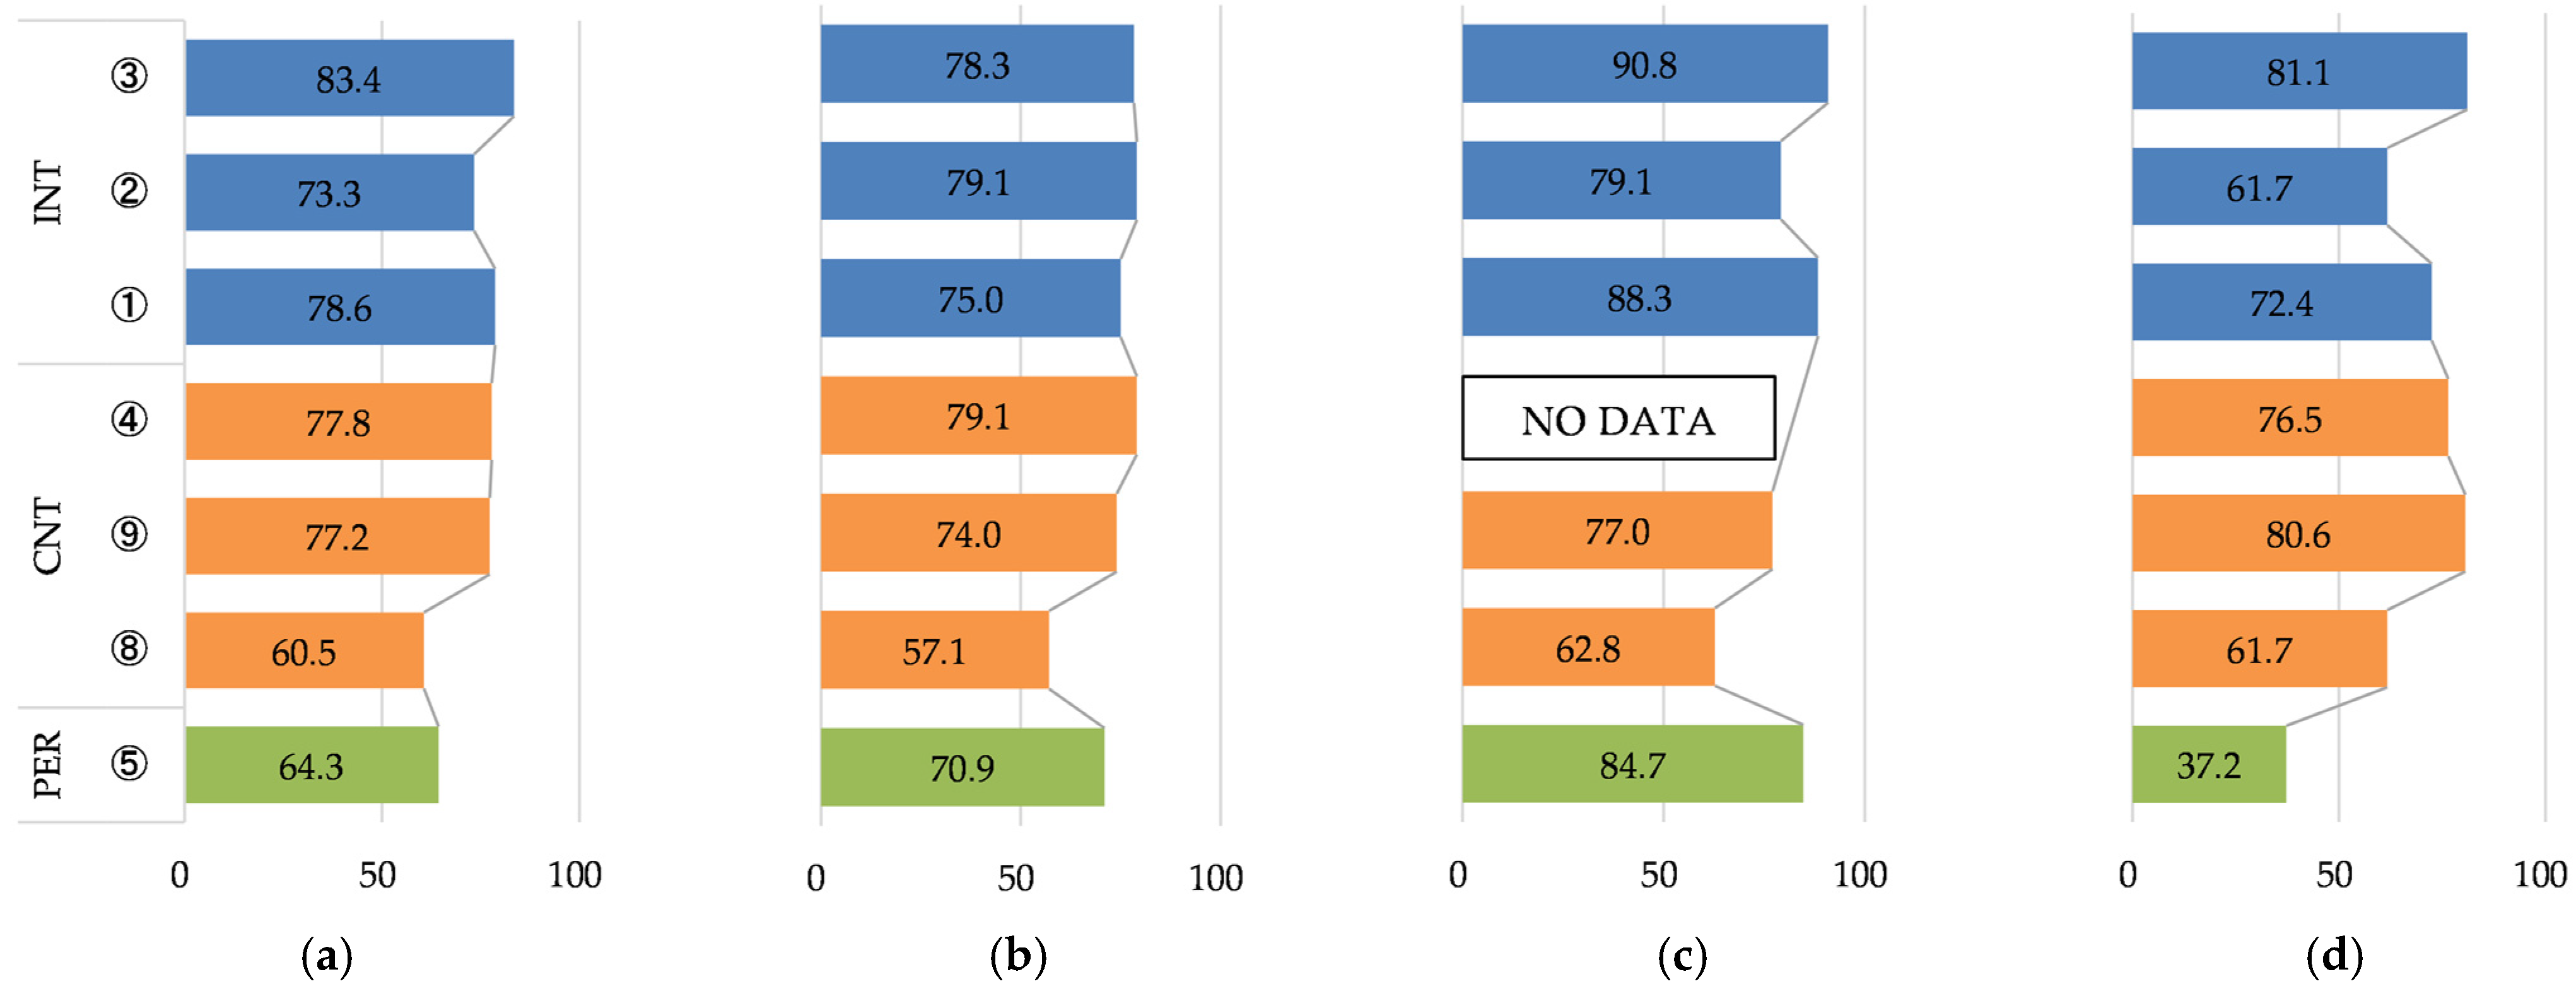
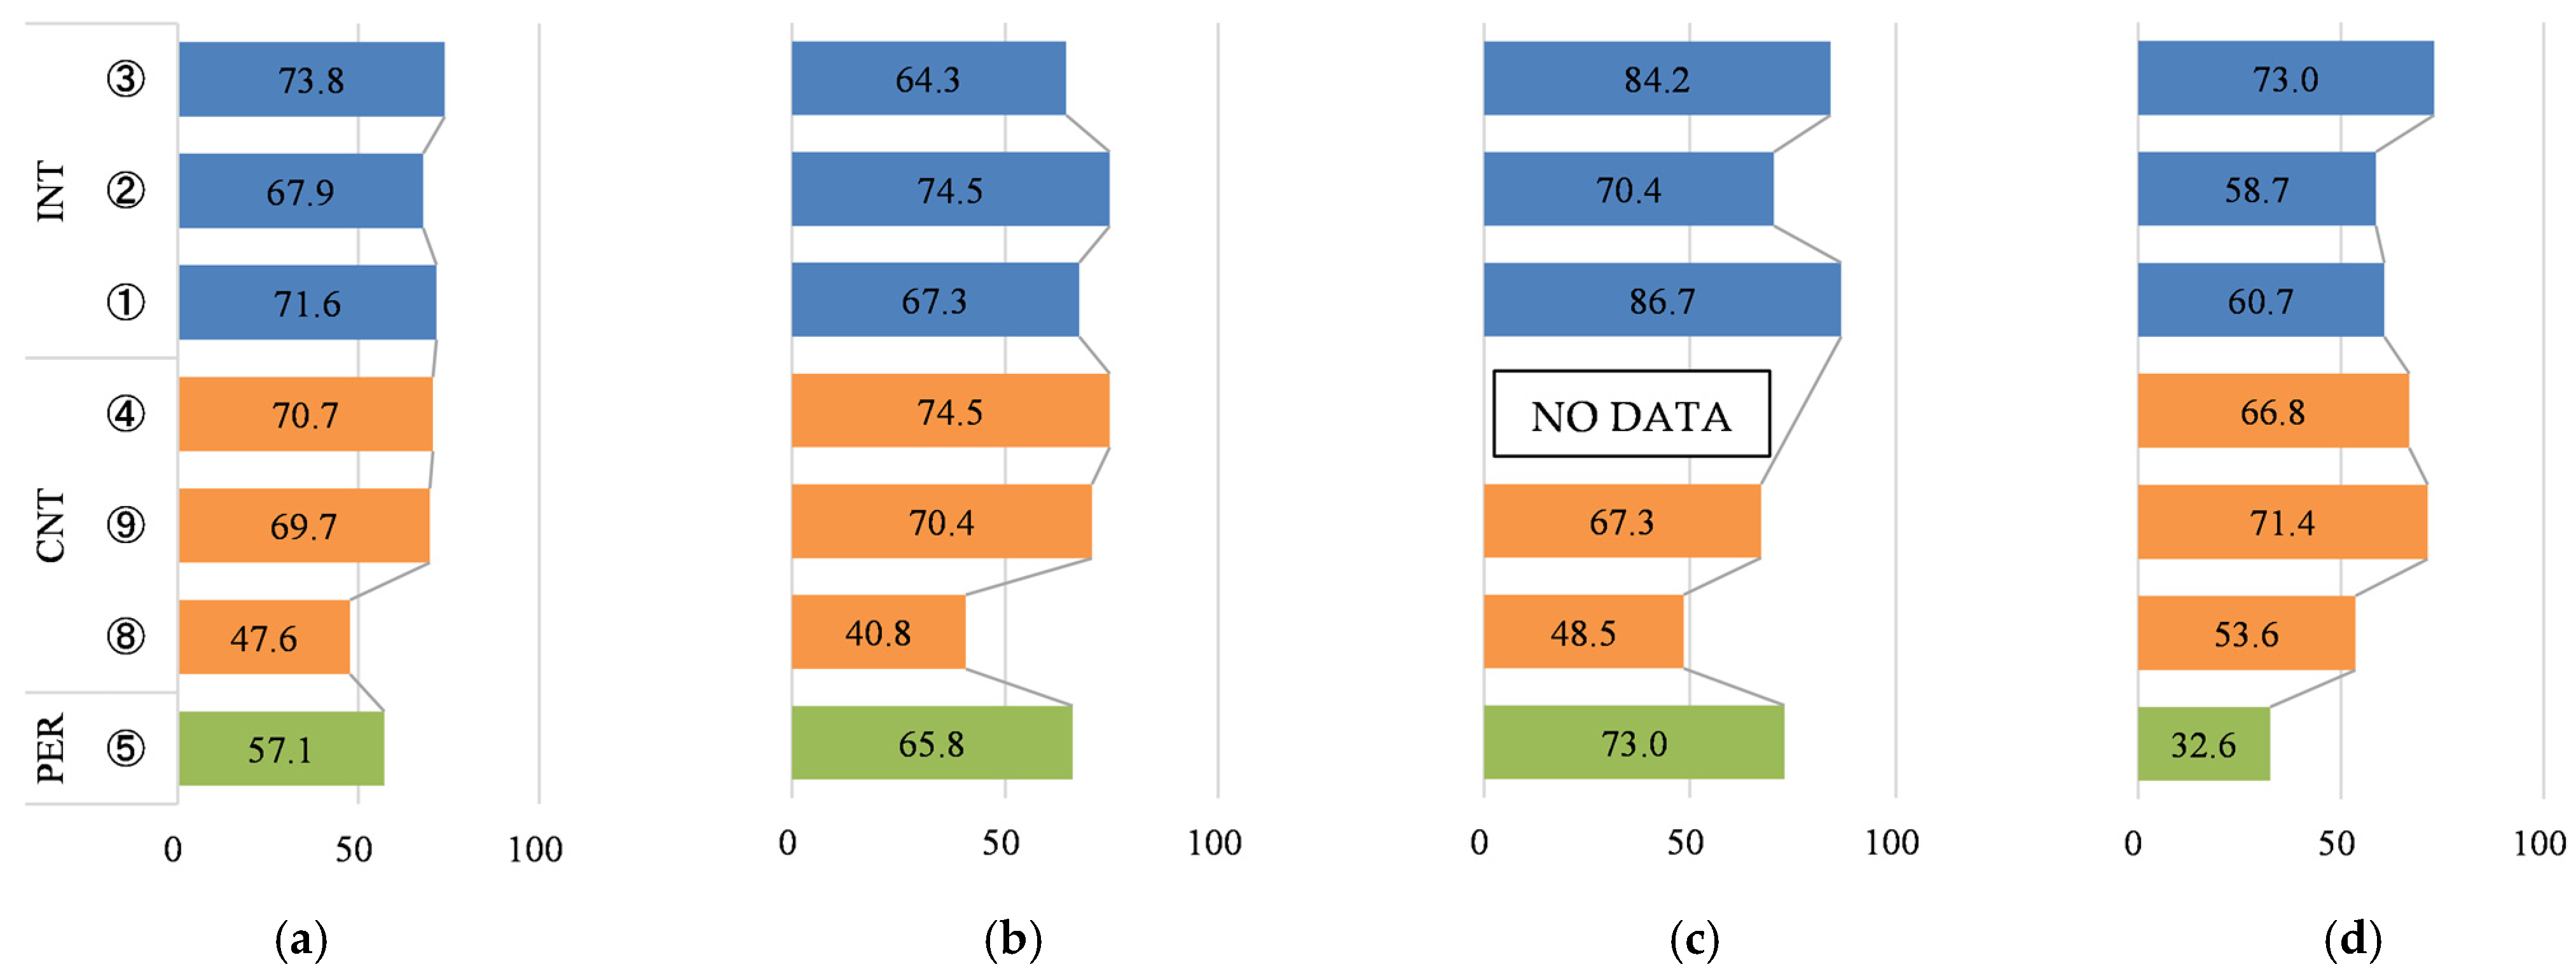
Figure 15.
Summer comfort range percentage based on the JSEHMS for the (a) total average and in (b) class A, (c) class B, and (d) class C.
Figure 15.
Summer comfort range percentage based on the JSEHMS for the (a) total average and in (b) class A, (c) class B, and (d) class C.
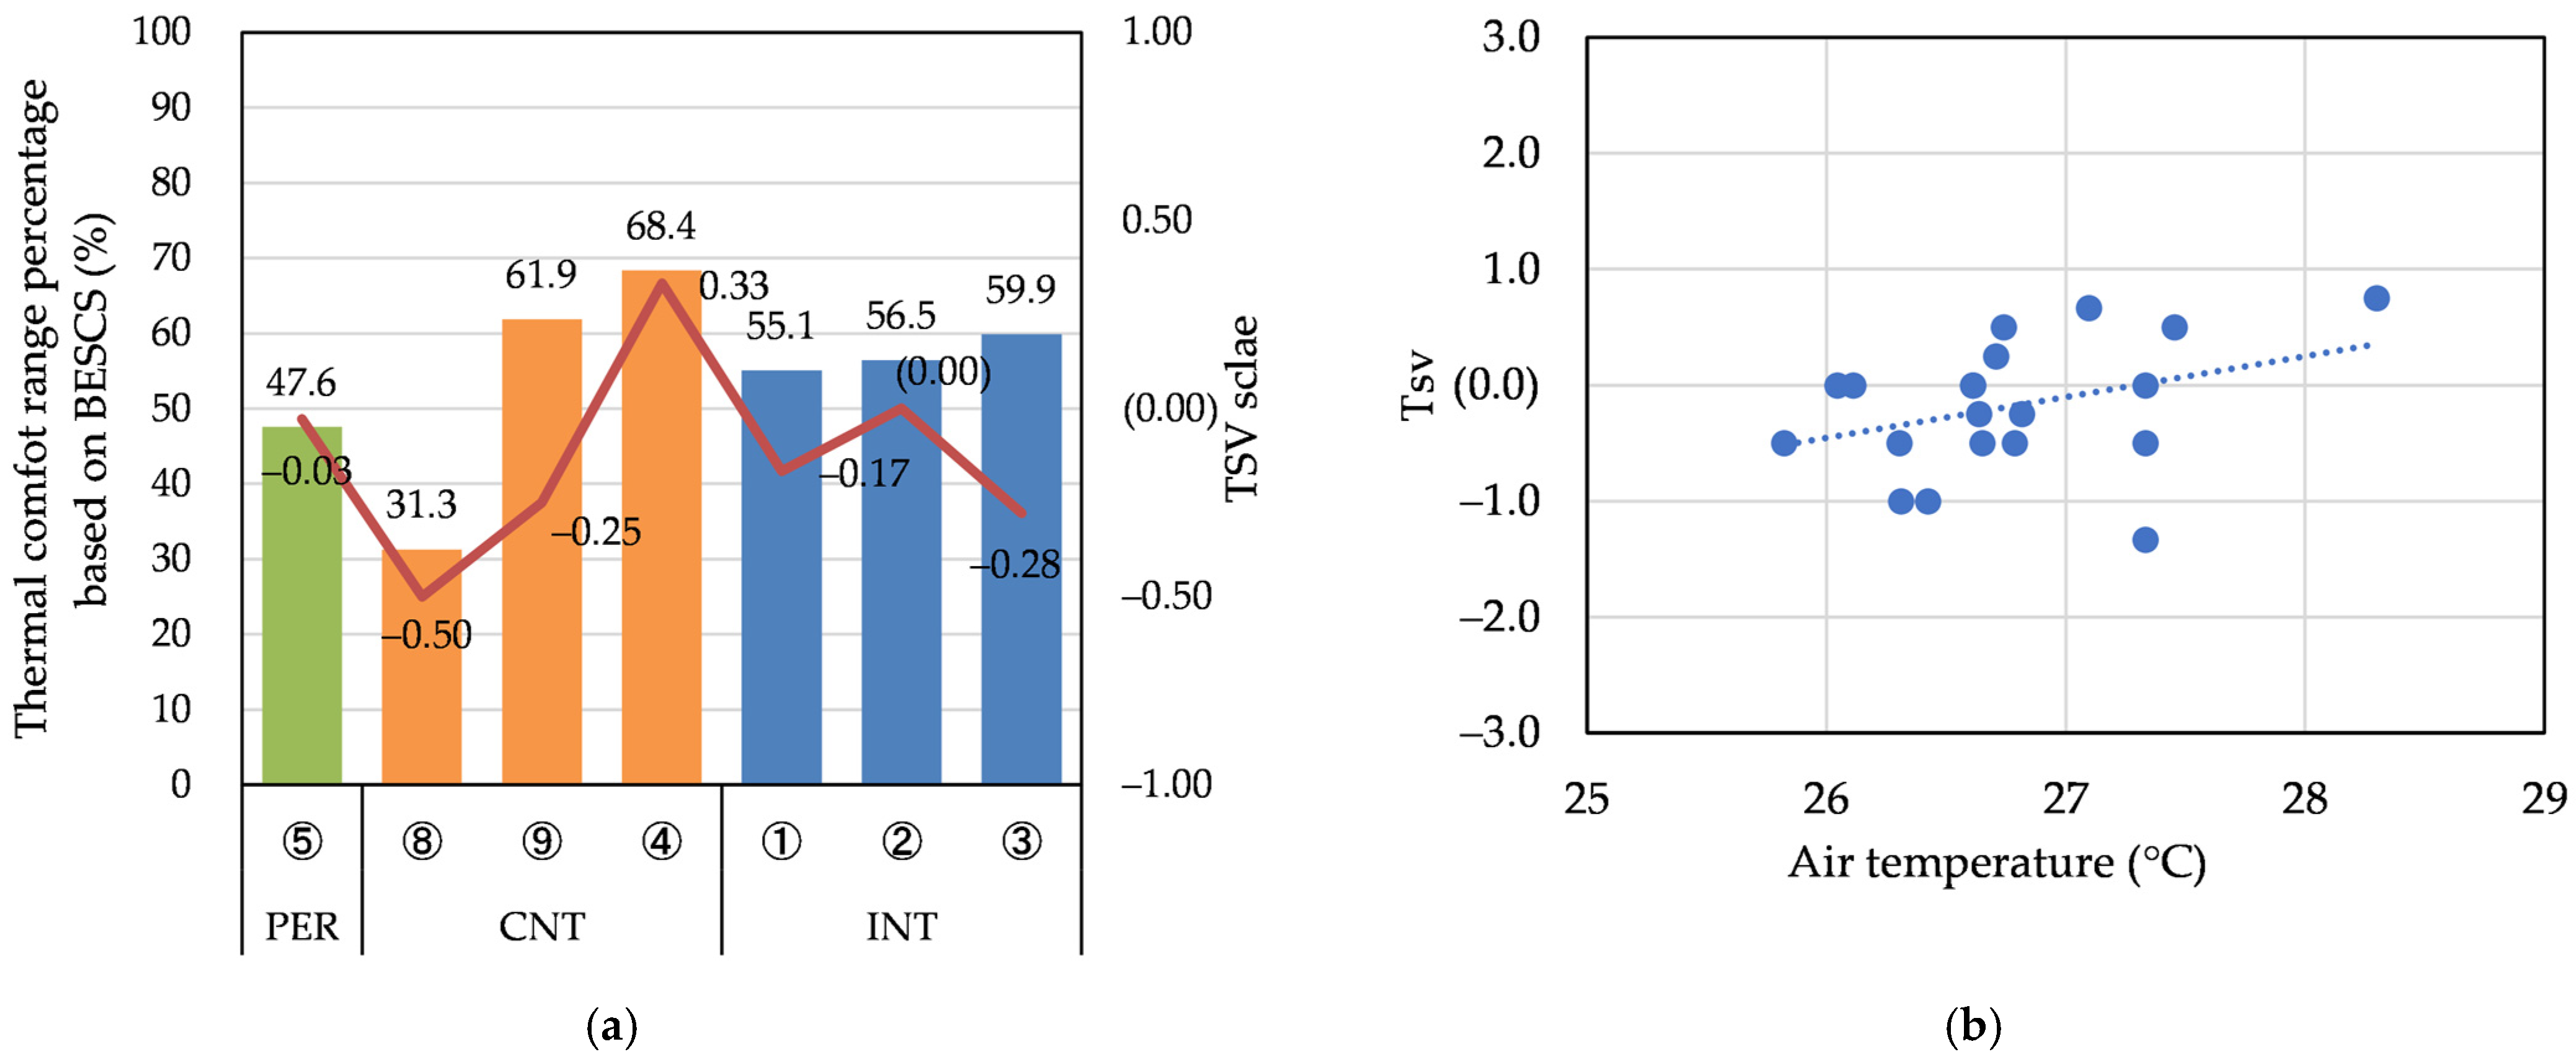
Figure 16.
Summer comfort range percentage based on the BESCS for the (a)total average and in (b) class A, (c) class B, and (d) class C.
Figure 16.
Summer comfort range percentage based on the BESCS for the (a)total average and in (b) class A, (c) class B, and (d) class C.
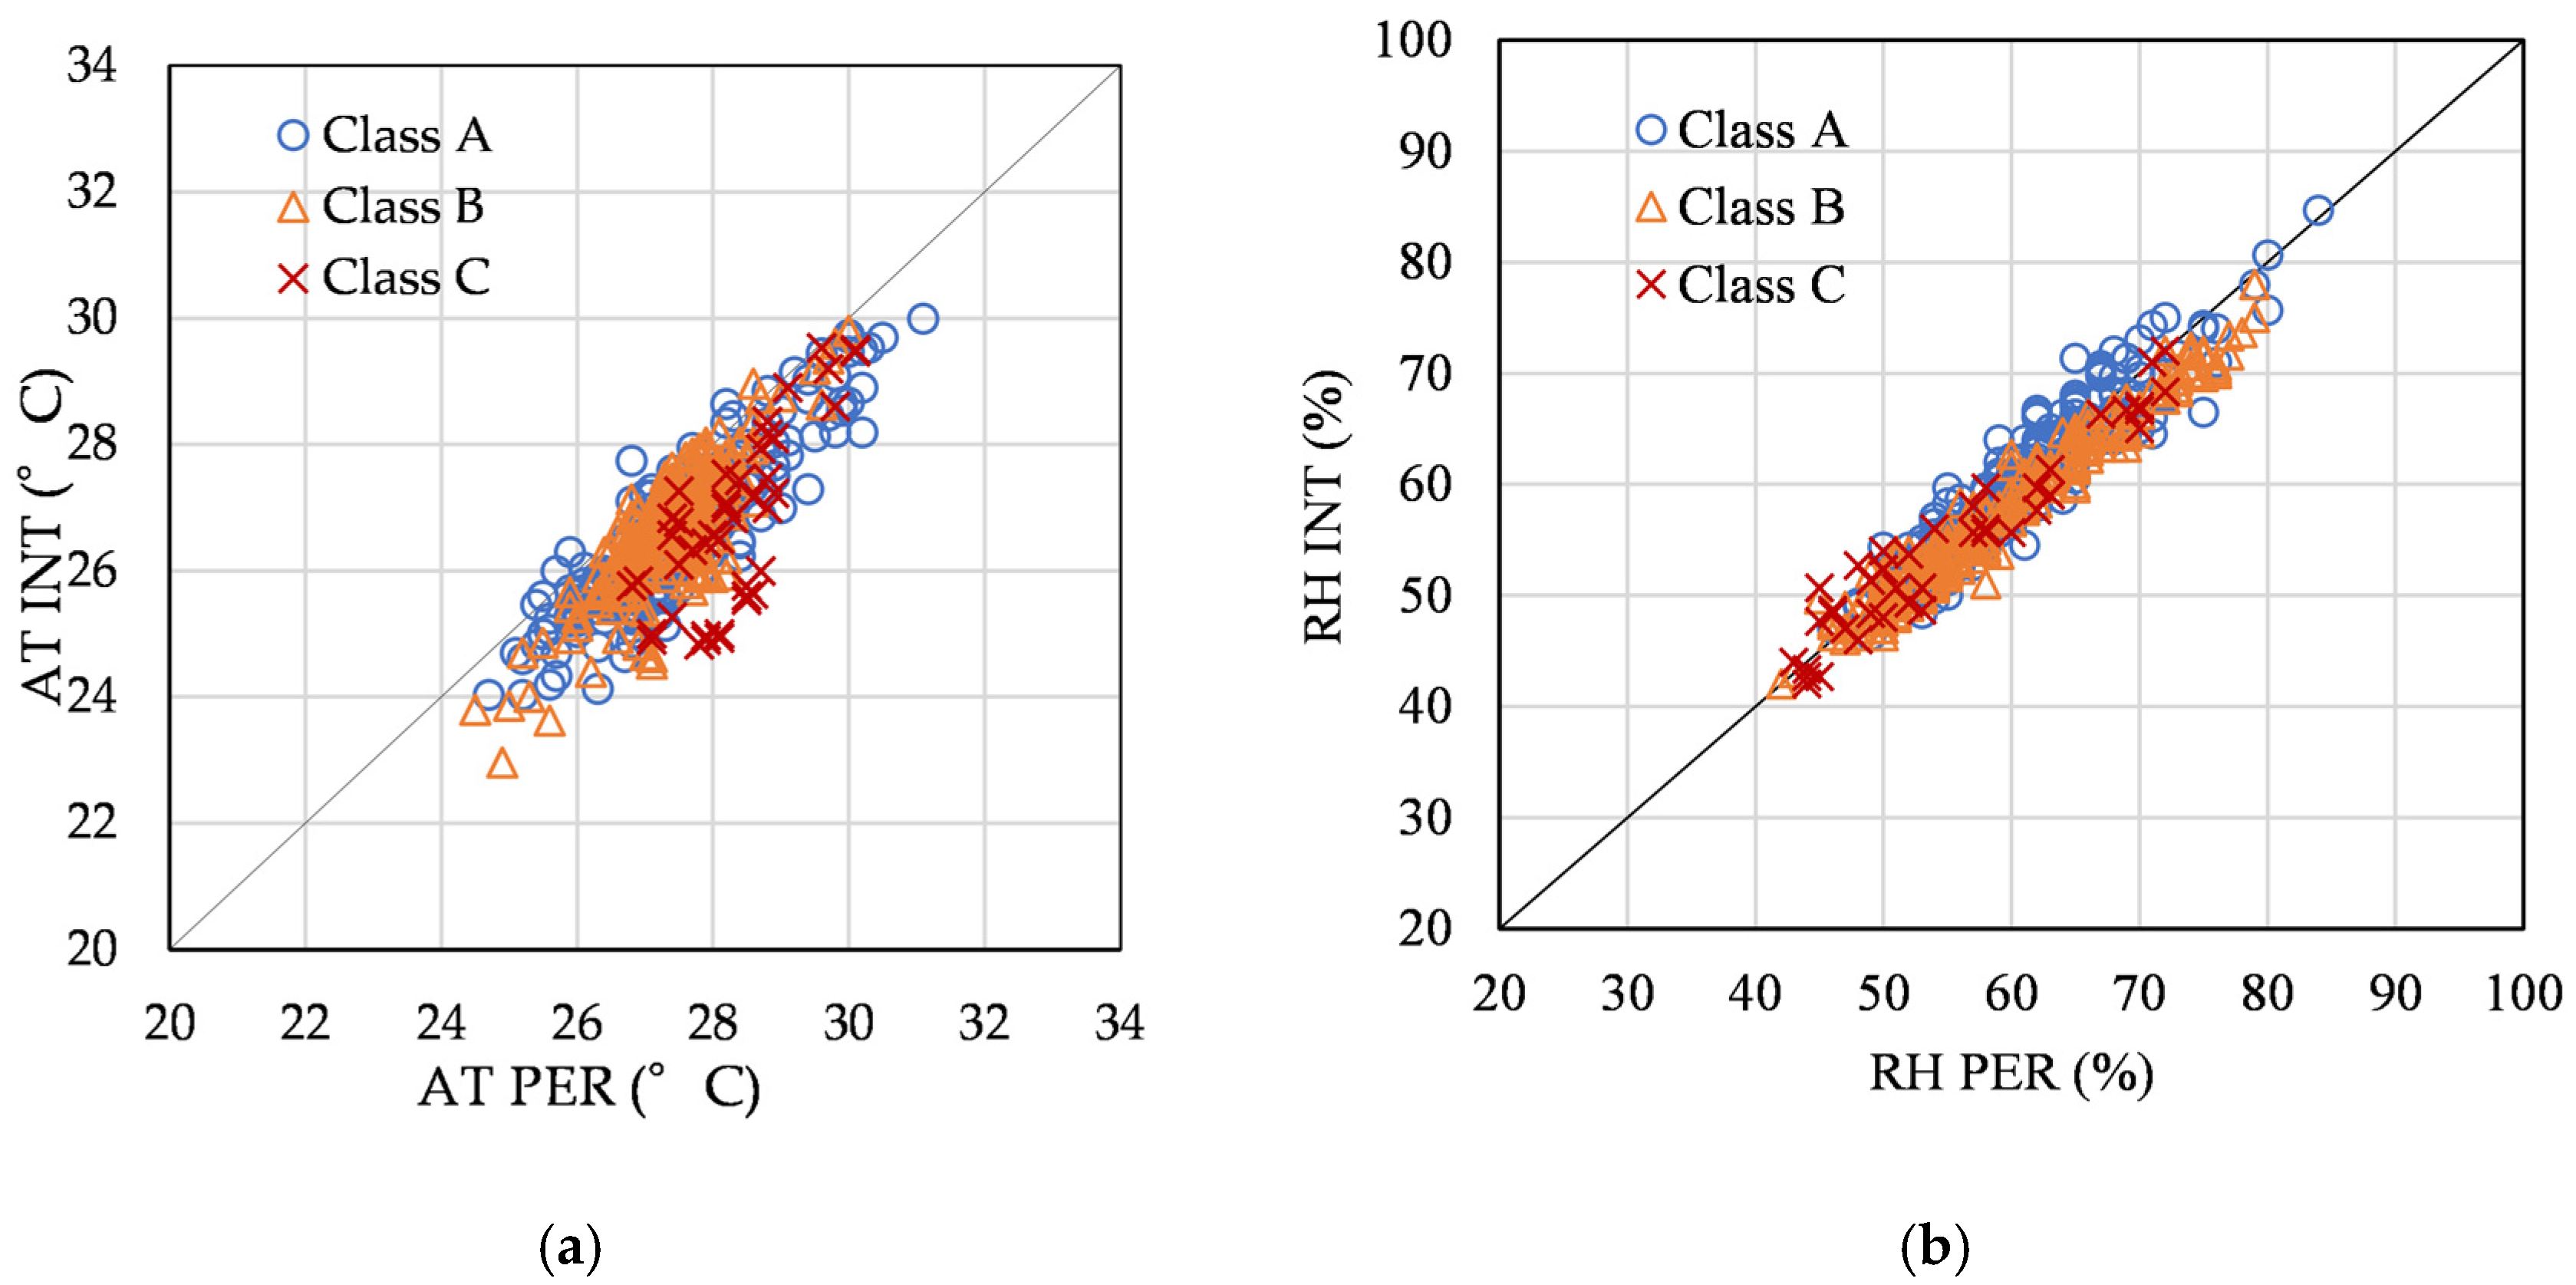
Figure 17.
PER and INT correlation for (a) air temperature and (b) relative humidity.
Figure 17.
PER and INT correlation for (a) air temperature and (b) relative humidity.
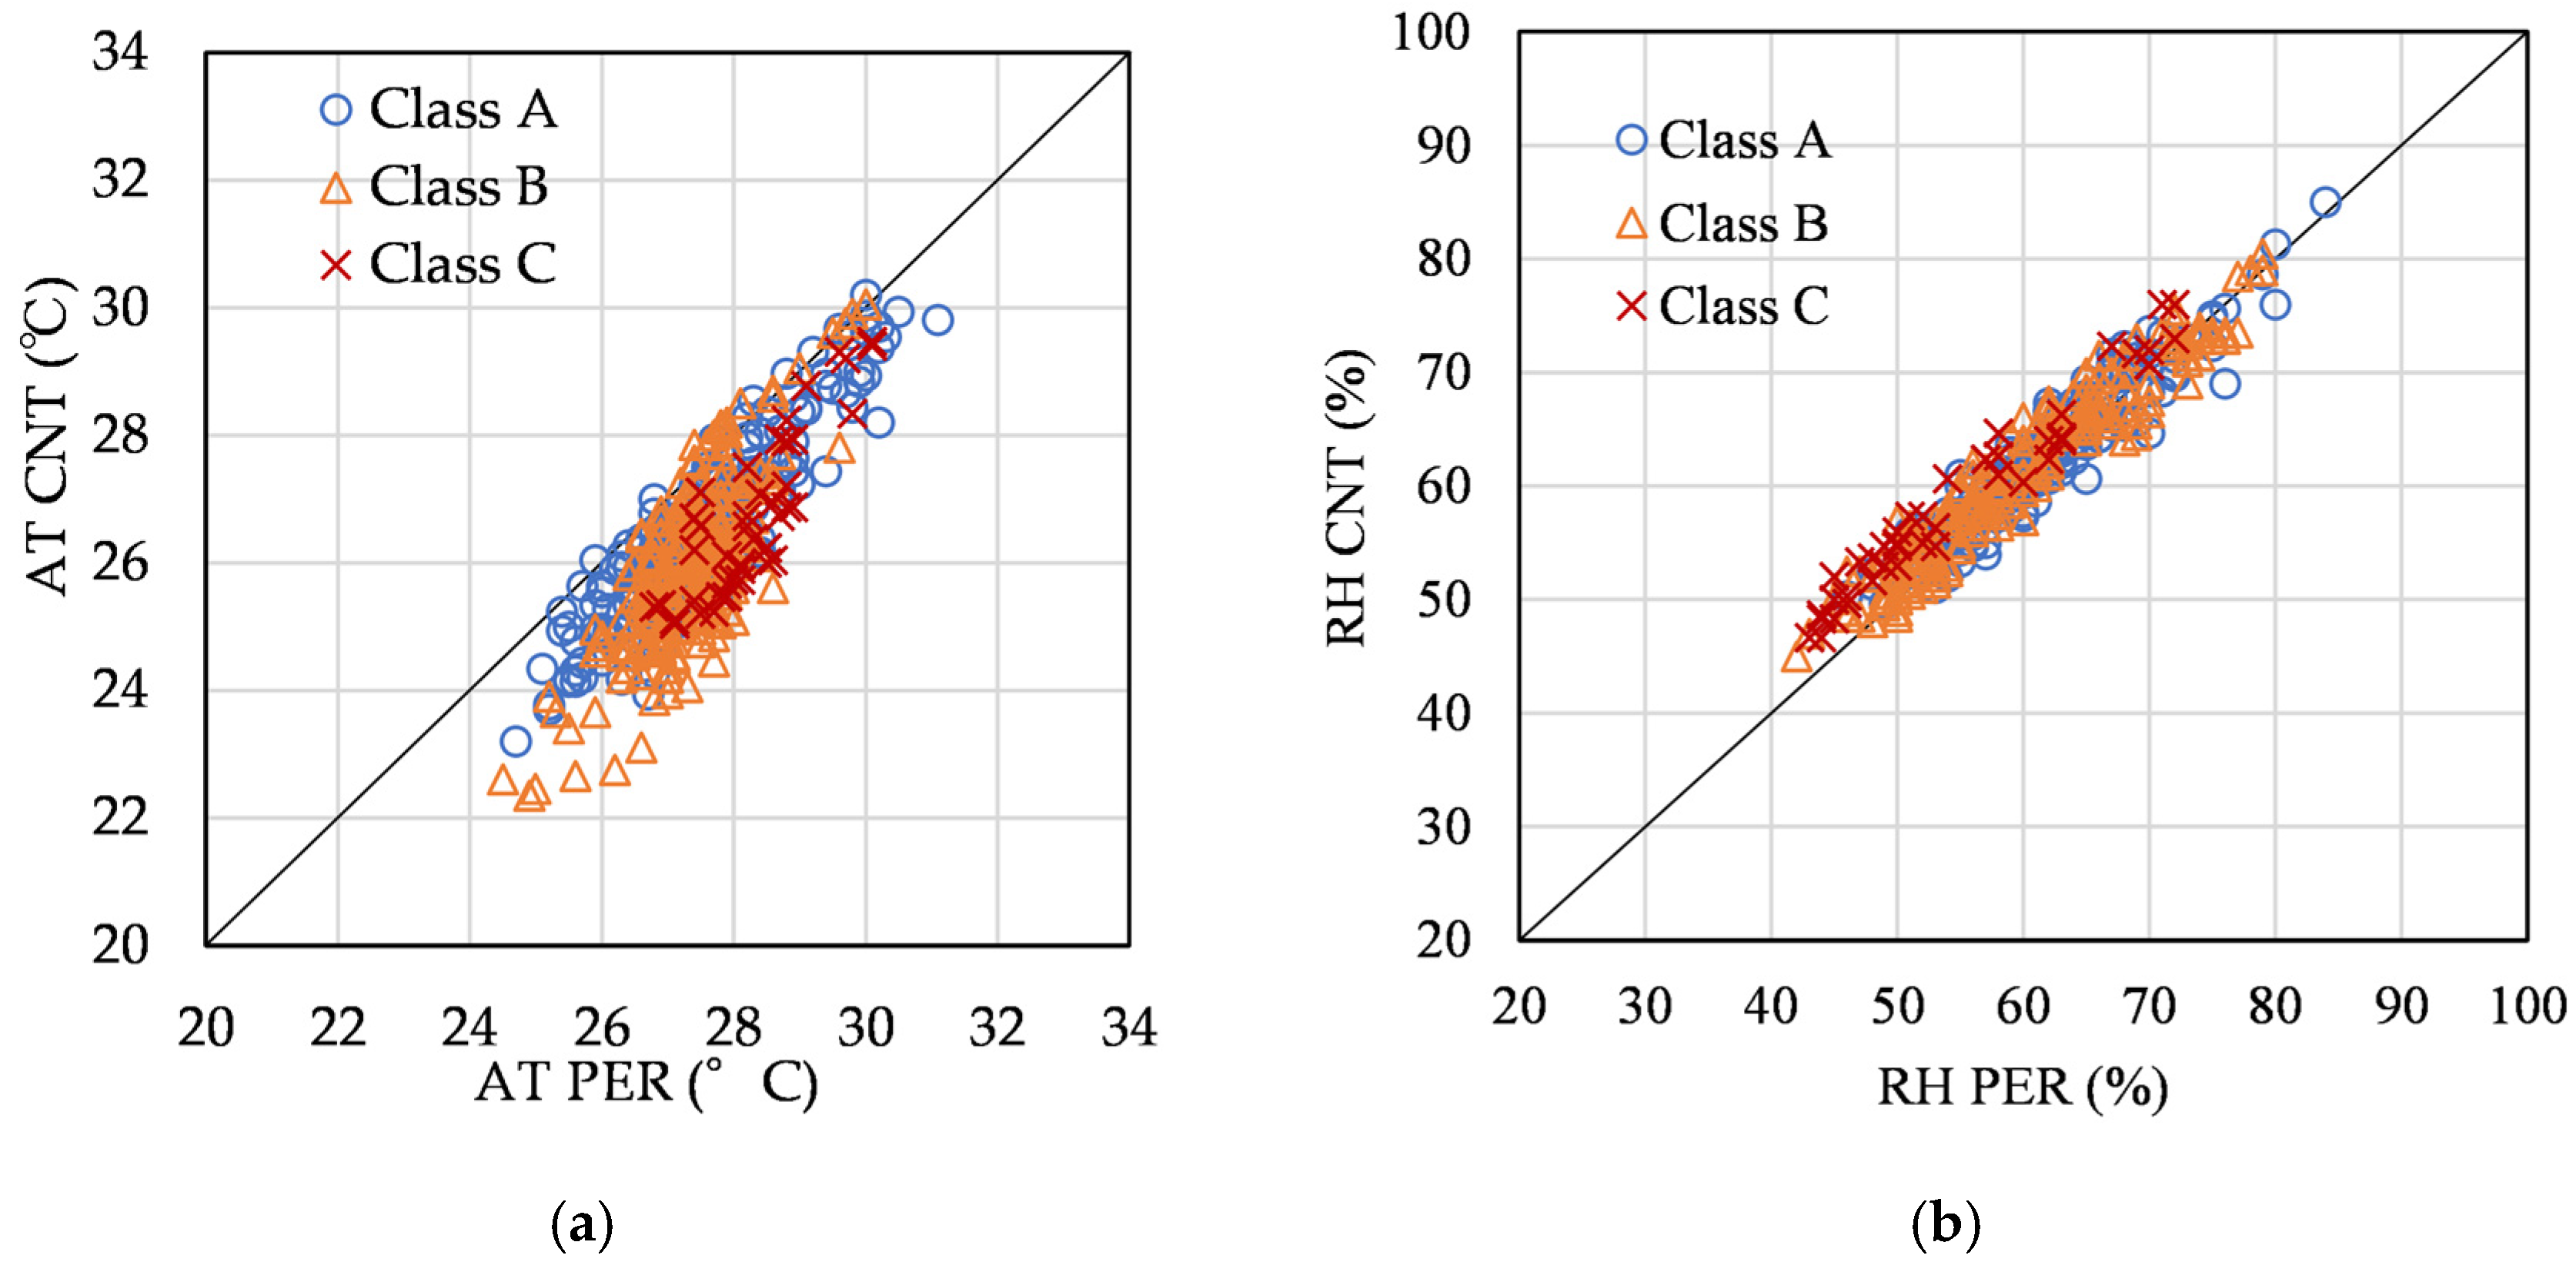
Figure 18.
PER and CNT correlation for (a) air temperature and (b) relative humidity.
Figure 18.
PER and CNT correlation for (a) air temperature and (b) relative humidity.
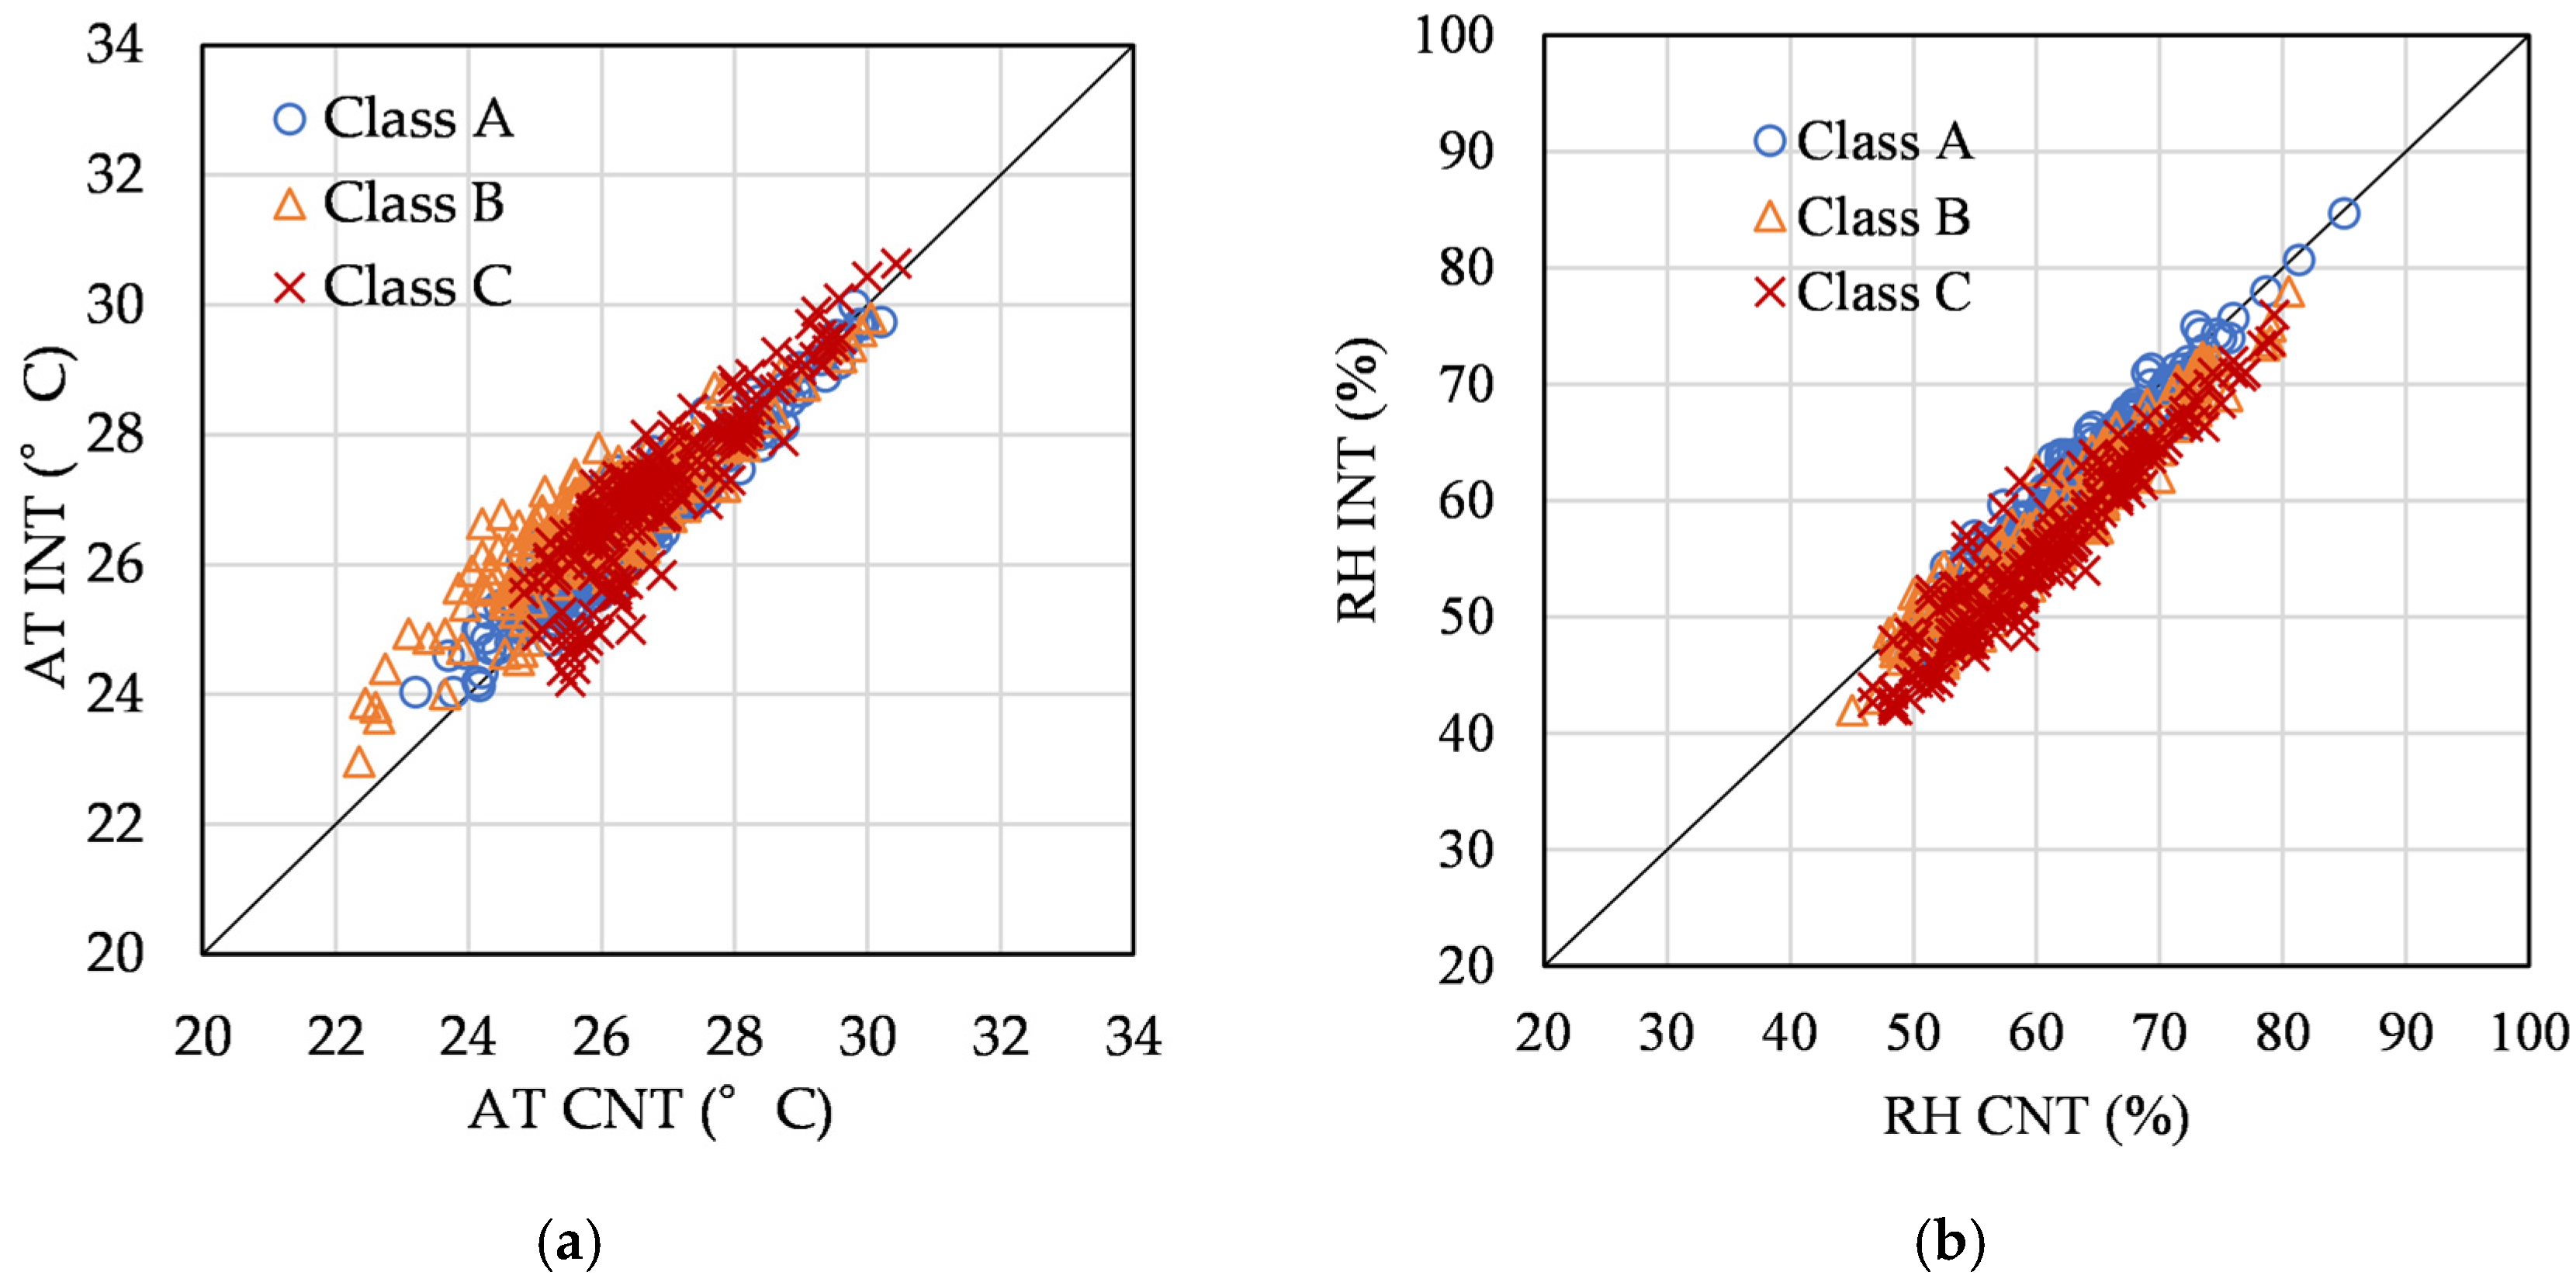
Figure 19.
CNT and INT correlation for (a) air temperature and (b) relative humidity.
Figure 19.
CNT and INT correlation for (a) air temperature and (b) relative humidity.
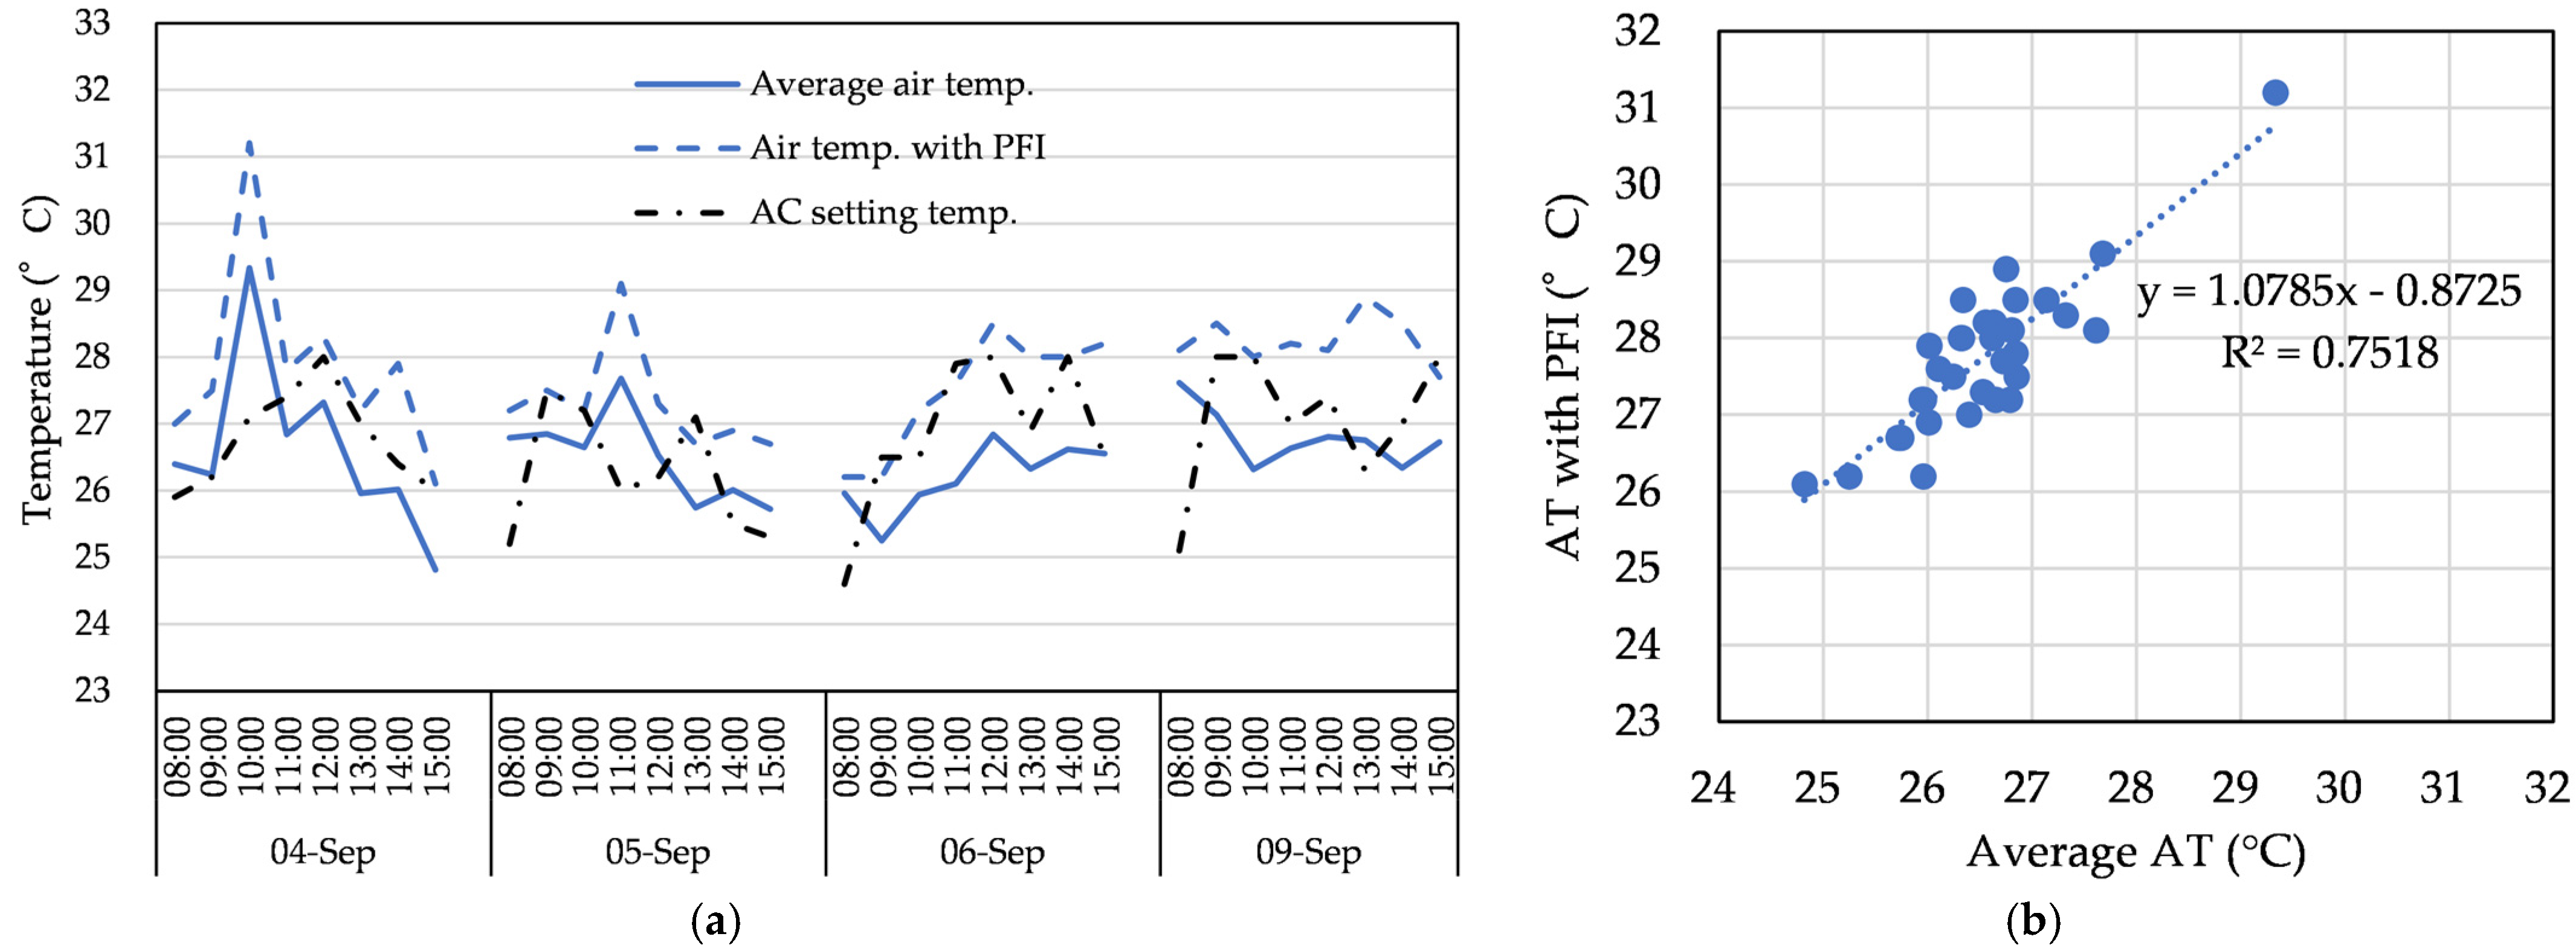
Figure 20.
Summer indoor air temperature and correlation for the (a) summer average AT, AT with PFI, AC setting temp. of class A and (b) summer AT, AT with PFI correlation of class A.
Figure 20.
Summer indoor air temperature and correlation for the (a) summer average AT, AT with PFI, AC setting temp. of class A and (b) summer AT, AT with PFI correlation of class A.
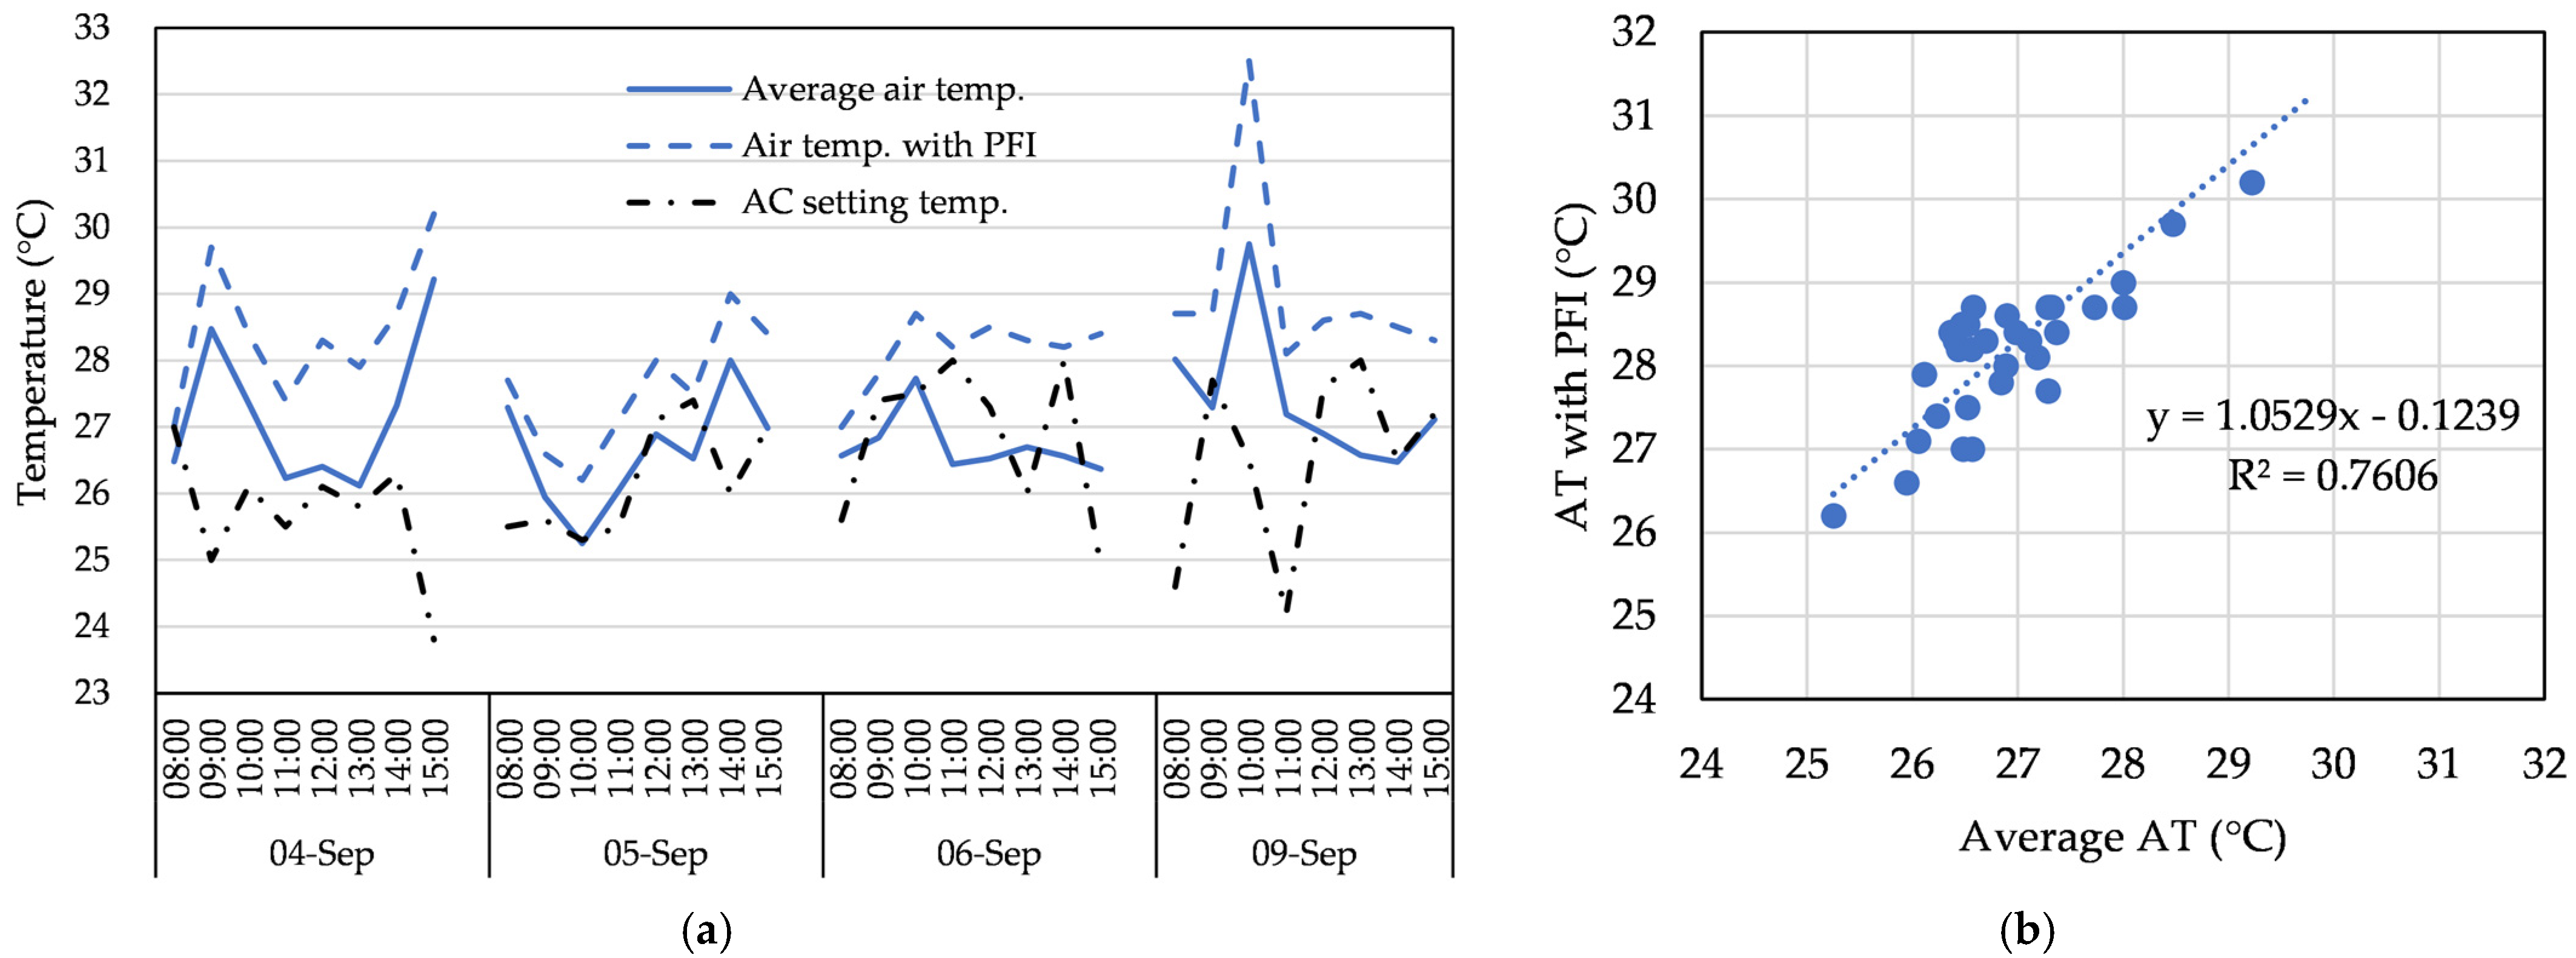
Figure 21.
Summer indoor air temperature and correlation for the (a) summer average AT, AT with PFI, AC setting temp. of class A and (b) summer AT, AT with PFI correlation of class B.
Figure 21.
Summer indoor air temperature and correlation for the (a) summer average AT, AT with PFI, AC setting temp. of class A and (b) summer AT, AT with PFI correlation of class B.
Figure 22.
Summer indoor air temperature and correlation for the (a) summer average AT, AT with PFI, AC setting temp. of class A and (b) summer AT, AT with PFI correlation of class C.
Figure 22.
Summer indoor air temperature and correlation for the (a) summer average AT, AT with PFI, AC setting temp. of class A and (b) summer AT, AT with PFI correlation of class C.
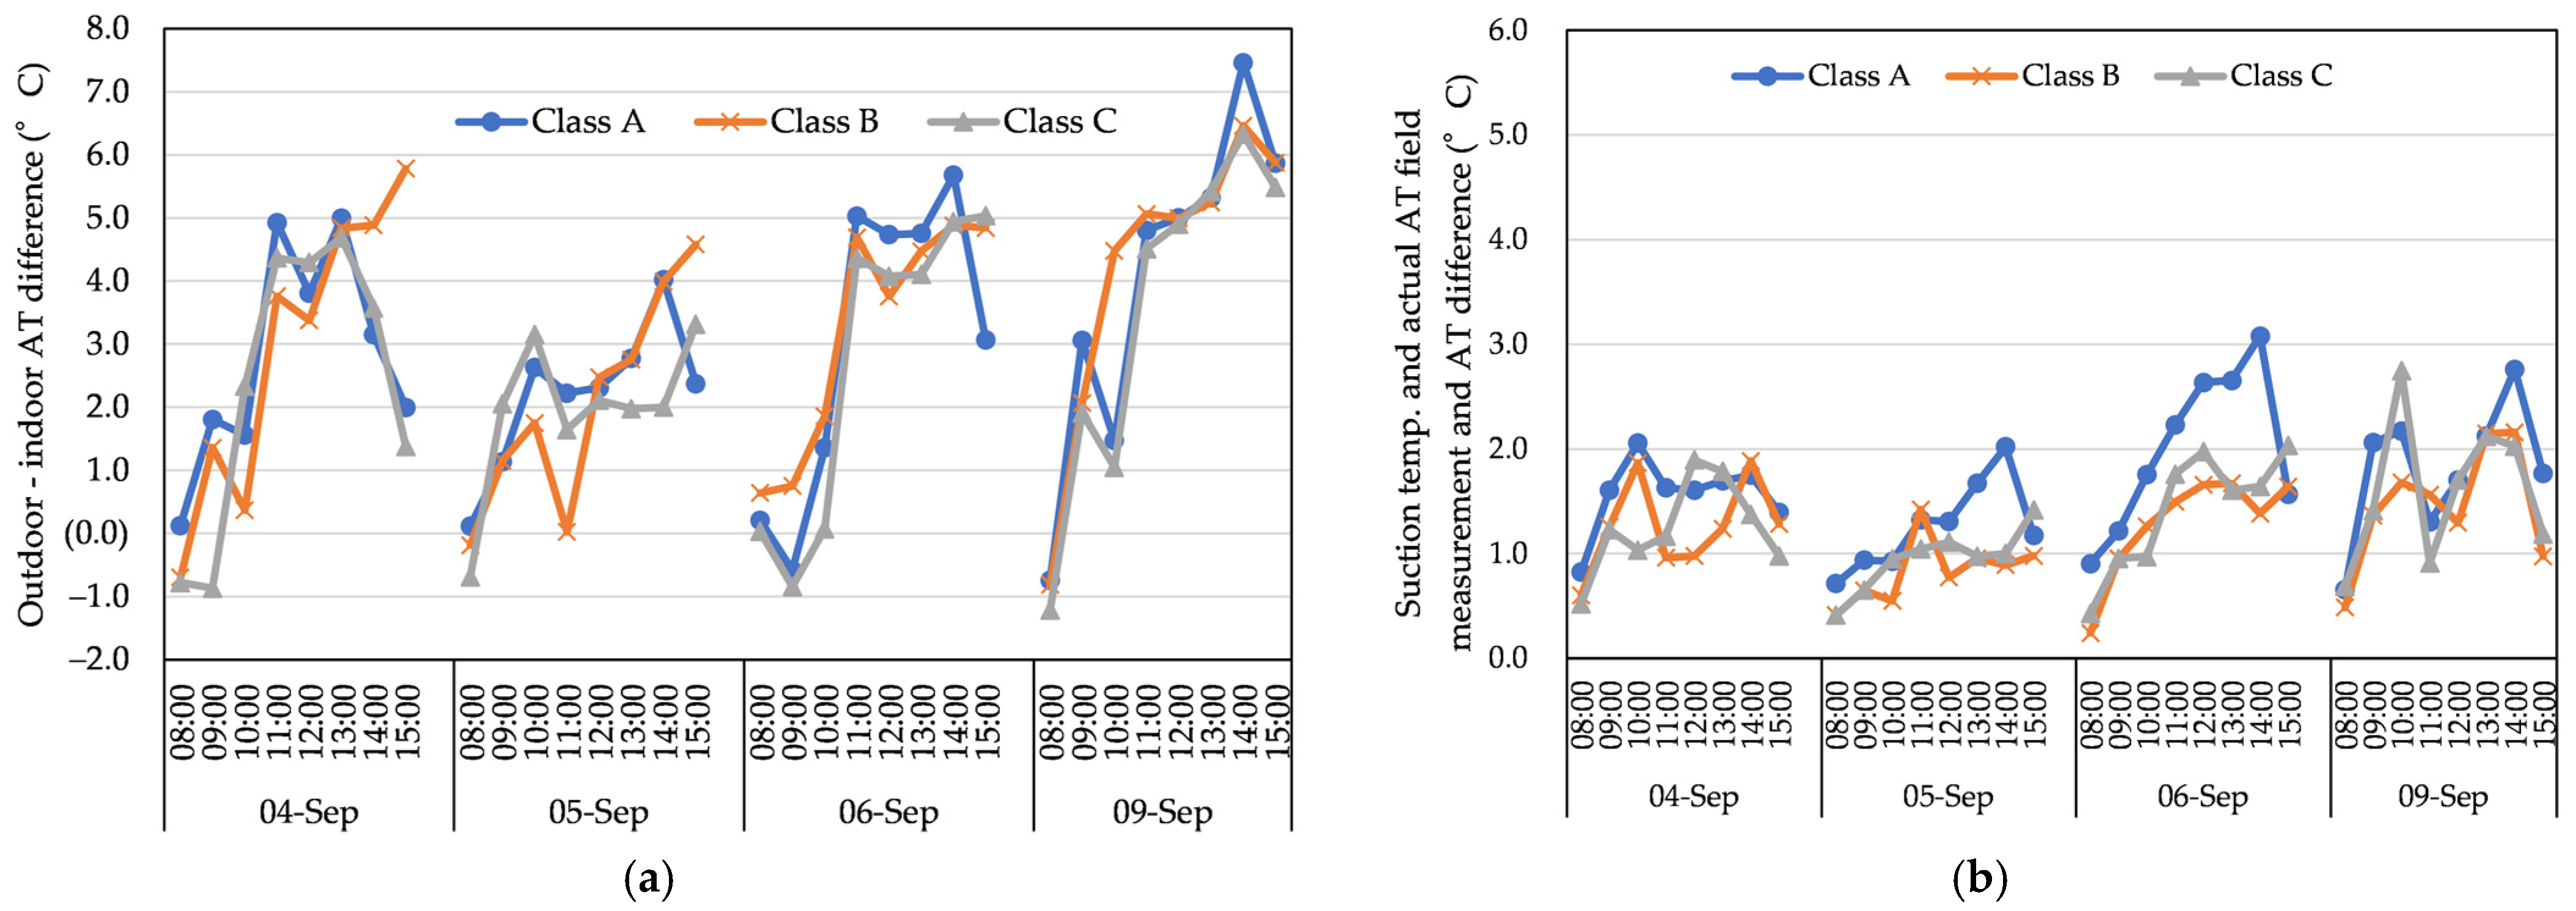
Figure 23.
AT differences. (a) AT difference between outdoor and indoor AT. (b) AT difference between actual air temperature field measurement data and air temperature data collected with the PFI method in the summer season.
Figure 23.
AT differences. (a) AT difference between outdoor and indoor AT. (b) AT difference between actual air temperature field measurement data and air temperature data collected with the PFI method in the summer season.
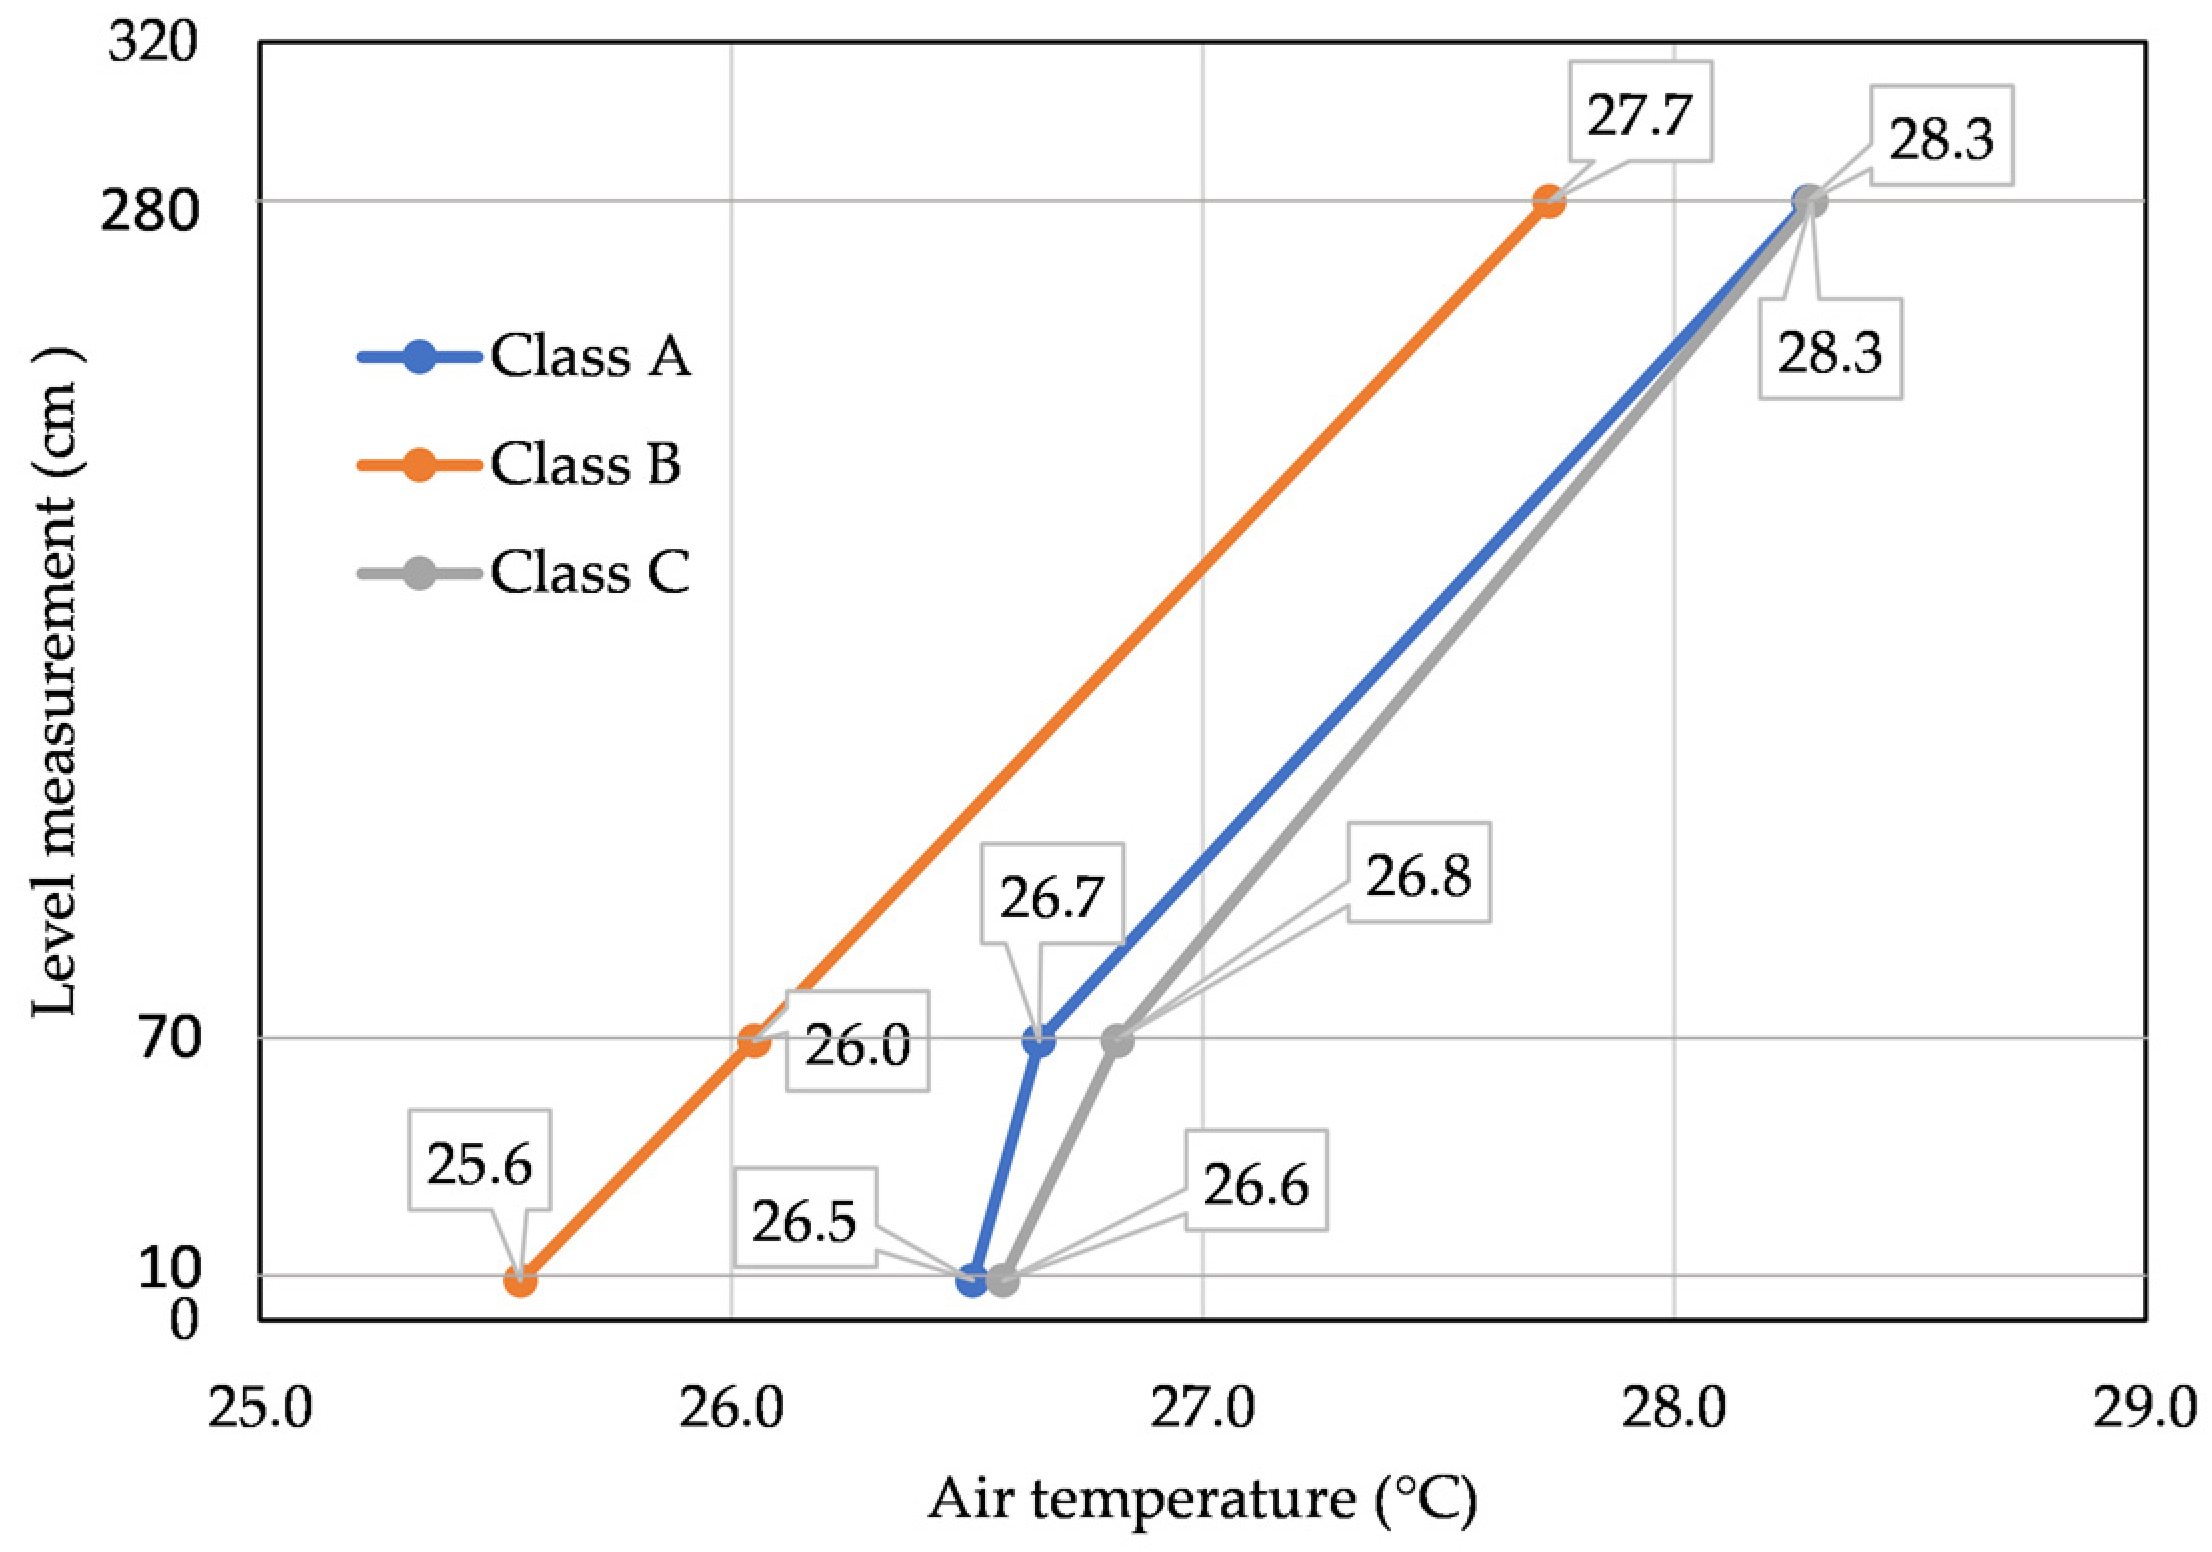
Figure 24.
Average air temperature distribution per level measurement (10 cm, 70 cm, and 280 cm) in each classroom.
Figure 24.
Average air temperature distribution per level measurement (10 cm, 70 cm, and 280 cm) in each classroom.
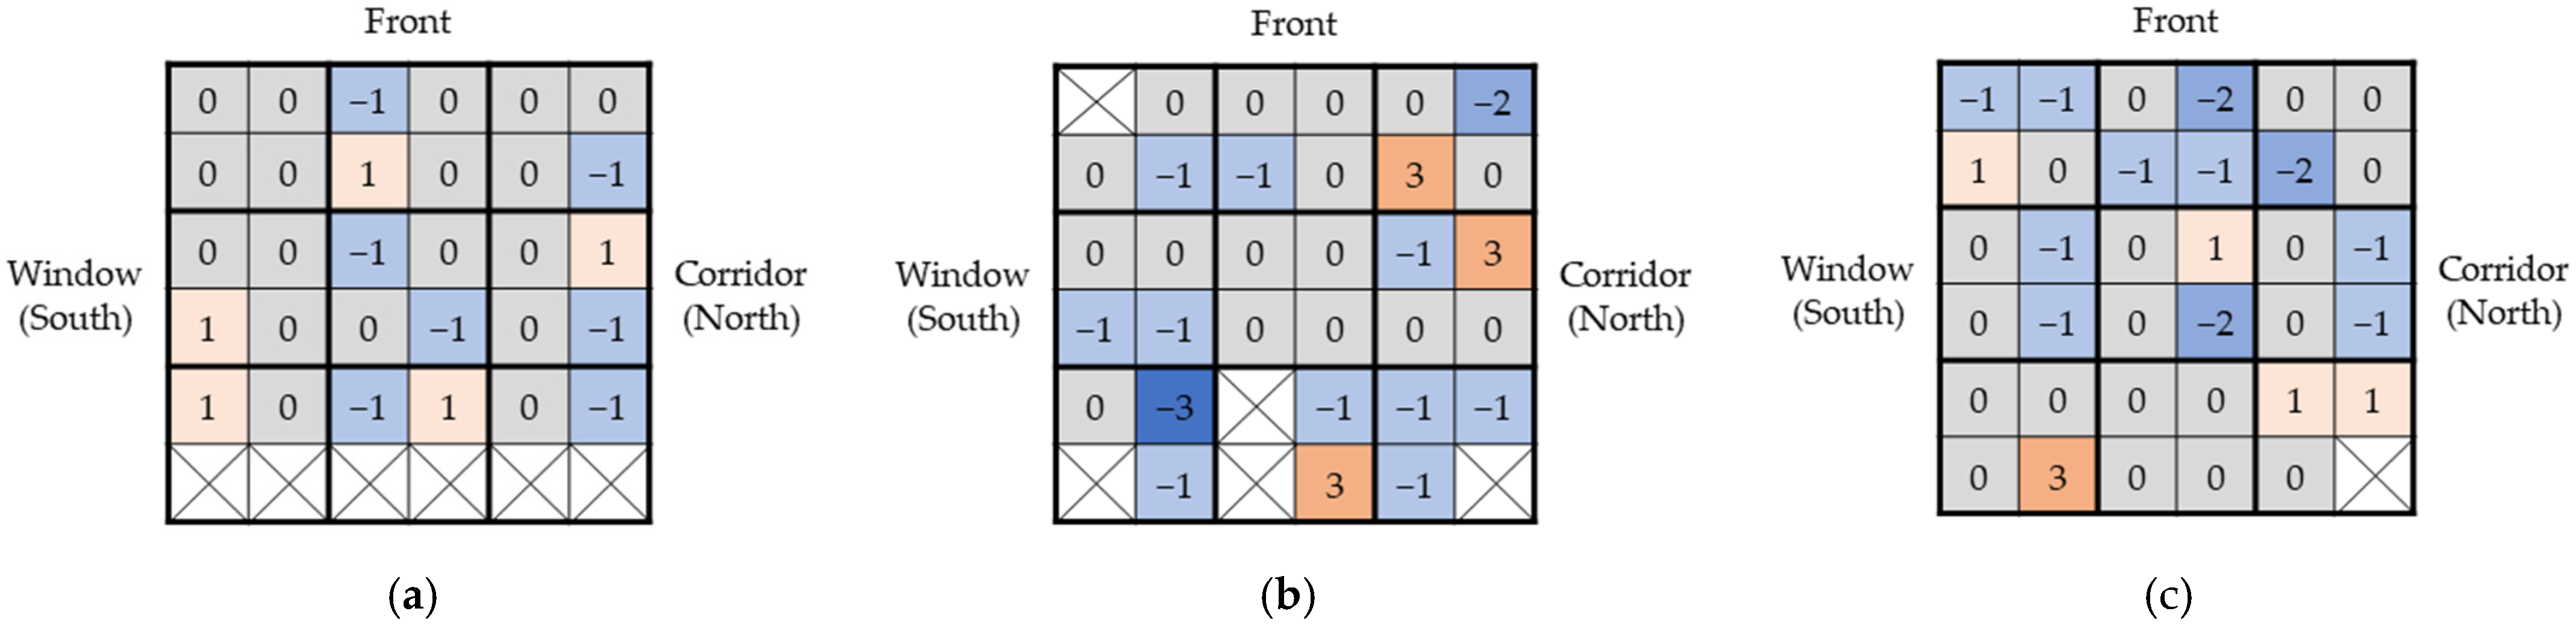
Figure 25.
Summer TSV result per seating point in (a) class A, (b) class B, and (c) class C.
Figure 25.
Summer TSV result per seating point in (a) class A, (b) class B, and (c) class C.
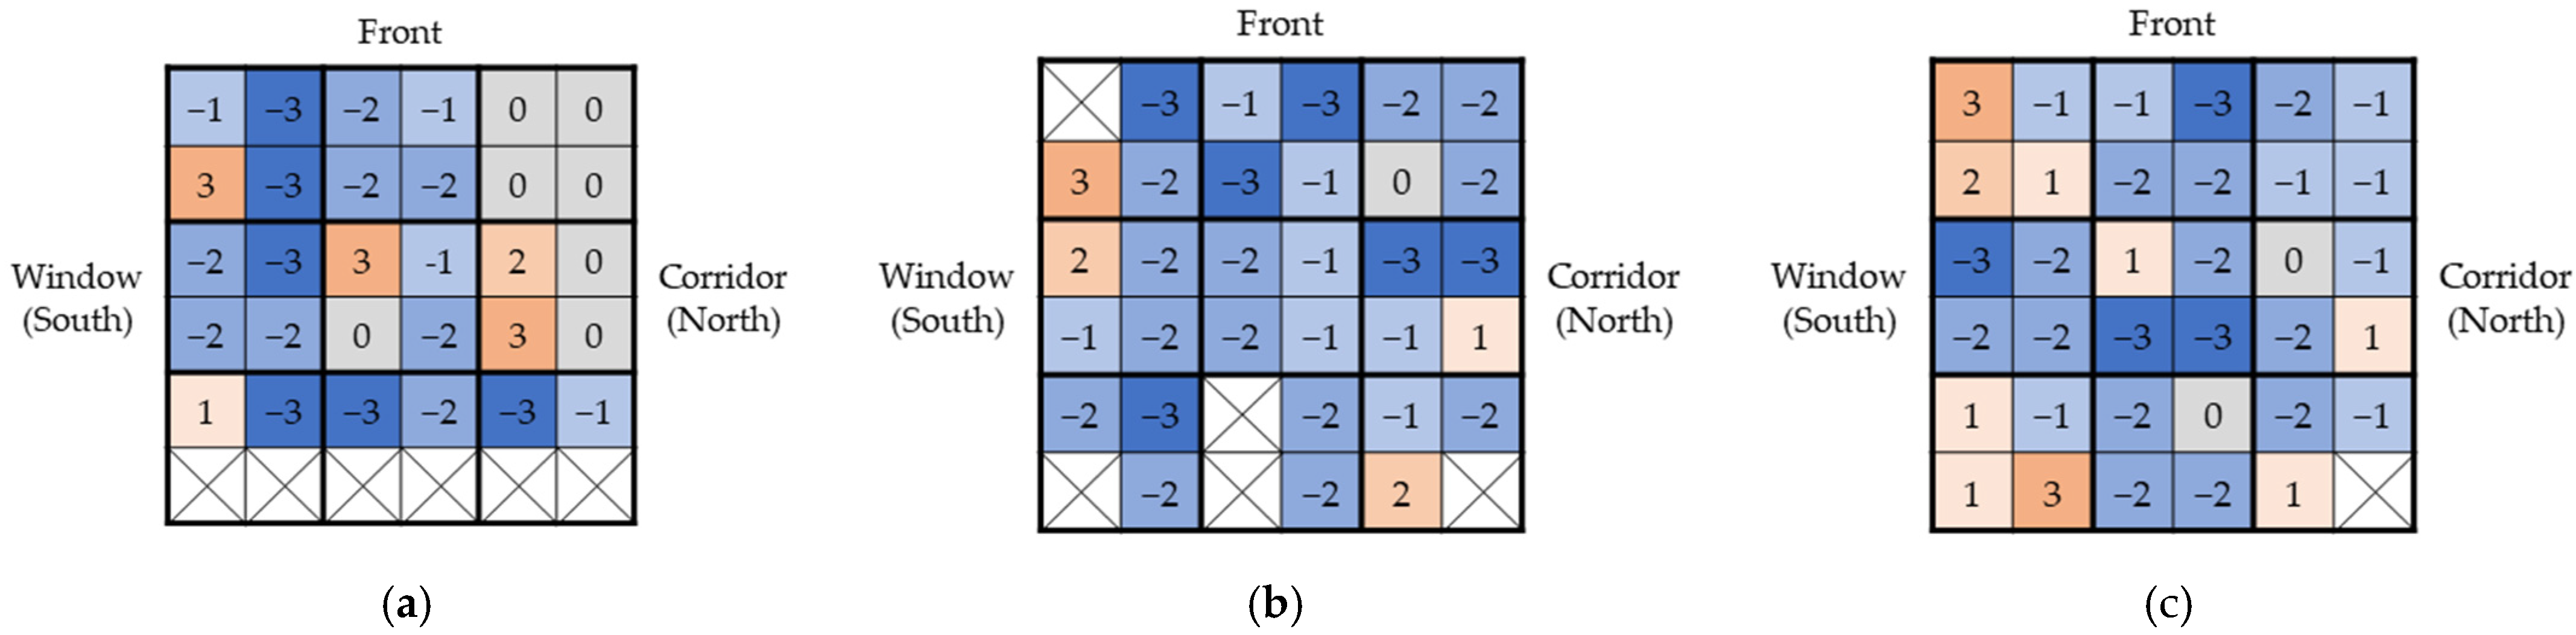
Figure 26.
Summer AFSV result per seating point in (a) class A, (b) class B, and (c) class C.
Figure 26.
Summer AFSV result per seating point in (a) class A, (b) class B, and (c) class C.
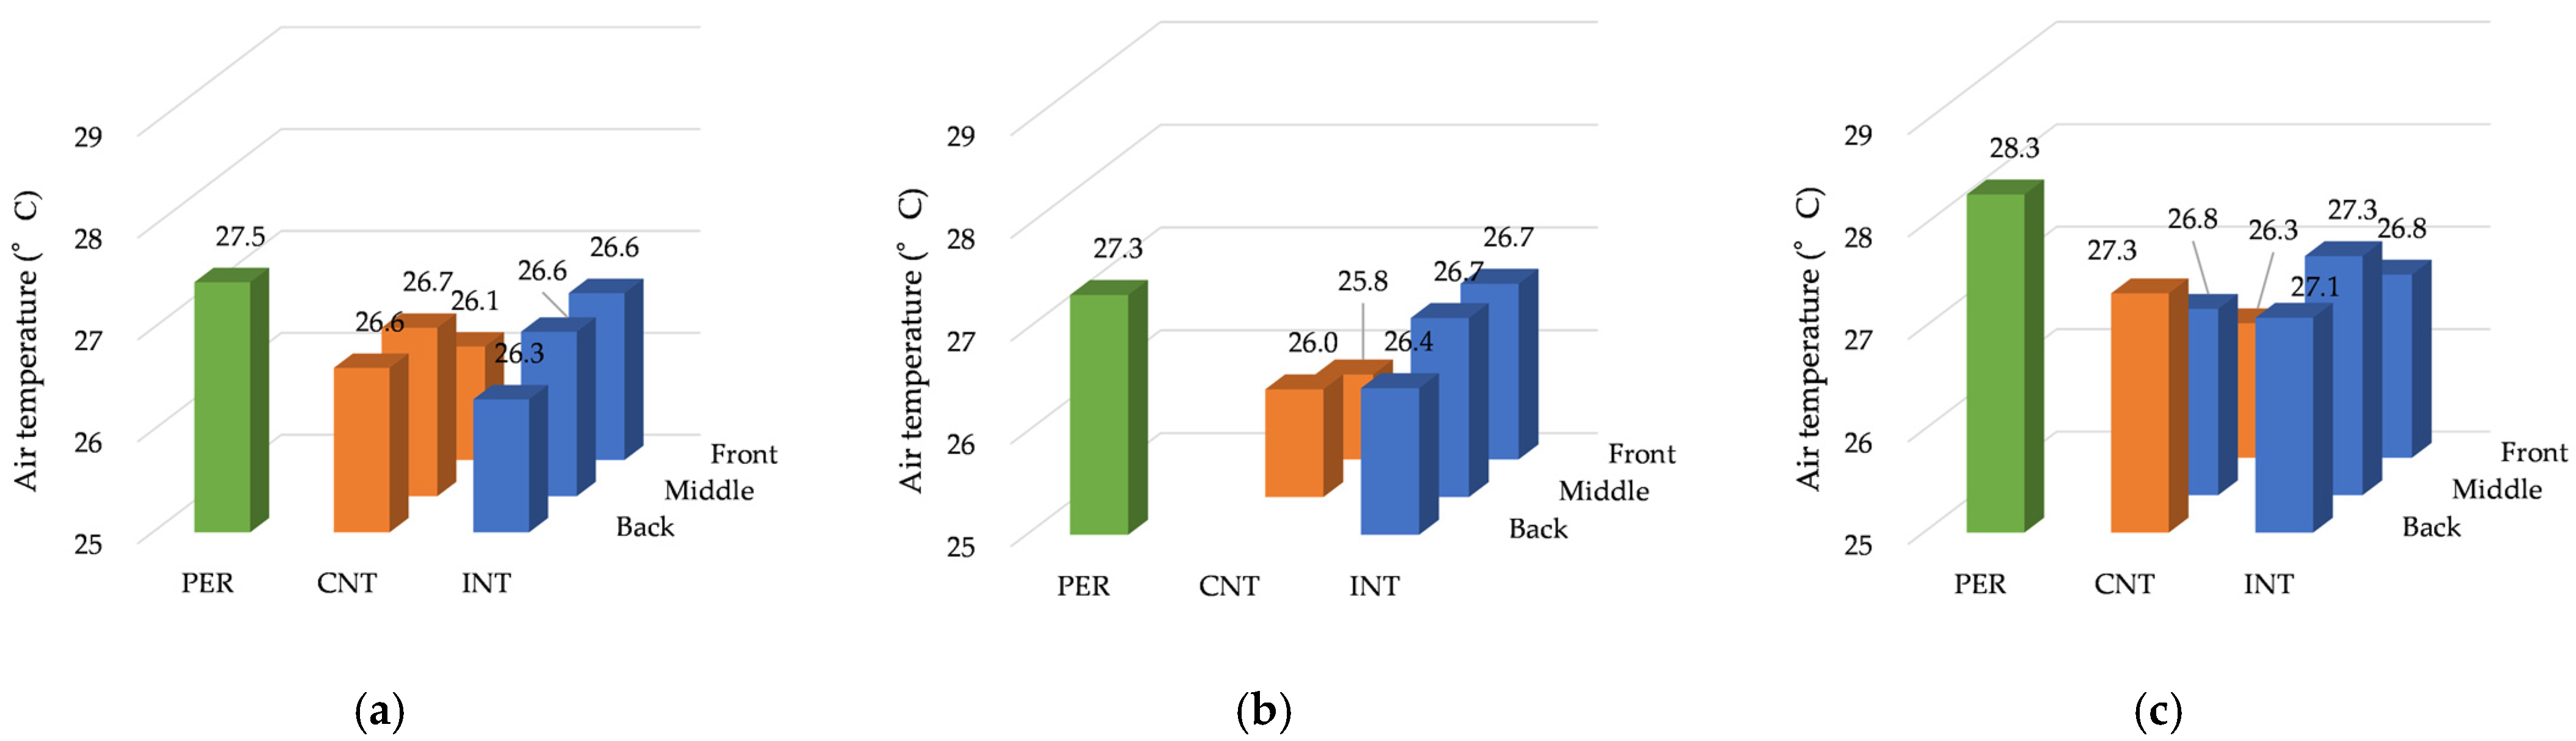
Figure 27.
Summer average air temperature in (a) class A, (b) class B, and (c) class C.
Figure 27.
Summer average air temperature in (a) class A, (b) class B, and (c) class C.
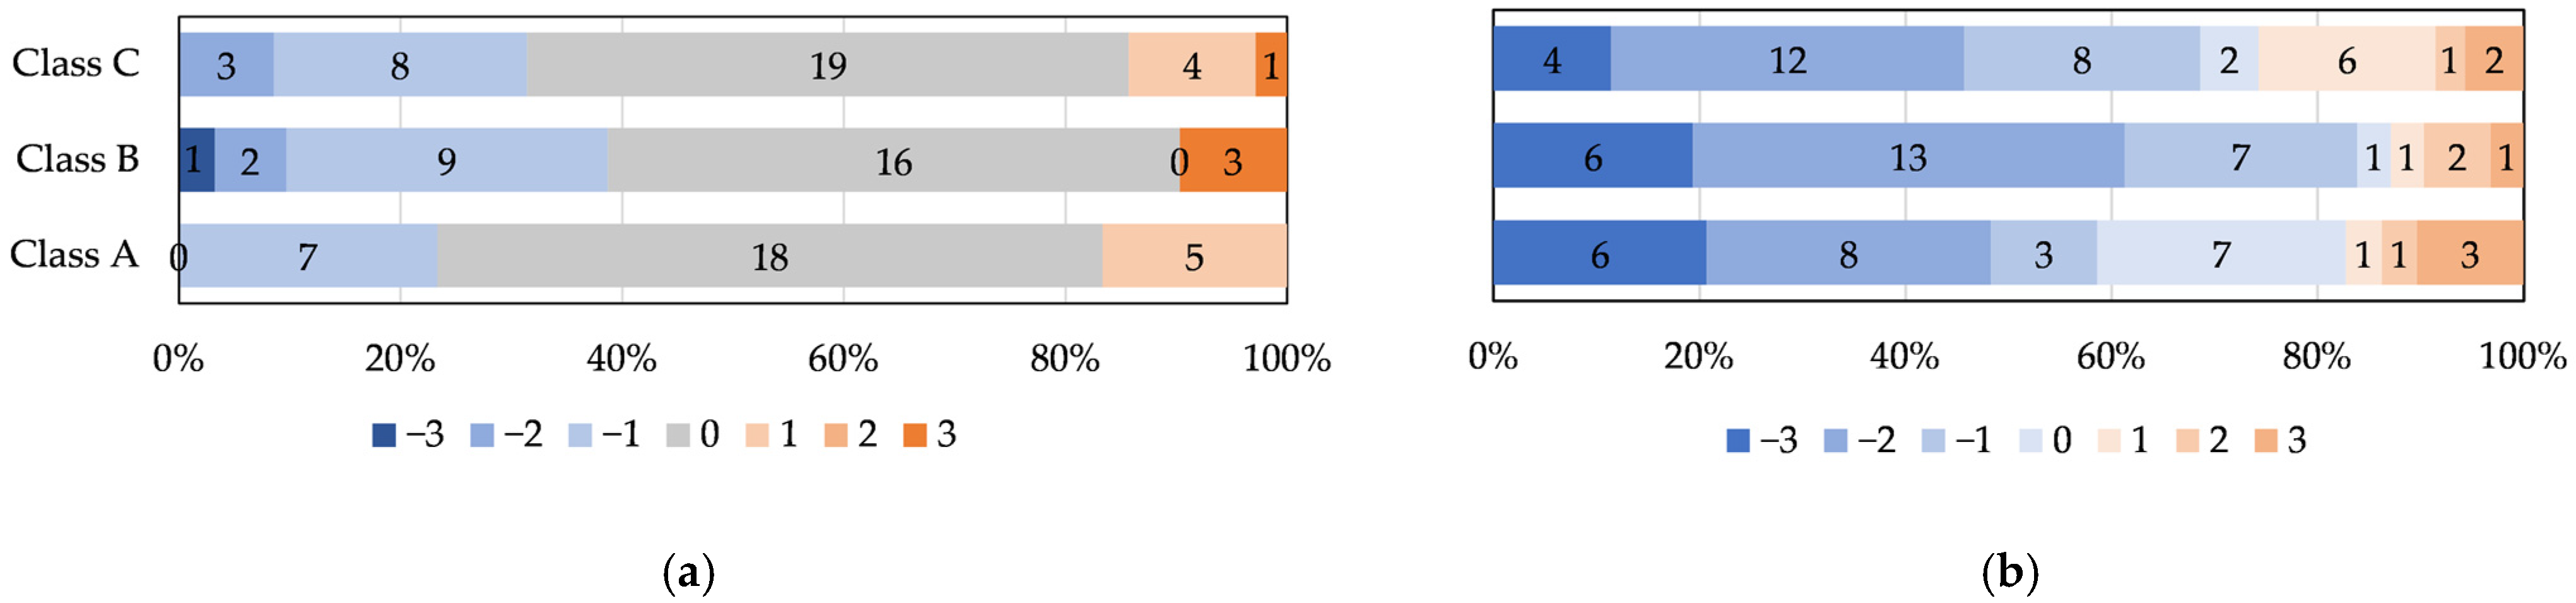
Figure 28.
Summer questionnaire result per classroom. (a) TSV result. (b) AFSV result.
Figure 28.
Summer questionnaire result per classroom. (a) TSV result. (b) AFSV result.
Figure 29.
The correlation between field measurement result and TSV. (a) Indoor thermal comfort range percentage and TSV correlation. (b) Summer AT and TSV correlation.
Figure 29.
The correlation between field measurement result and TSV. (a) Indoor thermal comfort range percentage and TSV correlation. (b) Summer AT and TSV correlation.
Table 1.
Abbreviation list.
Table 1.
Abbreviation list.
| Abbreviation | Meaning |
|---|
| AC | air-conditioning |
| AFSV | air flow sensation vote |
| ASHP | air source heat pump |
| ASHRAE | The American Society of Heating, Refrigerating and Air-conditioning Engineers |
| AT | air temperature |
| BESCS | Building Environmental Sanitation Control Standards |
| CNT | center zone |
| COP | coefficient of performance |
| EHP | electric heat pump |
| EU | energy-use |
| HVAC | heating, ventilation, and air-conditioning |
| INT | interior zone |
| ISO | International Organization for Standardization |
| JSEHMS | Japan School Environmental Hygiene Management Standard |
| LPG | liquefied petroleum gas |
| MEXT | Ministry of Education, Sports, Science, and Technology, Japan |
| PER | perimeter zone |
| PFI | Private Finance Initiative |
| PMV | predicted mean vote |
| REHVA | Federation of European Heating, Ventilation and Air Conditioning Associations |
| RH | relative humidity |
| TSV | thermal sensation vote |
Table 2.
Measurement and questionnaire distribution period.
Table 2.
Measurement and questionnaire distribution period.
| Actual Measurement | Questionnaire
Period |
|---|
| Measurement Period | Analysis Target Period |
|---|
| 27 August 2019–9 September 2019 | 4–6 September 2019, 9 September 2019 | 4 September 2019 |
Table 3.
Unit calorific value [
25].
Table 3.
Unit calorific value [
25].
| “Electric Heat Pump (EHP)” | “Liquefied Petroleum Gas (LPG)” |
|---|
| 9.97 MJ/kWh | 100.47 MJ/m3 |
Table 4.
PMV calculation parameters and assumption values.
Table 4.
PMV calculation parameters and assumption values.
| PMV Calculation Parameters | Assumption Values |
|---|
| Metabolic rate | 1 met (58.2 W/m2) |
| External work | 0.0 W/m2 |
| Relative humidity | 60% (obtained from averaged RH measurement data) |
| Clothing insulation | 0.5 CLO |
| Air velocity | 0.2 m/s |
| Radiant temperature | Equal to air temperature |
Table 5.
Pearson correlation of the PER-CNT-INT zone.
Table 5.
Pearson correlation of the PER-CNT-INT zone.
| | PER-INT | PER-CNT | CNT-INT |
|---|
| Class A | Class B | Class C | Class A | Class B | Class C | Class A | Class B | Class C |
|---|
| Air temperature | 0.888 | 0.829 | 0.754 | 0.909 | 0.775 | 0.857 | 0.955 | 0.886 | 0.891 |
| Relative humidity | 0.933 | 0.976 | 0.959 | 0.948 | 0.963 | 0.980 | 0.973 | 0.966 | 0.957 |
Table 6.
Questionnaire scales and definitions.
Table 6.
Questionnaire scales and definitions.
| “Thermal Sensation Vote (TSV)” Scale | Definition | “Air Flow Sensation Vote (AFSV)” Scale | Definition |
|---|
| 3 | hot | 3 | much too still |
| 2 | warm | 2 | too still |
| 1 | slightly warm | 1 | slightly still |
| 0 | neutral | 0 | just right |
| −1 | slightly cool | −1 | slightly breezy |
| −2 | cool | −2 | too breezy |
| −3 | cold | −3 | much too breezy |
Table 7.
TSV and AFSV average per row and zone.
Table 7.
TSV and AFSV average per row and zone.
| | Class A | Class B | Class C | Total Average |
|---|
| TSV | Row 1 | 0.4 | 0.0 | −0.4 | 0.0 | 0.0 | −0.4 | −0.3 | −1.0 | −0.5 | 0.3 | 0.0 | 0.0 | 0.0 | 0.0 | −0.2 | −0.7 | −0.2 | −0.2 | 0.1 | −0.3 | −0.4 | −0.1 | −0.1 | −0.2 |
| Zone 2 | 0.2 | −0.2 | −0.2 | −0.6 | −0.1 | 0.0 | 0.0 | −0.4 | −0.2 | −0.1 | −0.2 | −0.1 |
| AFSV | Row 1 | −0.2 | −2.8 | −0.8 | −1.6 | 0.4 | −0.2 | 0.5 | −2.3 | −2.0 | −1.7 | −0.8 | −1.6 | 0.3 | −0.3 | −1.5 | −2.0 | −1.0 | −0.6 | 0.2 | −1.8 | −1.4 | −1.8 | −0.5 | −0.8 |
| Zone 2 | −1.5 | −1.2 | 0.1 | −0.9 | −1.8 | −1.2 | 0.0 | −1.8 | −0.8 | −0.8 | −1.6 | −0.6 |


