
The Relation between Green Visual Index and Visual Comfort in Qingdao Coastal Streets

 , , ,
, , ,
Abstract
:1. Introduction
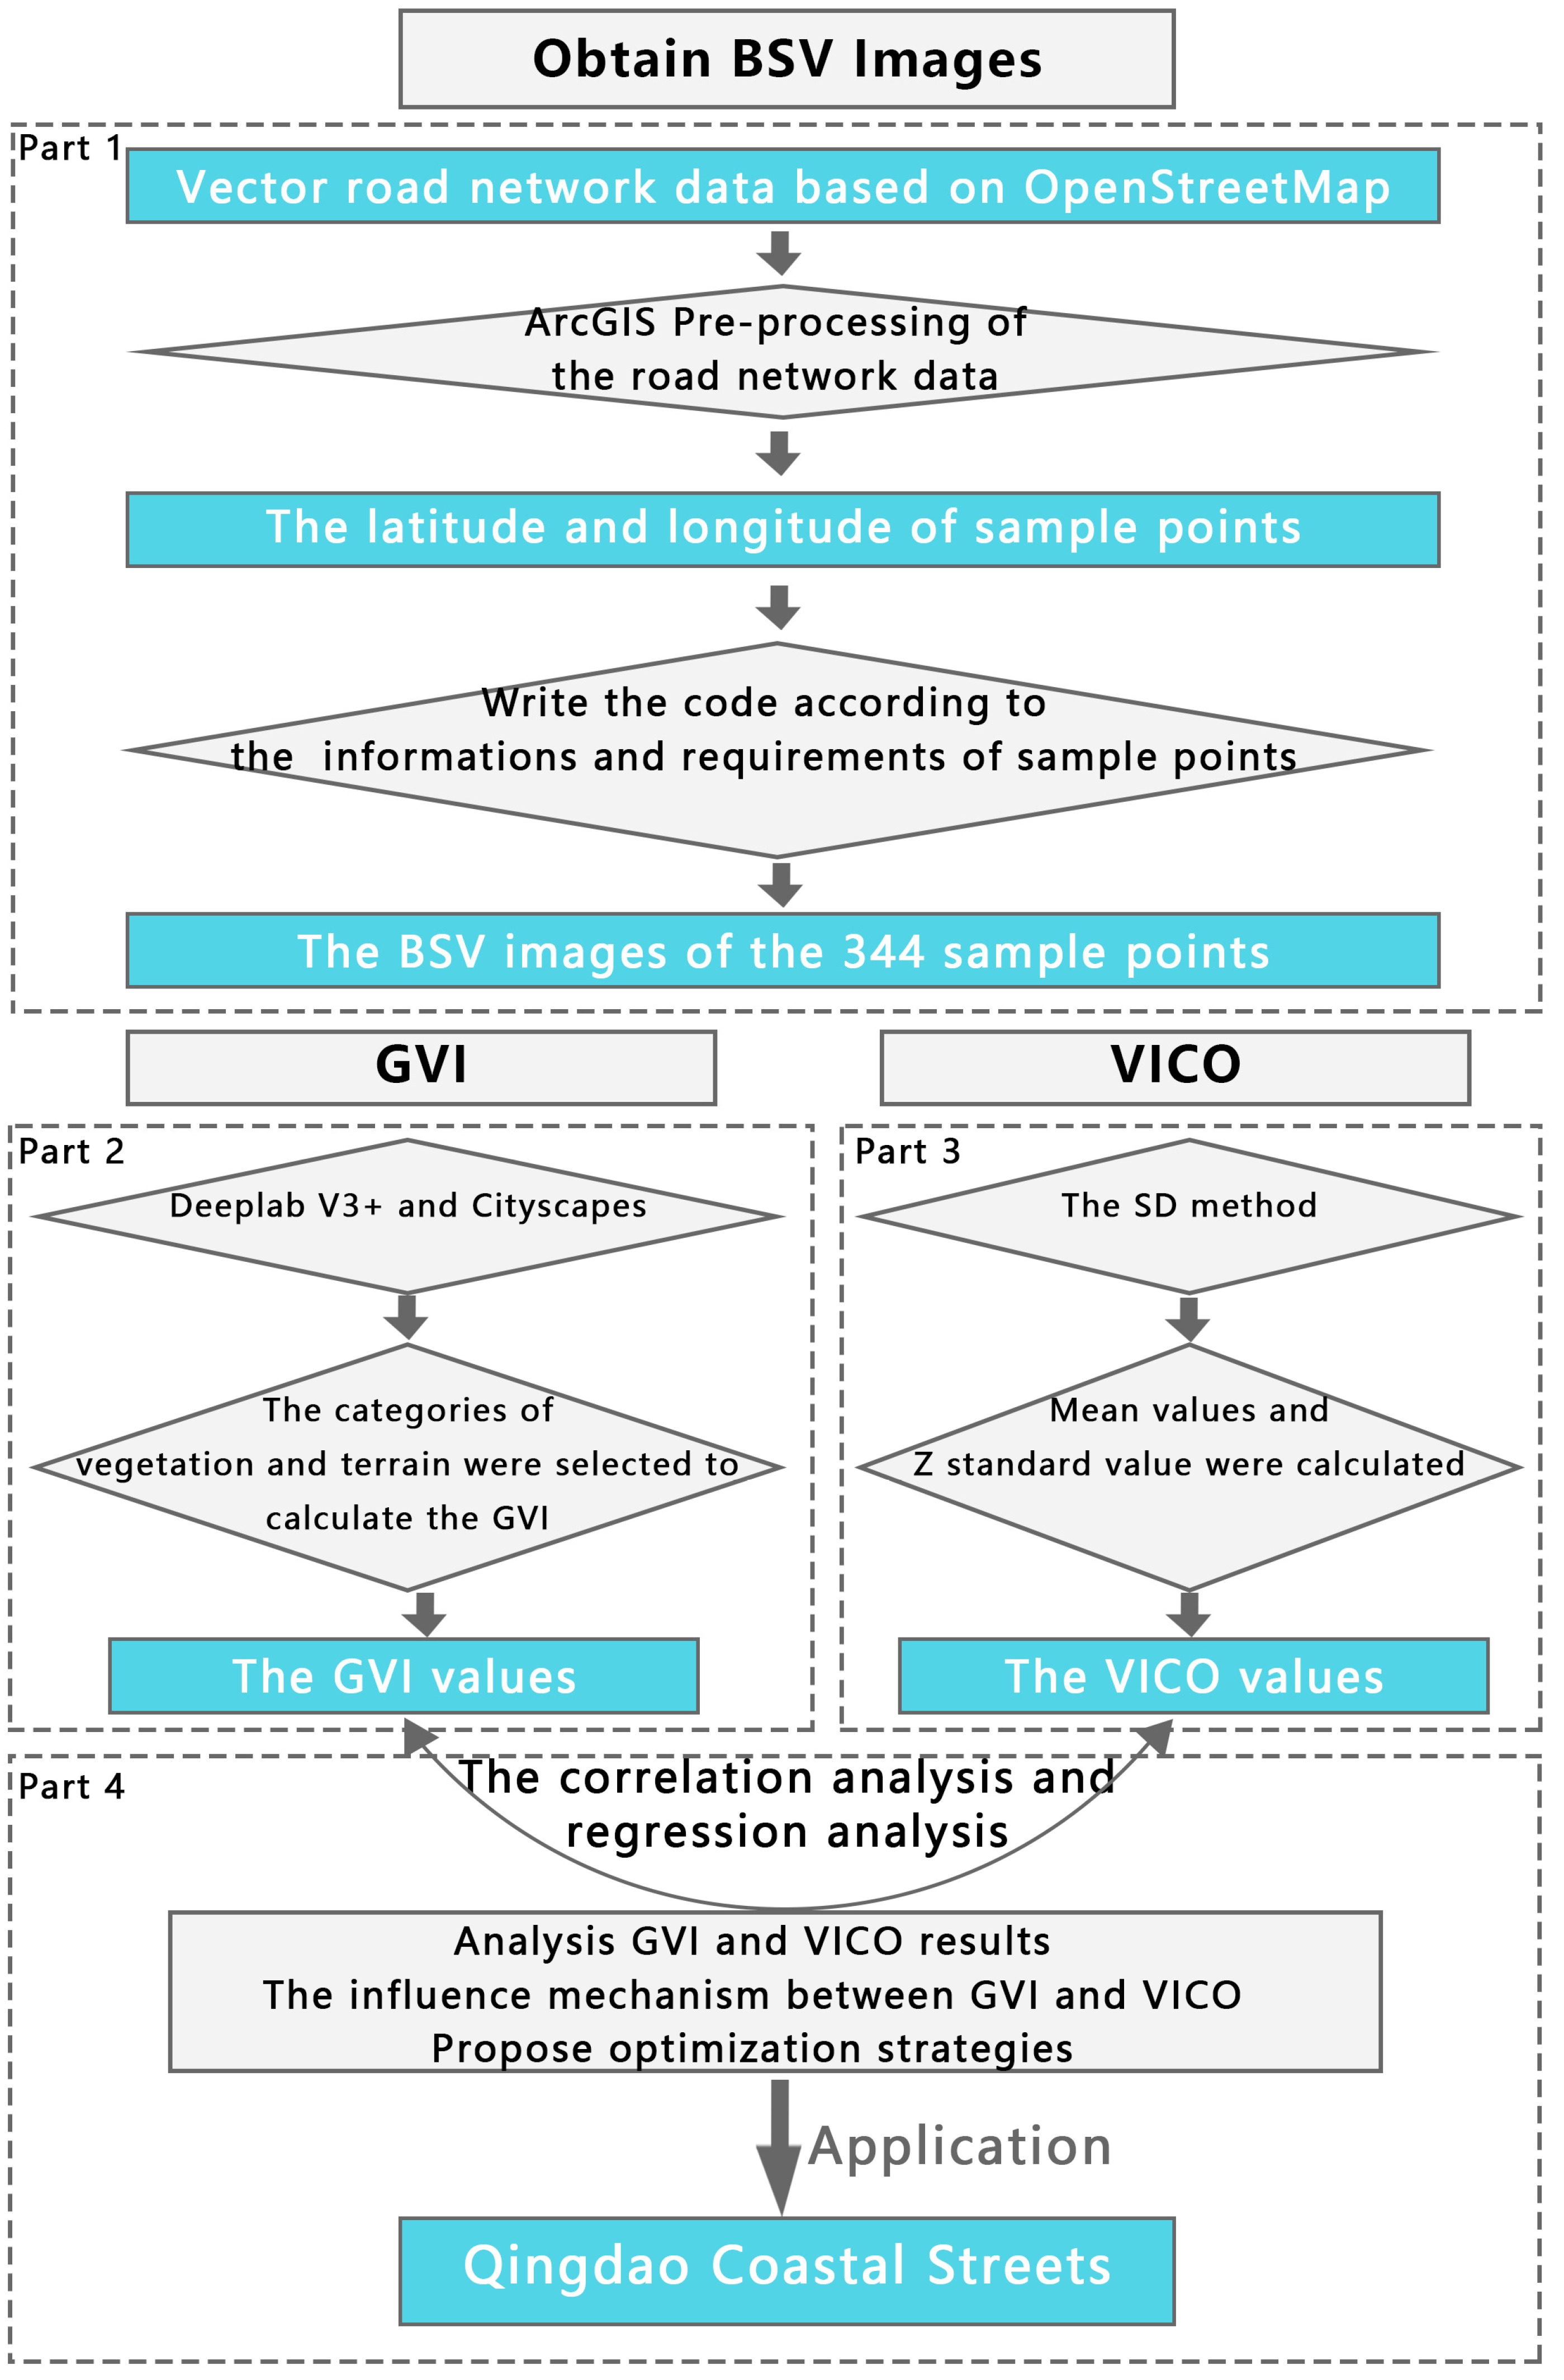
2. Materials and Methods
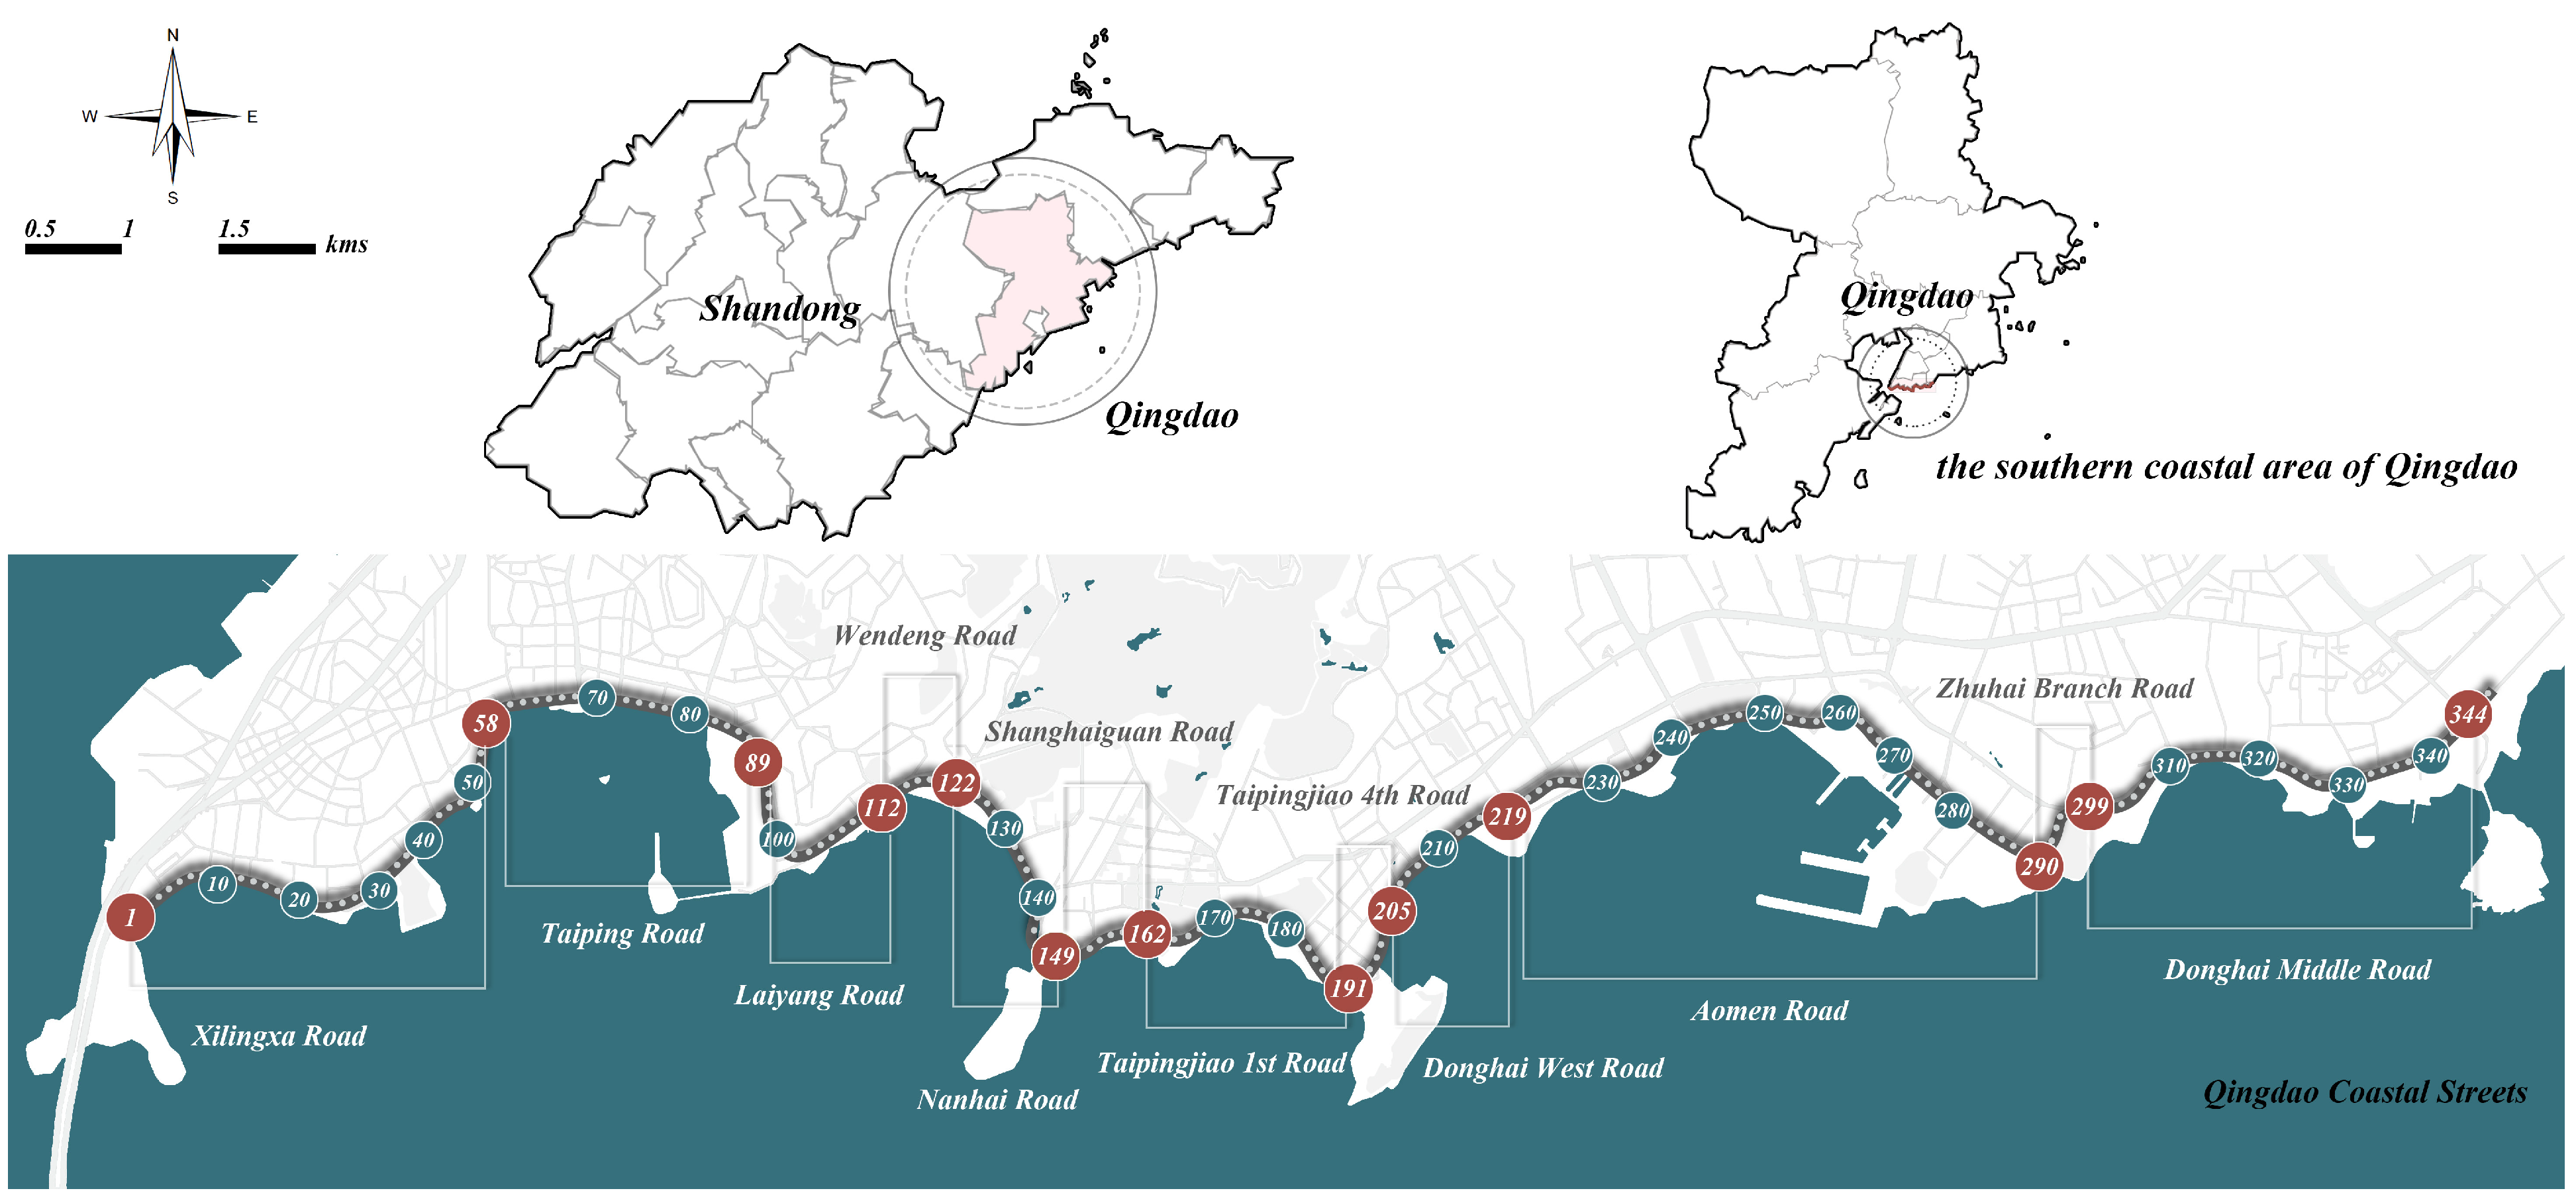
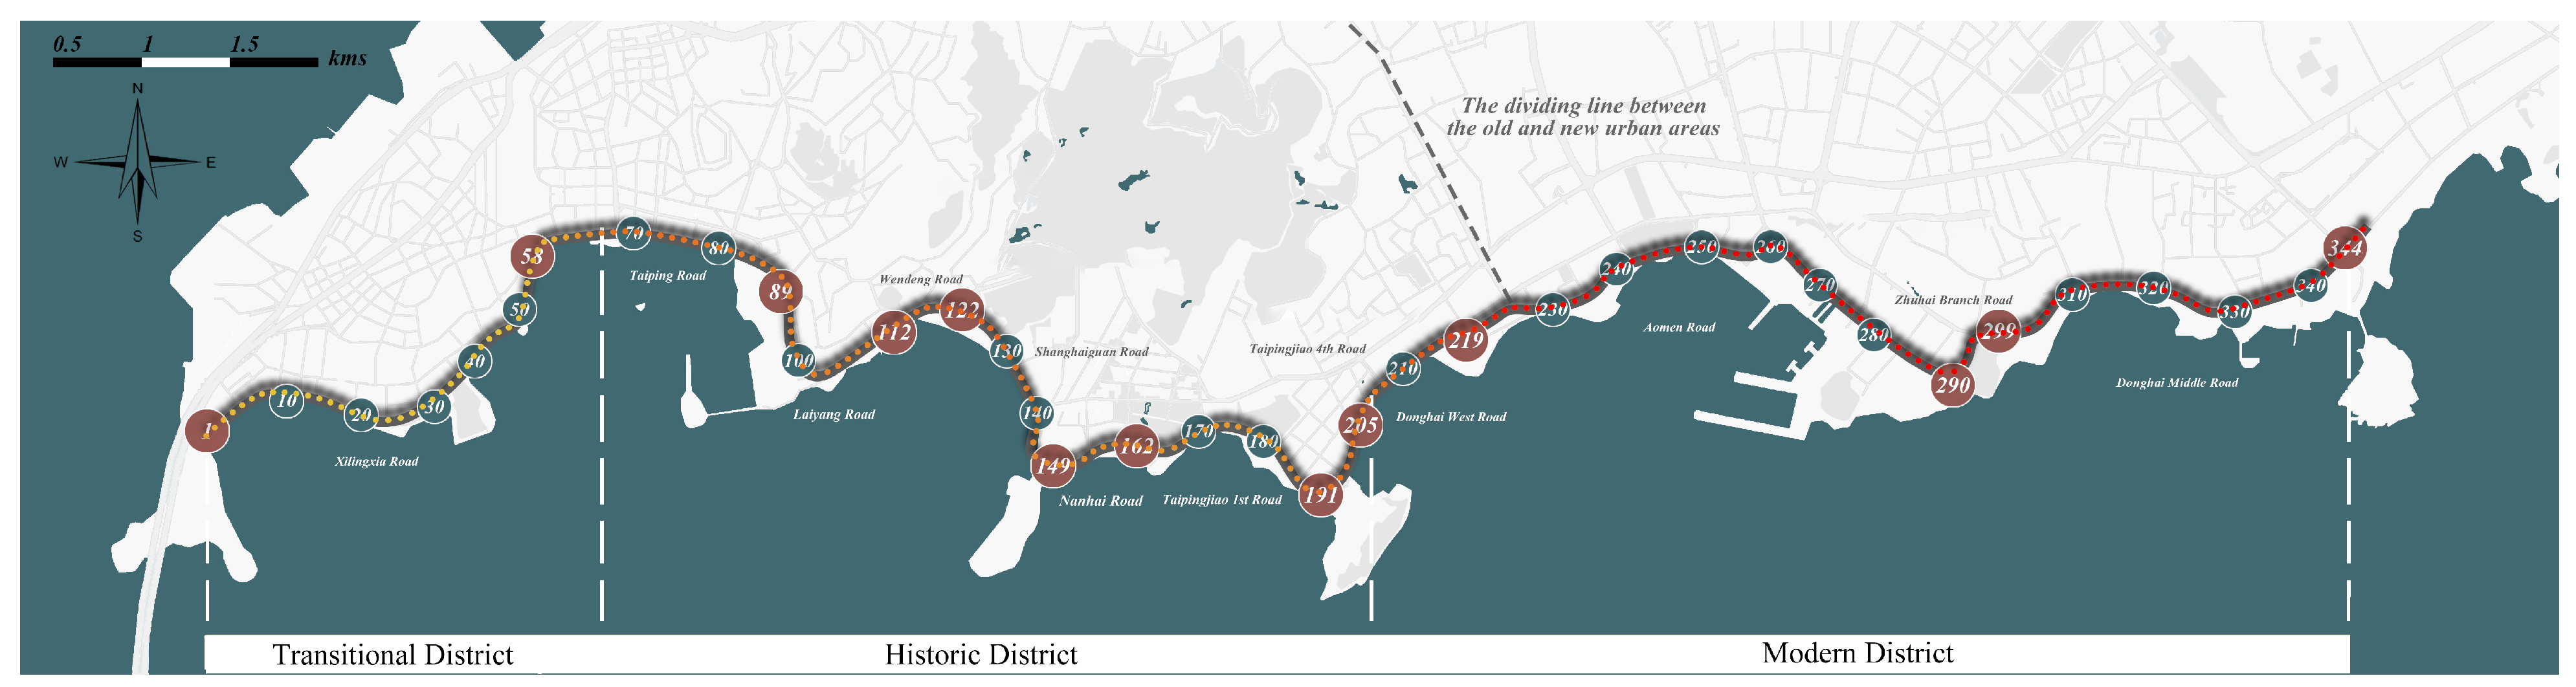
2.1. Study Site and Data
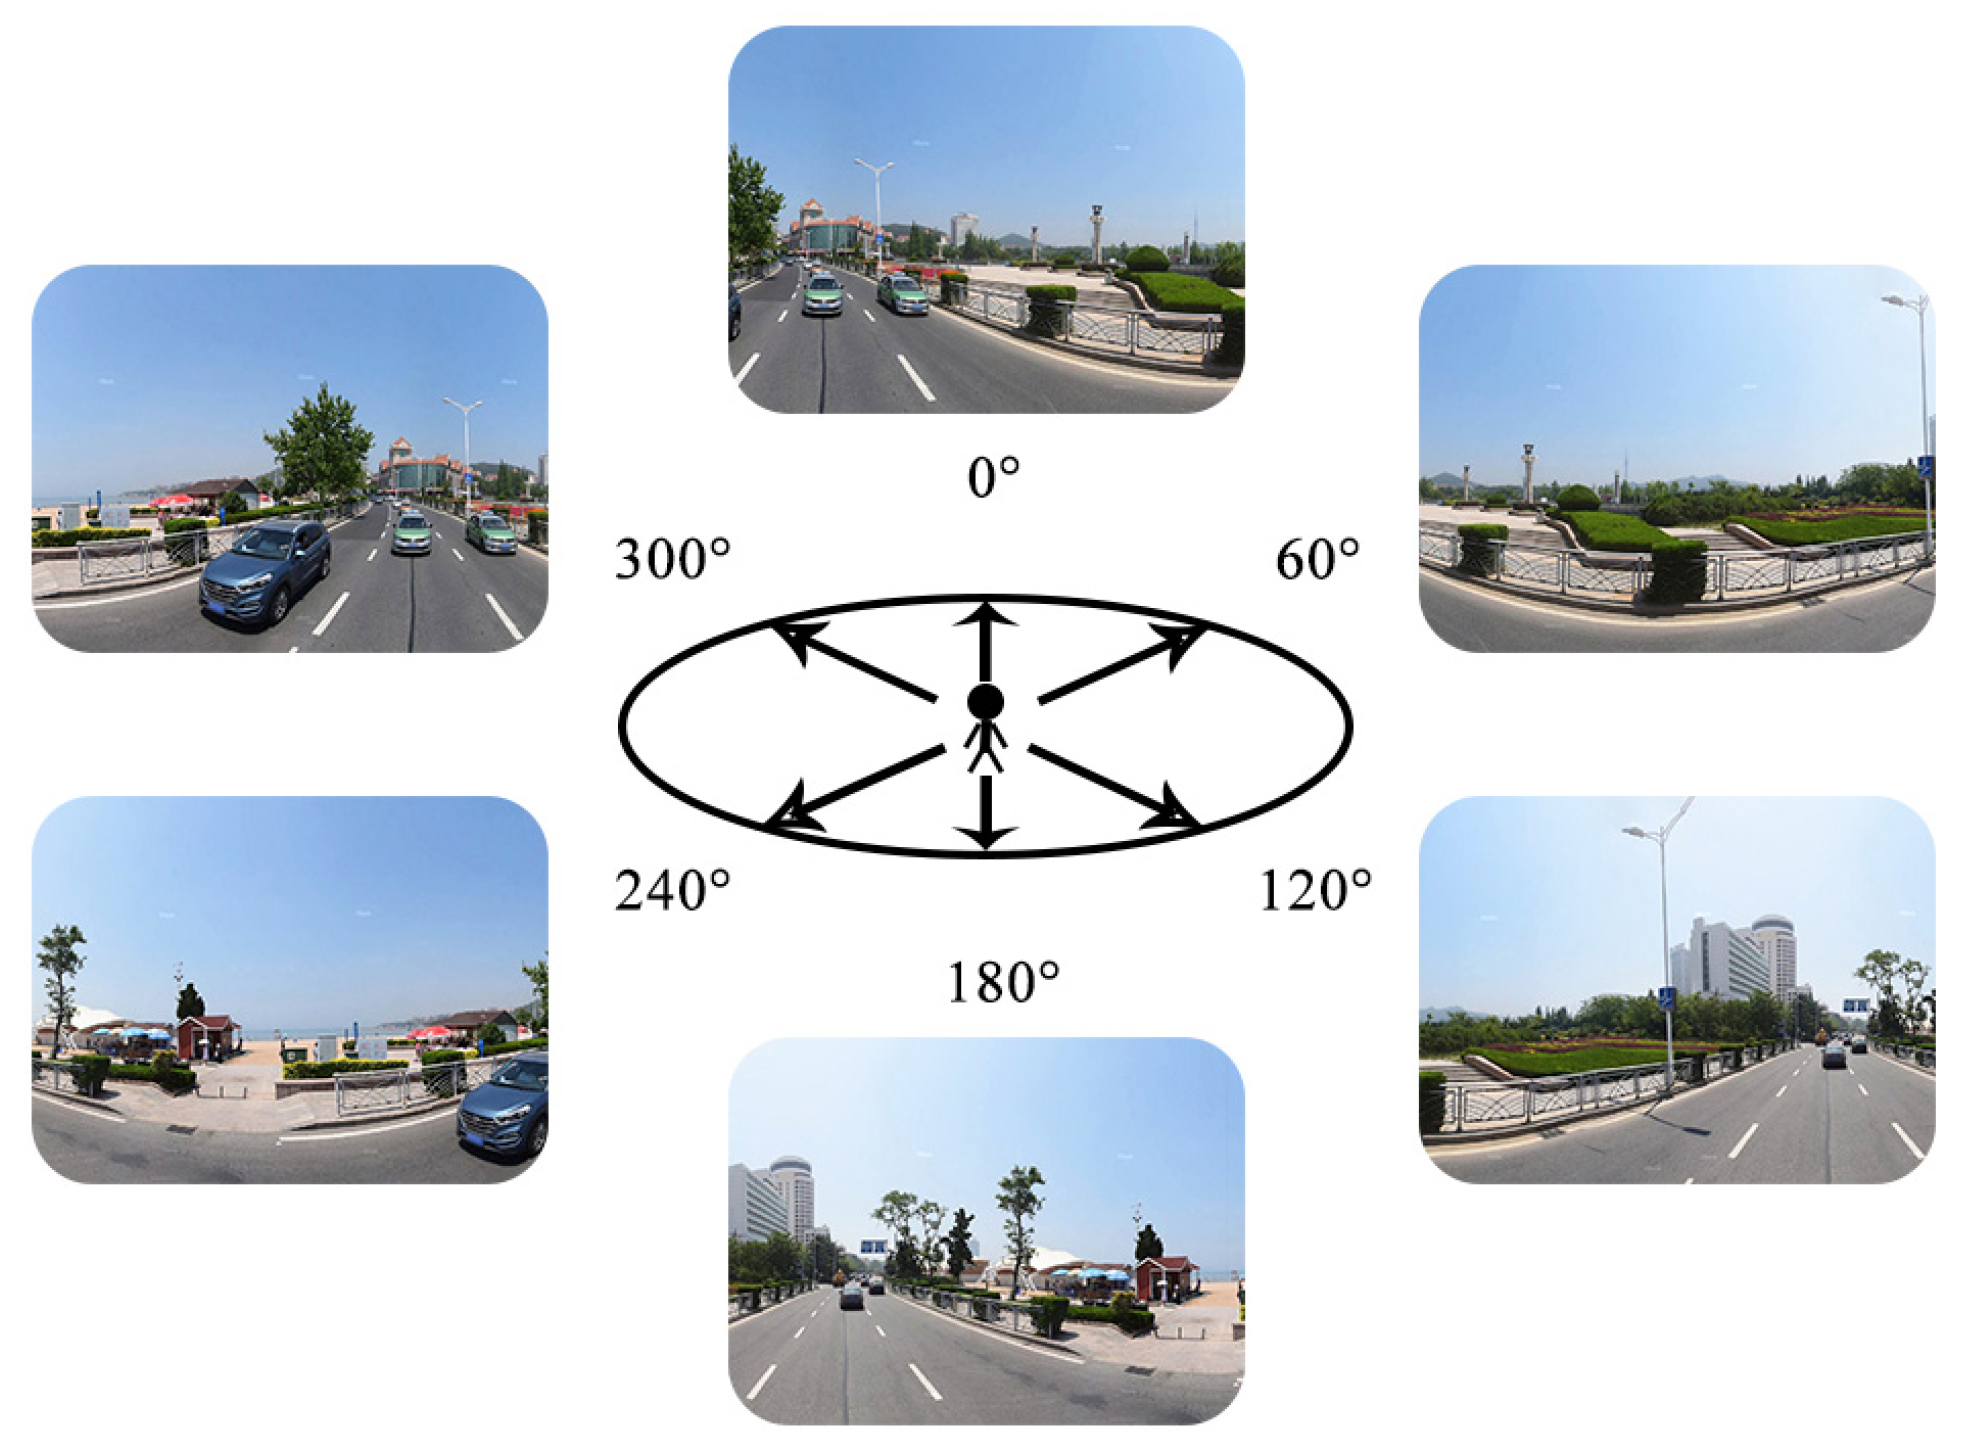
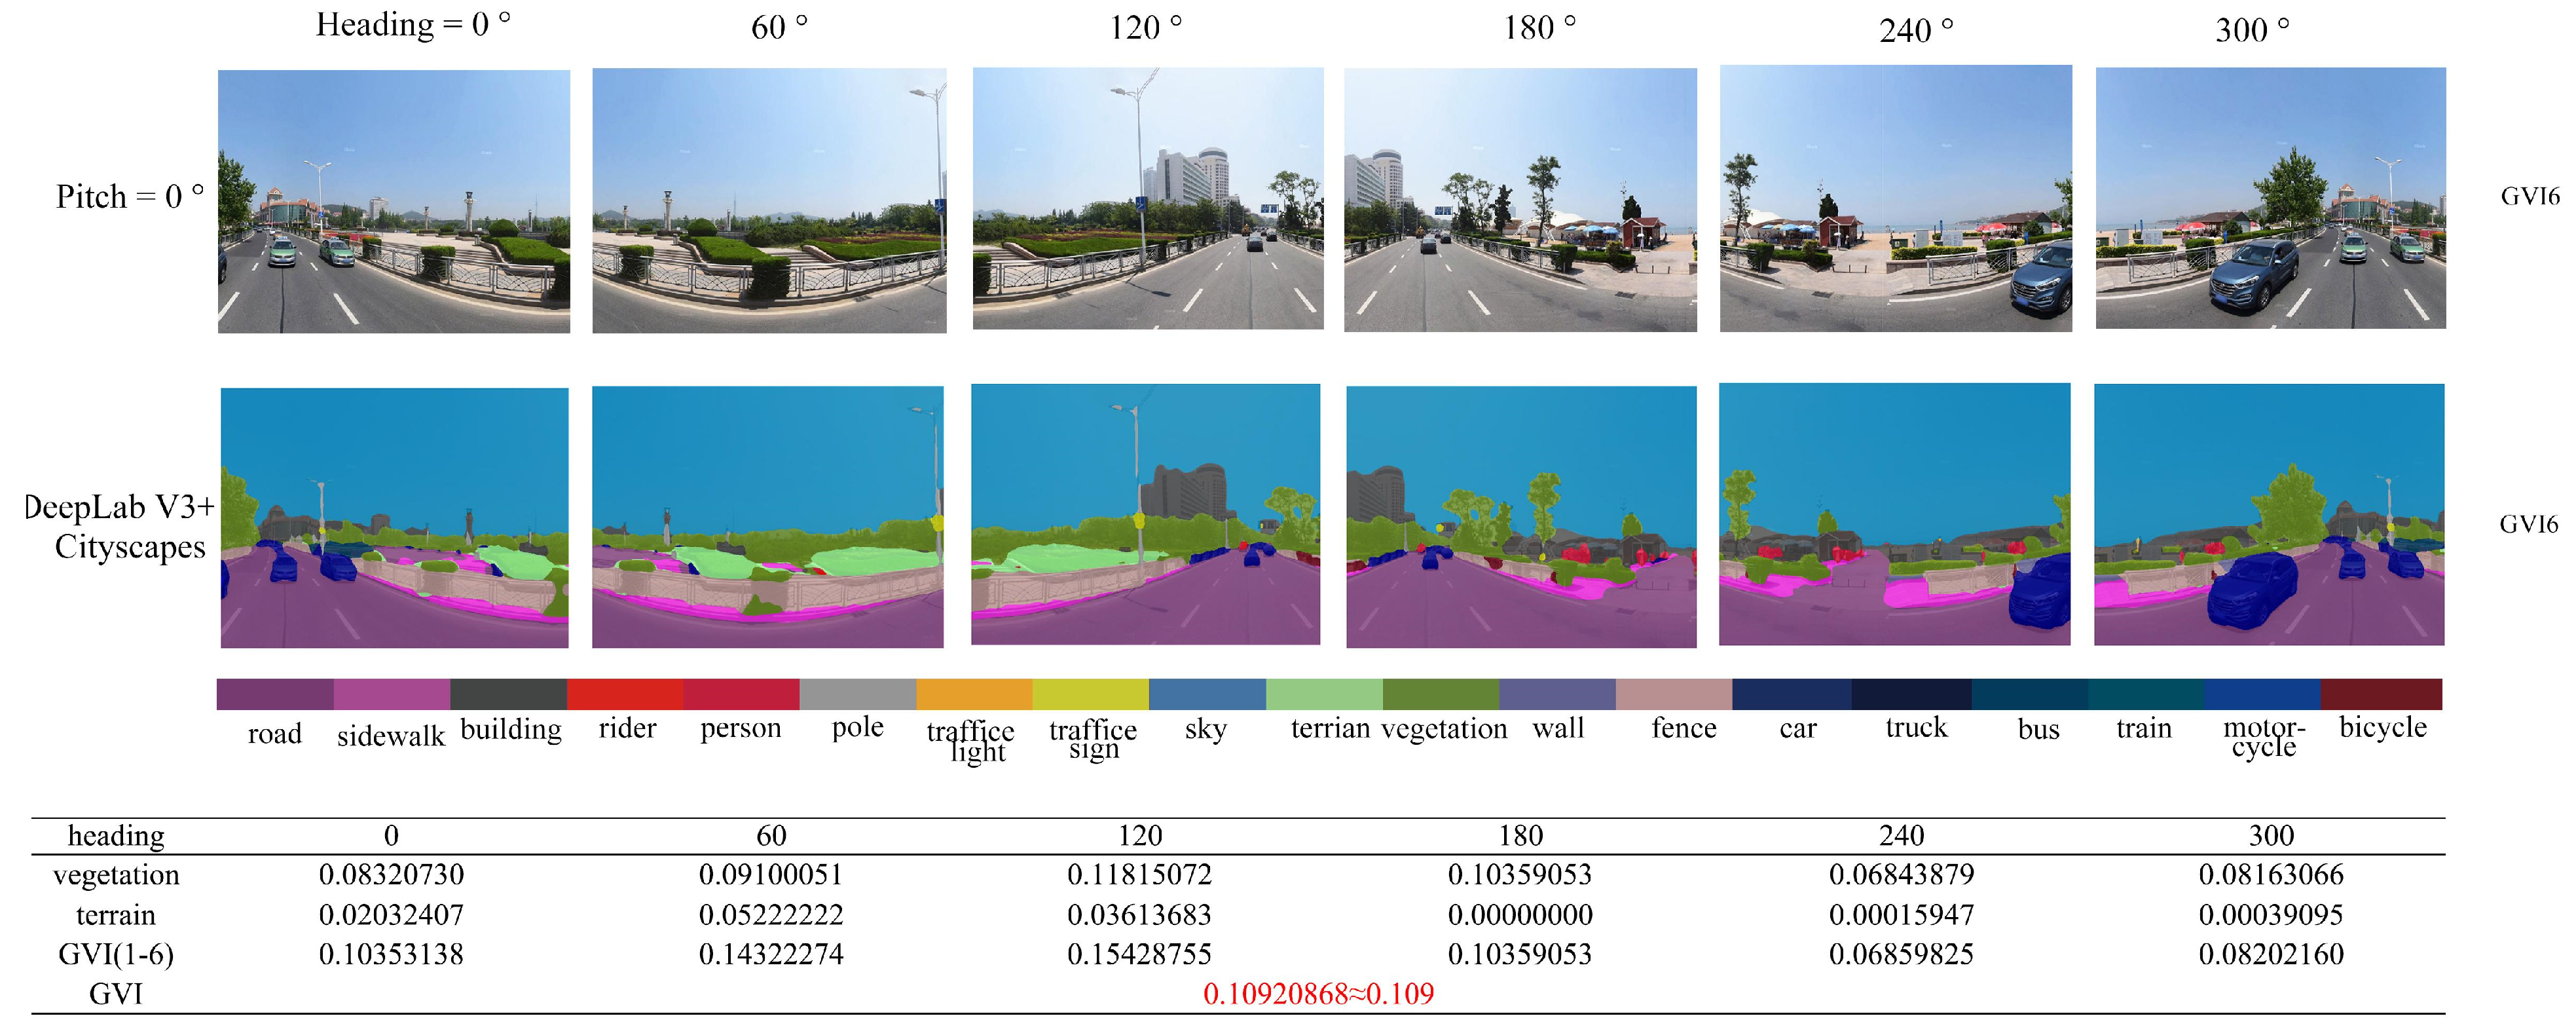
2.2. Calculation of Green View Index (GVI) of Street View by DeepLab V3+
2.3. Evaluation of Visual Comfort (VICO) of Street View Based on SD Method
2.4. Statistical Analysis
3. Results
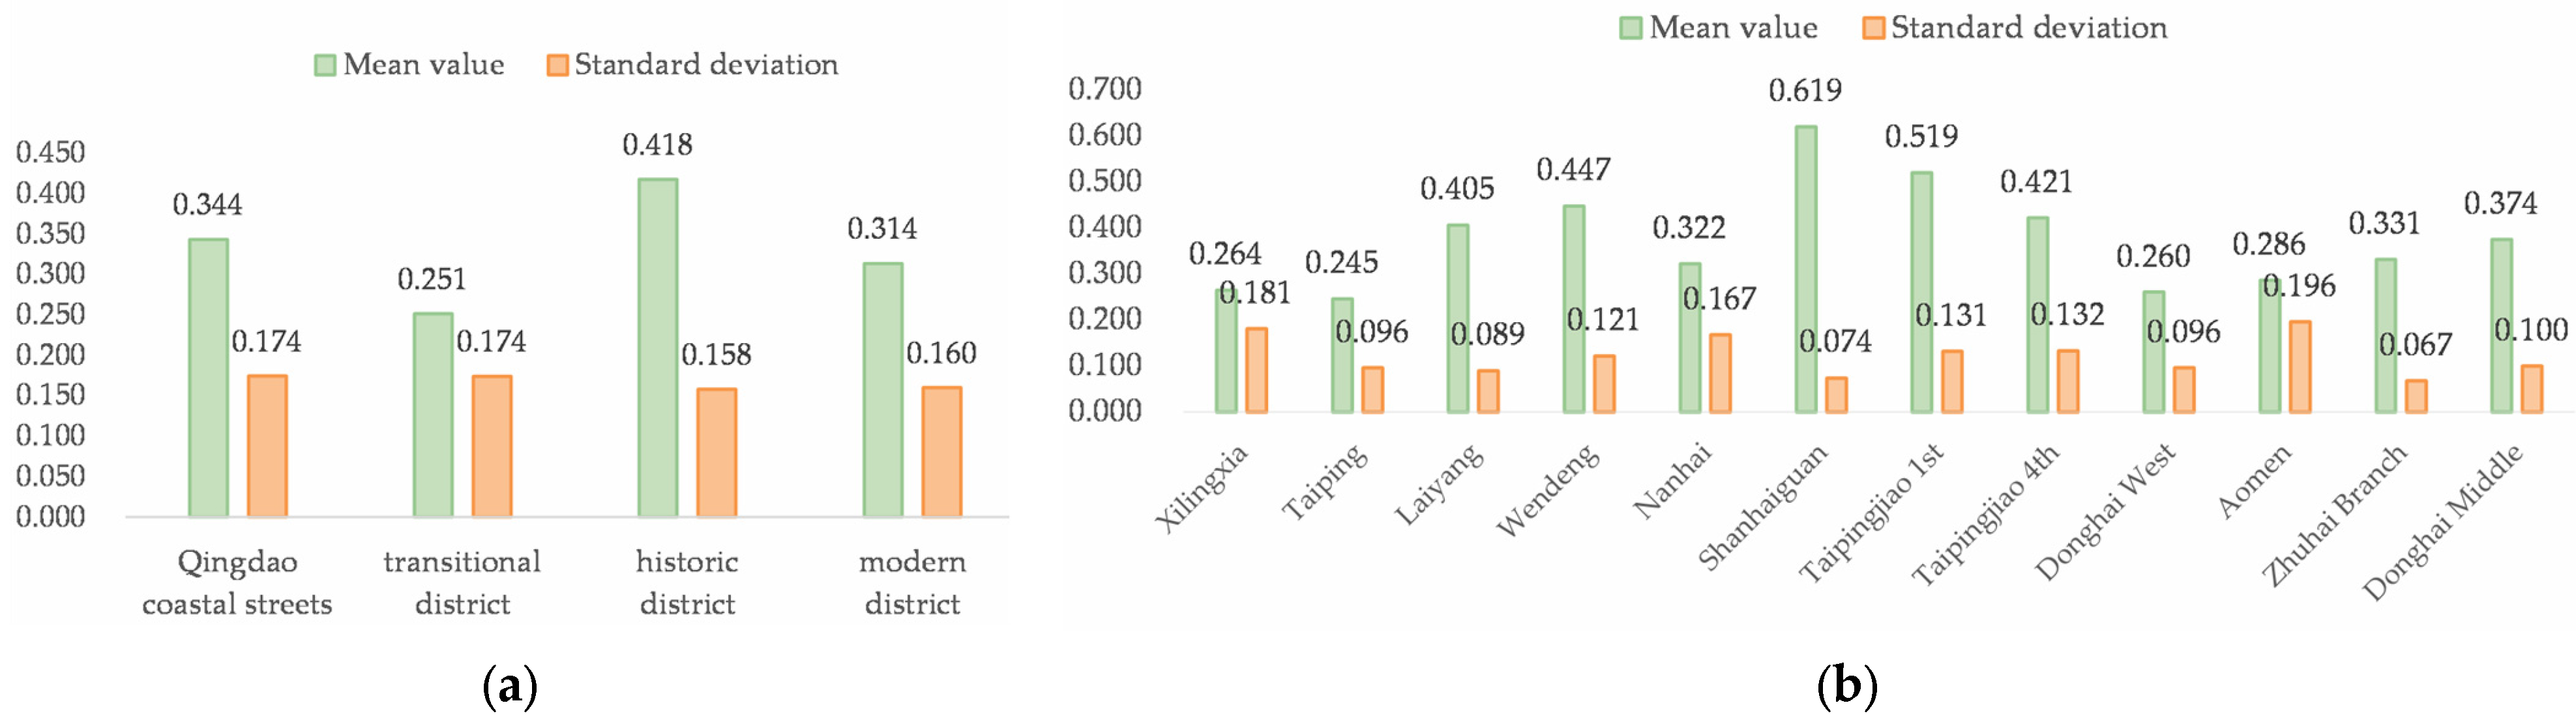
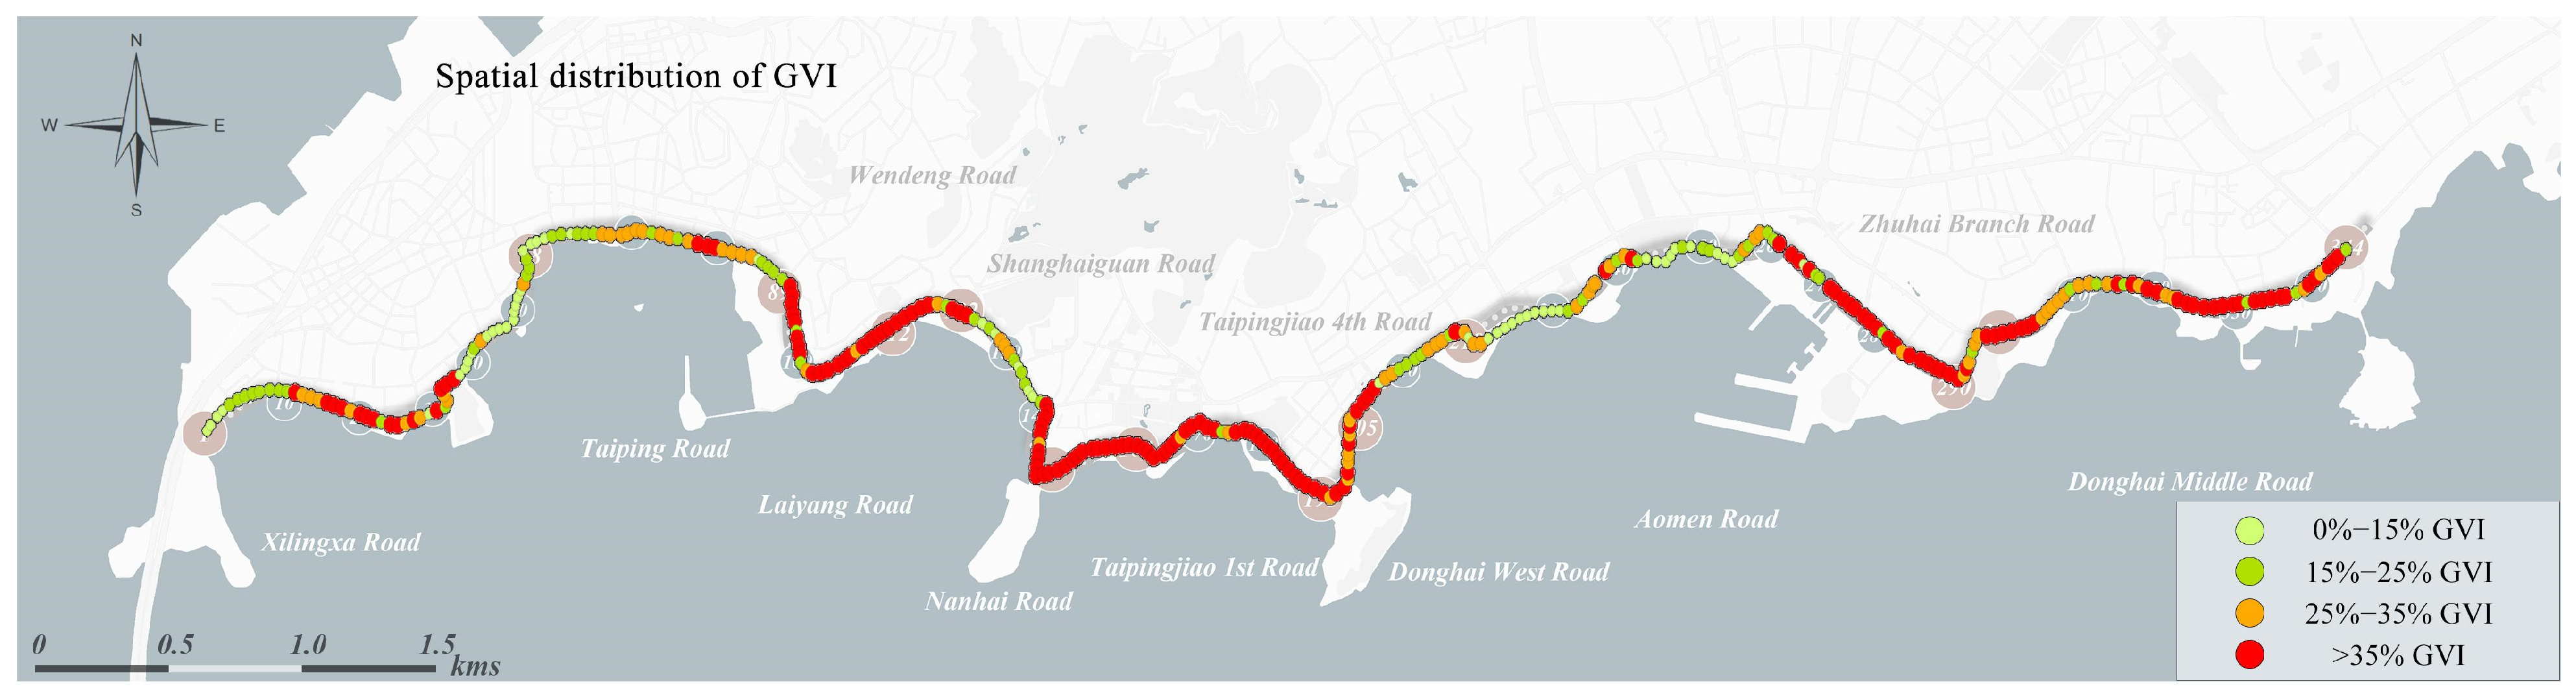
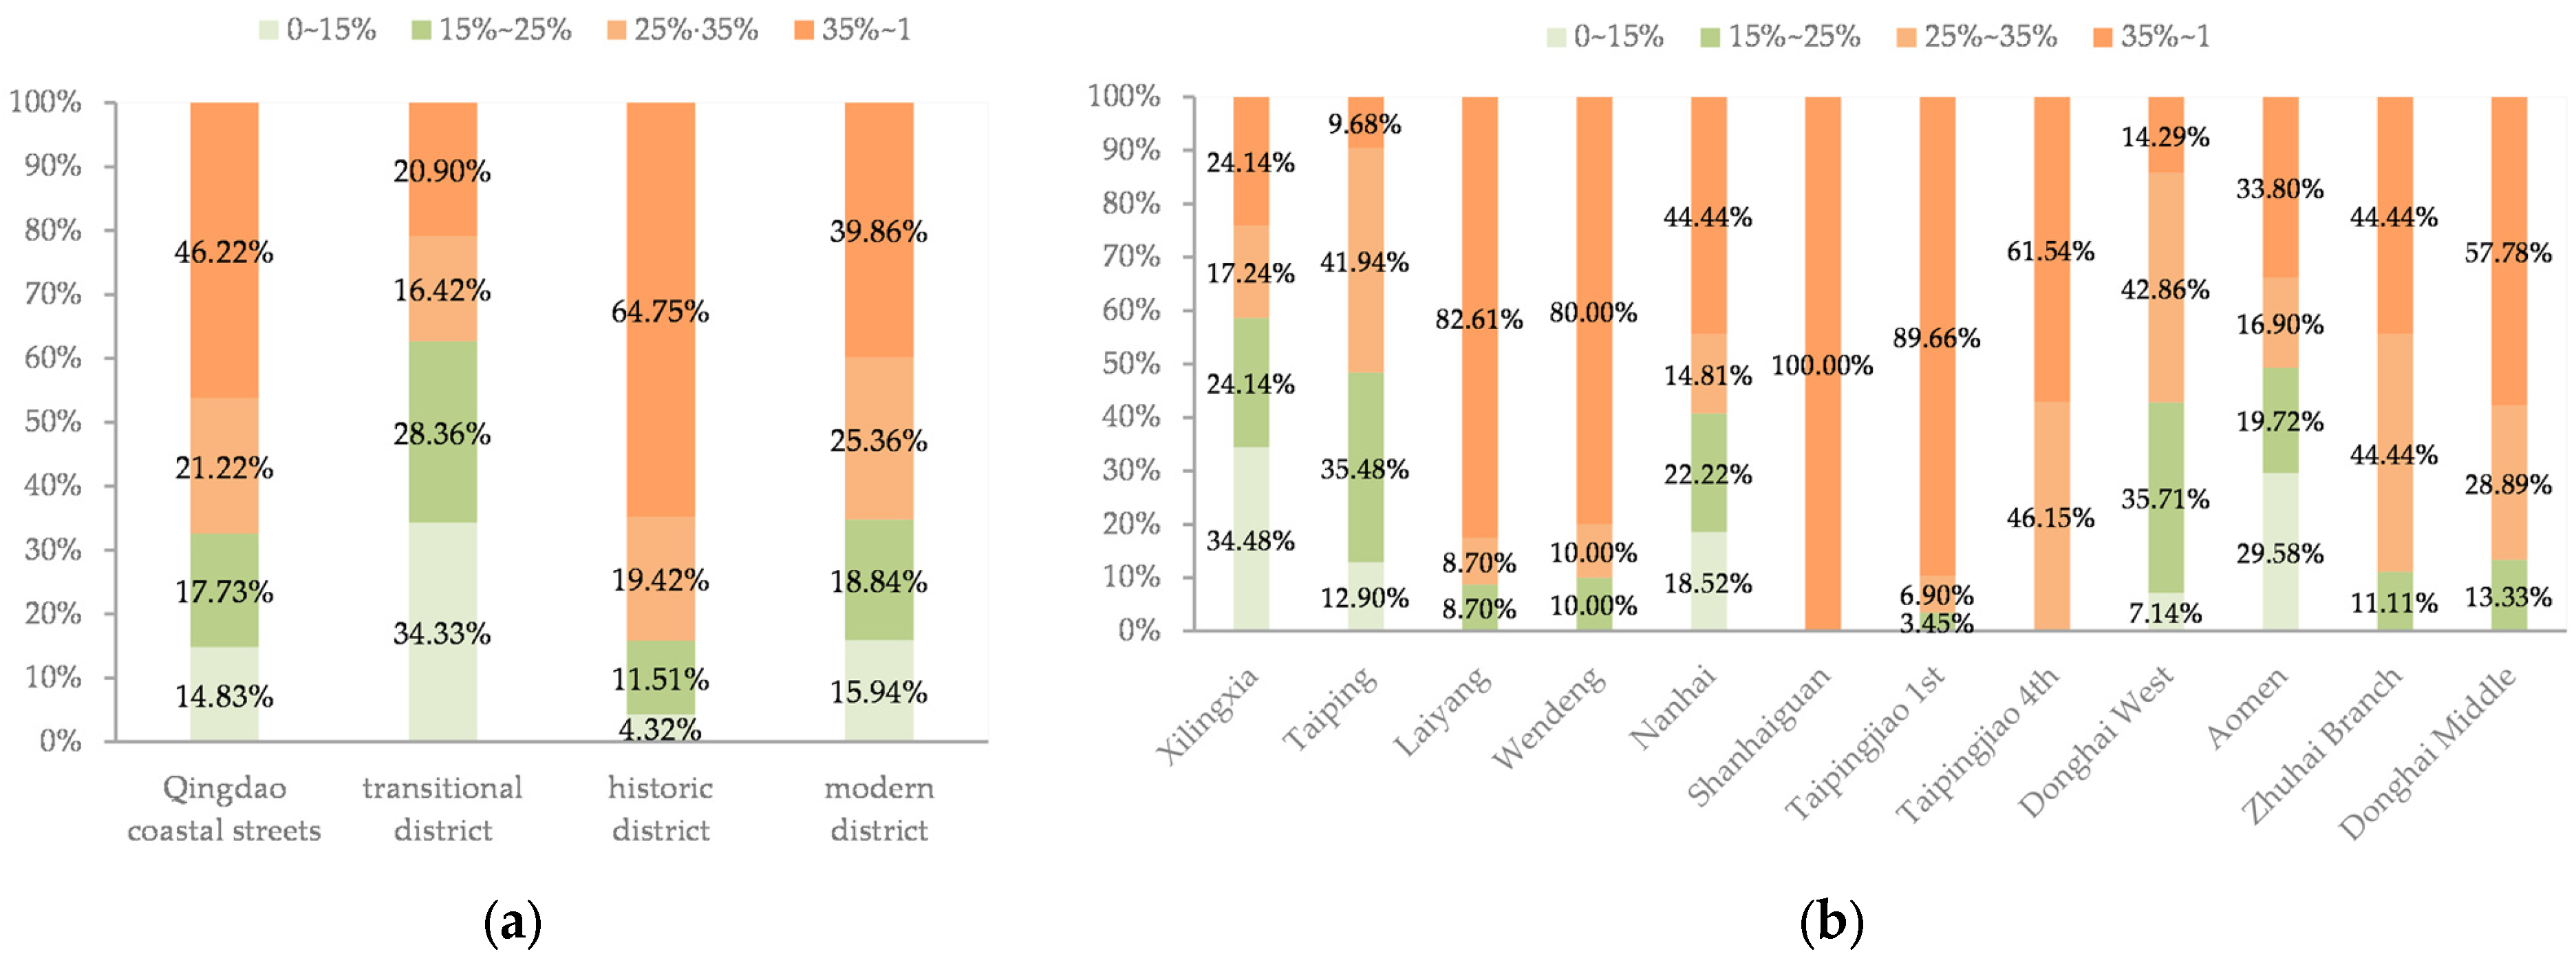
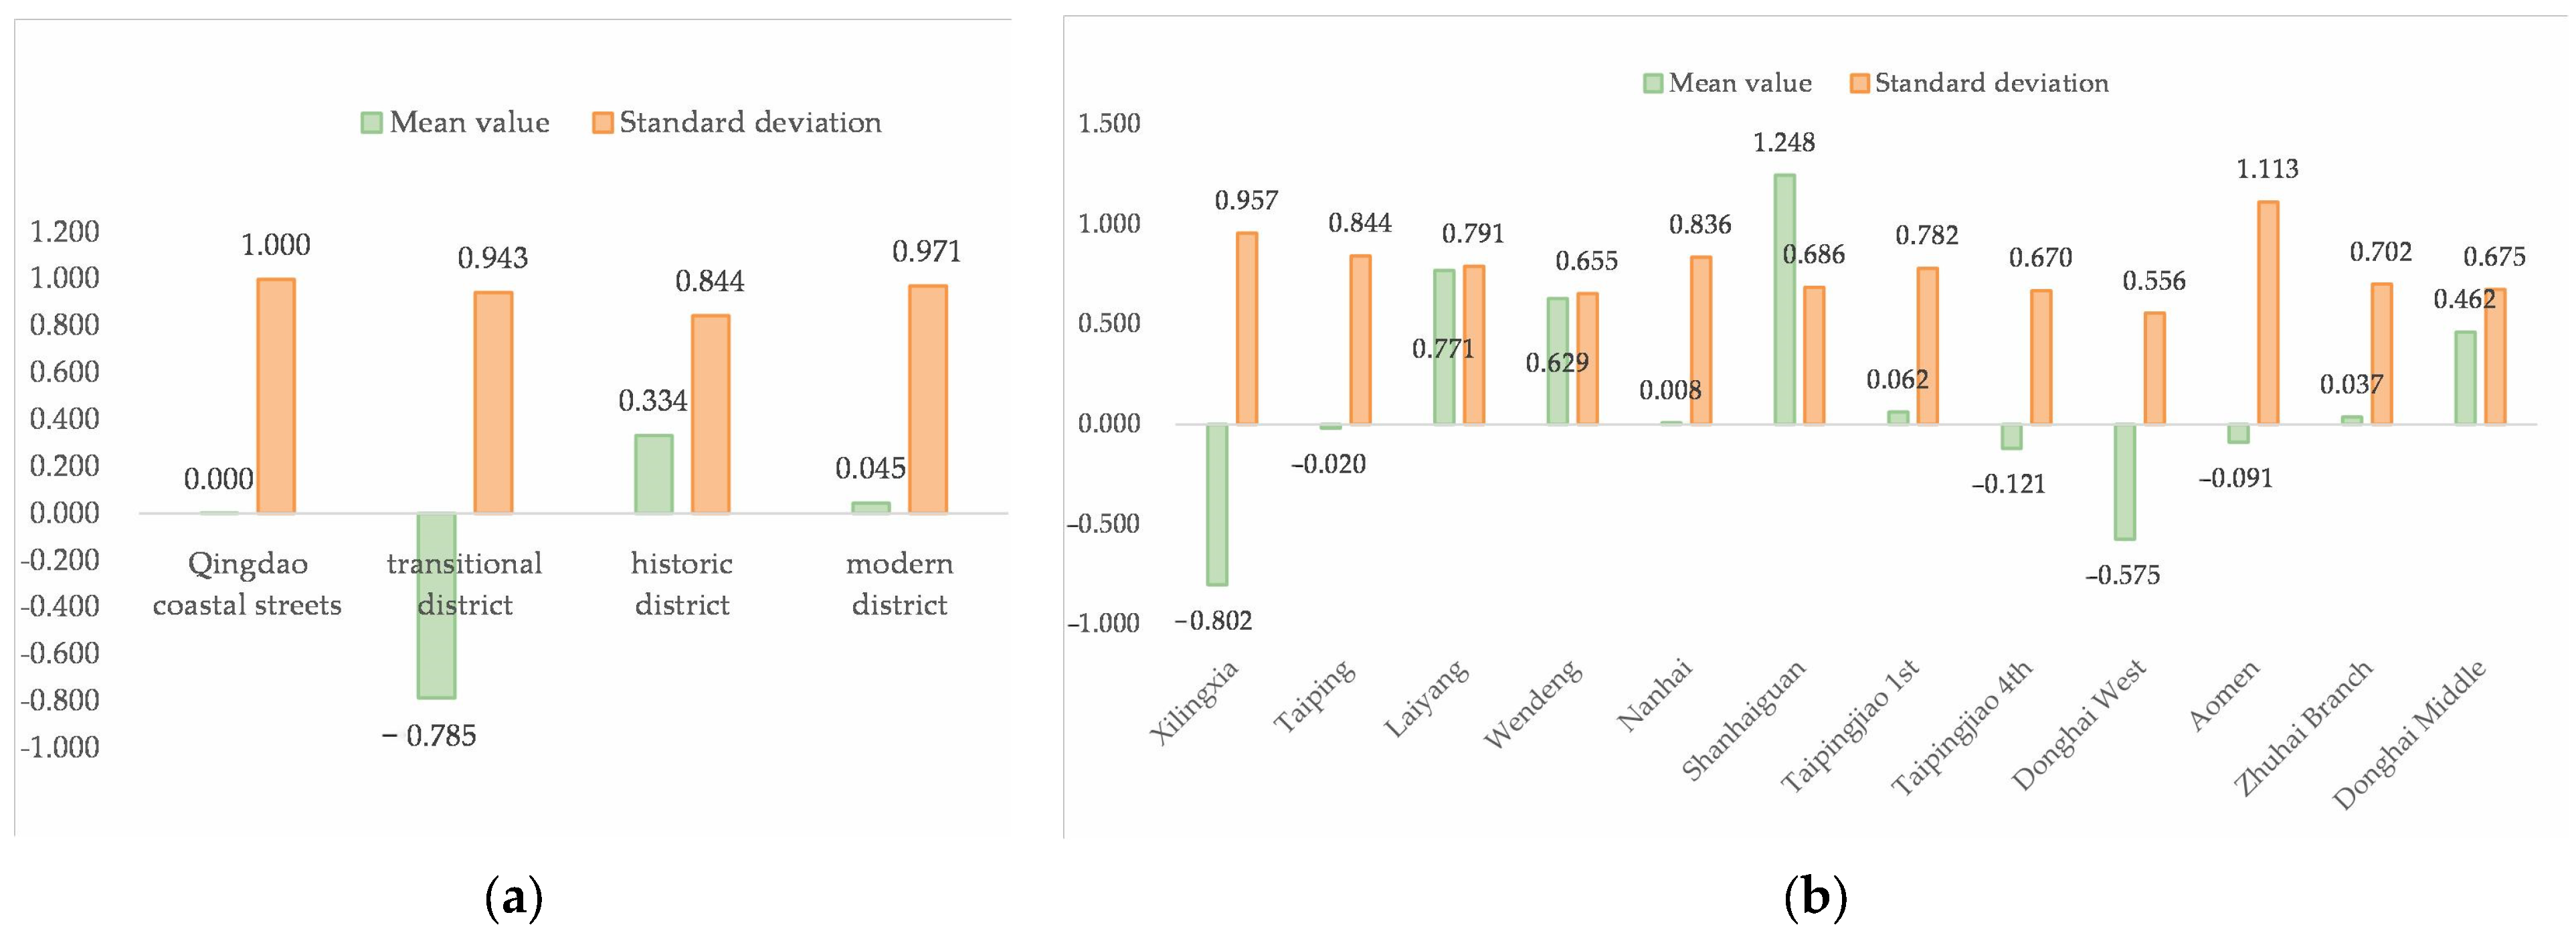
3.1. The GVI Analysis
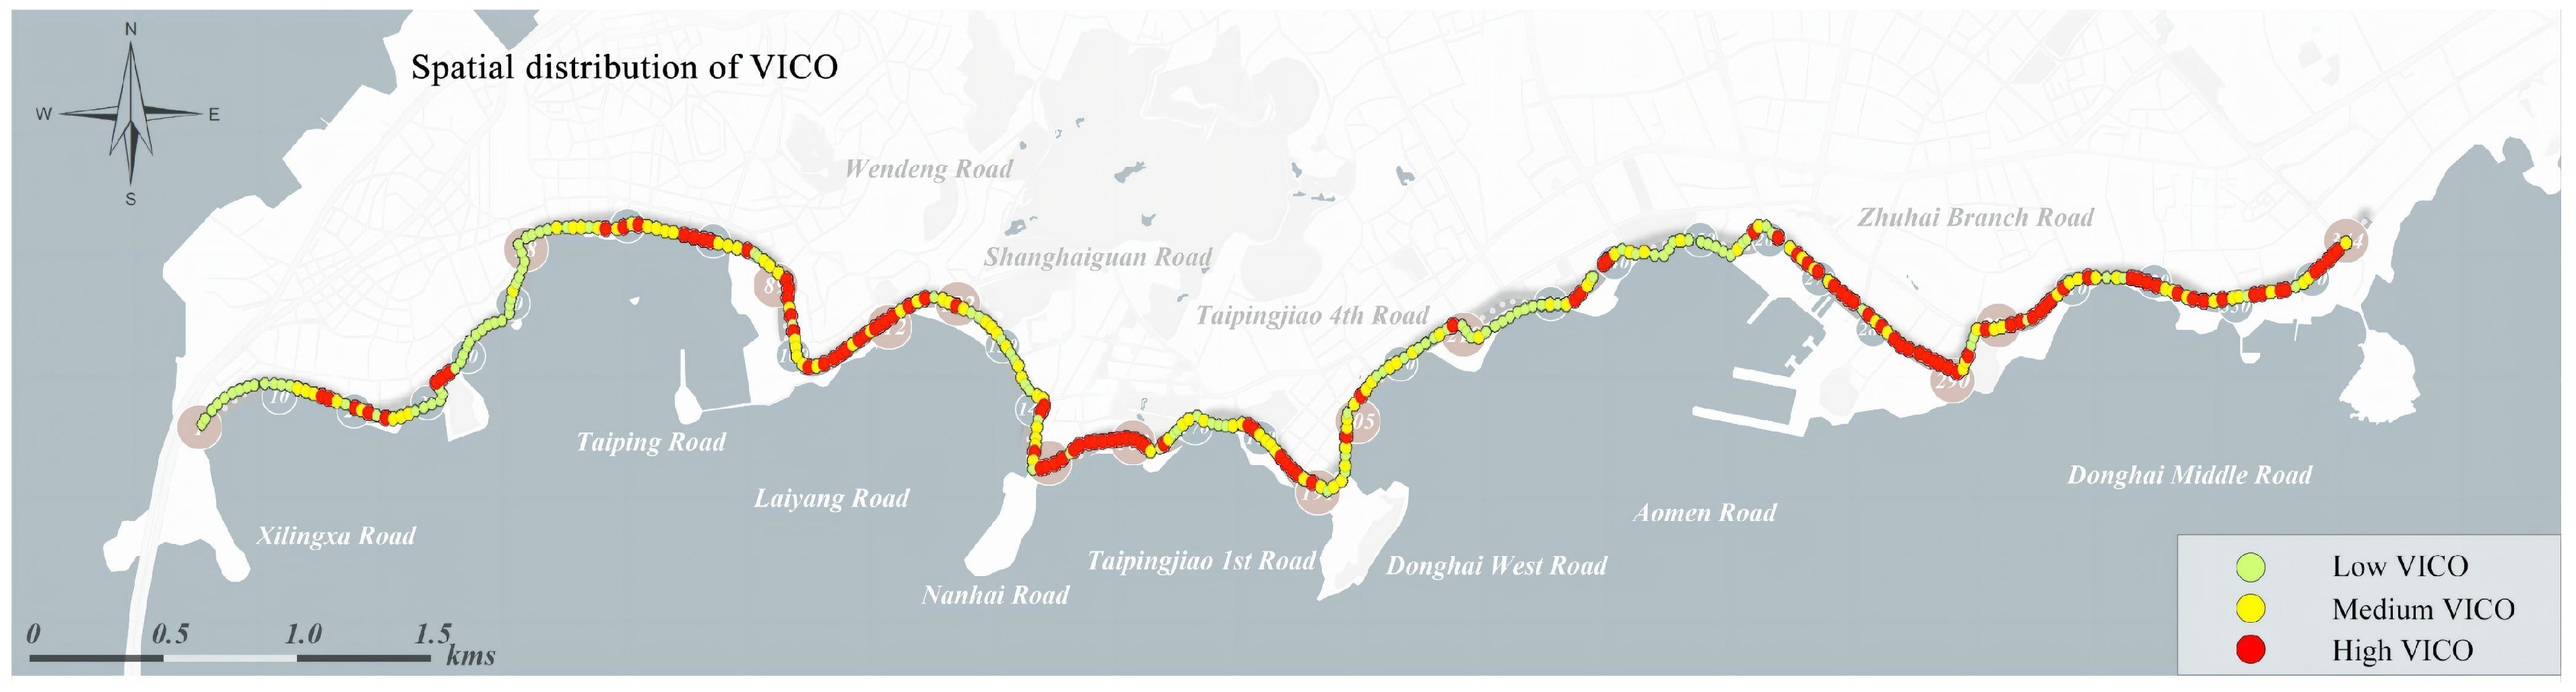
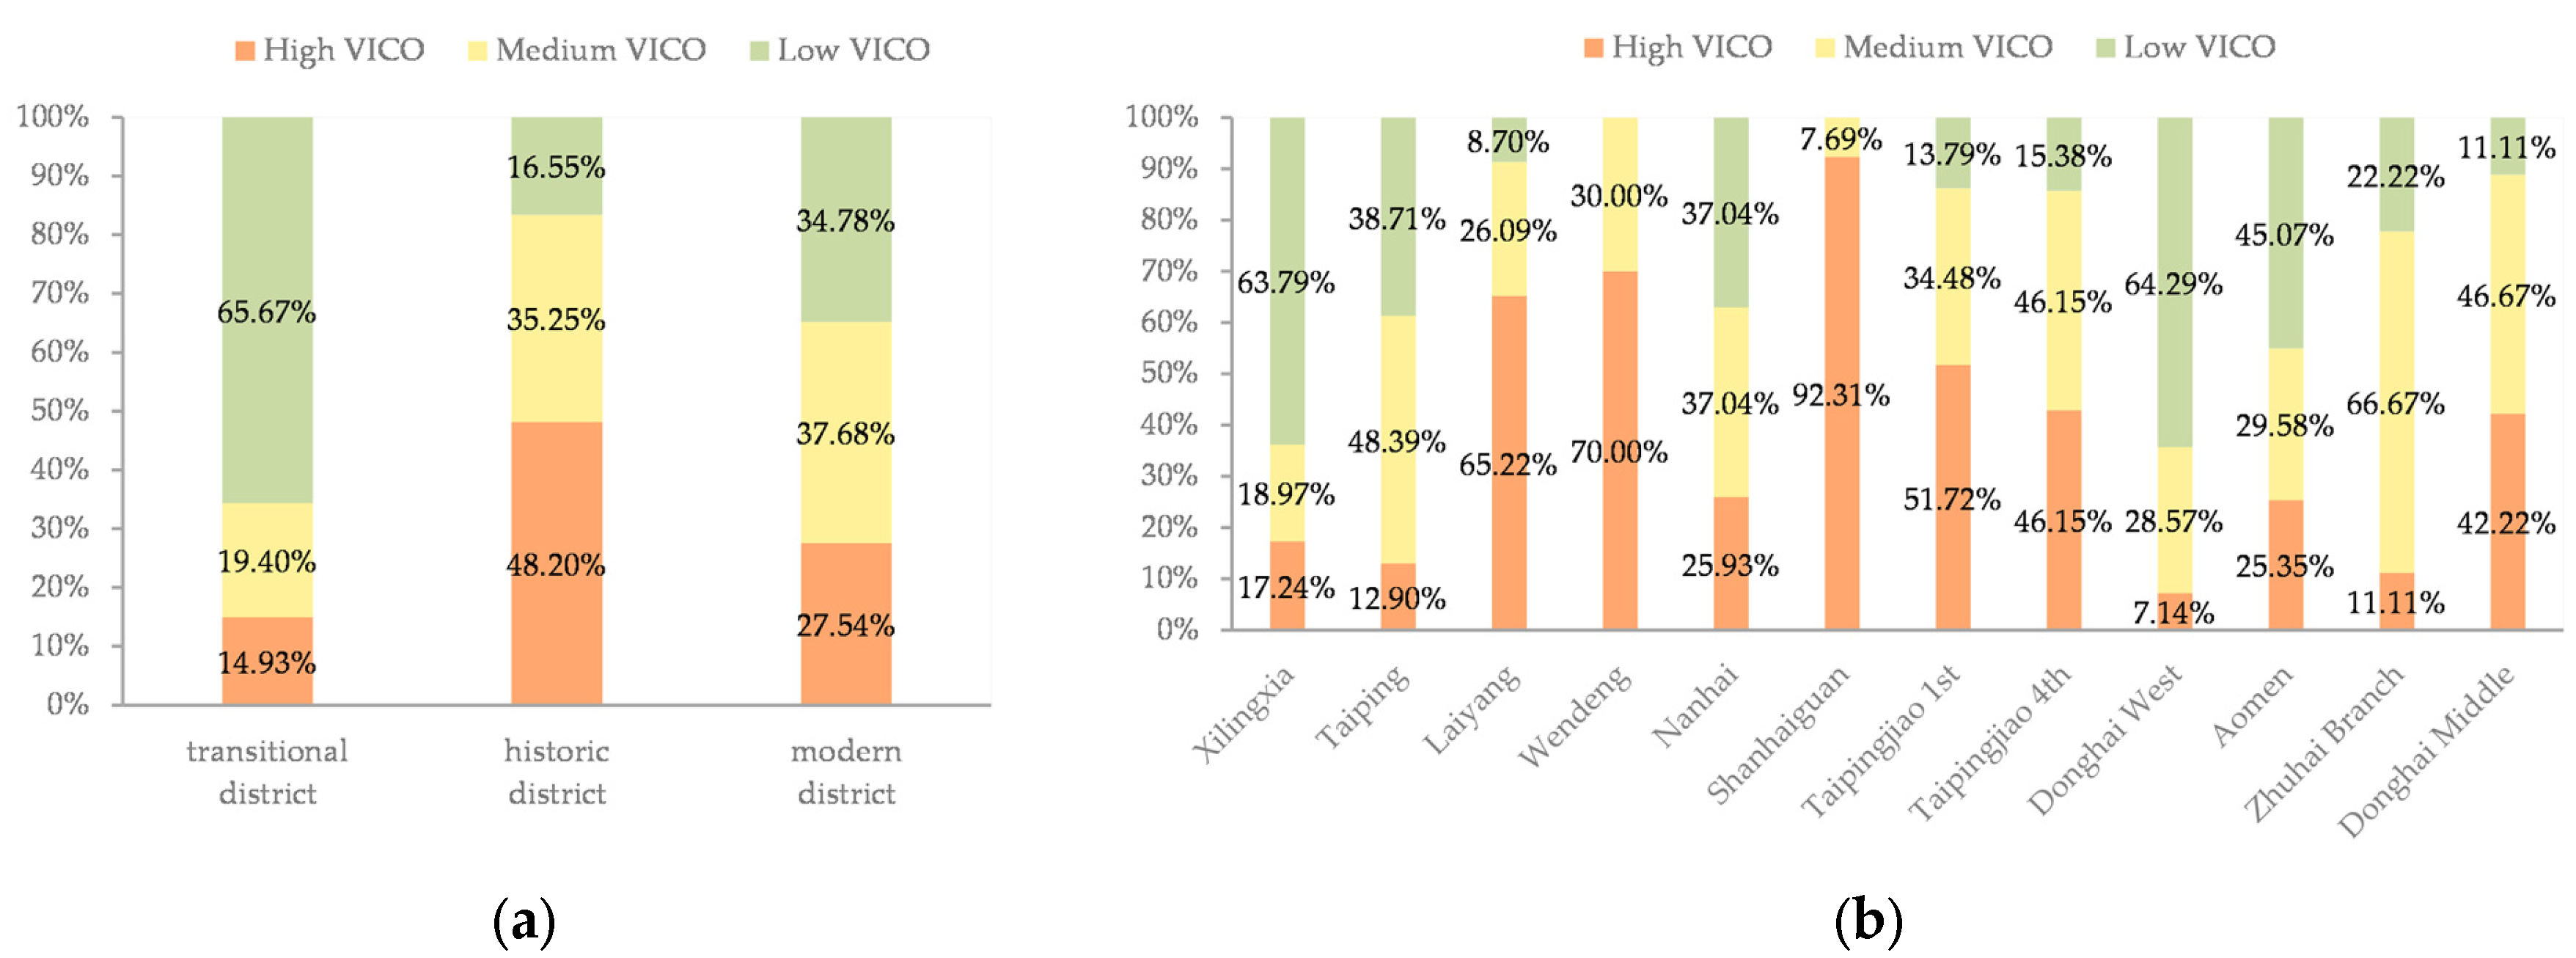
3.2. The VICO Analysis
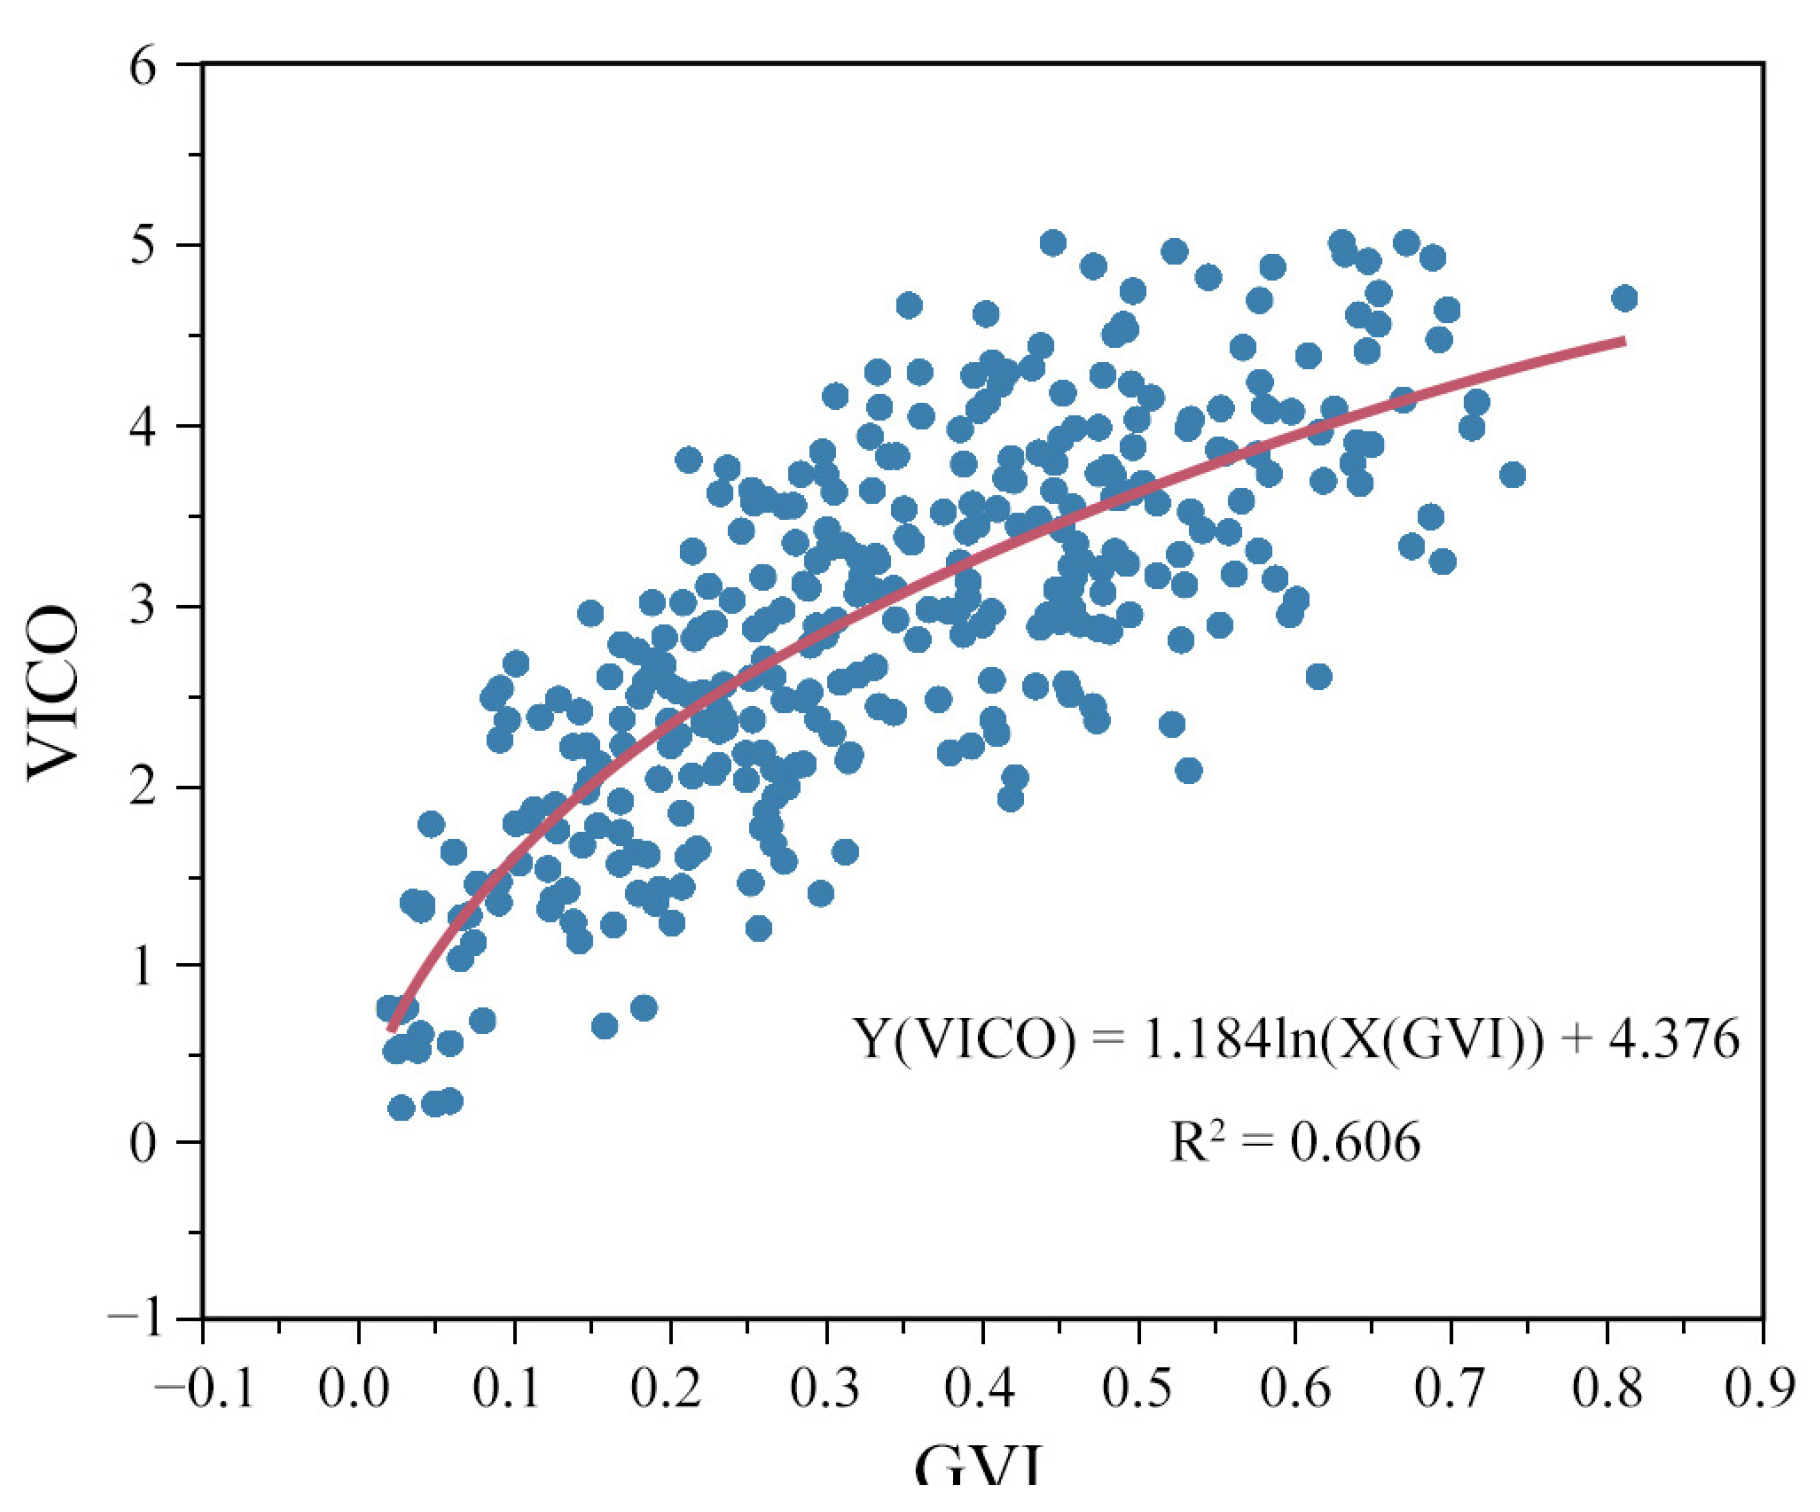
3.3. Correlation Analysis of the VICO and GVI
4. Discussion
4.1. The GVI of Qingdao Coastal Streets
4.2. The VICO of Qingdao Coastal Streets
4.3. Comparative Analysis of GVI and VICO
4.4. Limitations and Future Work
5. Conclusions
Author Contributions
Funding
Institutional Review Board Statement
Informed Consent Statement
Data Availability Statement
Acknowledgments
Conflicts of Interest
Appendix A

| NUM | VICO | GVI | NUM | VICO | GVI |
|---|---|---|---|---|---|
| 001 | 0.214 | 0.059 | 050 | 1.212 | 0.138 |
| 002 | 1.840 | 0.113 | 051 | 2.933 | 0.149 |
| 003 | 0.661 | 0.080 | 052 | 0.538 | 0.059 |
| 004 | 1.763 | 0.101 | 053 | 1.604 | 0.312 |
| 005 | 0.632 | 0.158 | 054 | 0.734 | 0.183 |
| 006 | 2.152 | 0.248 | 055 | 1.206 | 0.201 |
| 007 | 2.251 | 0.206 | 056 | 2.087 | 0.231 |
| 008 | 1.886 | 0.168 | 057 | 0.500 | 0.038 |
| 009 | 1.619 | 0.217 | 058 | 1.316 | 0.041 |
| 010 | 1.318 | 0.190 | 059 | 0.730 | 0.019 |
| 011 | 1.198 | 0.164 | 060 | 0.198 | 0.049 |
| 012 | 2.295 | 0.235 | 061 | 1.712 | 0.168 |
| 013 | 2.341 | 0.406 | 062 | 2.502 | 0.205 |
| 014 | 3.043 | 0.320 | 063 | 2.189 | 0.138 |
| 015 | 2.895 | 0.306 | 064 | 2.793 | 0.215 |
| 016 | 2.864 | 0.294 | 065 | 3.279 | 0.214 |
| 017 | 3.561 | 0.566 | 066 | 2.345 | 0.169 |
| 018 | 3.549 | 0.512 | 067 | 3.224 | 0.333 |
| 019 | 3.010 | 0.601 | 068 | 3.919 | 0.328 |
| 020 | 2.341 | 0.253 | 069 | 3.136 | 0.259 |
| 021 | 4.417 | 0.567 | 070 | 4.145 | 0.306 |
| 022 | 3.307 | 0.675 | 071 | 3.300 | 0.302 |
| 023 | 3.471 | 0.687 | 072 | 3.548 | 0.253 |
| 024 | 1.409 | 0.207 | 073 | 3.393 | 0.245 |
| 025 | 3.659 | 0.642 | 074 | 3.327 | 0.280 |
| 026 | 2.527 | 0.434 | 075 | 3.073 | 0.288 |
| 027 | 2.634 | 0.331 | 076 | 3.086 | 0.224 |
| 028 | 2.854 | 0.475 | 077 | 3.569 | 0.261 |
| 029 | 2.085 | 0.281 | 078 | 4.211 | 0.411 |
| 030 | 1.943 | 0.146 | 079 | 4.302 | 0.431 |
| 031 | 2.413 | 0.470 | 080 | 3.412 | 0.425 |
| 032 | 1.588 | 0.185 | 081 | 3.312 | 0.307 |
| 033 | 2.381 | 0.343 | 082 | 2.576 | 0.266 |
| 034 | 2.264 | 0.304 | 083 | 3.250 | 0.331 |
| 035 | 3.829 | 0.436 | 084 | 3.534 | 0.279 |
| 036 | 4.597 | 0.641 | 085 | 1.865 | 0.126 |
| 037 | 3.527 | 0.457 | 086 | 1.539 | 0.167 |
| 038 | 1.436 | 0.090 | 087 | 2.646 | 0.195 |
| 039 | 1.099 | 0.074 | 088 | 2.473 | 0.213 |
| 040 | 1.107 | 0.142 | 089 | 2.526 | 0.199 |
| 041 | 2.014 | 0.149 | 090 | 4.329 | 0.406 |
| 042 | 1.604 | 0.178 | 091 | 4.869 | 0.471 |
| 043 | 1.915 | 0.267 | 092 | 4.516 | 0.491 |
| 044 | 1.722 | 0.127 | 093 | 3.181 | 0.476 |
| 045 | 1.508 | 0.121 | 094 | 4.729 | 0.496 |
| 046 | 1.644 | 0.144 | 095 | 1.819 | 0.207 |
| 047 | 1.287 | 0.123 | 096 | 3.847 | 0.551 |
| 048 | 0.174 | 0.028 | 097 | 3.050 | 0.477 |
| 049 | 1.006 | 0.065 | 098 | 3.387 | 0.390 |
| NUM | VICO | GVI | NUM | VICO | GVI |
| 099 | 2.551 | 0.184 | 149 | 4.719 | 0.654 |
| 100 | 3.070 | 0.320 | 150 | 4.085 | 0.580 |
| 101 | 3.581 | 0.489 | 151 | 3.769 | 0.637 |
| 102 | 2.817 | 0.387 | 152 | 2.263 | 0.409 |
| 103 | 3.461 | 0.435 | 153 | 4.546 | 0.653 |
| 104 | 4.161 | 0.451 | 154 | 4.896 | 0.647 |
| 105 | 4.278 | 0.360 | 155 | 4.937 | 0.632 |
| 106 | 3.673 | 0.420 | 156 | 3.887 | 0.640 |
| 107 | 3.400 | 0.300 | 157 | 4.073 | 0.625 |
| 108 | 3.685 | 0.415 | 158 | 3.943 | 0.616 |
| 109 | 4.425 | 0.437 | 159 | 5.000 | 0.630 |
| 110 | 2.942 | 0.406 | 160 | 3.711 | 0.583 |
| 111 | 4.033 | 0.361 | 161 | 3.706 | 0.740 |
| 112 | 4.260 | 0.395 | 162 | 3.874 | 0.649 |
| 113 | 4.651 | 0.353 | 163 | 4.124 | 0.670 |
| 114 | 4.951 | 0.523 | 164 | 2.582 | 0.615 |
| 115 | 3.328 | 0.355 | 165 | 1.901 | 0.418 |
| 116 | 3.828 | 0.556 | 166 | 4.461 | 0.693 |
| 117 | 3.127 | 0.587 | 167 | 2.480 | 0.456 |
| 118 | 4.064 | 0.583 | 168 | 2.057 | 0.532 |
| 119 | 2.413 | 0.333 | 169 | 2.112 | 0.314 |
| 120 | 3.005 | 0.239 | 170 | 2.956 | 0.366 |
| 121 | 3.066 | 0.447 | 171 | 2.927 | 0.597 |
| 122 | 3.606 | 0.496 | 172 | 2.315 | 0.521 |
| 123 | 2.542 | 0.454 | 173 | 2.785 | 0.527 |
| 124 | 2.399 | 0.231 | 174 | 2.193 | 0.393 |
| 125 | 1.543 | 0.103 | 175 | 1.394 | 0.193 |
| 126 | 2.473 | 0.180 | 176 | 1.964 | 0.275 |
| 127 | 2.456 | 0.128 | 177 | 3.386 | 0.558 |
| 128 | 2.756 | 0.290 | 178 | 2.834 | 0.481 |
| 129 | 1.177 | 0.257 | 179 | 4.110 | 0.716 |
| 130 | 2.950 | 0.272 | 180 | 3.969 | 0.713 |
| 131 | 1.372 | 0.180 | 181 | 2.560 | 0.406 |
| 132 | 1.783 | 0.109 | 182 | 3.143 | 0.512 |
| 133 | 2.992 | 0.208 | 183 | 2.924 | 0.494 |
| 134 | 2.483 | 0.217 | 184 | 3.281 | 0.577 |
| 135 | 2.230 | 0.091 | 185 | 3.821 | 0.576 |
| 136 | 2.339 | 0.096 | 186 | 3.673 | 0.618 |
| 137 | 2.873 | 0.226 | 187 | 4.223 | 0.578 |
| 138 | 2.944 | 0.384 | 188 | 4.058 | 0.598 |
| 139 | 3.426 | 0.397 | 189 | 3.223 | 0.695 |
| 140 | 3.702 | 0.483 | 190 | 3.659 | 0.503 |
| 141 | 2.019 | 0.421 | 191 | 2.873 | 0.462 |
| 142 | 3.196 | 0.457 | 192 | 1.551 | 0.273 |
| 143 | 3.071 | 0.343 | 193 | 3.092 | 0.529 |
| 144 | 2.959 | 0.457 | 194 | 2.867 | 0.552 |
| 145 | 4.679 | 0.577 | 195 | 2.449 | 0.286 |
| 146 | 3.082 | 0.457 | 196 | 2.787 | 0.358 |
| 147 | 2.453 | 0.372 | 197 | 1.827 | 0.261 |
| 148 | 4.396 | 0.646 | 198 | 2.899 | 0.344 |
| NUM | VICO | GVI | NUM | VICO | GVI |
| 199 | 3.582 | 0.484 | 249 | 1.250 | 0.071 |
| 200 | 2.848 | 0.254 | 250 | 2.723 | 0.178 |
| 201 | 3.262 | 0.526 | 251 | 1.320 | 0.090 |
| 202 | 2.144 | 0.315 | 252 | 2.028 | 0.214 |
| 203 | 3.152 | 0.561 | 253 | 2.318 | 0.221 |
| 204 | 4.369 | 0.608 | 254 | 1.426 | 0.076 |
| 205 | 3.396 | 0.541 | 255 | 2.387 | 0.142 |
| 206 | 3.211 | 0.492 | 256 | 2.354 | 0.117 |
| 207 | 1.340 | 0.125 | 257 | 2.668 | 0.189 |
| 208 | 2.066 | 0.266 | 258 | 2.344 | 0.294 |
| 209 | 2.680 | 0.260 | 259 | 2.005 | 0.248 |
| 210 | 2.535 | 0.234 | 260 | 3.710 | 0.284 |
| 211 | 1.747 | 0.153 | 261 | 3.136 | 0.322 |
| 212 | 2.798 | 0.196 | 262 | 2.279 | 0.231 |
| 213 | 2.339 | 0.235 | 263 | 2.195 | 0.170 |
| 214 | 1.371 | 0.296 | 264 | 2.955 | 0.453 |
| 215 | 1.739 | 0.259 | 265 | 3.544 | 0.393 |
| 216 | 2.573 | 0.251 | 266 | 3.143 | 0.459 |
| 217 | 2.009 | 0.193 | 267 | 4.602 | 0.402 |
| 218 | 3.796 | 0.418 | 268 | 2.516 | 0.091 |
| 219 | 1.750 | 0.264 | 269 | 5.000 | 0.445 |
| 220 | 2.196 | 0.146 | 270 | 2.993 | 0.188 |
| 221 | 1.432 | 0.251 | 271 | 3.788 | 0.212 |
| 222 | 3.228 | 0.294 | 272 | 3.403 | 0.451 |
| 223 | 1.387 | 0.134 | 273 | 3.713 | 0.474 |
| 224 | 0.494 | 0.024 | 274 | 4.015 | 0.499 |
| 225 | 0.590 | 0.040 | 275 | 4.076 | 0.553 |
| 226 | 1.759 | 0.047 | 276 | 4.136 | 0.508 |
| 227 | 1.237 | 0.066 | 277 | 2.336 | 0.473 |
| 228 | 0.734 | 0.030 | 278 | 3.618 | 0.446 |
| 229 | 0.718 | 0.027 | 279 | 3.226 | 0.463 |
| 230 | 0.513 | 0.028 | 280 | 3.603 | 0.232 |
| 231 | 2.653 | 0.101 | 281 | 2.890 | 0.449 |
| 232 | 1.604 | 0.061 | 282 | 3.970 | 0.474 |
| 233 | 2.581 | 0.161 | 283 | 3.610 | 0.305 |
| 234 | 3.621 | 0.252 | 284 | 4.915 | 0.688 |
| 235 | 3.743 | 0.237 | 285 | 5.000 | 0.672 |
| 236 | 3.245 | 0.321 | 286 | 4.626 | 0.698 |
| 237 | 2.548 | 0.309 | 287 | 4.690 | 0.811 |
| 238 | 2.092 | 0.285 | 288 | 5.000 | 0.630 |
| 239 | 3.423 | 0.423 | 289 | 4.864 | 0.586 |
| 240 | 3.832 | 0.297 | 290 | 4.808 | 0.545 |
| 241 | 2.762 | 0.168 | 291 | 2.589 | 0.320 |
| 242 | 2.449 | 0.273 | 292 | 3.109 | 0.391 |
| 243 | 2.849 | 0.474 | 293 | 3.619 | 0.329 |
| 244 | 2.333 | 0.199 | 294 | 2.045 | 0.228 |
| 245 | 2.460 | 0.087 | 295 | 1.645 | 0.266 |
| 246 | 1.283 | 0.040 | 296 | 2.891 | 0.261 |
| 247 | 1.322 | 0.035 | 297 | 4.113 | 0.403 |
| 248 | 1.295 | 0.040 | 298 | 2.869 | 0.400 |
| NUM | VICO | GVI | NUM | VICO | GVI |
| 299 | 3.217 | 0.385 | 322 | 3.959 | 0.385 |
| 300 | 4.066 | 0.397 | 323 | 3.321 | 0.459 |
| 301 | 4.276 | 0.415 | 324 | 3.765 | 0.388 |
| 302 | 2.155 | 0.379 | 325 | 3.500 | 0.533 |
| 303 | 3.497 | 0.375 | 326 | 2.859 | 0.437 |
| 304 | 3.532 | 0.273 | 327 | 3.966 | 0.531 |
| 305 | 3.710 | 0.299 | 328 | 3.278 | 0.485 |
| 306 | 3.809 | 0.340 | 329 | 3.016 | 0.390 |
| 307 | 3.060 | 0.330 | 330 | 1.575 | 0.211 |
| 308 | 4.081 | 0.334 | 331 | 3.746 | 0.480 |
| 309 | 2.491 | 0.221 | 332 | 4.015 | 0.533 |
| 310 | 3.313 | 0.311 | 333 | 2.949 | 0.378 |
| 311 | 4.279 | 0.333 | 334 | 3.906 | 0.450 |
| 312 | 2.842 | 0.219 | 335 | 4.488 | 0.485 |
| 313 | 2.155 | 0.259 | 336 | 2.092 | 0.154 |
| 314 | 3.359 | 0.352 | 337 | 2.809 | 0.299 |
| 315 | 2.196 | 0.200 | 338 | 2.925 | 0.442 |
| 316 | 3.773 | 0.446 | 339 | 4.261 | 0.477 |
| 317 | 3.513 | 0.350 | 340 | 3.811 | 0.345 |
| 318 | 4.213 | 0.495 | 341 | 3.860 | 0.496 |
| 319 | 3.516 | 0.409 | 342 | 4.544 | 0.490 |
| 320 | 2.495 | 0.289 | 343 | 3.965 | 0.459 |
| 321 | 3.096 | 0.286 | 344 | 2.878 | 0.228 |
References
- Dillen, S.; De Vries, S.; Groenewegen, P.; Spreeuwenberg, P. Greenspace in urban neighbourhoods and residents’ health: Adding quality to quantity. J. Epidemiol. Community Health 2011, 66, e8. [Google Scholar] [CrossRef] [PubMed]
- Chen, X.; Meng, Q.Y.; Hu, D.; Zhang, L.L.; Yang, J. Evaluating Greenery around Streets Using Baidu Panoramic Street View Images and the Panoramic Green View Index. Forests 2019, 10, 1109. [Google Scholar] [CrossRef]
- Falfán, I.; Muñoz-Robles, C.A.; Bonilla-Moheno, M.; MacGregor-Fors, I. Can you really see ‘green’? Assessing physical and self-reported measurements of urban greenery. Urban For. Urban Green. 2018, 36, 13–21. [Google Scholar] [CrossRef]
- Kaplan, R. Some Methods and Strategies in the Prediction of Preference; Halsted Press New York: New York, NY, USA, 1975; pp. 118–129. [Google Scholar]
- Wang, Y.Y.; Huang, J.L. Construction of evaluation model of urban ecological comfort index based on green view index. Acta Ecologica Sinica 2021, 41, 2170–2179. [Google Scholar] [CrossRef]
- Zhai, Y.J.; He, X.F. A review of visual landscape theories and related empirical studies. J. Chin. Urban For. 2017, 15, 11–15. [Google Scholar] [CrossRef]
- Fan, R.; Xu, H.W. Study on visual quality of taihu greenway landscape space based on ecological diversity. J. Hum. Settl. West China 2019, 34, 19–25. [Google Scholar] [CrossRef]
- Liu, B.Y.; Fan, R. Quantitative analysis of the visual attraction elements of landscape space. J. Nanjing For. Univ. Nat. Sci. Ed. 2014, 38, 49–152. [Google Scholar] [CrossRef]
- Gong, P. Study on Animation Media-Based Perceived Safety Evaluation on Visual Landscape of Urban Park Plants. Ph.D. Thesis, Jiangxi Agricultural University, Nanchang, China, 2018. [Google Scholar]
- Daniel, T.C.; Vining, J. Methodological Issues in the Assessment of Landscape; Plenum Press: New York, NY, USA, 1983; pp. 39–80. [Google Scholar] [CrossRef]
- Ulrich, R.S. Human responses to vegetation and landscapes. Landsc. Urban Plan. 1986, 13, 29–44. [Google Scholar] [CrossRef]
- Liu, B.Y.; Fan, R. Research on Visual Attraction Elements and Mechanism of Landscape Space. Chin. Landsc. Archit. 2013, 29, 5–10. [Google Scholar]
- Tang, Z.; Liu, B.Y. Progress in Visual Landscape Evaluation. Landsc. Archit. 2015, 9, 113–120. [Google Scholar] [CrossRef]
- Yao, Y.M.; Chang, J.; Yang, H.Y.; Xie, B. Current Status and Trends of Research on Landscape Visual Quality Evaluation. J. West Anhui Univ. 2021, 37, 110–119. [Google Scholar]
- Rodriguez-Valencia, A.; Ortiz-Ramirez, H.A. Understanding Green Street Design: Evidence from Three Cases in the U.S. Sustainability 2021, 13, 1916. [Google Scholar] [CrossRef]
- Chen, W.Y.; Jim, C.Y. Cost–benefit analysis of the leisure value of urban greening in the new Chinese city of Zhuhai. Cities 2008, 25, 298–309. [Google Scholar] [CrossRef]
- Ferla, G.; Caputo, P.; Colaninno, N.; Morello, E. Urban greenery management and energy planning: A GIS-based potential evaluation of pruning by-products for energy application for the city of Milan. Renew. Energy 2020, 160, 185–195. [Google Scholar] [CrossRef]
- Nourmohammadi, Z.; Lilasathapornkit, T.; Ashfaq, M.; Gu, Z.; Saberi, M. Mapping urban environmental performance with emerging data sources: A case of urban greenery and traffic noise in Sydney, Australia. Sustainability 2021, 13, 605. [Google Scholar] [CrossRef]
- Kim, Y.J.; Hyun, J.; Yoo, S.Y.; Yoo, G. The role of biochar in alleviating soil drought stress in urban roadside greenery. Geoderma 2021, 404, 115223. [Google Scholar] [CrossRef]
- Xu, L.; Jiang, Q.; Xiao, Z.; Li, X.; Huo, J.; Wang, S.; Dai, L. Plasma-engraved Co3O4 nanosheets with oxygen vacancies and high surface area for the oxygen evolution reaction. Angew. Chem. 2016, 55, 5277–5281. [Google Scholar] [CrossRef]
- Zhao, L.; Li, T.; Przybysz, A.; Guan, Y.; Ji, P.; Ren, B.; Zhu, C. Effect of urban lake wetlands and neighboring urban greenery on air PM10 and PM2. 5 mitigation. Build. Environ. 2021, 206, 108291. [Google Scholar] [CrossRef]
- Mcpherson, E.G.; Simpson, J.R.; Xiao, Q.; Wu, C. Million trees Los Angeles canopy cover and benefit assessment. Landsc. Urban Plan. 2011, 99, 40–50. [Google Scholar] [CrossRef]
- Mcpherson, G.; Simpson, J.R.; Peper, P.J.; Maco, S.E.; Xiao, Q. Municipal forest benefits and costs in five US cities. J. For. 2005, 103, 411–416. [Google Scholar] [CrossRef]
- Lu, Y. Using Google Street View to investigate the association between street greenery and physical activity. Landsc. Urban Plan. 2019, 191, 103435. [Google Scholar] [CrossRef]
- Lu, Y.; Sarkar, C.; Xiao, Y. The effect of street-level greenery on walking behavior: Evidence from Hong Kong. Soc. Sci. Med. 2018, 208, 41–49. [Google Scholar] [CrossRef]
- Rajoo, K.S.; Karam, D.S.; Abdu, A.; Rosli, Z.; Gerusu, G.J. Addressing psychosocial issues caused by the COVID-19 lockdown: Can urban greeneries help? Urban For. Urban Green. 2021, 65, 127340. [Google Scholar] [CrossRef]
- Ulrich, R. View through a window may influence recovery. Science 1984, 224, 224–225. [Google Scholar] [CrossRef]
- Leslie, E.; Sugiyama, T.; Ierodiaconou, D.; Kremer, P. Perceived and objectively measured greenness of neighbourhoods: Are they measuring the same thing? Landsc. Urban Plan. 2010, 95, 28–33. [Google Scholar] [CrossRef]
- Beyer, K.; Kaltenbach, A.; Szabo, A.; Bogar, S.; Nieto, F.; Malecki, K. Exposure to neighborhood green space and mental health: Evidence from the survey of the health of Wisconsin. Int. J. Environ. Res. Public Health 2014, 11, 3453–3472. [Google Scholar] [CrossRef]
- Dadvand, P.; Nieuwenhuijsen, M.J.; Esnaola, M.; Forns, J.; Basagaña, X.; Alvarez-Pedrerol, M.; Rivas, I.; López-Vicente, M.; Pascual, M.D.C.; Su, J.; et al. Green spaces and cognitive development in primary schoolchildren. Proc. Natl. Acad. Sci. USA 2015, 112, 7937–7942. [Google Scholar] [CrossRef]
- Gilbert, N. Green space: A natural high. Nature 2016, 531, S56–S57. [Google Scholar] [CrossRef]
- Chiesura, A. The role of urban parks for the sustainable city. Landsc. Urban Plan 2004, 68, 129–138. [Google Scholar] [CrossRef]
- Hartig, T.; Mitchell, R.; de Vries, S.; Frumkin, H. Nature and health. Annu. Rev. Public Health 2014, 35, 207–228. [Google Scholar] [CrossRef]
- Wang, R.; Yang, B.; Yao, Y.; Bloom, M.S.; Feng, Z.; Yuan, Y. Residential greenness, air pollution and psychological well-being among urban residents in Guangzhou, China. Sci. Total Environ. 2020, 711, 134843. [Google Scholar] [CrossRef] [PubMed]
- Van den Bosch, M.; Nieuwenhuijsen, M. No time to lose—Green the cities now. Environ. Int. 2017, 99, 343–350. [Google Scholar] [CrossRef] [PubMed]
- Akpinar, A.; Barbosa-Leiker, C.; Brooks, K.R. Does green space matter? Exploring relationships between green space type and health indicators. Urban For. Urban Green. 2016, 20, 407–418. [Google Scholar] [CrossRef]
- Douglas, O.; Lennon, M.; Scott, M. Green space benefits for health and well-being: A life-course approach for urban planning, design and management. Cities 2017, 66, 53–62. [Google Scholar] [CrossRef]
- Van Vliet, K.; Hammond, C. Residents’ perceptions of green infrastructure in the contemporary residential context: A study of Kingswood, Kingston-upon-Hull, England. J. Environ. Plan. Manag. 2021, 64, 145–163. [Google Scholar] [CrossRef]
- Barnett, D.W.; Barnett, A.; Nathan, A.; Van Cauwenberg, J.; Cerin, E.; Grp, C.O.A.W. Built environmental correlates of older adults’ total physical activity and walking: A systematic review and meta-analysis. Int. J. Behav. Nutr. Phys. Act 2017, 14, 103. [Google Scholar] [CrossRef]
- Finlay, J.; Franke, T.; McKay, H.; Sims-Gould, J. Therapeutic landscapes and wellbeing in later life: Impacts of blue and green spaces for older adults. Health Place 2015, 34, 97–106. [Google Scholar] [CrossRef]
- Tzoulas, K.; Korpela, K.; Venn, S.; Yli-Pelkonen, V.; Kazmierczak, A.; Niemela, J.; James, P. Promoting ecosystem and human health in urban areas using Green Infrastructure: A literature review. Landsc. Urban Plan 2007, 81, 167–178. [Google Scholar] [CrossRef]
- Ugolini, F.; Massetti, L.; Calaza-Martinez, P.; Carinanos, P.; Dobbs, C.; Ostoic, S.K. Effects of the COVID-19 pandemic on the use and perceptions of urban green space: An international exploratory study. Urban For. Urban Green. 2020, 56, 9. [Google Scholar] [CrossRef]
- Wang, J.B.; Wei, L.; Gou, A.P. Numerical characteristics and spatial distribution of panoramic Street Green View index based on SegNet semantic segmentation in Savannah. Urban For. Urban Green. 2022, 69, 127488. [Google Scholar] [CrossRef]
- Chen, J.J.; Zhou, C.B.; Li, F. Quantifying the green view indicator for assessing urban greening quality: An analysis based on Internet-crawling street view data. Ecol. Indic. 2020, 113, 106192. [Google Scholar] [CrossRef]
- Ohno, R. A Hypothetical Model of Environmental Perception. In Theoretical Perspectives in Environment-Behavior Research; Demick, J., Yamamoto, T., Minami, H., Eds.; Springer: Berlin/Heidelberg, Germany, 2000; pp. 149–156. [Google Scholar]
- Bain, L.; Gray, B.; Rodgers, D. Living Streets: Strategies for Crafting Public Space, 1st ed.; John Wiley & Sons: Hoboken, NJ, USA, 2012. [Google Scholar]
- Schroeder, H.W.; Cannon, W.N. The esthetic contribution of trees to residential streets in Ohio towns. J. Arboric 1983, 9, 237–243. [Google Scholar] [CrossRef]
- Wolf, K.L. Business district streetscapes, trees, and consumer response. J. For. 2005, 103, 396–400. [Google Scholar] [CrossRef]
- Balram, S.; Dragievi, S. Attitudes toward urban green spaces: Integrating questionnaire survey and collaborative GIS techniques to improve attitude measurements. Landsc. Urban Plan 2005, 71, 147–162. [Google Scholar] [CrossRef]
- Camacho-Cervantes, M.; Schondube, J.; Castillo, A.; MacGregor-Fors, I. How do people perceive urban trees? Assessing likes and dislikes in relation to the trees of a city. Urban Ecosyst. 2014, 17, 761–773. [Google Scholar] [CrossRef]
- Humpel, N.; Owen, N.; Leslie, E. Environmental factors associated with adults’ participation in physical activity: A review. Am. J. Prev. Med. 2002, 22, 188–199. [Google Scholar] [CrossRef]
- Gan, Z.X. Discussion on Several Problems of Waterfront Development. City Plan. Rev. 1998, 2, 42–45. [Google Scholar]
- Lyu, M.; Meng, Y.M.; Gao, W.J.; Yu, Y.J.; Ji, X.; Li, Q.Y.; Huang, G.H. Measuring the perceptual features of coastal streets: A case study in Qingdao, China. Environ. Res. Commun. 2022, 4, 115002. [Google Scholar] [CrossRef]
- Xu, X.G.; Yang, L. The Application Of Circle-layer Model In Coastal Region Planning: Dalian Example. Planners 2014, 30, 41–46. [Google Scholar]
- Xi, J.L.; Wu, Z.F.; Xian, S.Z. Research Progress and Prospect of Urban Waterfront Space in China. Ecol. Econ. 2021, 37, 12. [Google Scholar]
- Kaczynski, A.T.; Henderson, K.A. Environmental correlates of physical activity: A review of evidence about parks and recreation. Leis. Sci. 2007, 29, 315–354. [Google Scholar] [CrossRef]
- Scott, K.I.; Mcpherson, E.G.; Simpson, J.R. Air pollutant uptake by Sacramento’s urban forest. J. Arboric. 1998, 24, 224–234. [Google Scholar] [CrossRef]
- Xiao, Q.; Mcpherson, E.G.; Ustin, S.L.; Grismer, M.E. A new approach to modeling tree rainfall interception. J. Geophys. Res. Atmos. 2000, 105, 29173–29188. [Google Scholar] [CrossRef]
- Nowak, D.J.; Crane, D.E. Carbon storage and sequestration by urban trees in the USA. Environ. Pollut. 2002, 116, 381–389. [Google Scholar] [CrossRef] [PubMed]
- Fraser, E.D.G.; Kenney, W.A. Cultural background and landscape history as factors affecting perceptions of the urban forest. J. Arboric. 2000, 26, 106–113. [Google Scholar] [CrossRef]
- Ohno, R.; Udagawa, A.; Soeda, M. Effects of emerging scenes from the occluding edges on visual attention and evaluation of the landscape. J. Archit. Plan. 2002, 556, 197–203. [Google Scholar] [CrossRef]
- Yu, S.; Yu, B.; Song, W.; Wu, B.; Zhou, J.; Huang, Y.; Mao, W. View-based greenery: A three-dimensional assessment of city buildings’ green visibility using Floor Green View Index. Urban Plan. 2016, 152, 13–26. [Google Scholar] [CrossRef]
- Li, X.; Zhang, C.; Li, W.; Kuzovkina, Y.A. Environmental inequities in terms of different types of urban greenery in Hartford. Urban For. Urban Green. 2016, 18, 163–172. [Google Scholar] [CrossRef]
- Yang, J.; Zhao, L.; Mcbride, J.; Gong, P. Can you see green? Assessing the visibility of urban forests in cities. Landsc. Urban Plan. 2009, 91, 97–104. [Google Scholar] [CrossRef]
- Li, X.; Zhang, C.; Li, W.; Ricard, R.; Meng, Q.; Zhang, W. Assessing street-level urban greenery using Google Street View and a modified green view index. Urban For. Urban Green. 2015, 14, 675–685. [Google Scholar] [CrossRef]
- Susaki, J.; Kubota, S. Automatic assessment of green space ratio in urban areas from mobile scanning data. Remote Sens. 2017, 9, 215. [Google Scholar] [CrossRef]
- Aoki, Y. Relationship between perceived greenery and width of visual fields. J. Jpn. Inst. Landsc. Archit. 1987, 51, 1–10. [Google Scholar] [CrossRef]
- Xiao, L. Multiscale analysis on the driving factors of urban street-view greenery in China based on internet street view map bigdata. Ph.D. Thesis, Northeast Institute of Geography and Agroecology, Beijing, China, 2021. [Google Scholar] [CrossRef]
- Liu, X.B.; Dong, L.T.; Zhao, L. Research on Spatial Quality Optimization Measures of Historical Streets from the Perspective of Green Looking Rate. Urban. Archit. 2021, 18, 26–28. [Google Scholar] [CrossRef]
- Helbich, M.; Yao, Y.; Liu, Y.; Zhang, J.; Liu, P.; Wang, R. Using deep learning to examine street view green and blue spaces and their associations with geriatric depression in Beijing, China. Environ. Int. 2019, 126, 107–117. [Google Scholar] [CrossRef]
- Wu, Z.W.; Shan, H.N.; Wang, Y.H. VisuaI EcoIogicaI Design of High-density Urban Residential Area Based on Green Seeing Rate: Taking Beijing as an ExampIe. Huazhong Archit. 2016, 34, 57–60. [Google Scholar] [CrossRef]
- Wu, J.; Cheng, L.; Chu, S.S.; Xia, N.; Li, M.C. A green view index for urban transportation: How much greenery do we view while moving around in cities? Int. J. Sustain. Transp. 2020, 14, 972–989. [Google Scholar] [CrossRef]
- Li, X.; Zhang, C.; Li, W. Does the visibility of greenery increase perceived safety in urban areas? Evidence from the Place Pulse 1.0 dataset. ISPRS Int. J. Geo-Inf. 2015, 4, 1166–1183. [Google Scholar] [CrossRef]
- Ki, D.; Lee, S. Analyzing the effects of Green View Index of neighborhood streets on walking time using Google Street View and deep learning. Landsc. Urban Plan. 2021, 205, 103920. [Google Scholar] [CrossRef]
- Villeneuve, P.; Ysseldyk, R.; Root, A.; Ambrose, S.; DiMuzio, J.; Kumar, N.; Shehata, M.; Xi, M.; Seed, E.; Li, X.; et al. Comparing the normalized difference vegetation index with the Google Street View measure of vegetation to assess associations between greenness, walkability, recreational physical activity, and health in Ottawa, Canada. Int. J. Environ. Res. Public Health 2018, 15, 1719. [Google Scholar] [CrossRef]
- Lin, J.H.; Chen, Y.Z.; Wang, X.Q. Road Greening Level Evaluation of Gulou District in Fuzhou Based on Visible Green Index. J. Chin. Urban For. 2021, 19, 73–77+84. [Google Scholar] [CrossRef]
- Ye, Y.; Zhang, L.Z.; Yan, W.T.; Zeng, W. Measuring Street Greening Quality from Humanistic Perspective: A Large-scale Analysis Based on Baidu Street View Images and Machine Learning Algorithms. Landsc. Archit. 2018, 25, 24–29. [Google Scholar] [CrossRef]
- Jiang, H.B.; Song, M.K.; Xiao, Y. Research on Visual Landscape Comfort Evaluation of Waterfront Space: A Case Study of Huangpu River and Suzhou Creek in Shanghai. Landsc. Archit. 2022, 29, 122–129. [Google Scholar] [CrossRef]
- Xiao, Y.; Zhang, Y.H.; Lu, S.; Kuang, X.M. Exploring the Relationship Between Multi-dimensional Residential Greening Perceived Neighborhoods Greenness Level and Residents’ Mental Health Based on Multi-source Data: A Case Study of Shanghai Lilong. Landsc. Archit. 2021, 8, 108–113. [Google Scholar] [CrossRef]
- Wan, J.; Dai, L.Y. Analysis and Optimization of Urban Road Greening Landscape in Nanjing Old Town Based on Visible Green Index. Landsc. Archit. Acad. J. 2021, 38, 45–51. [Google Scholar] [CrossRef]
- Xu, L.Q.; Meng, R.X.; Chen, Z. Fascinating Streets: The Impact of Building Facades and Green View. Landsc. Archit. 2017, 10, 27–33. [Google Scholar] [CrossRef]
- Long, Y.; Liu, L. How green are the streets? An analysis for central areas of Chinese cities using Tencent street view. PLoS ONE 2017, 12, e0171110. [Google Scholar] [CrossRef]
- Wu, X.R.; Qiu, H. Study on the Green View Index of the Road in the Core Area with Historical Cultural Features of Changsha Based on Street View Image Interpretation. Landsc. Archit. Acad. J. 2022, 39, 106–116. [Google Scholar] [CrossRef]
- Cui, Z.; He, M.Y.; Lu, M. An Analysis of Green View Index in Cold Region City: A Case Study of Harbin. J. Chin. Urban For. 2018, 16, 34–38. [Google Scholar] [CrossRef]
- Yang, C.C.; Xu, F.N.; Jiang, L.; Wang, R.F.; Yin, L.; Zhao, M.W.; Zhang, X.X. Approach to Quantify Spatial Comfort of Urban Roads based on Street View Images. J. Geo-Inf. Sci. 2021, 23, 785–801. [Google Scholar] [CrossRef]
- Tong, M.; She, J.F.; Tan, J.Z.; Li, M.Y.; Ge, R.C.; Gao, Y.Y. Evaluating Street Greenery by Multiple Indicators Using Street-Level Imagery and Satellite Images: A Case Study in Nanjing, China. Forests 2020, 11, 1347. [Google Scholar] [CrossRef]
- Aoki, Y.; Yasuoka, Y.; Naito, M. Assessing the impression of street-side greenery. Landsc. Res. 1985, 10, 9–13. [Google Scholar] [CrossRef]
- Hao, X.H.; Long, Y. Street Greenery: A New Indicator for Evaluating Walkability. Shanghai Urban Plan. Rev. 2017, 1, 32–36+49. [Google Scholar]
- Dong, R.C.; Zhang, Y.L.; Zhao, J.Z. How Green Are the Streets Within the Sixth Ring Road of Beijing? An Analysis Based on Tencent Street View Pictures and the Green View Index. Int. J. Environ. Res. Public Health 2018, 15, 1367. [Google Scholar] [CrossRef]
- Dubey, A.; Naik, N.; Parikh, D.; Raskar, R.; Hidalgo, C.A. Deep learning the city: Quantifying urban perception at a global scale European. Conf. Comput. Vis.—ECCV 2016, 9905, 196–212. [Google Scholar] [CrossRef]
- Ye, Y.; Zeng, W.; Shen, Q.; Zhang, X.; Lu, Y. The visual quality of streets: A human-centred continuous measurement based on machine learning algorithms and street view images. Urban Anal. City Sci. 2019, 46, 1440–1457. [Google Scholar] [CrossRef]
- Zhang, L.; Pei, T.; Wang, X.; Wu, M.; Song, C.; Guo, S.; Chen, Y. Quantifying the urban visual perception of chinese traditional-style building with street view images. Appl. Sci. 2020, 10, 5963. [Google Scholar] [CrossRef]
- Li, X.; Zhang, C.; Li, W.; Kuzovkina, Y.A.; Weiner, D. Who lives in greener neighborhoods? The distribution of street greenery and its association with residents’ socioeconomic conditions in Hartford, Connecticut, USA. Urban For. Urban Green. 2015, 14, 751–759. [Google Scholar] [CrossRef]
- Zhang, F.; Zhou, B.; Liu, L.; Liu, Y.; Fung, H.H.; Lin, H.; Ratti, C. Measuring human perceptions of a large-scale urban region using machine learning. Landsc. Urban Plan. 2018, 180, 148–160. [Google Scholar] [CrossRef]
- Qiu, W.; Li, W.; Liu, X.; Huang, X. Subjectively measured streetscape perceptions to inform urban design strategies for Shanghai. Int. J. Geo-Inf. 2021, 10, 493. [Google Scholar] [CrossRef]
- Tang, J.; Long, Y.; Zhai, W.; Ma, Y. Measuring quality of street space, its temporal variation and impact factors: An analysis based on massive street view pictures. New Archit. 2016, 05, 110–115. [Google Scholar]
- Shen, Q.; Zeng, W.; Ye, Y.; Arisona, S.M.; Schubiger, S.; Burkhard, R.; Qu, H. StreetVizor: Visual Exploration of Human-Scale Urban Forms Based on Street Views. IEEE Trans. Vis. Comput. Graph. 2017, 24, 1004–1013. [Google Scholar] [CrossRef] [PubMed]
- Zhang, Y.; Dong, R. Impacts of street-visible greenery on housing prices: Evidence from a hedonic price model and a massive street view image dataset in Beijing. ISPRS Int. J. Geo.-Inf. 2018, 7, 104. [Google Scholar] [CrossRef]
- Gong, F.Y.; Zeng, Z.C.; Zhang, F.; Li, X.; Ng, E.; Norford, L.K. Mapping sky, tree, and building view factors of street canyons in a high-density urban environment. Build. Environ. 2018, 134, 155–167. [Google Scholar] [CrossRef]
- Yan, W.Z.; Jian, Y.; Jin, S.J.; Che, S.Q. Comprehensive evaluation construction of urban green streets landscape. J. Shanghai Jiaotong Univ. Agric. Sci. 2012, 30, 82–87. [Google Scholar] [CrossRef]
- Chen, Y.; Qiao, J.G.; Rong, J.; Liu, X.M. Research on the evaluation system of greening landscape of urban trunk roads. Road Traffic Technol. Appl. Technol. Ed. 2007, 10, 146–151. [Google Scholar]
- Kang, N.; Liu, C.Q. Towards landscape visual quality evaluation: Methodologies, technologies, and recommendations. Ecol. Indic. 2022, 142, 109174. [Google Scholar] [CrossRef]
- Sun, D. Visual Quality Evaluation of Urban Landscape Based on Computer Vision Technology. In Digital Analysis of Urban Structure and Its Environment Implication, 1st ed.; Gao, W., Ed.; Springer: Singapore, 2022; pp. 139–169. [Google Scholar] [CrossRef]
- Zhao, R.; Li, Y.F. SBE-based evaluation on street trees landscape in Hohhot. J. Inn. Mong. For. Sci. Technol. 2014, 40, 53–57. [Google Scholar] [CrossRef]
- Yan, C.C.; Chen, C.; Yao, P. Valuation of Ficus Plant Scene by BIB-LCJ Method. Chin. J. Trop. Agric. 2011, 31, 79–83. [Google Scholar] [CrossRef]
- Daniel, T.C. Whither Scenic Beauty? Visual Landscape Quality Assessment in the 21st Century. Landsc. Urban Plan 2001, 54, 267–281. [Google Scholar] [CrossRef]
- Zhao, Z.; Gan, H.M.; Qian, X.; Leng, J.H.; Wang, Y.B.; Wu, P.P. Riverside Greenway in Urban Environment: Residents’ Perception and Use of Greenways along the Huangpu River in Shanghai, China. Int. J. Environ. Res. Public Health 2021, 18, 1120. [Google Scholar] [CrossRef]
- Zube, E.H.; Friedman, S.; Simcox, D.E. Landscape change: Perceptions and physical measures. Environ. Manag. 1989, 13, 639–644. [Google Scholar] [CrossRef]
- Du, H.; Jiang, H.; Song, X.; Zhan, D.; Bao, Z. Assessing the visual aesthetic quality of vegetation landscape in urban green space from a visitor’s perspective. J. Urban Plan. Dev. 2016, 142, 4016007–1–4016007–9. [Google Scholar] [CrossRef]
- Porta, S.; Renne, J.L. Linking Urban Design to Sustainability: Formal Indicators of Social Urban Sustainability Field Research in Perth, Western Australia. Urban Des. Int. 2005, 10, 51–64. [Google Scholar] [CrossRef]
- Kianicka, S.; Buchecker, M.; Hunziker, M.; Müller-Böker, U. Locals’ and Tourists’ Sense of Place. Mt. Res. Dev. 2006, 26, 55–63. [Google Scholar] [CrossRef]
- Zhao, Y.; Liu, J.H.; Zheng, Y.L. Preservation and renewal: A study on visual evaluation of urban historical and cultural street landscape in quanzhou. Sustainability 2022, 14, 8775. [Google Scholar] [CrossRef]
- Shao, Y.H.; Liu, B.Y. Urban streetscape visual aesthetics assessment research. Chin. Landsc. Archit. 2017, 33, 17–22. [Google Scholar]
- Han, J.W. A Visual Evaluation Study for Walking Streetscape. Ph.D. Thesis, Southwest Jiaotong University, Chengdu, China, 2018. [Google Scholar]
- Qi, J.D.; Lin, E.S.W.; Tan, P.Y.; ManHo, R.C.; Sia, A.; Olszewska-Guizzo, A.; Zhang, X.D.; Waykool, W. Development and application of 3D spatial metrics using point clouds for landscape visual quality assessment. Landsc. Urban Plan. 2022, 228, 104585. [Google Scholar] [CrossRef]
- Han, J.W.; Dong, L. A study of visual evaluation of streetscape based on the psychophysical method. Chin. Landsc. Archit. 2015, 31, 116–119. [Google Scholar] [CrossRef]
- Gong, Z.Y.; Ma, Q.W.; Kan, C.C.; Qi, Q.Y. Classifying Street Spaces with Street View Images for a Spatial Indicator of Urban Functions. Sustainability 2019, 11, 6424. [Google Scholar] [CrossRef]
- Gao, L.Y.; Xie, X.M.; Liu, X.Z.; Zhou, Y.H. Green Vision Study Based on Baidu Street View Data—Taking Fuzhou West Lake Community as an Example. Chin. Overseas Archit. 2020, 7, 144–147. [Google Scholar] [CrossRef]
- Gou, A.P.; Zhang, C.; Wang, J.B. Study on the identifcation and dynamics of green vision rate in Jing’an district, Shanghai based on deeplab V3+model. Earth Sci. Inform. 2022, 15, 163–181. [Google Scholar] [CrossRef]
- Osgood, C.E.; Suci, G.J.; Tannenbaum, P. The Measurement of Meaning; University of Illinois Press: Champaign, IL, USA, 1957; ISBN 13: 978-0252745393. [Google Scholar]
- Li, Z.; Sun, X.; Zhao, S.C.; Zuo, H.W. Integrating eye-movement analysis and the semantic differential method to analyze the visual effect of a traditional commercial block in Hefei, China. Front. Archit. Res. 2021, 10, 317–331. [Google Scholar] [CrossRef]
- Yu, K. Cultural variations in landscape preference: Comparisons among Chinese sub-groups and Western design experts. Landsc. Urban Plan. 1995, 32, 107–126. [Google Scholar] [CrossRef]
- Zhang, J.H. The Diagnosis Methods in Planning and Design (16)—SD Method. Chin. Landsc. Archit. 2004, 10, 57–61. [Google Scholar]
- Lang, X. Research on Urban Waterfront Space Characteristic: Taking Qingdao Historic and Cultural Scene as an Example. Ph.D. Thesis, Shandong Jianzhu University, Jinan, China, 6 June 2012. [Google Scholar]
- Natalija, N.; Daiga, S.; Madara, M.; Aiga, S. Enhancing Ecological, Functional, Social and Aesthetic Quality of Street Green Space by Planning Green Pockets. IOP Conf. Ser. Mater. Sci. Eng. 2021, 1203, 032019. [Google Scholar] [CrossRef]
- Araya, R.; Montgomery, A.; Rojas, G.; Fritsch, R.; Solis, J.; Signorelli, A.; Lewis, G. Common Mental Disorders and the Built Environment in Santiago, Chile. Br. J. Psychiatry 2007, 190, 394–401. [Google Scholar] [CrossRef]
- Bai, Q.F.; Huo, Z.G.; He, N. Analysis of human body comfort index of 20 tourist cities in China. Chin. J. Ecol. 2009, 28, 1607–1612. [Google Scholar] [CrossRef]
- Wang, R.Y.; Feng, Z.Q.; Jamie, P.; Yao, Y.; Li, X.J.; Liu, Y. The distribution of greenspace quantity and quality and their association with neighbourhood socioeconomic conditions in Guangzhou, China: A new approach using deep learning method and street view images. Sustain. Cities Soc. 2021, 66, 102664. [Google Scholar] [CrossRef]
- Kuper, R. Preference and Restorative Potential for Landscape Models that Depict Diverse Arrangements of Defoliated, Foliated, and Evergreen Plants. Urban For. Urban Green. 2020, 48, 126570. [Google Scholar] [CrossRef]
- Long, G.H.; Qin, H. Plant Landscape Evaluation of Street Trees Green Belt in Downtown Chongqing. For. Inventory Plan. 2022, 47, 194–200. [Google Scholar] [CrossRef]
- Liu, Y.F.; Yang, X.X.; Deng, J.Y.; Li, L.Q.; Yang, H.F. Application and Construction of the Evaluation Model of Greenway in Historic Cities: A Case Study of the South Dongsi Historic District in the Old City of Beijing. Cult. Hist. 2021, 39, 71–78. [Google Scholar] [CrossRef]
- Wang, M.; Qiu, M.; Chen, M.X.; Zhang, Y.L.; Zhang, S.Z.; Wang, L. How does urban green space feature influence physical activity diversity in high-density built environment? An on-site observational study. Urban For. Urban Green. 2021, 62, 127129. [Google Scholar] [CrossRef]
- Guo, L.L.; Tang, X.M. Evaluation of Walking Comfort of Community Roads under the Background of City Betterment and Ecological Restoration—A Case of Shanghai Caoyang New Village. Chin. Landsc. Archit. 2020, 36, 70–75. [Google Scholar] [CrossRef]
- Tan, S.H.; Hu, Y.F.; Han, L. A Study 0n the Environment Feature of Beautiful Street Based on People’s Psychological Satisfaction. New Archit. 2016, 1, 64–70. [Google Scholar]


| Grade | 0~15% GVI | 15~25% GVI | 25~35% GVI | 35~100% GVI |
|---|---|---|---|---|
| Sample points | 1, 2, 3, 4, 30, 38, 39, 40, 41, 44, 45, 46, 47, 48, 49, 50, 51, 52, 57, 58, 59, 60, 63, 85, 125, 127, 132, 135, 136, 207, 220, 223, 224, 225, 226, 227, 228, 229, 230, 231, 232, 245, 246, 247, 248, 249, 251, 254, 255, 256, 268 | 5, 6, 7, 8, 9, 10, 11, 12, 24, 32, 42, 54, 55, 56, 61, 62, 64, 65, 66, 73, 76, 86, 87, 88, 89, 95, 99, 120, 124, 126, 131, 133, 134, 137, 175, 210, 211, 212, 213, 217, 233, 235, 241, 244, 250, 252, 253, 257, 259, 262, 263, 270, 271, 280, 294, 309, 312, 315, 330, 336, 344 | 14, 15, 16, 20, 27, 29, 33, 34, 43, 53, 67, 68, 69, 70, 71, 72, 74, 75, 77, 81, 82, 83, 84, 100, 107, 119, 128, 129, 130, 143, 169, 176, 192, 195, 197, 198, 200, 202, 208, 209, 214, 215, 216, 219, 221, 222, 234, 236, 237, 238, 240, 242, 258, 260, 261, 283, 291, 293, 295, 296, 304, 305, 306, 307, 308, 310, 311, 313, 317, 320, 321, 337, 340 | 13, 17, 18, 19, 21, 22, 23, 25, 26, 28, 31, 35, 36, 37, 78, 79, 80, 90, 91, 92, 93, 94, 96, 97, 98, 101, 102, 103, 104, 105, 106, 108, 109, 110, 111, 112, 113, 114, 115, 116, 117, 118, 121, 122, 123, 138, 139, 140, 141, 142, 144, 145, 146, 147, 148, 149, 150, 151, 152, 153, 154, 155, 156, 157, 158, 159, 160, 161, 162, 163, 164, 165, 166, 167, 168, 170, 171, 172, 173, 174, 177, 178, 179, 180, 181, 182, 183, 184, 185, 186, 187, 188, 189, 190, 191, 193, 194, 196, 199, 201, 203, 204, 205, 206, 218, 239, 243, 264, 265, 266, 267, 269, 272, 273, 274, 275, 276, 277, 278, 279, 281, 282, 284, 285, 286, 287, 288, 289, 290, 292, 297, 298, 299, 300, 301, 302, 303, 314, 316, 318, 319, 322, 323, 324, 325, 326, 327, 328, 329, 331, 332, 333, 334, 335, 338, 339, 341, 342, 343 |
| Grade | High VICO | Medium VICO | Low VICO |
|---|---|---|---|
| Sample points | 17, 18, 19, 21, 22, 23, 25, 28, 36, 37, 68, 70, 78, 79, 90, 91, 92, 93, 94, 96, 97, 101, 104, 105, 106, 108, 109, 111, 112, 113, 114, 116, 117, 118, 121, 122, 140, 142, 144, 145, 146, 148, 149, 150, 151, 153, 154, 155, 156, 157, 158, 159, 160, 161, 162, 163, 166, 171, 177, 179, 180, 182, 183, 184, 185, 186, 187, 188, 189, 190, 193, 199, 201, 203, 204, 205, 206, 264, 266, 267, 269, 272, 273, 274, 275, 276, 279, 282, 284, 285, 286, 287, 288, 289, 290, 297, 300, 301, 306, 308, 311, 318, 322, 323, 325, 327, 328, 331, 332, 334, 335, 339, 341, 342, 343 | 13, 14, 15, 16, 20, 26, 27, 31, 33, 34, 35, 65, 67, 69, 71, 72, 73, 74, 75, 76, 77, 80, 81, 82, 83, 84, 98, 100, 102, 103, 107, 110, 115, 119, 120, 123, 128, 130, 133, 137, 138, 139, 141, 143, 147, 152, 164, 167, 168, 170, 172, 173, 174, 178, 181, 191, 194, 195, 196, 198, 200, 202, 208, 209, 216, 218, 222, 234, 235, 236, 237, 238, 239, 240, 242, 243, 258, 259, 260, 261, 265, 271, 277, 278, 280, 281, 283, 291, 292, 293, 296, 298, 299, 302, 303, 304, 305, 307, 310, 313, 314, 316, 317, 319, 320, 321, 324, 326, 329, 333, 337, 338, 340, 344 | 1, 2, 3, 4, 5, 6, 7, 8, 9, 10, 11, 12, 24, 29, 30, 32, 38, 39, 40, 41, 42, 43, 44, 45, 46, 47, 48, 49, 50, 51, 52, 53, 54, 55, 56, 57, 58, 59, 60, 61, 62, 63, 64, 66, 85, 86, 87, 88, 89, 95, 99, 124, 125, 126, 127, 129, 131, 132, 134, 135, 136, 165, 169, 175, 176, 192, 197, 207, 210, 211, 212, 213, 214, 215, 217, 219, 220, 221, 223, 224, 225, 226, 227, 228, 229, 230, 231, 232, 233, 241, 244, 245, 246, 247, 248, 249, 250, 251, 252, 253, 254, 255, 256, 257, 262, 263, 268, 270, 294, 295, 309, 312, 315, 330, 336 |
| VICO | Overall GVI | 0–35% GVI | >35% GVI | ||
|---|---|---|---|---|---|
| Pearson correlation | 0.769 ** | 0.717 ** | 0.390 ** | ||
| VICO | 0~15% GVI | 15~25% GVI | 25~35% GVI | ||
| Pearson correlation | 0.641 ** | 0.468 ** | 0.400 ** | ||
Disclaimer/Publisher’s Note: The statements, opinions and data contained in all publications are solely those of the individual author(s) and contributor(s) and not of MDPI and/or the editor(s). MDPI and/or the editor(s) disclaim responsibility for any injury to people or property resulting from any ideas, methods, instructions or products referred to in the content. |
© 2023 by the authors. Licensee MDPI, Basel, Switzerland. This article is an open access article distributed under the terms and conditions of the Creative Commons Attribution (CC BY) license (https://creativecommons.org/licenses/by/4.0/).
Share and Cite
Sun, D.; Ji, X.; Gao, W.; Zhou, F.; Yu, Y.; Meng, Y.; Yang, M.; Lin, J.; Lyu, M. The Relation between Green Visual Index and Visual Comfort in Qingdao Coastal Streets. Buildings 2023, 13, 457. https://0-doi-org.brum.beds.ac.uk/10.3390/buildings13020457
Sun D, Ji X, Gao W, Zhou F, Yu Y, Meng Y, Yang M, Lin J, Lyu M. The Relation between Green Visual Index and Visual Comfort in Qingdao Coastal Streets. Buildings. 2023; 13(2):457. https://0-doi-org.brum.beds.ac.uk/10.3390/buildings13020457
Chicago/Turabian StyleSun, Dong, Xiang Ji, Weijun Gao, Fujian Zhou, Yiqing Yu, Yumeng Meng, Meiqi Yang, Junjie Lin, and Mei Lyu. 2023. "The Relation between Green Visual Index and Visual Comfort in Qingdao Coastal Streets" Buildings 13, no. 2: 457. https://0-doi-org.brum.beds.ac.uk/10.3390/buildings13020457