

Experimental Study and 3-D Meso-Scale Discrete Element Modeling on the Compressive Behavior of Foamed Concrete
1
Institute of Cold Regions Science and Engineering, Northeast Forestry University, Harbin 150040, China
2
Inner Mongolia Research Institute of Transportation Science Development, Hohhot 010051, China
3
Engineering Technology and Materials Research Center, China Academy of Transportation Sciences, Beijing 100029, China
4
Transportation Construction Administration of Xinjiang Uygur Autonomous Region, Urumqi 830049, China
*
Author to whom correspondence should be addressed.
Buildings 2023, 13(3), 674; https://0-doi-org.brum.beds.ac.uk/10.3390/buildings13030674
Submission received: 7 December 2022
/
Revised: 16 January 2023
/
Accepted: 21 February 2023
/
Published: 3 March 2023
(This article belongs to the Special Issue Multiscale Calculation of Structural Concrete)
Abstract
:The relationships between the mechanical properties of foam concrete and its pore structure and cement slurry properties have been confirmed, but these relationships cannot be directly reflected just through experimental research. Thus, experiments and the discrete element method (DEM) were used to reveal the relationship between pore structure, cement slurry characteristics, and mechanical properties in foam concrete in this paper. In order to ensure the authenticity and accuracy of numerical simulation, tests of foam concrete were carried out first, such as X-ray computed tomography (CT), the uniaxial compression test, and the three-point flexural test. On this basis, the failure process of foamed concrete was reflected by numerical simulation. The results show that the bearing capacity of foam concrete increases significantly with its increased density. In 750 kg/m3 foam concrete, the stress is mainly borne by the cement matrix. The ability of the cement matrix around the pores to resist tensile failure is weak, and the failure of foamed concrete is mainly caused by tensile failure. Moreover, when the loading rate is low, it takes a long time for the foamed concrete to break, and the cracks generated by the force expand along the weakest area around the pores to form a rough failure section. At higher loading rates, cracks tend to develop directly through the cement matrix along a straight line. The crack development process inside foam concrete is accurately presented by DEM. The density of foam concrete increases, the number of internal cracks decreases, and the cracks are dispersed. The crack development of foam concrete can be divided into the following stages: First, the microcracks are generated near the supports. Following that, the cracks are caused by tensile stress and gradually extend with increasing loading until the foamed concrete fails. Under full calibration, the engineering design of foam concrete can be completed by DEM.
1. Introduction
Foamed concrete is a kind of lightweight concrete without coarse aggregate, which plays an important role in infrastructure construction. Foamed concrete is composed of cementitious materials with less content, and its fluidity is high [1]. The density of foamed concrete is generally less than 1000 kg/m3 [2]. The outstanding advantages of foam concrete, such as its lightweight nature, sound insulation, and heat insulation, are attributed to these characteristics [3,4,5]. In addition, the use of foam concrete is considered an economic solution for manufacturing large lightweight buildings or components (such as structural components, partitions, and fillers) [6]. The use of foam concrete reduces the exploitation of rock, consumes limited natural resources, and protects the ecological environment compared with traditional concrete [7,8,9]. At present, foam concrete is widely used worldwide, attributing to the encouragement of governments and the development of scientific researchers [10].
In concrete foundation construction, the material characteristics and mechanical properties of foam concrete are focused on. Similar to traditional concrete, curing conditions and the water-binder ratio are the key factors determining the material characteristics and mechanical properties of foam concrete. In addition, the internal pore structure is also of great significance to the properties of the foam concrete [11,12,13]. Even previous studies have confirmed that the service life of foam concrete is inversely proportional to its porosity [14]. Therefore, most of the research on foam concrete focuses on its pore structure. Nambiar [15] and Kuzielová et al. [16] found that reducing the stomatal size could significantly improve the mechanical properties of equal-density foam concrete through research on the pore effect of foam concrete. Meanwhile, Nambiar and Ramamurthy [17] note that the compressive strength is considered higher in foam concrete due to the small size of the pores. They reached this conclusion after establishing the relationship between the performance of foam concrete and its pore structure according to experimental tests and optical microscope technology. Wee et al. [18] and Hilal et al. [19] also confirmed that the content and distribution of pores have a significant impact on foam concrete.
However, experiments with foam concrete have many deficiencies. The foamed concrete with a specific density is made by mixing the foam generated by a foaming machine with cement paste. Thus, the characteristics of pores inside the foamed concrete cannot be controlled (even if the same density is in the same batch), which makes it impossible to control other variables in single factor analysis and makes the analysis results inaccurate. This deficiency can be made up by numerical simulation. It can generate the model with a specific pore distribution and accurately obtain the effect of a single factor on the performance of foamed concrete. Therefore, it is particularly important to study the failure mechanism of foamed concrete from the microscopic parameters, such as pore structure and cement paste characteristics, by numerical simulation. In addition, the influence of the mechanical properties of foam concrete, which are analyzed from a microscopic perspective and caused by pore collapse and compaction, can be studied by establishing a heterogeneous model through numerical software.
The discrete element method (DEM) is an effective numerical simulation method used widely in the microstructure modeling of porous materials at present. The failure of internal pores was figured out based on the discontinuity characteristics of materials. DEM was first used to simulate the mechanical properties of granular materials. [20,21]. This method has attracted more attention, and later it was also introduced for viscous materials (such as rock, soil, and concrete) [22,23]. Ma et al. [24,25] revealed the decisive effect of internal pore distribution on the mechanical properties of an asphalt mixture under high temperatures using this method. Suchorzewski et al. [26] established heterogeneous four-phase models, including aggregate particles, cement matrix, interfacial transition zone, and porosity, by combining CT and DEM. The numerical model of porous concrete established by Xie et al. [27] also used DEM. The numerical model connected the macro and the micro of concrete and found different failure mechanisms for connected and disconnected pores on the concrete. Pieralisi et al. [28] applied DEM to the experimental study of porous concrete, which not only improved the research efficiency but also reduced the test cost. Therefore, this paper intends to establish a mesoscale model of cellular concrete using DEM and find the relationship between the mechanical properties and pore structure of foam concrete. The premise of accurate simulation by DEM is to accurately obtain the pore structure inside foamed concrete by certain technical means. Many researchers [29,30,31,32] have found that X-ray computed tomography (CT) has the advantages of high resolution and being non-destructive. CT is increasingly used to detect the microstructure of concrete, foam aluminum, and other materials.
2. Research Significance
In this paper, before numerical simulation, foam concrete was detected by CT. In addition, the microstructure information of pore distribution in the foam concrete’s microstructure was obtained. The stress-strain curve and the flexural strength were obtained by the uniaxial compression test and flexural strength test of foam concrete. Subsequently, the stress-strain curve was used to calibrate the mesoscopic parameters of DEM. Finally, the numerical models were established based on the determined mesoscopic parameters to simulate the failure process, and the influence of loading rate and density on uniaxial compression strength and three-point flexural strength was explained from the perspective of pore scale.
The simulation results of the DEM intuitively show the failure process of foam concrete and the relationships between the density of foam concrete or loading rate and the mechanical properties. Thus, the relationships between the macroscopic mechanical properties and the microscopic properties of foam concrete were established. The study method of combining the DEM with experimental research has guiding significance for the quantitative analysis of the relationships among the mechanical properties, pore structure, and cement paste properties of foam concrete.
3. Discrete Element Constitutive Model of Foamed Concrete
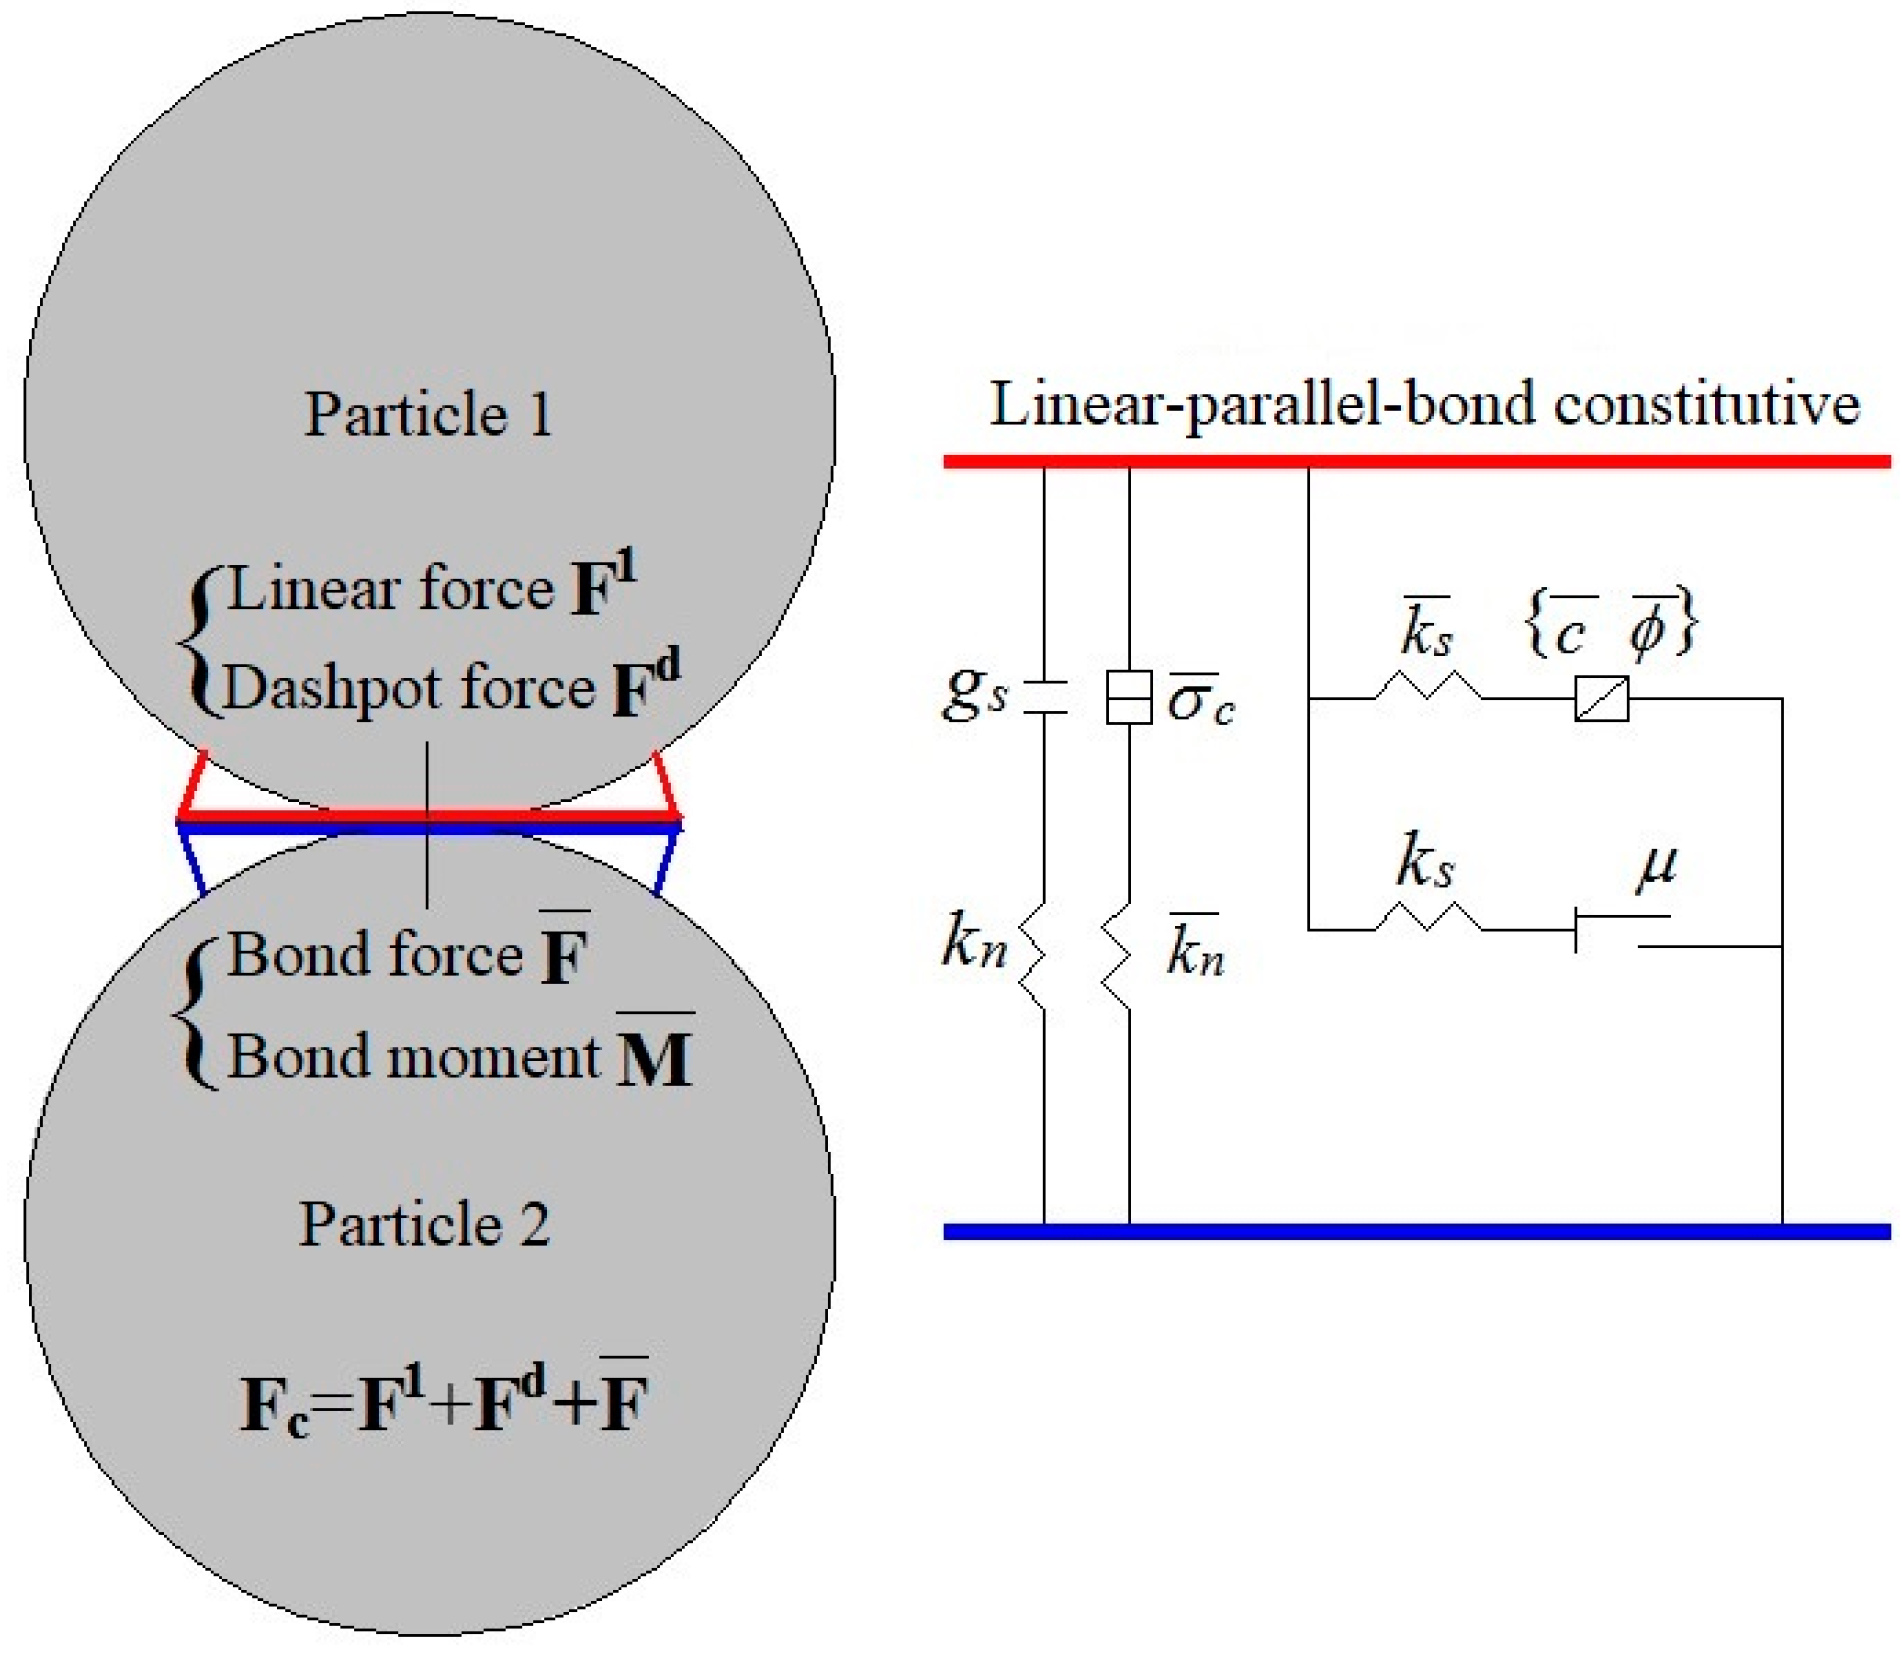
Particles in the DEM model move (translate or rotate) according to Newton’s second law and are considered as rigid bodies. The interaction between particles is based on the internal forces and moments, which are updated in real-time between each other. Bonds are fractured and microcracks are formed when the bond strength exceeds the bond strength. In order to do so, it is necessary to determine the constitutive relationship based on the particle size. However, to ensure that the fracture process calculated by DEM truly reflects the actual situation, the constitutive relationship on the particle scale needs to be determined. The model is used to establish foamed concrete made of cement paste because the bond behavior between cement particles is similar to that between contact particles in the linear parallel bond model. Particle interactions (forces and moments) are transmitted by parallel bonds, and elastic interaction is established by the parallel bond. The advantage of this bond is that relative sliding is not affected between particles. The linear-parallel-bond model consists of two interfaces: (1) the infinitesimal linear elastic friction interface and (2) the linear-elastic-bond interface in the finite size. Figure 1 shows these two interfaces.
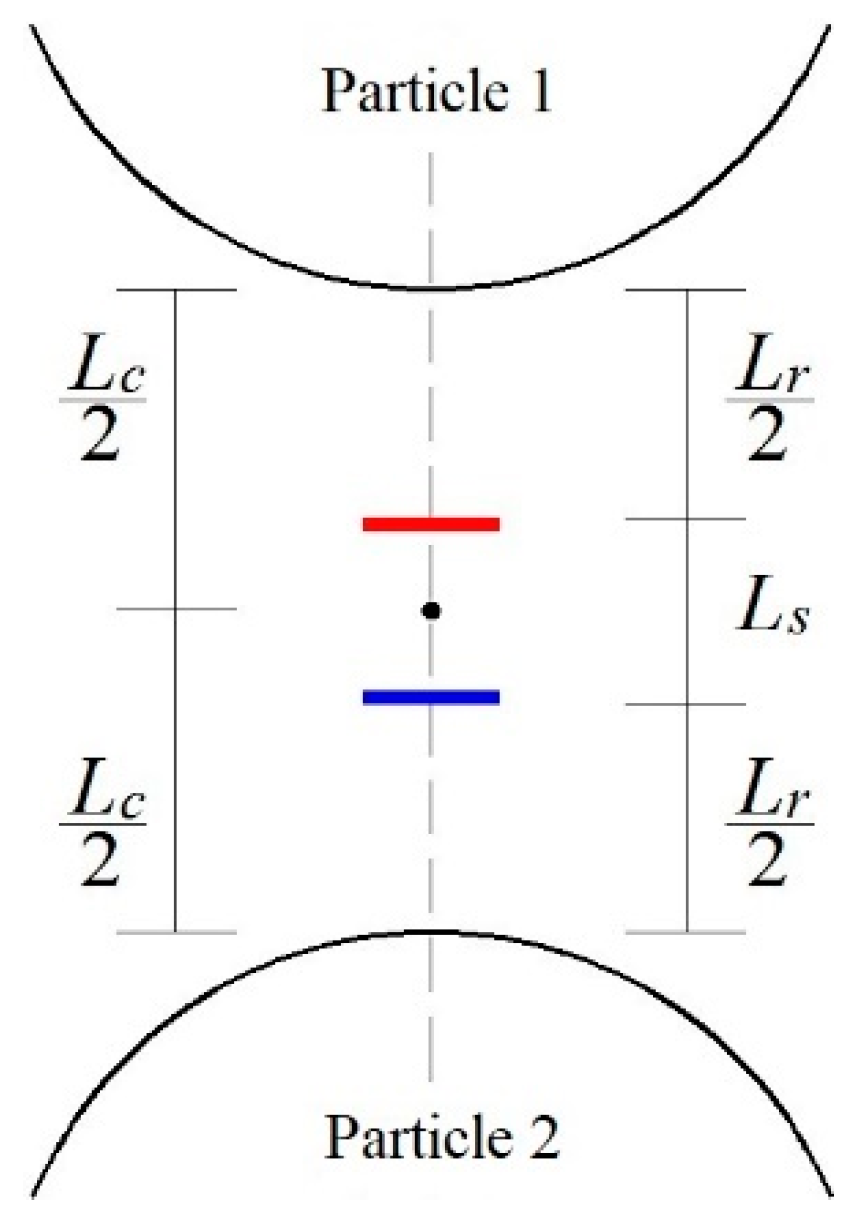
The surface gap (Ls) between a pair of particles is defined as the difference between the contact gap (Lc) and the reference gap (Lr), as shown in Figure 2. The contact is activated (Ls ≤ 0), while the force-displacement law will not be considered for the inactive contact.
When the bond between particles is activated, the force-displacement law will be followed, as shown in Equations (2) and (3):
where, , , , represent the linear force, the damper force, the parallel-bond force, and the parallel-bond moment. Equations (4) and (5) show the parallel bond force components and parallel bond moments, where the parallel bond force consists of both normal force and tangential force, and the parallel bond moment consists of both a torsional moment and a bending moment.
where, , represent the parallel-bond tangential force and bending moment, they are shown in the contact plane coordinate system as Equations (6) and (7):
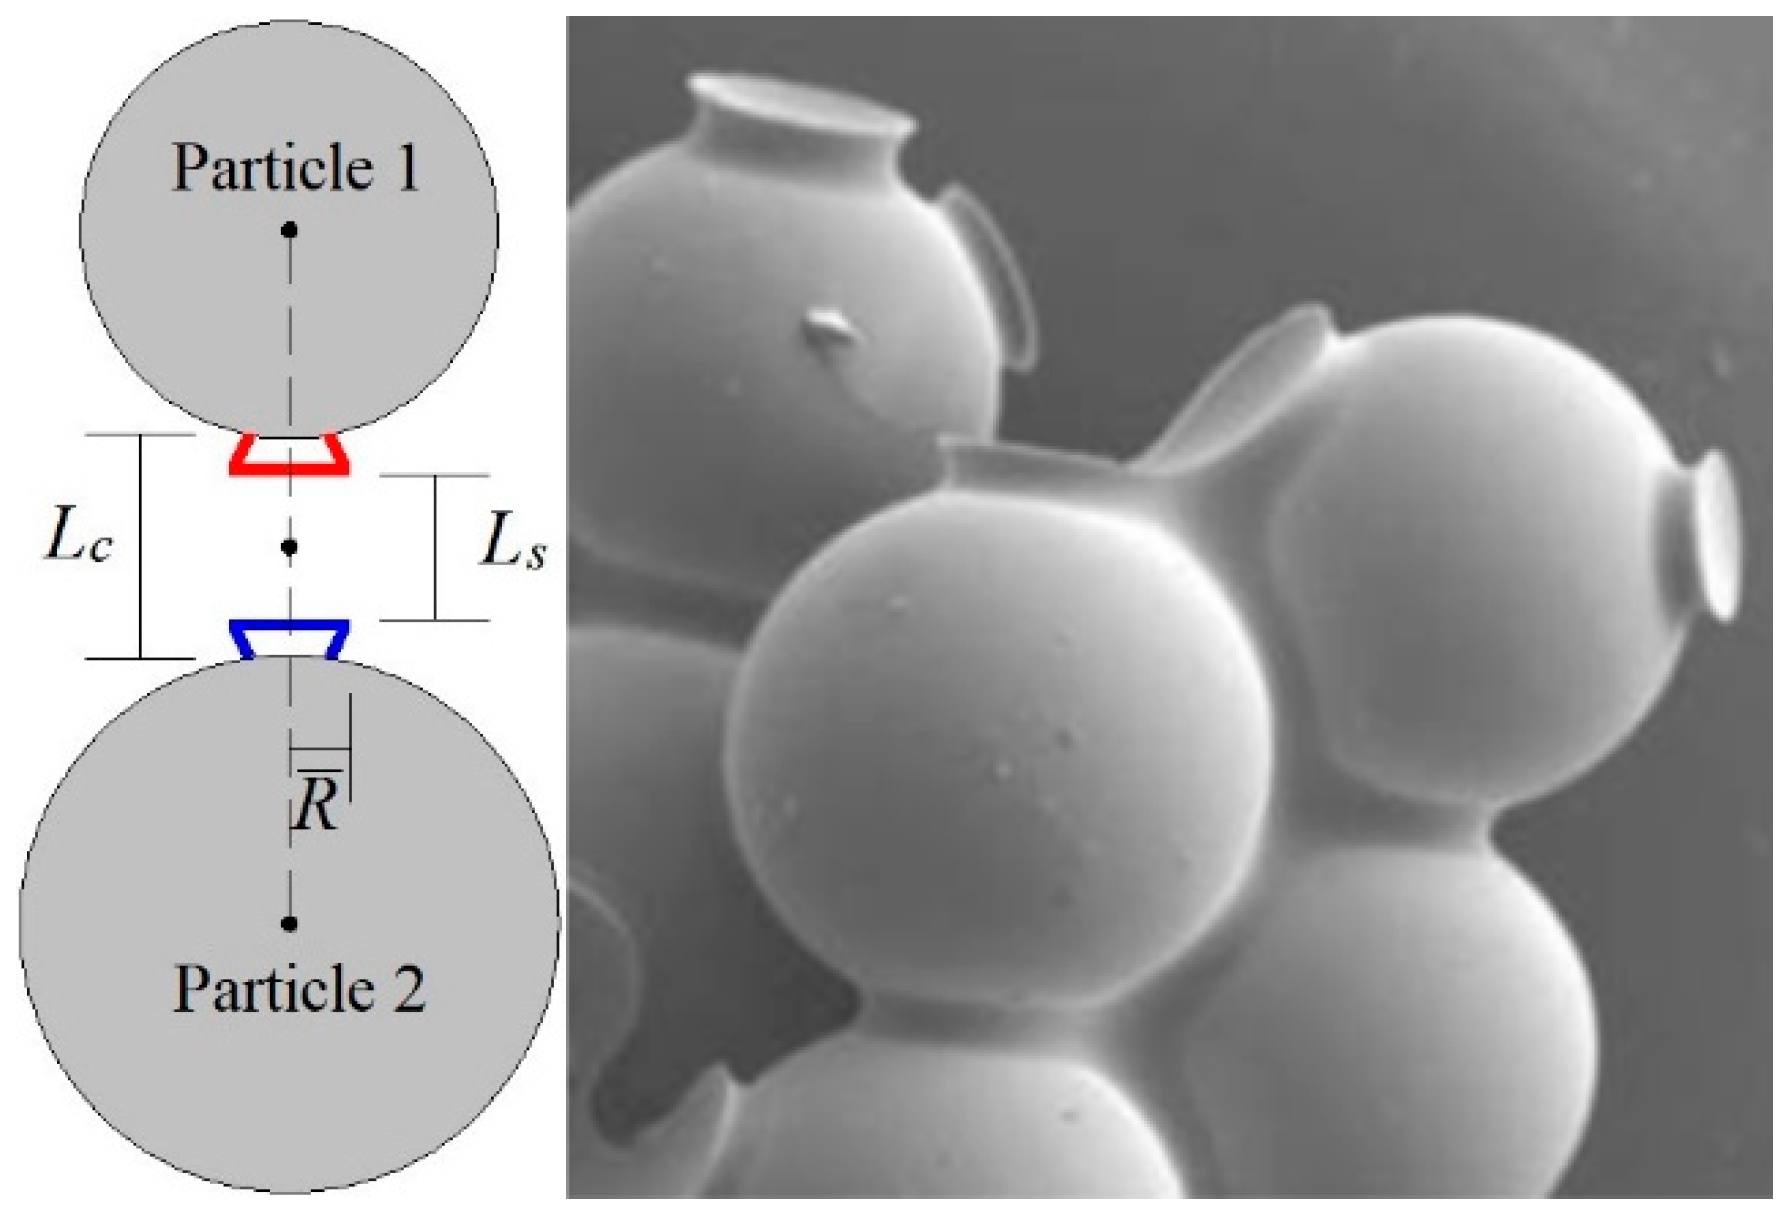
When the parallel bond is formed, an interface is created between the two conceptual surfaces, as shown in Figure 3. The parallel bond provides an elastic interaction between the two conceptual surfaces, which disappears when the bond is broken due to external forces.
The bond broken satisfies Equation (8), which is applicable when the force on the parallel bond exceeds the tensile strength limit.
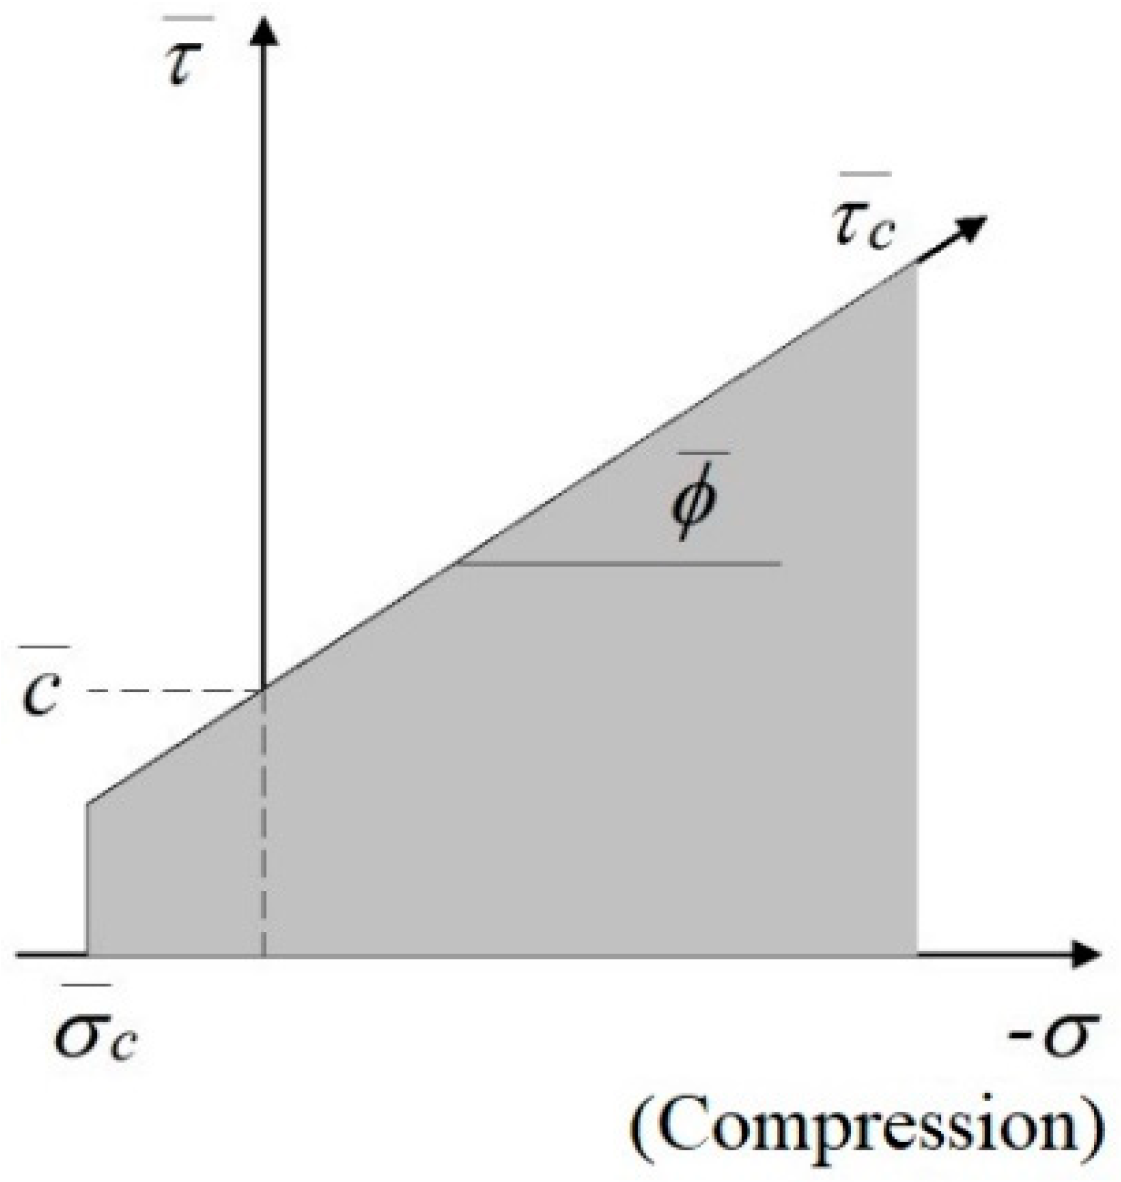
If the parallel bond is not broken during the tensile process, the shear strength limit is determined, and the expression is as follows:
where represent the average normal stress on the cross-section of the parallel bond. When the parallel-bond force exceeds the shear strength limit ( > ), the bond will also be broken, as shown in Figure 4, which satisfies the following Equation (10):
4. Experimental Methods and Modeling
4.1. Specimen Preparation
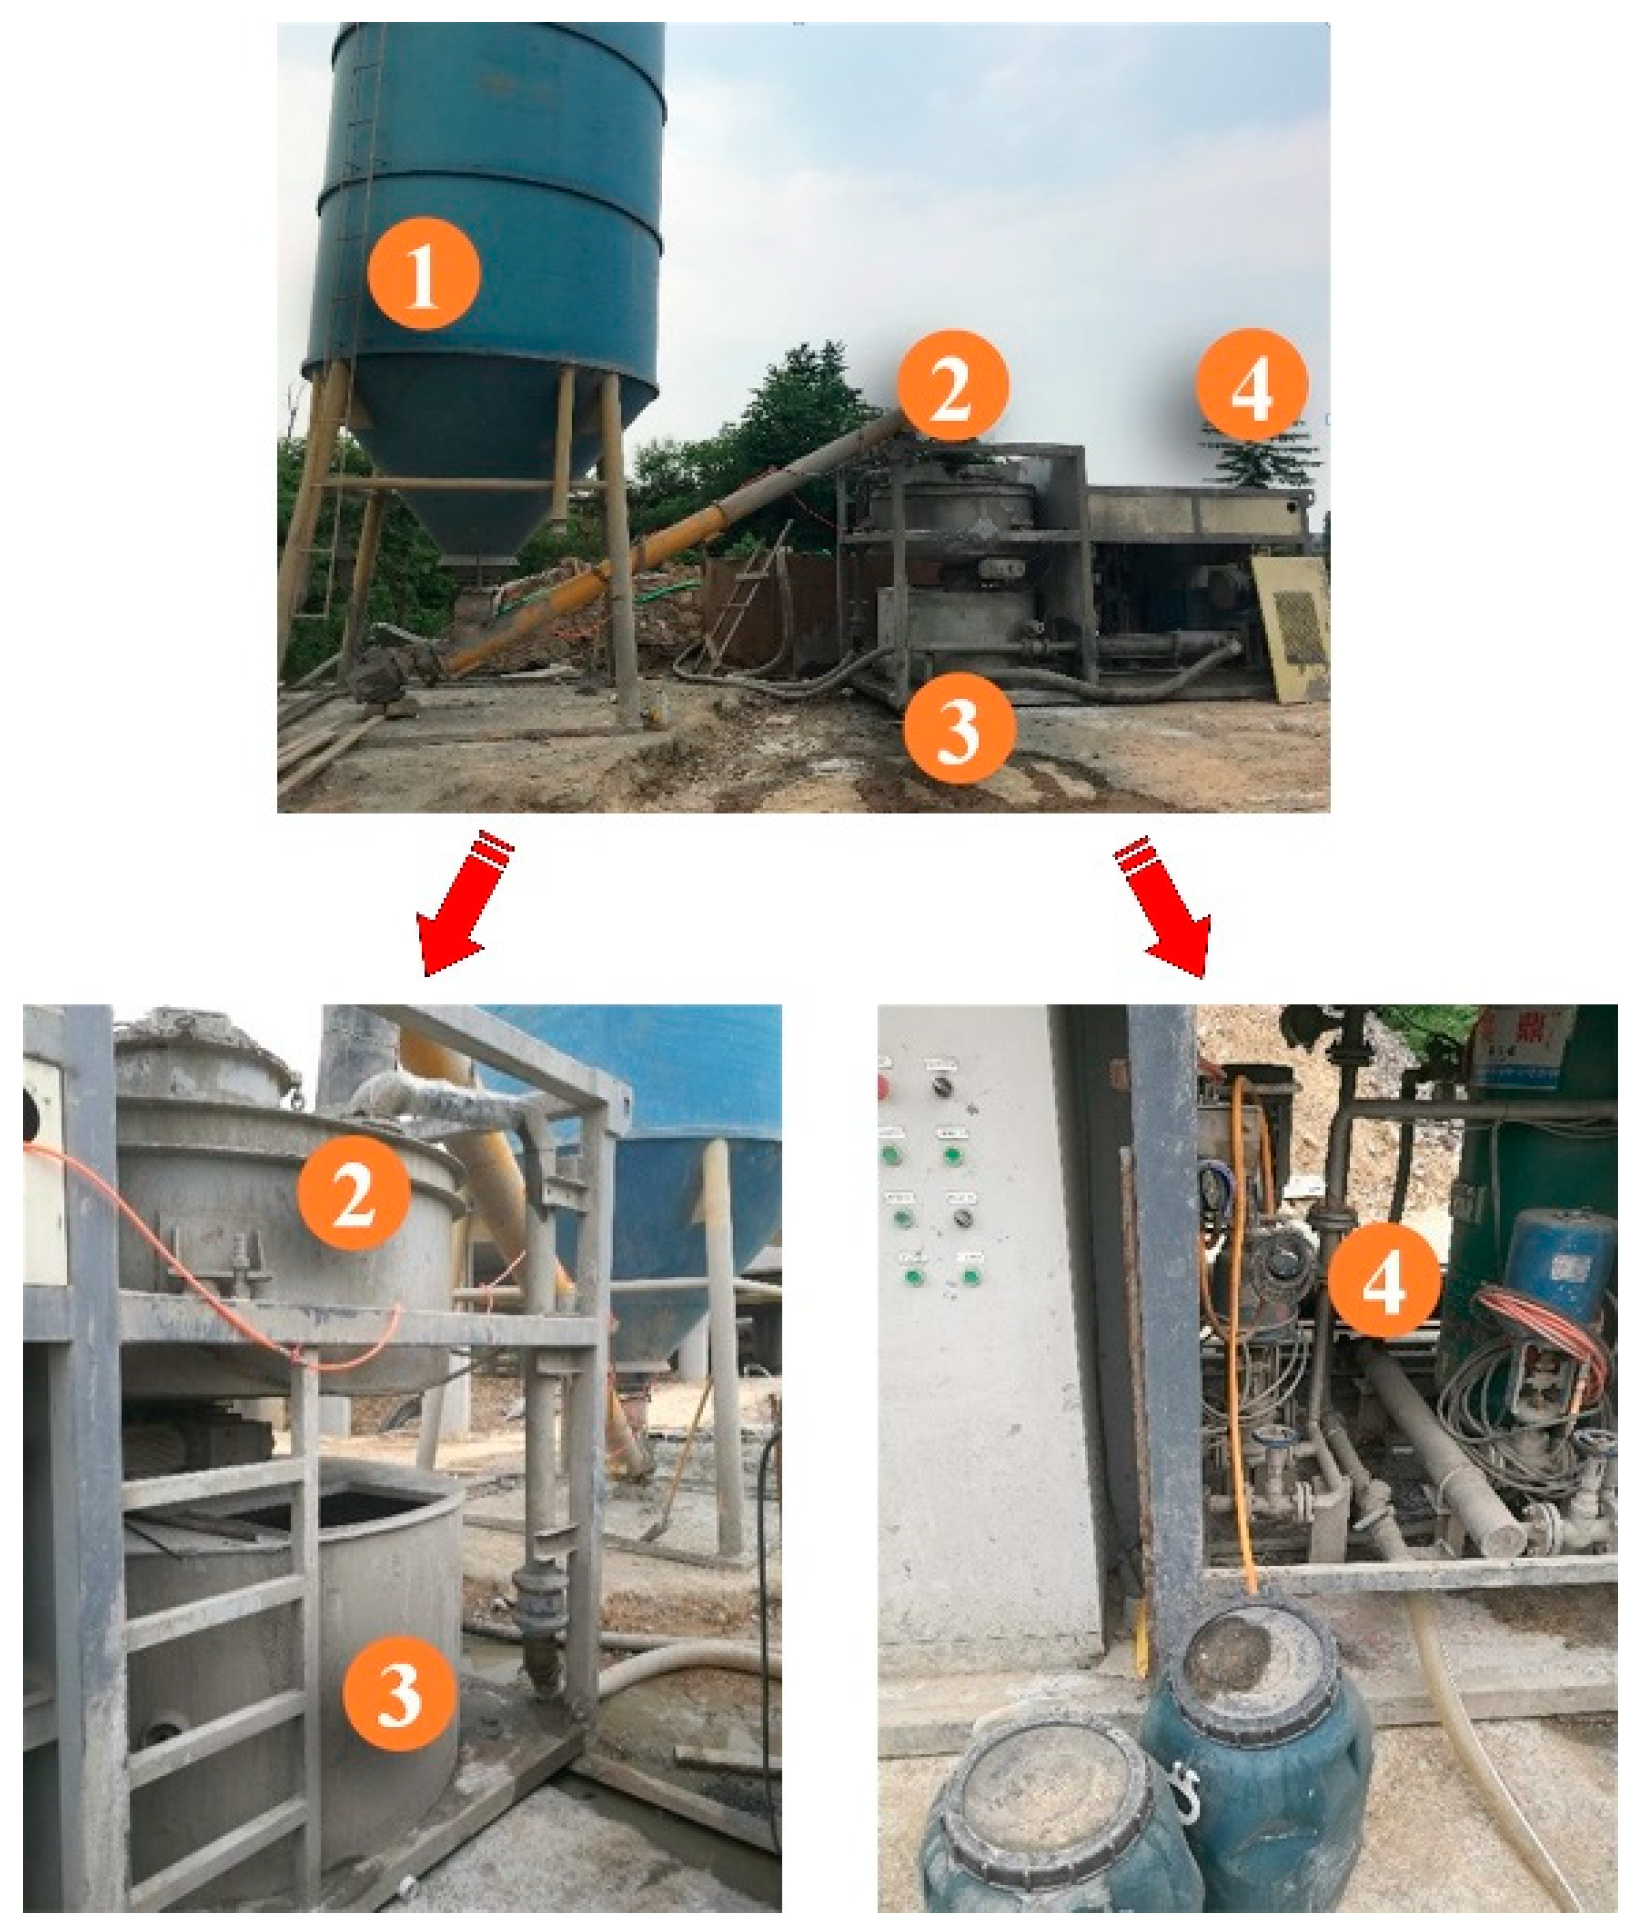
The foamed concrete samples used in the test were all prepared on-site, and the sample preparation equipment was made up of four parts, as shown in Figure 5. In Figure 5, the cement storage tank, the mixing place of cement and water, the mixer, and the foaming agent diluter are respectively represented by the numbers 1, 2, 3, and 4. The simplified production of foam concrete includes three parts: the production of cement slurry, the production of foam, and the mixing of the first two items. The cement slurry was put into the mixer after it was mixed with cement and water. At the same time, the foaming agent was diluted in the foaming agent diluter and put into the mixer. Cement slurry and a foaming agent were mixed in the mixer to produce foam concrete. Samples of foam concrete were prepared, and the wet density of foam concrete must be kept constant.
In this test, PO 42.5 was used as the cementitious material, and a foaming agent and tap water were also used to produce foam concrete. The protein-based foaming agent was purchased from Wenzhu Chemical Co., Ltd., Jinan, China, and its ratio to water was 1:40 (by volume). Stable mixes of foamed concrete have been achieved by prepared experiments; the mixtures are listed in Table 1. The foam concrete produced in this paper had different wet densities of 750 kg/m3, 600 kg/m3, and 500 kg/m3, respectively, and the water-cement ratio was constant at 0.6. The actual wet density was measured by filling and weighing a pre-weighed standard container of known volume with the produced foamed concrete. The unity brought the wet density to target density ratio close during the pouring of specimens. Four sizes of specimens were set to meet the different test requirements. (1) The cube specimens of size 10 × 10 × 10 mm were used for CT scanning. (2) The cylinder specimens with a diameter of 50 mm and a length of 100 mm were used to calibrate the mesoscopic parameters of the DEM model. (3) The cube specimens of size 100 × 100 × 100 mm were used for the uniaxial compression test. (4) Cuboid specimens of size 400 × 100 × 100 mm were used for the three-point flexural test. According to JG/T266-2011, specimens of foam concrete were poured.
4.2. X-ray Computed Tomography
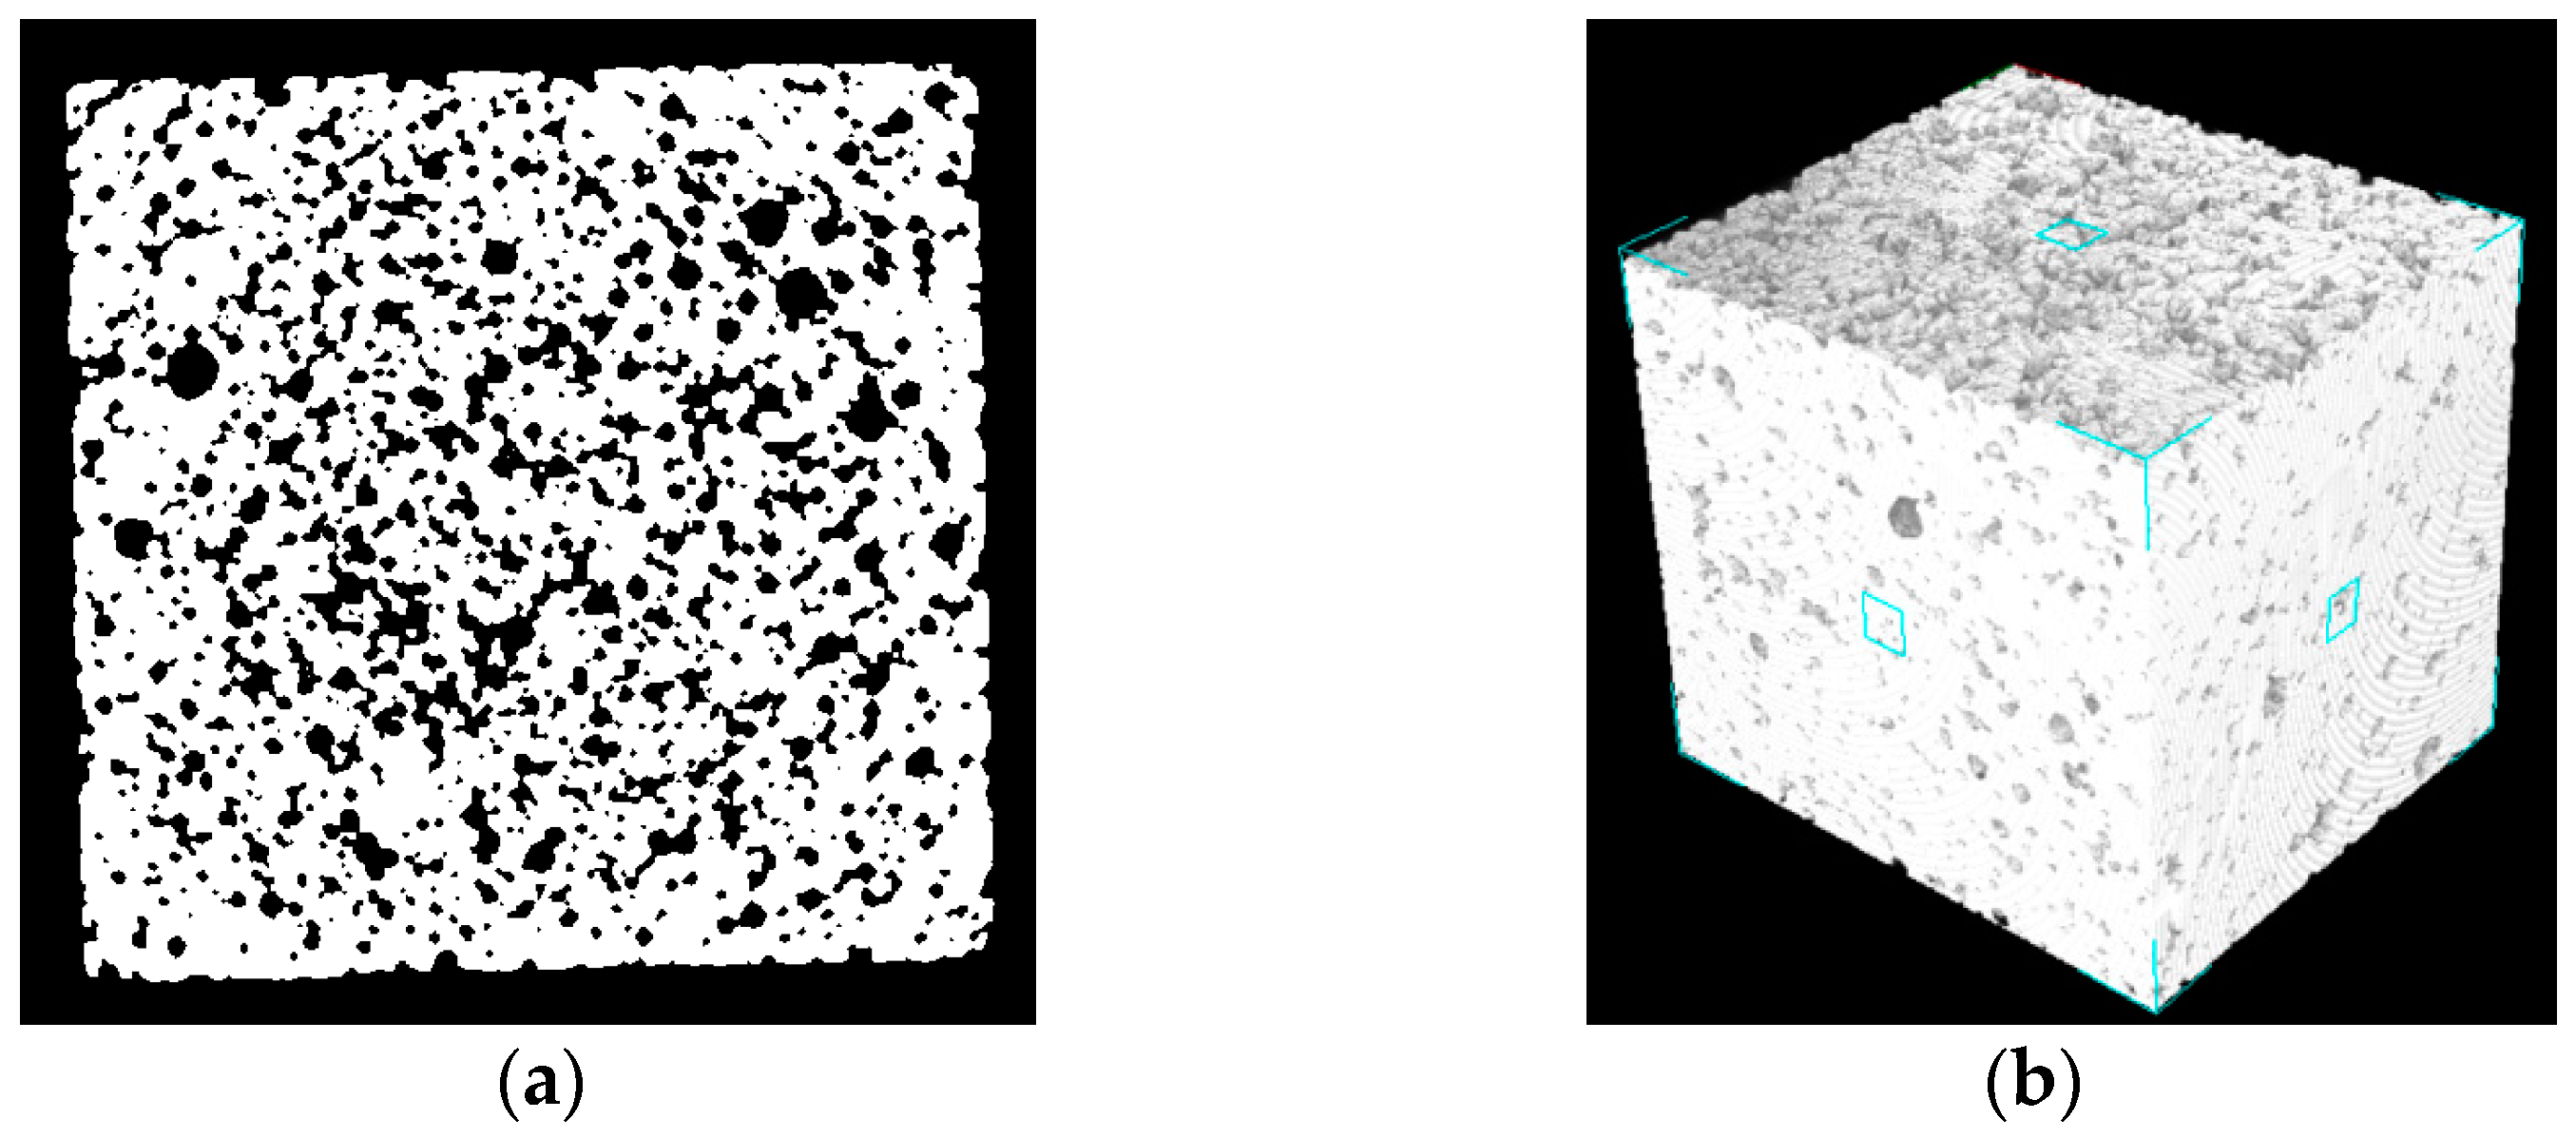
To achieve information on pore distribution inside the foamed concrete, CT scanning was performed on cube specimens (10 × 10 × 10 mm) with three kinds of densities. The slice thickness was 0.01 mm, the image resolution was set to 750 dpi × 750 dpi, and the size of a single pixel was 46 m. These data were processed by filtering and correction; 1024 cross-section slices of data were calculated, and the grayscale image of each slice was generated (as shown in Figure 6a). In Figure 6b, the pores and cement paste are indicated by black and white, respectively. Then, the 3D pore structure was reconstructed by using binary image stacking and 3D image processing technology.
4.3. Uniaxial Compression Test
The uniaxial compression test was used to investigate the density of the foamed concrete and the loading rate in order to influence compressive strength. First of all, it is necessary to obtain complete stress-strain curves, which are actual data support for the calibration of the DEM model. Therefore, the uniaxial compression test was carried out on the cylinder specimens by an MTS testing machine. The stress-strain curve was monitored, and the specimen was loaded at 1 mm/min.
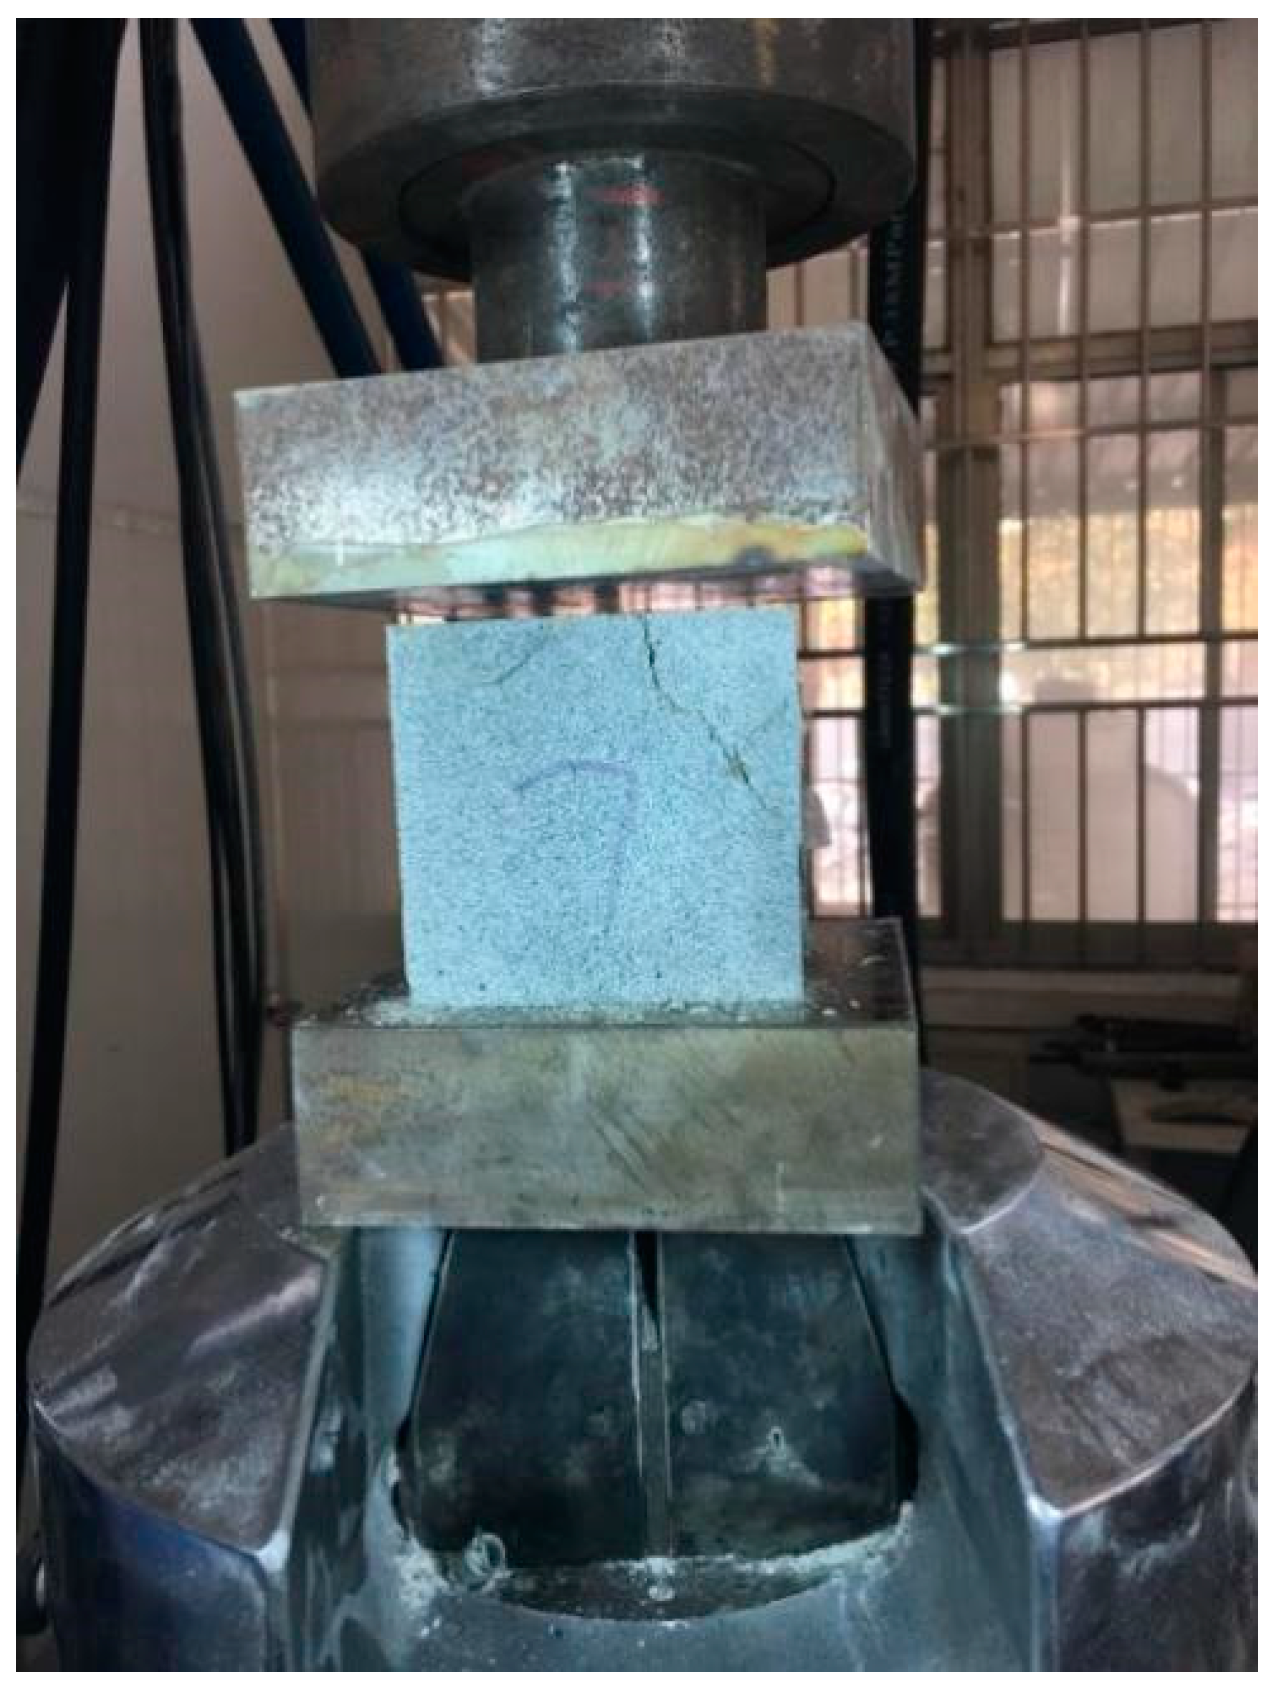
In Figure 7, a uniaxial compression test was carried out on the specimens with 100 × 100 × 100 mm by an MTS testing machine. This uniaxial compression test aimed to explore the relationship between the compressive strength of foam concrete and its density. The loading rates of 0.06 mm/min, 0.6 mm/min, and 6 mm/min were adopted as one of the variables.
4.4. Three-Point Flexural Test
In practical engineering, many failure cases of foam concrete are ultimately attributed to the bending stress. Therefore, it is important to research the flexural strength of foam concrete. In this section, the MTS test machine was used to investigate the effect of density on the three-point flexural strength of foamed concrete at different loading rates (0.006 mm/min, 0.6 mm/min, and 3 mm/min). The loading was stopped immediately once the displacement of the sample reached 300 mm.
4.5. Establishment of the DEM Model for Foamed Concrete
In this paper, a numerical method for establishing the numerical models of foamed concrete was proposed, where the density and pore distribution of foam concrete were taken as the two main parameters of the model. Firstly, two groups were created by writing the Fish program, namely Group 1 (representing cement matrix) and Group 2 (representing pores). Then, the parameters of porosity and density of the model were set according to the tests of foamed concrete, and cement matrix particles and pore particles were generated according to a certain size and distribution of the particles. When the surface gap (Ls) between particles is ≤0, the parallel bond is activated, and the particles are bonded together by the parallel bond. Finally, in order for the numerical model with a specific density and porosity to be generated, the Fish program was used to delete the pore particles (Group 2).
According to the CT scanning analysis, the size distribution of pores roughly follows the normal distribution, which is the same as Wei et al. [33], Therefore, pore particles were generated following the normal distribution in all models, and the formula is as follows:
where x is the variable for pore size, μ is the average pore size, and σ is the standard deviation.
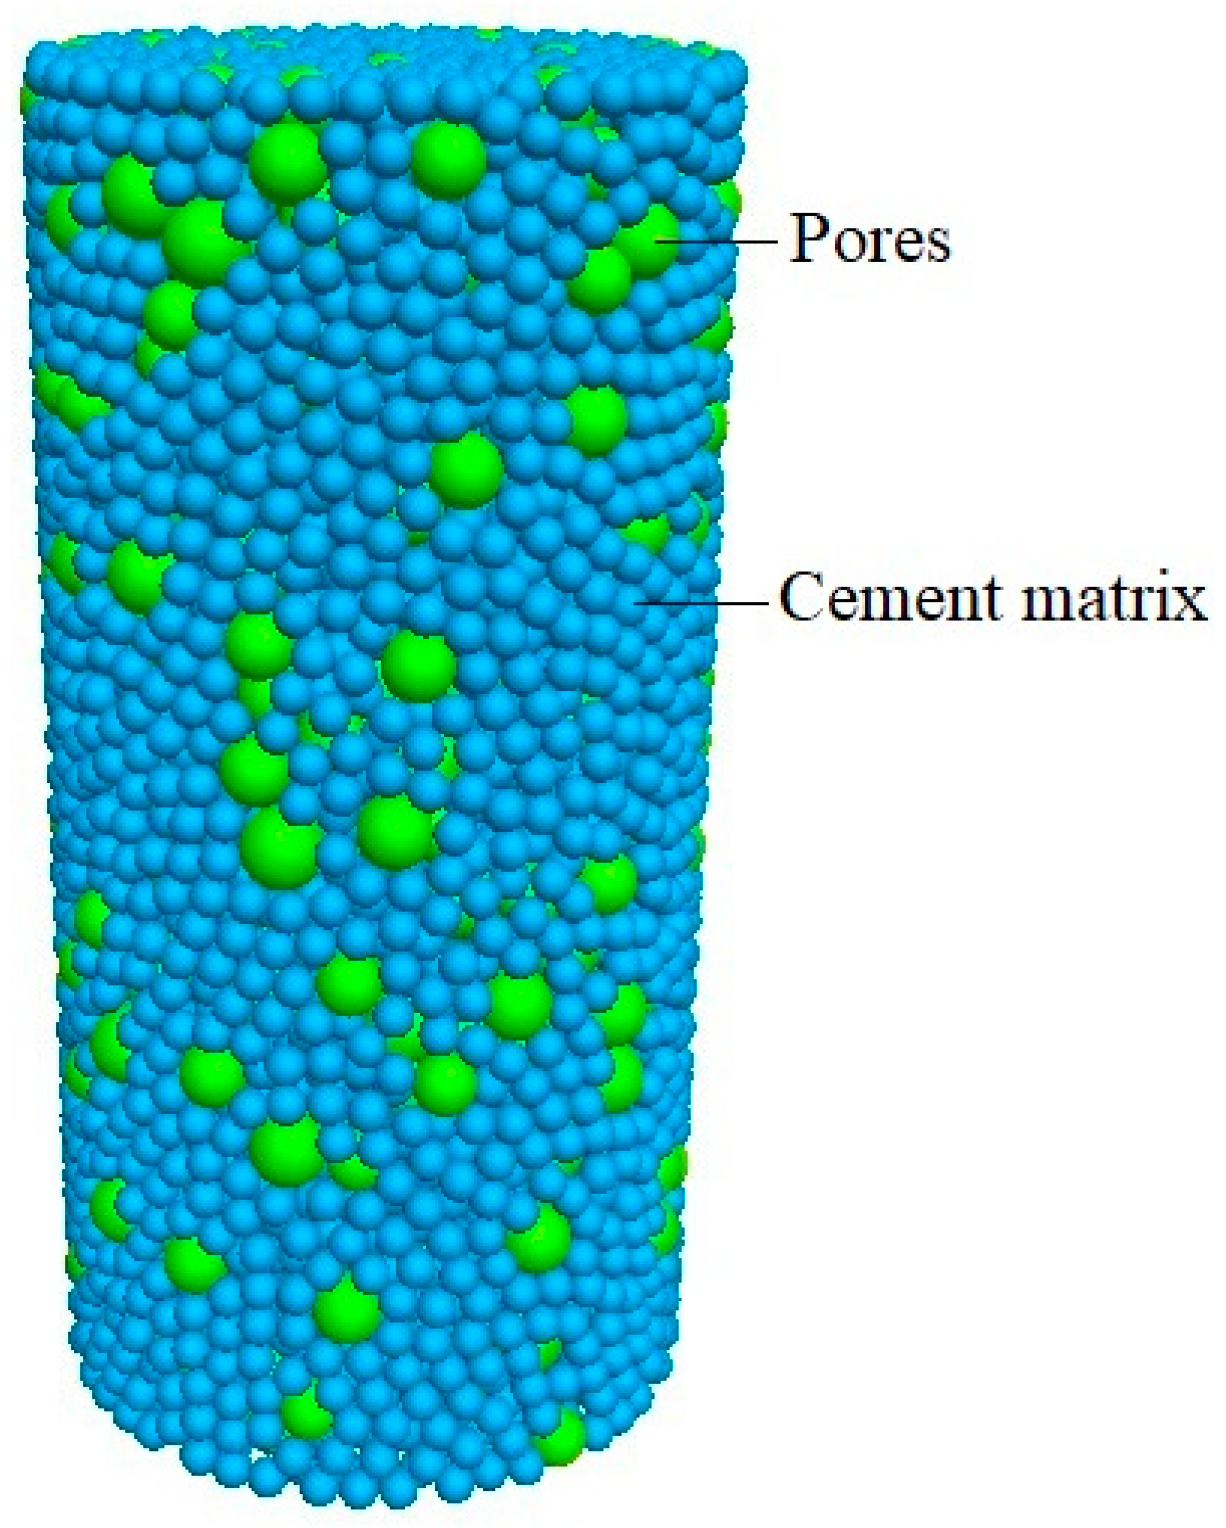
According to the CT scanning results and taking into account the calculation cost, the radius range of pores selected in this paper was 0.4–3.8 mm, and a cylinder model (with a density of 750 kg/m3 and a size of Φ 50 × 100 mm) was generated by the above method, as shown in Figure 8.
5. Results and Discussions
5.1. Experimental Study
5.1.1. X-ray Computed Tomography
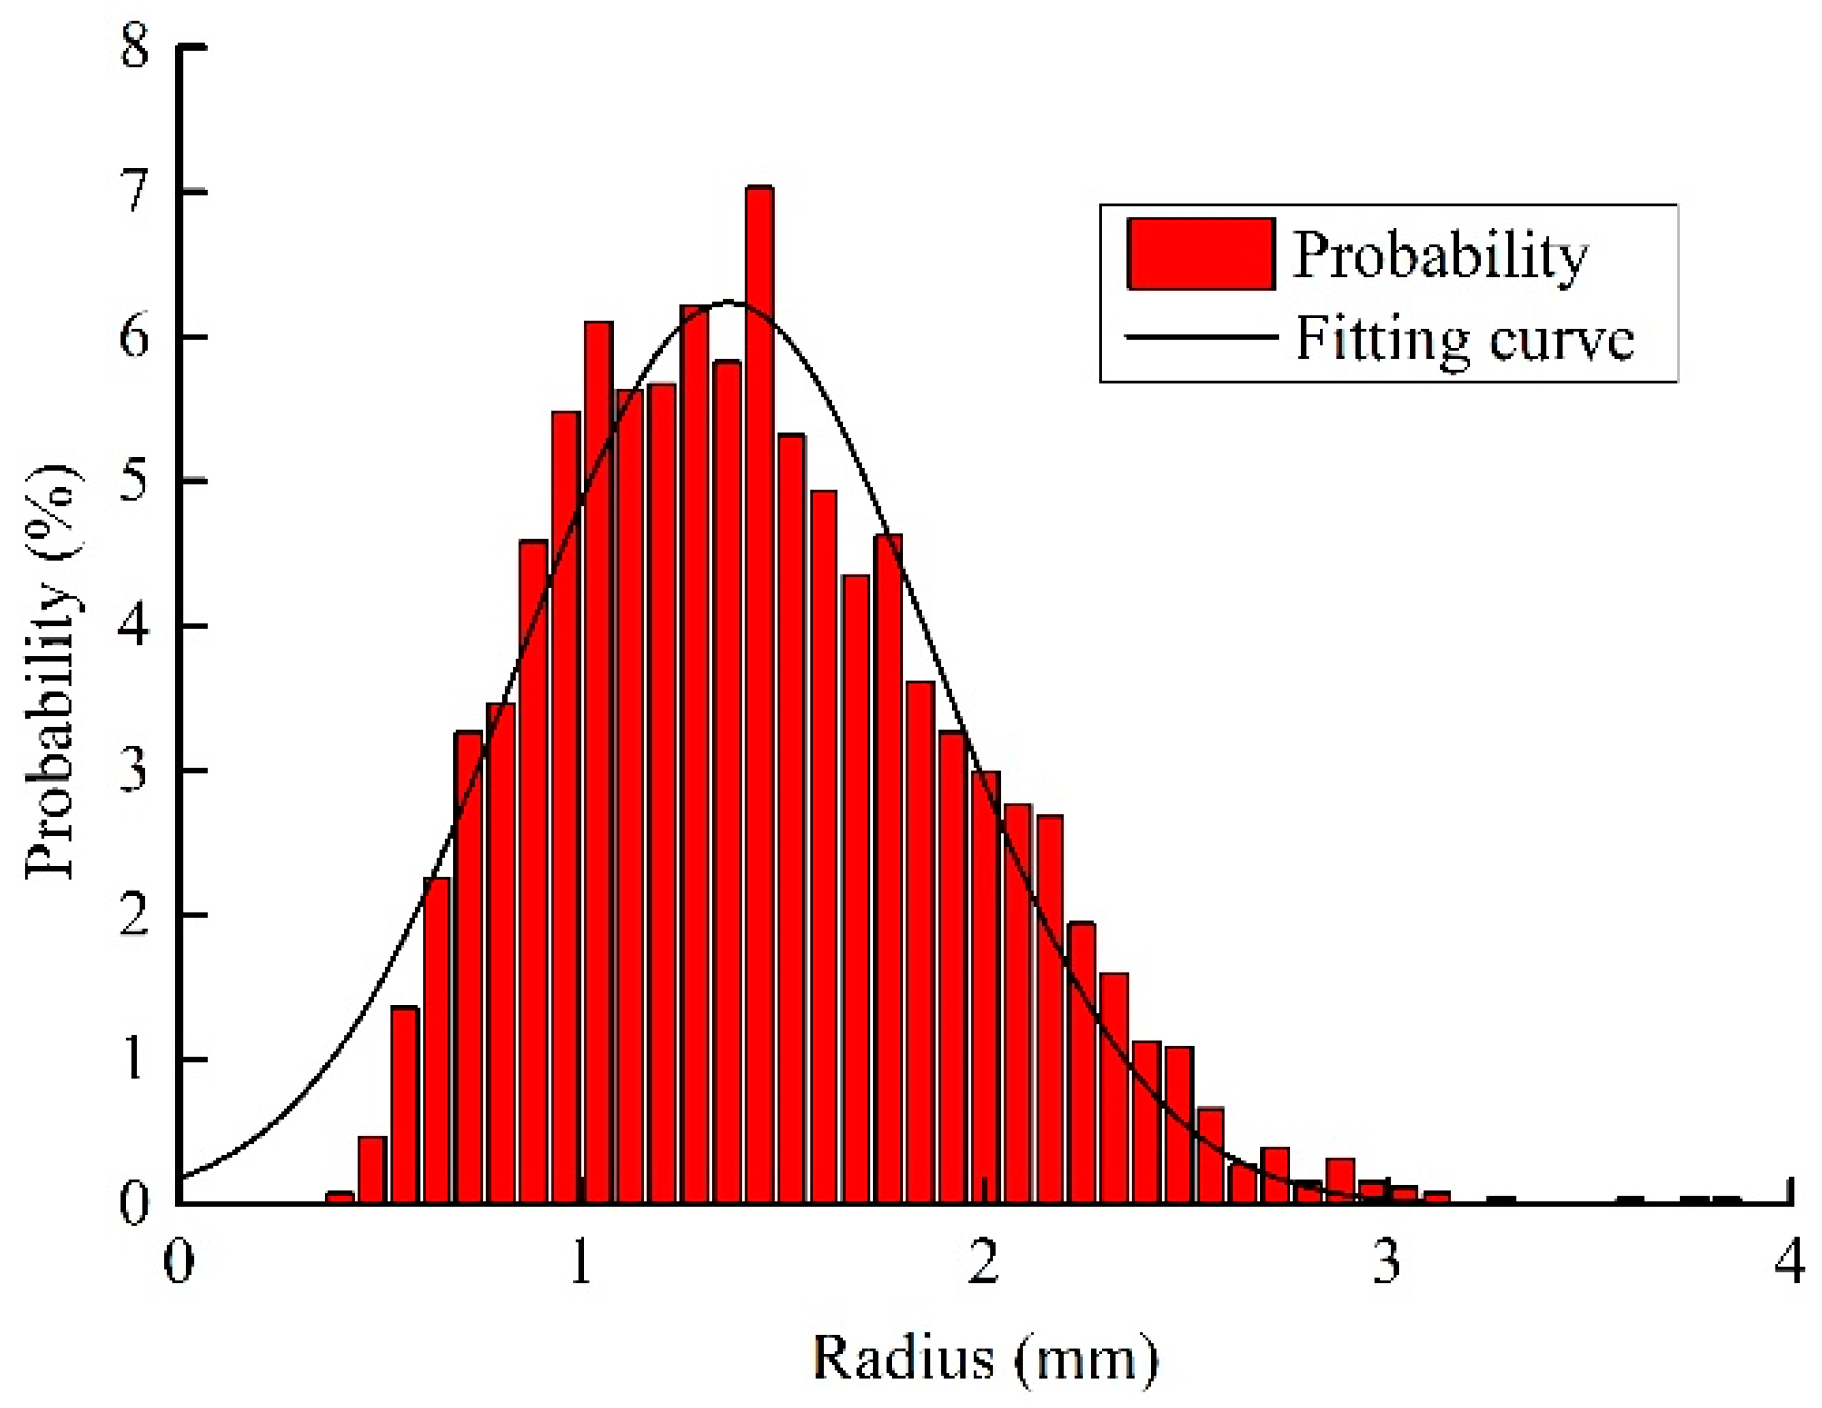
According to the analysis of CT scan images, the total porosity of foamed concrete was 68.2304% for 500 kg/m3, 66.1396% for 600 kg/m3, and 52.1737% for 750 kg/m3, respectively. It can be seen from the 2D grayscale image and the 3D reconstruction of the pore structure that most of the pores are spherical, and it can be concluded from the extraction and calculation of pores inside the foamed concrete that the size distribution of pores roughly follows the normal distribution [17,34,35], as shown in Figure 9.
Based on the physical characteristics observed by CT scanning, spherical particles can be used in the DEM model. Pores in the foamed concrete are signified by these spherical particles, which are named pore particles. Therefore, in this study, a certain number of pores were generated using the determined pore size distribution, and the DEM model with a given density was formed with the cement paste particles. When the DEM model was generated, the deletion command was executed to remove the pore particle group from the model, and the pore structure was generated to establish a calculation model that was consistent with the actual pore structure inside the foamed concrete.
5.1.2. Uniaxial Compression Test
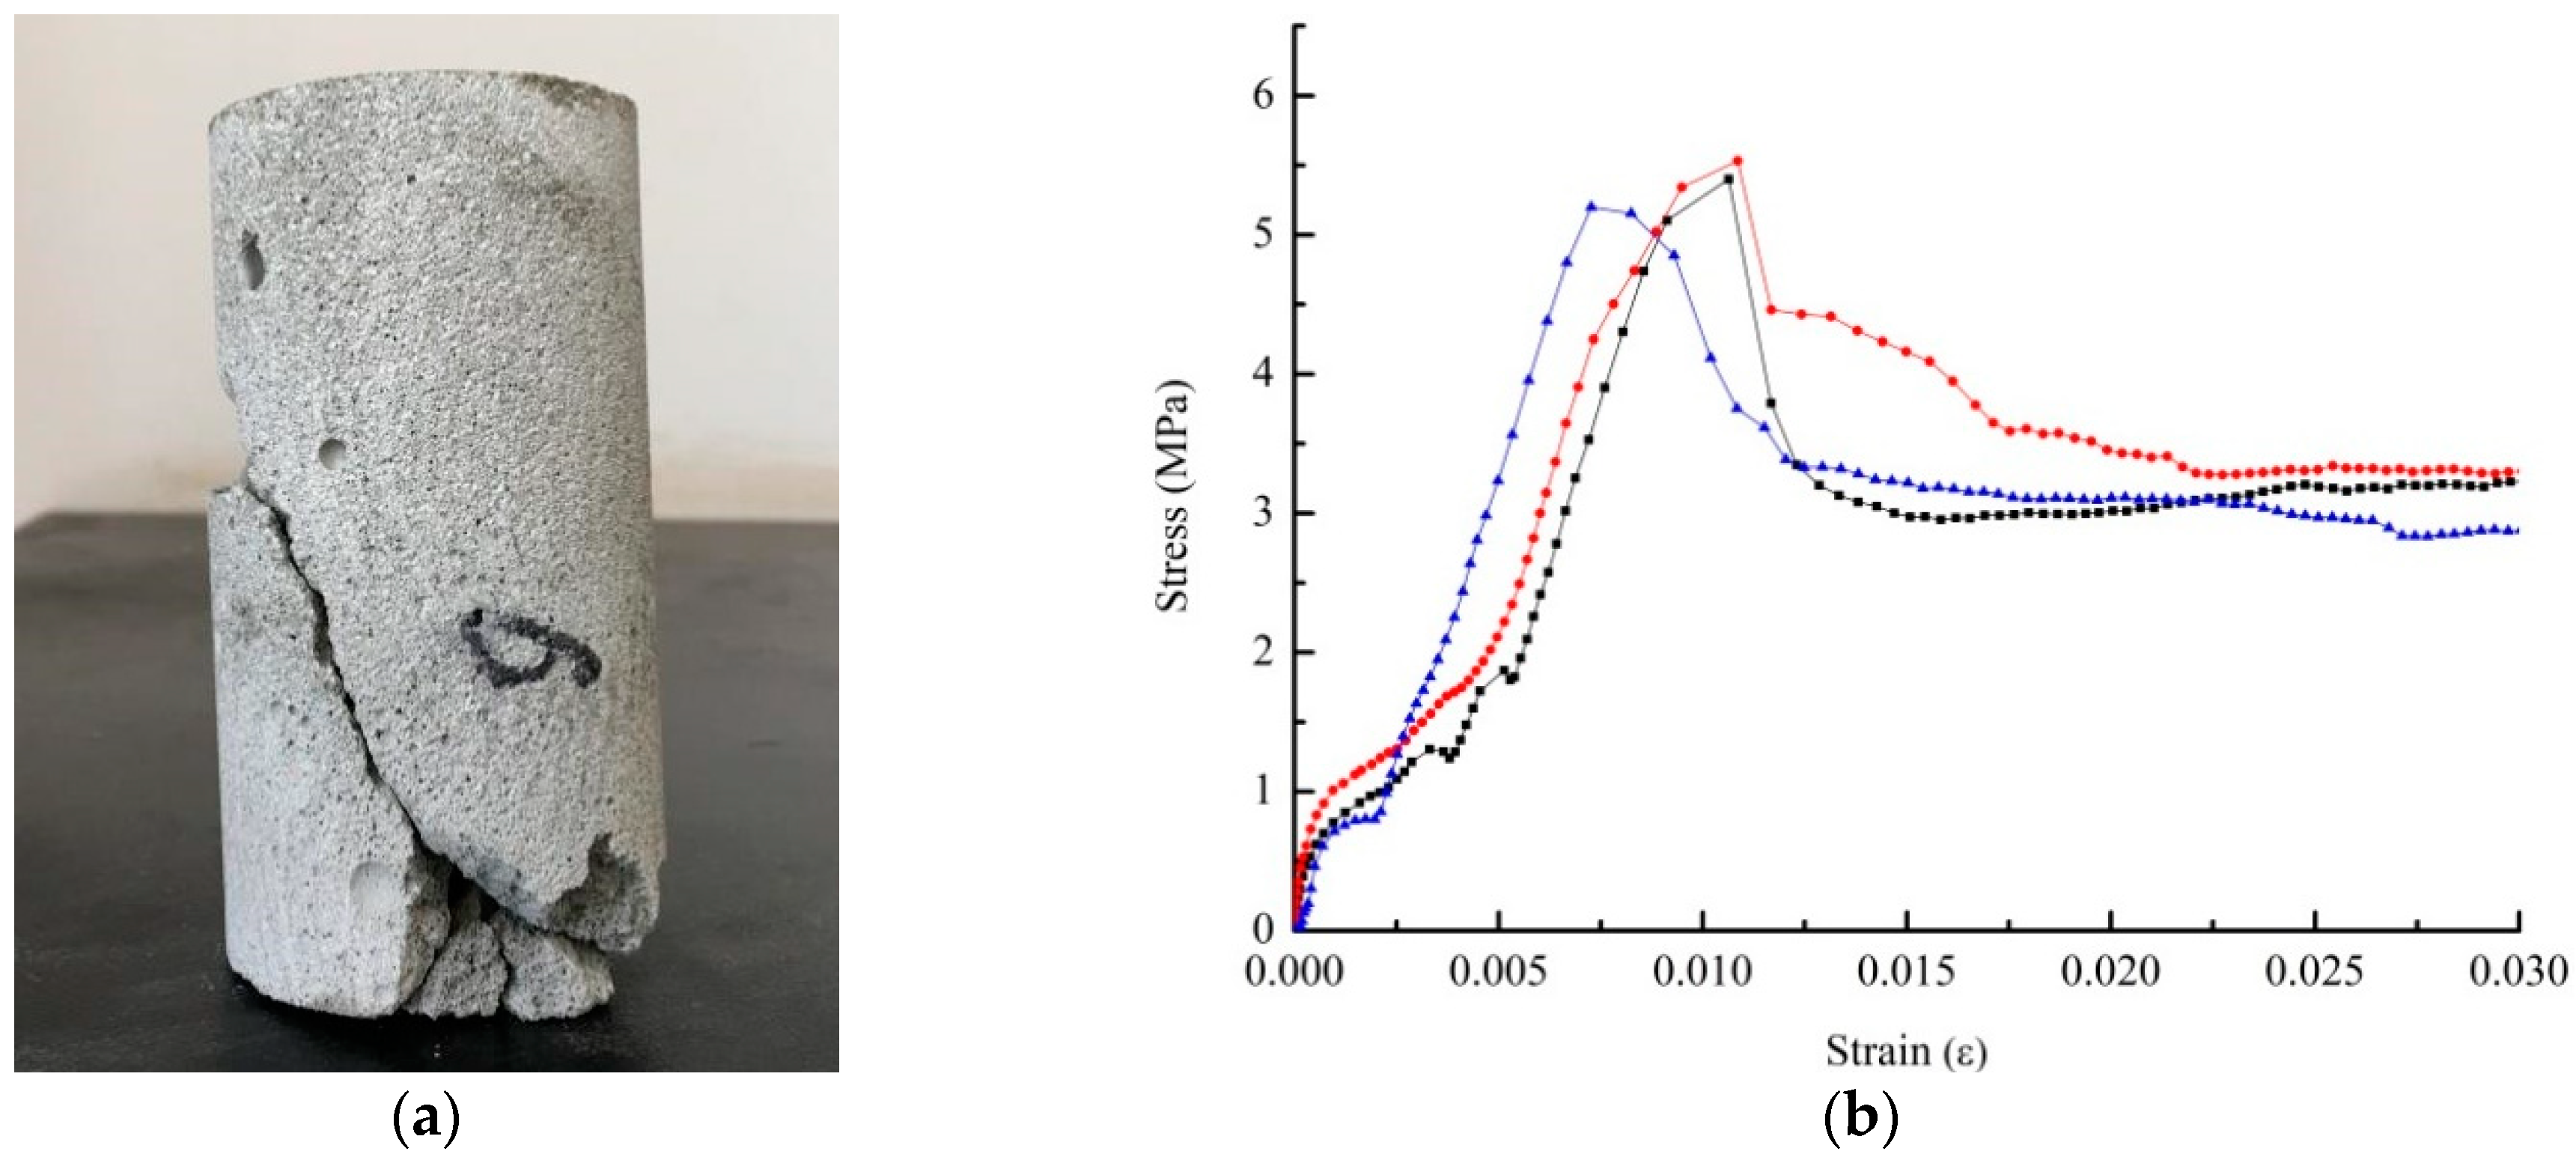
Figure 10 shows the stress-strain curves at the typical failure mode of foam concrete. It can be seen from Figure 10b that the curve is in the shape of steps at the beginning of loading. This is mainly because the foamed concrete contains a large number of pores, which collapse as the loading goes on, resulting in a sudden drop in stress. However, when the strain reaches 0.005, the foamed concrete is compacted, and the stress-strain curve presents a straight upward trend until a macroscopic crack is formed, resulting in the complete failure of the foamed concrete due to its loss of bearing capacity. For the specimens with the same density, the failure modes and elastic moduli are also different. This is mainly because the pore structures inside different specimens are different, although these specimens have the same density. In addition, the macroscopic response of different microcosmic pore structures to the foamed concrete leads to different mechanical behaviors.
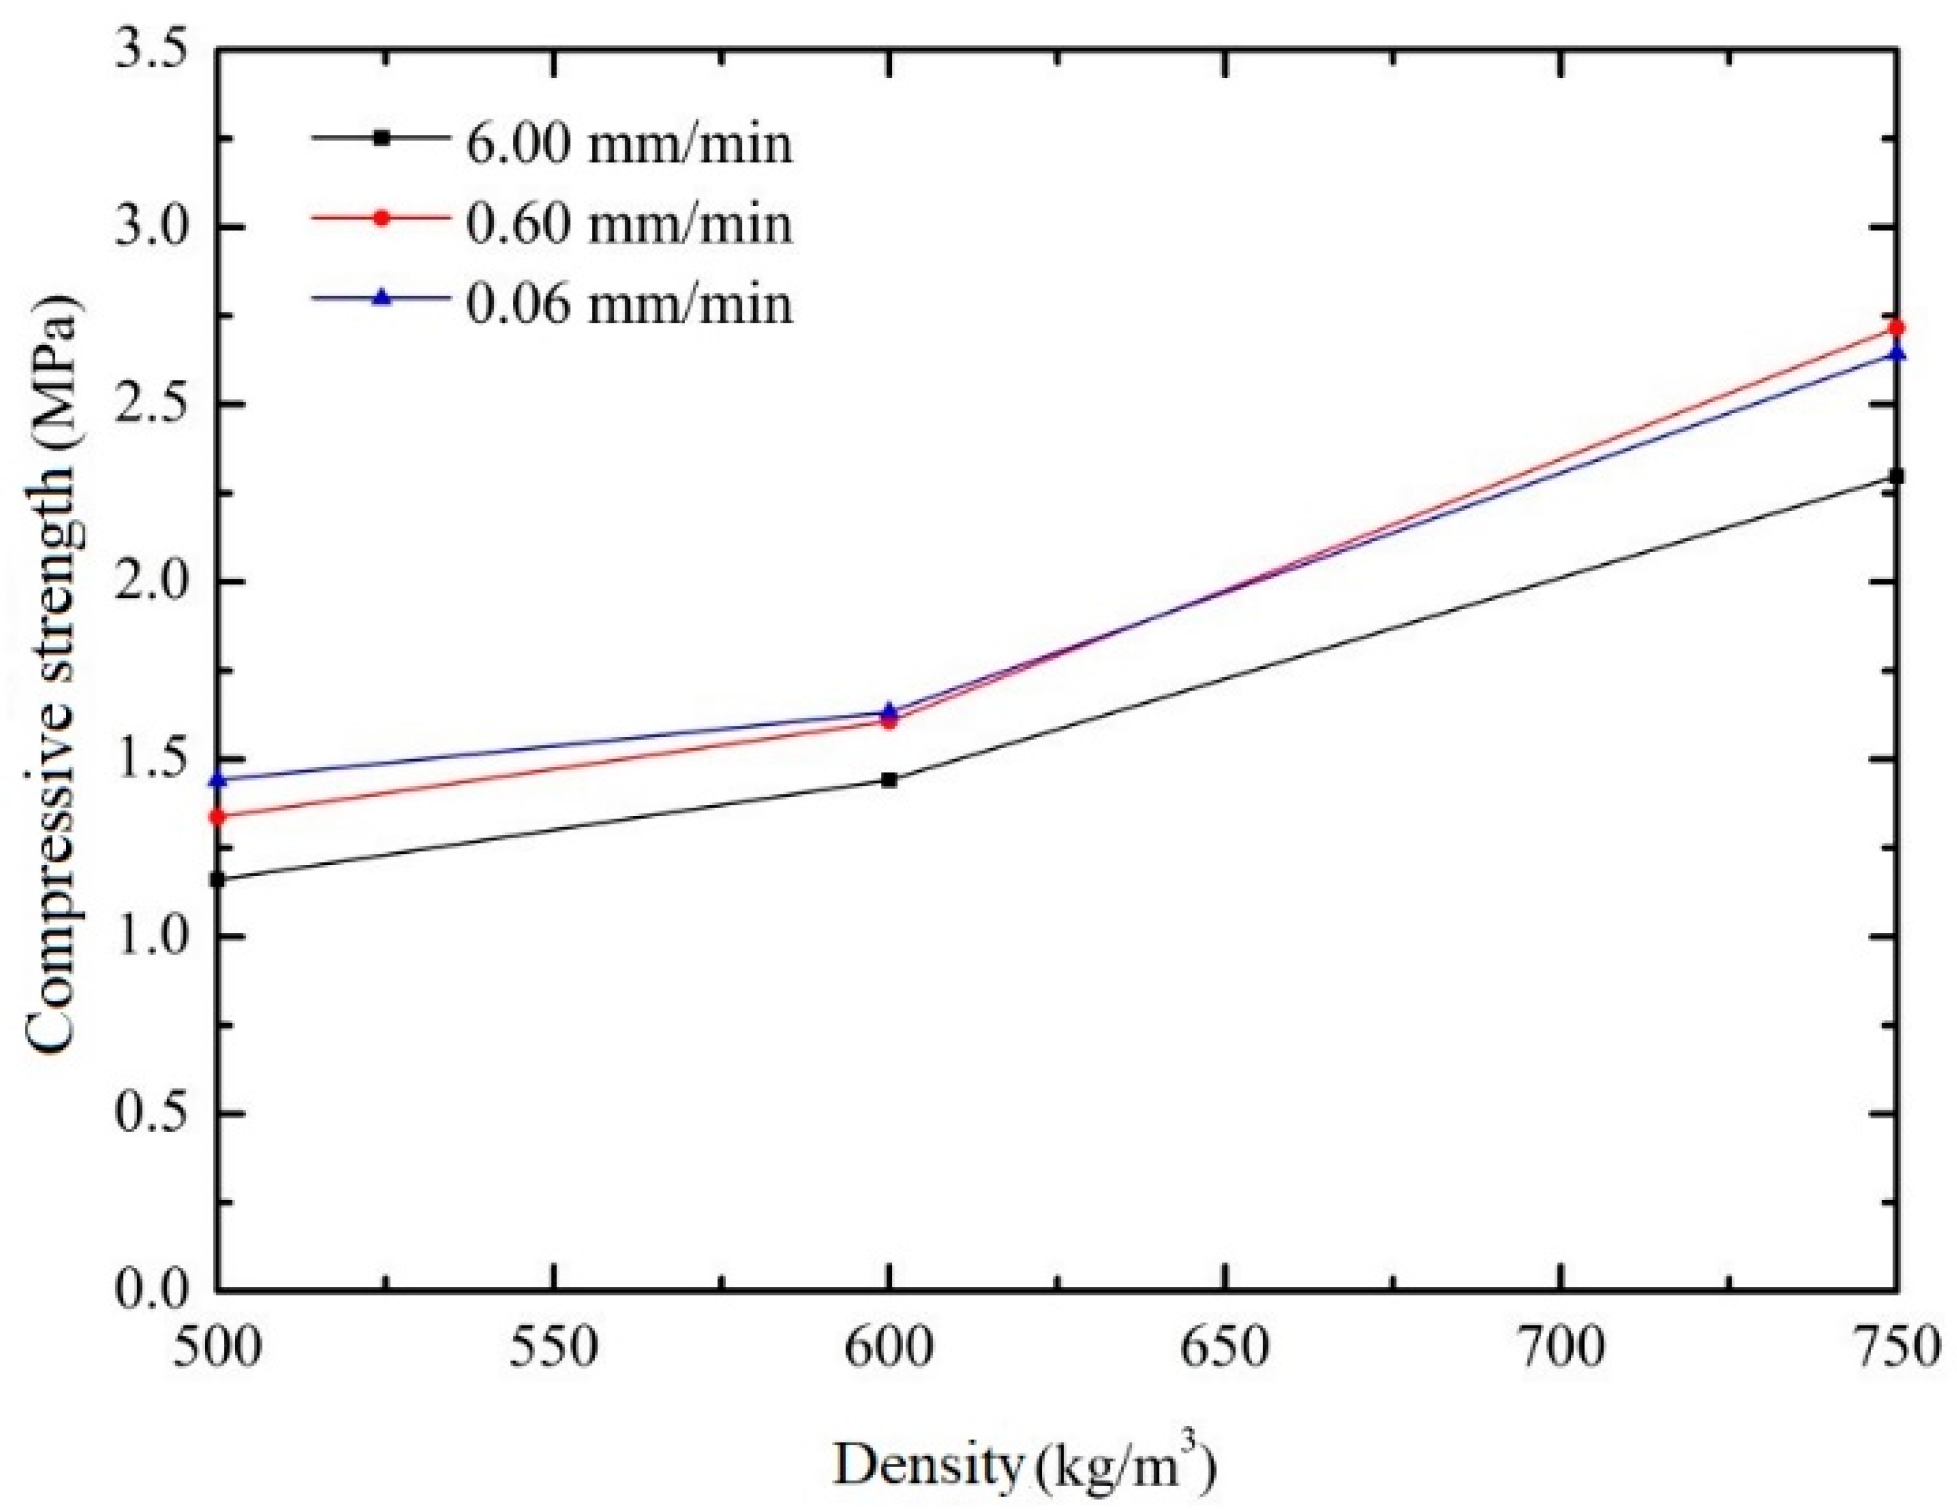
Figure 11 shows the relationship between compressive strength and density of foam concrete under different loading rates. The densities of foam concrete were 500 kg/m3, 600 kg/m3, and 750 kg/m3, respectively, and the loading rates were 0.06 mm/min, 0.6 mm/min, and 6 mm/min, respectively. As shown in Figure 11, the compressive strength of foam concrete was proportional to its density, and this conclusion applied to all loading rates. When the density increases from 500 kg/m3 to 600 kg/m3, the compressive strength increases by 20%, and when the density increases from 600 kg/m3 to 750 kg/m3, the growth rate of the compressive strength further increases, increasing by 69%. This phenomenon once again showed that the density of foam concrete is related to its compressive strength. It is because, with the increase in the density of foamed concrete, the internal pores are less dispersed, which causes the stress to be dispersed to the cement matrix, showing a significant increase in the carrying capacity. In addition, the cement matrix around the pores is more likely to form a stress concentration, resulting in the loss of the bond and the collapse of cement particles around them, which is another reason for the low carrying capacity of foamed concrete with a lower density.
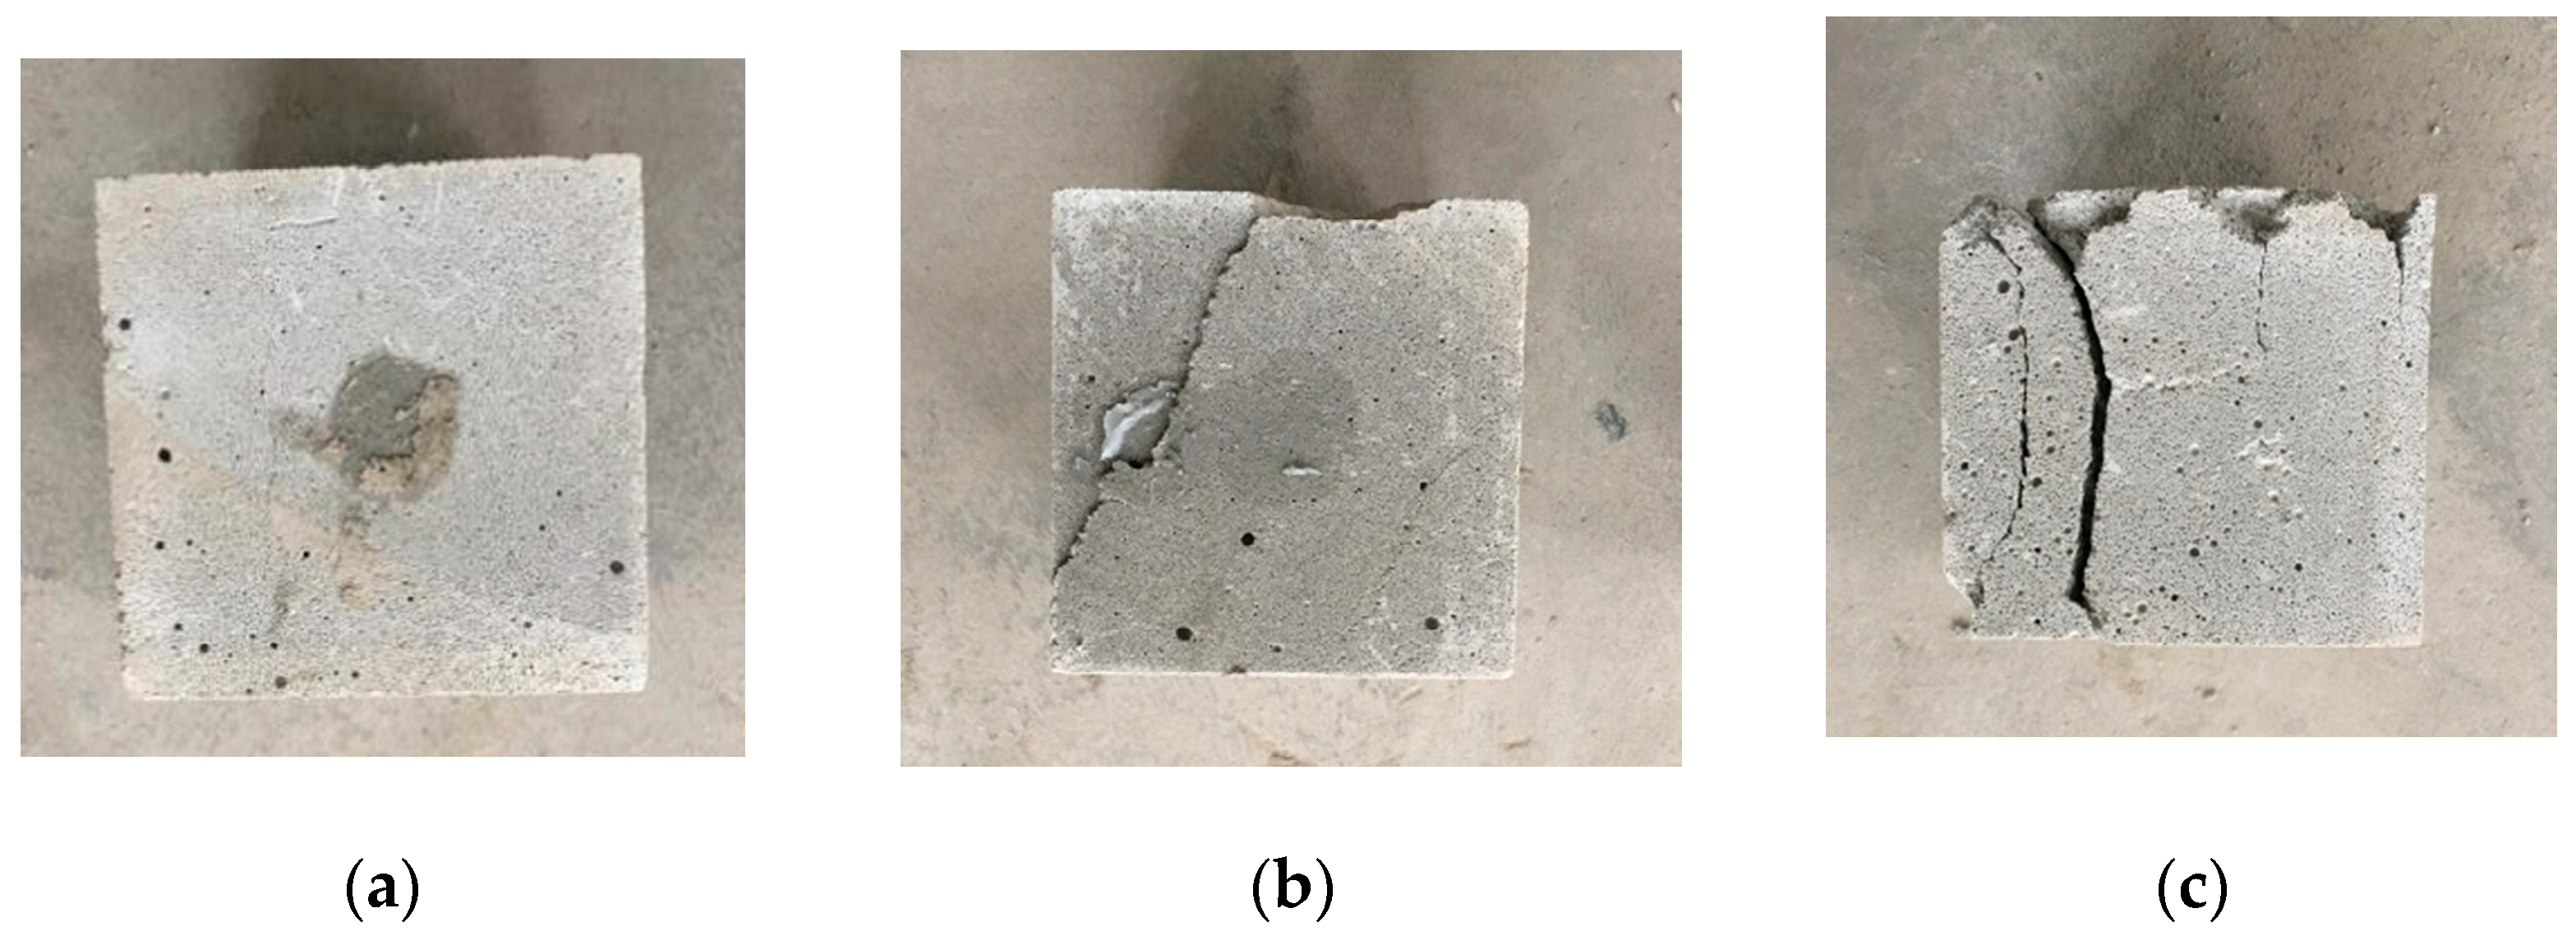
Meanwhile, the loading rate also has a certain effect on the compressive strength. The loading rate has a strong positive correlation with compressive strength when the density of foamed concrete is small. However, the positive correlation gradually weakened with the increase in density. In Figure 12, the above phenomenon can be explained by the failure section of the specimen. When the loading rate is small, the number of macroscopic cracks is also small (as shown in Figure 12a), which indicates that the stress distribution of the specimen is relatively uniform and there is no obvious stress concentration, and the ability to bear the stress will be correspondingly large. When the loading rate is high (as shown in Figure 12c), some macroscopic cracks will be generated, which indicates that the stress concentration phenomenon occurs in the specimen and that its ability to bear the stress will be weakened. However, when the density is higher, the number of pores inside the foamed concrete is smaller, the cement matrix is more uniform, and the development of cracks is less affected by the loading rate, which leads to the positive correlation being weakened.
5.1.3. Three-Point Flexural Test
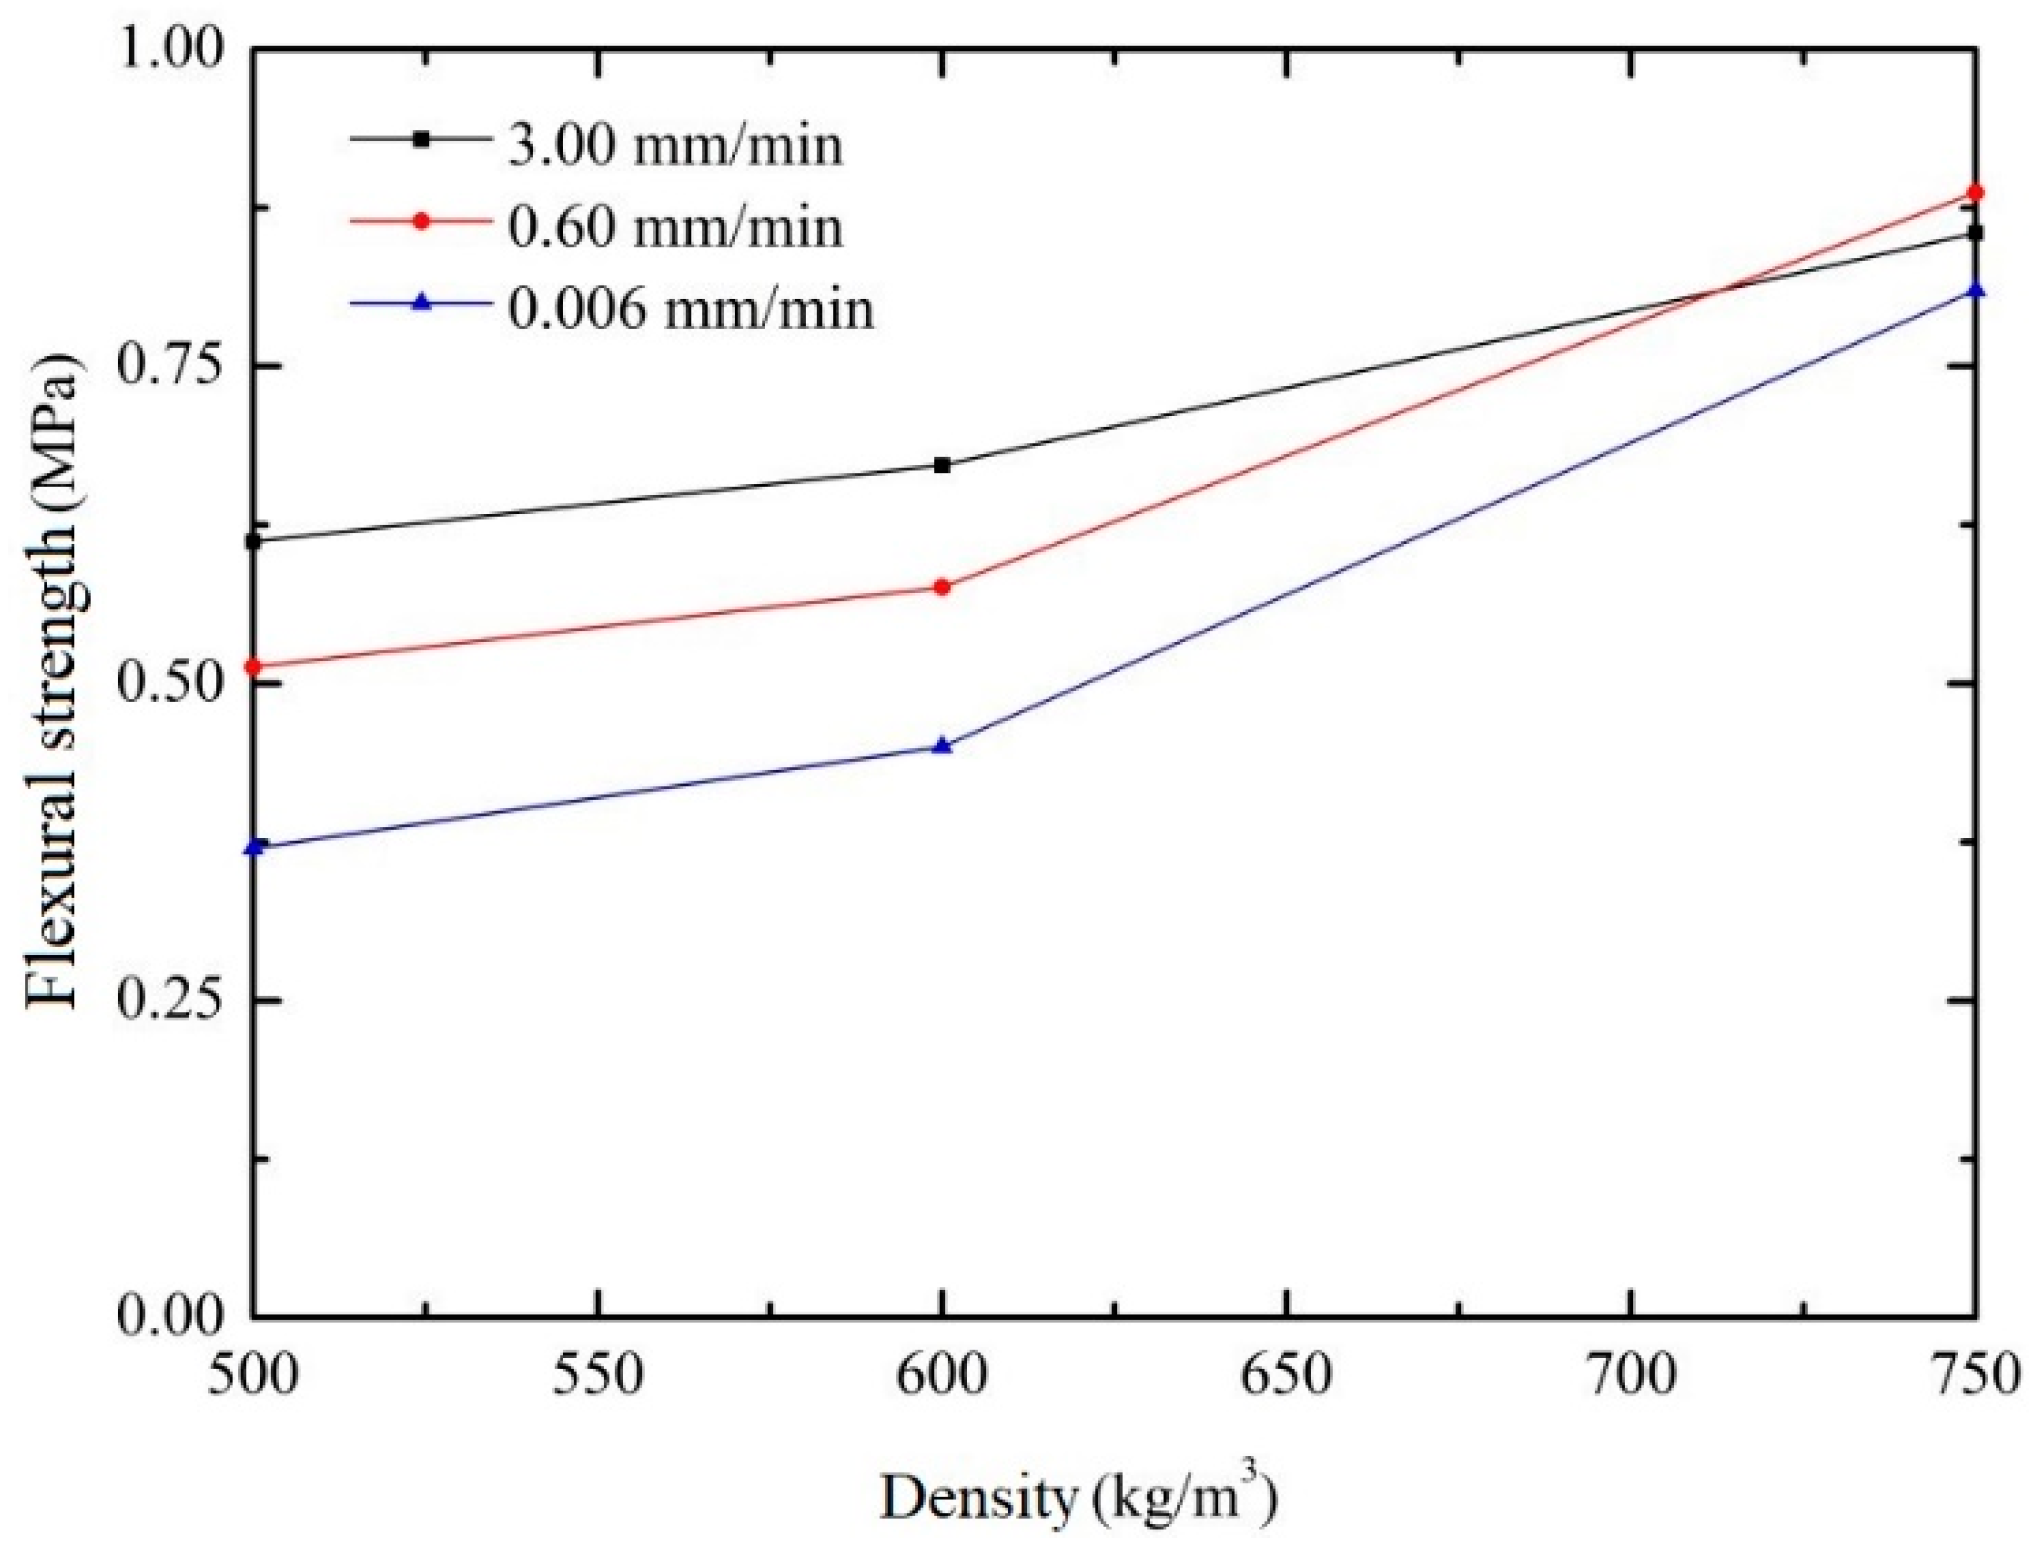
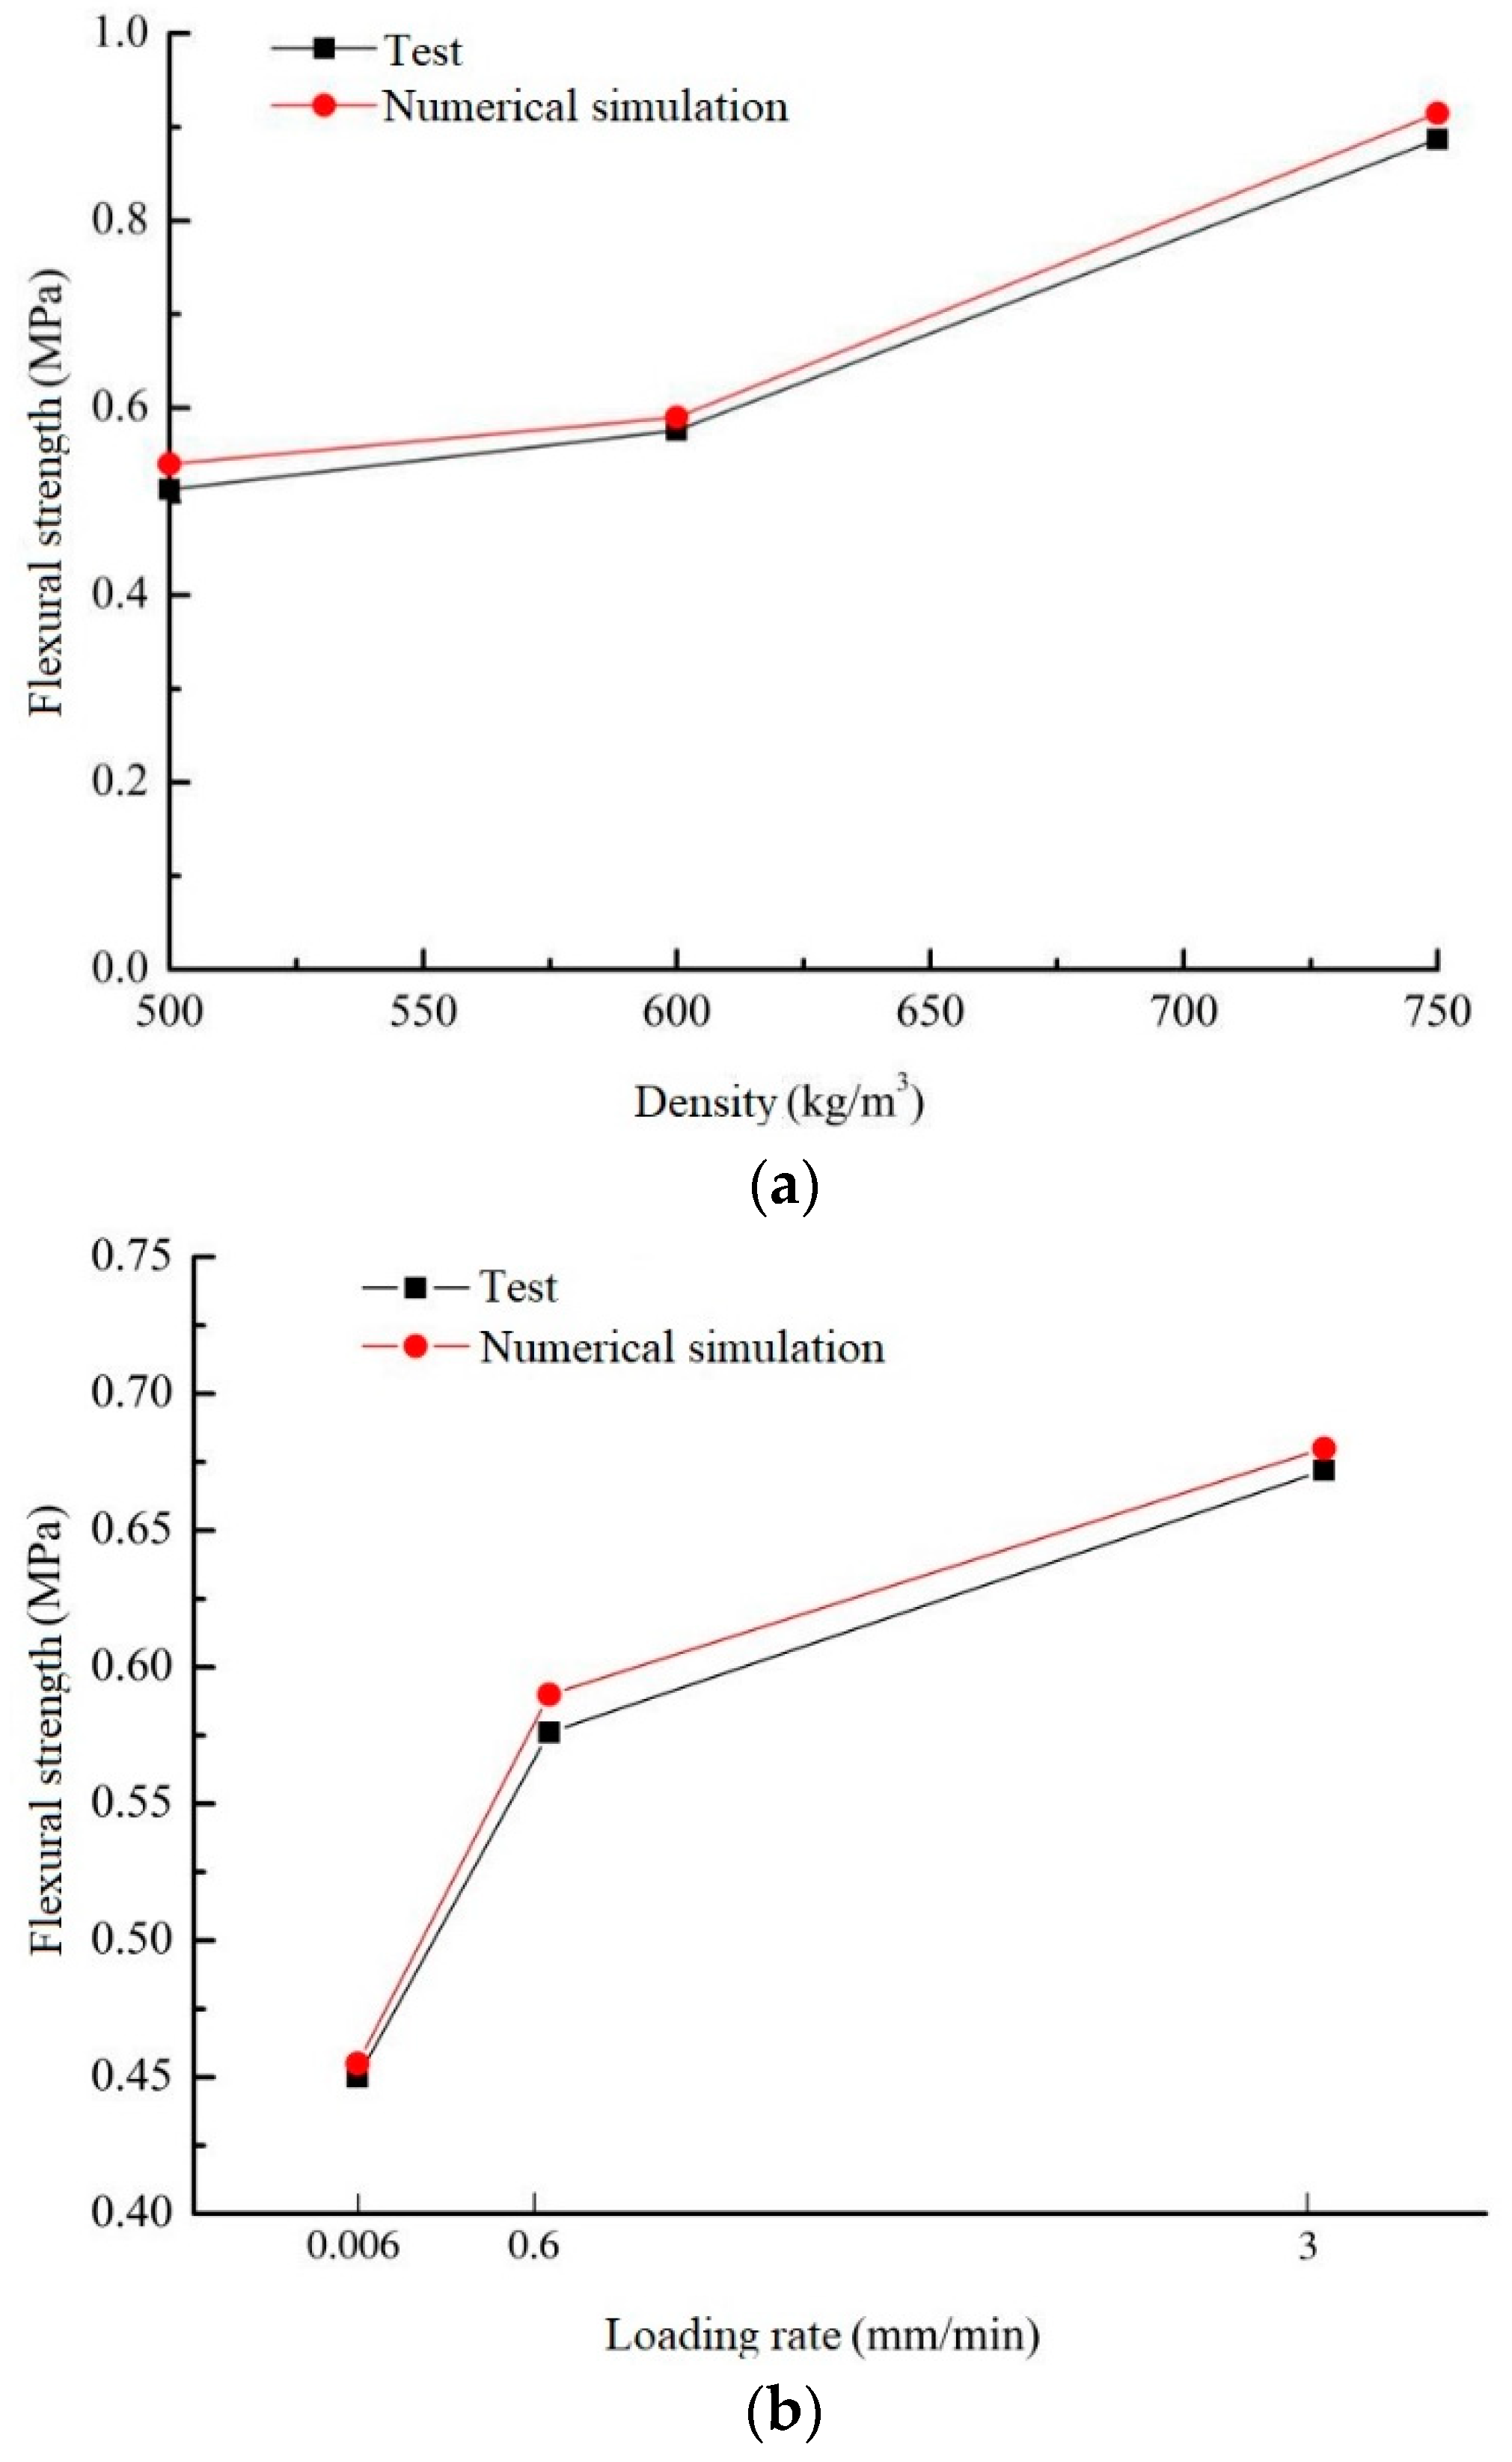
It can be seen from Figure 13 that, when the loading rate is constant, the flexural strength of foamed concrete is also in direct proportion to its density, which is similar to the research results of Jiang et al. [36]. When the density increases from 500 kg/m3 to 600 kg/m3, the flexural strength increases slowly, only by 12.3%, while when the density increases from 600 kg/m3 to 750 kg/m3, the flexural strength increases rapidly, by 54%. The influence of density on flexural strength is mainly attributed to the different pore distributions in foam concrete [37,38,39,40]. The bottom of the specimen is subject to tensile stress, and the cement matrix around the pores is weak in resistance to tensile failure. Therefore, when the density is low, the pores inside the foamed concrete will be more concentrated, which will divide the cement matrix into thinner resistant tensile surfaces, resulting in a sharp drop in tensile strength. This is the internal cause of the rise in flexural strength of foamed concrete with high density.
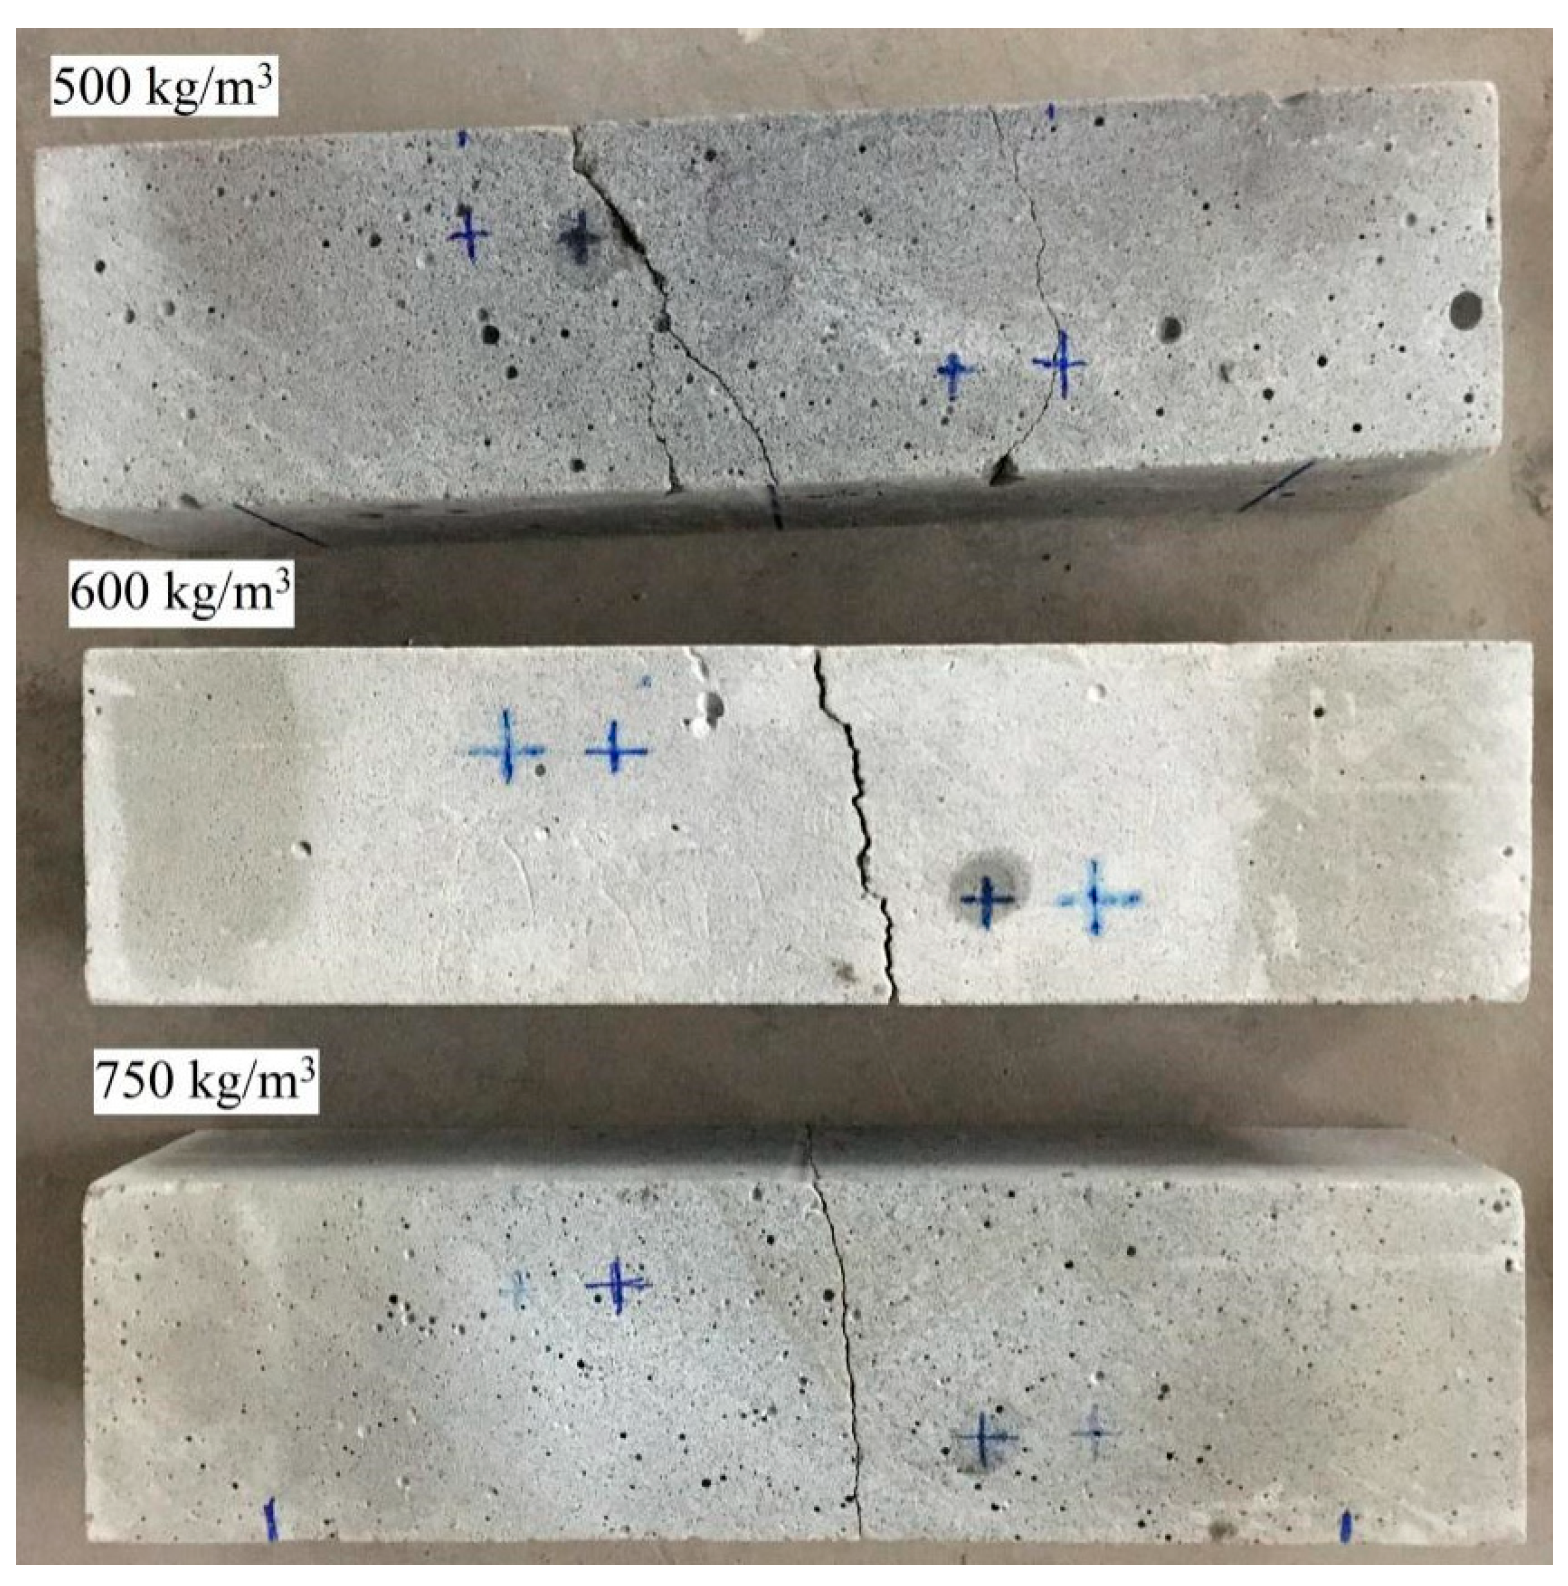
Figure 14 shows the failure mode of foamed concrete with different densities at a fixed loading rate. In Figure 14, when the density is high, the failure section is relatively flat, approximately in a straight line; when the density is low, the failure section is relatively rough, and the failure angle is large. This phenomenon is consistent with the flexural failure of light-weight foam concrete with expanded clay aggregates carried out by Lu et al. [41]. This is mainly due to the distribution of more pores inside the foamed concrete with a lower density. The cracks generated by the force will expand along the weakest area around the pores according to the distribution trend of pores, resulting in a relatively rough failure surface. However, when the density is higher, the distribution of pores inside the foamed concrete is less, and the homogeneity of the cement matrix is further improved, so the cracks tend to develop along the loading direction, resulting in a relatively flat macroscopic failure surface. Meanwhile, it can be seen from Figure 13 that when the density is less than 600 kg/m3, the influence of loading rate on bending strength is as follows: 3 mm/min > 0.6 mm/min > 0.006 mm/min. However, when the density is greater than 600 kg/m3, the influence of the loading rate on flexural strength is gradually weakened.
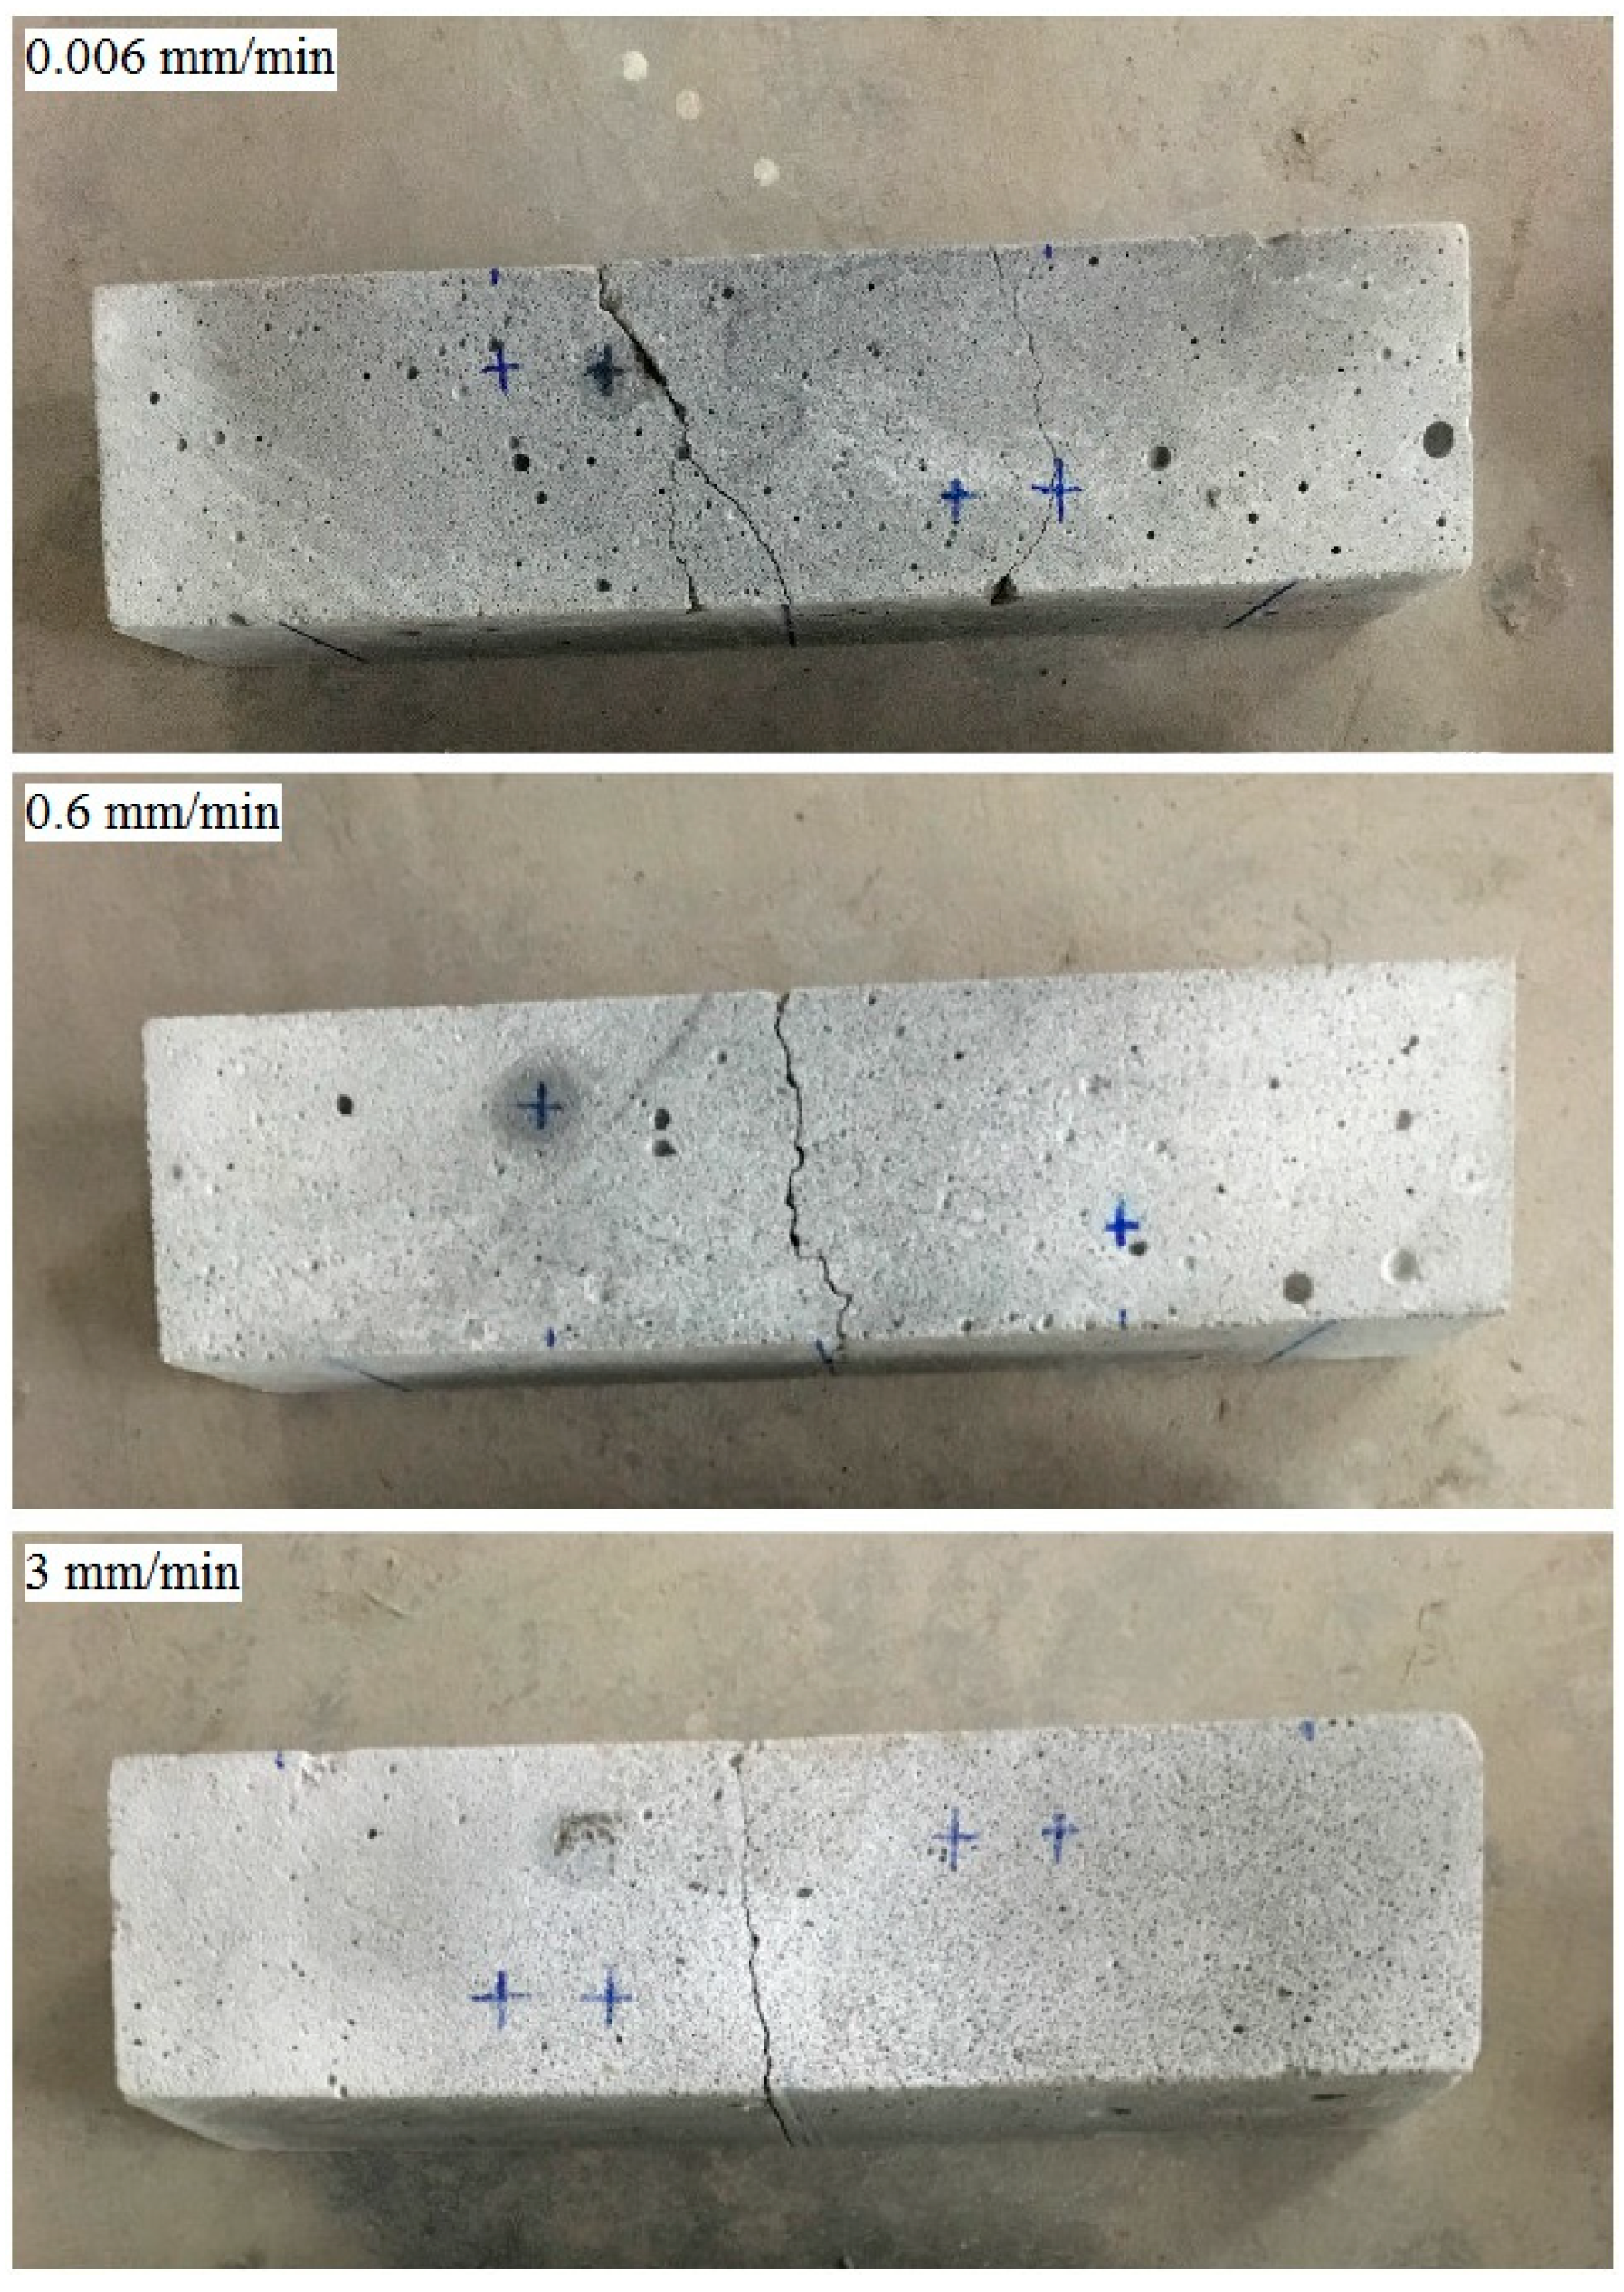
When the loading rate increases from 0.006 mm/min to 3 mm/min, the flexural strength of foamed concrete with a density of 500 kg/m3 increases by 65%, while that of foamed concrete with a density of 750 kg/m3 increases slightly. This phenomenon can be attributed to the failure section of foam concrete. In Figure 15, when the loading rate is low, it takes a long time for the foamed concrete specimen to fail, and the cracks generated by the force will expand along the weakest area around the pores to form a rough failure section during this period. When the loading rate is high, the loading period is short, and the cracks tend to develop directly through the cement matrix in a straight line. The toughness of the cement matrix is higher than that of the pore area, which is the main reason for the high strength of the foamed concrete beam under a high loading rate.
5.2. Numerical Simulation Analysis
5.2.1. Effect of Particle Size
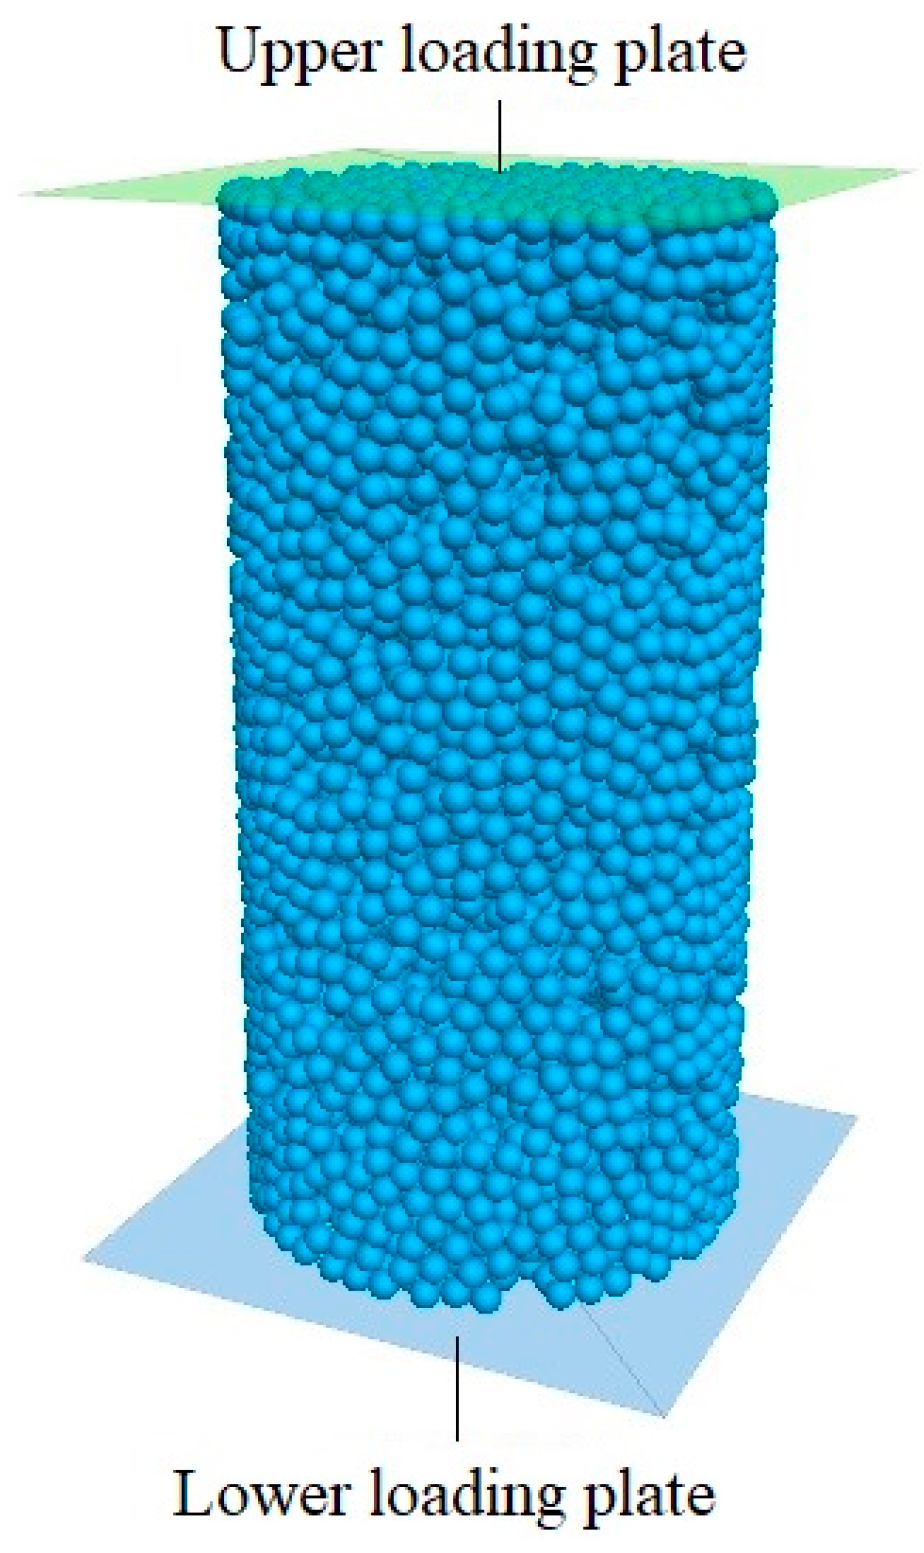
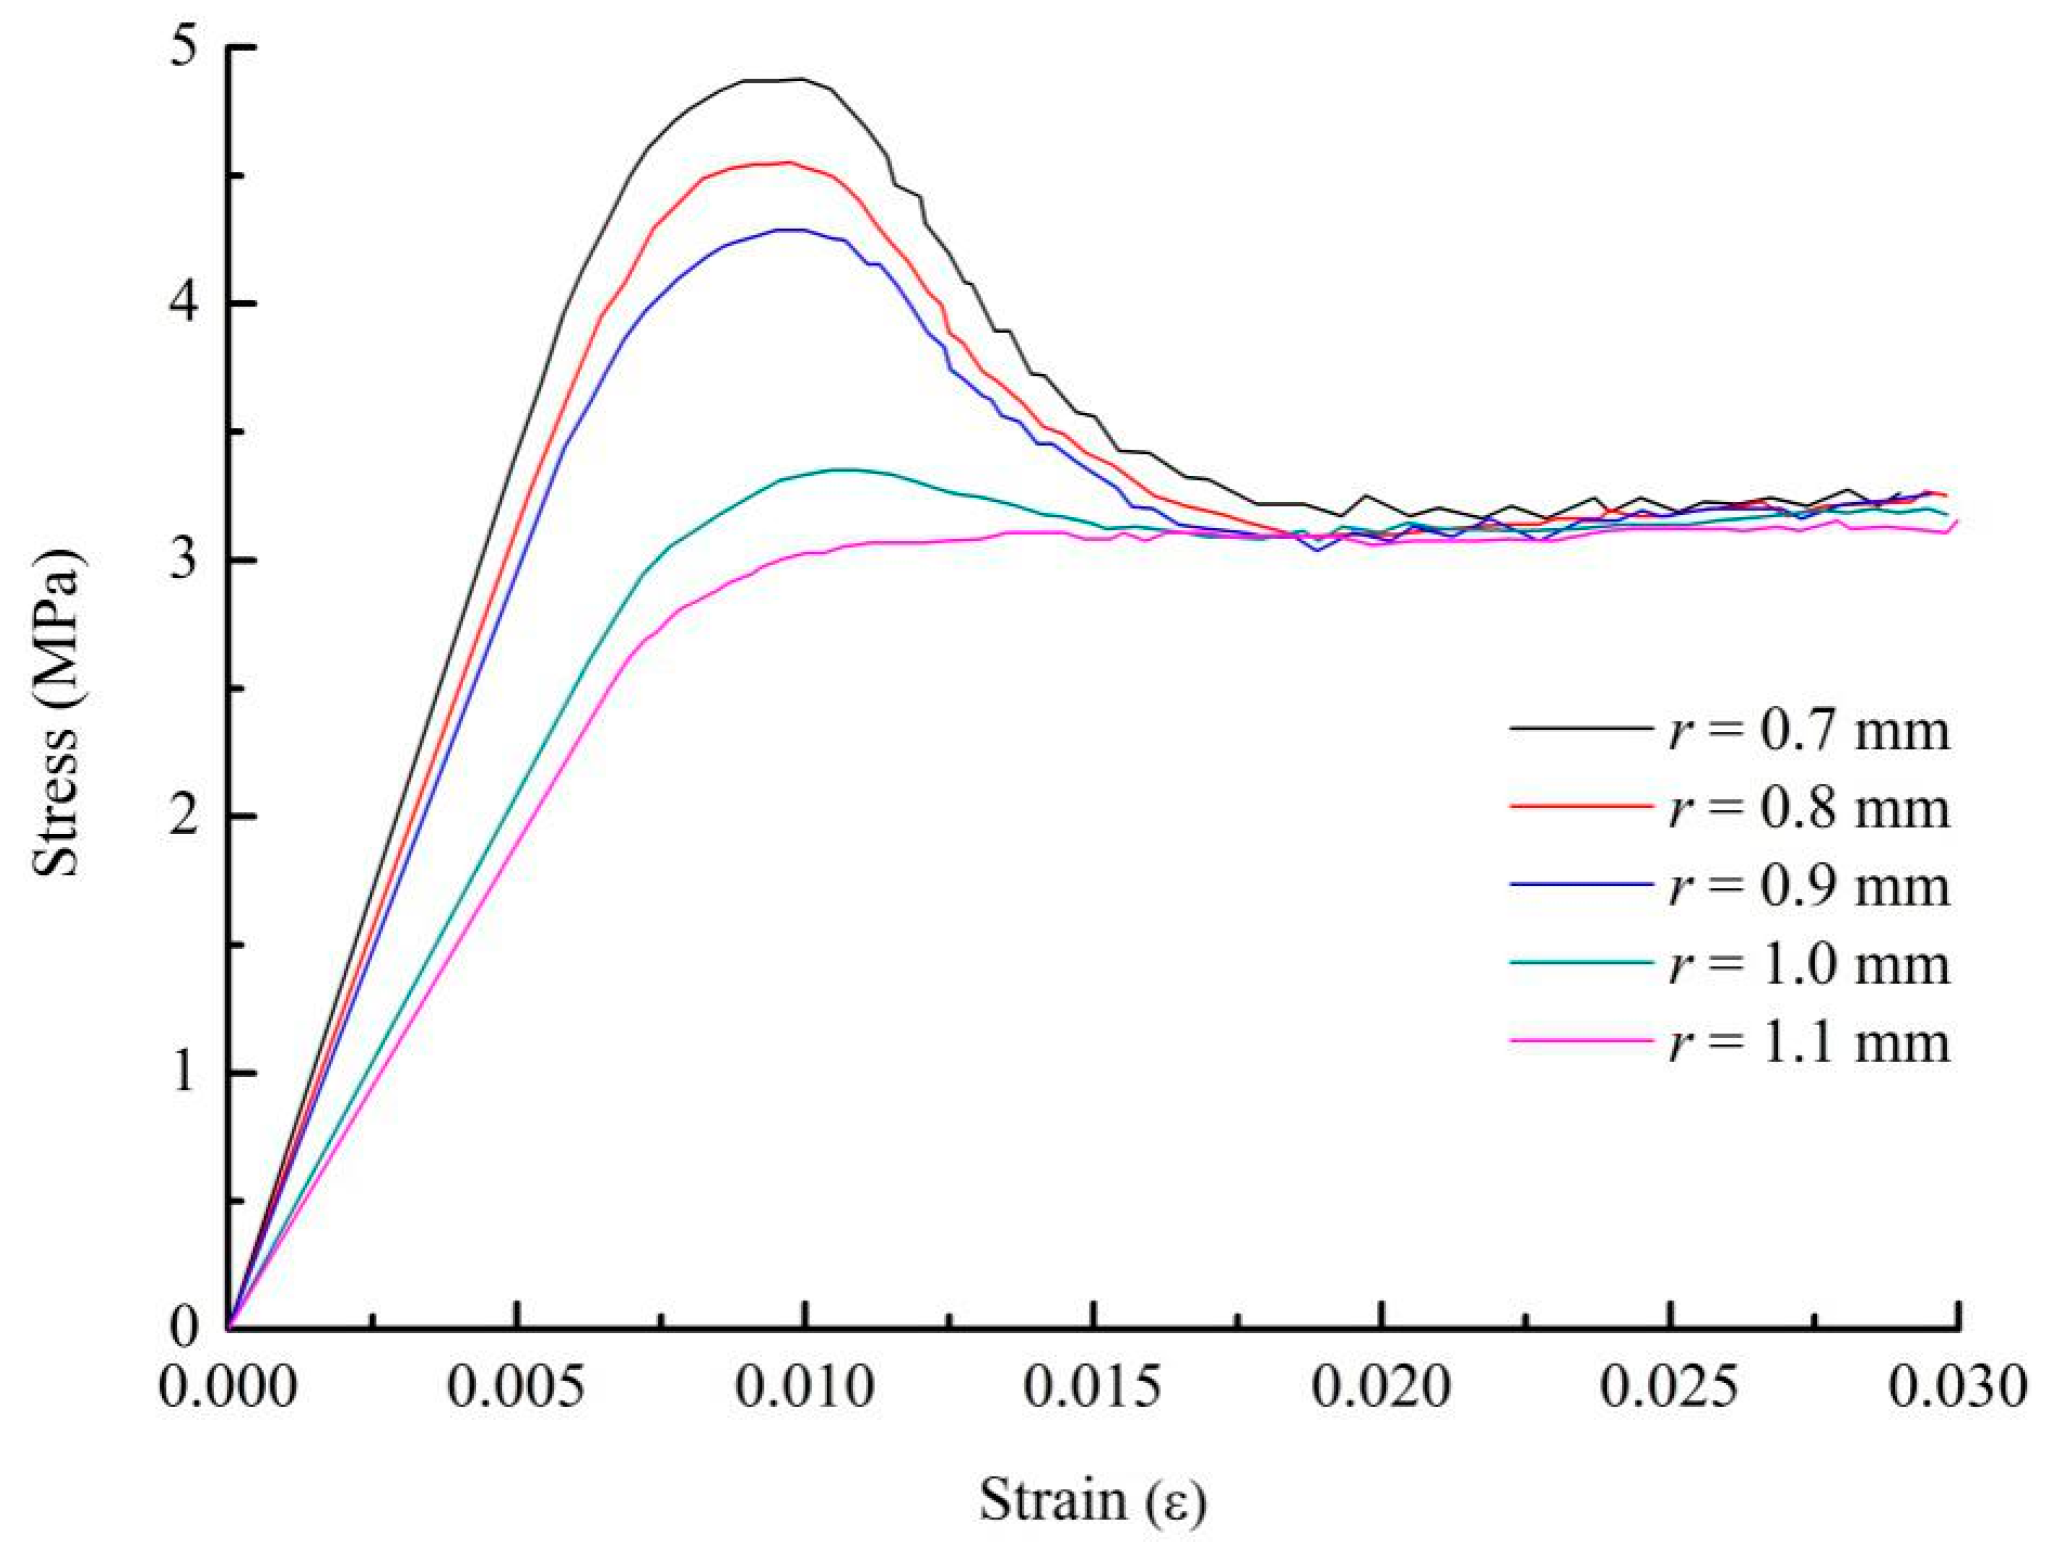
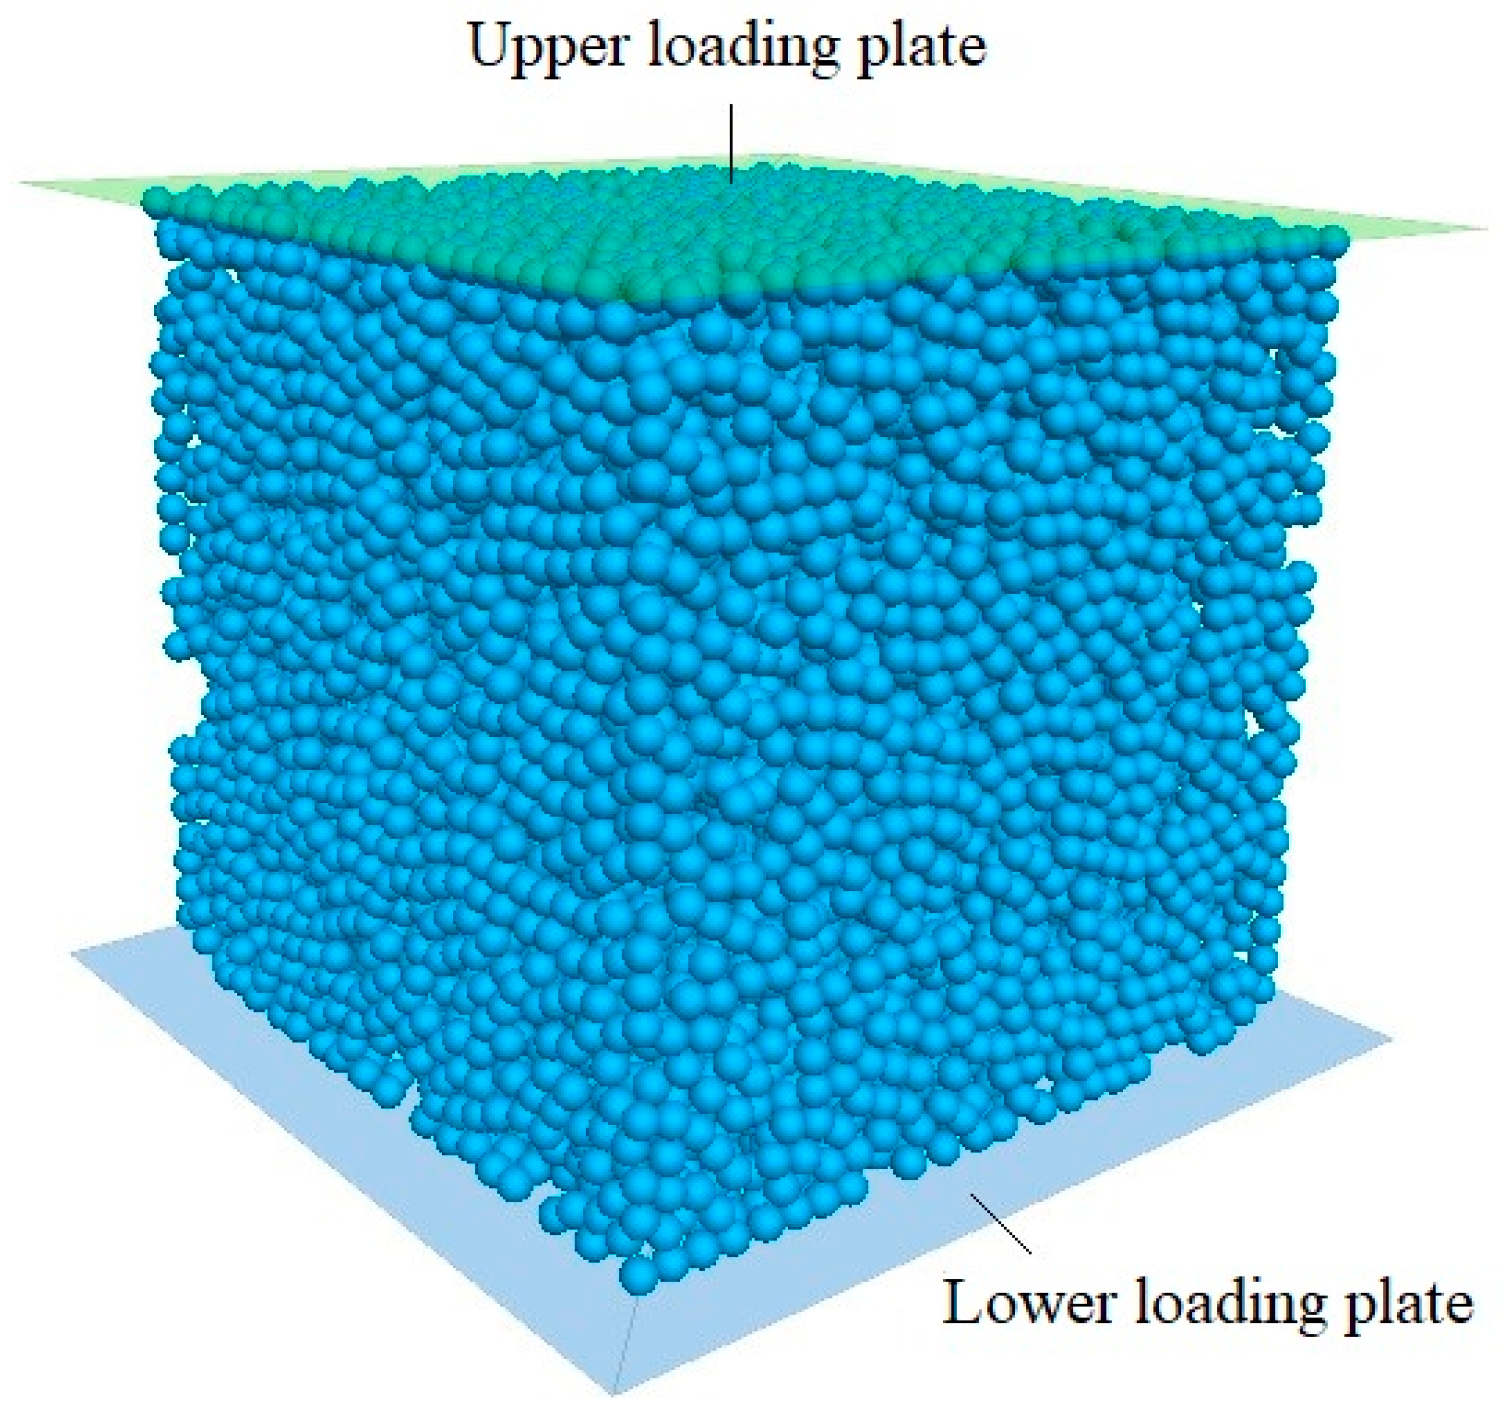
For the discrete element method (DEM), the numerical simulation results are largely restricted by the particle size. To simulate the test phenomenon accurately, it is necessary to eliminate the influence of particle size on foamed concrete. So, the distribution of the same pores (see Section 4.1) and mesoscopic parameters were used to generate the foamed concrete models with five kinds of particle sizes (the radii were 0.7 mm, 0.8 mm, 0.9 mm, 1.0 mm, and 1.1 mm, respectively), and the loading plates of the MTS test machine were simulated by using two upper and lower walls, as shown in Figure 16. The lower loading plate was fixed, and the upper loading plate was controlled by the displacement (1 mm/min). This section reveals the phenomenon that the mechanical properties of foam concrete were limited and restricted by the particle size of cement paste.
As we all know, the failure process of foam concrete includes the linear elastic stage, the nonlinear stage, and the softening stage [42,43]. Figure 17 shows the stress-strain curves of the foamed concrete models with five kinds of cement paste sizes under uniaxial compression, all of which contain the above three stages. In Figure 17, the particle size has a significant effect on the mechanical properties of the foamed concrete model. When the particle size decreases, the elastic modulus and compressive strength of the model increase gradually, and the toughness and ductility of the material decrease while the brittleness increases. In particular, when the particle size decreases from 1.0 mm to 0.9 mm, the numerical model changes significantly from plasticity to brittleness. Although the peak load will increase with the further decrease of particle size, the brittleness and residual strength of the material are similar. When the particle size was small enough (≤0.9 mm), the results obtained from the numerical model were similar. Therefore, a particle size of 0.9 mm was adopted for the modeling calculation.
5.2.2. The Calibration of Mesoscopic Parameters
The discrete element constitutive indicates that the DEM model is used to simulate the macroscopic mechanical behavior of foamed concrete on the particle scale by the linear parallel bond. Before the macromaterial parameters obtained from the experiment were used in the DEM model, these data were calibrated to obtain the micromaterial parameters applicable to the DEM model. In order to ensure the accuracy of mesoscopic parameters, the method of optimizing the parameters of the DEM model was adopted. This method required that the result of the DEM model, test data, and failure modes be fitted. In order to be consistent with the test conditions, a cylinder model (with a density of 500 kg/m3 and a size of Φ 50 × 100 mm) was used for the parameter calibration. The particle size of the cement paste was 0.9 mm, and the pore distribution was generated according to the normal distribution discussed in Section 4.1. The loading control was the same as above. The loading control was the same as above, and the upper loading plate was controlled by servo control, in which the loading rate was set to 1 mm/min according to the test conditions. Table 2 shows the mesoscopic parameters that were adopted by the parameter calibration of the parallel-bond model of foam concrete.
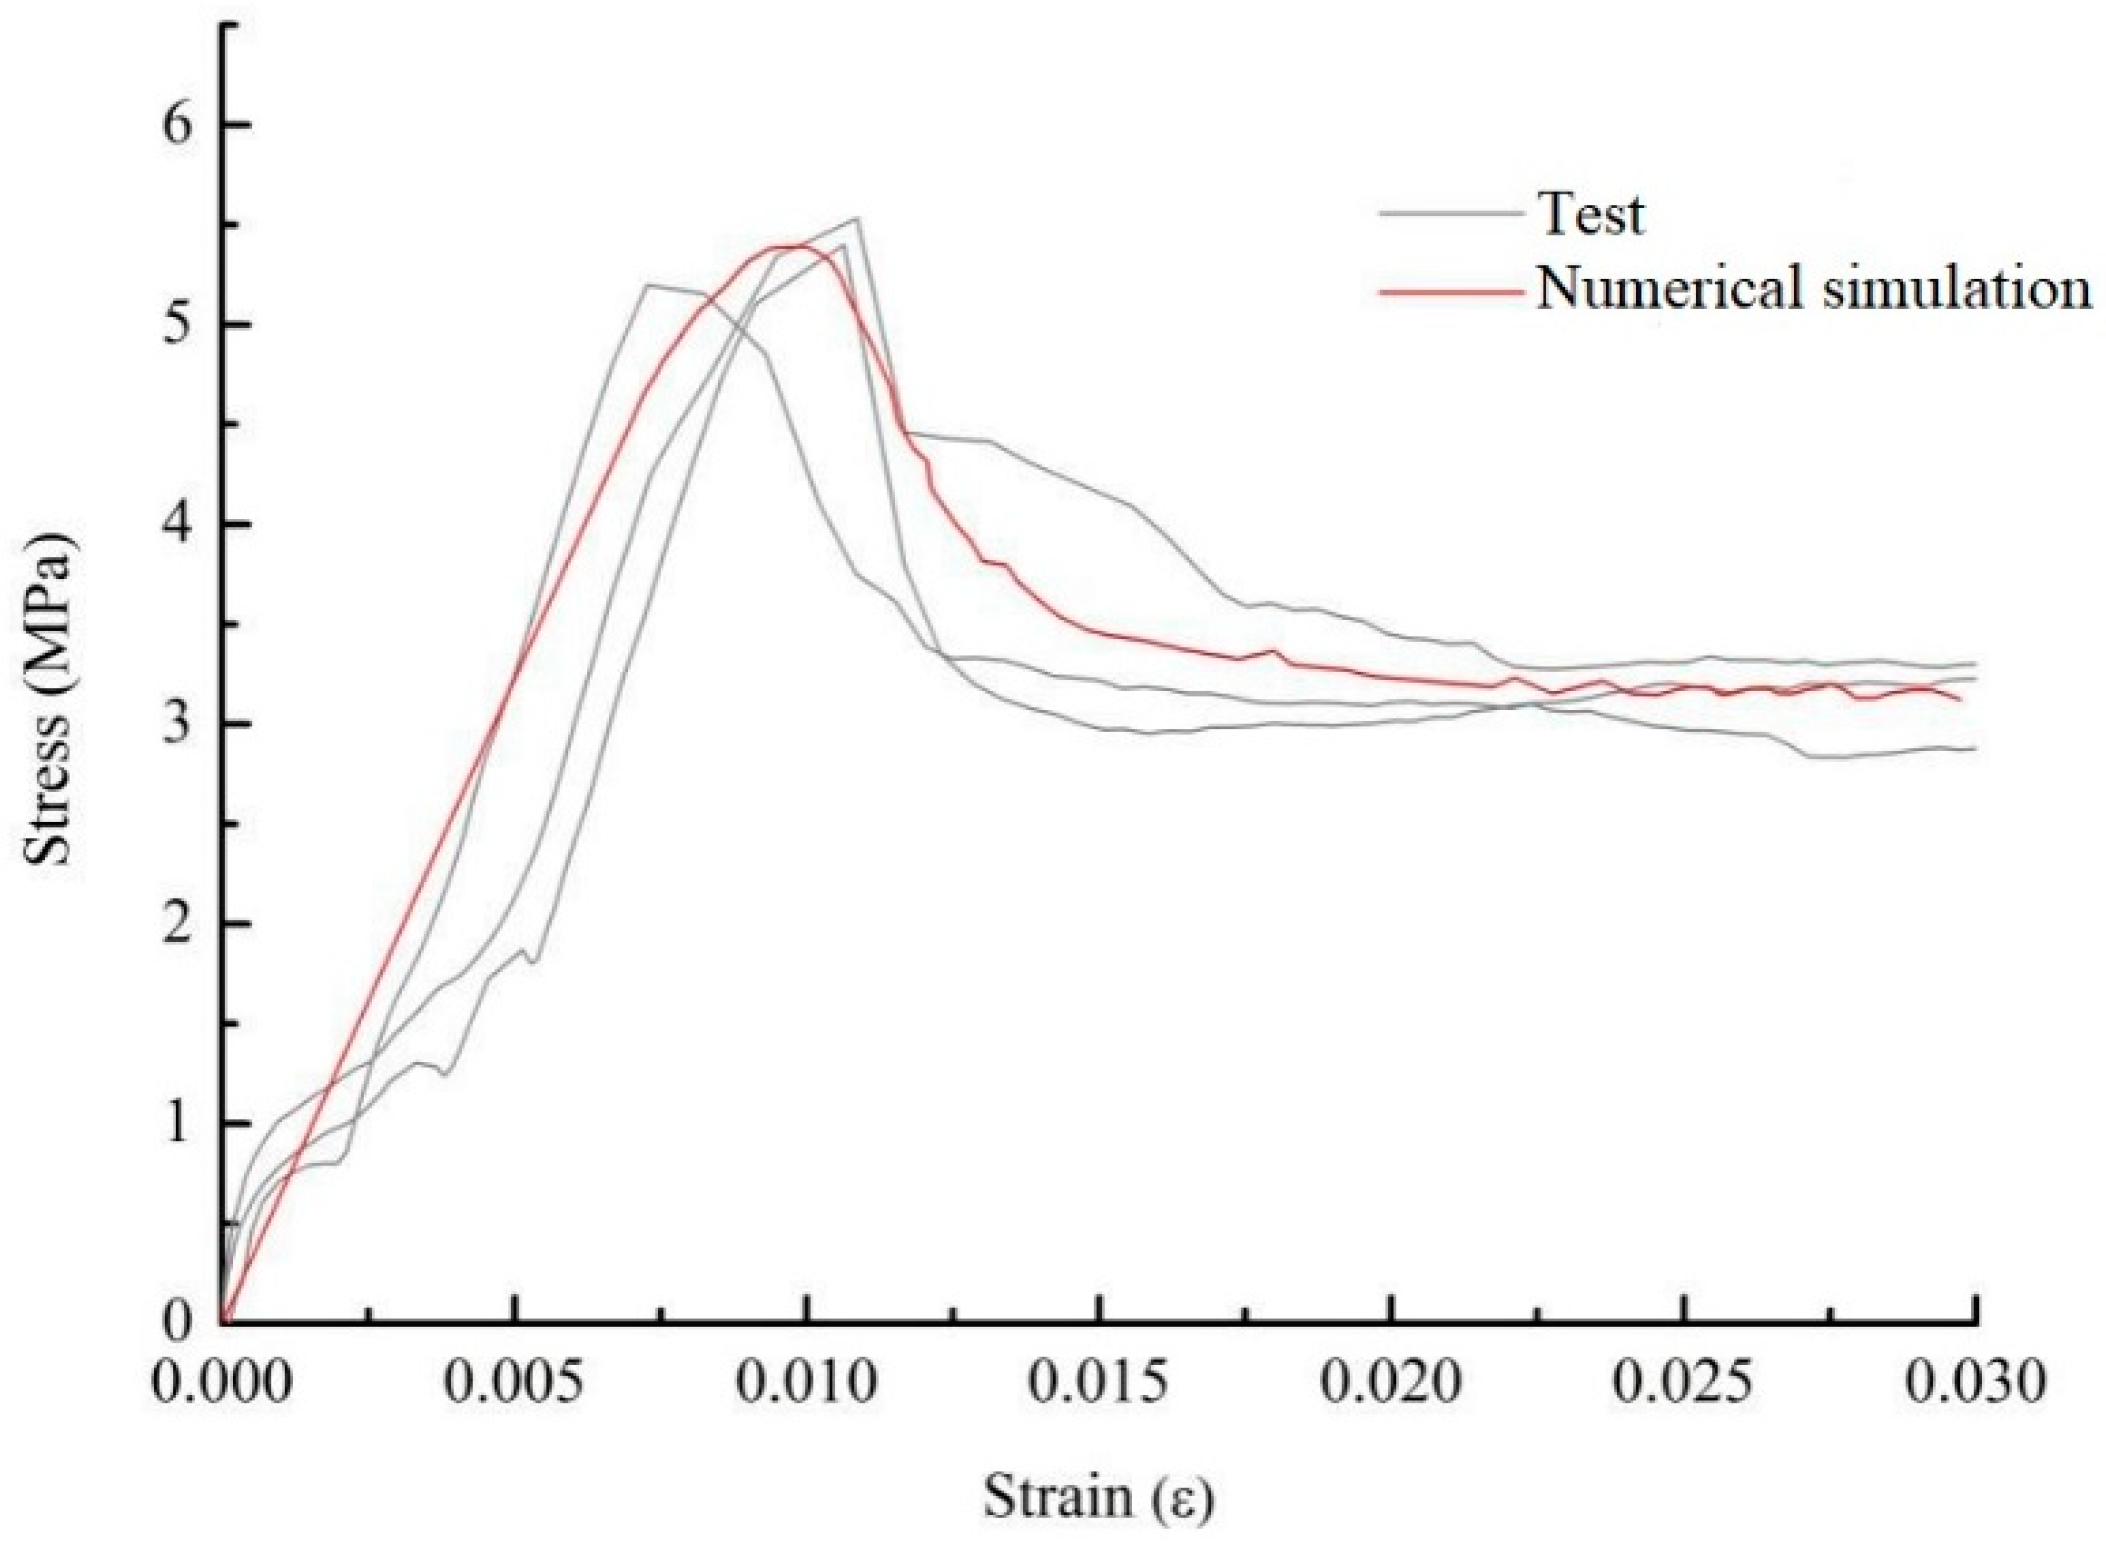
Figure 18 depicts a comparison of the stress-strain curves simulated by DEM and those obtained from testing. The difference in microstructure of samples, even foam concrete microstructure with the same density, had a significant difference, which may explain the difference between the experimental results and the simulation results. Through comparison, the stress-strain curve of the numerical simulation was consistent with that of the test. It indicates that the macroelastic modulus and compressive strength of foam concrete can be figured out accurately through DEM model simulation analysis. The three stages of the stress-strain curve were reproduced by numerical simulation. In the linear-elastic stage of the numerical simulation, the internal stress does not reach the tensile strength of the parallel bond or the limit of shear strength. Thus, there was no fracture bond, and no cracks formed inside the foamed concrete. As the simulation proceeds, the internal stress reaches the strength limit of the bond, the bond breaks, and the microcracks begin to form inside the foamed concrete. At this point, the simulation enters the nonlinear hardening stage. With the loading process, the stress reached the peak bearing stress, the number of microcracks increased rapidly, and macrocracks were formed through each other, resulting in the loss of bearing capacity of the foamed concrete, which shows nonlinear softening behavior. When the numerical simulation enters the third stage, the stress-strain curve fluctuates up and down. This is mainly due to the collapse of the pores caused by the fracture of the bond around the pores. At this time, the stress drops suddenly. When the pores are compacted, the bearing capacity increases again. With the collapse and compaction of pores, this process is repeated, and the fluctuation of the stress-strain curve occurs, which is consistent with that of the test. Therefore, the influence of cement paste properties and pore structure on the macro-performance of foam concrete can be studied by the DEM method. Nguyen et al. [43] reached a similar conclusion. In addition, the correctness of the calibration parameters of the DEM method in this paper has also been confirmed by the good consistency between simulation and experiment.
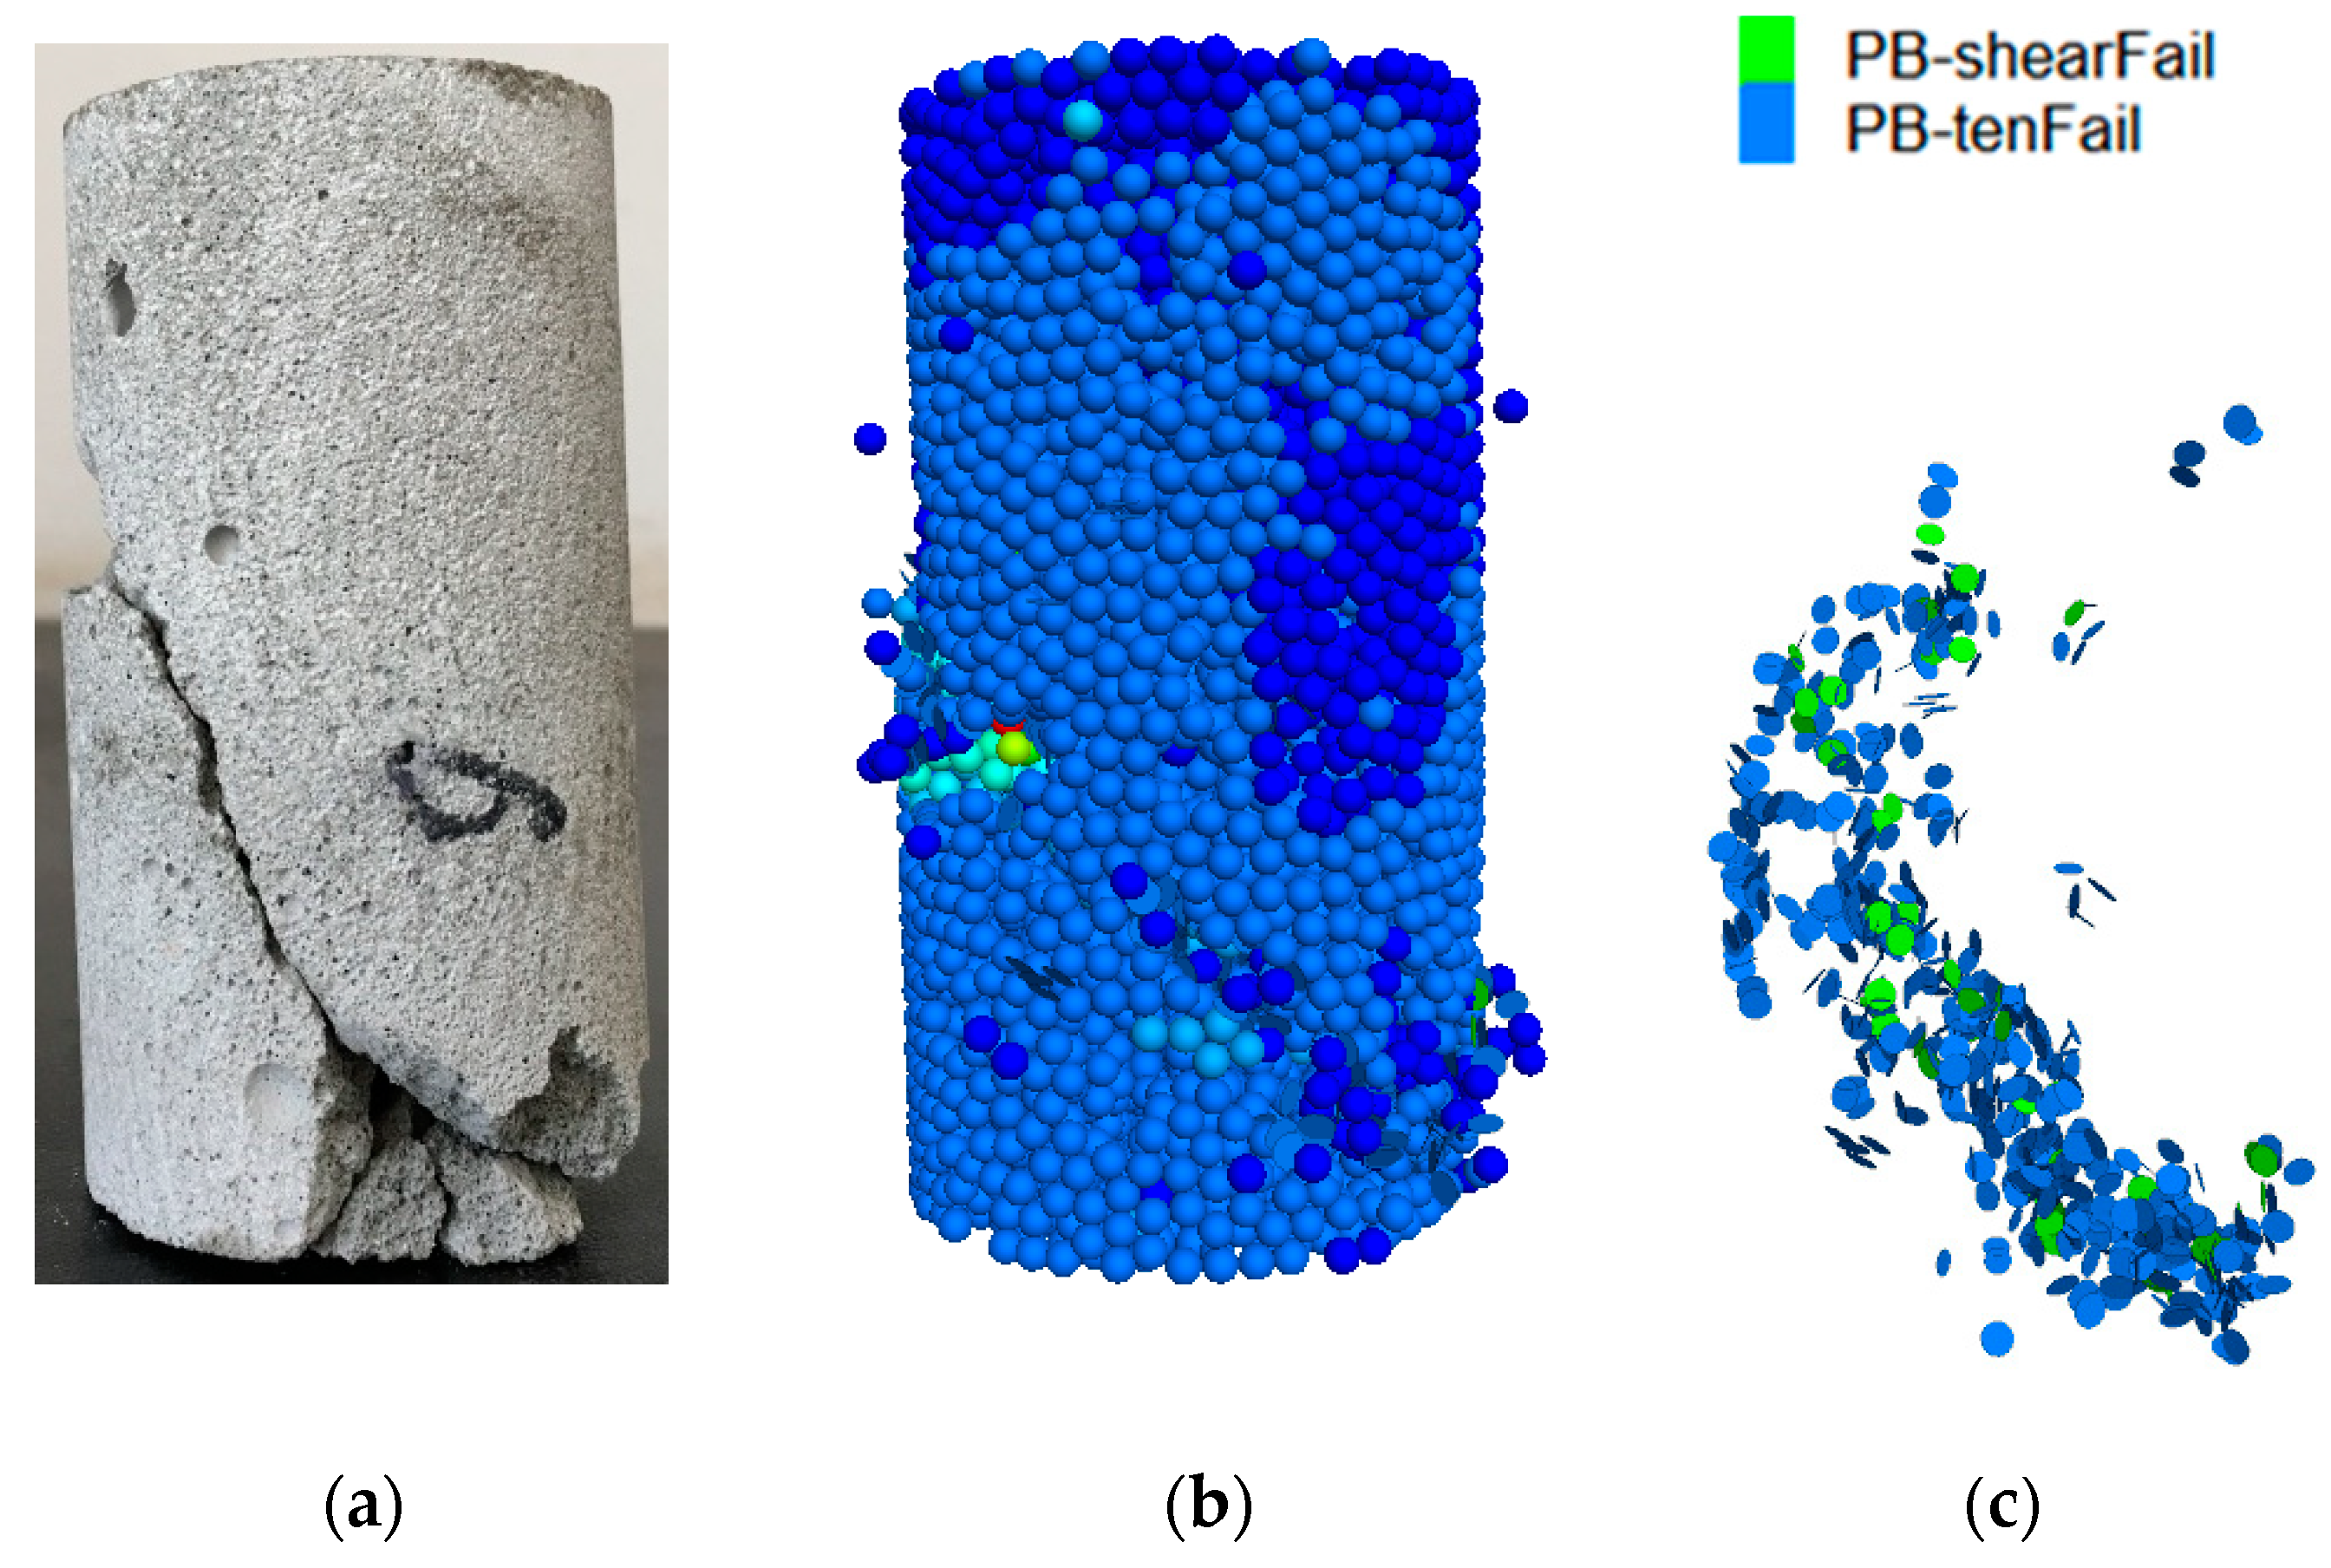
Figure 19 shows the damaged specimen after loading, the failure state of the specimen in the corresponding numerical model, and the inside crack development of that. The failure of foam concrete occurred in the lower left of the sample, and penetrating oblique cracks were formed in the test or numerical model, which is a typical failure mode of concrete materials. In Figure 19c, the circular pie shape represents the microcracks, and the generation mechanism is as follows: when the stress between particles is greater than the limit tensile stress or shear stress that the bond can withstand (that is, Equations (8) and (10) are satisfied), the program defaults that the bond breaks here and then marks the damage with the circular pie shape, and indicates whether it is a shear failure (shearFail) or tensile failure (tenFail). Therefore, it can be seen from the fracture mode that the tensile failure produces more cracks than the shear failure.
Based on the above analysis, the mesoscopic parameters (as shown in Table 2) obtained from the calibration procedure can be used to accurately simulate the macroscopic mechanical behavior of the foamed concrete.
5.2.3. Prediction of DEM in the Basic Mechanical Properties of Foamed Concrete
To study the influence of density and loading rate on the basic mechanical properties of foamed concrete from a mesoscopic perspective, the numerical model consistent with the test was generated using the cement paste particle size (r = 0.9 mm) and the mesoscopic parameters (as shown in Table 2) determined above.
- (1)
- Uniaxial compression characteristics
To keep consistent with the test, the DEM models with different densities (500 kg/m3, 600 kg/m3, and 750 kg/m3) were generated in this section. All the models were 100 × 100 × 100 mm, and the loading rates were 0.06 mm/min, 0.6 mm/min, and 6 mm/min, respectively. In Figure 20, the DEM model of uniaxial compression is shown.
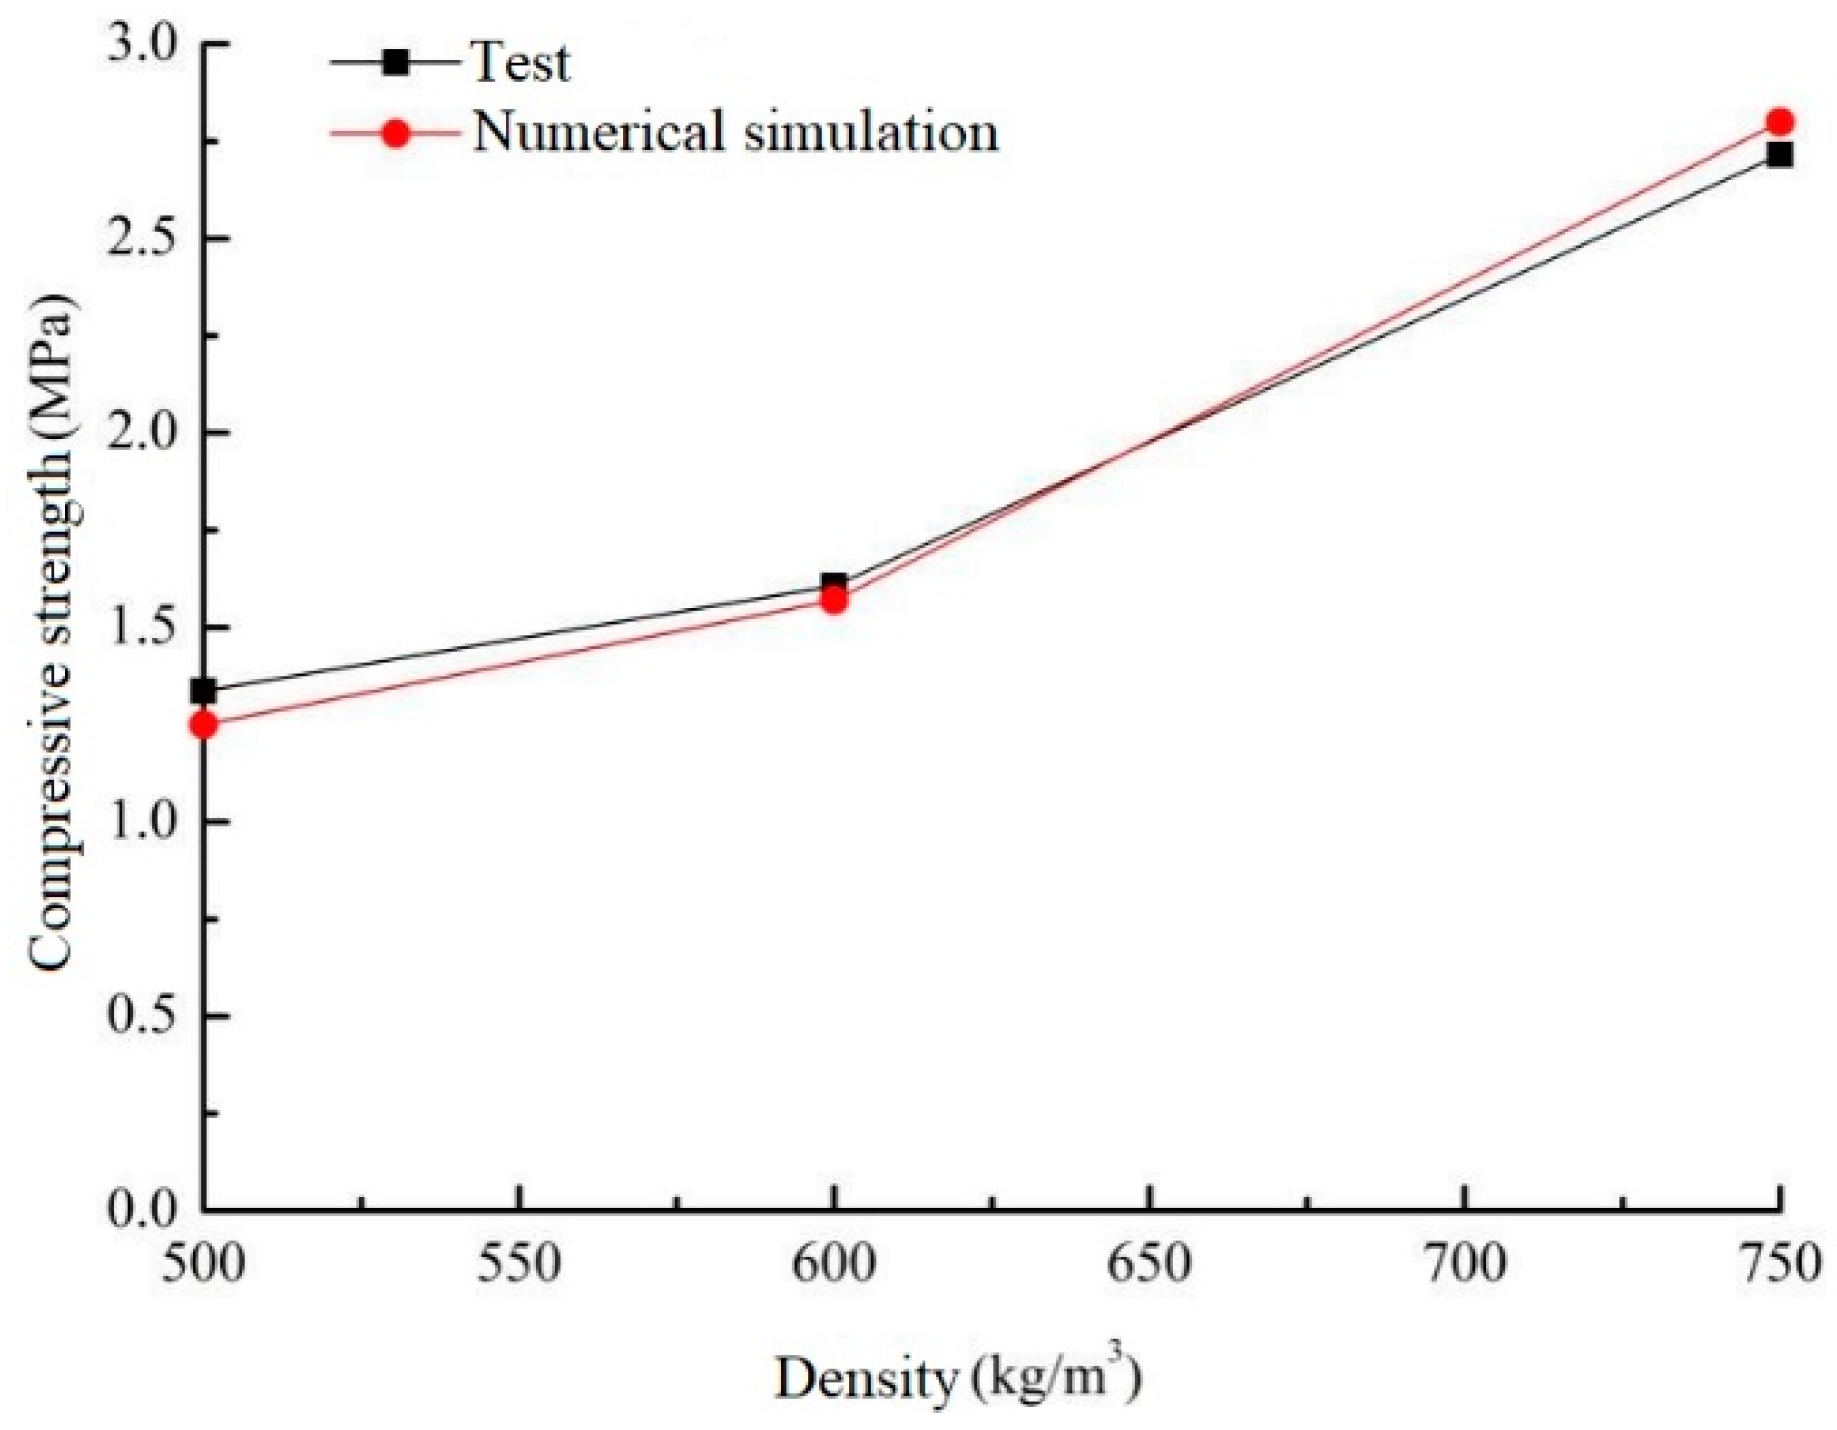
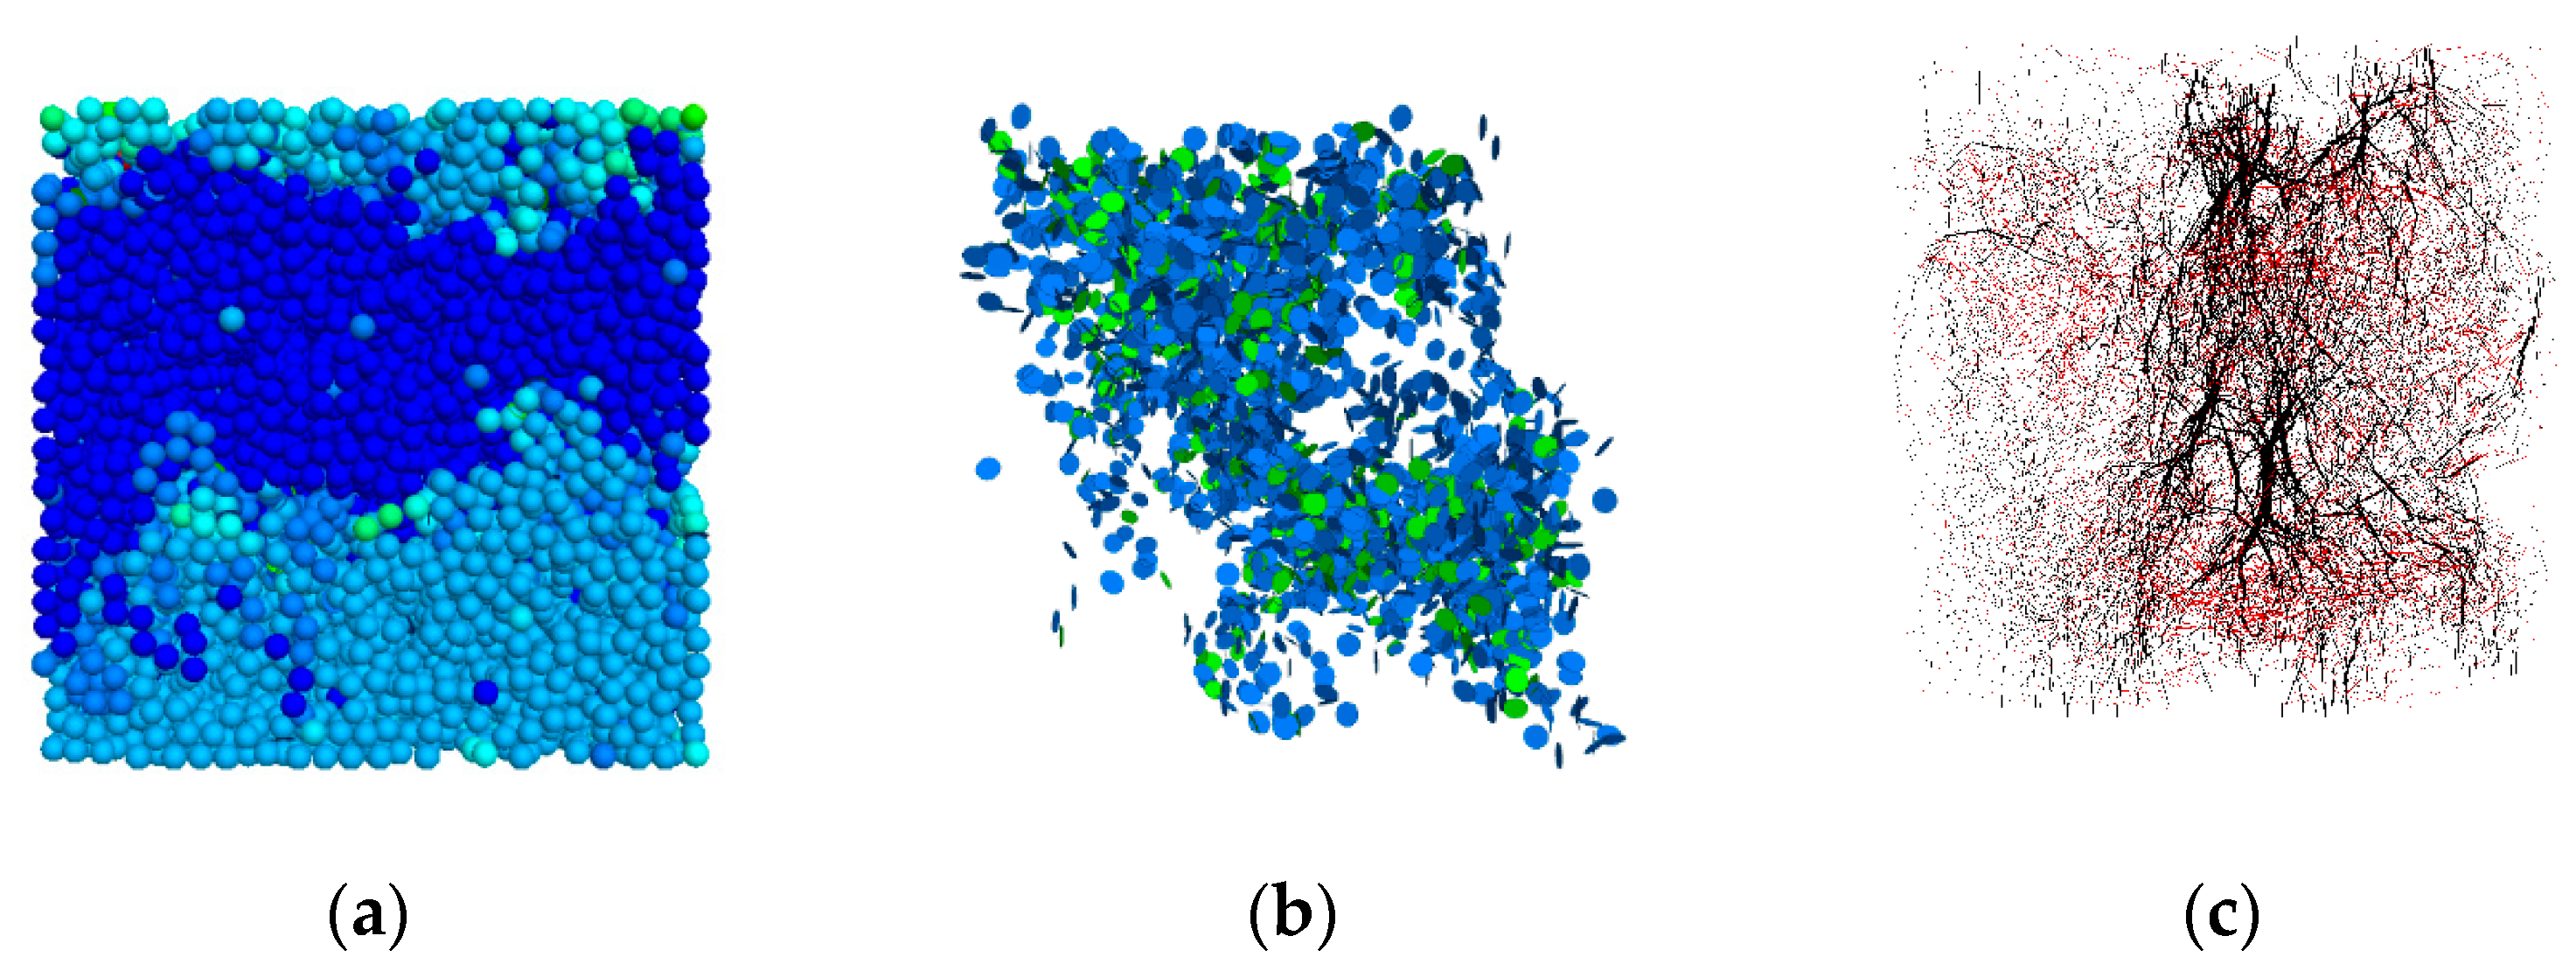
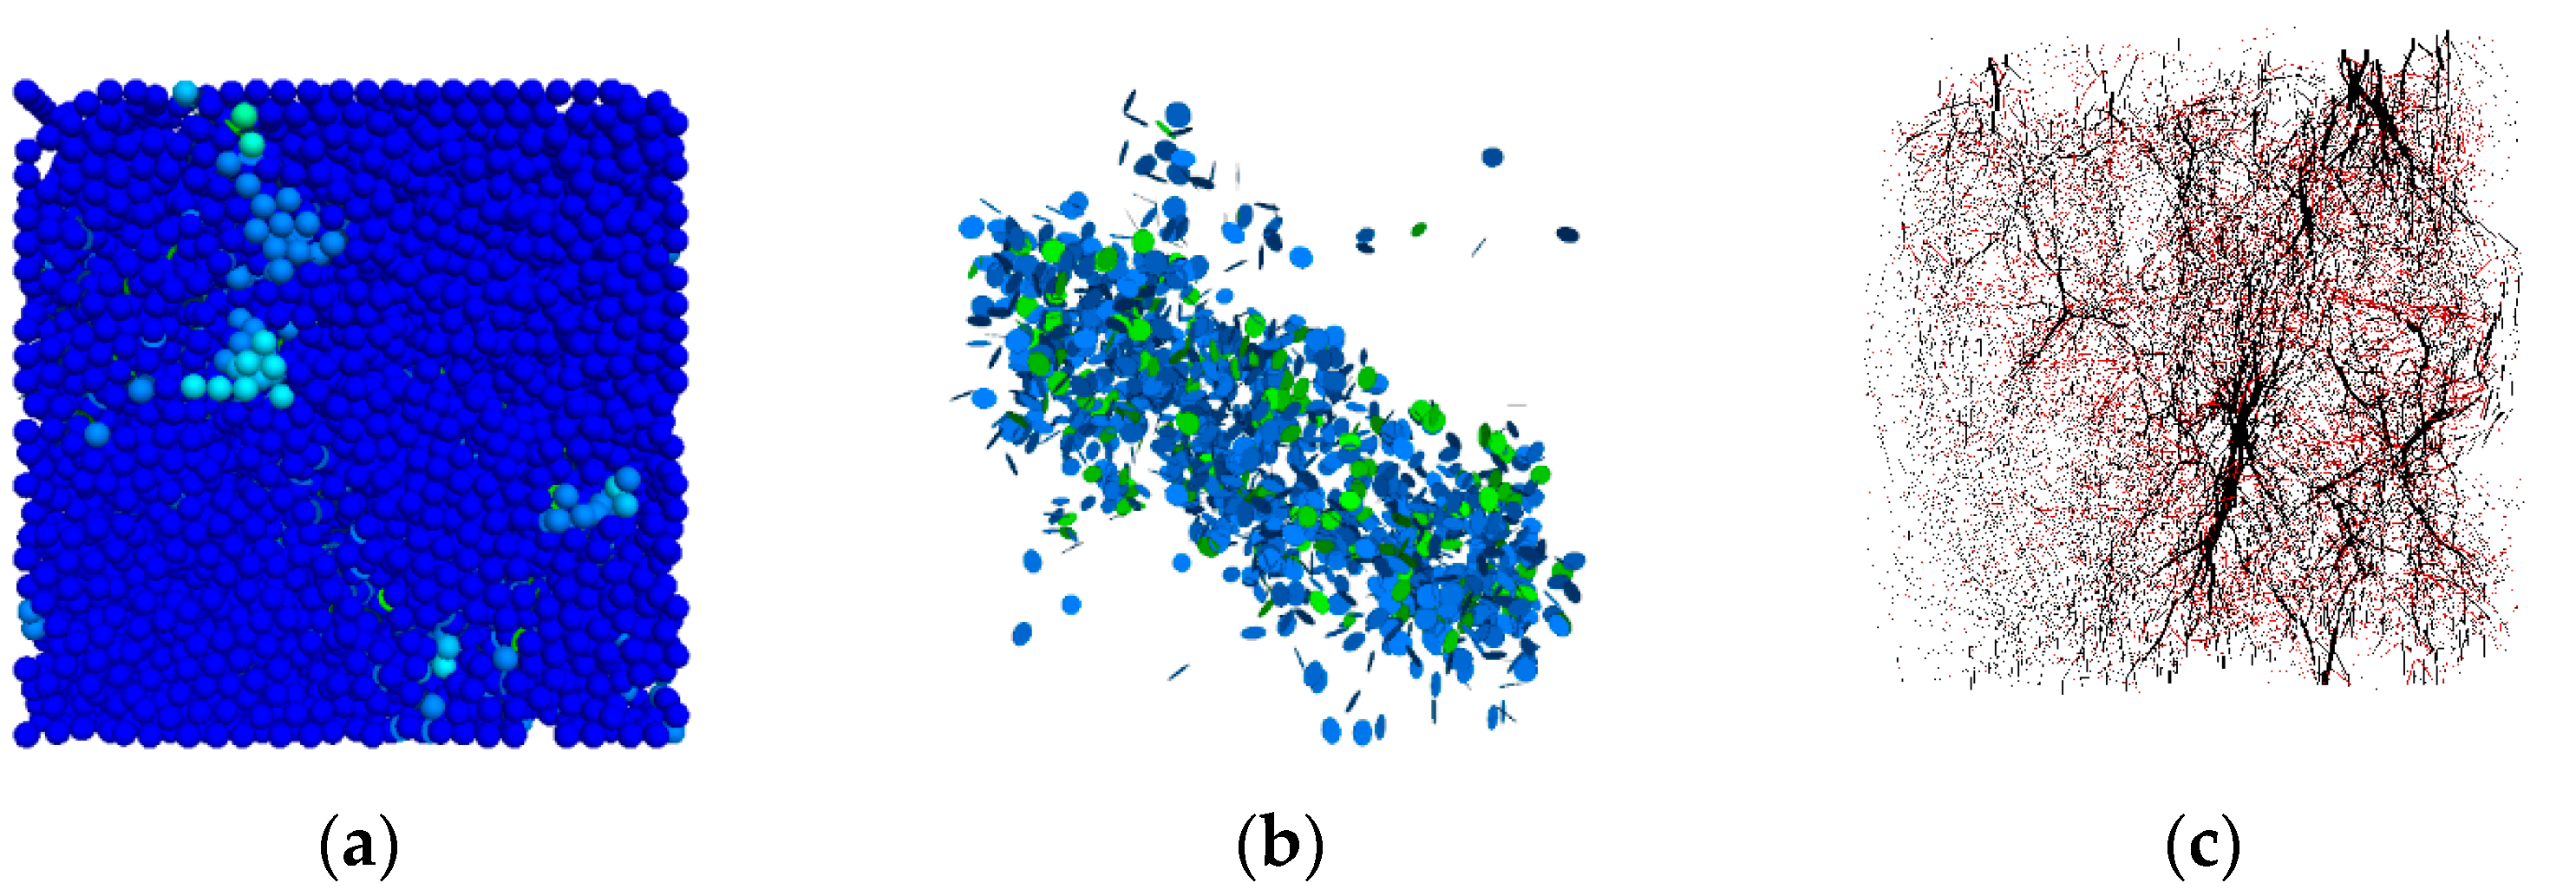
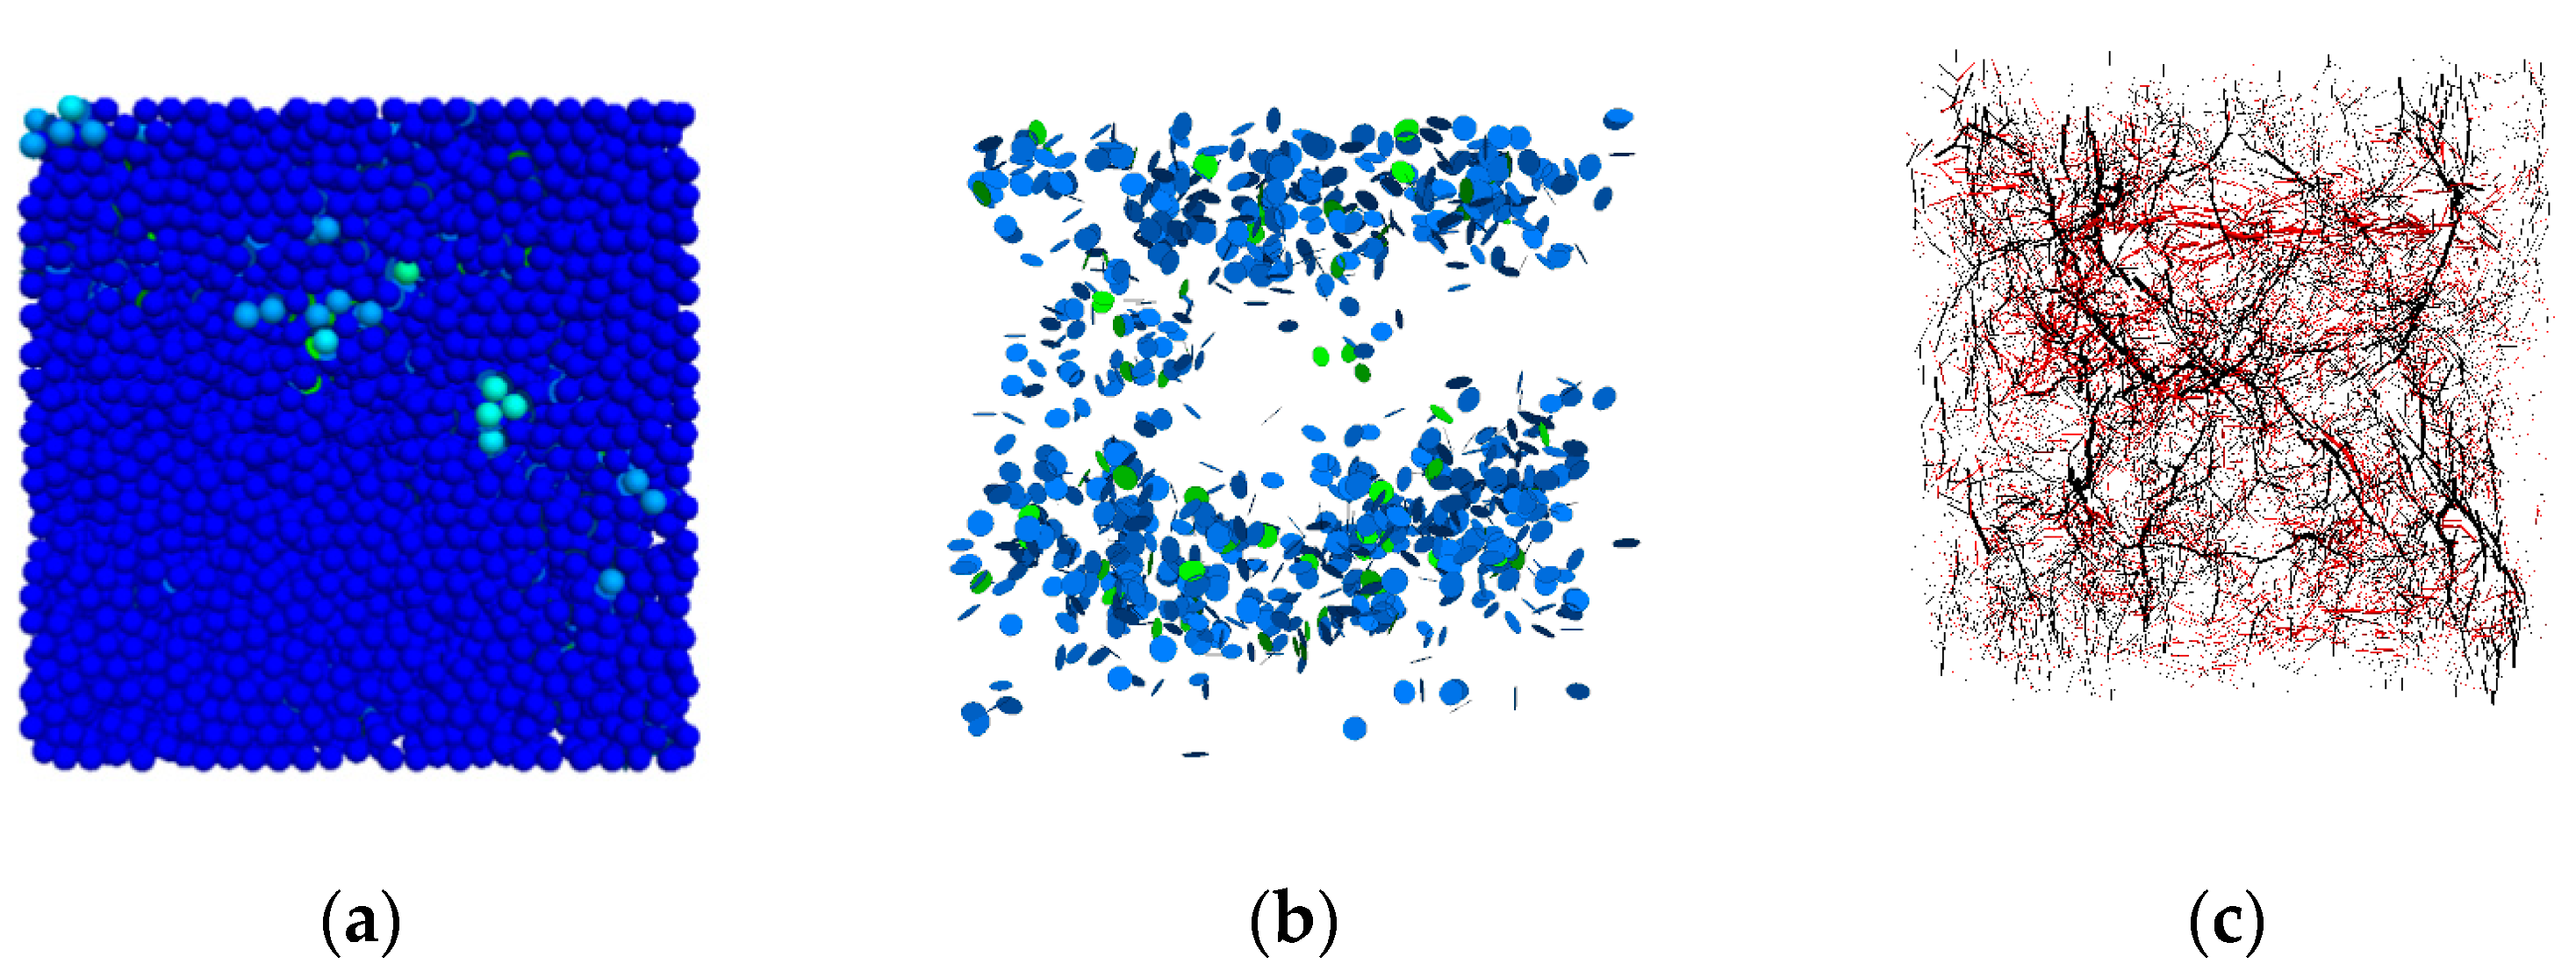
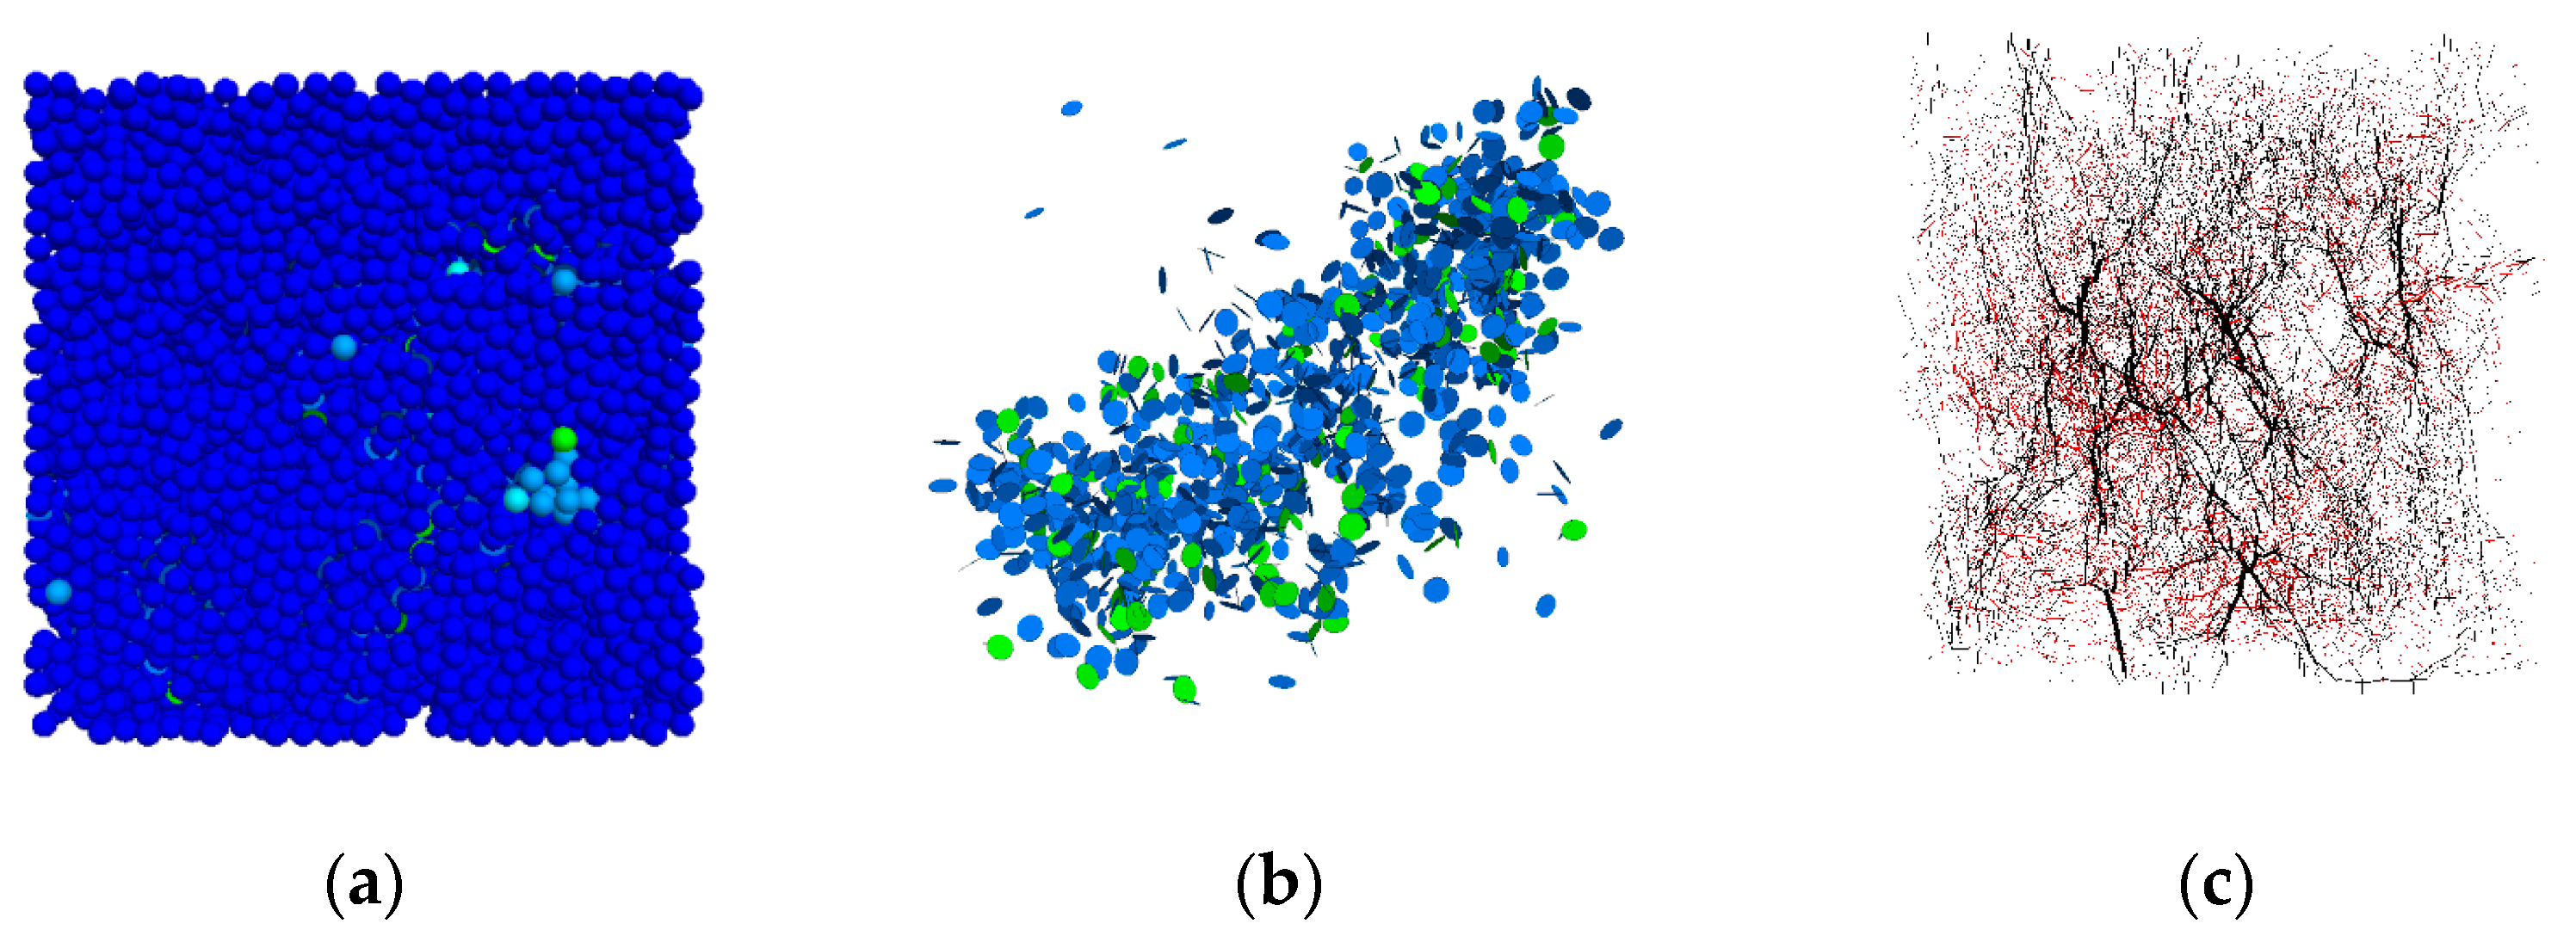
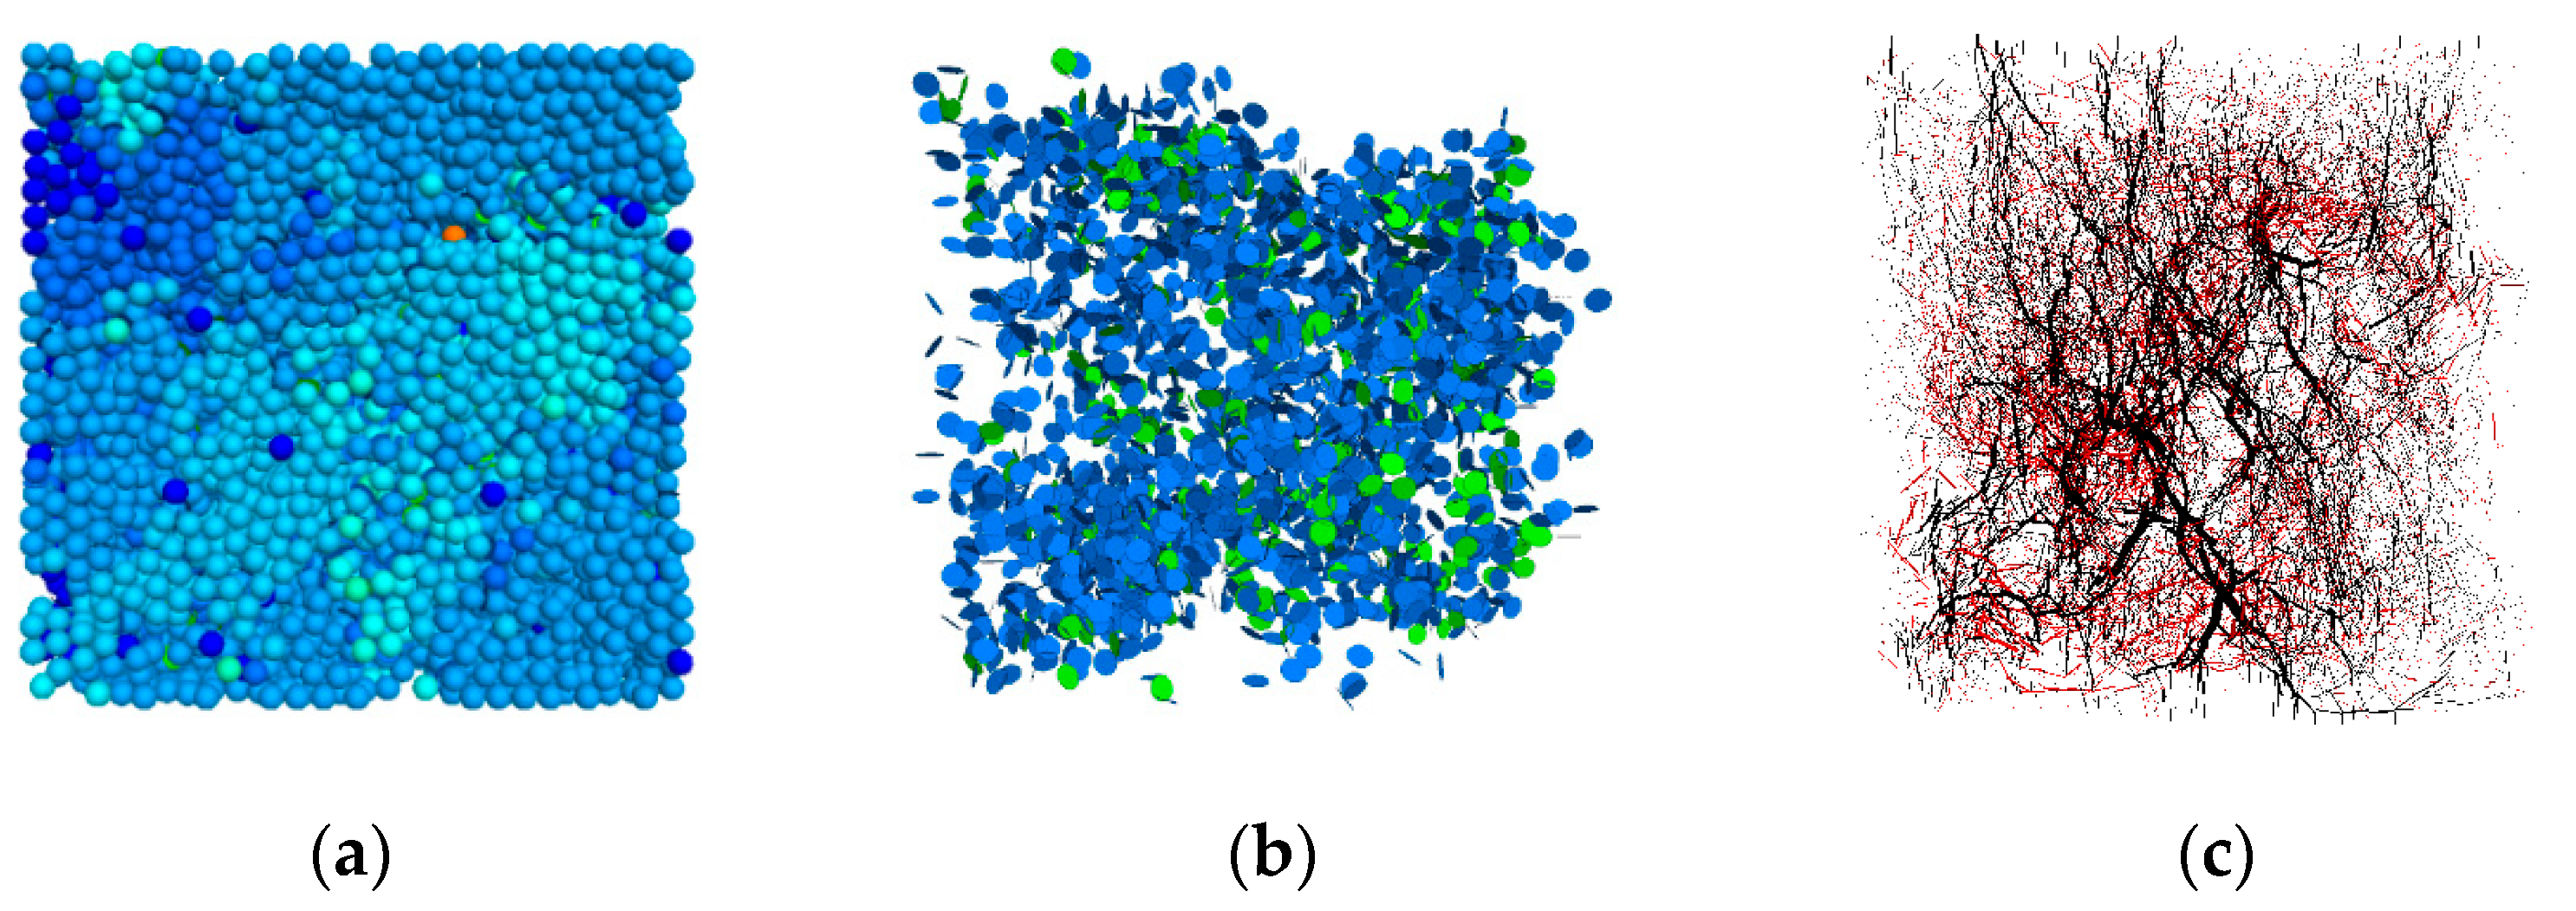
In this paper, the influence of density on the compressive strength of foam concrete was investigated by a uniaxial compression test and simulation analysis, where the loading rate (0.6 mm/min) was required to be constant. The comparative analysis between the test and numerical simulation is shown in Figure 21. Although the numerical simulation slightly deviated from the test results, the relationship between the density of foam concrete and its compressive strength was accurately simulated by the numerical model. This deviation was mainly due to the difference between the pore structure in the numerical model and that in the sample, which was within the acceptable error range. In addition, the development of internal cracks can be accurately monitored by numerical simulation, as shown in Figure 22, Figure 23 and Figure 24. When the density is 750 kg/m3, the cracks inside the foamed concrete are relatively dispersed and smaller. However, when the density is 600 kg/m3, the internal cracks are relatively concentrated and more numerous, and the concentration degree and the number of internal cracks increased when the density was 500 kg/m3. This was mainly due to the fact that the interior of low-density foam concrete has more pores than that of high-density foam concrete, making it easy to form stress concentration (Figure 22c) and generate concentrated cracks, as shown in Figure 22. However, when the density is high, the content of the cement matrix is relatively large, and the loading stress is dispersed on the cement matrix, which is not easy to form a stress concentration and tends to generate dispersed cracks, as shown in Figure 24.
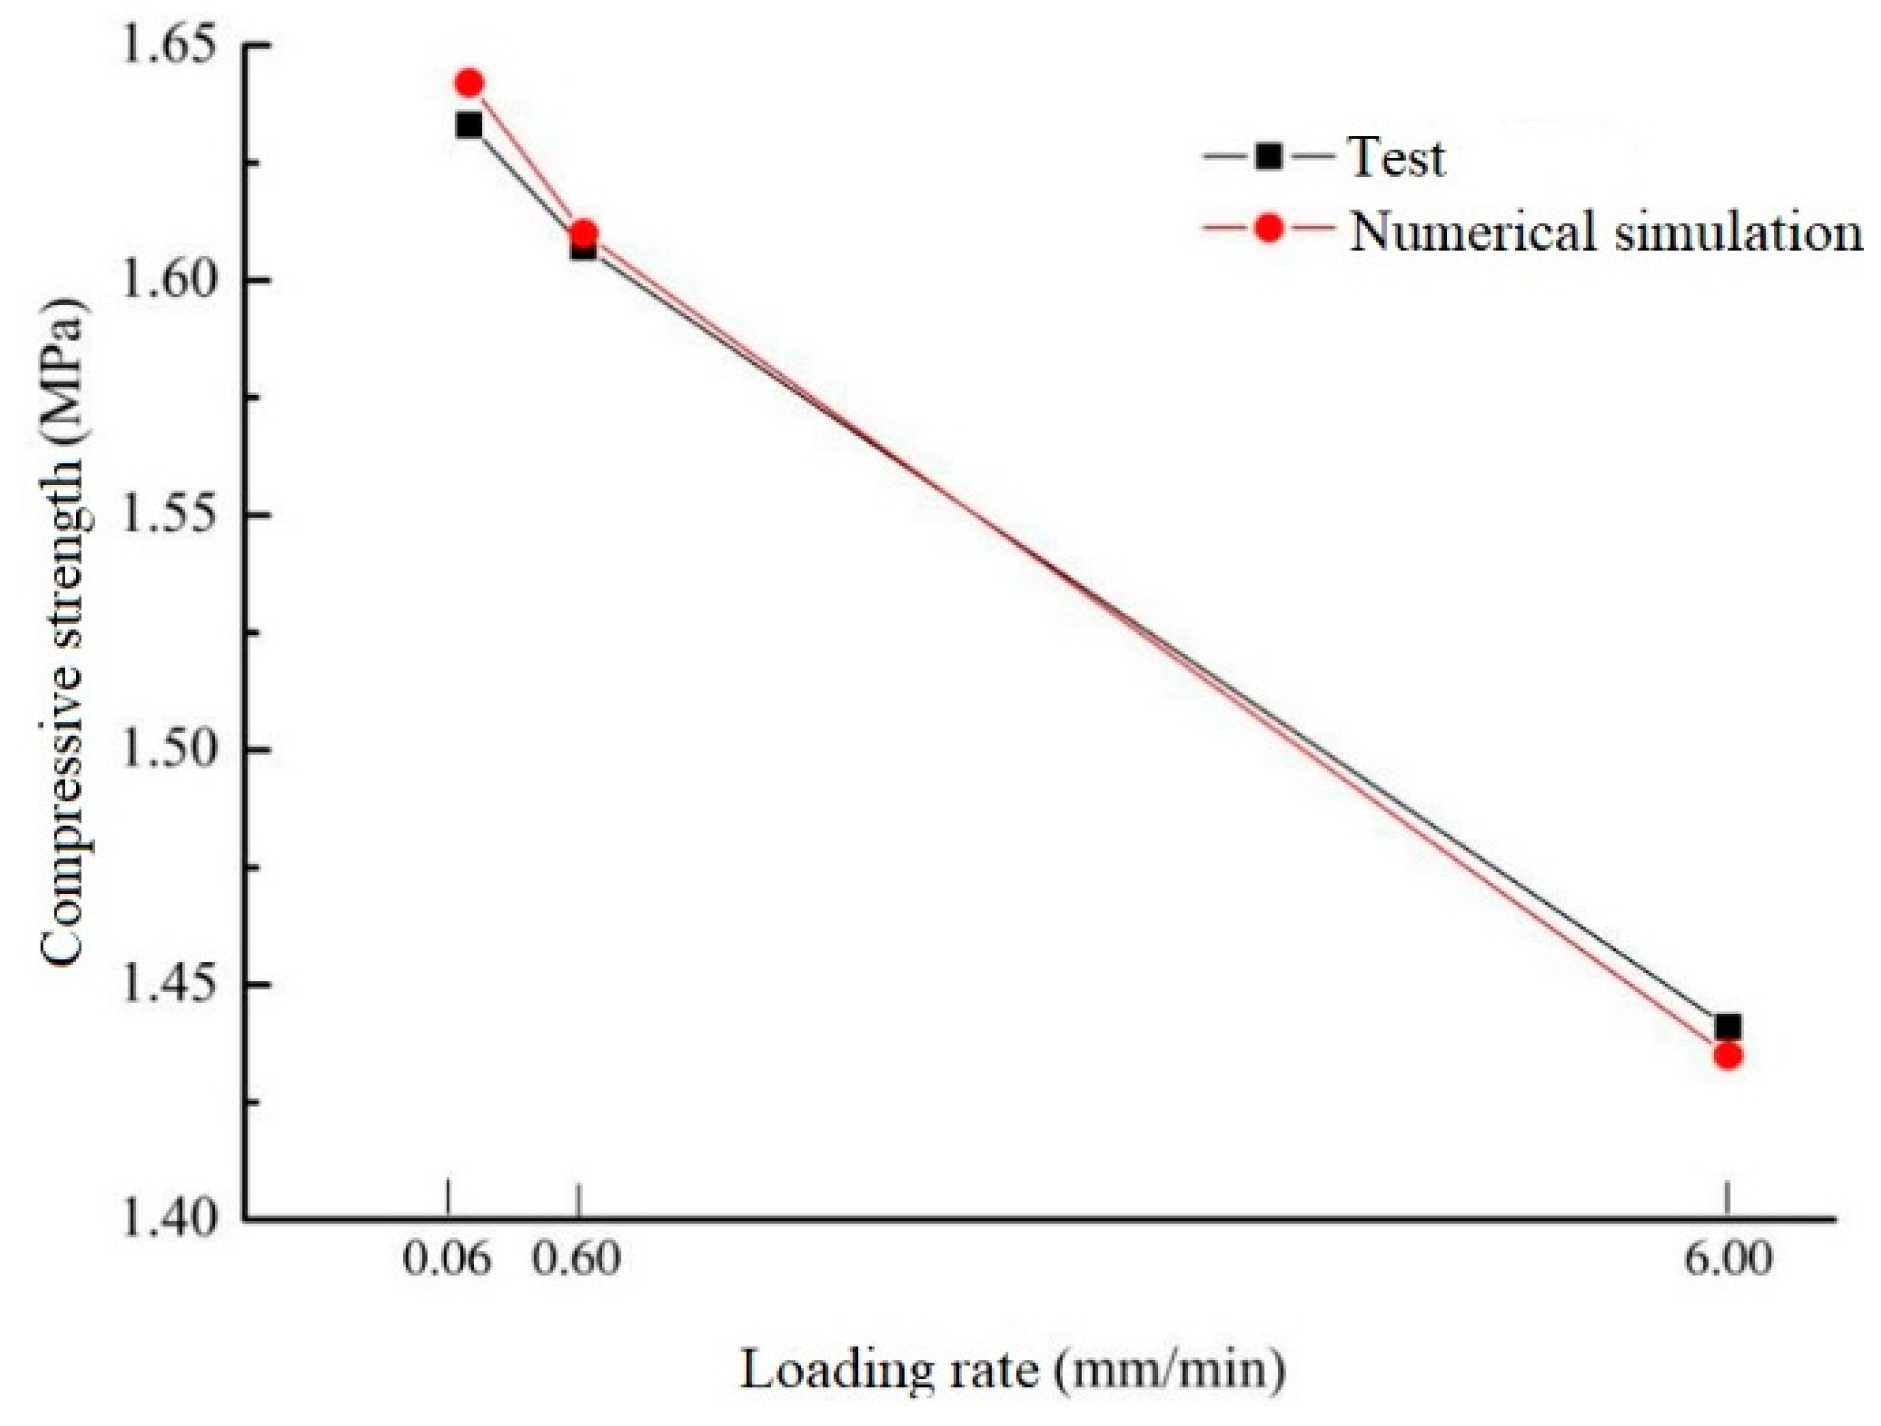
To reveal the reasons for the influence of the loading rate on the failure mode of foam concrete, three loading rates were set for the numerical calculation and kept the density (600 kg/m3) of foam concrete unchanged. In Figure 25, the consistency between experimental measurements and simulation is shown; their error is less than 1%, within the acceptable range. The main source of error in numerical simulation and practice was an incompletely consistent pore structure. The crack development inside the model is shown in Figure 26, Figure 27 and Figure 28. In Figure 26b, Figure 27b, and Figure 28b, the internal cracks of foam concrete gradually increased with the increase in the loading rate, which was consistent with Figure 12. The compressive strength of foam concrete at the two loading rates (0.06 mm/min and 0.6 mm/min) is similar because the loading rate is small. In the case of a low loading rate, the increase in the loading rate will not lead to the obvious development of cracks in foam concrete. However, when the loading rate is high (6 mm/min), the number of internal cracks in foam concrete increases sharply, and the compressive strength of foam concrete decreases compared with the low loading rate. Meanwhile, it can be intuitively seen from Figure 26c, Figure 27c, and Figure 28c that when the loading rate increases, the degree of stress concentration gradually increases. The severe concentration of stresses reduces the compressive strength of foam concrete, making the specimen more likely to fail.
- (2)
- Three-point flexural characteristics
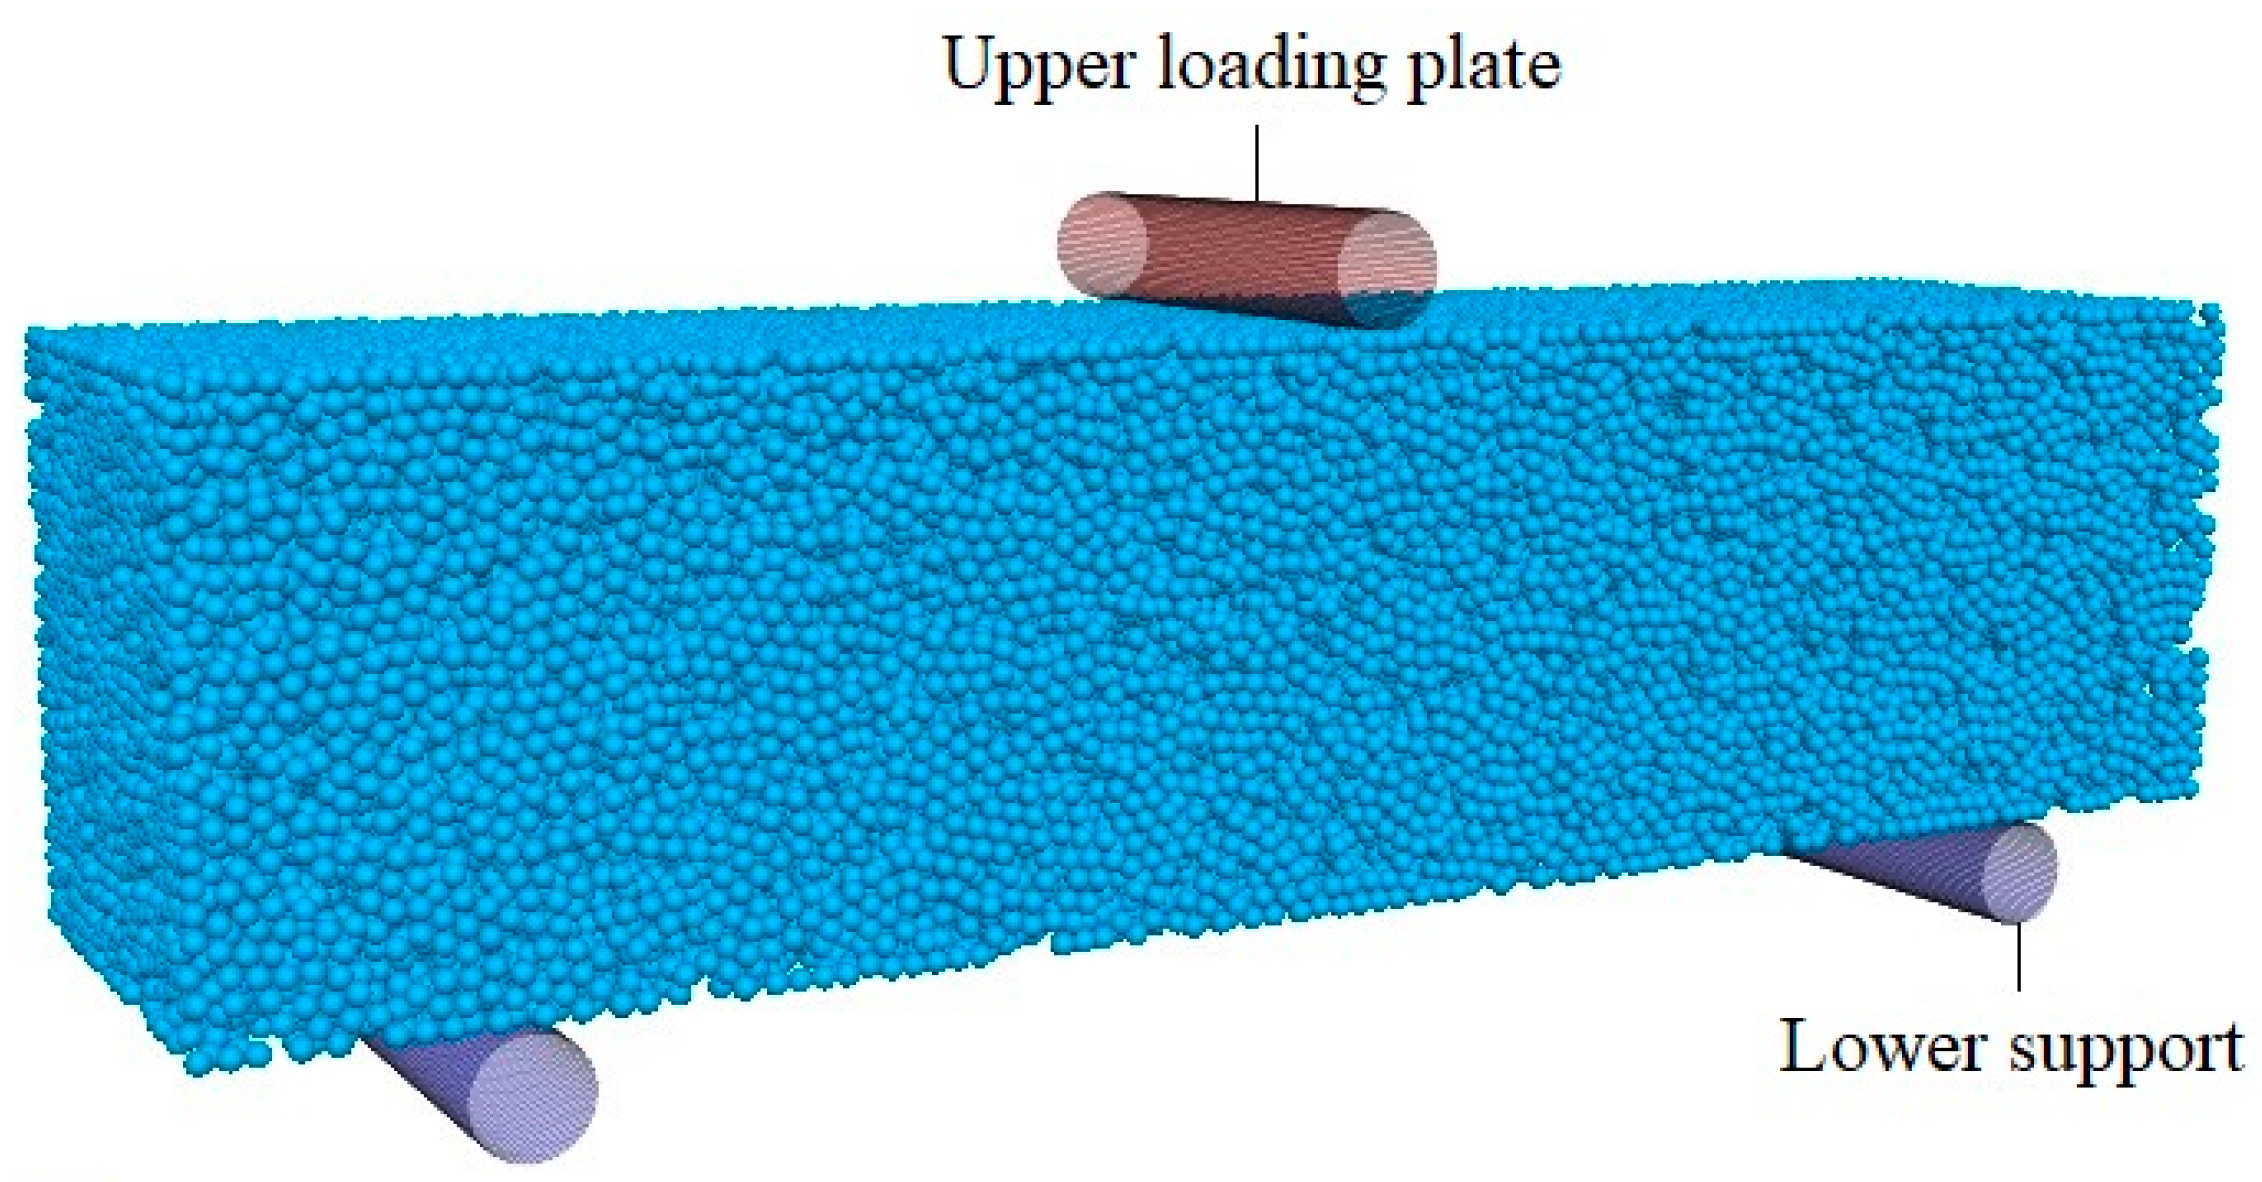
The models with three densities (500 kg/m3, 600 kg/m3, and 750 kg/m3) generated in this section had the same dimensions of 400 × 100 × 100 mm. The FISH program was used to control the upper loading bar by displacement, and the loading rates were consistent with the previous section. The lower part was supported by two supports, as shown in Figure 29.
In this section, the failure process of foamed concrete with different densities under different loading rates was figured out by DEM, and the development of internal cracks was recorded. Figure 30 compares the results of a practical experiment and a numerical simulation. The flexural strength of the numerical simulation is slightly higher than that of the test. This may be because it is impossible to ensure uniform mixing between the foam and cement paste during the on-site production of foamed concrete. Therefore, the pores in the foam concrete specimen may be unevenly distributed. The porosity of some parts of foamed concrete is higher than the predetermined value, which reduces the bearing capacity. For the numerical model, the porosity is uniformly distributed in strict accordance with the normal distribution and will not be affected by the test factors, so the bearing capacity is higher than the test. However, the predicted error of the numerical simulation is within the acceptable range of 5%. As for the influence of foam concrete density and loading rate on flexural strength, the simulation results are consistent with the test results.
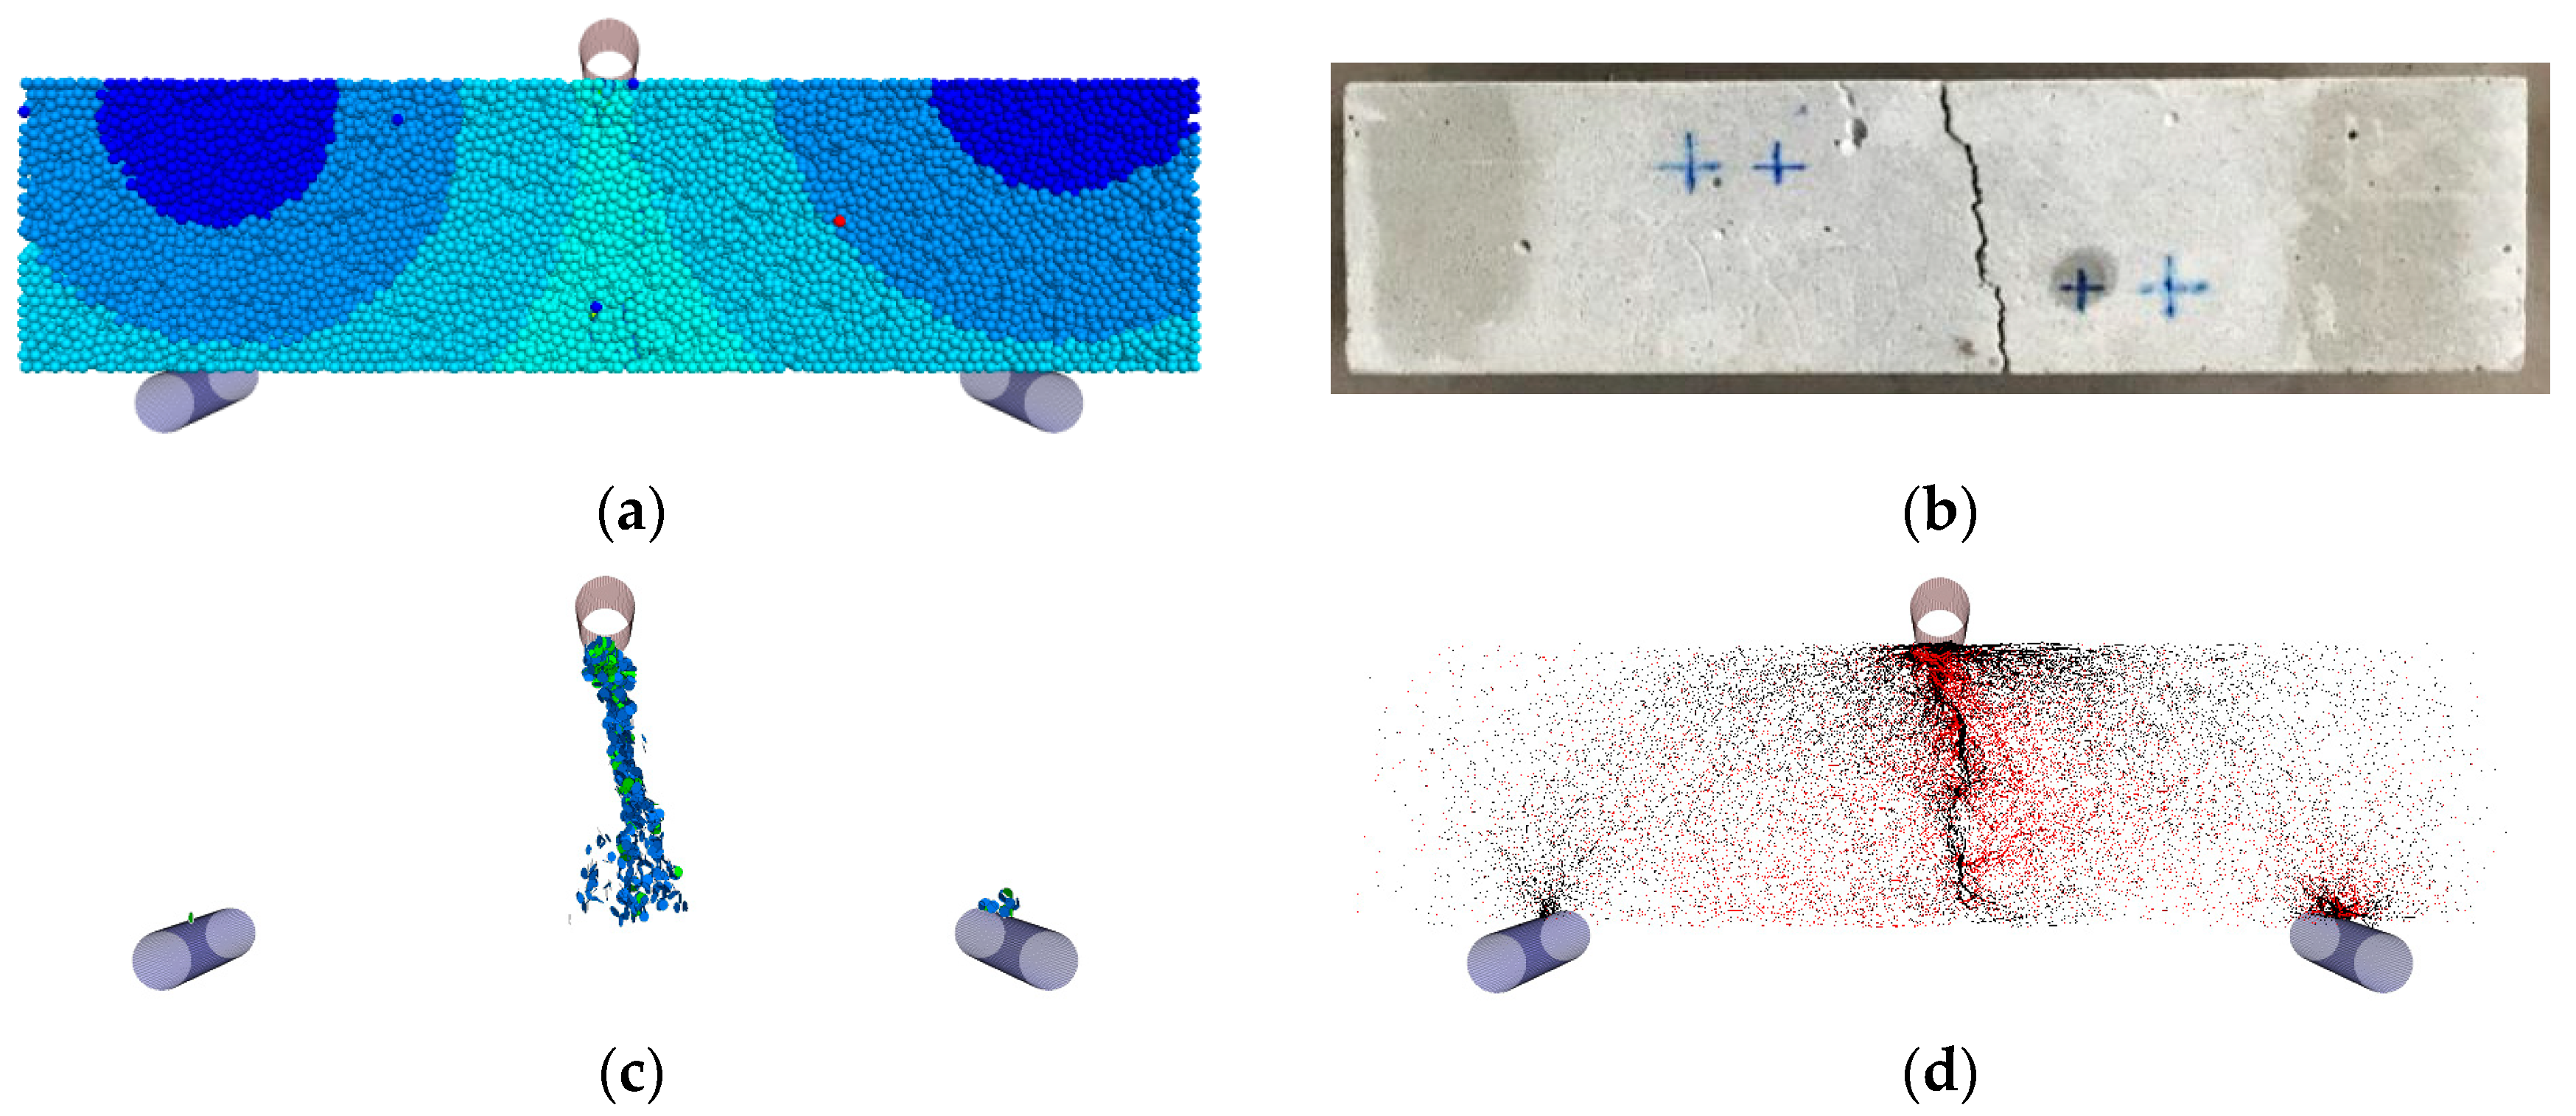
From Figure 31, it can be shown that the failure mode of the numerical model and specimen of foam concrete is crack development and force-chain distribution. It can be seen from the macroscopic cracks that the calculated results of the numerical model are consistent with the failure modes obtained from the tests. In Figure 31c, the blue circular pie shape is marked as the cracks generated by tensile failure (tenFail), and the green is marked as a shear failure (shearFail), which has the same meaning as Figure 19c. It can be known from the whole development process of internal cracks that when the foamed concrete beam is damaged, the stress near the upper loading part and the lower supports is higher, and the microcracks are first generated in these positions. Subsequently, the cracks begin to appear in the bottom middle of the beam and then gradually extend upwards with the loading until they are connected with the upper cracks, and the foamed concrete completely fails, as shown in Figure 31c. The number of cracks generated by tensile failure is greater than that generated by shear failure. This is mainly because foamed concrete is a porous material with lower strength and more pores, which makes internal stress more concentrated near the pores (as shown in Figure 31d) and results in tensile failure.
The above numerical simulations provide strong evidence that the influence of the internal pore structure of foam concrete on its macromechanical properties can be accurately presented by DEM. Accurate test results are obtained, which requires correct material constitutive relations to be provided. The investigation shows that DEM can be used as a useful way to predict the strength of foam concrete with arbitrary density for practical engineering design, but an important prerequisite that must be observed is to calibrate the model. It not only improves research efficiency and reduces test costs, but it also overcomes the drawback of conventional laboratory tests, which cannot obtain the influence of the internal structure. DEM shows its potential in structural analysis and design.
6. Recommendations
In this study, the mechanical properties of foam concrete are shown by the combination of experiment and numerical simulation. The mechanical response of foam concrete with different densities is revealed at the micro/meso-scale using X-ray computed tomography technology. Future research will be devoted to proposing accurate equations about compressive strength, flexure strength, and porosity and realizing quantitative analysis of the mechanical properties of foam concrete. In addition, the theoretical basis will be provided to design foam concrete with desirable properties. In parallel with this, the workability and durability of foam concrete are of great significance to practical projects. Further research will also include the following two parts in this field: The calibrated and validated DEM model will be used to systematically study the effects of pore and microstructure parameters on the performance of foam concrete. Additionally, the mechanism of pore characteristics and paste properties on the workability and durability of foam concrete will be clarified. Moreover, the huge potential of the DEM model in the analysis of foam concrete performance has been recognized, but the modeling parameters still need to be further calibrated by abundant and detailed experiments.
7. Conclusions
In this study, experiments and DEM were used to reveal the relationship between pore structure, cement slurry characteristics, and mechanical properties. The effects of density and loading rate on the mechanical properties are studied through the test and numerical simulation, and the following conclusions are drawn:
- The bearing capacity of foamed concrete increases significantly as its density increases. When the density of foam concrete is 750 kg/m3, the pores inside the foamed concrete are less dispersed, so the stress is dispersed on the cement matrix, and the stress concentration is not easy to form. However, 500 kg/m3 is reached by the density of foamed concrete, and the loading rate has a strong positive correlation with compressive strength. However, the positive correlation gradually weakened with the increase in density.
- For the three-point flexural test, the ability of the cement matrix around the pores to resist tensile failure is weak, and the failure of foamed concrete is mainly caused by tensile failure. The density of foam concrete increases from 500 kg/m3 to 600 kg/m3, the flexural strength increases by 12%, the density increases from 600 kg/m3 to 750 kg/m3, and the flexural strength increases by 54%. The density is low, and the pores inside the foamed concrete are more concentrated. The loading rate has a significant effect on the flexural strength of foam concrete with low density. When the loading rate increases from 0.006 mm/min to 3 mm/min, the flexural strength of foamed concrete with a density of 500 kg/m3 increases by 65%, while that of foamed concrete with a density of 750 kg/m3 increases slightly.
- The crack development inside the foamed concrete is more accurately monitored by DEM. When the density is relatively high, the cracks inside the foamed concrete are relatively dispersed, and the quantity is less. However, when the density is low, the crack development inside the foamed concrete is relatively concentrated, the quantity is higher, which makes it easier to form stress concentration, and the compressive strength is lower. At the same time, with the increase in loading rate, the phenomenon of stress concentration becomes more serious, more cracks are generated, and the specimen is more likely to fail.
- It can be known from the whole development process of internal cracks that the microcracks are first generated near the upper loading part and the lower supports. Subsequently, the cracks generated by tensile failure begin to appear in the bottom middle of the beam and then gradually extend upwards with the loading until they are connected with the upper cracks, and the foamed concrete completely fails. As a kind of porous material with lower strength and more pores, stress concentration is more easily formed around the pores inside the foamed concrete, which leads to more cracks generated by tensile failure than shear failure, resulting in tensile failure.
- The DEM can be used to predict the performance of foamed concrete with an arbitrary density and any loading rate. Quantitative analysis of the mechanical properties of foam concrete, prediction of various properties of foam concrete, and further research on the calibration of modeling parameters are the key contents of future research work in this file. Finally, technical support will be provided for the application of foam concrete using the DEM model in practical engineering.
Author Contributions
Conceptualization, Methodology, Formal analysis, Resources, Project administration, Funding acquisition, Supervision, Y.G.; Investigation, Writing—original draft, Visualization, Writing—review & editing, Y.C.; Conceptualization, Resources, Supervision, J.C. All authors have read and agreed to the published version of the manuscript.
Funding
This research was funded by the National Natural Science Foundation of China (Grant No. 52009122, No. 52268072); Transportation Key Scientific and Technological Project (Grant No. 2021-ZD1-026); the Xinjiang Transportation Science and Technology Project (Grant No. XJLQ-22016/FW03).
Institutional Review Board Statement
Not applicable.
Informed Consent Statement
Not applicable.
Data Availability Statement
Data available in a publicly accessible repository.
Acknowledgments
The research is based upon the work supported by the Open Fund Project of Inner Mongolia Transportation Science Development Research Institute (Grant No. 2021KFJJ-003); Science and Technology Plan Project of the Zhejiang Provincial Department of Transportation (Grant No. 2019007); Zhejiang Provincial Natural Science Foundation of China (Grant No. LQ21E090002, LGF20E080007). Their support is gratefully appreciated.
Conflicts of Interest
The authors declare that they have no known competing financial interests or personal relationships that could have appeared to influence the work reported in this paper.
Nomenclature
| DEM | Discrete element method |
| CT | X-ray computed tomography |
| Ls | Surface gap |
| Lc | Contact gap |
| Lr | Reference gap |
| F1 | Linear force |
| Fd | Damper force |
| Parallel-bond force | |
| Parallel-bond moment | |
| Parallel-bond tangential force | |
| Bending moment | |
| ks | Normal contact stiffness |
| kn | Tangential contact stiffness |
| x | Variable of pore size |
| μ | Average pore size |
| σ | Standard deviation |
References
- Ramamurthy, K.; Kunhanandan Nambiar, E.K.; Indu Siva Ranjani, G. A classification of studies on properties of foam concrete. Cem. Concr. Compos. 2009, 31, 388–396. [Google Scholar] [CrossRef]
- Xie, H.; Dong, J.; Deng, Y.; Dai, Y. Research and Model Prediction on the Performance of Recycled Brick Powder Foam Concrete. Adv. Civ. Eng. 2022, 2022, 2908616. [Google Scholar] [CrossRef]
- Nguyen, T.; Ghazlan, A.; Kashani, A.; Bordas, S.; Ngo, T. 3D meso-scale modelling of foamed concrete based on X-ray Computed Tomography. Constr. Build. Mater. 2018, 188, 583–598. [Google Scholar] [CrossRef]
- Wang, B.; Chen, Y.; Fan, H.; Jin, F. Investigation of low-velocity impact behaviors of foamed concrete material. Compos. Part B 2019, 162, 491–499. [Google Scholar] [CrossRef]
- Adams, T.; Vollpracht, A.; Haufe, J.; Hildebrand, L.; Brell-Cokcan, S. Ultra-lightweight foamed concrete for an automated facade application. Mag. Concr. Res. 2019, 71, 424–436. [Google Scholar] [CrossRef]
- Tikalsky, P.J.; Pospisil, J.; MacDonald, W. A method for assessment of the freeze-thaw resistance of preformed foam cellular concrete. Cem. Concr. Res. 2004, 34, 889–893. [Google Scholar] [CrossRef]
- Yang, K.H.; Lee, K.H.; Song, J.K.; Gong, M.H. Properties and sustainability of alkali-activated slag foamed concrete. J. Clean. Prod. 2014, 68, 226–233. [Google Scholar] [CrossRef]
- Gu, G.; Xu, F.; Huang, X.; Ruan, S.; Peng, C.; Lin, J. Foamed geopolymer: The relationship between rheological properties of geopolymer paste and pore-formation mechanism. J. Clean. Prod. 2020, 277, 123238. [Google Scholar] [CrossRef]
- Mohit, M.; Ranjbar, A.; Sharifi, Y. Mechanical and microstructural properties of mortars incorporating ceramic waste powder exposed to the hydrochloric acid solution. Constr. Build. Mater. 2021, 271, 121565. [Google Scholar] [CrossRef]
- Alzara, M.; Riad, M.; AbdelMongy, M.; Farouk, M.A.; Yosri, A.M.; Moubarak, A.M.; Ehab, A. Analysis of Lightweight Polystyrene Foam Concrete Flat Slabs under Fire Condition. Adv. Civ. Eng. 2022, 2022, 1964903. [Google Scholar] [CrossRef]
- Liu, Z.; Zhao, K.; Hu, C.; Tang, Y. Effect of Water-Cement Ratio on Pore Structure and Strength of Foam Concrete. Adv. Mater. Sci. Eng. 2016, 2016, 9520294. [Google Scholar] [CrossRef] [Green Version]
- Nambiar, E.K.K.; Ramamurthy, K. Influence of filler type on the properties of foam concrete. Cem. Concr. Compos. 2006, 28, 475–480. [Google Scholar] [CrossRef]
- Yong, M.; Liu, J.; Alengaram, U.J.; Jumaat, M.Z.; Mo, K.H. Evaluation of thermal conductivity, mechanical and transport properties of lightweight aggregate foamed geopolymer concrete. Energy Build. 2014, 72, 238–245. [Google Scholar] [CrossRef]
- Gong, J.; Li, K. Minimizing Drying Shrinkage and Enhancing Impermeability of Foam Concrete Modified with Epoxy Resin. Adv. Civ. Eng. 2020, 2020, 8897687. [Google Scholar] [CrossRef]
- Nambiar, E.K.K.; Ramamurthy, K. Models for strength prediction of foam concrete. Mater. Struct. 2008, 41, 247–254. [Google Scholar] [CrossRef]
- Kuzielová, E.; Pach, L.; Palou, M. Effect of activated foaming agent on the foam concrete properties. Constr. Build. Mater. 2016, 125, 998–1004. [Google Scholar] [CrossRef]
- Nambiar, E.K.K.; Ramamurthy, K. Air-void characterisation of foam concrete. Cem. Concr. Res. 2007, 37, 221–230. [Google Scholar] [CrossRef]
- Wee, T.H.; Babu, D.S.; Tamilselvan, T.; Lim, H.S. Air-void system of foamed concrete and its effect on mechanical properties. ACI Mater. J. 2006, 103, 45–52. [Google Scholar]
- Hilal, A.A.; Thom, N.H.; Dawson, A.R. On entrained pore size distribution of foamed concrete. Constr. Build. Mater. 2015, 75, 227–233. [Google Scholar] [CrossRef]
- Cundall, P.A. A computer model for simulating progressive, large-scale movement in blocky rock system. Proc. Int. Symp. Rock Mech. 1971, 8, 129–136. [Google Scholar]
- Cundall, P.A.; Strack, O. A discrete numerical model for granular assemblies. Géotechnique 2008, 30, 331–336. [Google Scholar] [CrossRef] [Green Version]
- Potyondy, D.O.; Cundall, P.A. A bonded-particle model for rock. Int. J. Rock Mech. Min. Sci. 2004, 41, 1329–1364. [Google Scholar] [CrossRef]
- Onate, E.; Zarate, F.; Miquel, J.; Santasusana, M.; Celigueta, M.A.; Arrufat, F.; Gandikota, R.; Valiullin, K.; Ring, L. A local constitutive model for the discrete element method. Application to geomaterials and concrete. Comput. Part. Mech. 2015, 2, 139–160. [Google Scholar] [CrossRef] [Green Version]
- Ma, T.; Zhang, D.; Zhang, Y.; Zhao, Y.; Huang, X. Effect of air voids on the high-temperature creep behavior of asphalt mixture based on three-dimensional discrete element modeling. Mater. Des. 2016, 89, 304–313. [Google Scholar] [CrossRef]
- Ma, T.; Zhang, Y.; Zhang, D.; Yan, J.; Ye, Q. Influences by air voids on fatigue life of asphalt mixture based on discrete element method. Constr. Build. Mater. 2016, 126, 785–799. [Google Scholar] [CrossRef]
- Suchorzewski, J.; Tejchman, J.; Nitka, M. Discrete element method simulations of fracture in concrete under uniaxial compression based on its real internal structure. Int. J. Damage Mech. 2018, 27, 578–607. [Google Scholar] [CrossRef]
- Xie, C.; Yuan, L.; Zhao, M.; Jia, Y. Study on failure mechanism of porous concrete based on acoustic emission and discrete element method. Constr. Build. Mater. 2020, 235, 117409. [Google Scholar] [CrossRef]
- Pieralisi, R.; Cavalaro, S.H.P.; Aguado, A. Cement and Concrete Research Advanced numerical assessment of the permeability of pervious concrete. Cem. Concr. Res. 2017, 102, 149–160. [Google Scholar] [CrossRef] [Green Version]
- Kader, M.A.; Islam, M.A.; Saadatfar, M.; Hazell, P.J.; Brown, A.D.; Ahmed, S.; Escobedo, J.P. Macro and micro collapse mechanisms of closed-cell aluminium foams during quasi-static compression. Mater. Des. 2017, 118, 11–21. [Google Scholar] [CrossRef]
- Moradian, M.; Hu, Q.; Aboustait, M.; Robertson, B.; Ley, M.T.; Hanan, J.C.; Xiao, X. Direct in-situ observation of early age void evolution in sustainable cement paste containing fly ash or limestone. Compos. Part B 2019, 175, 107099. [Google Scholar] [CrossRef]
- Mukhopadhyay, A.; Shi, X.J. Microstructural Characterization of Portland Cement Concrete Containing Reclaimed Asphalt Pavement Aggregates Using Conventional and Advanced Petrographic Techniques. Adv. Cem. Anal. Concr. Petrogr. 2019, 1613, 187–206. [Google Scholar] [CrossRef]
- Rossi, E.; Polder, R.; Copuroglu, O.; Nijland, T.; Šavija, B. The influence of defects at the steel/concrete interface for chloride- induced pitting corrosion of naturally-deteriorated 20-years-old specimens studied through X-ray Computed Tomography. Constr. Build. Mater. 2020, 235, 117474. [Google Scholar] [CrossRef]
- Wei, S.; Yiqiang, C.; Yunsheng, Z.; Jones, M.R. Characterization and simulation of microstructure and thermal properties of foamed concrete. Constr. Build. Mater. 2013, 47, 1278–1291. [Google Scholar] [CrossRef]
- Hajimohammadi, A.; Ngo, T.; Mendis, P.; Kashani, A.; van Deventer, J.S.J. Alkali activated slag foams: The effect of the alkali reaction on foam characteristics. J. Clean. Prod. 2017, 147, 330–339. [Google Scholar] [CrossRef]
- Hajimohammadi, A.; Ngo, T.; Mendis, P.; Sanjayan, J. Regulating the chemical foaming reaction to control the porosity of geopolymer foams. Mater. Des. 2017, 120, 255–265. [Google Scholar] [CrossRef]
- Amran, Y.H.M.; Farzadnia, N.; Ali, A.A.A. Properties and applications of foamed concrete; A review. Constr. Build. Mater. 2015, 101, 990–1005. [Google Scholar] [CrossRef]
- Zhang, M. Pore-scale modelling of relative permeability of cementitious materials using X-ray computed microtomography images. Cem. Concr. Res. 2017, 95, 18–29. [Google Scholar] [CrossRef] [Green Version]
- Hilal, A.A.; Thom, N.H.; Dawson, A.R. On void structure and strength of foamed concrete made without/with additives. Constr. Build. Mater. 2015, 85, 157–164. [Google Scholar] [CrossRef]
- Zhuang, S.; Wang, Q. Inhibition mechanisms of steel slag on the early-age hydration of cement. Cem. Concr. Res. 2021, 140, 106283. [Google Scholar] [CrossRef]
- Lu, Y.; Hu, X.; Yang, X.; Xiao, Y. Comprehensive tests and quasi-brittle fracture modeling of light-weight foam concrete with expanded clay aggregates. Cem. Concr. Compos. 2021, 115, 103822. [Google Scholar] [CrossRef]
- Jiang, N.; Ge, Z.; Guan, Y.; Zuo, Z.; Zhang, H.; Ling, Y.; Šavija, B. Experimentally validated meso-scale fracture modelling of foamed concrete. Theor. Appl. Fract. Mech. 2022, 122, 103631. [Google Scholar] [CrossRef]
- Nguyen, T.T.; Bui, H.H.; Ngo, T.D.; Nguyen, G.D. Experimental and numerical investigation of influence of air-voids on the compressive behaviour of foamed concrete. Mater. Des. 2017, 130, 103–119. [Google Scholar] [CrossRef]
- Nguyen, T.T.; Bui, H.H.; Ngo, T.D.; Nguyen, G.D.; Kreher, M.U.; Darve, F. A micromechanical investigation for the effects of pore size and its distribution on geopolymer foam concrete under uniaxial compression. Eng. Fract. Mech. 2019, 209, 228–244. [Google Scholar] [CrossRef]
Figure 1.
The linear-parallel-bond model.

Figure 2.
Schematic diagram of the gap between particles.

Figure 3.
Schematic diagram of the parallel bond.

Figure 4.
Failure envelope of the parallel bond.

Figure 5.
The preparation equipment for foamed concrete specimens.

Figure 6.
(a) The grayscale image of the CT slice, (b) 3D reconstruction of the pore structure.

Figure 7.
Schematic diagram of the uniaxial compression test.

Figure 8.
DEM model with a density of 750 kg/m3.

Figure 9.
The size distribution of pores in foamed concrete.

Figure 10.
Mechanical response of foamed concrete with a density of 750 kg/m3. (a) The typical failure modes; (b) The stress-strain curve.
Figure 10.
Mechanical response of foamed concrete with a density of 750 kg/m3. (a) The typical failure modes; (b) The stress-strain curve.

Figure 11.
Relationship between compressive strength and density of foam concrete under different loading rates.
Figure 11.
Relationship between compressive strength and density of foam concrete under different loading rates.

Figure 12.
The failure mode of the foamed concrete at a density of 600 kg/m3. (a) 0.06 mm/min; (b) 0.60 mm/min; (c) 6 mm/min.
Figure 12.
The failure mode of the foamed concrete at a density of 600 kg/m3. (a) 0.06 mm/min; (b) 0.60 mm/min; (c) 6 mm/min.

Figure 13.
Relationship between flexural strength and density of foam concrete under different loading rates.
Figure 13.
Relationship between flexural strength and density of foam concrete under different loading rates.

Figure 14.
The failure mode of foamed concrete with different densities at a fixed loading rate.

Figure 15.
The failure mode of foamed concrete at different loading rates.

Figure 16.
The calculation model for uniaxial compression of cylinder specimens.

Figure 17.
Stress-strain curves of the foamed concrete models with five kinds of cement paste sizes.
Figure 17.
Stress-strain curves of the foamed concrete models with five kinds of cement paste sizes.

Figure 18.
Stress-strain curves of numerical simulation and test.

Figure 19.
(a) damaged specimen after loading (b) failure mode of the numerical model (c) crack development inside the model.
Figure 19.
(a) damaged specimen after loading (b) failure mode of the numerical model (c) crack development inside the model.

Figure 20.
The calculation model for uniaxial compression of cube specimens.

Figure 21.
Relationship between the compressive strength and density of foam concrete in the test and the numerical simulation results.
Figure 21.
Relationship between the compressive strength and density of foam concrete in the test and the numerical simulation results.

Figure 22.
The failure mode of the foamed concrete with a density of 500 kg/m3 at a loading rate of 0.06 mm/min. (a) model failure mode; (b) crack development; (c) force-chain distribution.
Figure 22.
The failure mode of the foamed concrete with a density of 500 kg/m3 at a loading rate of 0.06 mm/min. (a) model failure mode; (b) crack development; (c) force-chain distribution.

Figure 23.
The failure mode of the foamed concrete with a density of 600 kg/m3 at a loading rate of 0.06 mm/min. (a) model failure mode; (b) crack development; (c) force-chain distribution.
Figure 23.
The failure mode of the foamed concrete with a density of 600 kg/m3 at a loading rate of 0.06 mm/min. (a) model failure mode; (b) crack development; (c) force-chain distribution.

Figure 24.
The failure mode of the foamed concrete with a density of 750 kg/m3 at a loading rate of 0.06 mm/min. (a) model failure mode; (b) crack development; (c) force-chain distribution.
Figure 24.
The failure mode of the foamed concrete with a density of 750 kg/m3 at a loading rate of 0.06 mm/min. (a) model failure mode; (b) crack development; (c) force-chain distribution.

Figure 25.
Relationship between compressive strength and loading rate of foam concrete of the test and numerical simulation results.
Figure 25.
Relationship between compressive strength and loading rate of foam concrete of the test and numerical simulation results.

Figure 26.
The crack development inside the model of the foamed concrete with a density of 600 kg/m3 at a loading rate of 0.06 mm/min. (a) model failure mode; (b) crack development; (c) force-chain distribution.
Figure 26.
The crack development inside the model of the foamed concrete with a density of 600 kg/m3 at a loading rate of 0.06 mm/min. (a) model failure mode; (b) crack development; (c) force-chain distribution.

Figure 27.
The crack development inside the model of the foamed concrete with a density of 600 kg/m3 at a loading rate of 0.6 mm/min. (a) model failure mode; (b) crack development; (c) force-chain distribution.
Figure 27.
The crack development inside the model of the foamed concrete with a density of 600 kg/m3 at a loading rate of 0.6 mm/min. (a) model failure mode; (b) crack development; (c) force-chain distribution.

Figure 28.
The crack development inside the model of the foamed concrete with a density of 600 kg/m3 at a loading rate of 6 mm/min. (a) model failure mode; (b) crack development; (c) force-chain distribution.
Figure 28.
The crack development inside the model of the foamed concrete with a density of 600 kg/m3 at a loading rate of 6 mm/min. (a) model failure mode; (b) crack development; (c) force-chain distribution.

Figure 29.
A numerical model for the three-point flexural test.

Figure 30.
Effect of different densities and loading rates on the flexural strength of the test and numerical simulation results. (a) The loading rate is 0.6 mm/min; (b) the density is 600 kg/m3.
Figure 30.
Effect of different densities and loading rates on the flexural strength of the test and numerical simulation results. (a) The loading rate is 0.6 mm/min; (b) the density is 600 kg/m3.

Figure 31.
The flexural failure mode of the foamed concrete with a density of 600 kg/m3 at a loading rate of 0.6 mm/min. (a) The failure of the numerical model; (b) the failure of the specimen; (c) crack development inside foam concrete; (d) force-chain distribution.
Figure 31.
The flexural failure mode of the foamed concrete with a density of 600 kg/m3 at a loading rate of 0.6 mm/min. (a) The failure of the numerical model; (b) the failure of the specimen; (c) crack development inside foam concrete; (d) force-chain distribution.


Table 1.
Mixtures of foamed concrete.
| Wet Density (kg/m3) | Cement (kg/m3) | Water (kg/m3) | Foaming Agent (kg/m3) |
|---|---|---|---|
| 500 | 310 | 186 | 0.59 |
| 600 | 355 | 216 | 0.57 |
| 750 | 450 | 270 | 0.53 |
Table 2.
Mesoscopic parameters of the parallel-bond model of foamed concrete.
| Mesoscopic Parameters of Particles | Parallel-Bond Model | ||
|---|---|---|---|
| Parameters | Values | Parameters | Values |
| Radius (mm) | 0.9 | Effective elastic modulus E0 (Pa) | 1.0 × 10⁸ |
| Density (kg/m3) | 500 | Tensile strength (Pa) | 1.1 × 10⁷ |
| Normal contact stiffness kn (N/m3) | 4.0 × 10⁹ | Cohesion (Pa) | 7.0 × 10⁶ |
| Normal contact stiffness/Tangential contact stiffness kn/ks | 1.0 | Friction coefficient | 0.4 |
Disclaimer/Publisher’s Note: The statements, opinions and data contained in all publications are solely those of the individual author(s) and contributor(s) and not of MDPI and/or the editor(s). MDPI and/or the editor(s) disclaim responsibility for any injury to people or property resulting from any ideas, methods, instructions or products referred to in the content. |
© 2023 by the authors. Licensee MDPI, Basel, Switzerland. This article is an open access article distributed under the terms and conditions of the Creative Commons Attribution (CC BY) license (https://creativecommons.org/licenses/by/4.0/).
Share and Cite
MDPI and ACS Style
Gao, Y.; Cheng, Y.; Chen, J. Experimental Study and 3-D Meso-Scale Discrete Element Modeling on the Compressive Behavior of Foamed Concrete. Buildings 2023, 13, 674. https://0-doi-org.brum.beds.ac.uk/10.3390/buildings13030674
AMA Style
Gao Y, Cheng Y, Chen J. Experimental Study and 3-D Meso-Scale Discrete Element Modeling on the Compressive Behavior of Foamed Concrete. Buildings. 2023; 13(3):674. https://0-doi-org.brum.beds.ac.uk/10.3390/buildings13030674
Chicago/Turabian StyleGao, Yuan, Yin Cheng, and Jianzhuang Chen. 2023. "Experimental Study and 3-D Meso-Scale Discrete Element Modeling on the Compressive Behavior of Foamed Concrete" Buildings 13, no. 3: 674. https://0-doi-org.brum.beds.ac.uk/10.3390/buildings13030674
Note that from the first issue of 2016, this journal uses article numbers instead of page numbers. See further details here.