Article

Unified Flexural Resistance Design Method and Evaluation Frame for the B-Regions of RC Flexural Members—Theory and Application

School of Civil Engineering, Hunan University of Science and Technology, Xiangtan 411201, China
*
Author to whom correspondence should be addressed.
Submission received: 29 March 2023 / Revised: 14 April 2023 / Accepted: 20 April 2023 / Published: 24 April 2023
(This article belongs to the Special Issue New and Future Progress for Concrete Structures)

Abstract

:
The load and resistance factor design (LRFD) method is normally used to design B-regions of reinforced concrete (RC) flexural members. The design includes many checks corresponding to different limit states. The LRFD method requires many loop calculation steps in the design, demonstrating its relative inefficiency. It cannot be applied to compare limit states directly and quantitatively. Different design limit states are separated and isolated. How to improve the analytical calculation efficiency of the LRFD method and to realize direct and quantitative comparisons between limit states are very important problems in structural engineering. This paper presents an innovative unified flexural resistance design (UFRD) method and a unified flexural resistance evaluation (UFRE) frame to solve these problems to some extent. The main contents include the unified flexural resistance (UFR) principles, formulas for the unified flexural resistance design (UFRD) method, the operation procedure to facilitate its usage, the UFRE framework to compare limit states, and three examples. The results show that the UFRD method can provide the same design outcomes as the LRFD one. However, UFRD calculations are simpler, requiring at most 20% of the calculation steps of the LRFD method. The UFRE frame can make different limit states compare with each other directly and quantitatively, which cannot be realized by the LRFD method. It helps expose some potential and insufficient flexural resistance hazards for some limit states, such as the only 10% relative strength reservation of one example. Thus, the UFRD method and the UFRE frame supplement and develop the LRFD method to some degree. The simplicity and practicality of the approach and the frame make them appropriate for many applications.

1. Introduction

Reinforced concrete (RC) flexural members are widely utilized in structural engineering. The flexural resistance design of these members is always encountered in engineering practices. The design method is a core problem of the flexural design of these structures.
Structural engineers use various methods to design structures for ensuring satisfactory performance under prescribed loads, which include service loads and ultimate ones. Philosophies for designing the structural members of different materials have evolved over several decades. Popular design theories have always been modified or superseded through experimental studies, theoretical research, and practical experiences. The allowable stress design method was applied to design steel, wood, and other structures for decades. For concrete structures, the strength design method replaced the allowable stress method in the 1960s. From the 1980s, the load and resistance factor design (LRFD) method has been gradually introduced and developed to take the place of the strength method. Some of the newest developments and practical applications of the LRFD method are displayed in the AASHTO specifications [1,2].
Recent research provides some different design methods based on different considerations and from different perspectives.
To investigate the required flexural strength ratio of joints between the columns and beams of framed buildings, Chang-Soo Kim et al. [3] conducted a numerical study by considering various parameters. Based on numerical studies, the design method based on the performance-based design was developed for the strength ratio, which was represented as a function of the height ratio. Linlin Xie et al. [4] proposed a new RC frame structure, which was high-performance with an energy dissipative connection system. An equivalent design procedure was developed for realizing the performance-based design of the structure. A calculation approach was recommended to design some of the critical parameters of the structure. An analytical model and design method were studied for RC beams/columns under blasting loads by a field explosion test [5]. A unified blast-resistant design procedure was presented for the performance-based design. The studies were very important for developing an independent code of blast-resistant design.
Based on the fib model and Japanese standards, Gaochuang Cai et al. [6] proposed a simplified design method to predict the flexural behaviour of RC beams under cyclic loads. The uniqueness of the study lied in the fact that the structures were strengthened by reinforced mortar with high-performance textile. Fang Yuan and Yu-Fei Wu [7] developed new RC flexural design theorems under elevated temperature. Then different parameters of sectional stress blocks were produced for RC members. The advantage of the theory and the corresponding stress block parameters lied in requiring no tests. They facilitated the flexural design of RC components under elevated temperature just by using the conventional RC design frame. Based on experimental data, an extensive numerical study was conducted for joints between RC columns and footing sockets [8]. A calculation method was then developed for computing the flexural capacity of socket joints. A design method was also given for the practical design of socket joints.
Paolo Martinelli et al. [9] validated an analytical method which was suitable for the robust design of RC buildings. The method combined together the ultimate limit state with the serviceability one. Parametric analyses for RC flat slabs were then conducted in the framework of the safety factor method based on experimental data available and nonlinear finite element analyses. A unified approach was proposed by A. Carpinteri and M. Corrado [10]. The method aimed to interpret the complex phenomena of the bending behaviour of RC beams from the perspective of nonlinear fracture mechanics. New practical design equations and diagrams were presented according to numerical results. To avoid brittle failures, suggested bounds of reinforcement, material properties, and structural dimensions were proposed based on the method.
It can be seen from above literature that different researchers have proposed some new design methods for RC structures. These methods are very useful and suitable for specified structures and situations. They are very important and valuable for promoting structural design philosophies to some degree. However, these methods are not common and practical enough to be fit for real structural design, through being compared with the LRFD method. For example, they cannot even provide a reliable load factor to secure enough safety storage. Thus, developing the LRFD method is still very important and meaningful.
Shamsad Ahmad et al. [11] strengthened pre-damaged RC beams with different layer schemes of ultra-high-performance fibre-reinforced concrete (UHPFRC). Experimental and analytical studies were then composed to display the flexural behaviour of the strengthened beams. Analytical models were then proposed to estimate the ultimate bending capacities of the strengthened beams with different jacketing schemes. Yang Zhang et al. [12] proposed a new approach to strengthen damaged RC structures with prestressed ultra-high-performance concrete (UHPC). Bending tests of strengthened beams were conducted to study the flexural properties. A calculation method was developed to calculate the ultimate bending capacity of the strengthened beams. The calculation results showed satisfactory estimations with test results. Yang Zhang et al. [13] also strengthened damaged RC beams with new steel plate and UHPC composite. They proposed calculation methods to compute cracking moments and the bending capacity of the strengthened beams according to the test results. Some important factors were rationally considered, including the interface anchorage length, the strain-hardening property of UHPC, and the residual strain in the beams.
Gang Peng et al. [14] studied the flexural behaviour of RC beams strengthened with cementitious grout. The different reinforcement positions and thicknesses of layers were considered in the loading test of the beam specimens. Thereafter, an innovative calculation method was proposed to calculate the bending capacity and deformation of strengthened RC beams. Shitao Cheng et al. [15] combined textile and fibre-reinforced concrete (FRC) together to enhance RC beams. The aim was to increase the crack resistance and bending performance. In the test of strengthened beams, the textile, anchoring means, and thickness of FRC were considered as variables. The calculation methods were proposed for the load-deformation relationship and the bending capacity of composite beams through sectional analyses. The mechanical properties and crack resistance of RC beams enhanced by carbon textile and modified concrete were also studied by using similar methods and the four-point loading test approach [16]. Xi-Yuan Yu et al. [17] compared bending tests between corroded RC beams strengthened with carbon fibre-reinforced plastics (CFRP) and CFRP strengthened non-corroded RC beams. Based on comparisons and the failure mode theory, they proposed a method to calculate the bending capacities of corroded RC beams strengthened with CFRP. The initial bonding failure was taken as the ultimate limit state of RC beams strengthened with CFRP [18]. A new method was developed to calculate the bending strength based on theoretical analyses and experimental results.
Golewski, G.L. [19] specified the importance of the design of pocket foundations. The main problems in the construction of them were also stressed at different stages. Then a different method was proposed to assemble precast columns in the foundations. Three types of precast column-foundation connection were designed: the base plate connection, the pocket one, and the grouted sleeve one [20]. Experiments were conducted to study the hysteretic behaviours of scaled models of the connections through lateral cyclic loading tests. Focusing on increasing the prefabricated rate, Wang, S. and Sinha, R. [21] examined the influencing pattern and mode on the environment from the aspect of the construction sector.
The above literature provides some different calculation approaches for the design of specified RC structures, such as UHPC strengthened RC structures, CFRP-sheet strengthened non-corroded RC beams, and prefabricated RC columns, etc. These methods are very useful for the design of these structures. However, it is very important to point out that these methods were mainly presented by numerical analyses and experimental tests of specified structures. The universality and practicality of these methods needs more promotion.
Numerical analyses of structural design are relatively easy and efficient when the finite element method develops rapidly. Correspondingly, large-scale numerical calculation is possible and convenient. A large number of numerical analyses can provide a large amount of data and contribute to finding out some important rules. The above literature on structural design methods and calculation approaches for design also present the same conclusion. However, analytical calculation methods still have an important influence on the development of structural design because of the clear and profound mechanical concepts and ideas they have [22]. It is the LRFD method that has significant comparative advantages for the design of RC members on these aspects.
Based on the analyses of the structural design methods and calculation approaches for structural design in the literature, it might be important and necessary to promote the LRFD design method and to develop corresponding analytical calculation methods for the design of RC members.
For the practical design of an RC member, it is always divided into B-regions and D-regions per AASHTO standards [1], as shown in Figure 1, where ds is defined as the distance between the extreme compression fibre and the centroid of the primary longitudinal reinforcement, and q is the uniform load on the member. R1 and R2 represent the supporting reaction forces.
Bernoulli’s plane section hypothesis is considered applicable for B-regions [1,2]. However, more complex stress and strain variations exist in D-regions. It is assumed that Bernoulli’s hypothesis of a straight-line strain profile cannot apply in D-regions. This paper mainly focuses on the B-regions of RC flexural members.
Existing RC structure design practices are based on probability-based limit state design (PLSD) philosophies per AASHTO standards [1]. The design work determines the values of the structural geometric parameters and material parameters, especially those of the cross section. The most popular design technique is the load and resistance factor design (LRFD) method. This method considers explicit concepts of the limit states, load and resistance factors, and implicit probabilistic decisions [23]. The limit state concept forms the foundations of the LRFD method. When the B-regions of an RC flexural member are designed, the extreme event limit state is always omitted under normal circumstances. The requirements for other limit states from AASHTO specifications [1] must be checked and satisfied, such as a flexural resistance check of the strength limit state, a deformation check of the service limit state, and a fatigue stress verification of the fatigue limit state. When a structure meets these requirements, the design of B-regions is considered feasible, which means that the values of the structural geometric dimensions and materials are acceptable [24]. The conventional analytical calculation procedure for the design based on the LRFD method is illustrated in Figure 2 [23,25,26].
Figure 2 shows that the complexity of the design of B-regions makes the LRFD method require many loop calculation steps to provide feasible design schemes meeting all of the specification requirements [1], limiting its analytical calculation efficiency.
Since the LRFD method was introduced in the USA, it has gained wider acceptance by engineers for structural design [2]. Undoubtedly, the LRFD method is popular and functional. It is easy for structural engineers to take the LRFD method for granted, accept it, and apply the design requirements for different limit states to design RC components [24]. However, if we carefully examine the long-existing design practices for the B-regions of RC flexural members based on the LRFD method, we find that the requirements of different limit states are only checked passively and separately according to the code [1]. Namely, the flexural resistance is checked for the strength limit state, the deformation is checked for the service state, and the fatigue stress is verified for the fatigue state [23,27]. It is evident that the three limit states cannot be internally related by the three indexes. Additionally, the indexes cannot be used to compare these states directly and quantitatively.
It is natural and instinctive to infer that PLSD philosophies, as complete and developed design principles, should contain internal, inherent and organic relations among the limit states. The separation and isolation of the limit states of the LRFD method is unfavourable to the development of the philosophies and the code [1].
Therefore, in response to the inefficiency of analytical calculations of the LRFD method and the non-unity of the different LRFD method limit states, the concept of unified flexural resistance (UFR) and an innovated unified flexural resistance design (UFRD) method are proposed. The method unifies different limit states to the UFR to provide a new and unique way to design the B-regions of RC flexural members. The theoretical principles are constructed, and corresponding analytical calculation formulas are deduced for the UFRD method. An operational procedure is established to facilitate its usage. A unified flexural resistance evaluation (UFRE) frame based on the UFRD method is proposed to compare and evaluate different limit states directly and quantitatively. They consist of the main tasks of the paper. Finally, the presented method and frame are applied to some cases.
The goal of this study was to construct and reveal a new inherent and internal unity of PLSD philosophies as a profound and simple approach through the URF concept. It also aimed to simplify the calculations to improve the design efficiency of the B-regions of RC flexural members by using the UFRD method. It is expected that the research can help engineers quickly estimate the quantitative differences among the limit states through the UFRE frame.
The scientific novelty of the study lies in that the innovative UFRD method and UFRE frame can overcome some of the deficiencies of the LRFD method. By using the UFRD method, structural engineers can design B-regions of RC flexural members more efficiently than by using the LRFD method. They can understand the inherent and internal unity of PLSD philosophies from the URF concept. By using the UFRE frame, engineers can compare different limit states directly and quantitatively. These practical functions cannot be realized by the LRFD method. Thus, the UFRD method and the UFRE frame further develop the LRFD method.

2. Theoretical Principles of the UFRD Method

2.1. Foundations and Concept of UFR

According to the LRFD method [1], the flexural resistance should be checked for the B-regions of RC flexural members in the strength limit state. Specifications [1] require that the deflection is checked in the service limit state, and that the fatigue stress is evaluated in the fatigue limit state.
Regardless of whether an RC flexural member is in the strength limit state, the service state, or the fatigue state, it must have corresponding bending capacity when it is designed based on the LRFD method according to the code [1]. Otherwise, it cannot bear the load and perform the corresponding functions of each state. This means that different limit states can be unified in flexural resistance, and each state should have its own values in the quantity of flexural resistance. By regarding the deflection limit values in the service limit state and the stress limit values in the fatigue limit state as constraints, the flexural resistances corresponding to these limit states can be inversely deduced based on the basic principles of the LRFD method [1,2]. Then we transform the deflection verification and the fatigue stress verification to a kind of flexural resistance check. The flexural capacity of the strength limit state is directly determined by its calculation principles. Therefore, all the limit states are unified to this kind of flexural resistance. We define this kind of flexural resistance as the unified flexural resistance (UFR), which is obviously a clear, definite, quantifiable, and comparable concept and index.
The B-regions of RC flexural members can then be designed using the alternative verifications of the UFRs of all limit states. The design method using alternative UFR verifications of all the limit states to realize the design of B-regions of RC members is defined as the UFRD method.

2.2. Basic Assumptions

The essence of the UFRD method is to unify different limit states to the UFR and to simplify the flexural design calculation of the B-regions of RC components. It complies with the basic assumptions of PLSD philosophies [1] for the design of B-regions of RC members.

2.2.1. Assumptions for the Strength Limit State

The following assumptions are suitable for the design of the B-regions of RC components of the strength limit state [1,23,27]:
  • The sectional strain is directly proportional to the depth from the neutral axis, namely, the plane section hypothesis.
  • The extreme usable strain for unconfined concrete is less than or equal to 0.003.
  • The stress in the reinforcement steels is computed from a given constitutive relationship of the steel or an approved formula.
  • The concrete tensile strength is neglected.
  • The stress and strain distribution of the concrete compressive area is assumed to be rectangular.
  • The strain balances at a cross section. The compression concrete will reach its ultimate strain of 0.003 when the tension reinforcement reaches the specified yield strain corresponding to yield strength fy.
  • Sections are controlled by tension. When the compression concrete reaches its assumed limit strain of 0.003, the tensile steel will reach or exceed the tension-controlled strain limit.

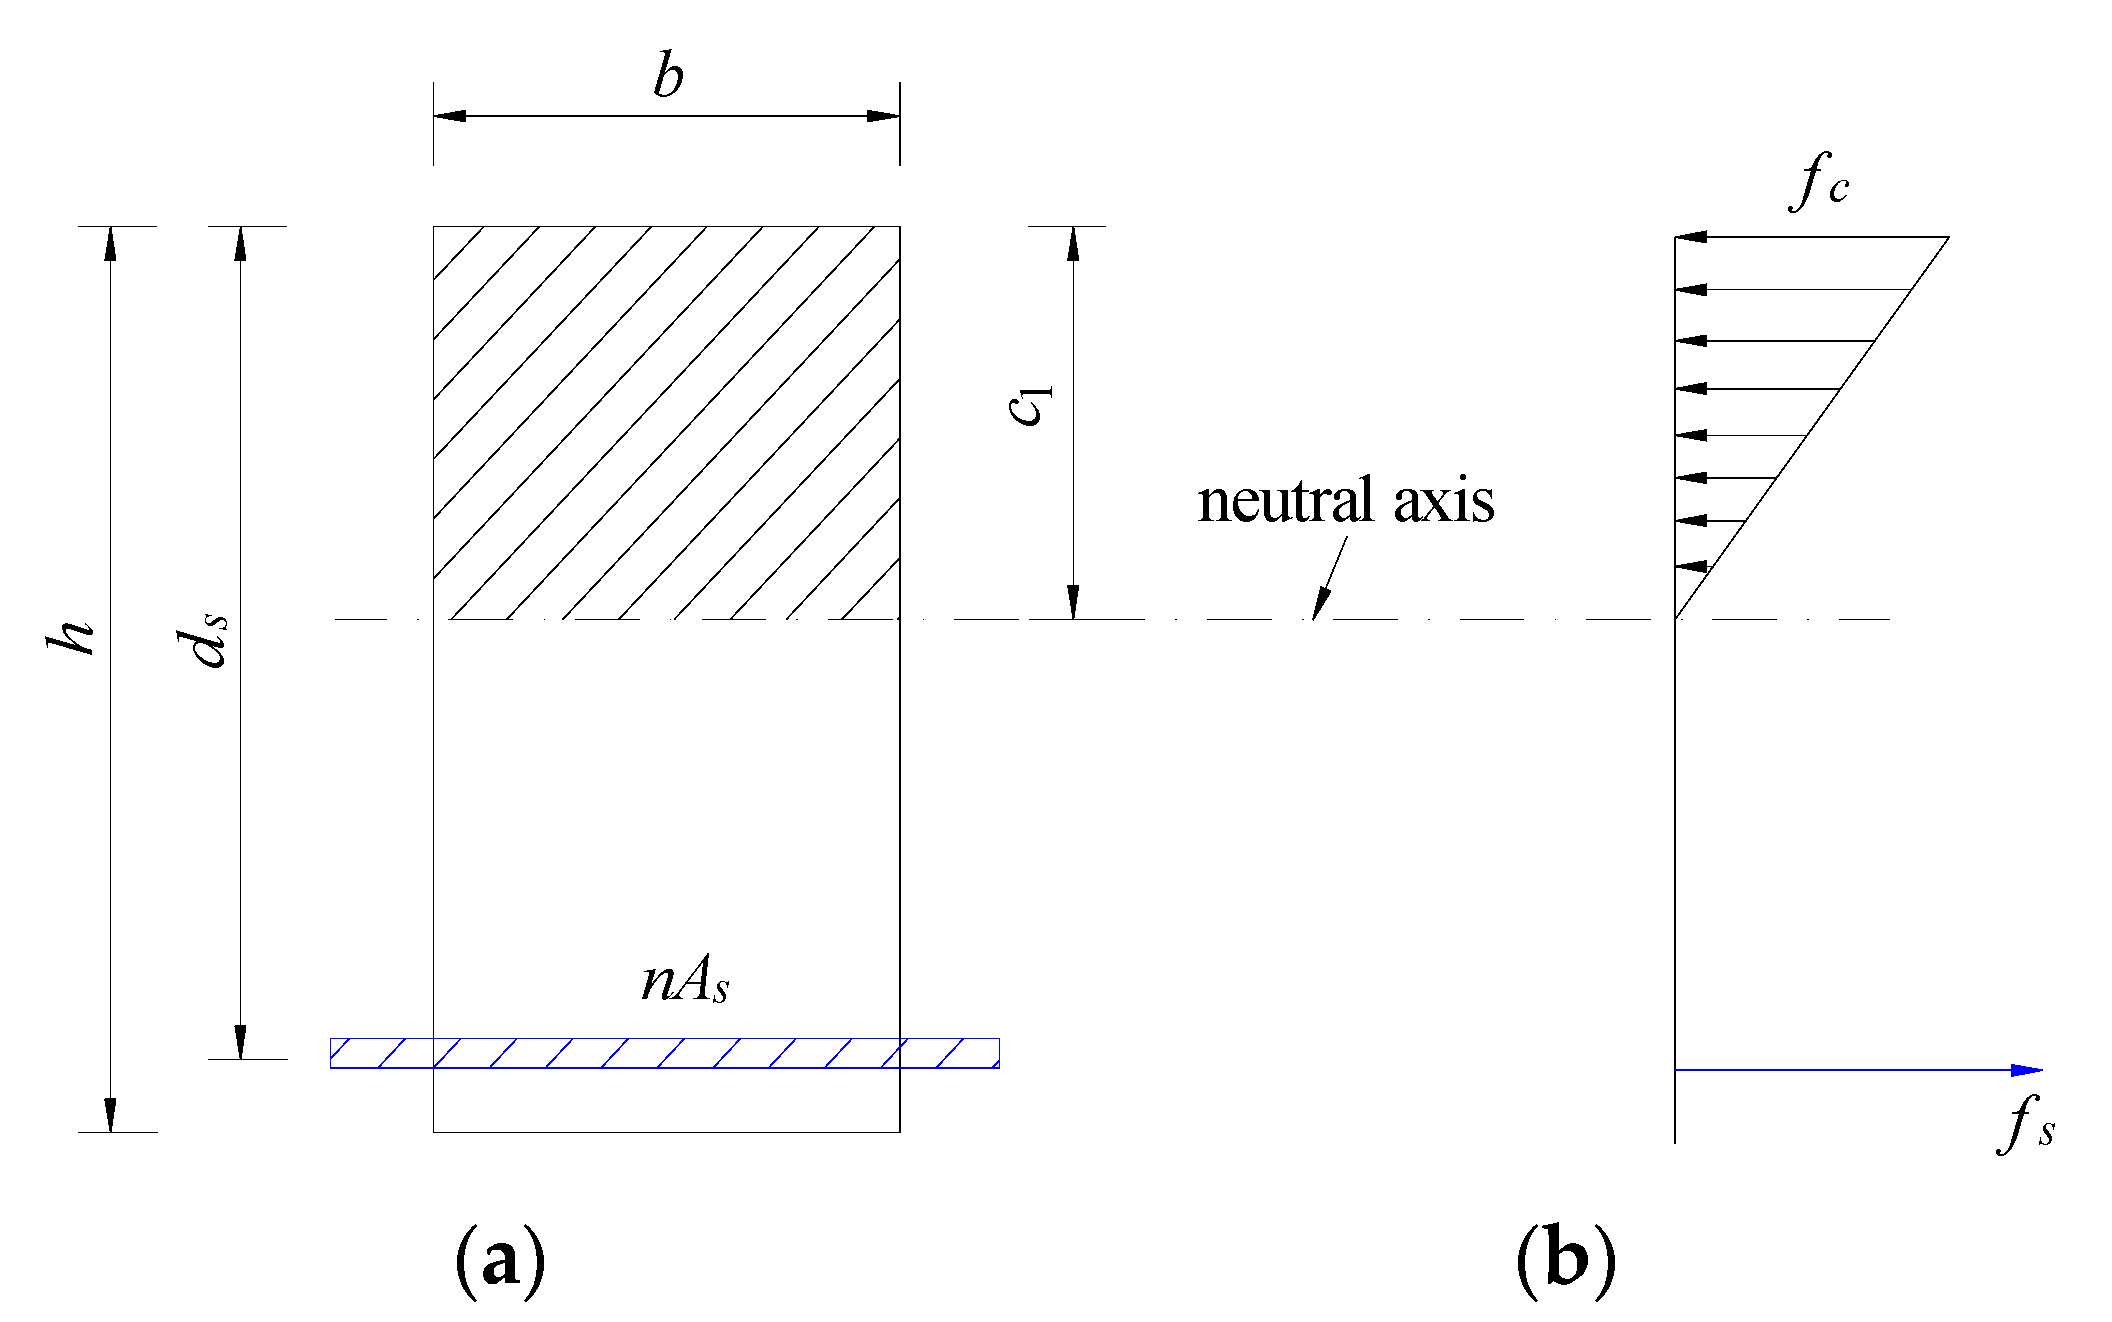
2.2.2. Assumptions for the Service and Fatigue Limit States

The following assumptions are suitable for the design of RC components of service and fatigue limit states [1,23,28]:
  • Where transformed section analysis is used to assess the elastic deformations and stresses in RC components, the transformed area properties may be calculated by replacing the steel area with an equivalent concrete area equal to the steel area multiplied by a modular ratio, defined as Es/Ec for reinforcing bars, where Es is the elastic modulus of steel, and Ec is the elastic modulus of concrete.
  • If there are no more comprehensive analyses, instantaneous deformations of structures can be determined by using the concrete elastic modulus and the effective sectional inertia moment.
  • The sectional properties are based on cracked sections for the fatigue limit state. Under the situation, the sum of concrete stresses due to specified loads will be tensile and exceed the tensile limit to ensure the section crack. The cracked section should be changed to a transformed one. The fatigue stress is computed using the properties of the transformed section.

2.3. Theoretical Derivation

2.3.1. Strength Limit State

According to the LRFD method, the flexural resistance check of the strength limit state is first conducted for the design of the B-regions of RC components. In the strength limit state, this kind of flexural resistance for singly reinforced rectangular sections is analysed according to the design concept [29,30,31] shown in Figure 3.
In Figure 3, b is the section width of the member, h is the depth of the section, dc is the thickness of the concrete cover which is the distance from the sectional tension edge to the centre of the reinforcement, and ds is equal to hdc, namely, the distance from the extreme compression edge to the centroid of the flexural reinforcement. εc is the strain at the extreme concrete compression fibre with an assumed strain limit of 0.003 under balanced strain conditions. εy is the strain of the reinforcement. f’c is the design concrete compressive strength, As is the area of the tension reinforcement, fy is the yield strength in the tension reinforcement at a nominal flexural resistance, and c is the actual distance from the extreme compression fibre to the neutral axis. α1 is the first stress block factor, equal to 0.85 when the concrete design compressive strengths do not exceed 10.0 ksi. C = α1f’cba represents the total force of the compression concrete. T = fyAs represents the tension force of the reinforcement.
From Figure 3d, Equation (1) is derived:
a = β 1 c
where a is the depth of the equivalent compression stress block. β1 is the second stress block factor, equal to 0.85 when the design concrete compressive strengths do not exceed 4.0 ksi. β1 is reduced at a rate of 0.05 for each 1.0 ksi of strength when the design compressive strengths of concrete exceed 4.0 ksi. However, β1 is not less than 0.65 [1].
Neglecting the tensile strength of the concrete, as shown in Figure 3d, the static balance equations are shown as Equations (2) and (3):
α 1 f c b a = f y A s
M n = f y A s ( d s a 2 )
where Mn is the nominal bending capacity.
The factored bending capacity Mr [1] is then expressed as Equation (4):
M r = ϕ M n
where ϕ is the resistance factor, which is equal to 0.90 for tension-controlled RC sections and normal weight concrete based on AASHTO standards [1]. Here, Mr represents the flexural resistance of the strength limit state of the B–regions of RC flexural members.
To design the B-regions of RC flexural components according to AASHTO specifications [1], the load combination response Mu of the strength limit state can be obtained through structural analyses. The initial values of the dimensional parameters such as b, h, dc, and ds, and the material parameters such as f’c and fy, are always provided based on engineering experiences and the specified demands of the engineering project. Then, the most important design task focuses on determining the reinforcement parameter As and the depth of the equivalent stress block a.
According to AASHTO specifications [1], there are three design restrictions for determining the above design parameters in the strength limit state. The first is that the flexural resistance Mr should be not less than the load combination effect Mu of the strength limit state, as shown in Equation (5):
M u M r
By synthesizing Equations (2)–(5) to determine As, and selecting the actual and possible type and number of reinforcing steel bars to be as economical as possible [32,33], the initial value of As can be given.
After these initial design parameters are determined, the flexural resistance [2] is expressed as Equation (6):
M r = ϕ 2 α 1 f y 2 A s 2 f c b + ϕ d s f y A s
Correspondingly, the initial value of a is given in Equation (7) by transforming Equation (2):
a = f y A s α 1 f c b
Equation (7) is substituted into Equation (1) to determine the value of c, as shown in Equation (8):
c = f y A s α 1 β 1 f c b
The second design restriction is that the height c should be limited to ensure that the reinforcing bars yield under tension-controlled conditions according to the code [1]. This requires that the ratio c/ds should not exceed the limit shown in Equation (9):
c d s 0.003 0.003 + ε c l = ( c d s ) max
where εcl is the reinforcement strain limit. The values of εcl commonly used in RC components [1] are shown in Table 1.
Combining Equation (1) with Equation (9) and inverting the result gives the limit of the height a in Equation (10):
a 0.003 0.003 + ε c l β 1 d s = a 0
Following the basic idea and concept of the UFR, we change the perspective from the depth limitation of the equivalent compression block to its corresponding bending moment capacity limit. We combine Equations (3), (4), and (10) to provide the first range of Mr under the limitation of Equation (10), as shown in Equation (11):
M r 1 = ϕ f y A s ( d s a 0 2 ) M r
where Mr1 is the transformed limit of flexural resistance from the limitation of the depth of the compression area.
The third design restriction is that the minimum reinforcement should be limited to prevent brittle failure by providing flexural strength no less than the cracking moment [1,3]. Under this design constraint, AASHTO specifications [1] require that the flexural resistance Mr be not less than the lesser of the following two values in Equation (12):
M r 2 = min { 1.33 M u M c r 1 = γ 1 γ 3 f r S c M r
Equation (12) is the second range of Mr meeting the concept of the UFR, where Mr2 is the converted flexural resistance limit from the minimum reinforcement requirements. Mu is the factored load response moment required by the corresponding strength load combination. Mcr1 is the cracking moment based on the code [1]. γ1 is the flexural cracking variability factor, which is 1.6 for commonly constructed concrete structures, which do not include precast segmental ones. γ3 is the ratio between yield strength to the ultimate tensile strength of the reinforcement, which may have different values corresponding to the commonly used reinforcements in RC elements [1], as shown in Table 2.
Sc is the section modulus for the edge fibre of the section where the tensile stress of the section is caused by external loads [34,35], which is shown in Equation (13) for a rectangular section. fr is the rupture modulus of concrete, which may be expressed in Equation (14) in ksi units for normal weight concrete [1]. Equations (13) and (14) are:
S c = b h 2 6
f r = 0 . 24 f c k s i
Equations (5), (6), (11) and (12) can be combined in Equation (15) to contain all three requirements of the strength limit state from the code [1] as a unified flexural moment form:
M u 0 = max ( M r 1 , M r 2 , M u ) M r = ϕ 2 α 1 f y 2 A s 2 f c b + ϕ d s f y A s
where Mu0 is a converted comprehensive representation of the limit value of the flexural resistance according to the three code restrictions for the strength limit state.
Therefore, Mr discussed in Equation (15) represents the UFR of the strength limit state based on the proposed concept of the UFR.
In terms of the LRFD method, a structural design for the strength limit state is considered rational to meet the requirements of AASHTO specifications [1] if three different design constraints, Equations (5), (9) and (12) are satisfied. The three formulas are not uniform in form. By using the concept of the UFR, the three requirements of the strength limit state are unified to Equation (15) as a uniform form of the flexural moment.

2.3.2. Service Limit State

According to the LRFD method, the deformation of the service limit state should be checked after the flexural resistance check of the strength limit state meets the AASHTO requirements [1]. In the service limit state, the instantaneous deflections [1] may be computed using the concrete elasticity modulus and taking the effective inertia moment, Ie, given by Equation (16), where the cracking moment Mcr2 is computed using Equation (17):
I e = ( M c r 2 M a ) 3 I g + [ 1 ( M c r 2 M a ) 3 ] I c r I g
M c r 2 = f r I g y t
In Equation (16), Ma is the maximum bending moment of a member at the stage where deflection is computed, which is commonly referred to as the unfactored live load response per AASHTO specifications [1]. In Equation (17), fr is the rupture modulus of concrete specified in Equation (14) for normal weight concrete. yt is the distance from the tension edge fibre to the section neutral axis, equal to h/2 for a rectangular section. Ig is the gross inertia moment of the concrete section about the centroidal axis, neglecting the reinforcement, as shown in Equation (18) for a rectangular section:
I g = 1 12 b h 3
Icr is the inertia moment of the cracked section. It is calculated using the concept of the transformed section shown in Figure 4, where the tension reinforcement areas are transformed to concrete and the area of concrete assumed cracked below the neutral axis is negligible [36,37]. According to AASHTO specifications [1], when two kinds of materials, concrete and reinforcement are transformed to one kind of material, the elastic principles can be applied to calculate the structural displacement and sectional stress. The area of tension reinforcement is usually replaced with an equivalent area of concrete, nAs, as shown in Figure 4. n is the modular ratio given by Equation (19). Es is the elasticity modulus of steel and is equal to 29,000 ksi. Ec is the modulus of elasticity of concrete calculated using Equation (20).
n = E s E c
E c = 1820 f c   k s i
For normal weight concrete, the values of the modular ratio n are commonly integers [1,2], which are listed in Table 3.
The moments about the neutral axis for concrete above the neutral axis are equal to the moments about the axis for the transformed area of tension reinforcement below the neutral axis. We obtain Equation (21), where c1 is the actual distance from the compression edge fibre to the neutral axis of the transformed section as shown in Figure 4:
b c 1 2 2 = n A s ( d s c 1 )
The solution to Equation (21) for c1 is given in Equation (22):
c 1 = n A s b 1 + 2 b d s n A s n A s b
The inertia moment Icr is then calculated for the cracked section by using the transformed section in Figure 4b. It is given by Equation (23):
I c r = 1 3 b c 1 3 + n A s ( d s c 1 ) 2
According to AASHTO specifications [1], the calculated deflection refers to displacement responses under an unfactored live load regardless of the dead load. The live load mainly includes the uniform lane load w and the axle truck load P.
The largest mid-span deflection Δ1 under uniform lane load w can be calculated using Equation (24) for a simply supported beam based on the effective inertia moment of a cracked section according to simple structural analyses [38], where L is the span length:
Δ 1 = 5 w L 4 384 E c I e
The bending moment Ma1 at the mid-span under w can be calculated using Equation (25):
M a 1 = w L 2 8
If Equation (24) is rationally translated, and Equation (25) is substituted into it, we obtain Equation (26):
Δ 1 = 5 48 M a 1 L 2 E c I e
However, the largest deflection Δ2 at the mid-span of a simply supported member under an axle load P of the design truck can be calculated using Equation (27) based on the effective inertia moment of the cracked section [39]:
Δ 2 = P L 3 48 E c I e
The mid-span moment Ma2 under P is calculated using Equation (28) according to simple structural analyses:
M a 2 = P L 4
Substituting Equation (28) into Equation (27) gives Equation (29):
Δ 2 = 1 12 M a 2 L 2 E c I e
Then, a careful analysis of Equations (26) and (29) shows that the deflections caused by lane load w and design truck load P can be expressed by the largest mid-span moment Ma for a simply supported beam. This means that the chosen larger deflection Δ to be checked according to AASHTO standards [1] can always be represented as a certain form of the largest mid-span moment Ma with a coefficient α to simplify the deflection calculation, as shown in Equation (30):
Δ = α M a L 2 E c I e
In conservative design, we can assume that α is equal to 5/48 for a simply supported beam [40,41].
According to AASHTO [1], the deflection criterion Δl considered for concrete vehicular bridges under vehicular loads is L/800. Therefore, in the service limit state, the deformation verification is expressed as Equation (31) using the concrete elastic modulus and taking the effective inertia moment of the cracked section:
Δ = α M a L 2 E c I e Δ l = L 800
It is an obvious expression of the displacement form, which cannot be directly compared with the expression of the flexural moment form in the strength limit state. Therefore, the concept of the UFR is used to facilitate the comparison and simplify the analytical calculation of the design of the B-regions of RC flexural members.
In the strength limit state, the corresponding UFR matches the largest load combination of the state, as shown in Equations (5) and (15). To be consistent with the strength limit state and the basic concept of the UFR, Equation (31) is transformed into Equation (32) in the form of a load combination of this service limit state:
Δ = α ( M u a M p ) L 2 E c I e Δ l = L 800
where Mua indicates the largest load combination moment of the state. The corresponding unfactored permanent load effect is represented by Mp. Then, Ma is equal to (Mua − Mp) for this state.
If Ie in Equation (16) is substituted into Equation (32), we obtain Equation (33):
Δ = α ( M u a M p ) L 2 E c [ ( M c r 2 M u a M p ) 3 I g + [ 1 ( M c r 2 M u a M p ) 3 ] I c r ] Δ l = L 800
where the cracking moment Mcr2 is computed using Equation (17).
Based on the concept of the UFR, the deflection verification requirement of Equation (33) is regarded as a deflection constraint of the service limit state. The largest bending moment Muamax that the structure can bear in this state under the constraint can be solved using Equation (33). It is defined as the UFR Mra of the service limit state, which is shown in Equation (34):
M r a = M u a max

2.3.3. Fatigue Limit State

According to the LRFD method, the fatigue stress of the fatigue limit state should also be verified after the flexural resistance check of the strength limit state meets AASHTO requirements [1].
In the fatigue limit state, the combination moment due to the unfactored permanent load and the factored fatigue load is expressed as Muf. The load factor γ is equal to 1.75 [1], and the response from the unfactored permanent load is expressed as Mp. The fatigue live load effect can then be expressed as (Muf − Mp)/γ.
Based on elastic principles and the features of the gross concrete section, the tensile stress fb in the bottom fibres caused by Muf for a rectangular RC section can be calculated using Equation (35):
f b = M u f I g h 2
where Ig is the inertia moment of the gross concrete section shown in Equation (18). h is the depth of the rectangular section.
When the sum of stresses fb due to Muf is tensile and exceeds 0.095 f c and the section cracks under Muf, fatigue stress verification should be specified [1,3]. This is the first constraint of the fatigue limit state and is expressed as Equation (36):
0.095 f c f b = M u f I g h 2
Equation (36) is an expression of the fatigue limit state stress form, which cannot be directly compared with the strength and the service limit state. Based on the UFR concept, we can transform Equation (36) into Equation (37) in the form of the bending moment Muf:
M u f 1 = 0.19 I g f c h M u f
where Muf1 represents the bending moment limit used to determine whether the section cracks under Muf.
If Equation (36) is satisfied, the fatigue stress check of the fatigue limit state is expressed as Equation (38):
γ ( Δ f ) ( Δ F ) T H
where γ = 1.75 is the load factor specified in AASHTO [1] for the fatigue load. Δf is the live load stress range caused by the passage of the unfactored fatigue load. (ΔF)TH is the constant-amplitude fatigue stress limit of the reinforcements.
Equation (38) gives the second constraint of the fatigue limit state. It is also an expression of the stress form, which cannot be directly compared with the strength and the service limit state. To facilitate the comparison and simplify the design calculation of the B-regions of RC flexural members, the concept of the UFR is used to convert the second constraint to an expression of the flexural moment form as follows.
Since Equation (36) is satisfied to conduct the fatigue stress check, the properties of the transformed cracked section should be used, as shown in Figure 5:
The stress distributions in the compression area and reinforcements are shown. fc represents the concrete stress in the compression area, and fs represents the stress of the tensile reinforcement in this state [23,28,42].
Based on elastic principles and the transformed section in Figure 5, the stress range caused by fatigue live load (MufMp)/γ in the tensile reinforcement is calculated using Equation (39):
Δ f = f s = n M u f M p γ I c r ( d s c 1 )
where c1 is the actual depth of the compression area of the transformed section and calculated in Equation (22).
F)TH in Equation (38) is the constant-amplitude fatigue threshold for normal straight reinforcement. It is calculated using Equation (40) with ksi units according to AASHTO [1]:
( Δ F ) T H = ( 26 22 f min f y ) k s i
where fy is the specified minimum yield strength of reinforcement, ranging from 60.0 to 100 ksi in the study [1]. The yield strengths of normally used reinforcements [3] are listed in Table 4.
fmin in Equation (40) is the minimum load stress caused by the factored fatigue load combined with the unfactored permanent loads, namely, Muf. Its expression is shown in Equation (41) based on elastic principles and the transformed section in Figure 5:
f min = n M u f I c r ( d s c 1 )
where the inertia moment Icr of the cracked section is calculated using Equation (23).
If Equation (41) is substituted into Equation (40), we obtain Equation (42) with MPa units:
( Δ F ) T H = 7 [ 26 22 n M u f f y I c r ( d s c 1 ) ]
If Equations (39) and (42) are substituted into Equation (38), Equation (43) is obtained:
γ n M u f M p γ I c r ( d s c 1 ) 7 [ 26 22 n M u f f y I c r ( d s c 1 ) ]
If Equation (43) is solved for Muf by meeting the requirement of Equation (37), the value ranges of Muf are determined using Equation (44):
M u f 1 M u f 182 I c r f y n ( d s c 1 ) ( 154 + f y ) + f y M p 154 + f y
Equation (44) provides the maximum moment that the section can resist in the fatigue limit state. According to the UFR concept, the maximum moment here is the UFR of the fatigue limit state under the fatigue stress constraints, Equations (36) and (38). Namely, the UFR Mrf of the fatigue limit state is shown as Equation (45):
M r f = 182 I c r f y n ( d s c 1 ) ( 154 + f y ) + f y M p 154 + f y

3. Construction of Practical Operation of the UFRD Method

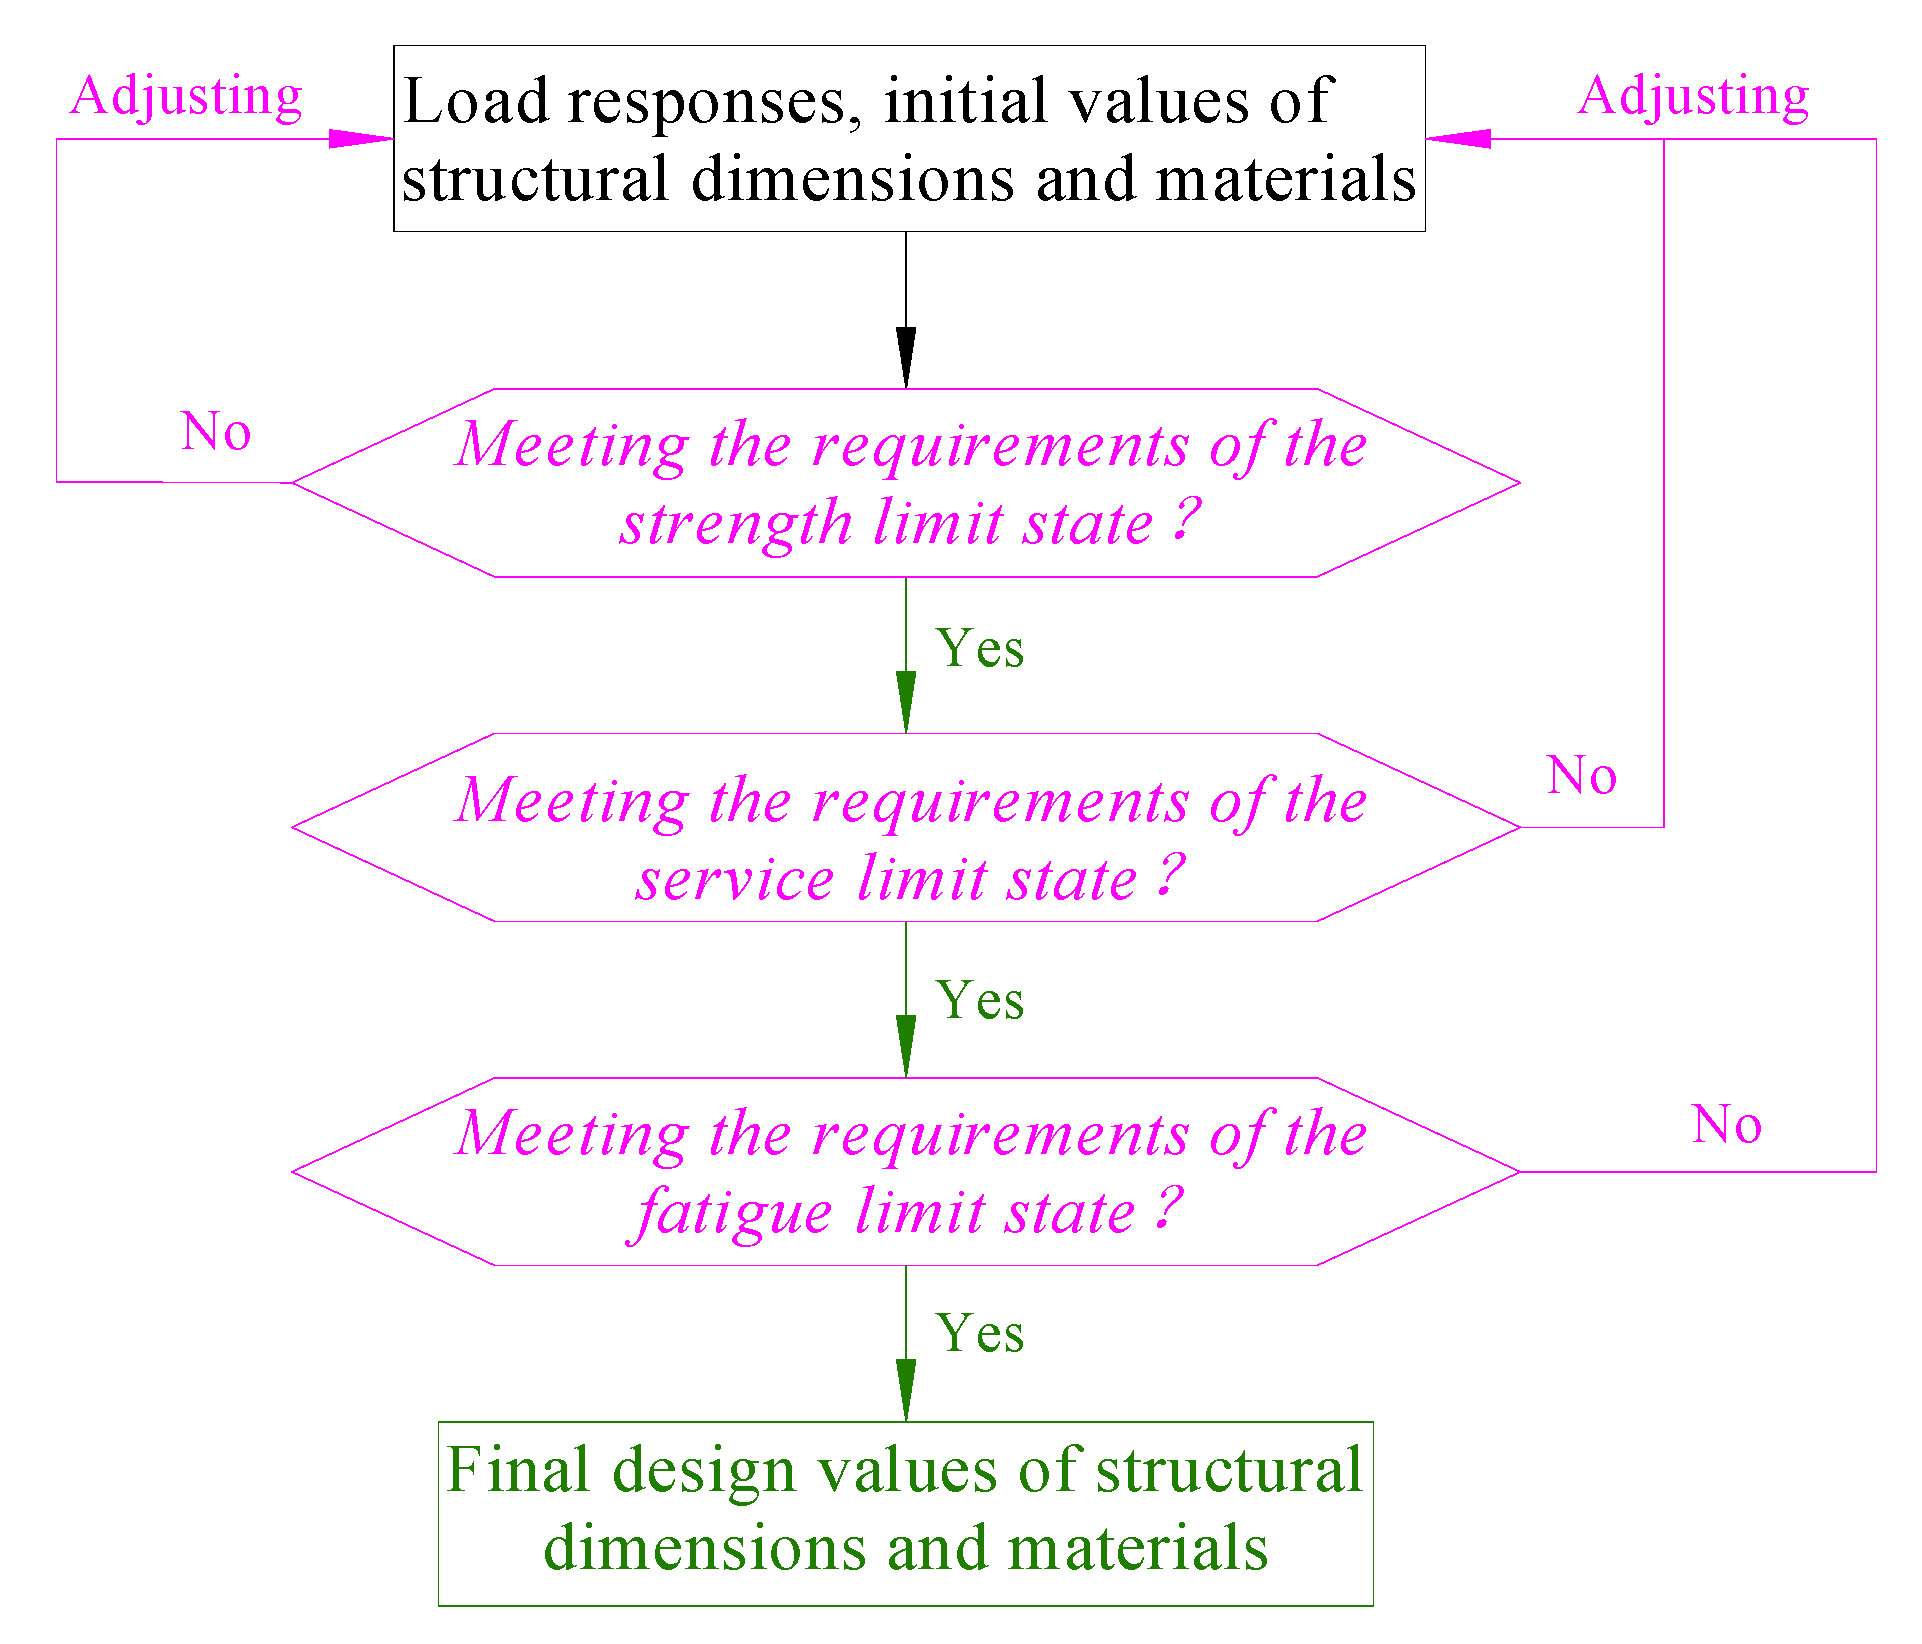
3.1. Analyses of the LRFD Method Calculation Procedure

In RC flexural component B-regions engineering design practices based on the LRFD method, the initial values of geometric parameters such as b, h, dc, and ds and material parameters such as f′c and fy are always provided based on engineering experience. By synthesizing Equations (2)–(5) to calculate As and selecting the actual and possible type and number of reinforcing steel bars as economical as possible, the initial value of As can be determined. This content was introduced in Section 2.3.1.
After determining the initial values of the design parameters, the design focus is on the verifications and comparisons of resistances and load responses for every limit state, while the force effects are provided by structural analyses. The applied analytical calculation procedure of the LRFD method for the design of the B-regions of RC flexural members is shown in Figure 6:
Figure 6 shows that the calculation procedure of the LRFD method has three process blocks: direct load responses, indirect load responses, and calculations for checking. The analytical calculations need at least five steps, which are relatively complex and cumbersome. It also further reveals that the three limit states are essentially isolated and separated when the B-regions of RC members are designed based on the LRFD method.

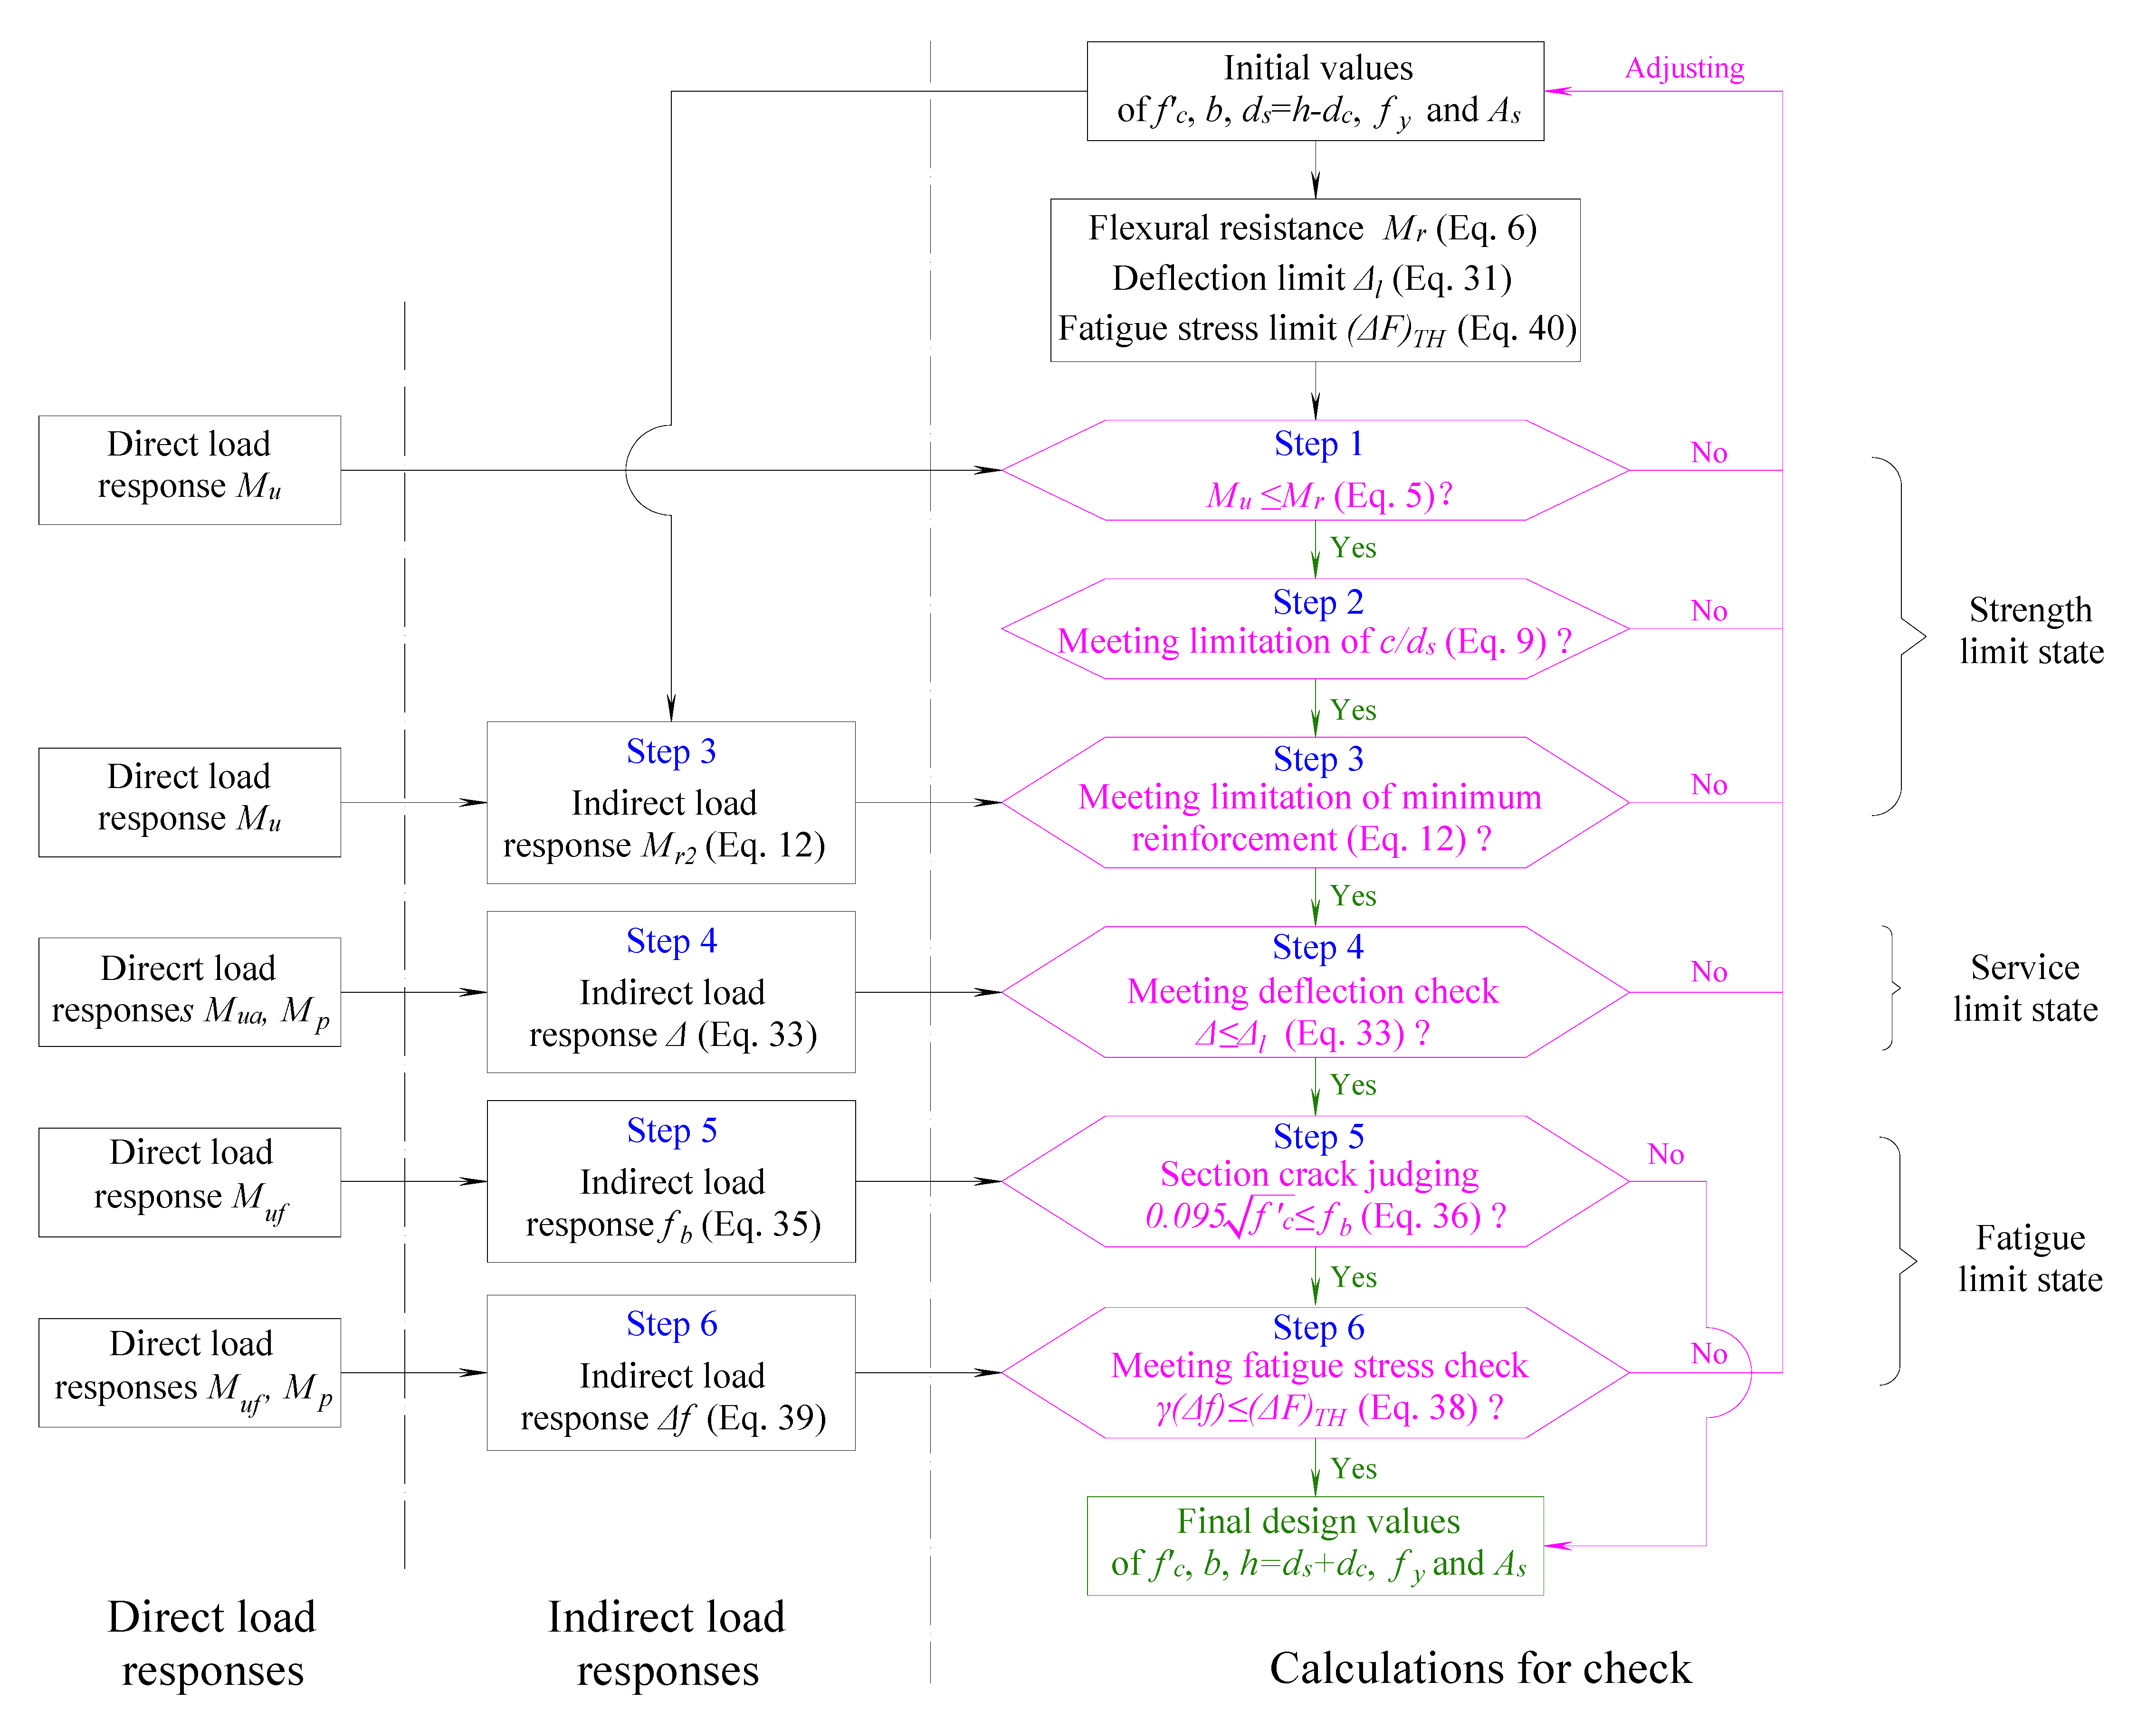
3.2. Construction of Calculation Procedure of the UFRD Method

According to the studies in Section 2.3.2, the UFR of the service limit state, Mra, in Equation (34) is deduced under the deflection constraint, Equation (33). It is the maximum flexural moment that the structure can bear in this state under the deformation constraint. Therefore, the deflection check of the LRFD method, Equation (33), can be replaced by the UFR verification of Equation (46):
M u a M r a
Equation (46) is evidently a compatible verification that implicitly includes the deflection check. This means that if the UFR check of Equation (46) is met, then the deflection verification of Equation (33) is automatically and implicitly satisfied.
Similarly, the UFR of the fatigue limit state, Mrf, in Equation (45) is derived from the fatigue stress constraints, Equations (36) and (38). It is the maximum bending moment that the member can bear in the state under these constraints. Therefore, the fatigue stress checks of the LRFD method, Equations (36) and (38), can be essentially converted to the UFR verification of Equation (47) according to the studies in Section 2.3.3:
M u f 1 M u f M r f
which is also a compatible verification that implicitly includes the fatigue stress check. If the UFR check of Equation (47) is met, then the fatigue stress verification of Equations (36) and (38) are automatically and implicitly satisfied.
The flexural resistance, Mr, in the strength limit state represents the ultimate bearing capacity of the B-regions of RC flexural members, which should not be exceeded in any state. Therefore, the UFRs of the other two states should be smaller than the flexural resistance of the strength limit state. Then, the UFR verifications of the other two states, Equations (46) and (47), are transformed into Equation (48):
{ M u a min ( M r a , M r ) M u f 1 M u f min ( M r f , M r )
Subsequently, the UFR checks of the strength limit state, Equation (15), are combined with Equation (48). Then, the UFR verifications that unify all three limit states are shown in Equation (49):
{ M u 0 M r M u a min ( M r a , M r ) M u f 1 M u f min ( M r f , M r )
which perfectly replaces different types of checks of different limit states. Different limit states achieve perfect unity of form and substance when B-regions of RC flexural members are designed based on Equation (49). This is the basic function of the UFRD method.
The UFRD method design procedure is illustrated in Figure 7 based on the above analyses:
Figure 7 shows that the UFRD method only undergoes a one-step UFR check to realize the analytical calculations for the design of the B-regions of RC flexural members. Different limit states are conveniently unified to the UFR.

4. UFRE Frame

To facilitate direct and quantitative comparisons between different limit states, a unified flexural resistance evaluation (UFRE) frame is established based on the UFRD method as follows.
An index, the relative flexural resistance ratio, is defined by taking the flexural resistance Mr as a reference value. This is the ratio of the UFR corresponding to each limit state divided by the flexural capacity Mr of the strength limit state. The relative flexural resistance ratio U of the strength limit state is then calculated using Equation (50):
U = M r M r = 1
The relative flexural resistance ratios corresponding to the service and fatigue limit states are computed using Equation (51):
{ U 1 = M r a M r U 2 = M r f M r
The relative strength reservation ratios corresponding to the service and fatigue limit states are defined as Equation (52):
{ 1 U 1 = 1 M r a M r 1 U 2 = 1 M r f M u
which represent the relative strength storage of the two limit states. If the relative strength reservation ratio of a limit state is larger, then the limit state has a larger strength storage relative to the strength limit state, and the structure in this state is safer.
In this way, different limit states can be conveniently compared and evaluated.

5. Case Studies

5.1. Introduction of Cases

Three cases from engineering practice, C1, C2, and C3 are presented to show the applications of the UFRD method and the UFRE frame to the design of the B-regions of RC flexural members. The structural types of the three cases are simply supported beams with known initial values of the design parameters listed in Table 5, which are preliminarily determined based on the process presented in Section 2.3.1, and which include the dimensional parameters and the material parameters of concrete and reinforcement. The load responses are presented in Table 5 after the structural analyses. Other parameters related to the flexural design are supplied based on AASHTO requirements [1].

5.2. Process and Results of the LRFD Method

Case C1 is chosen to show the application of the LRFD method to design the B-regions of an RC structure. The detailed calculation process is displayed in Table 6 based on the corresponding theoretical formulas in Section 2.3 and the application procedure in Figure 6.
Table 6 shows that the design verifications of the three limit states are all satisfied for case C1. The flexural resistance check of the strength limit state, the deformation check of the service limit state, and the fatigue stress verification of the fatigue limit state are separately verified and passed. Therefore, the final values of the design parameters are the same as the initial values.
However, the LRFD method undergoes six calculation steps to realize the design process of the B-regions in the C1 case. The method is relatively complex and inefficient. Different limit states are separated and isolated when using the LRFD method so that they cannot be quantitatively compared with each other.

5.3. Process and Results of the UFRD Method

The UFRD method is applied to design the B-regions of case C1. The calculation process and results are listed in Table 7 based on the theoretical derivation in Section 2.3 and the operational procedure in Figure 7.
It can be seen from Table 7 that the one-step UFR verification is passed to meet AASHTO requirements [1] using the UFRD method to design the B-regions of case C1. Passing the UFR checks using the UFRD method implies that the flexural resistance check of the strength limit state, the deformation check of the service limit state, and the fatigue stress verification of the fatigue limit state are automatically and implicitly passed.
The UFRD method check results are the same as those of the LRFD method. However, the one-step calculation process of the UFRD method is simpler than the six steps of the LRFD method in Table 6. Table 7 also shows that the strength, service, and fatigue limit states are conveniently unified by the UFR.

5.4. UFRE of Cases

By applying the proposed UFRD method to the design of the B-regions of case C1, different limit states can be clearly unified to the UFR, which can be seen in Table 7. To directly and quantitatively differentiate, compare, and evaluate these limit states, the proposed UFRE framework is applied to the cases in Table 5.
First, the UFRs of the different limit states are calculated and summarized in Table 8 for the three cases based on the UFRD method.
Second, the relative flexural resistance ratios of the three limit states are listed in Table 9 for the cases using Equations (50) and (51).
Third, the relative strength reservation ratios of the service and fatigue limit states are displayed in Table 10 for the cases using Equation (52).
Table 8, Table 9 and Table 10 show that different limit states can be directly and quantitatively differentiated, compared, and evaluated using the proposed UFRE framework.
Table 9 also shows that the relative flexural resistance ratio of the service limit state is relatively large for case C2. The corresponding relative strength reservation ratio is relatively small, only 0.10, as shown in Table 10. This means that the relative strength storage of the service limit state in case C2 is relatively small. The potential and insufficient risks of flexural resistance for the service limit state in case C2 are exposed using the UFRE framework. It may be beneficial to increase the stiffness in this case to improve the corresponding strength storage of the service limit state, if possible. Then, the deflection verification of this state in case C2 will be not only guaranteed but also safer in flexural capacity. In addition, other limit states of these cases have more rational strength storage with values of the relative strength reservation ratio in the range of 0.15 to 0.32.

5.5. Comparisons and Discussion

After the LRFD method, the UFRD method and the UFRE frame are applied to the design of the B-regions of the cases in Section 5, comprehensive and detailed comparisons are made as follows between the new method, new frame, and the LRFD method in various respects, which mainly include the quantitative dimension and the qualitative one.
  • Comparing Figure 6 and Figure 7 and Table 6 and Table 7, the one-step verification of the UFRD method is much simpler than the at-least-five-step verification of the LRFD method. The analytical calculation efficiency of the UFRD method is higher, requiring at most 20% of the calculation steps of the LRFD method;
  • Figure 7 and Table 7 show that all limit states can be clearly unified to the UFR by applying the UFRD method to design the B-regions of RC flexural members. However, Figure 6 and Table 6 show that different limit states are separated and isolated using the LRFD method for the design;
  • Table 8, Table 9 and Table 10 show that different limit states can be directly and quantitatively compared using the proposed UFRD method and the UFRE framework in the design. However, it is difficult for the LRFD method to realize this function based on the application results shown in Table 6;
  • Table 9 and Table 10 show that the UFRE frame can help expose some potential and insufficient risks of flexural resistance for some limit states, such as the only 10% relative strength reservation of one case. However, the LRFD method cannot realize this function based on the application results shown in Table 6;
  • Comparing Figure 7 and Figure 6 and Table 7 and Table 6, the design based on the UFRD method almost crosses over the calculation process of the indirect load responses, which is necessary for the LRFD method. The UFRD method realizes direct checks between the flexural resistances (UFRs) and flexural moment responses for all the limit states. It is more direct and intuitive than the LRFD method;
  • From the basic principles of the UFRD method and its application results to cases, when the UFR checks (Equation (49)) of the UFRD method are passed, the flexural resistance check of the strength limit state, the deformation check of the service limit state, and the fatigue stress verification of the fatigue limit state in the LRFD method are automatically and implicitly passed. The UFR checks of the UFRD method implicitly contain the flexural resistance check of the strength limit state, the deformation check of the service limit state, and the fatigue stress verification of the fatigue limit state from the LRFD method. Therefore, the UFRD method has better compatibility and integration.
The above comparison results are summarized in Table 11 from two dimensions: quantitative one and qualitative one.
Table 11 shows that the UFRD method and the UFRE frame have some critical advantages for the design of the B-regions of RC flexural members. By using the UFRD method, structural engineers can design B-regions of RC flexural members more efficiently, requiring at most 20% of the calculation steps of the LRFD method. This is the main quantitative advantage of the UFRD method. The proposed method and frame can realize some practical and qualitative functions: realizing unification of different limit states, realizing direct and quantitative comparison of different limit states, helping expose some potential and insufficient risks of flexural resistance for some limit states, realizing better directness and intuitiveness of design, and realizing better compatibility and integration of design. These functions cannot be realized by the LRFD method. The functions help structural engineers understand the design outcomes better. Thus, the innovative UFRD method and UFRE frame supplement and develop the LRFD method to some degree.

6. Conclusions

At present, the LRFD method is commonly adopted for the design of the B-regions of RC flexural components. It includes a flexural resistance check of the strength limit state, a deformation check of the service limit state, and a fatigue stress verification of the fatigue limit state under normal circumstances.
Focusing on some deficiencies of the LRFD method, this paper proposes an innovative UFRD method and a UFRE frame for the design of the B-regions of RC flexural members. The main contents include the construction of the UFR principles, formula derivation for the UFRD method, the operation procedure to facilitate its usage, and the UFRE framework to compare limit states. Then, the UFRD method and the UFRE frame are applied to some cases. Comprehensive and detailed comparisons are made between the new method, the new frame, and the LRFD method in various respects.
Based on this study, the main conclusions are summarized as follows from quantitative and qualitative dimensions:
  • The UFRD method is much simpler than the LRFD method. It has higher analytical calculation efficiency, requiring at most 20% of the calculation steps of the LRFD method;
  • All limit states can be clearly unified to the UFR by applying the UFRD method to design the B-regions of RC flexural members;
  • Different limit states can be directly and quantitatively compared with each other using the proposed UFRD method and the UFRE framework;
  • The UFRE frame can help expose some potential and insufficient risks of flexural resistance for some limit states, such as the only 10% relative strength reservation of one case;
  • The UFRD method is more direct and intuitive than the LRFD method;
  • The UFRD method has better compatibility and integration than the LRFD method;
  • The innovative UFRD method and UFRE frame can overcome some deficiencies of the LRFD method and have comparative advantages in quantitative and practical qualitative aspects. They supplement and develop the LRFD method to some degree.

Author Contributions

Conceptualization, Y.Z.; methodology, Y.Z.; software, Y.L.; validation, Y.L.; formal analysis, Y.L.; investigation, Y.L.; resources, B.K.; data curation, B.K.; writing—original draft preparation, B.K.; writing—review and editing, M.C.; visualization, M.C.; supervision, Y.Z.; project administration, Y.Z.; funding acquisition, Y.Z. All authors have read and agreed to the published version of the manuscript.

Funding

This research was funded by the NSFC, grant number 51348010, and the NSF of Hunan Province, grant number 14JJ3109.

Data Availability Statement

The authors confirm that the data supporting the findings of this study are available within the article.

Conflicts of Interest

The authors declare no conflict of interest.

References

  1. AASHTO. AASHTO LRFD Bridge Design Specifications, 9th ed.; AASHTO: Washington, DC, USA, 2020; pp. 5.24–5.55. [Google Scholar]
  2. Taly, N. Highway Bridge Superstructure Engineering LRFD Approaches to Design and Analysis, 1st ed.; CRC Press: Boca Raton, FL, USA, 2015; pp. 449–692. [Google Scholar]
  3. Kim, C.-S.; Park, H.-G.; Truong, G.T. Column-to-beam flexural strength ratio for performance-based design of RC moment frames. J. Build. Eng. 2022, 46, 103645. [Google Scholar] [CrossRef]
  4. Xie, L.; Sha, H.; Chong, X.; Hou, L.; Guo, Y. Performance-based seismic design of RC frame structure with energy dissipative cladding panel connection system using equivalent energy design procedure. J. Build. Eng. 2022, 59, 105076. [Google Scholar] [CrossRef]
  5. Ma, L.L.; Wu, H.; Fang, Q. A unified performance-based blast-resistant design approach for RC beams/columns. Int. J. Impact Eng. 2023, 173, 104459. [Google Scholar] [CrossRef]
  6. Cai, G.; Tsavdaridis, K.D.; Larbi, A.S.; Purnell, P. A simplified design approach for predicting the flexural behavior of TRM-strengthened RC beams under cyclic loads. Constr. Build. Mater. 2021, 285, 122799. [Google Scholar] [CrossRef]
  7. Yuan, F.; Wu, Y.-F. Application of RC flexural theorems for member design under elevated temperature. Eng. Struct. 2019, 201, 109762. [Google Scholar] [CrossRef]
  8. Zhang, G.; Han, Q.; Xu, K.; Song, Y.; Li, J.; He, W. Numerical analysis and design method of UHPC grouted RC column-footing socket joints. Eng. Struct. 2023, 281, 115755. [Google Scholar] [CrossRef]
  9. Martinelli, P.; Colombo, M.; Ravasini, S.; Belletti, B. Application of an analytical method for the design for robustness of RC flat slab buildings. Eng. Struct. 2022, 258, 114117. [Google Scholar] [CrossRef]
  10. Carpinteri, A.; Corrado, M. Upper and lower bounds for structural design of RC members with ductile response. Eng. Struct. 2011, 33, 3432–3441. [Google Scholar] [CrossRef]
  11. Ahmad, S.; Sharif, A.M.; Al-Osta, M.A.; Al-Zahrani, M.M.; Sharif, A.M.; Al-Huri, M.A. Flexural performance of pre-damaged RC beams strengthened with different configurations of UHPFRC layer–experimental and analytical investigation. Structures 2023, 48, 1772–1787. [Google Scholar] [CrossRef]
  12. Zhang, Y.; Huang, S.; Liu, Y.; Fan, W.; Shao, X. Flexural behavior of damaged RC beams strengthened with prestressed UHPC layer. Eng. Structures 2023, 283, 115806. [Google Scholar] [CrossRef]
  13. Zhang, Y.; Wang, H.; Qin, Y.; Huang, S.; Fan, W. Experimental and analytical studies on the flexural behavior of steel plate-UHPC composite strengthened RC beams. Eng. Struct. 2023, 283, 115834. [Google Scholar] [CrossRef]
  14. Peng, G.; Niu, D.; Hu, X.; Zhong, S.; Huang, D. Experimental and theoretical study on the flexural behavior of RC beams strengthened with cementitious grout. Eng. Struct. 2022, 267, 114713. [Google Scholar] [CrossRef]
  15. Cheng, S.; He, H.; Cheng, Y.; Sun, H. Flexural behavior of RC beams enhanced with carbon textile and fiber reinforced concrete. J. Build. Eng. 2023, 70, 106454. [Google Scholar] [CrossRef]
  16. Cheng, S.; He, H.; Chen, Y.; Lan, B. Capacity prediction and crack width calculation of RC beam strengthened with textile and modified concrete. J. Build. Eng. 2023, 69, 106261. [Google Scholar] [CrossRef]
  17. Yu, X.-Y.; Jiang, C.; Zhang, W.-P. Failure mode-based calculation method for bending bearing capacities of corroded RC beams strengthened with CFRP sheets. Eng. Struct. 2022, 271, 114946. [Google Scholar] [CrossRef]
  18. Li, G.; Zhang, A.; Jin, W.; Xiao, Y.; Li, H. A new flexural strength model of CFRP-strengthened RC beams with intermediate crack induced debonding failure. Compos. Struct. 2023, 308, 116681. [Google Scholar] [CrossRef]
  19. Golewski, G.L. The Specificity of shaping and execution of monolithic pocket foundations (PF) in hall buildings. Buildings 2022, 12, 192. [Google Scholar] [CrossRef]
  20. Hemamathi, L.; Jaya, K.P. Behaviour of precast column foundation connection under reverse cyclic loading. Adv. Civ. Eng. 2021, 2021, 6677007. [Google Scholar] [CrossRef]
  21. Wang, S.; Sinha, R. Life cycle assessment of different prefabricated rates for building construction. Buildings 2021, 11, 552. [Google Scholar] [CrossRef]
  22. Shvab’yuk, V.I.; Krutii, Y.S.; Sur’yaninov, M.G. Investigation of the free vibrations of bar elements with variable parameters using the direct integration method. Strength Mater. 2016, 48, 384–393. [Google Scholar] [CrossRef]
  23. Yuan, Y.; Han, W.; Li, G.; Guo, Q.; Xu, X.; Sun, J. Probabilistic limit state assessment of concrete bridges considering non-stationary factors. Eng. Mech. 2020, 37, 167–178. [Google Scholar] [CrossRef]
  24. Zhang, Z.; Su, K.; Wu, H. Reinforcement design for hydraulic concrete structures based on American specification. Eng. J. Wuhan Univ. 2015, 48, 627–633. [Google Scholar] [CrossRef]
  25. Rashid, M.A.; Mansur, M.A. Reinforced high-strength concrete beams in flexure. ACI Struct. J. 2005, 102, 462–471. [Google Scholar]
  26. Giduquio, M.B.; Cheng, M.Y.; Wibowo, L.S.B. High-strength flexural reinforcement in reinforced concrete flexural members under monotonic loading. ACI Struct. J. 2015, 112, 793–803. [Google Scholar] [CrossRef]
  27. Rizkalla, S.; Mirmiran, A.; Zia, P.; Russell, H.; Mast, R. Application of the LRFD Bridge Design Specifications to High-Strength Structural Concrete: Flexure and Compression Provisions; Transportation Research Board: Washington, DC, USA, 2007; pp. 20–148. [Google Scholar]
  28. DeJong, S.J.; MacDougall, C. Fatigue behavior of MMFX corrosion-resistant reinforcing steel. In Proceedings of the 7th International Conference on Short and Medium Span Bridges, Montreal, QC, Canada, 23–25 August 2006. [Google Scholar]
  29. Zhou, K.J.H.; Ho, J.C.M.; Su, R.K.L. Flexural strength and deformability design of reinforced concrete beams. Procedia Eng. 2011, 14, 1399–1407. [Google Scholar] [CrossRef]
  30. Chen, C.; Yang, X.; Pan, W.; Kuang, H. Experimental research on flexural performance of reinforced concrete beams with 600 MPa steel bars. Build. Struct. 2018, 48, 1–4. [Google Scholar] [CrossRef]
  31. Xie, P.; Yu, X.; Mu, Z. Study on flexural capacity of plain circular reinforced concrete beams. Highw. Transp. Inn. Mong. 2018, 4, 18–24. [Google Scholar] [CrossRef]
  32. Tantipidok, P.; Kobayashi, C.; Matsumoto, K.; Watanabe, K.; Niwa, J. Proposed predictive equation for diagonal compressive capacity of reinforced concrete beams. J. Jpn. Soc. Civ. Eng. 2011, 67, 535–548. [Google Scholar] [CrossRef]
  33. Sarkar, S.; Adwan, O.; Munday, J.G. High strength concrete: An investigation of the flexural behavior of high strength RC beams. Struct. Eng. 1997, 75, 115–121. [Google Scholar]
  34. Ashour, S.A. Effect of compressive strength and tensile reinforcement ratio on flexural behavior of high-strength concrete beams. Eng. Struct. 2000, 22, 413–423. [Google Scholar] [CrossRef]
  35. Hong, K.N.; Lee, B.H.; Kim, J.H.; Jang, I.Y.; Han, S.H. Flexural behavior of RC beams strengthened with composite beam. Int. J. Phys. Sci. 2011, 6, 2205–2218. [Google Scholar] [CrossRef]
  36. Pam, H.J.; Kwan, A.K.; Islam, M.S. Flexural strength and ductility of reinforced normal and high-strength concrete beams. Struct. Build. 2001, 146, 381–389. [Google Scholar] [CrossRef]
  37. Bernardo, L.F.A.; Lopes, S.M.R. Neutral axis depth versus flexural ductility in high-strength concrete beams. J. Struct. Eng. 2004, 130, 452–459. [Google Scholar] [CrossRef]
  38. Zheng, Y.; Xiao, X.; Chen, M.; Wang, Y.; Song, Y. Theoretical development of a stiffness decomposition method for calculating the displacement of complex bending structures. J. Eng. Res. 2021, 9, 112–146. [Google Scholar] [CrossRef]
  39. Zheng, Y.; Wang, Y.; Song, Y. Principle and application of stiffness-distribution diagram multiplication method. Mech. Eng. 2019, 41, 227–232. [Google Scholar] [CrossRef]
  40. Zheng, Y.; Wang, Y.; Xiao, X. Variable substitution integral method and its application for solving displacement curves of framed structures. Int. J. Ind. Syst. Eng. 2021, 38, 346–361. [Google Scholar] [CrossRef]
  41. Wu, X.; Song, Y.; He, S. Analysis of long-term deflection of reinforced concrete beams. J. Traffic Transp. Eng. 2001, 1, 48–50. [Google Scholar]
  42. Deng, L.; Wang, W.; He, X. Optimization and application of fatigue design Based on AASHTO code. China J. Highw. Transp. 2017, 30, 40–48. [Google Scholar] [CrossRef]
Figure 1. B- and D-regions of a flexural member.
Buildings 13 01138 g001
Figure 2. LRFD method conventional analytical calculation procedure.
Buildings 13 01138 g002
Figure 3. Flexural strength design concept of a singly reinforced rectangular section: (a) beam cross section; (b) strain distribution; (c) actual parabolic stress distribution in concrete; (d) equivalent rectangular stress distribution.
Buildings 13 01138 g003
Figure 4. Transformed section of a cracked RC section: (a) cracked section; (b) transformed section.
Buildings 13 01138 g004
Figure 5. Stress analysis of a transformed section in the fatigue limit state: (a) transformed section; (b) stress.
Buildings 13 01138 g005
Figure 6. Applied analytical calculation procedure of the LRFD method.
Buildings 13 01138 g006
Figure 7. UFRD method operational procedure.
Buildings 13 01138 g007
Table 1. Strain limits for reinforcements.
Strength Grade of Reinforcement, ksi
(Type with MPa Units)
Compression Control Strain Limit, εcl
60 (Grade 420)0.0020
75 (Grade 520)0.0028
80 (Grade 520)0.0030
Table 2. Modification factor γ3.
Strength Grade of Reinforcement, ksi (Type with MPa Units)γ3
60 (Grade 420)0.67
75 (Grade 520)0.75
80 (Grade 520)0.76
Table 3. Values of the modular ratio n.
Ranges of f′c, ksiRanges of f′c, MPan
2.4 ≤ f′c ≤ 2.9 16.8 ≤ f′c ≤ 20.310
2.9 ≤ f′c ≤ 3.620.3 ≤ f′c ≤ 25.29
3.6 ≤ f′c ≤ 4.625.2 ≤ f′c ≤ 32.28
4.6 ≤ f′c ≤ 6.032.2 ≤ f′c ≤ 42.07
6.0 ≤ f′c42.0 ≤ f′c6
Table 4. Yield strengths of normally used reinforcements.
Strength Grade of Reinforcement, ksi (Type with MPa Units)fy, MPa
60 (Grade 420)420
75 (Grade 520)520
80 (Grade 560)560
Table 5. Known initial values of the design parameters.
ParameterC1C2C3
Dimensionb (mm)200250200
h (mm)500700420
dc (mm)484045
ds = hdc (mm)452660375
L (m)6.57.25.0
Concretef′c (MPa) (Class 4000)282828
fr (MPa) (Class 4000)3.363.363.36
Ec (MPa) (Equation (20))25,48025,48025,480
ReinforcementAs (mm2)645
(1 No. 9 steel bar)
1290
(2 No. 9 steel bars)
1020
(2 No. 8 steel bars)
fy (MPa) (Grade 420)420420420
εcl (Table 1)0.0020.0020.002
Es (MPa)203,000203,000203,000
Load responseMp (kN·m)26.33127.9236.00
Mu (kN·m)76.66278.9799.25
Mua (kN·m)51.33195.9667.00
Muf (kN·m)70.08246.9990.25
Other parametersα10.850.850.85
β10.850.850.85
ϕ0.900.900.90
γ11.61.61.6
γ3 (Table 2)0.670.670.67
n (Table 3)888
γ1.751.751.75
Table 6. Calculation process using the LRFD method for the design of case C1.
Initial Design Valueb = 200 mm, h = 500 mm, dc = 48 mm, ds = h − dc = 452 mm, L = 6.5 m, f′c = 28 MPa (Class 4000), fy = 420 MPa (Grade 420), As = 645 mm2 (One No. 9 Steel Bar)
Limit StateStepDirect Load ResponseIndirect Load ResponseResistance or LimitVerificationPass?
Strength limit stateStep 1Mu = 76.66 kN·m/Mr = 103.26 kN·m (Equation (6))MuMr
(Equation (5))
Yes
Step 2//c/ds = 0.15 (Equation (9))
(c/ds)max = 0.60 (Equation (9))
c/ds ≤ (c/ds)max
(Equation (9))
Yes
Step 3Mu = 76.66 kN·mMr2 = 30.02 kN·m (Equation (12))Mr = 103.26 kN·m (Equation (6))Mr2Mr
(Equation (12))
Yes
Service limit stateStep 4Mua = 51.33 kN·m
Mp = 26.33 kN·m
Δ = 1.63 mm (Equation (33))Δl = 8.13 mm (Equation (31))Δ ≤ Δl
(Equation (33))
Yes
Fatigue limit stateStep 5Muf = 70.08 kN·mfb = 8.41 MPa (Equation (35)) 0.095 f c = 0.50 MPa (Equation (36)) 0.095 f c f b
(Equation (36))
Yes
Step 6Muf = 70.08 kN·m
Mp = 26.33 kN·m
γf) = 20.73 MPa (Equation (38))f)TH = 24.26 MPa (Equation (40))γf) ≤ (Δf)TH
(Equation (38))
Yes
Final design valueb = 200 mm, h = 500 mm, dc = 48 mm, ds = h − dc = 452 mm, L = 6.5 m, f′c = 28 MPa (Class 4000), fy = 420 MPa (Grade 420), As = 645 mm2 (One No. 9 steel bar)
Table 7. Calculation process using the UFRD method for the design of case C1.
Initial Design Valueb = 200 mm, h = 500 mm, dc = 48 mm, ds = h − dc = 452 mm, L = 6.5 m, f′c = 28 MPa (Class 4000), fy = 420 MPa (Grade 420), As = 645 mm2 (One No. 9 Steel Bar)
Limit StateStepLoad ResponseUFRVerificationPass?
Strength limit stateStep 1Mu0 = 82.10 kN·m (Equation (15))Mr = 103.26 kN·m (Equation (15)) { M u 0 M r M u a min ( M r a , M r ) M u f 1 M u f min ( M r f , M r )
(Equation (49))
Yes
Service limit stateMua = 51.33 kN·mMra = 72.81 kN·m (Equation (34))
Fatigue limit stateMuf = 70.08 kN·mMuf1 = 11.08 kN·m (Equation (37))
Mrf = 70.64 kN·m (Equation (45))
Final design valueb = 200 mm, h = 500 mm, dc = 48 mm, ds = h − dc = 452 mm, L = 6.5 m, f′c = 28 MPa (Class 4000), fy = 420 MPa (Grade 420), As = 645 mm2 (One No. 9 steel bar)
Table 8. UFRs of the cases.
Limit StateUFRC1C2C3
Strength limit stateMr (kN·m) (Equation (15))103.26299.63127.23
Service limit stateMra (kN·m) (Equation (34))72.81269.6278.45
Fatigue limit stateMrf (kN·m) (Equation (45))70.64254.2492.20
Table 9. Relative flexural resistance ratios of the cases.
Limit StateRelative Flexural Resistance RatioC1C2C3
Strength limit stateU111
Service limit stateU10.710.900.62
Fatigue limit stateU20.680.850.72
Buildings 13 01138 i001
Table 10. Relative strength reservation ratios of cases.
Limit StateRelative Strength Reservation RatioC1C2C3
Service limit state1−U10.290.100.38
Fatigue limit state1−U20.320.150.28
Buildings 13 01138 i002
Table 11. Comparisons between the UFRD method, the UFRE frame and the LRFD method.
Comparison DimensionUFRD Method and UFRE Frame ①LRFD Method ②①/②
Quantitative oneNecessary calculation steps1520%
Qualitative oneRealize unification of different limit states?YesNo/
Realize direct and quantitative comparison of different limit states?YesNo/
Help expose some potential and insufficient risks of flexural resistance for some limit states?YesNo/
Realize better directness and intuitiveness of design?Yes//
Realize better compatibility and integration of design?Yes//
① represents the value that may be calculated by the UFRD method and the UFRE frame. ② represents the value that may be calculated by the LRFD method.
Disclaimer/Publisher’s Note: The statements, opinions and data contained in all publications are solely those of the individual author(s) and contributor(s) and not of MDPI and/or the editor(s). MDPI and/or the editor(s) disclaim responsibility for any injury to people or property resulting from any ideas, methods, instructions or products referred to in the content.

