


Optimization of Fresh and Mechanical Characteristics of Carbon Fiber-Reinforced Concrete Composites Using Response Surface Technique

 ,
,  ,
,  ,
,  , and
, and
Abstract
:1. Introduction
2. Background
3. Response Surface Methodology (RSM)
4. Materials and Experimental Methods
4.1. Materials
4.2. RSM and Mix Proportioning
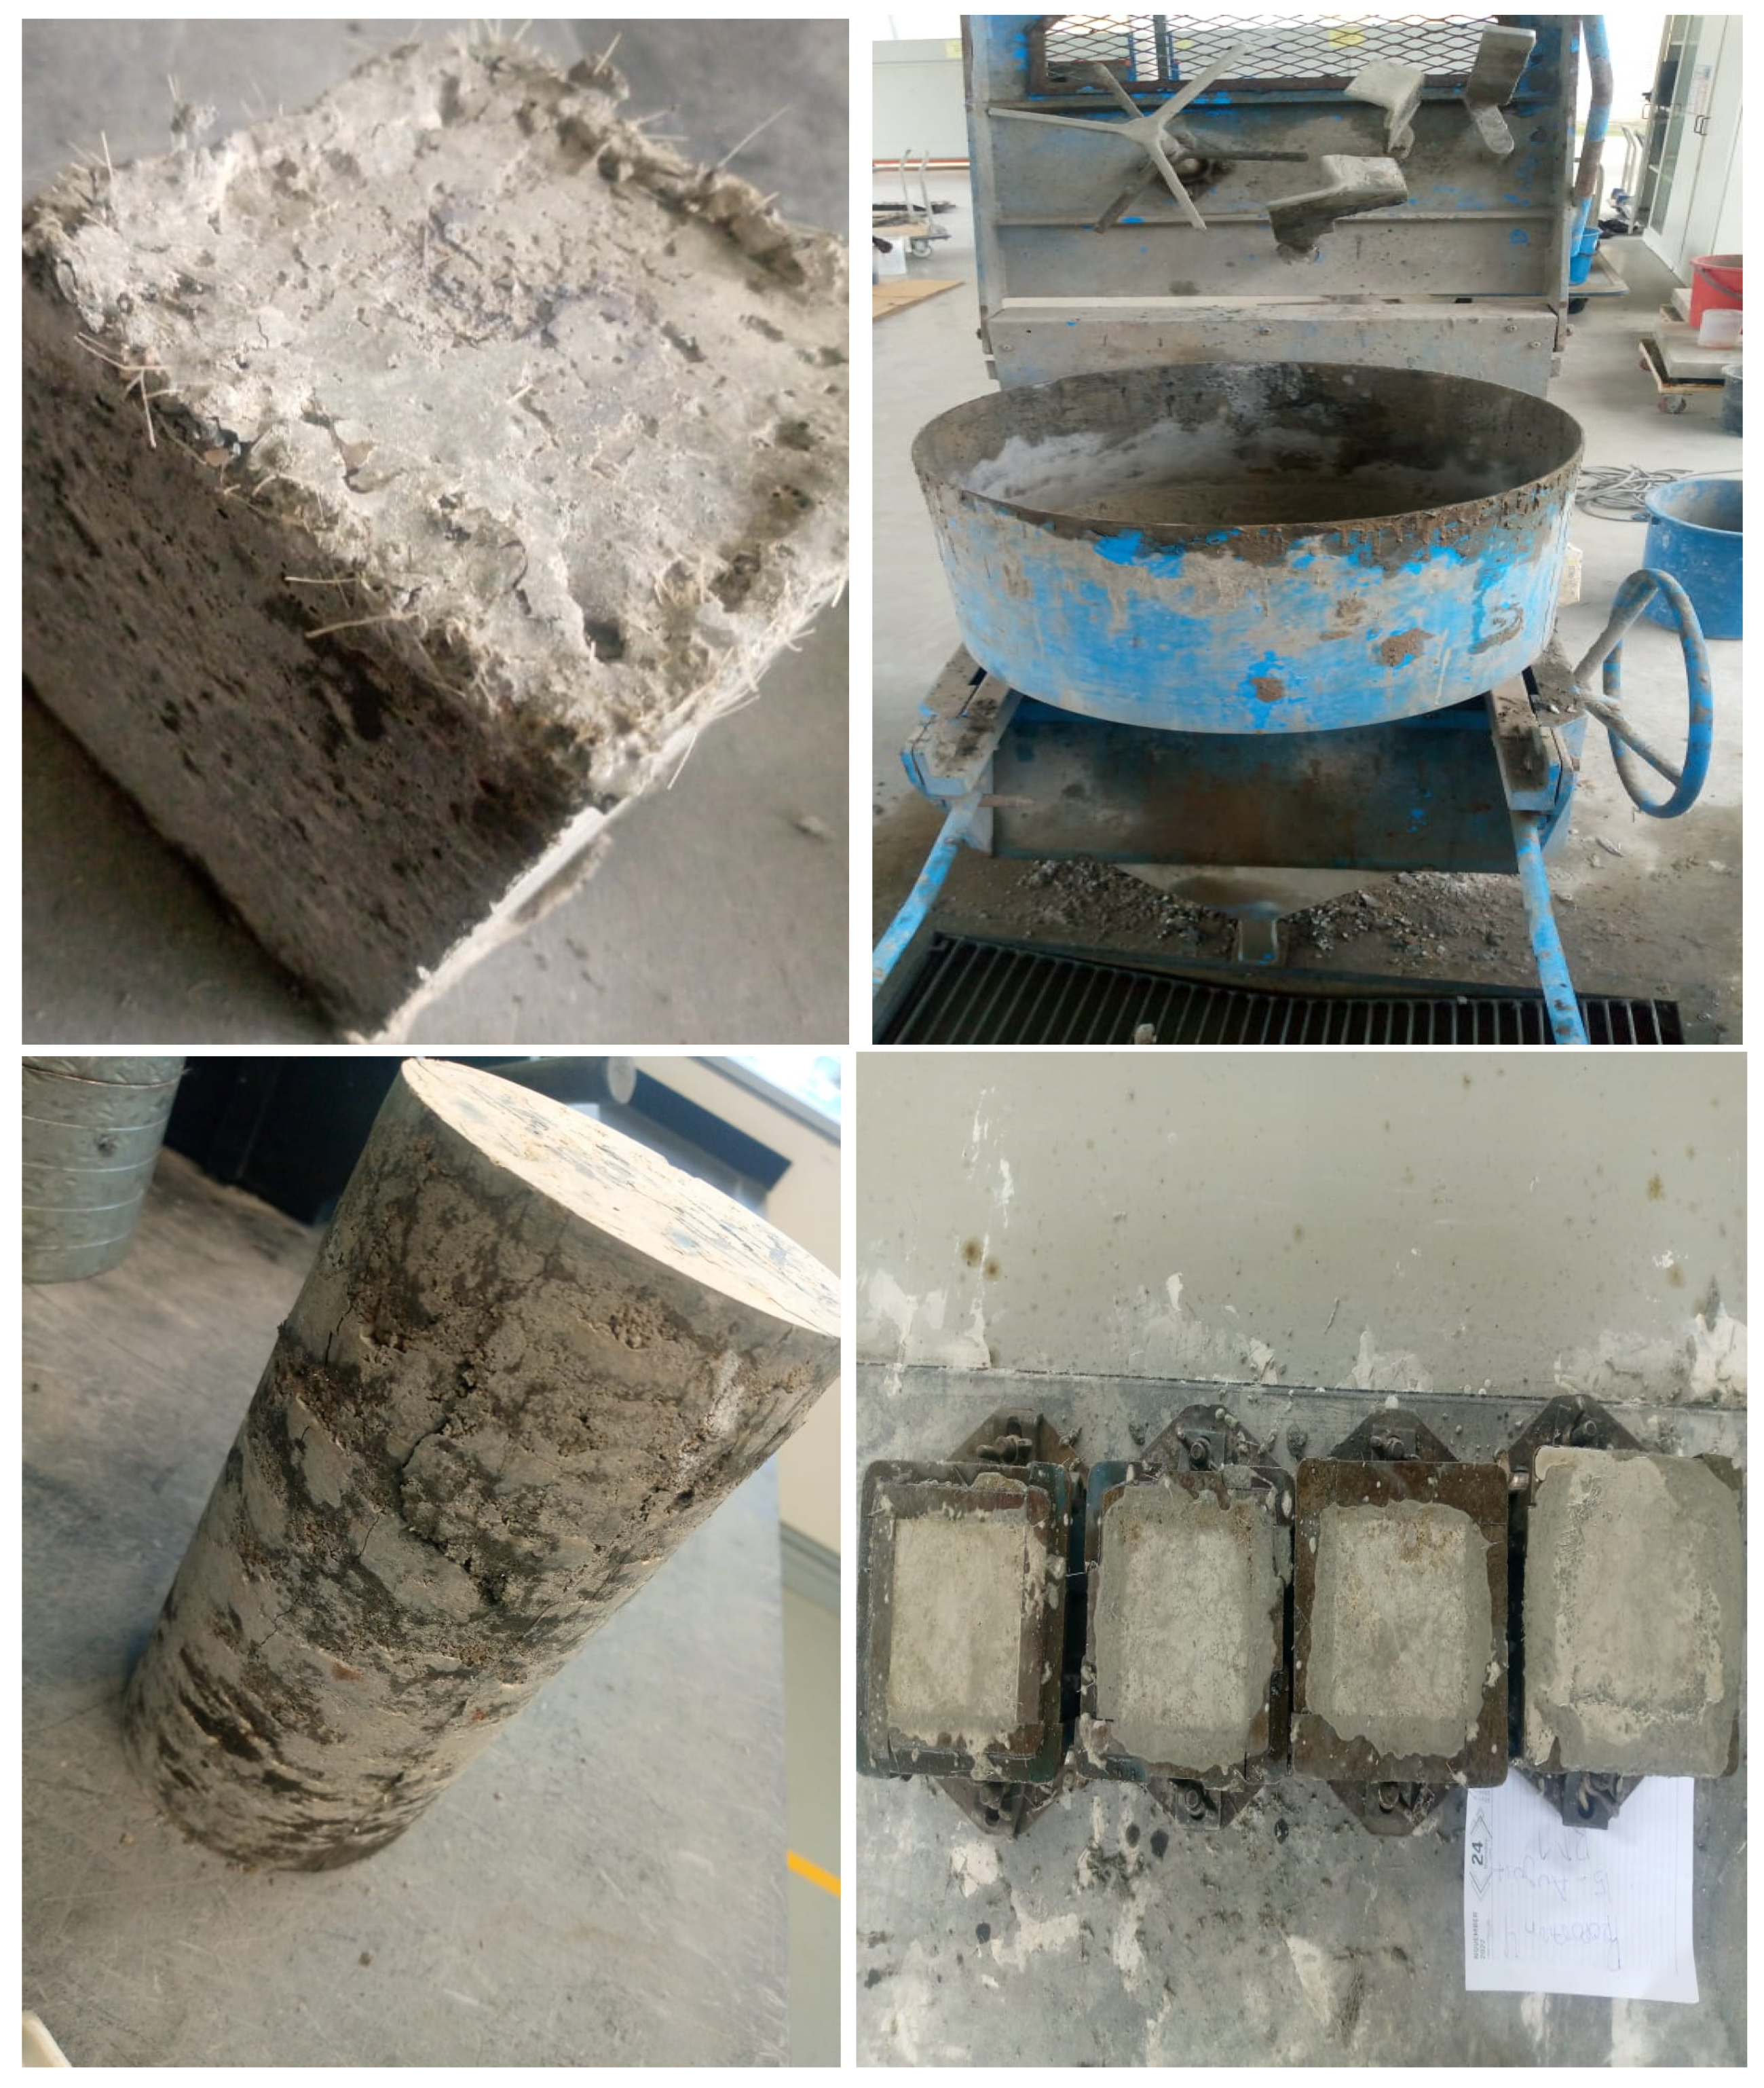
4.3. Preparations of Samples
5. Results and Discussion
5.1. Fresh Characteristics Examination
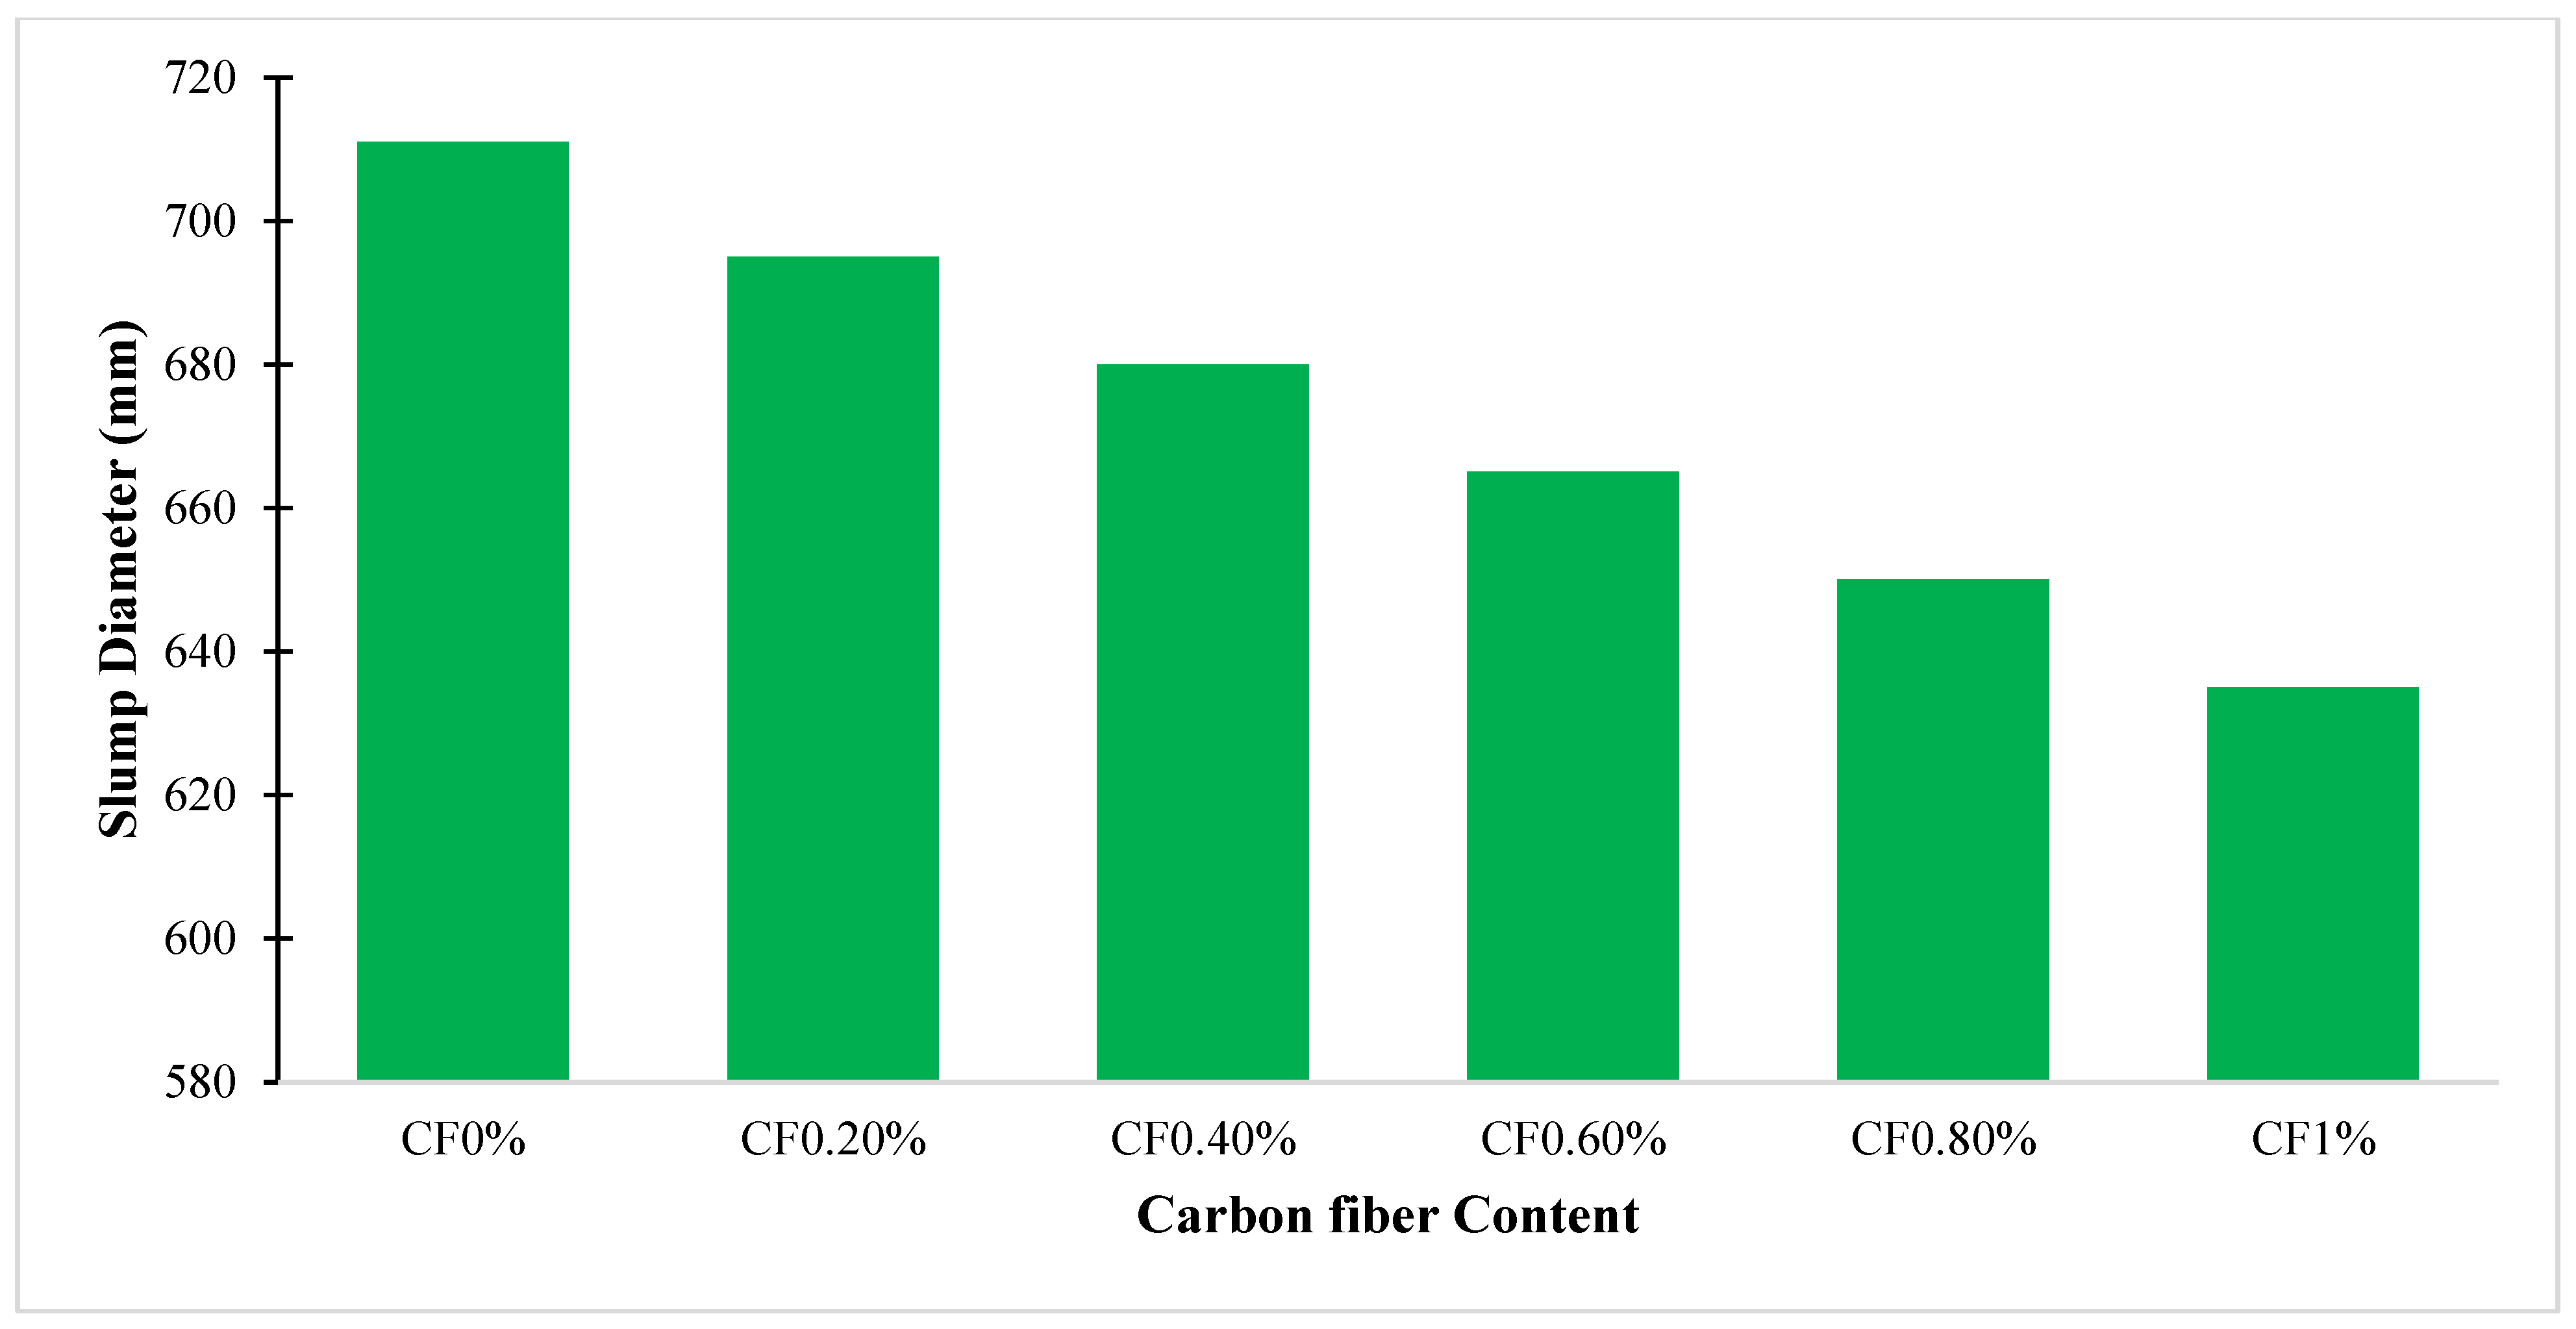
5.1.1. Slump Flow-Test
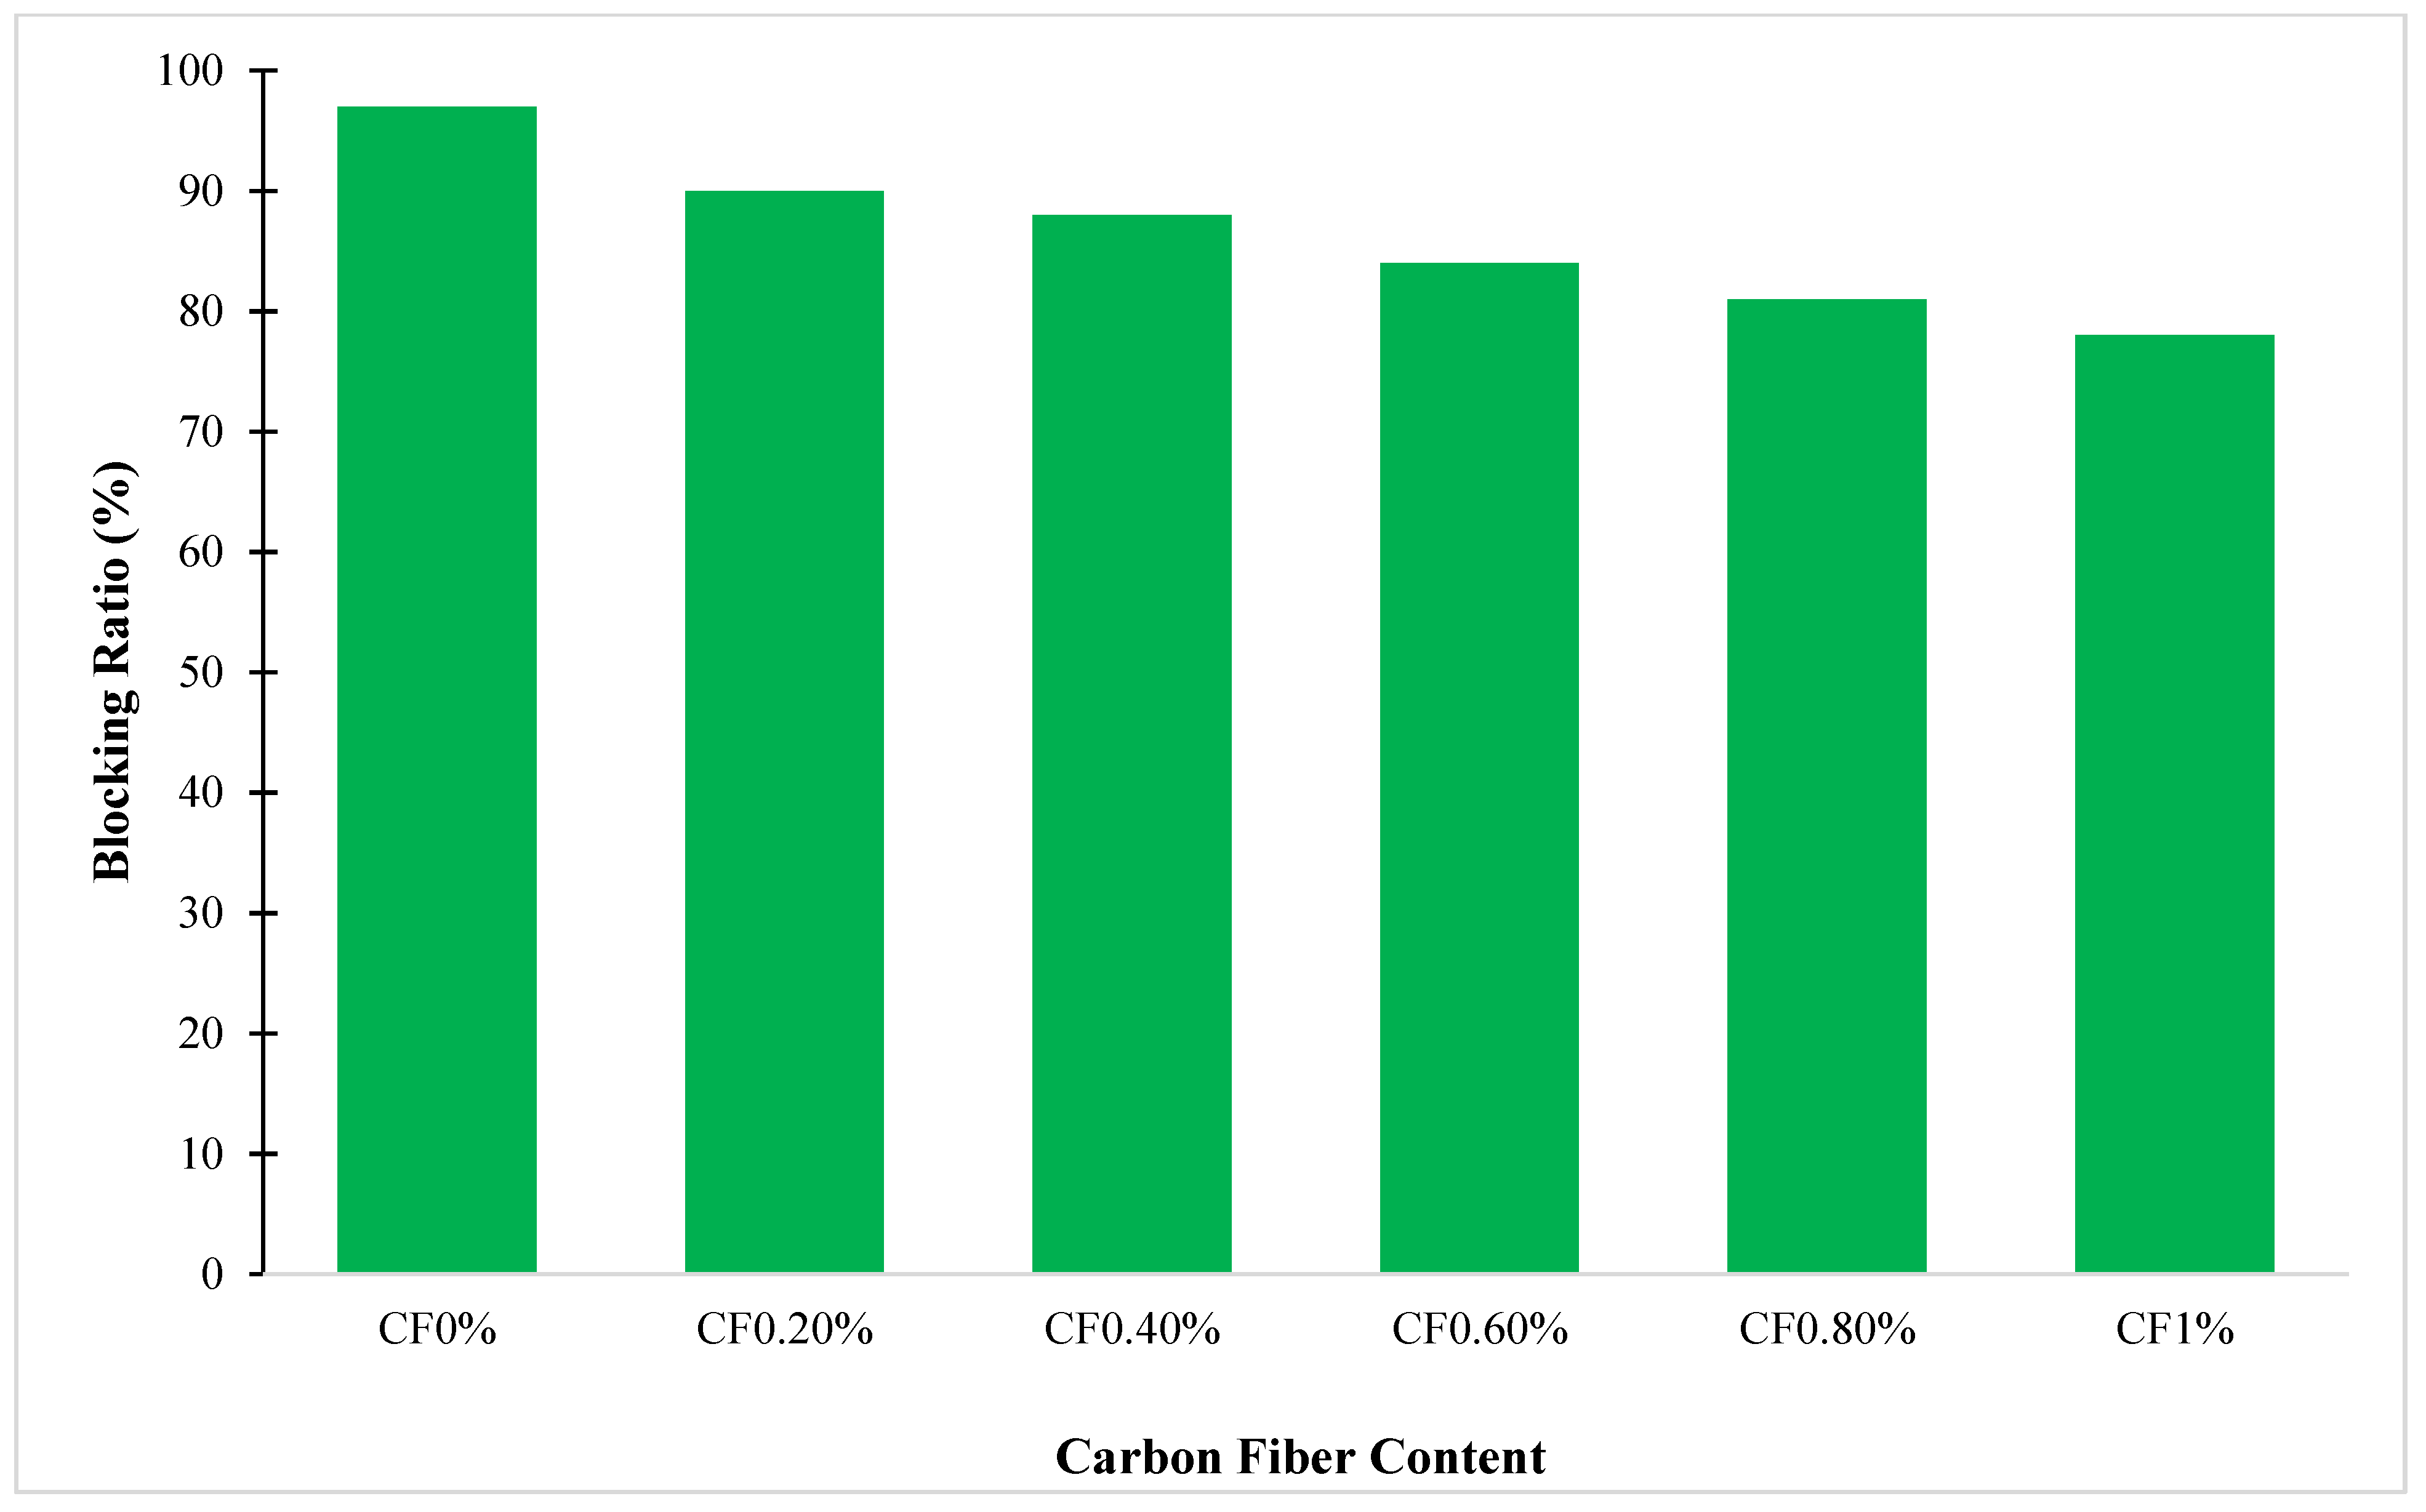
5.1.2. L-Box Test
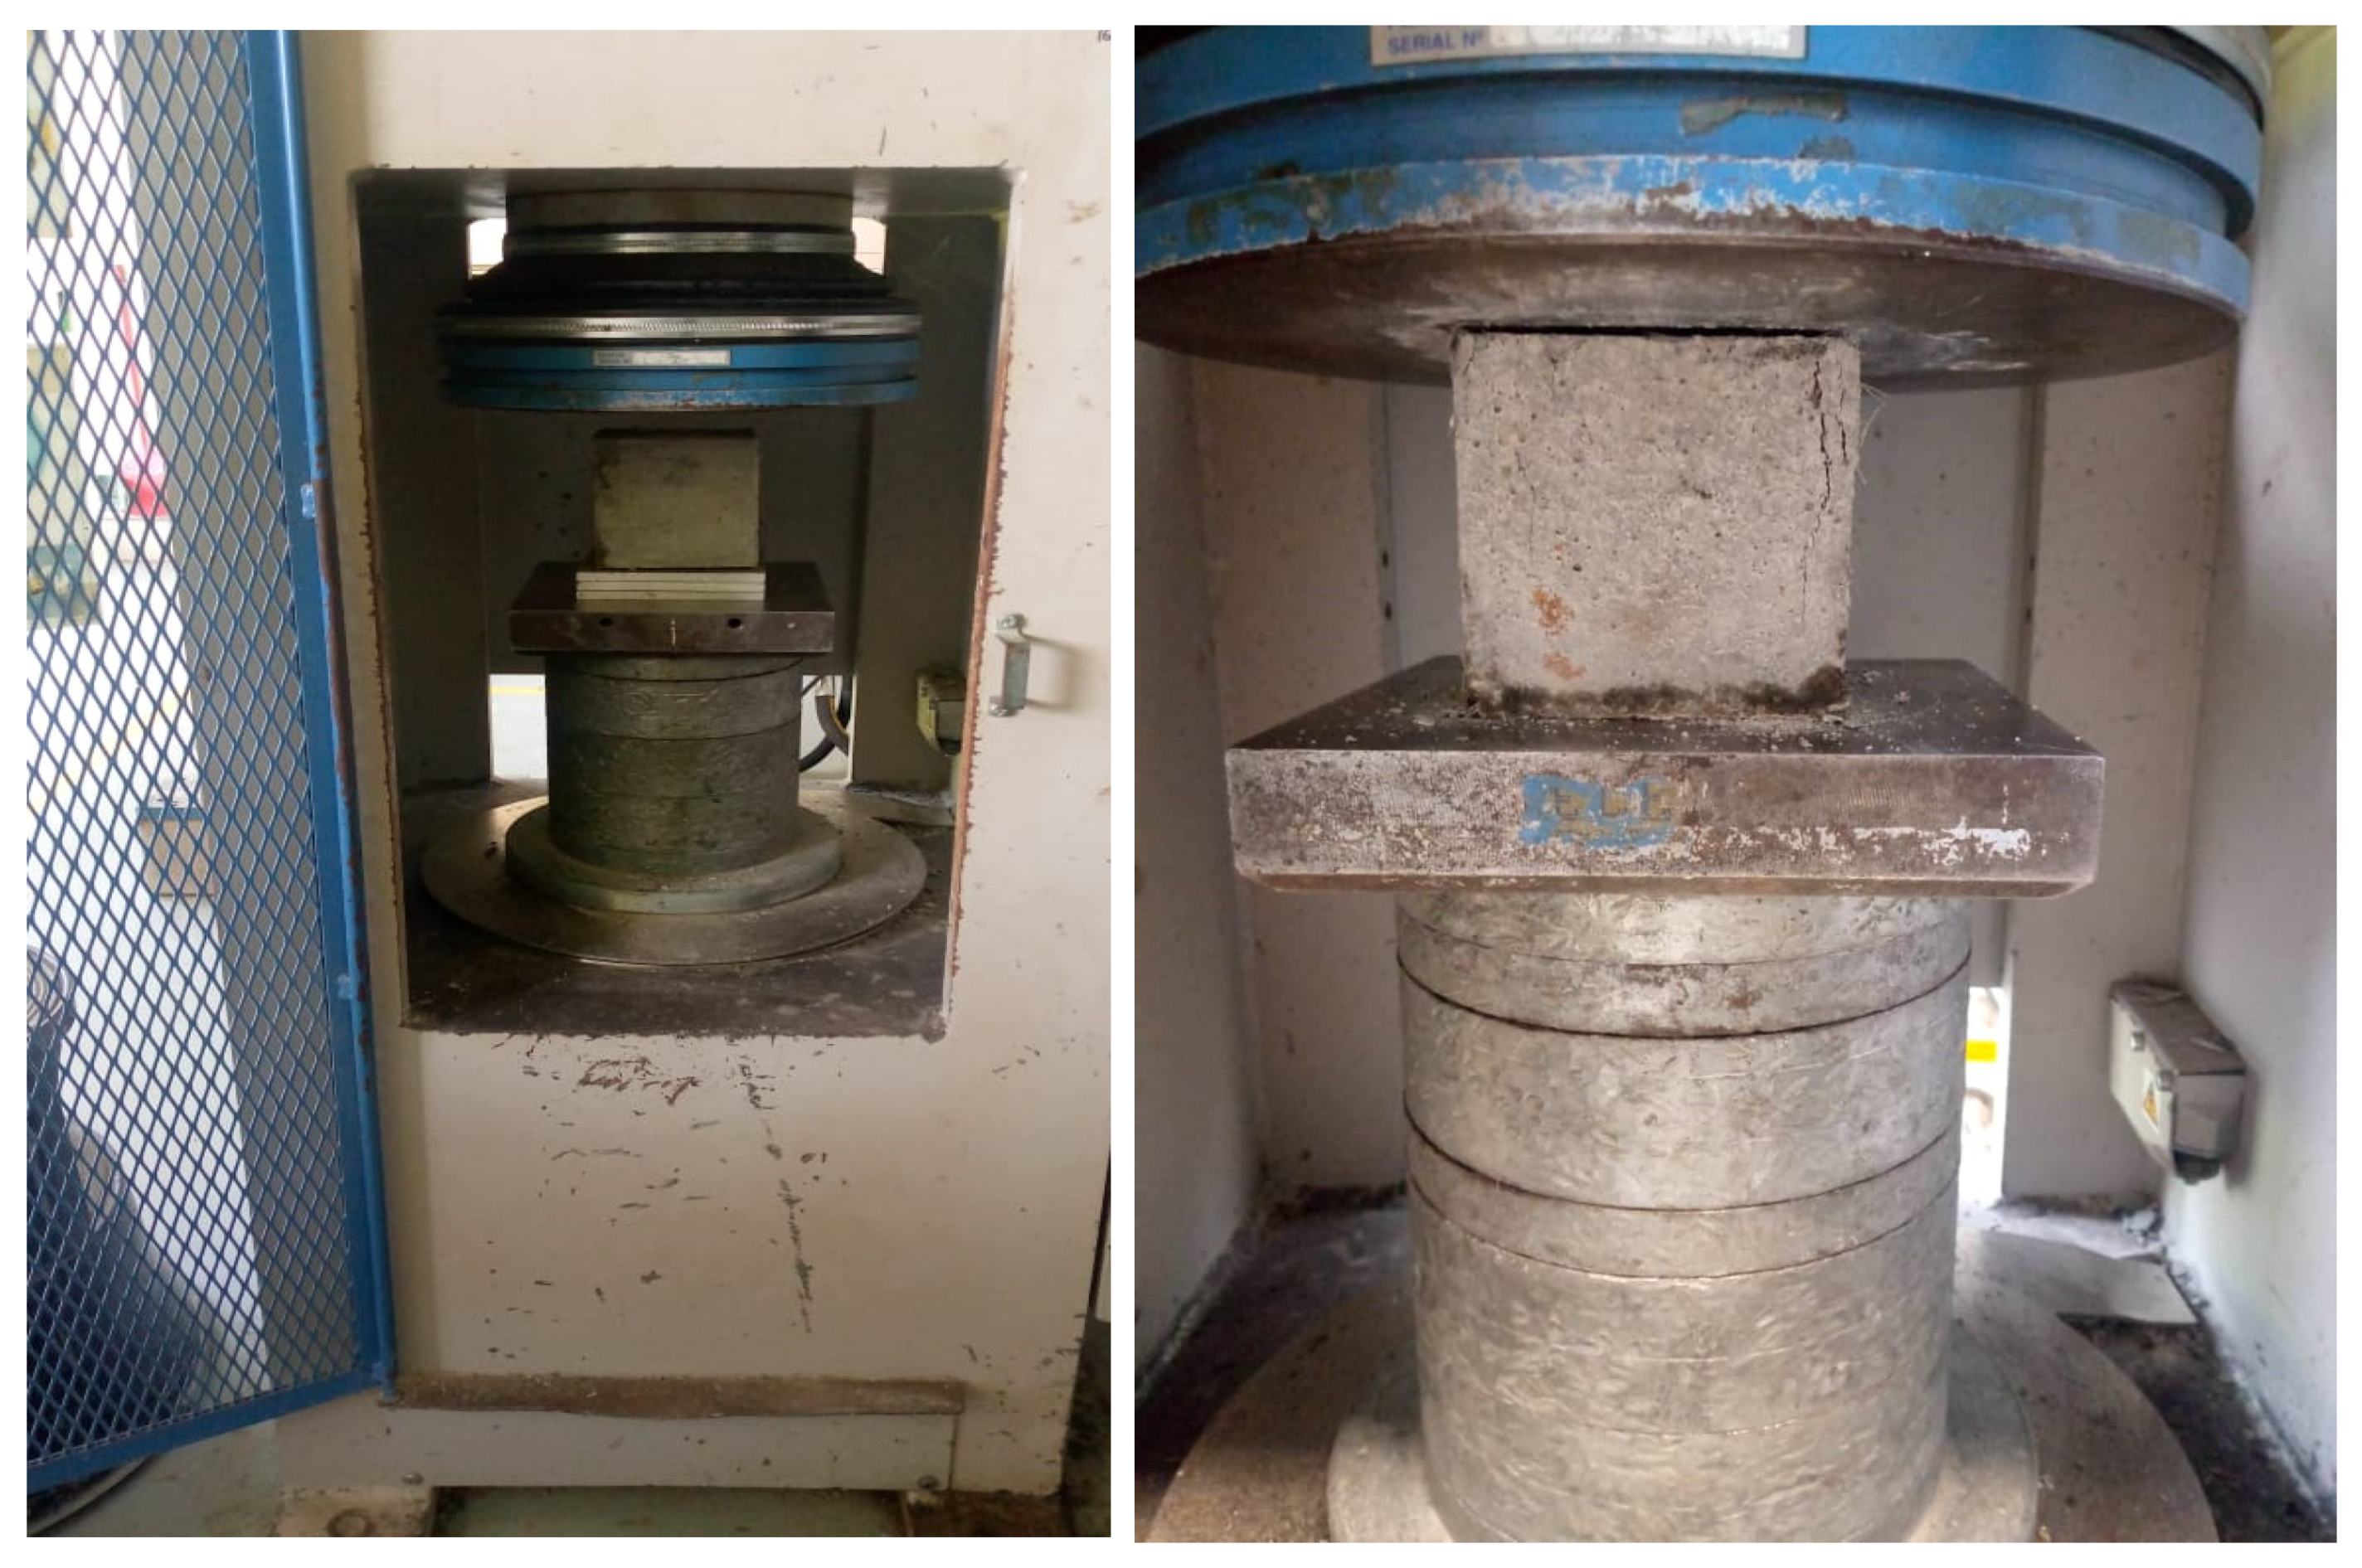
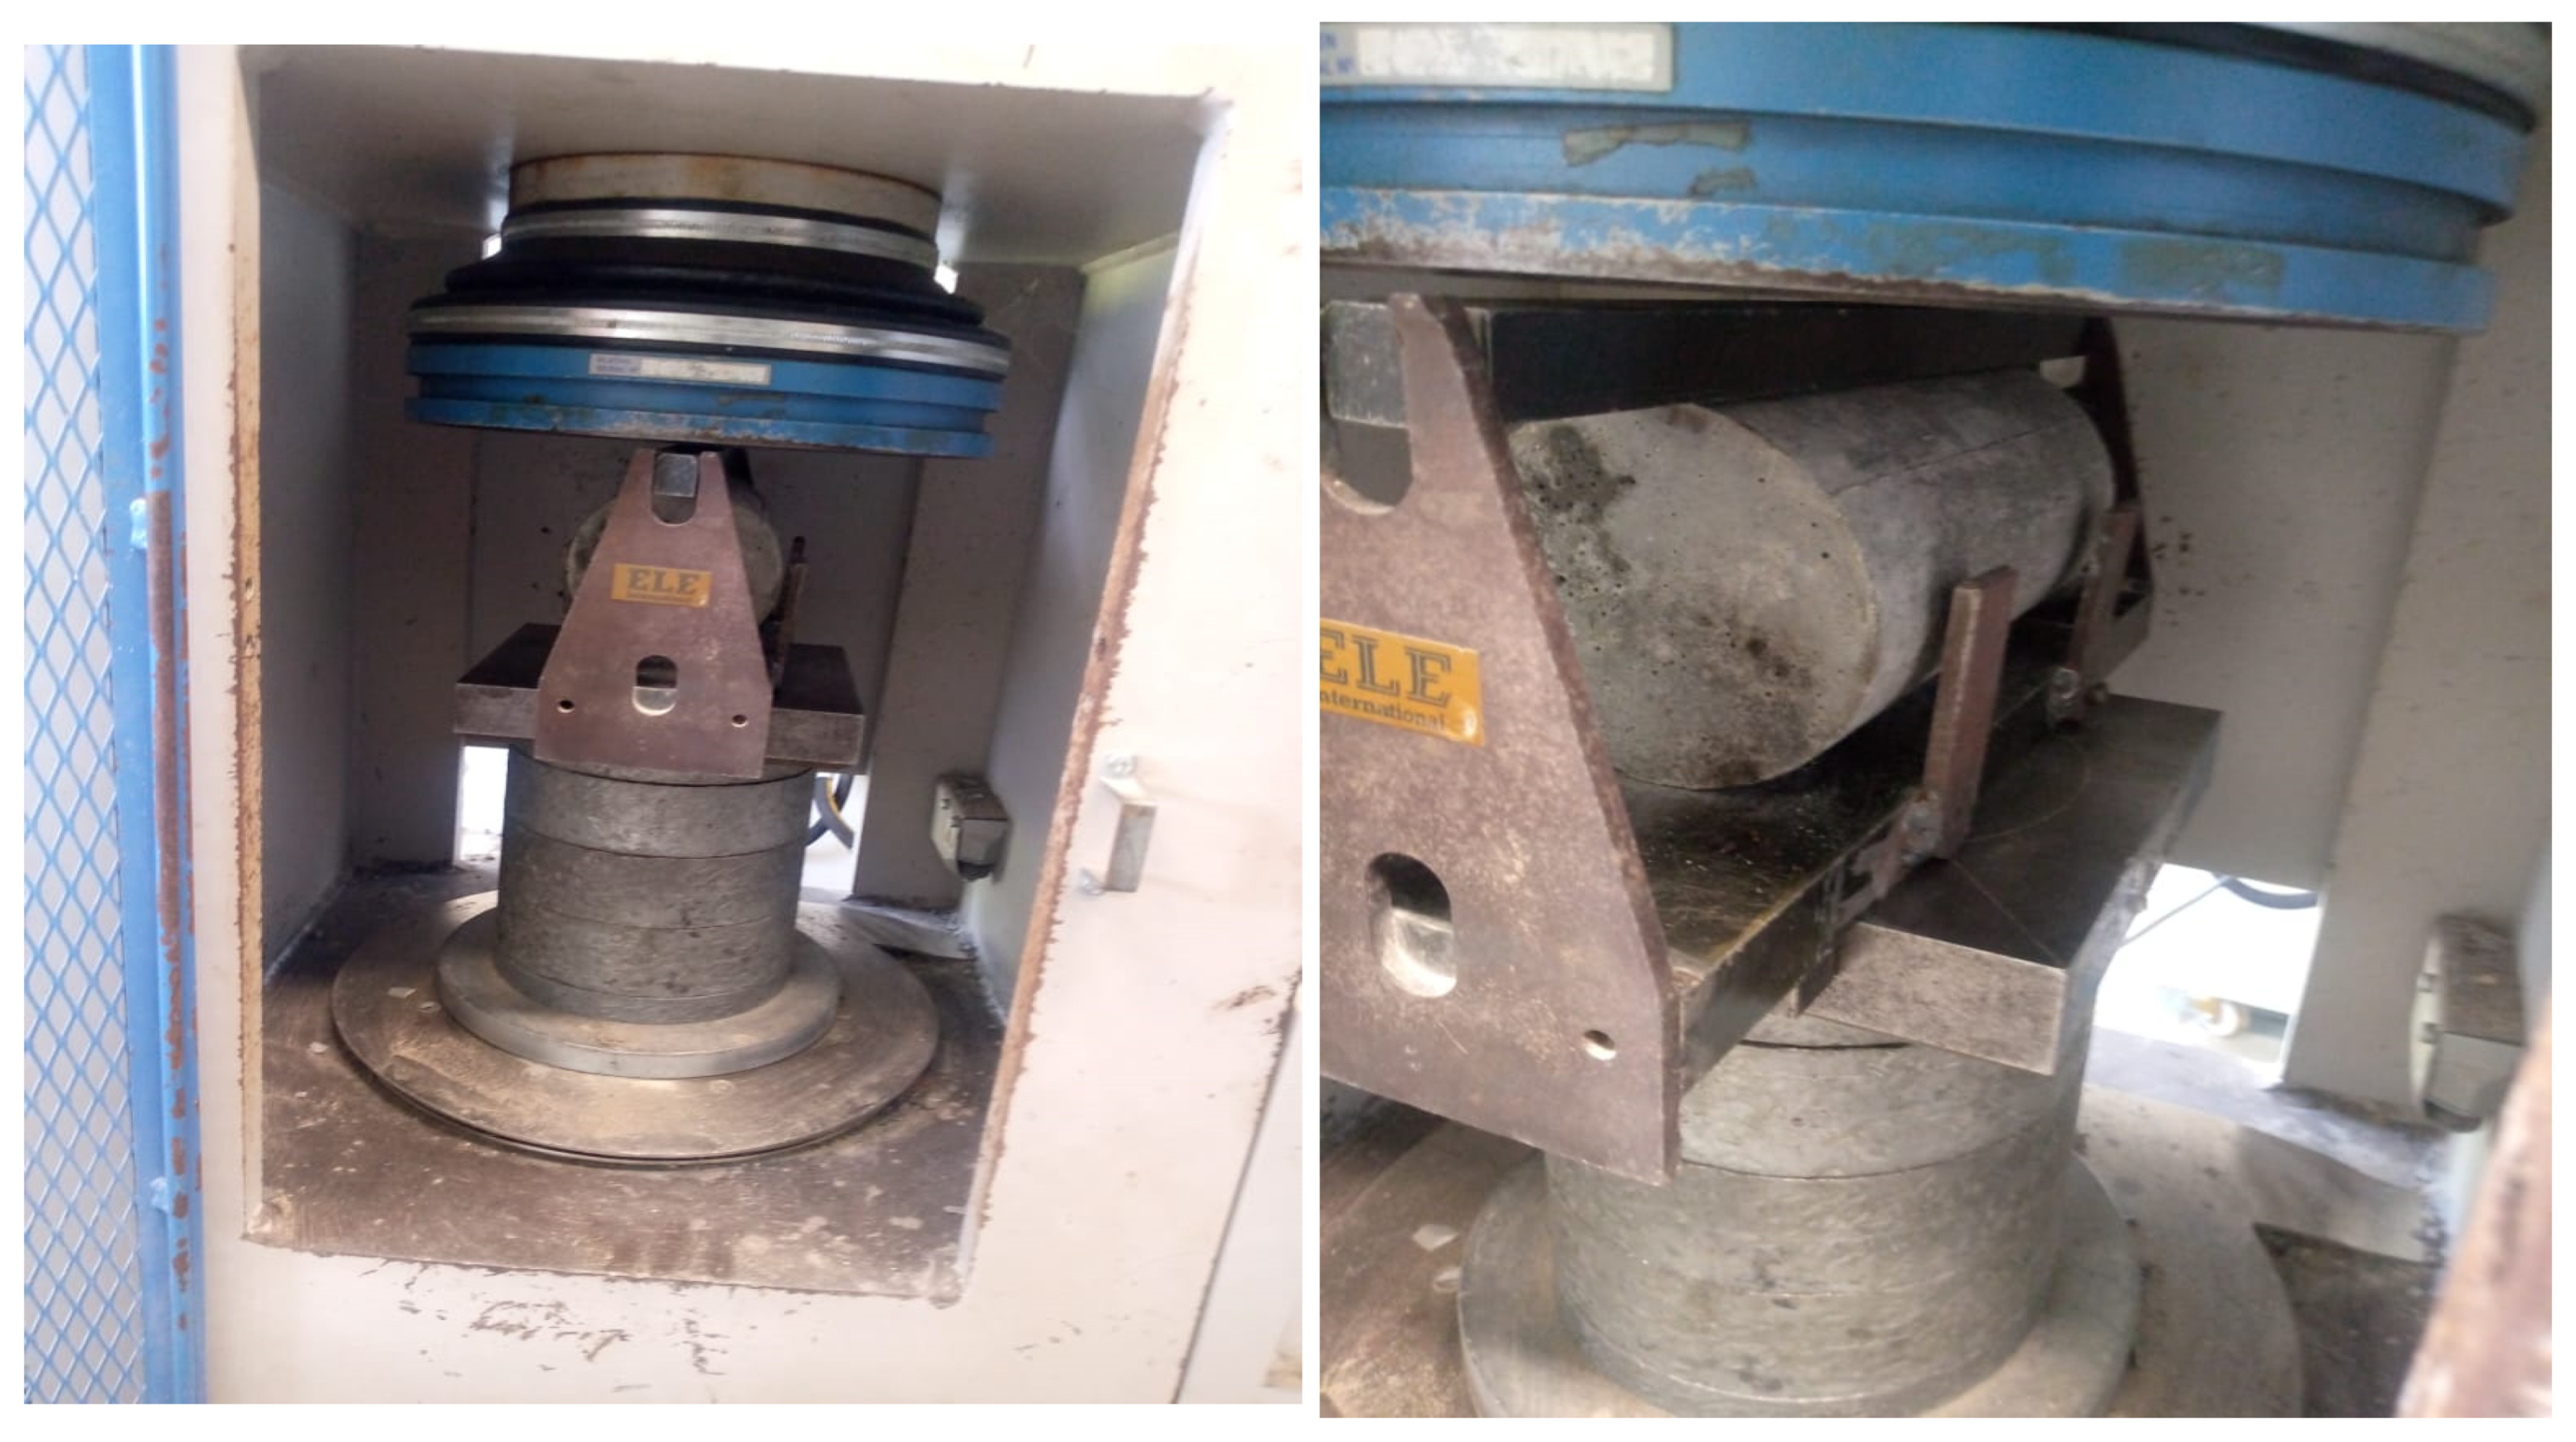
5.2. Compressive Strength
5.3. Split Tensile Strength
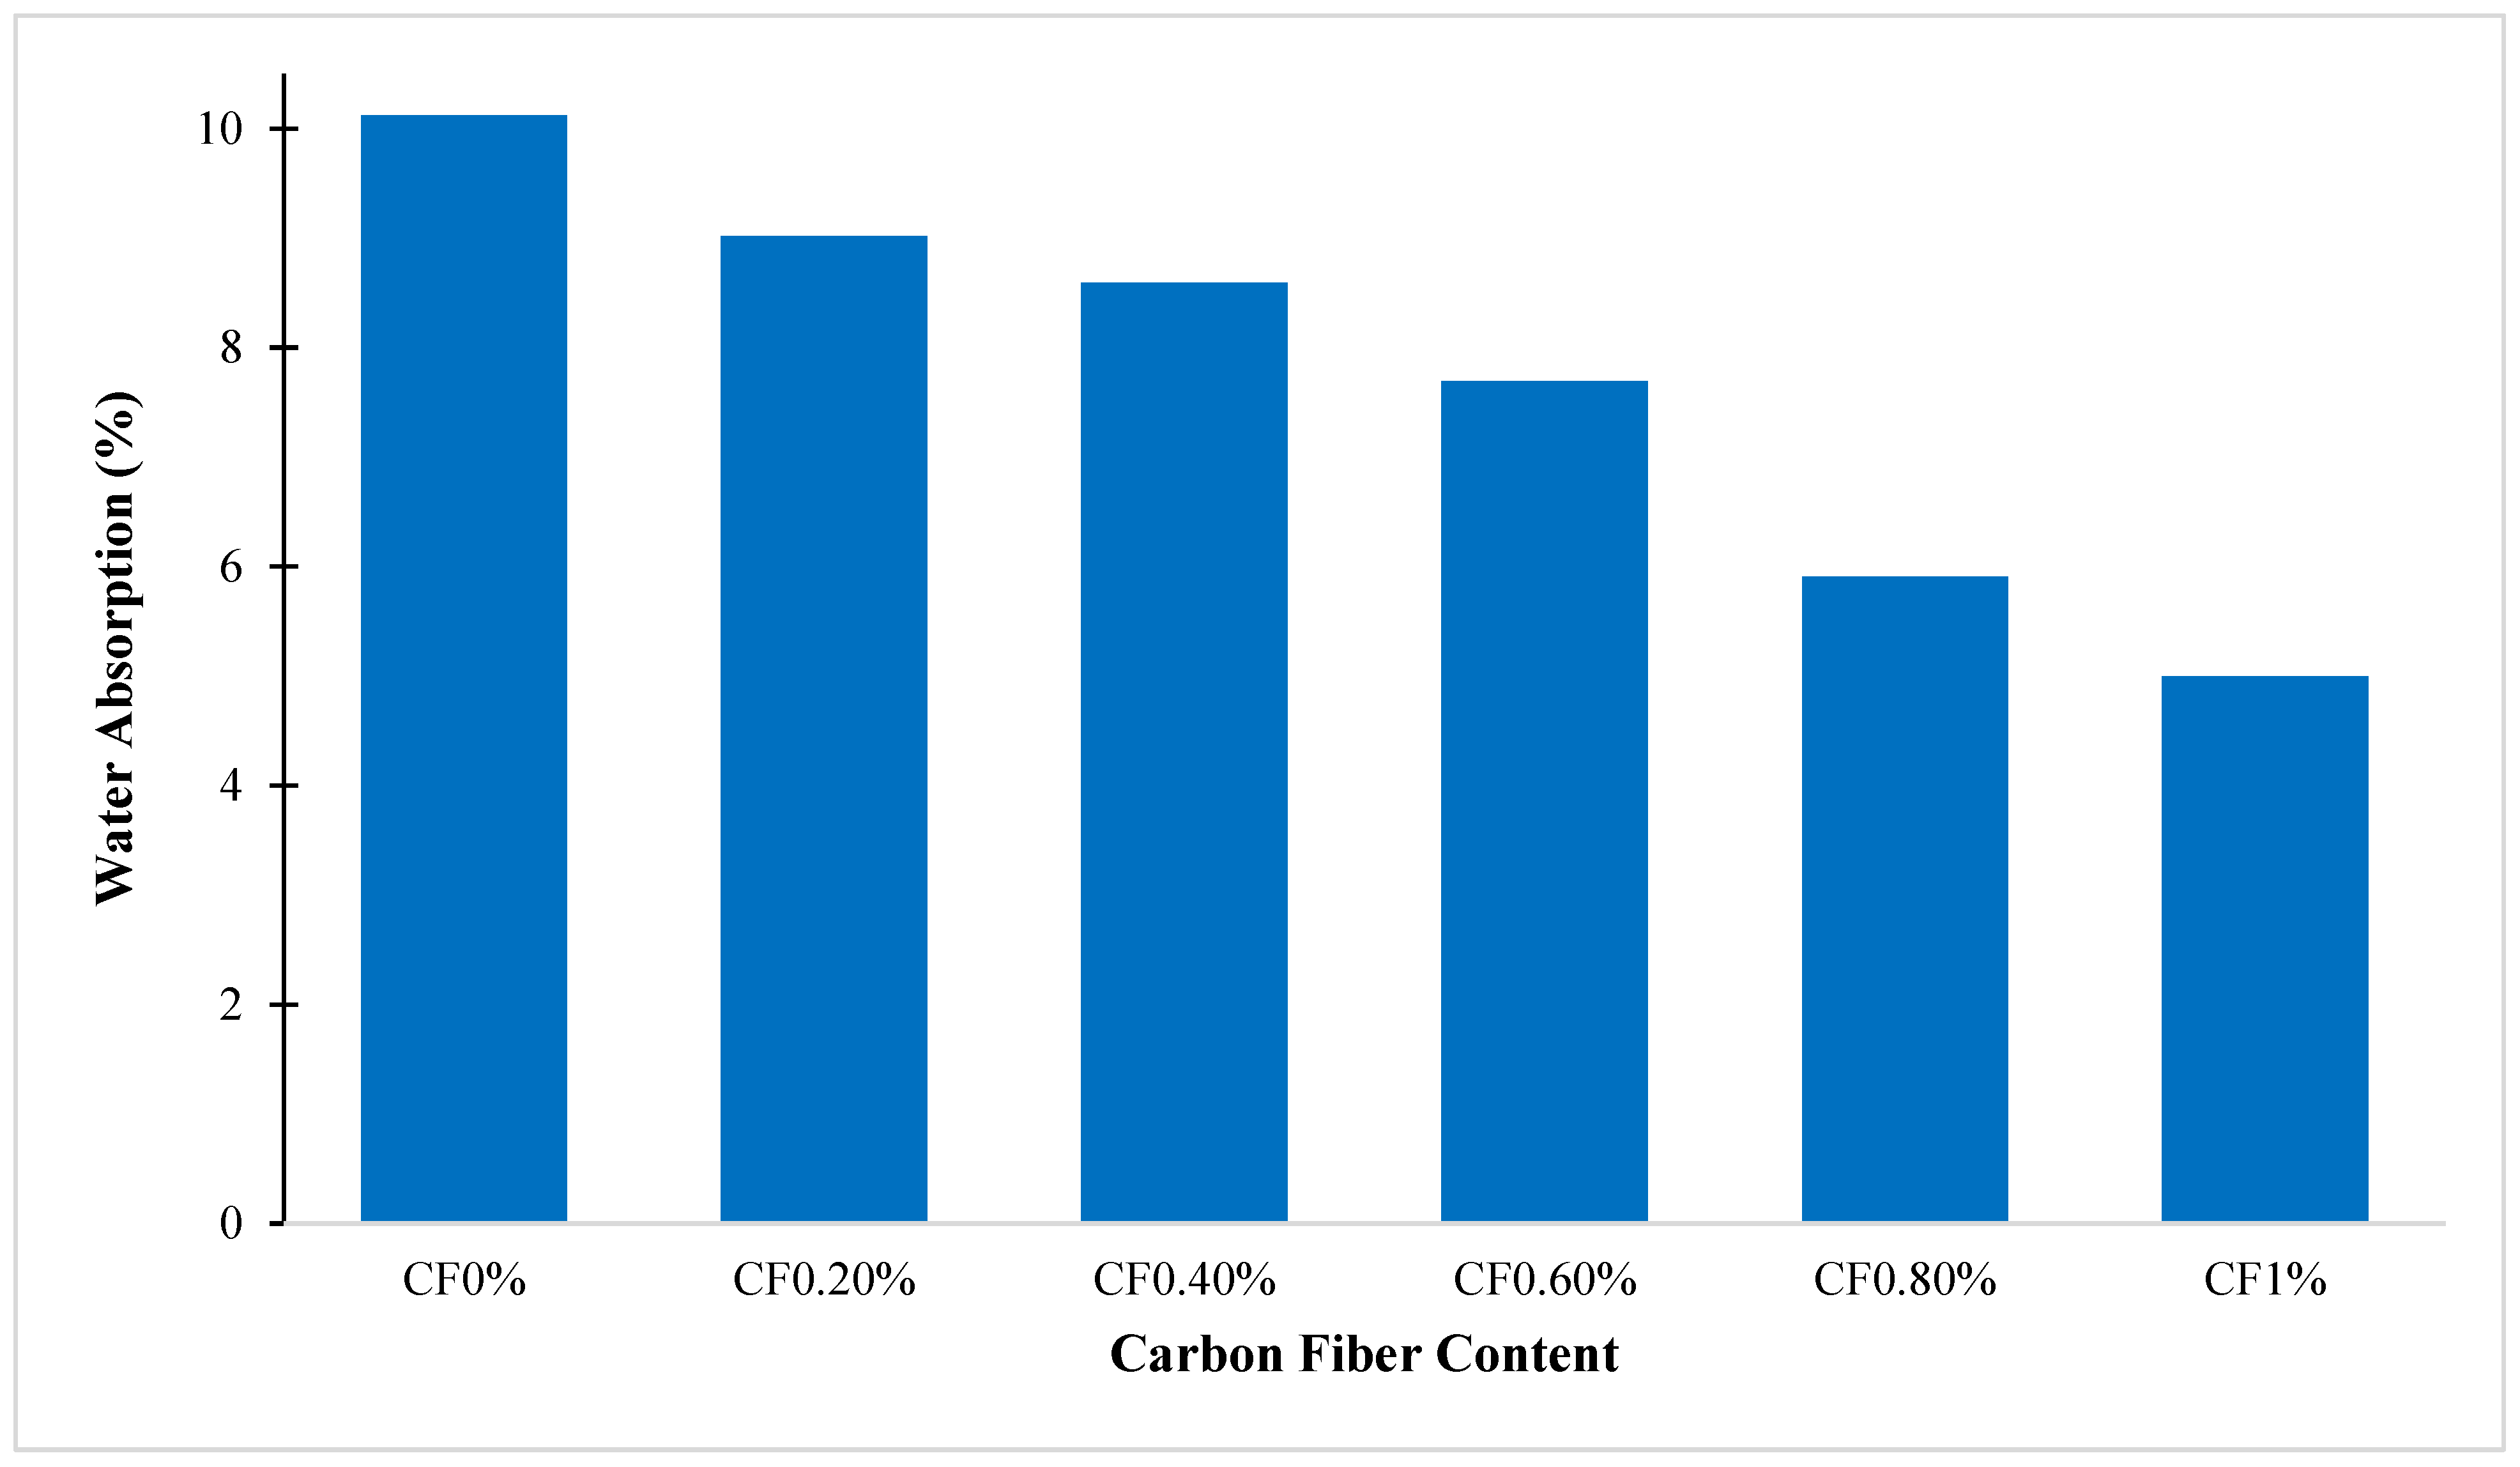
5.4. Water Absorption
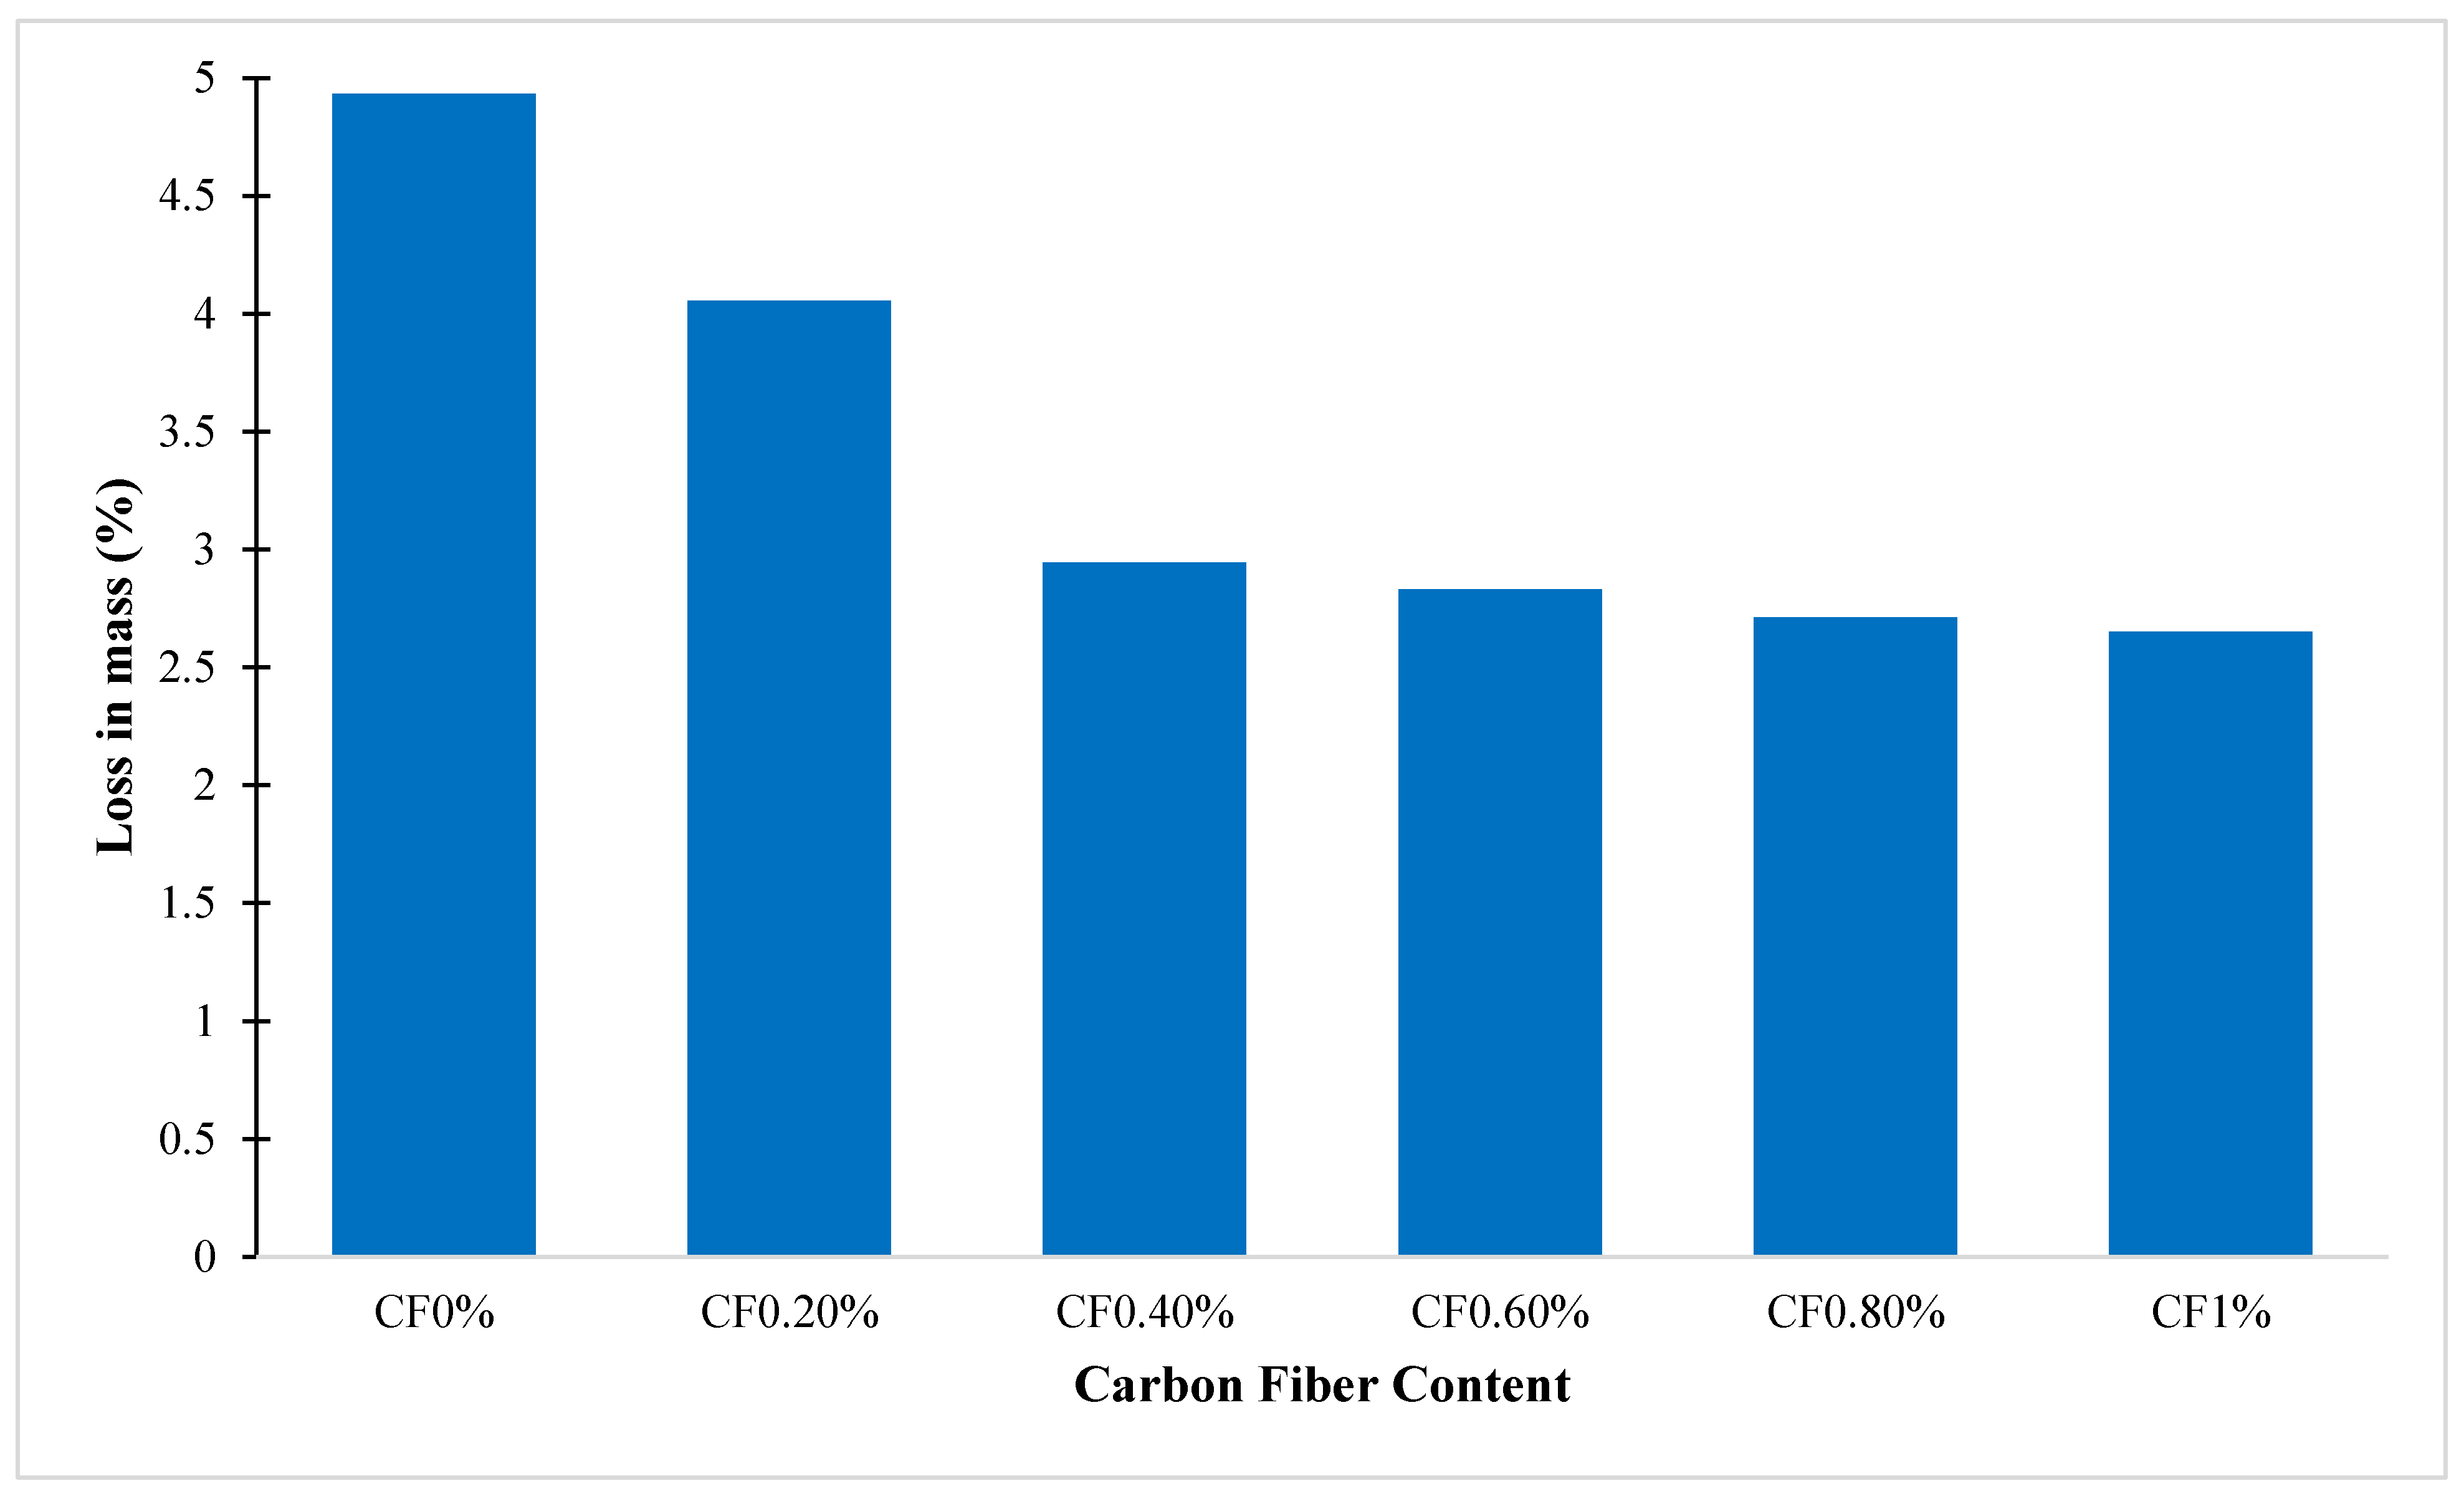
5.5. Acid Attack Test
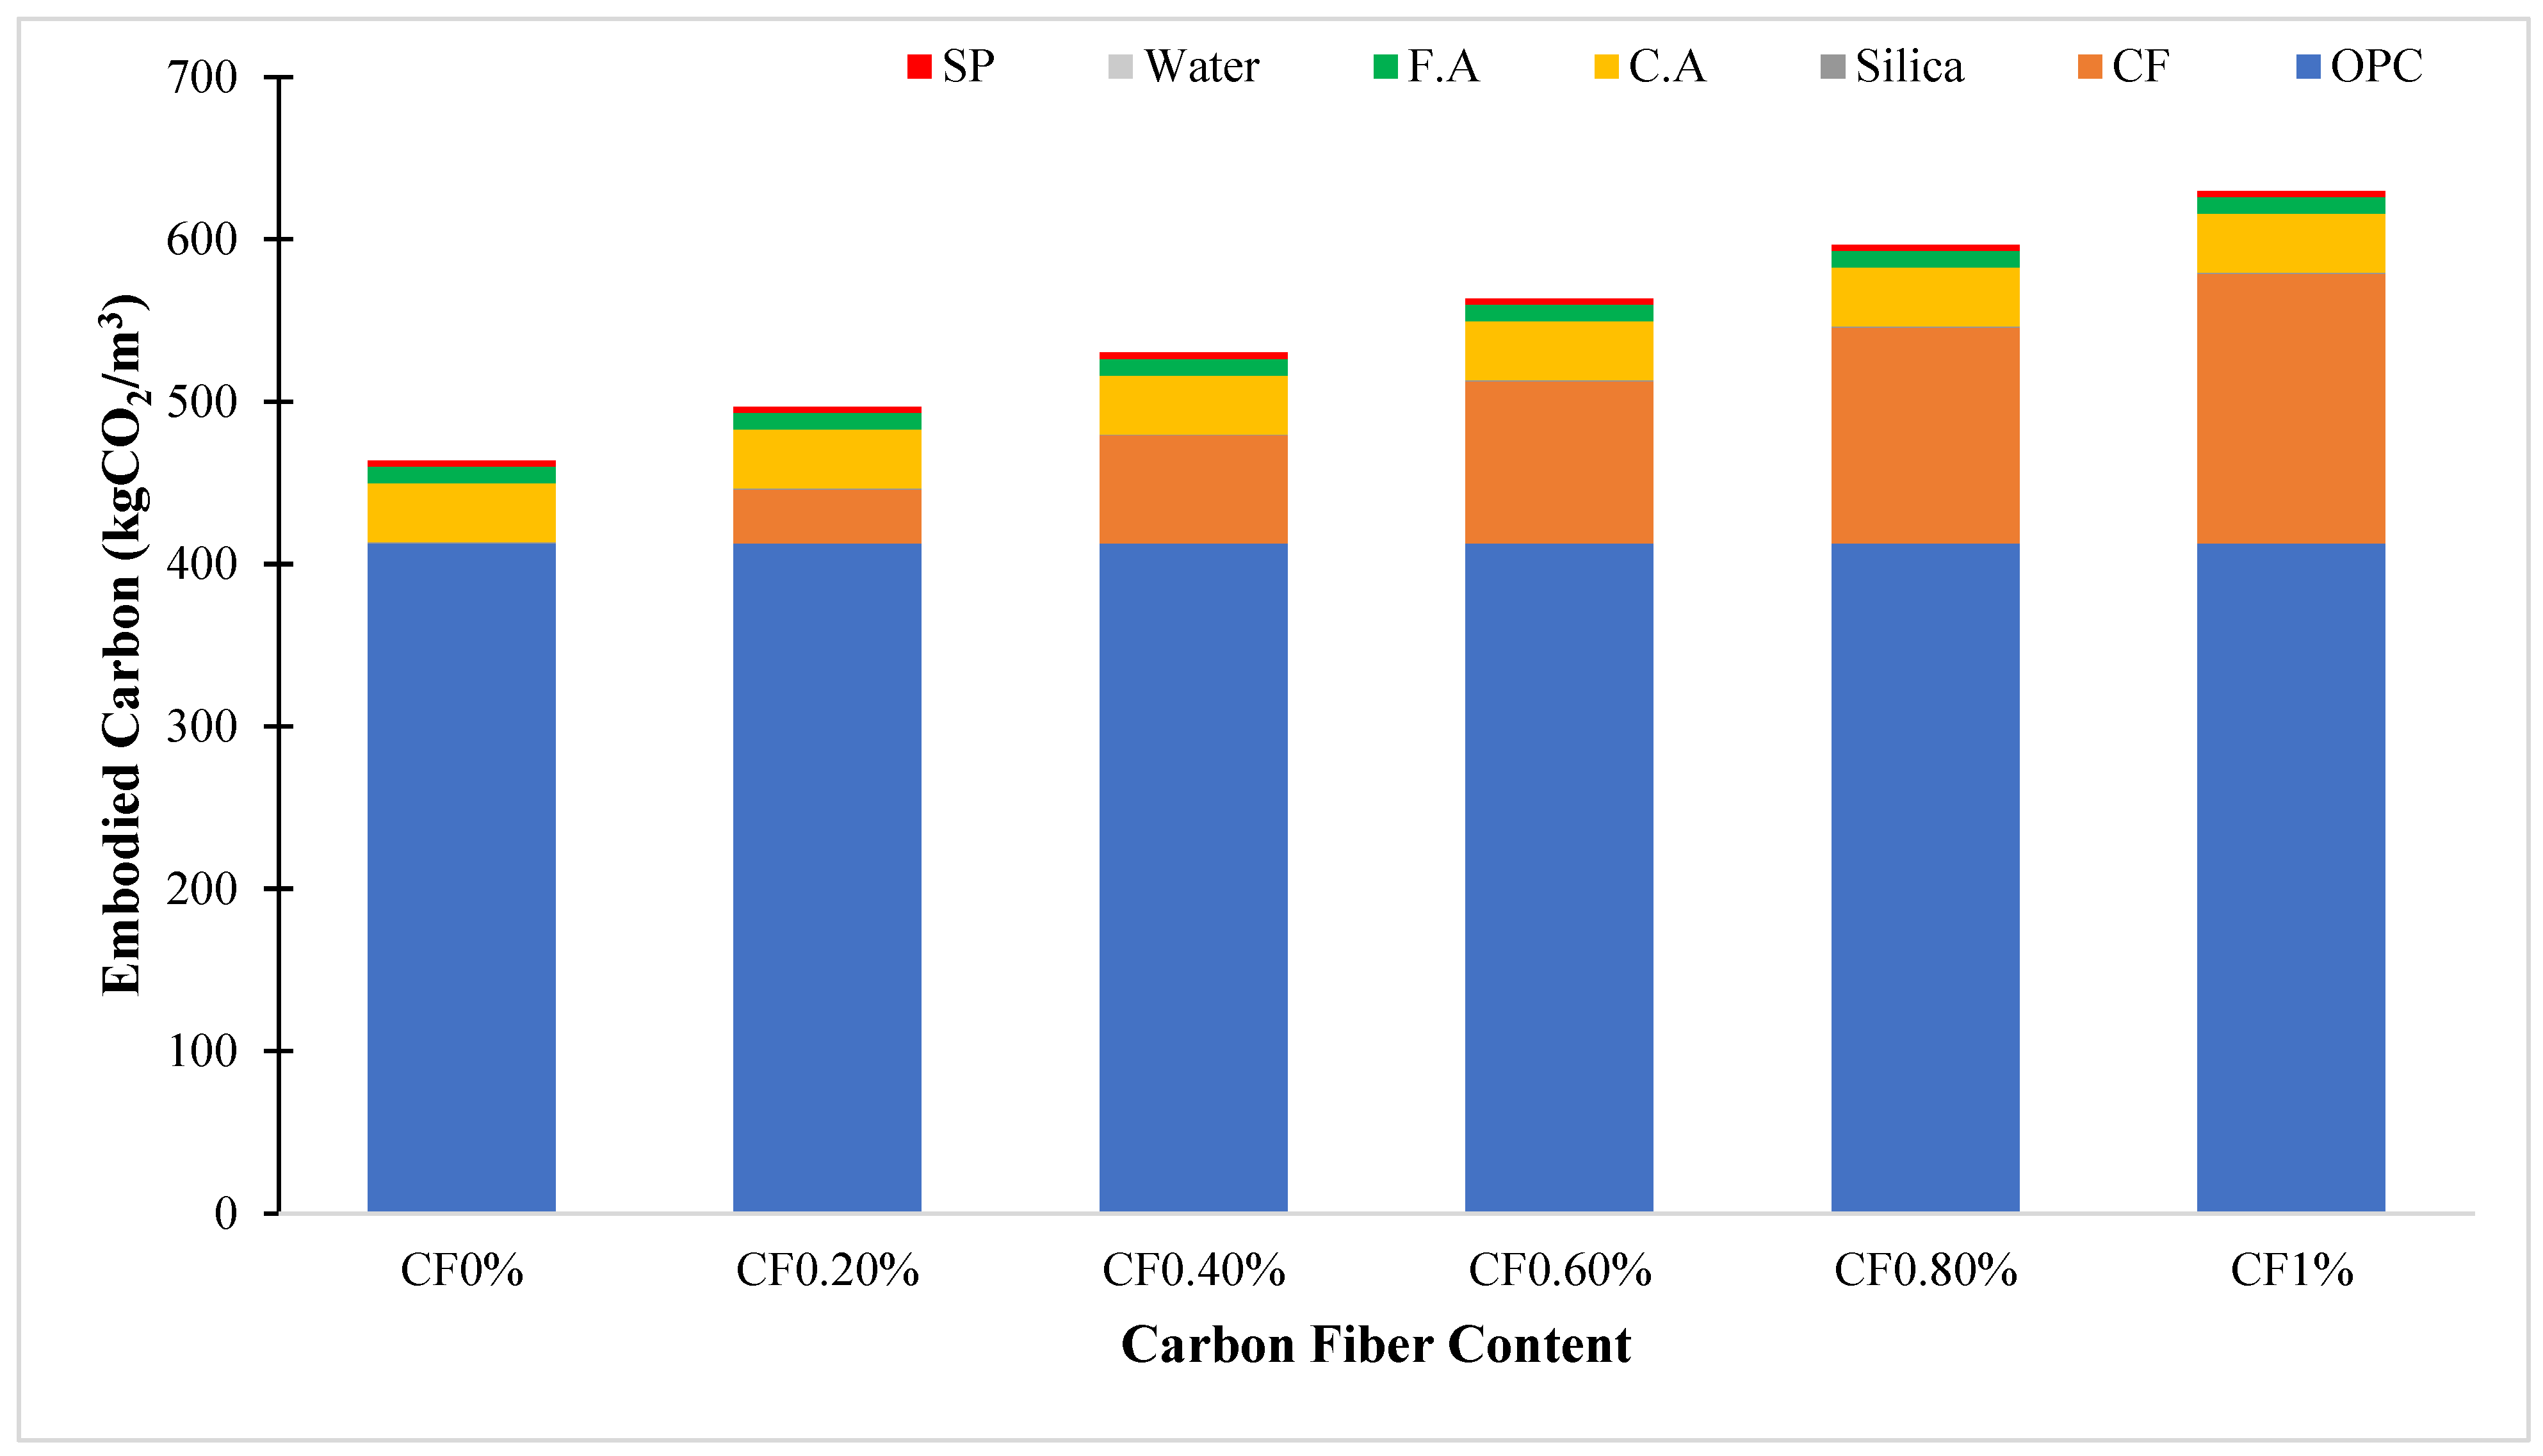
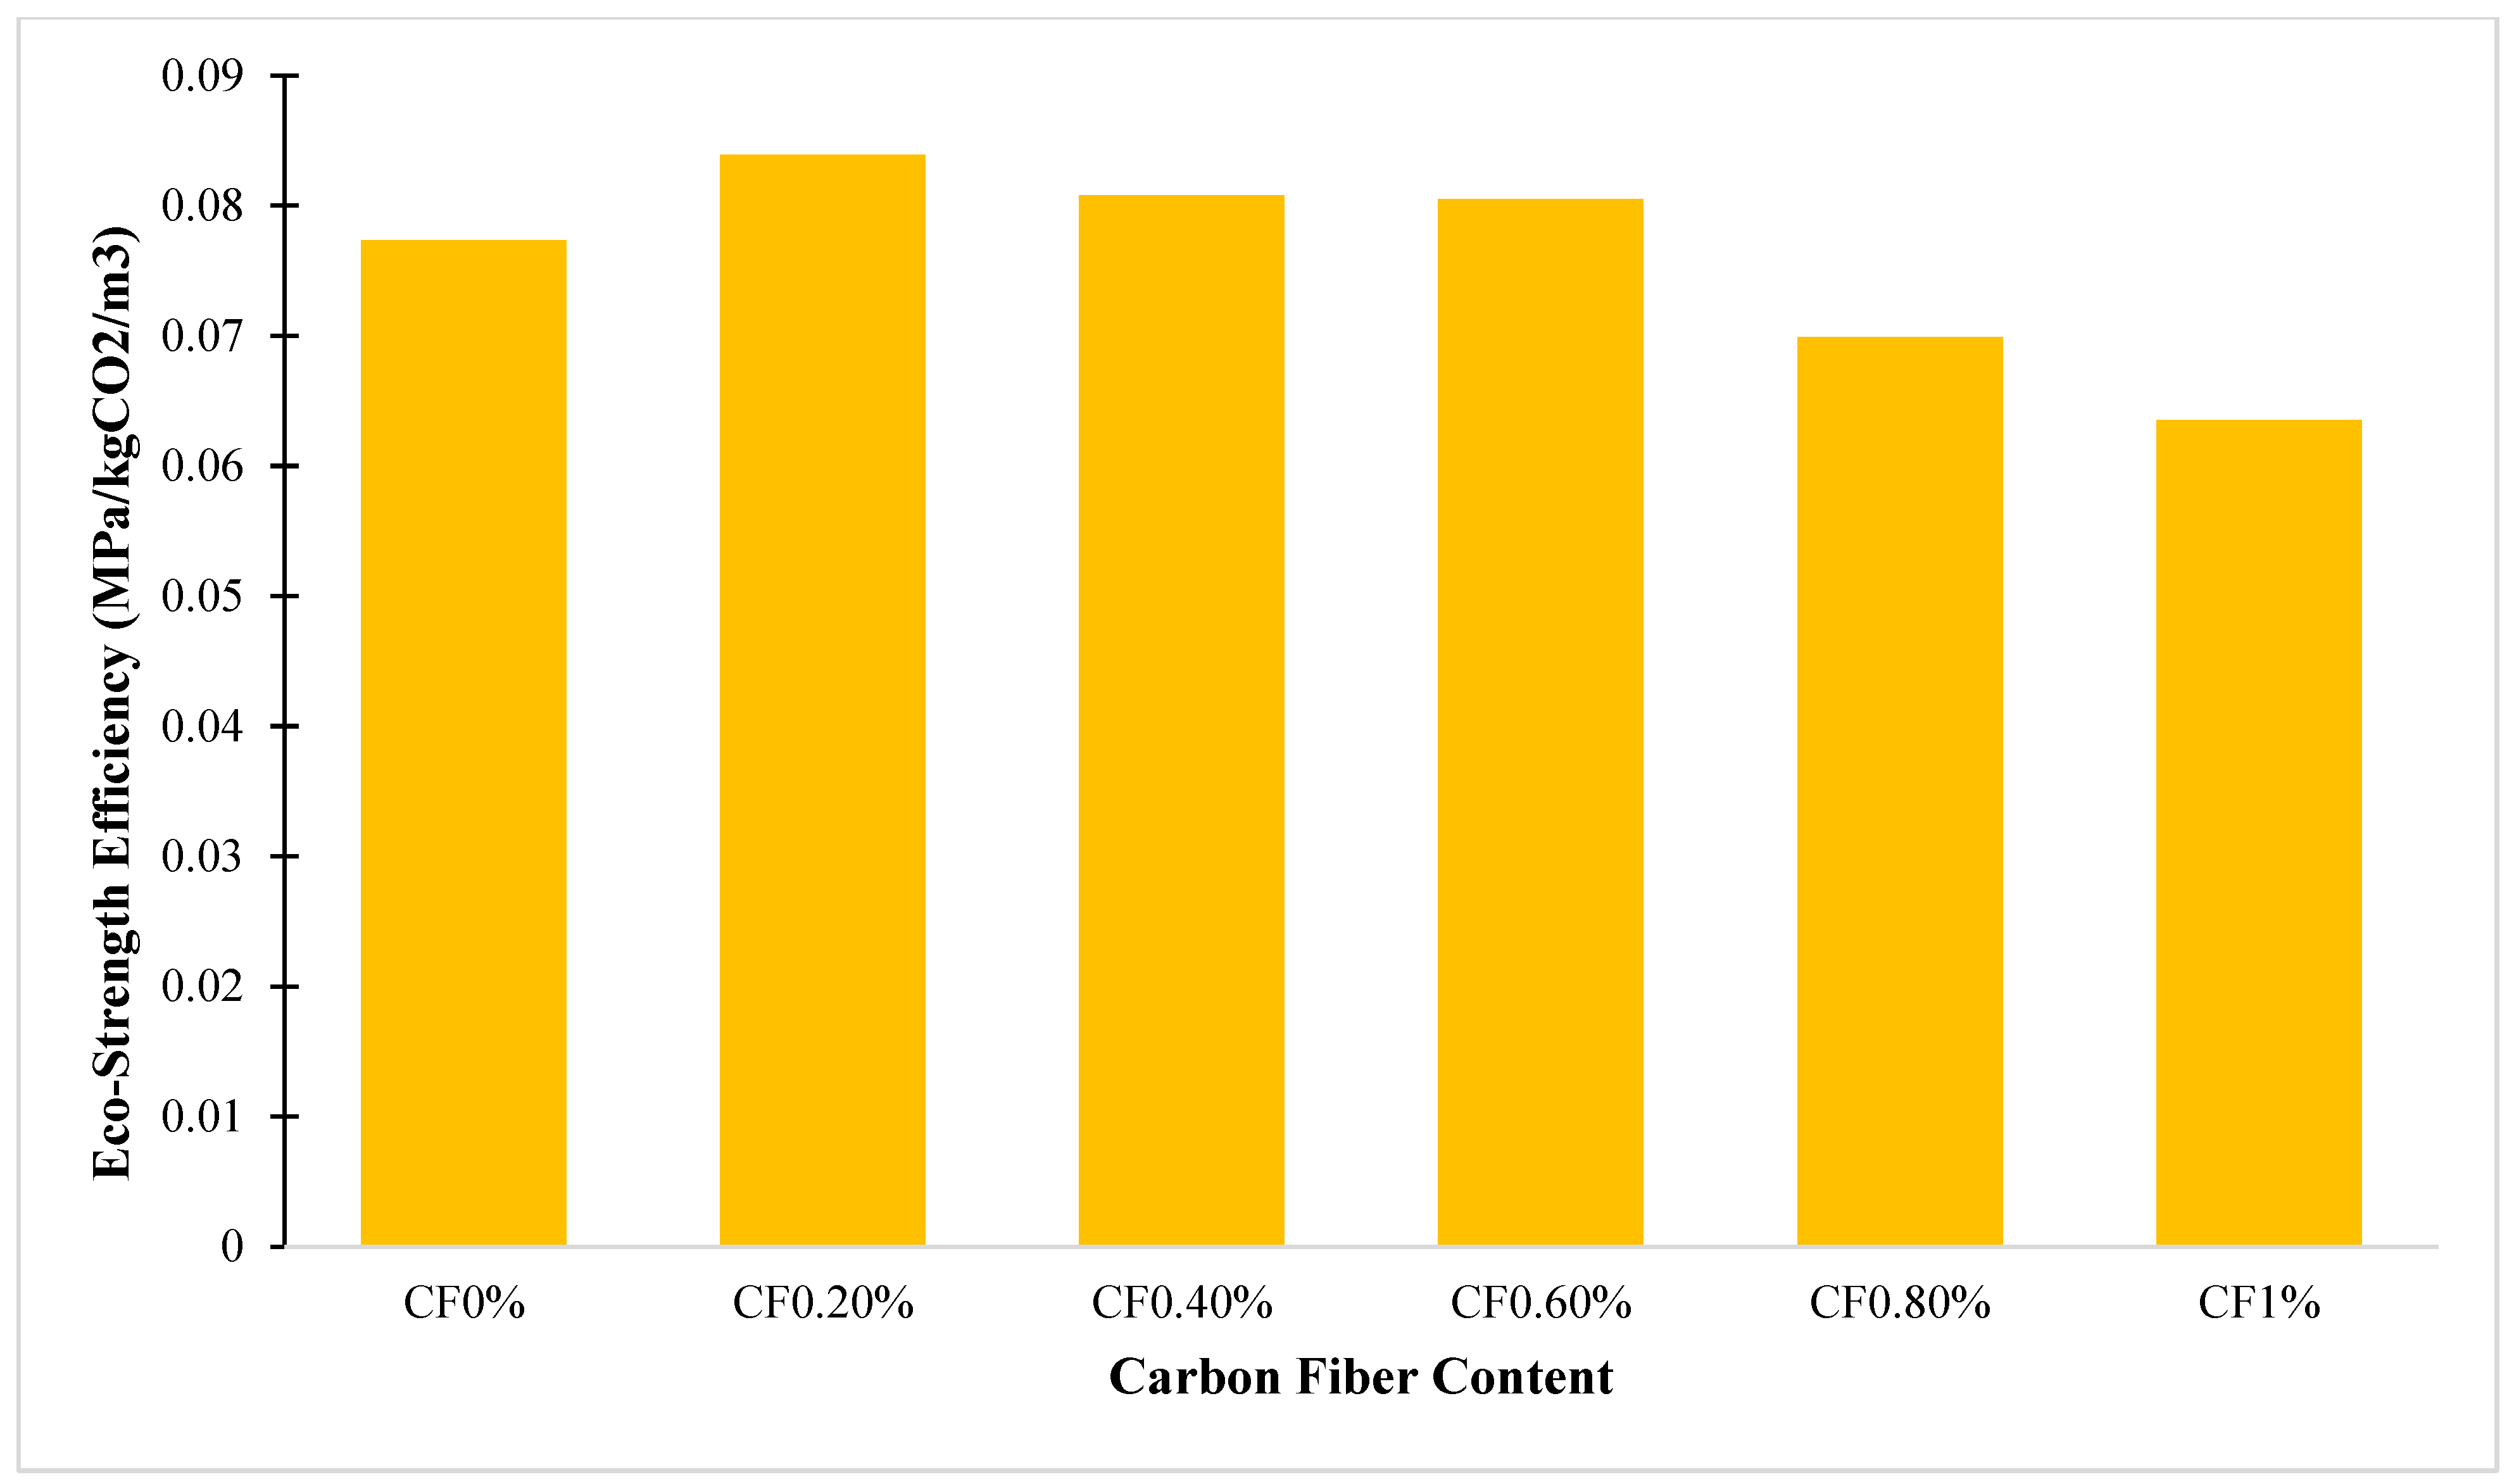
5.6. Sustainability Assessment
Embodied Carbon and Eco-Strength Efficiency
5.7. Modelling and Optimization Using RSM
Analysis of Variance Using RSM
5.8. Effects of Carbon Fiber on Fresh Properties of Concrete
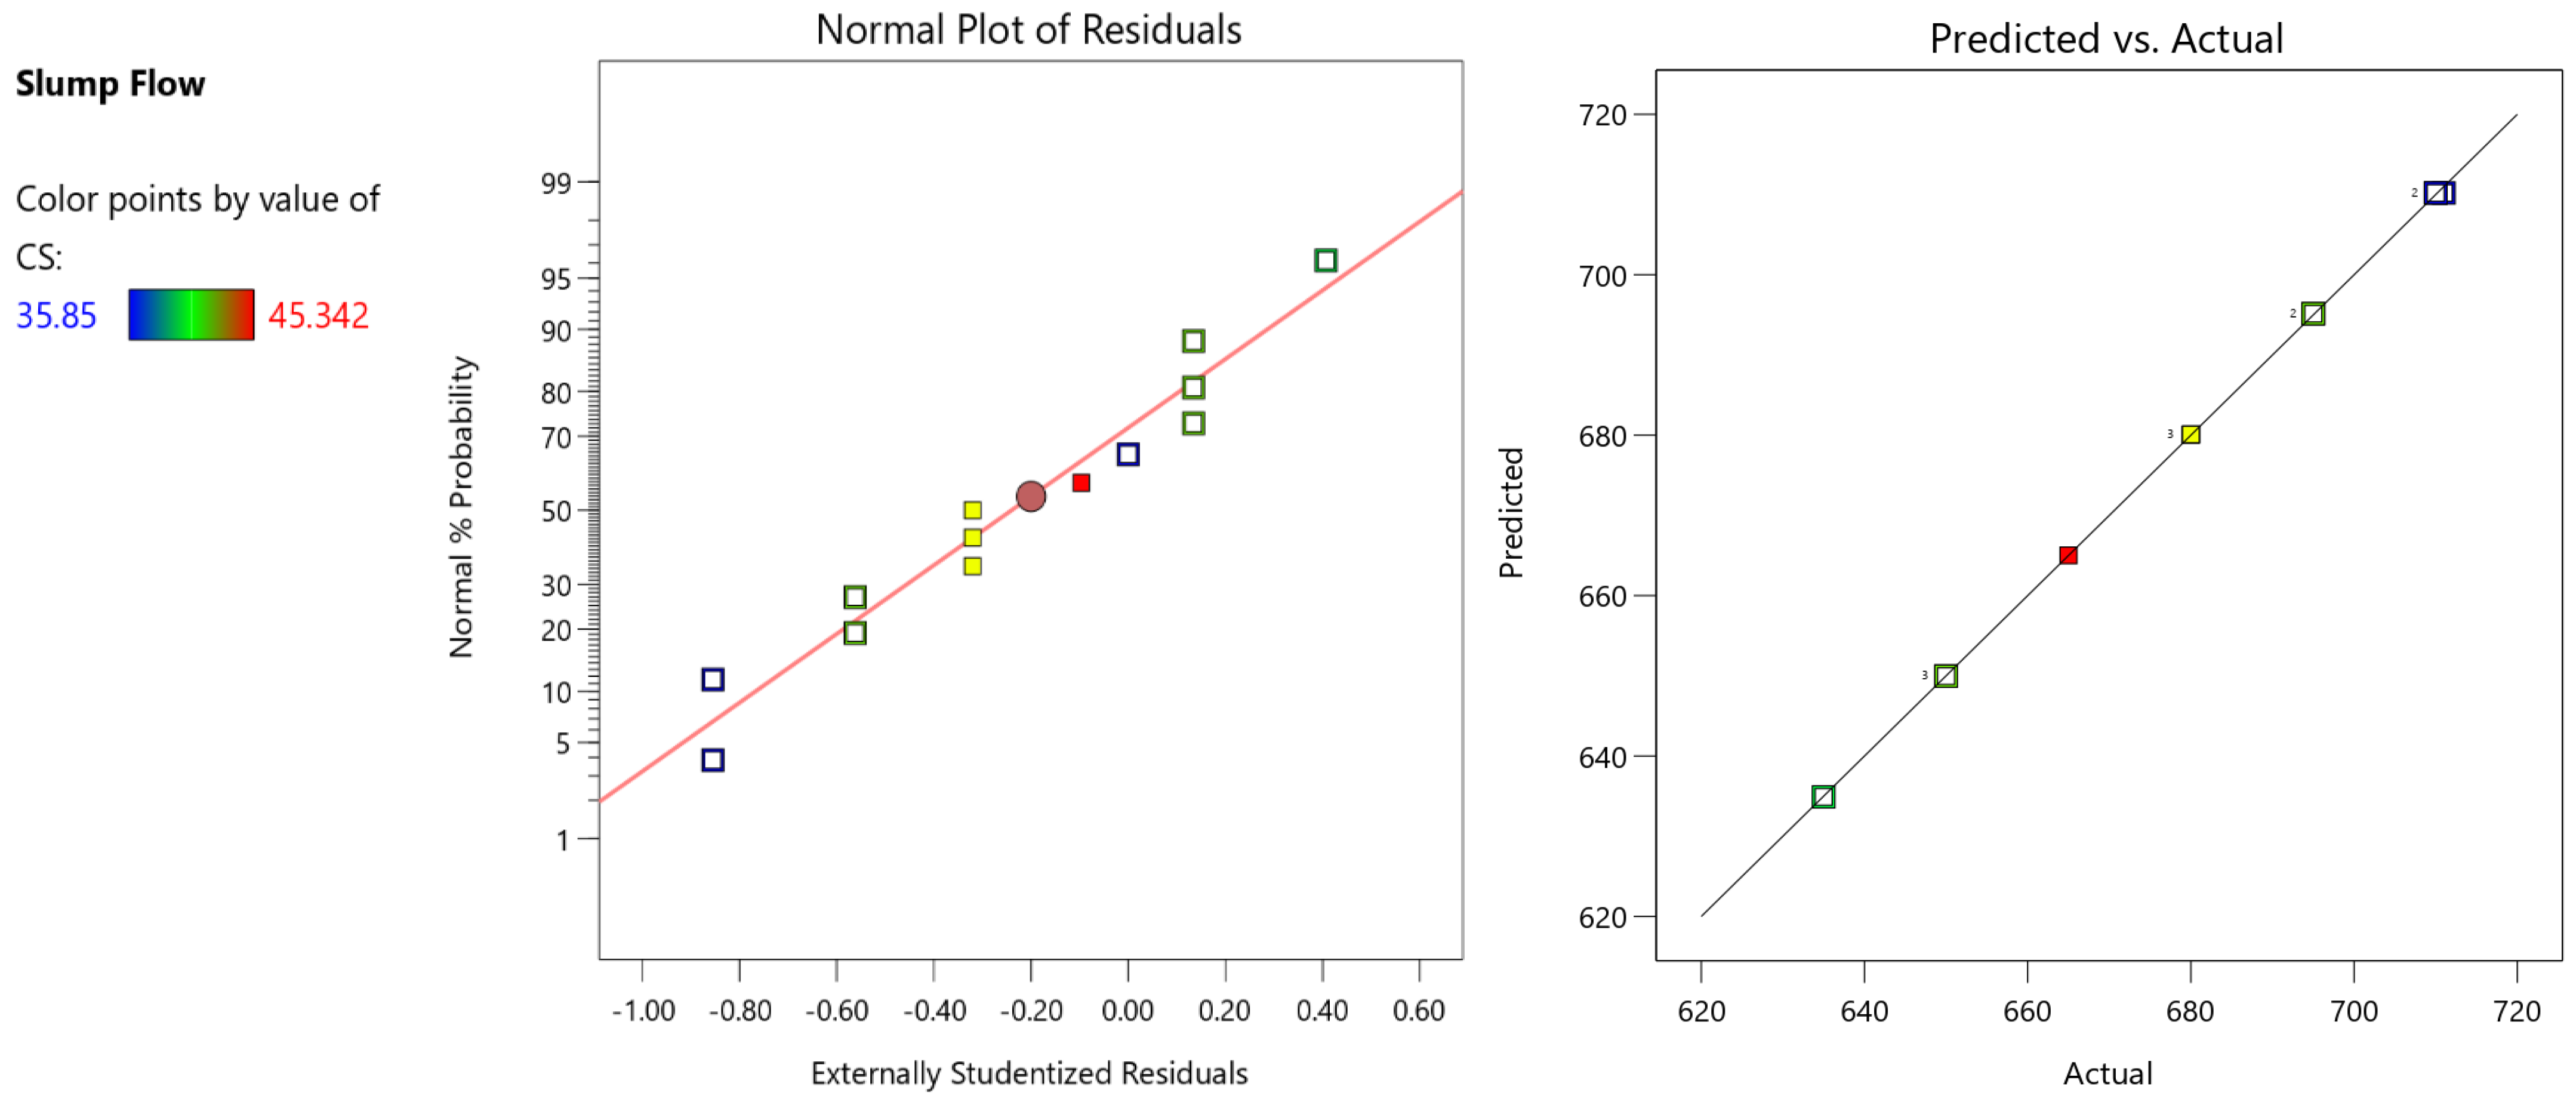
5.8.1. Slump Flow
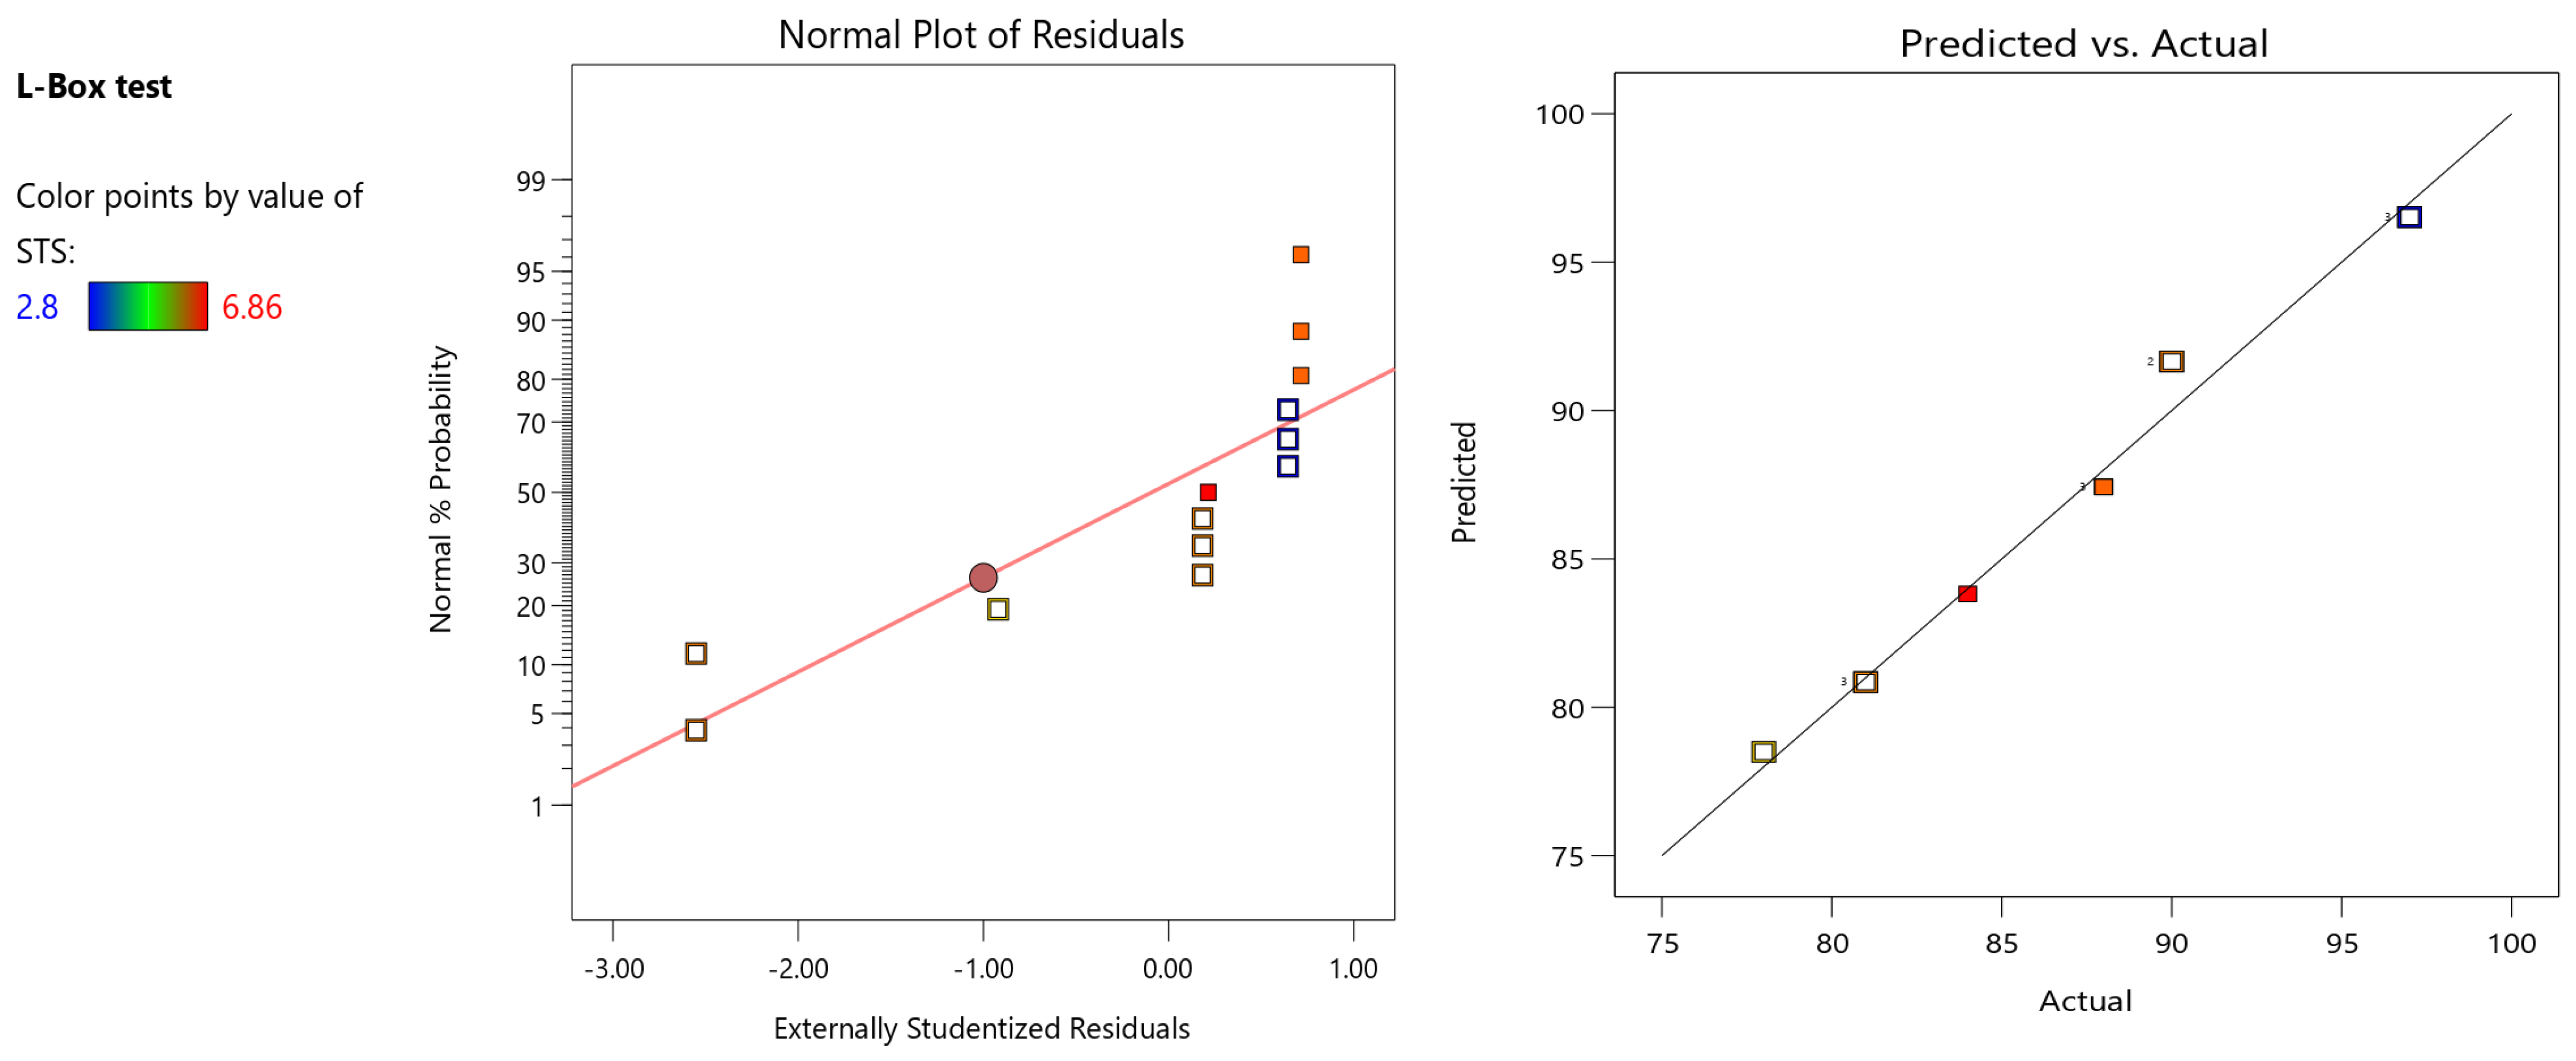
5.8.2. L-Box Test
5.9. Effects of Carbon Fiber on Concrete’s Mechanical Properties
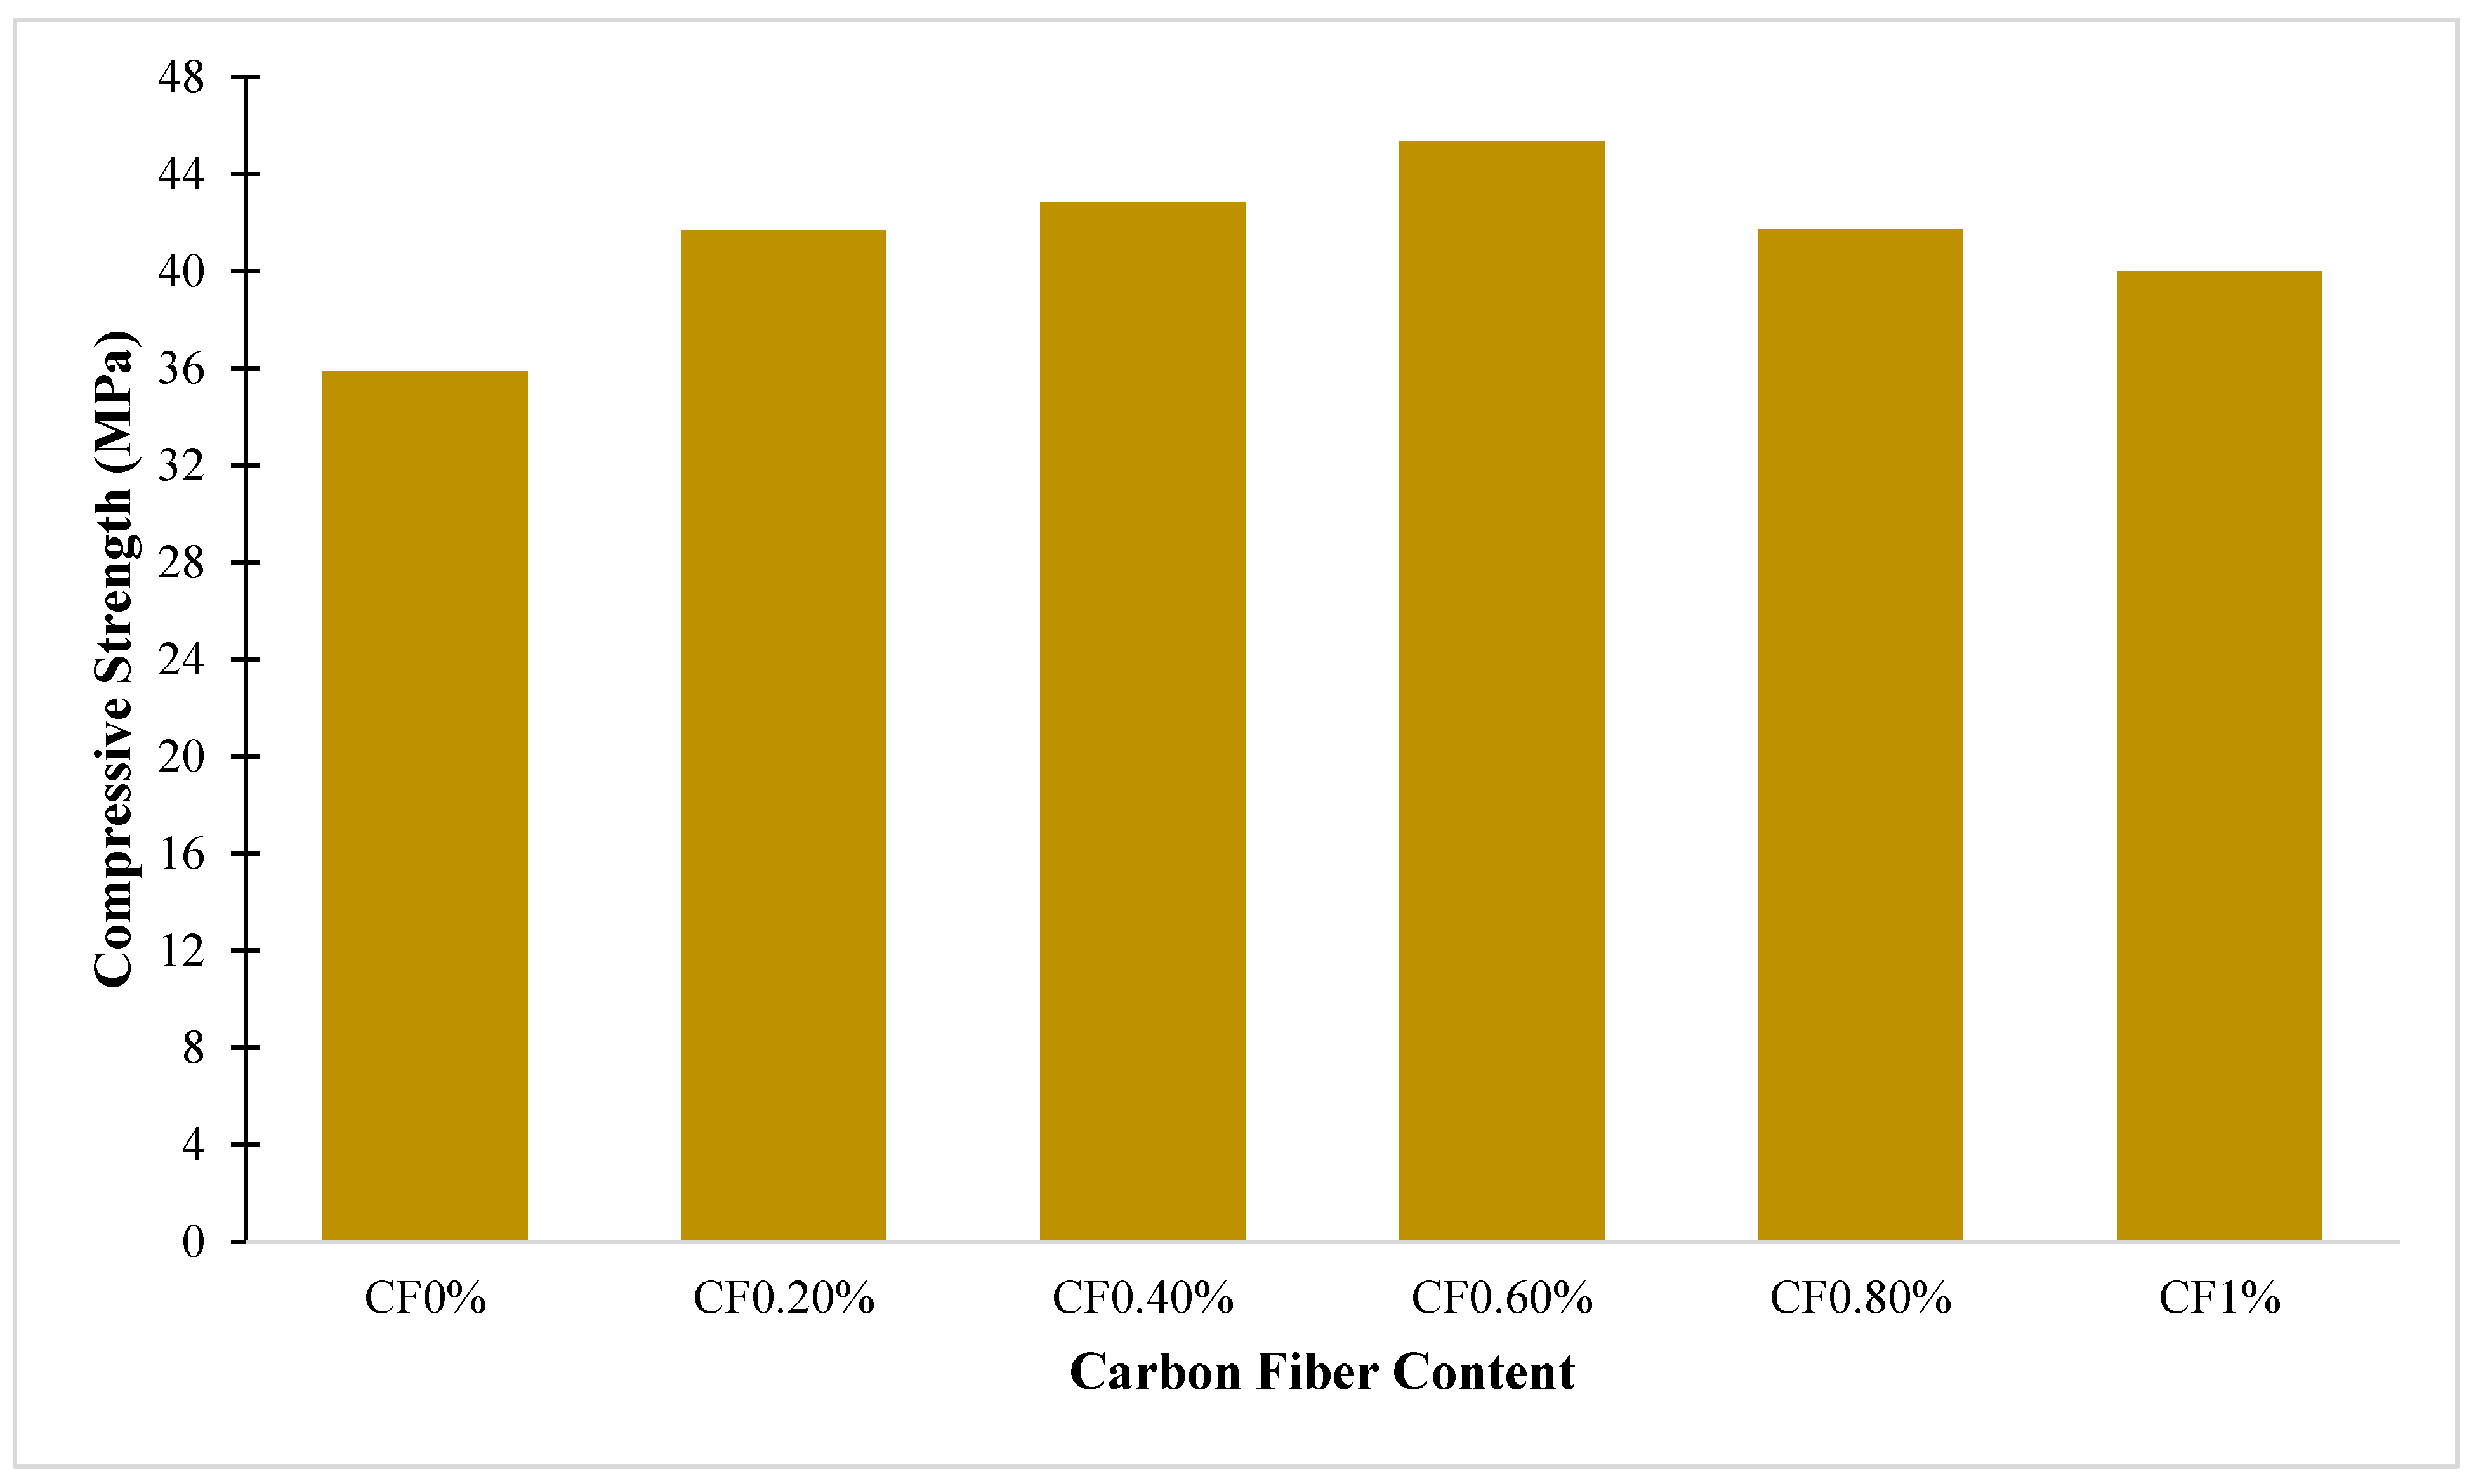
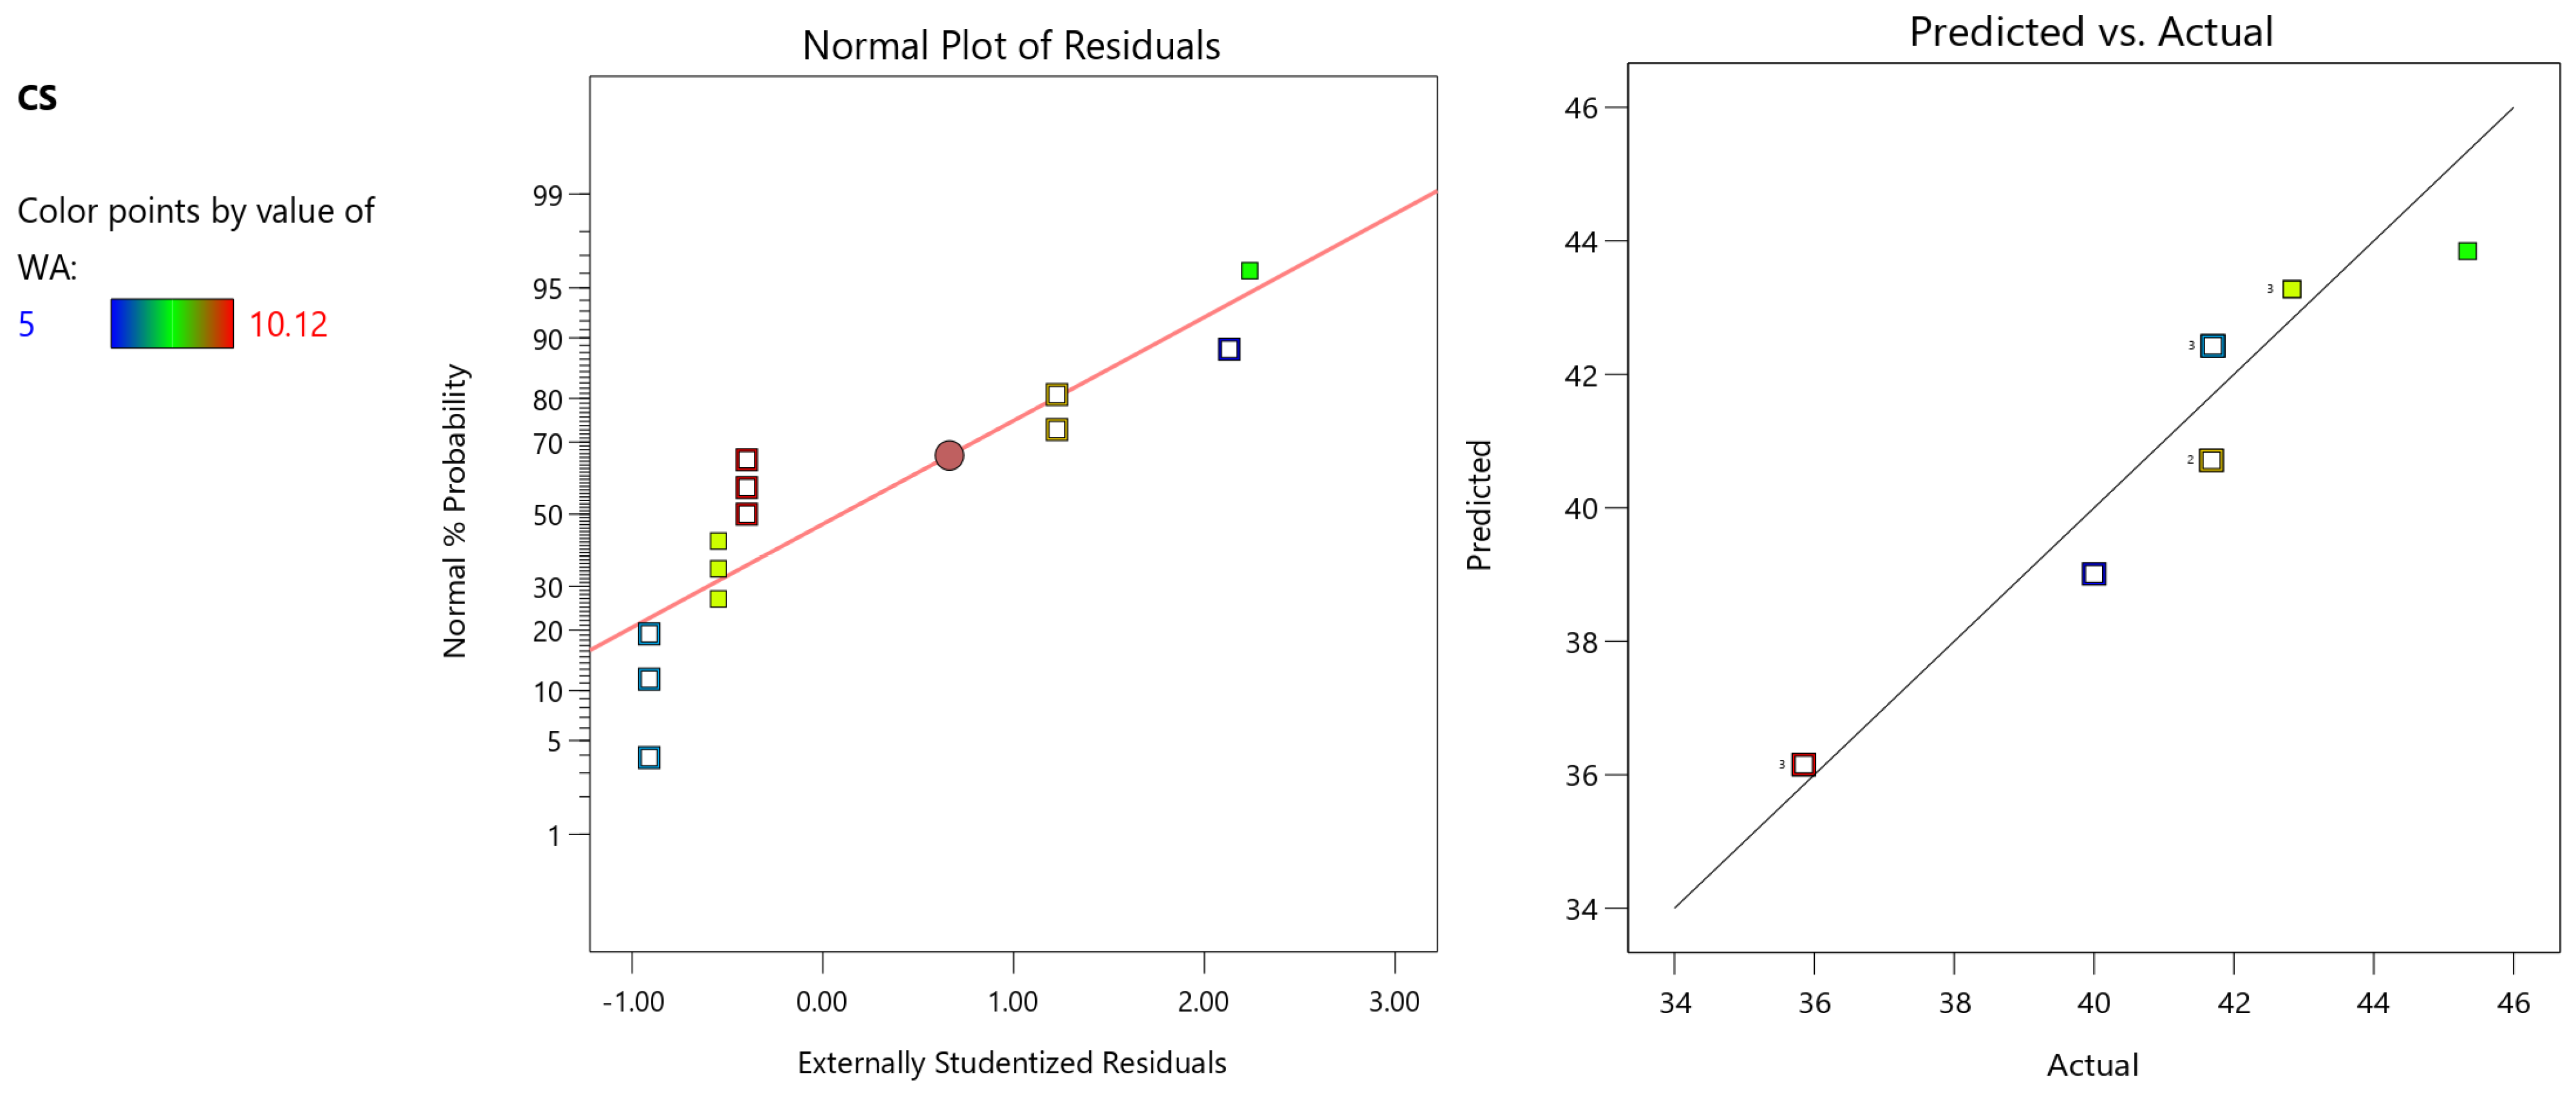
5.9.1. Compressive Strength
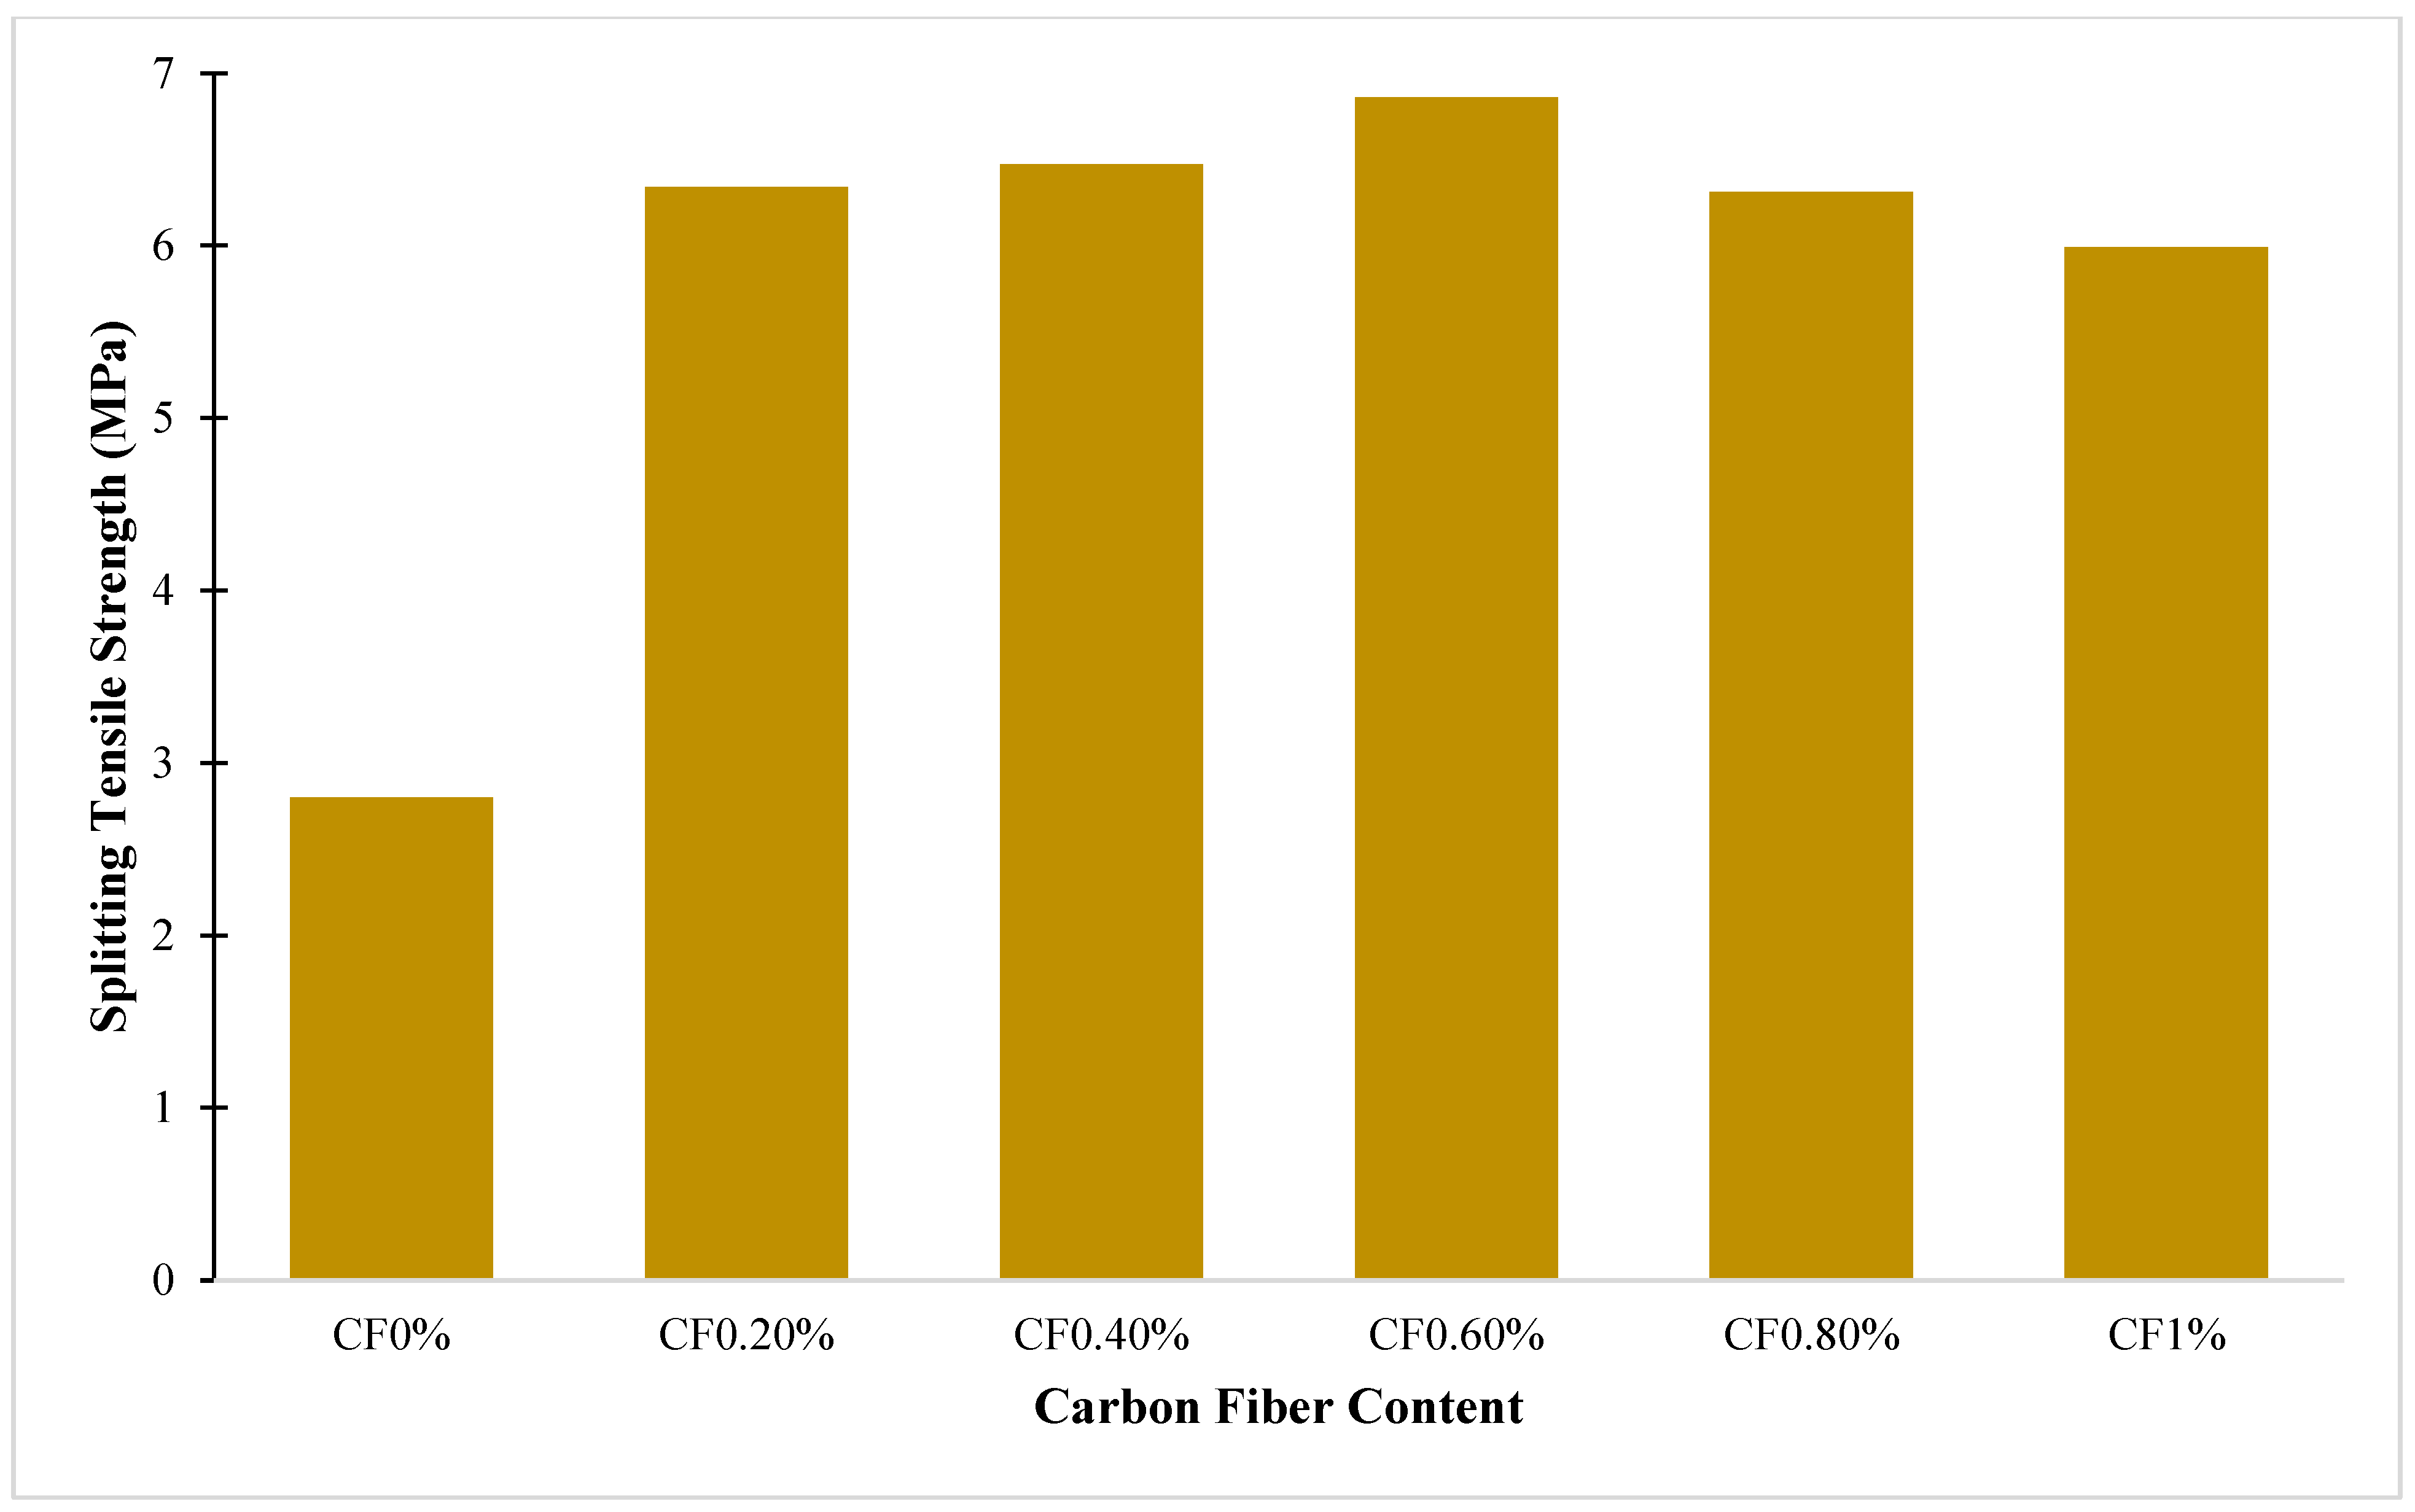
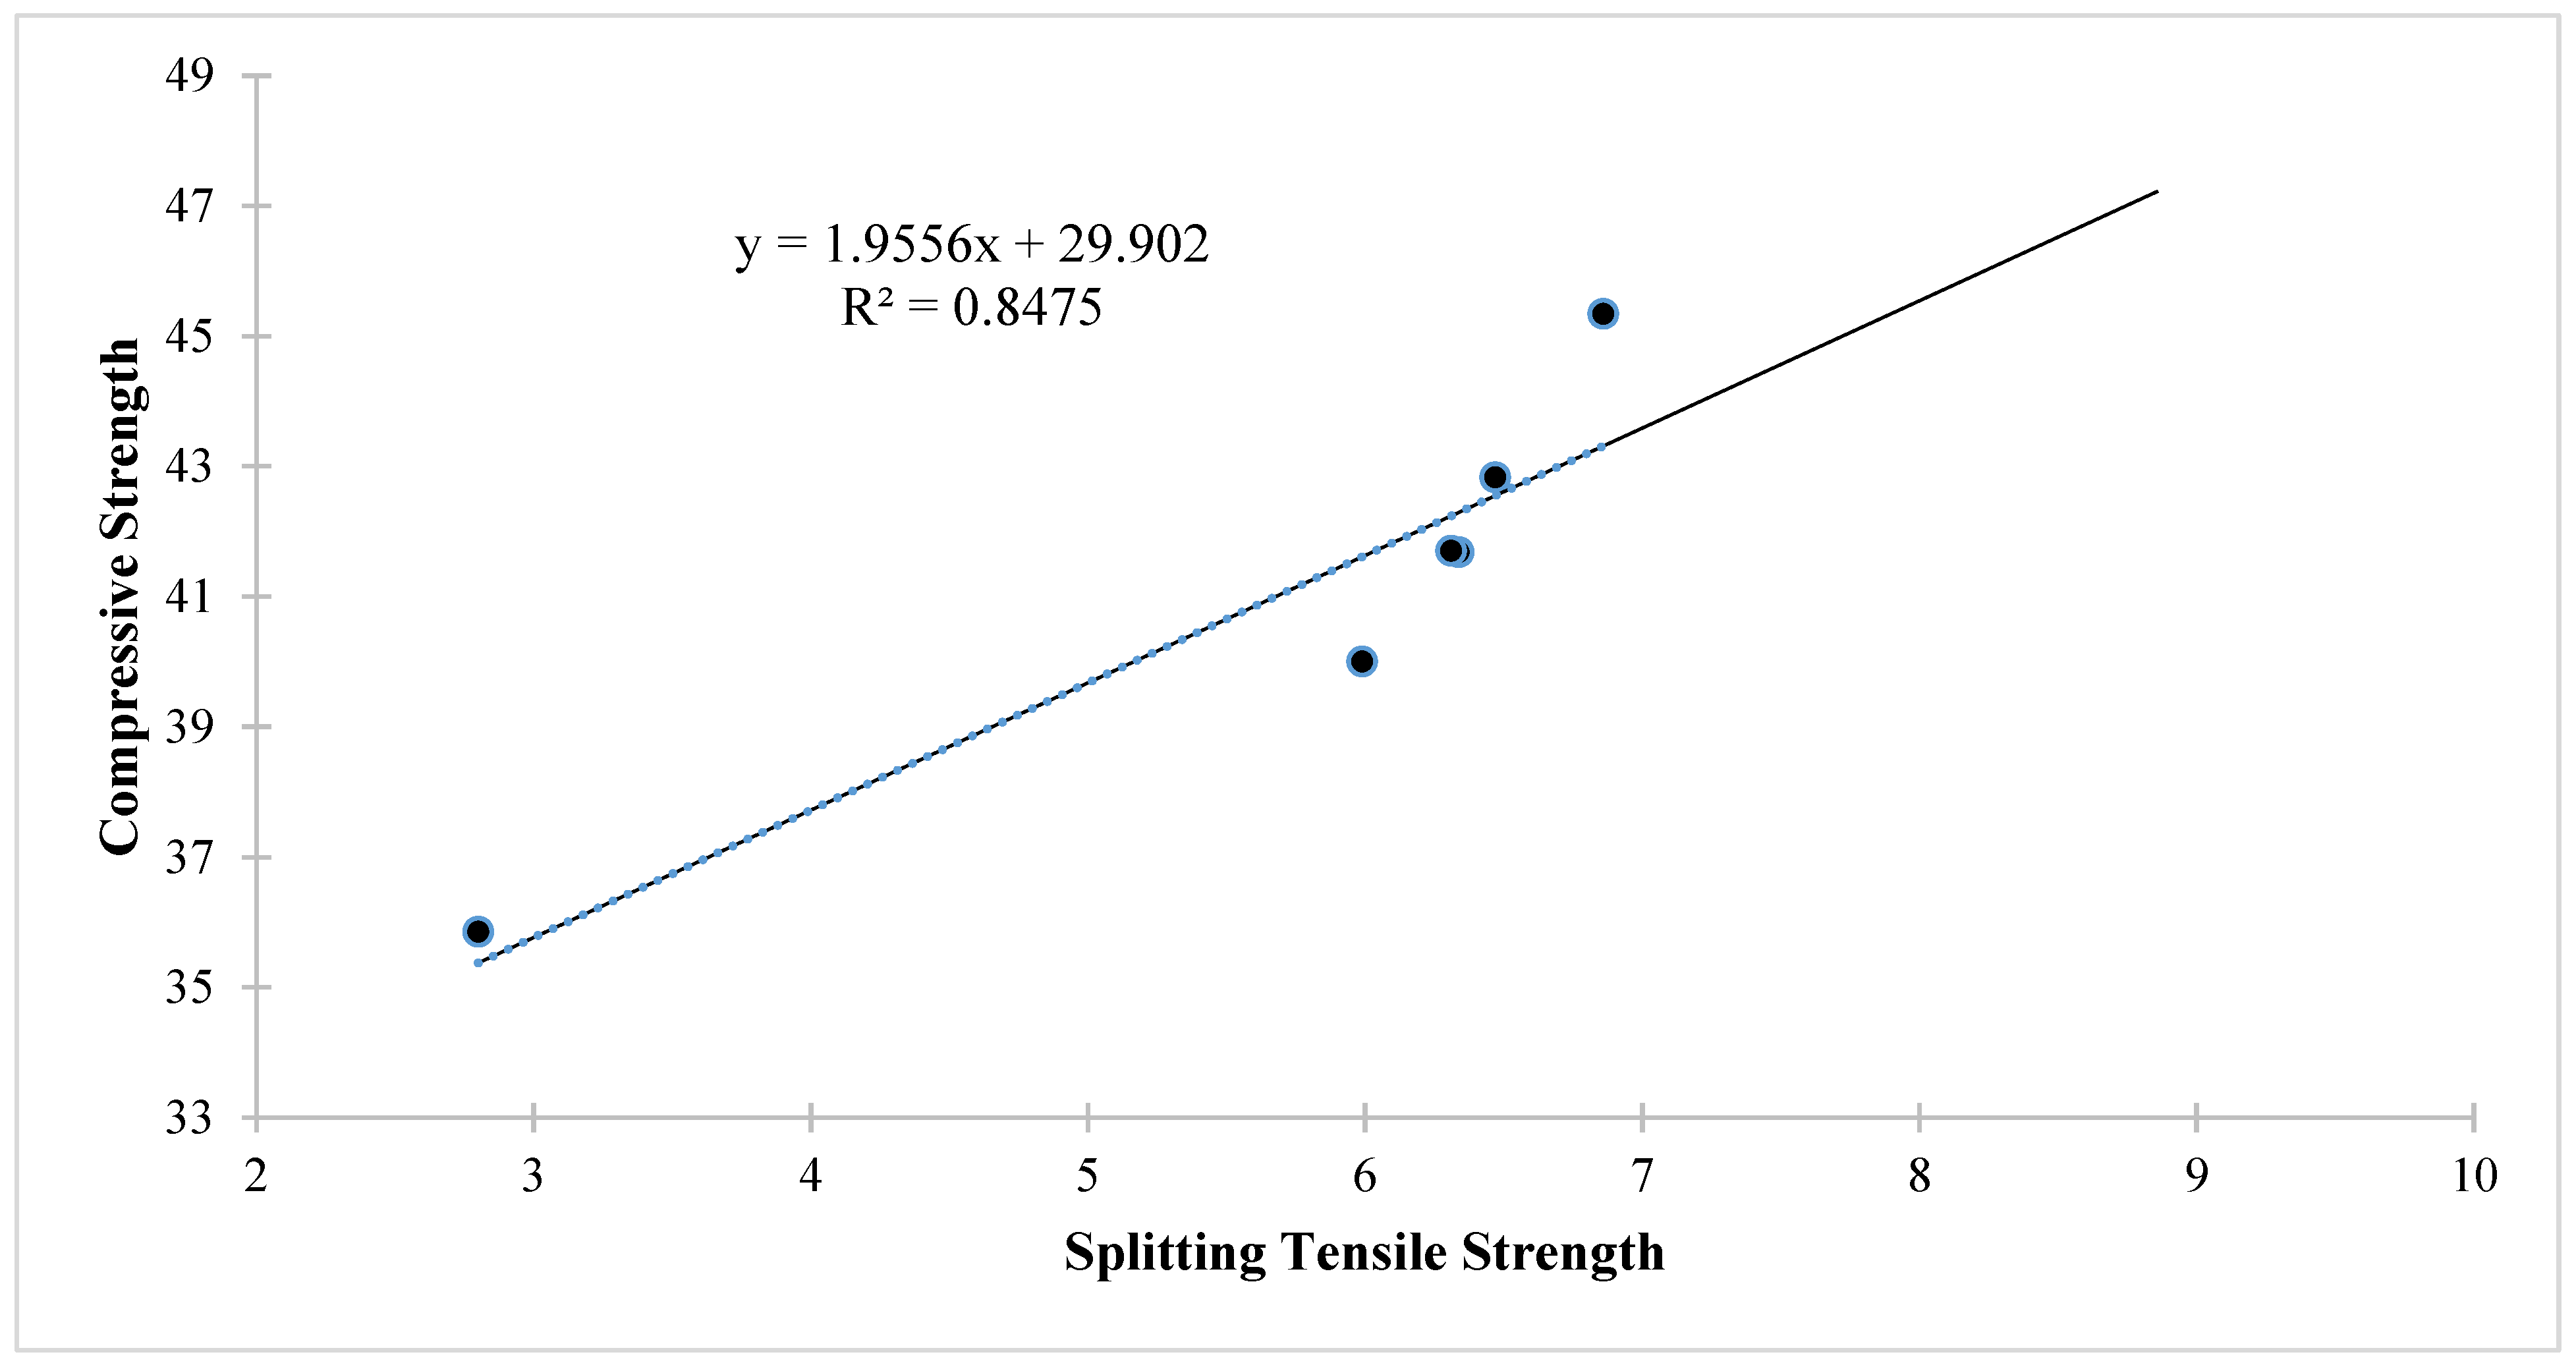
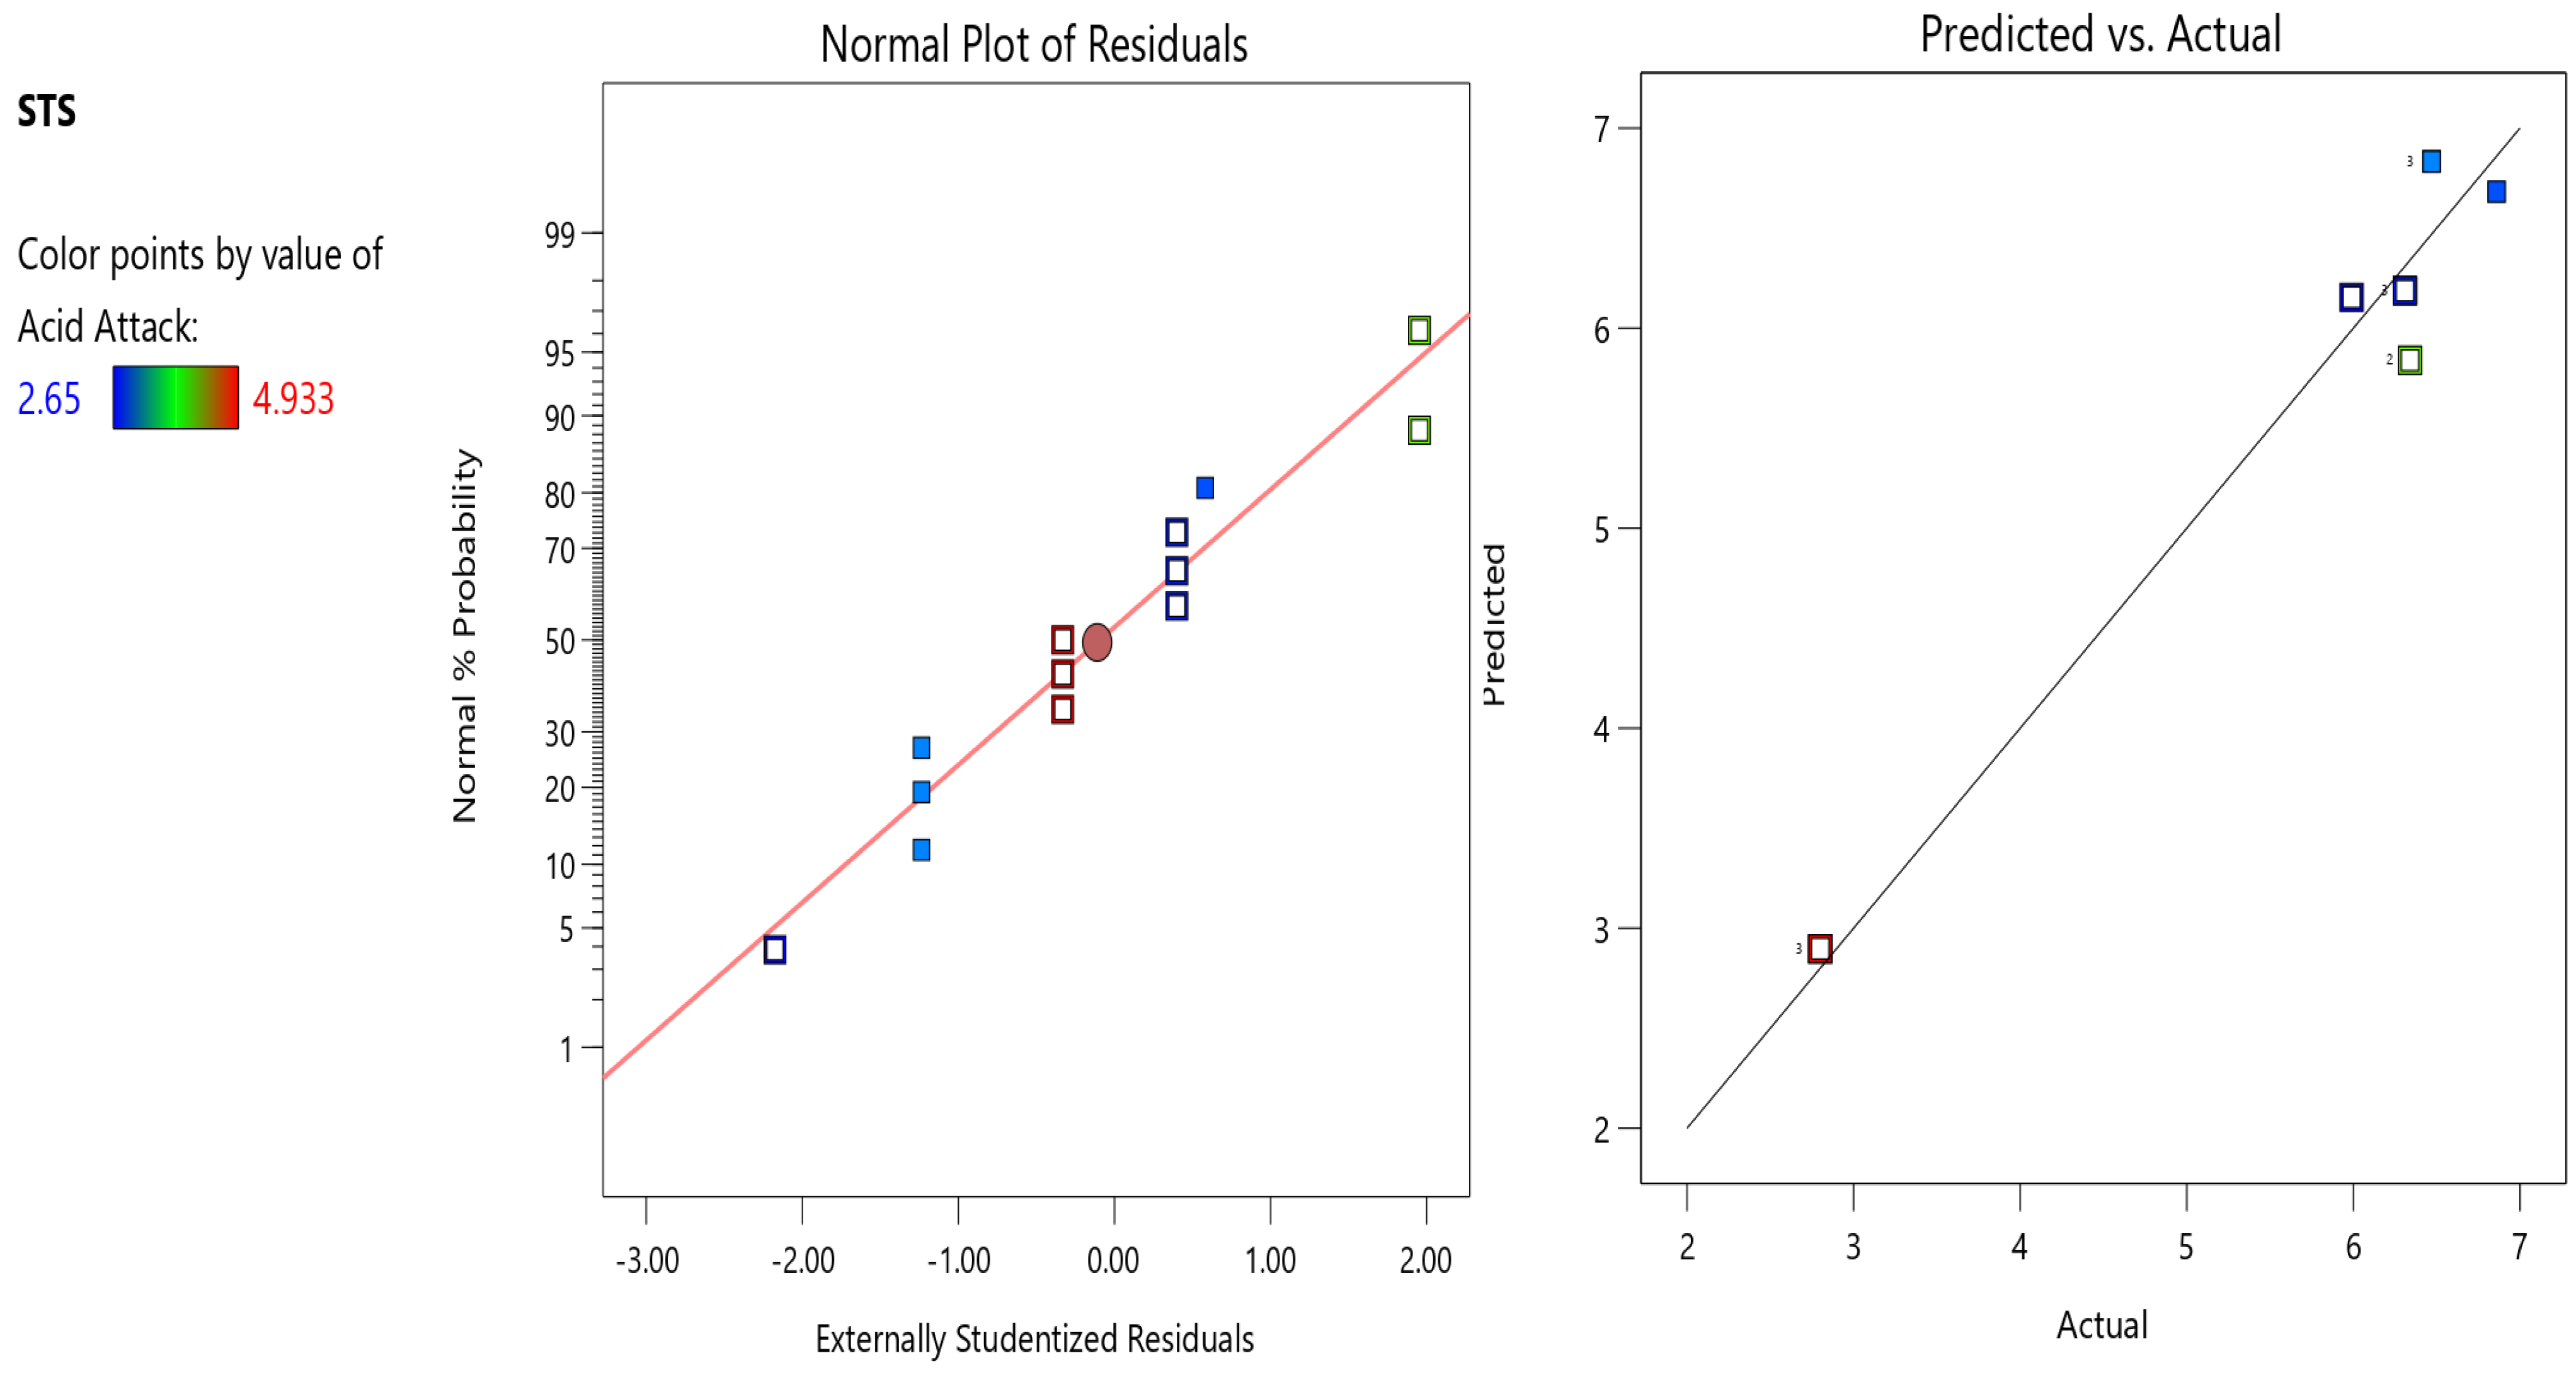
5.9.2. Split Tensile Strength
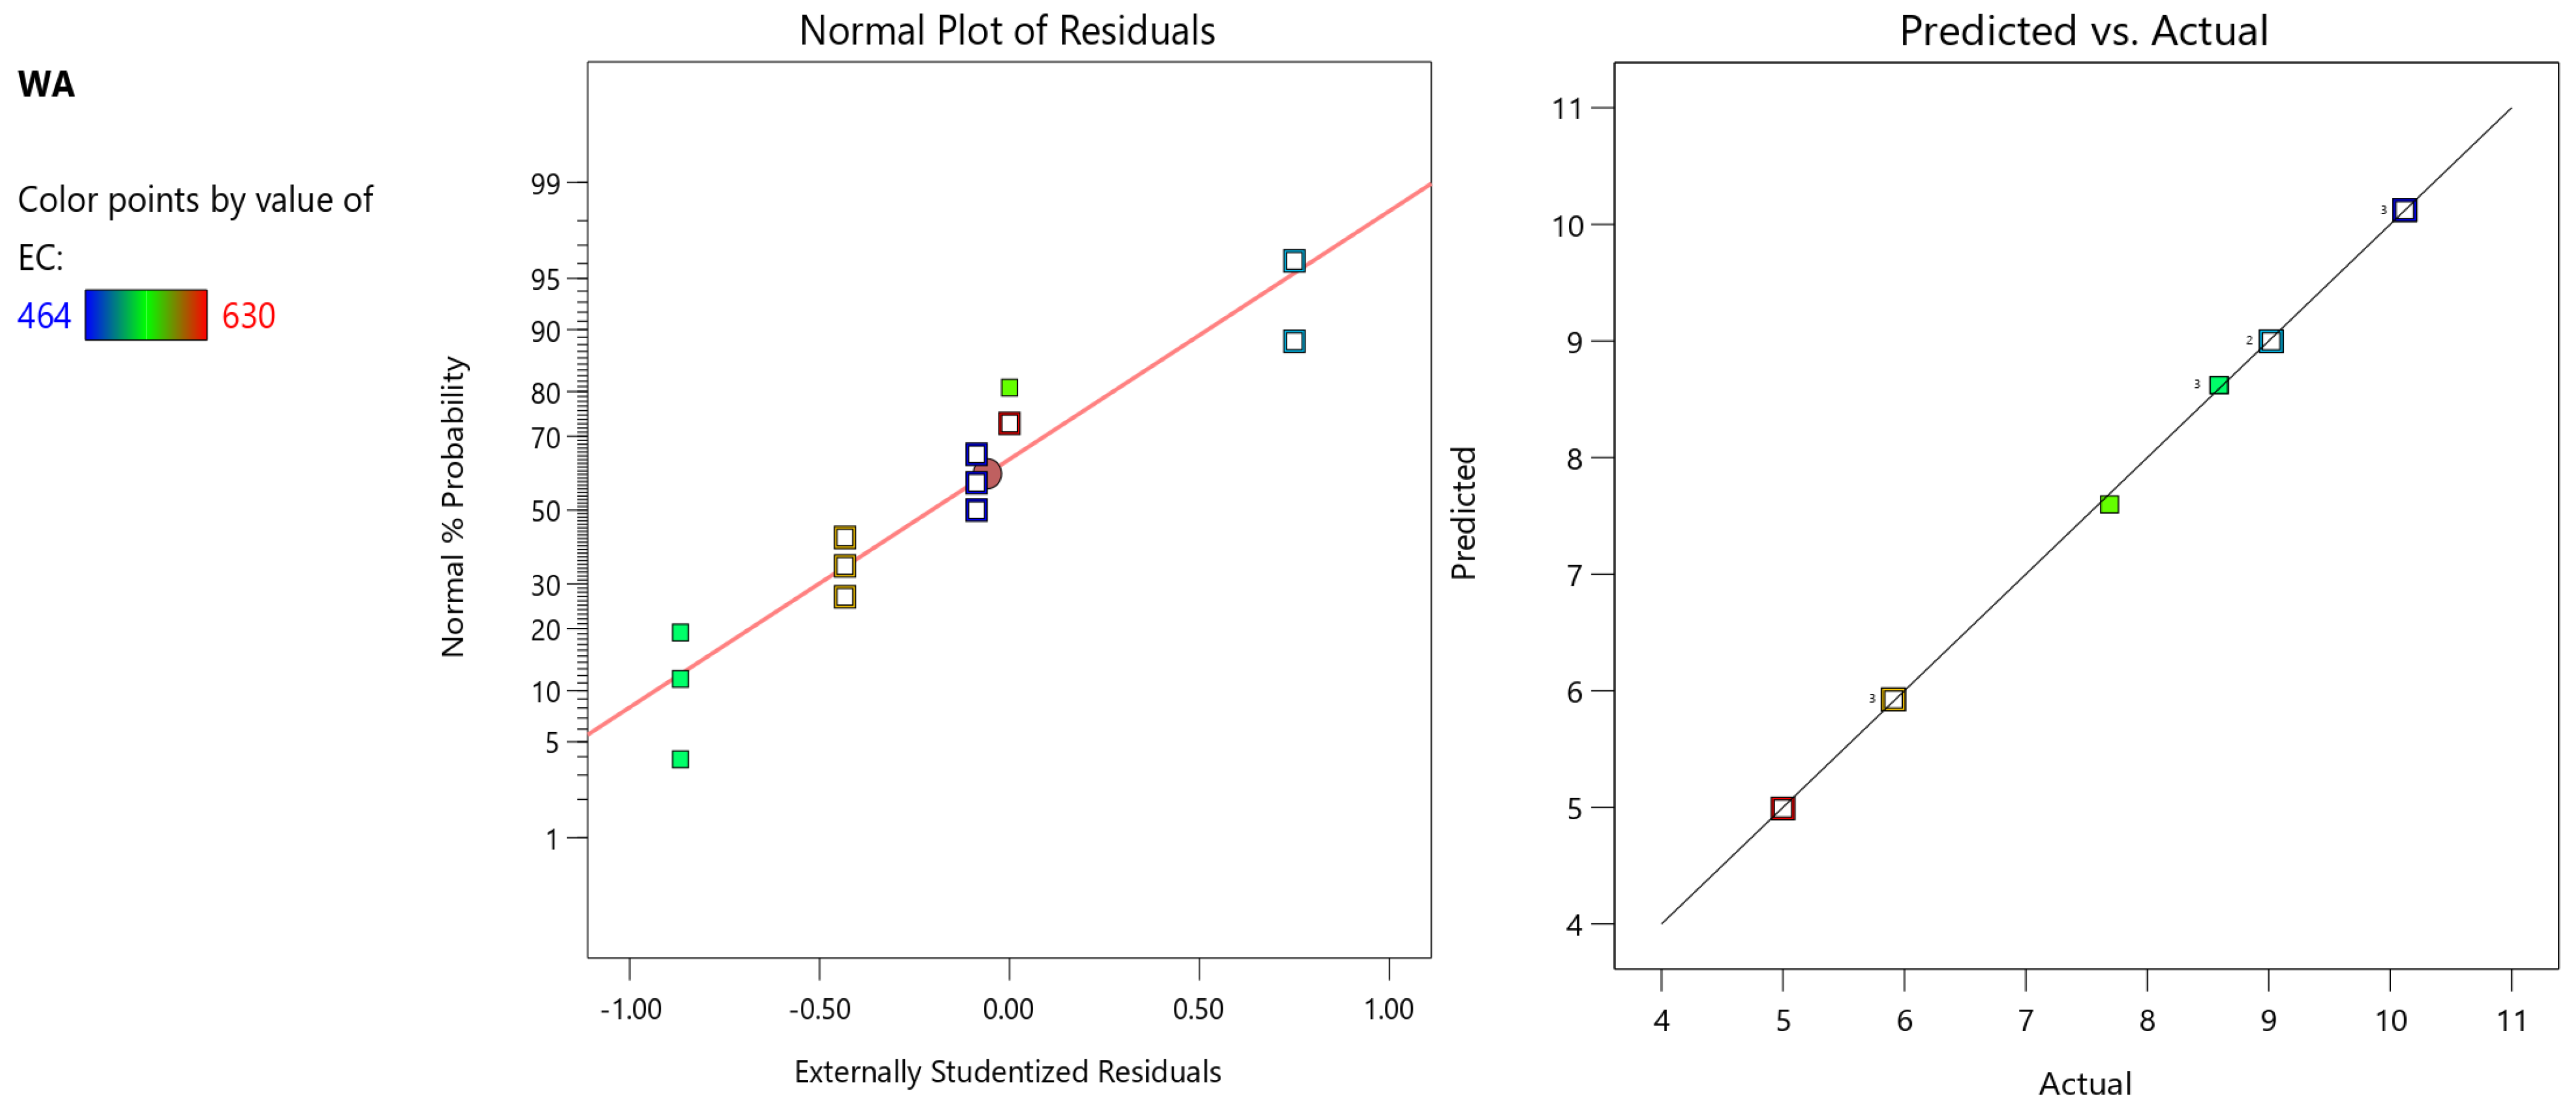
5.10. Water Absorption
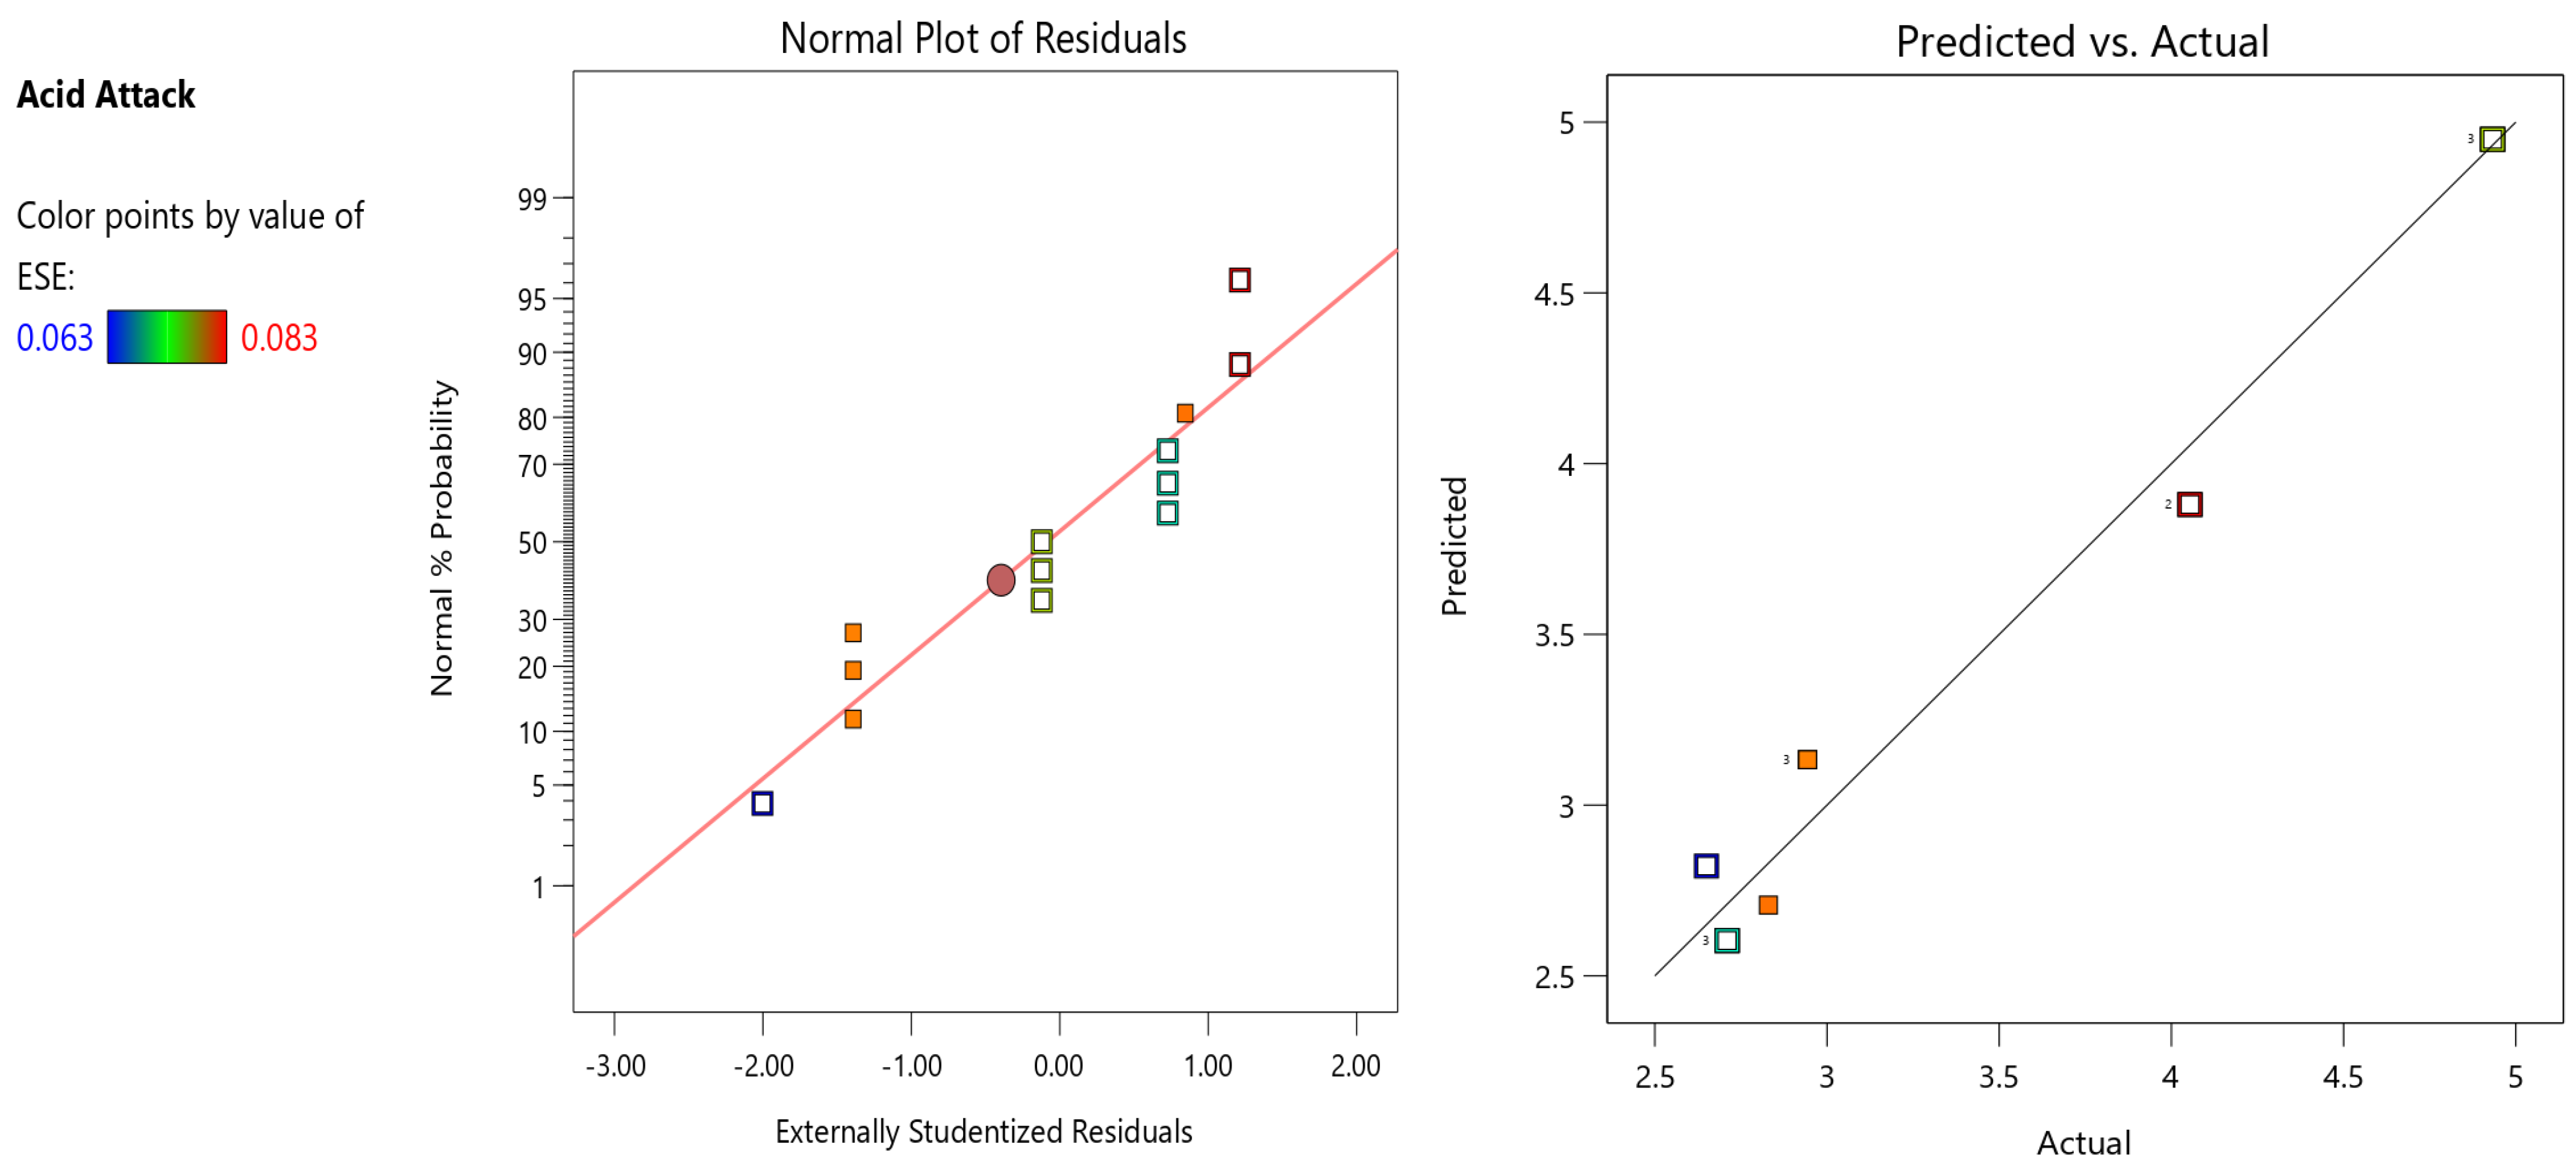
5.11. Acid Attack Test
5.12. Effects of Carbon Fiber on Environmental Sustainability of Concrete
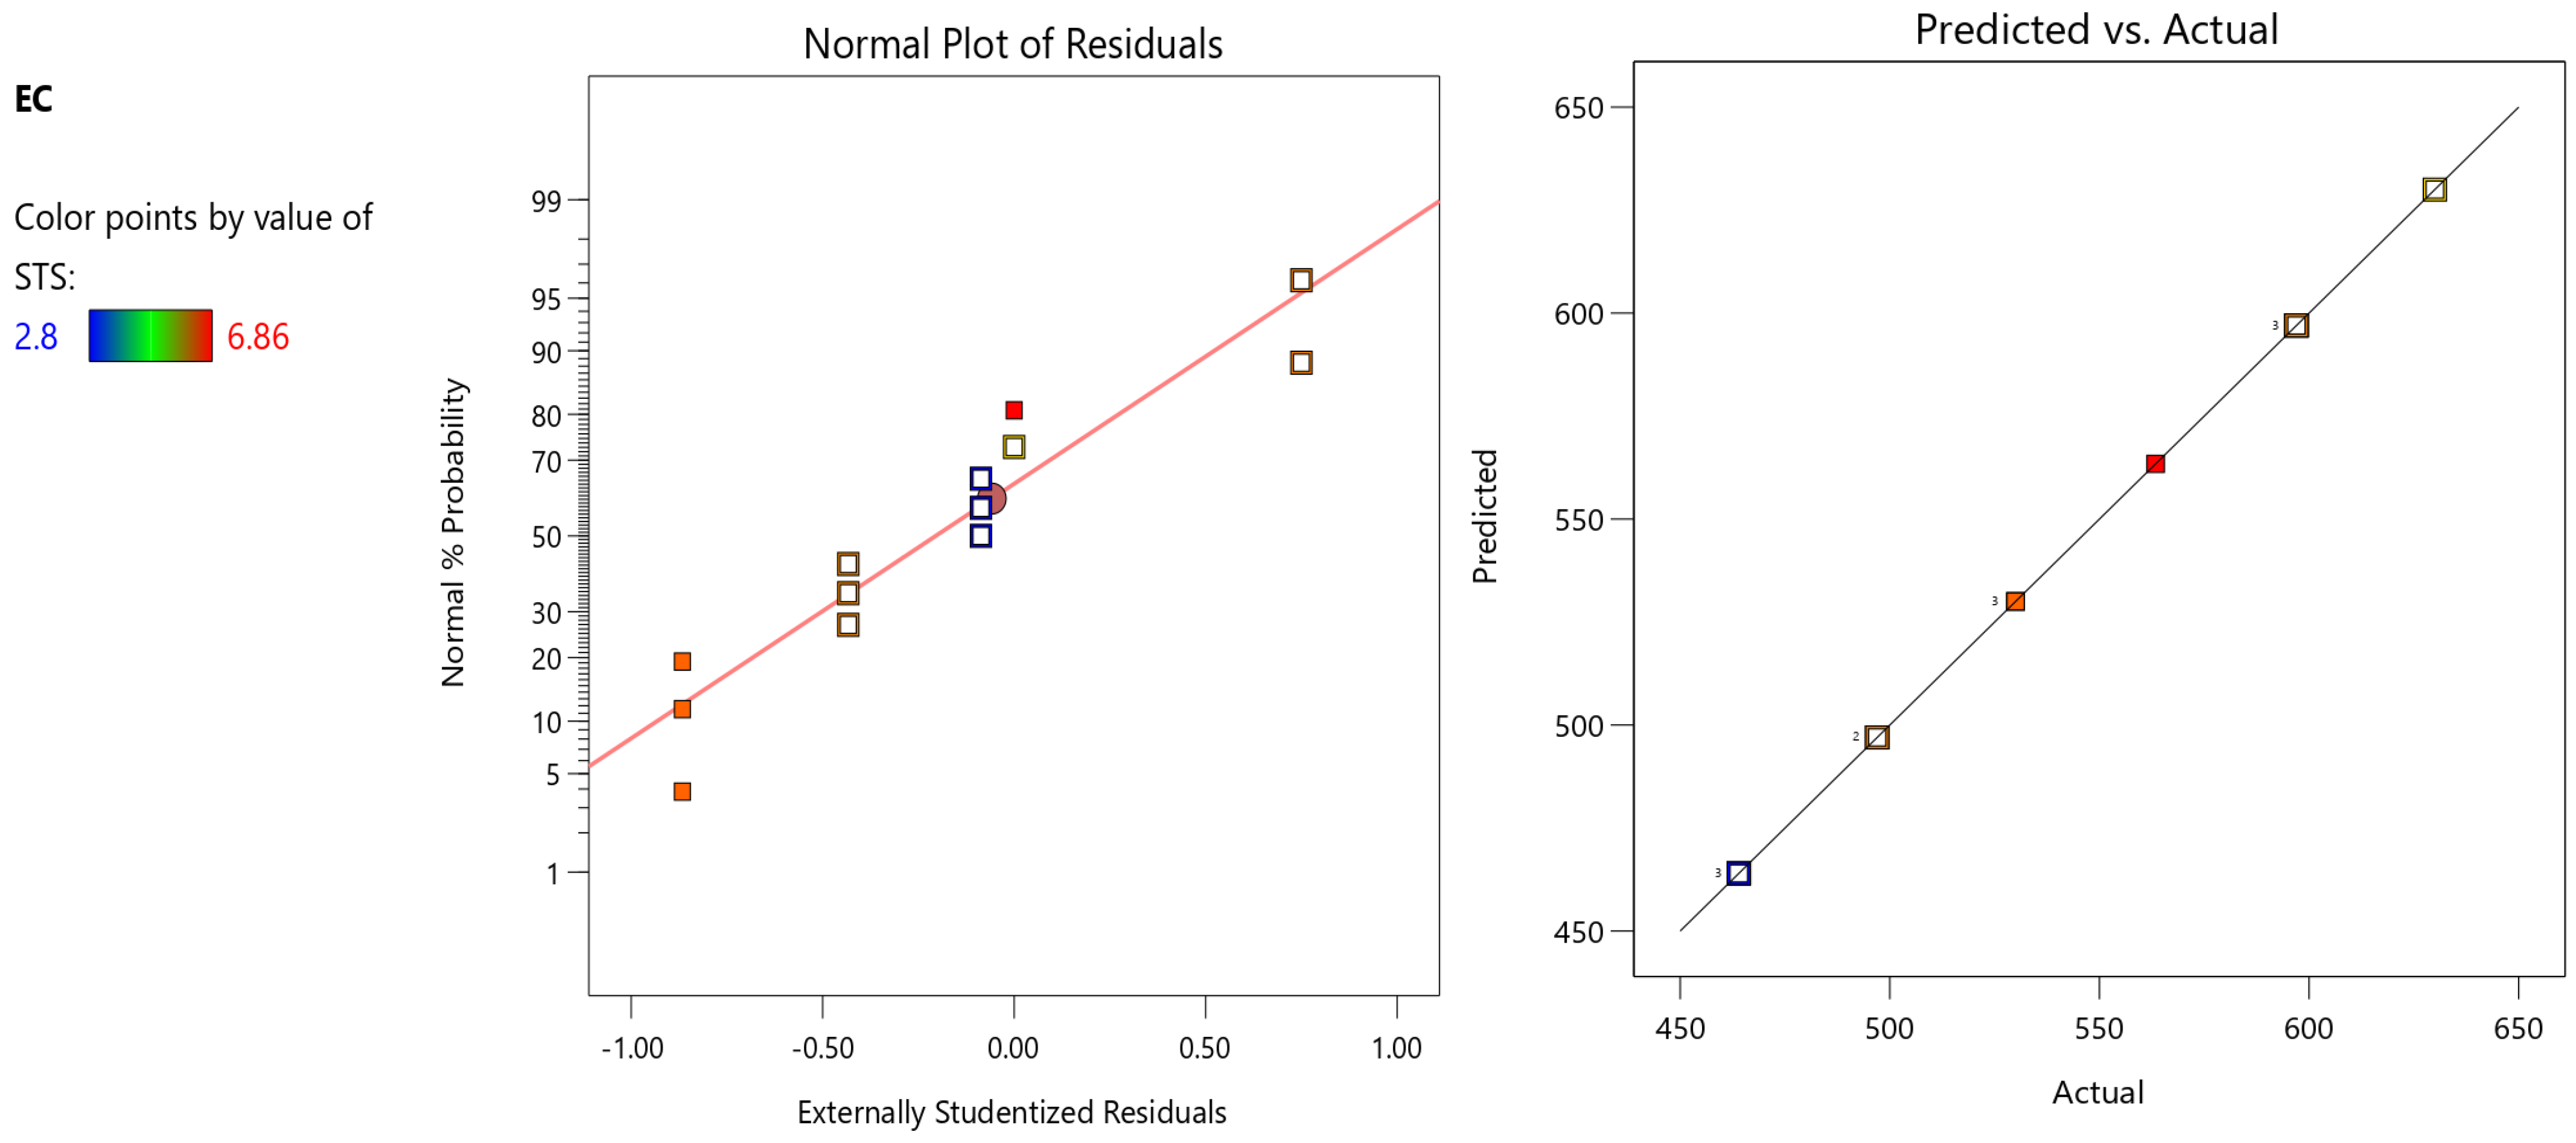
5.12.1. Embodied Carbon
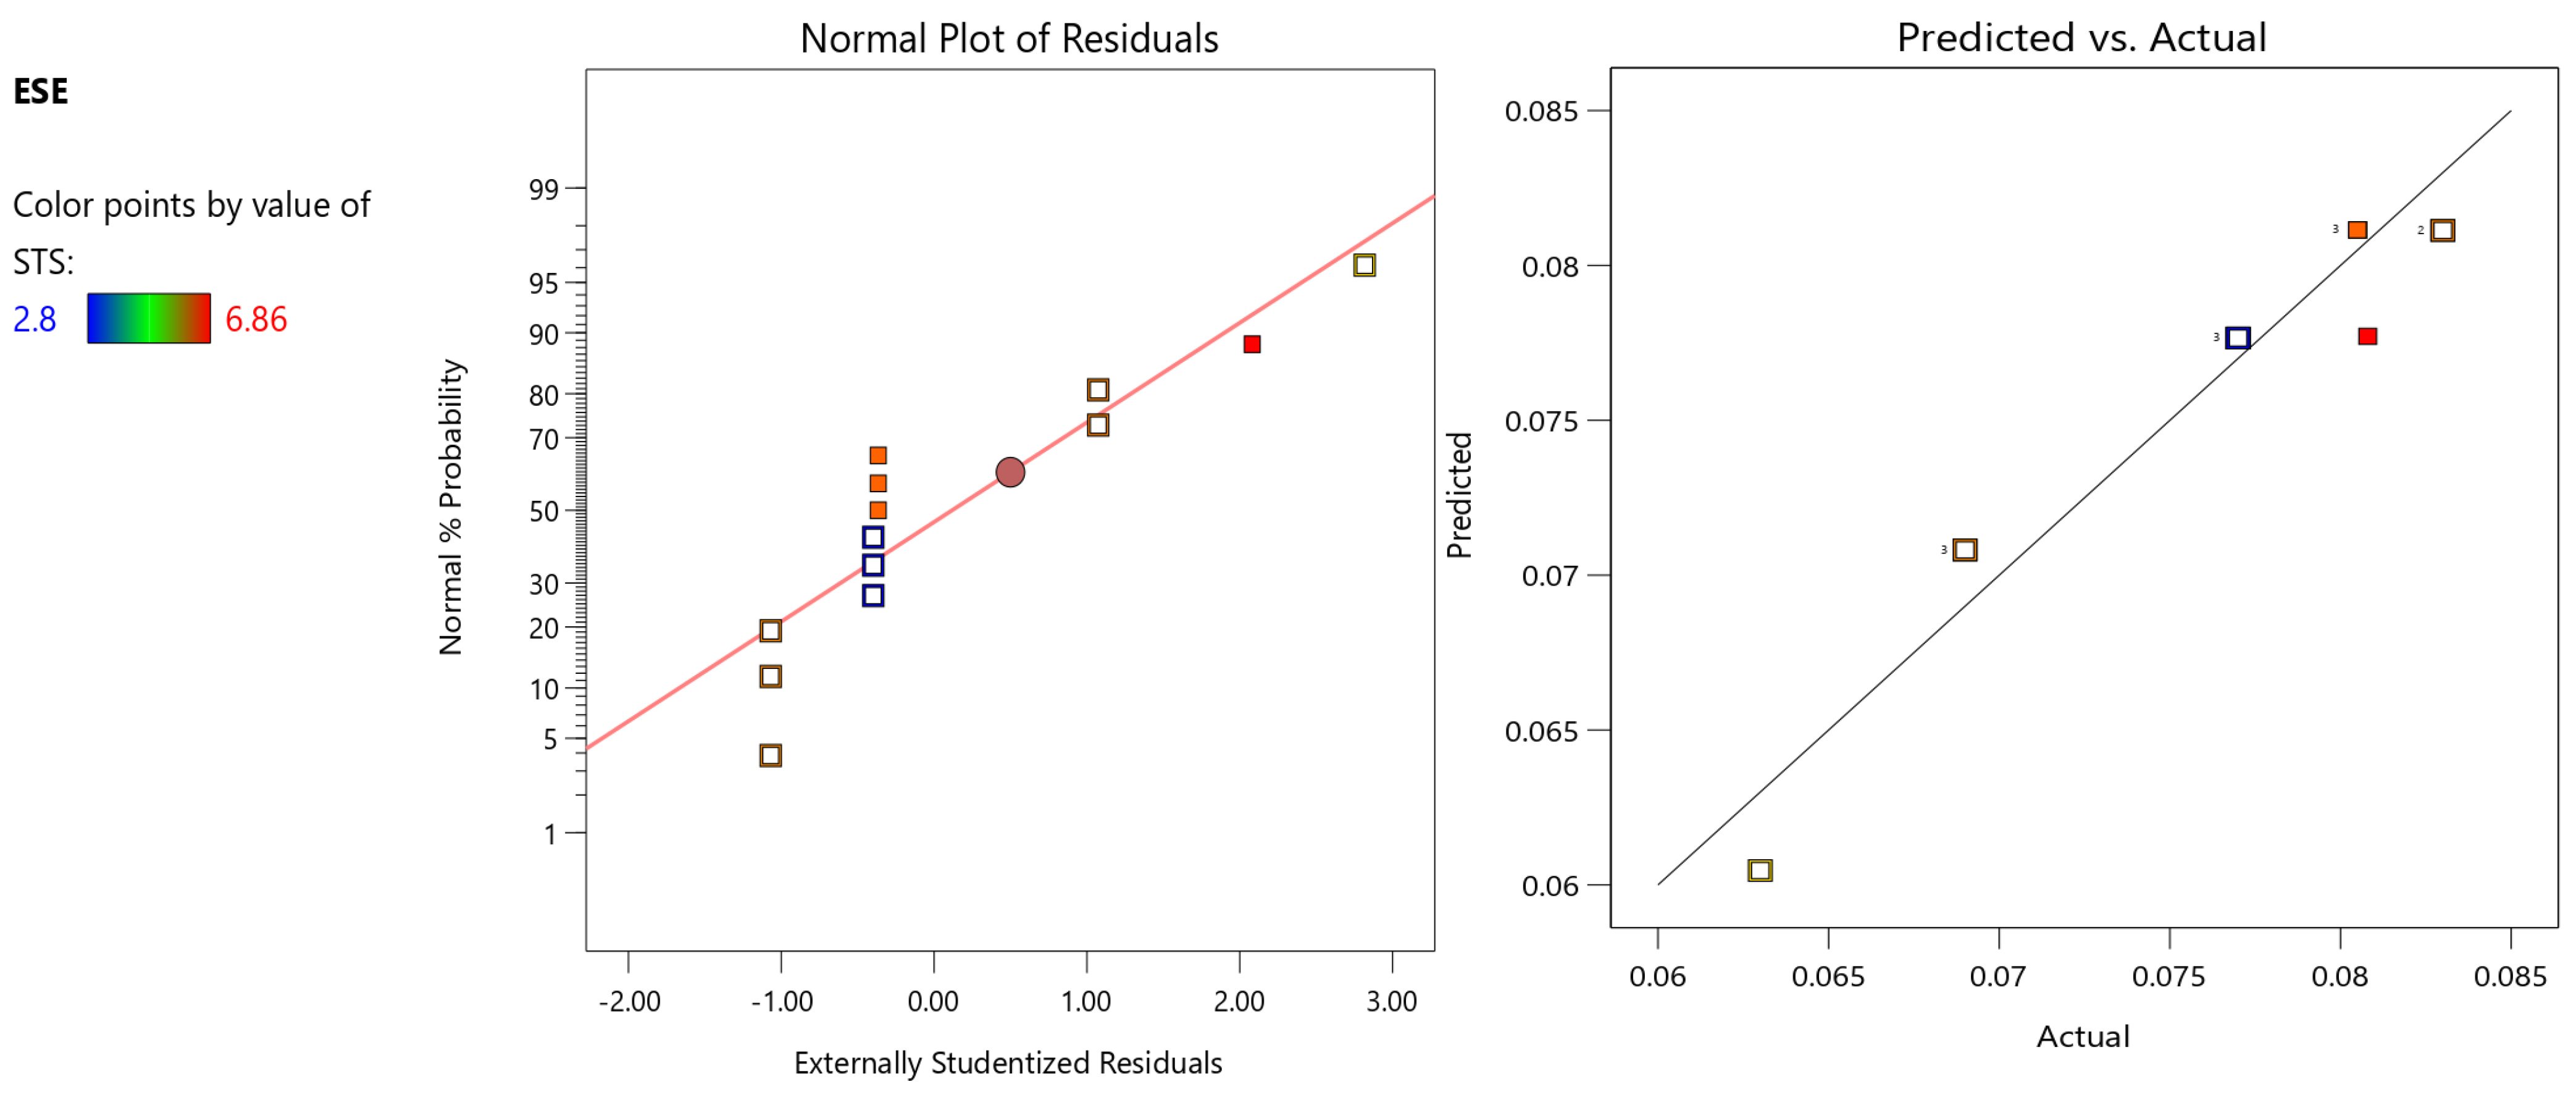
5.12.2. Eco-Strength Efficiency
5.12.3. Optimization and Model Validation
6. Conclusions
- CF0.60% provides the best and most desired outcomes for concrete blended with carbon fiber, according to testing data. Carbon fiber concentrations over 0.60% have no favorable effect on the fresh and hardened properties of concrete. It has been shown that the prediction models that are based on the p-value are statistically significant, and extremely useful for assessing the fresh and hardened mechanical properties of carbon fiber-containing concrete. All statistical findings for each answer were satisfactory and within range.
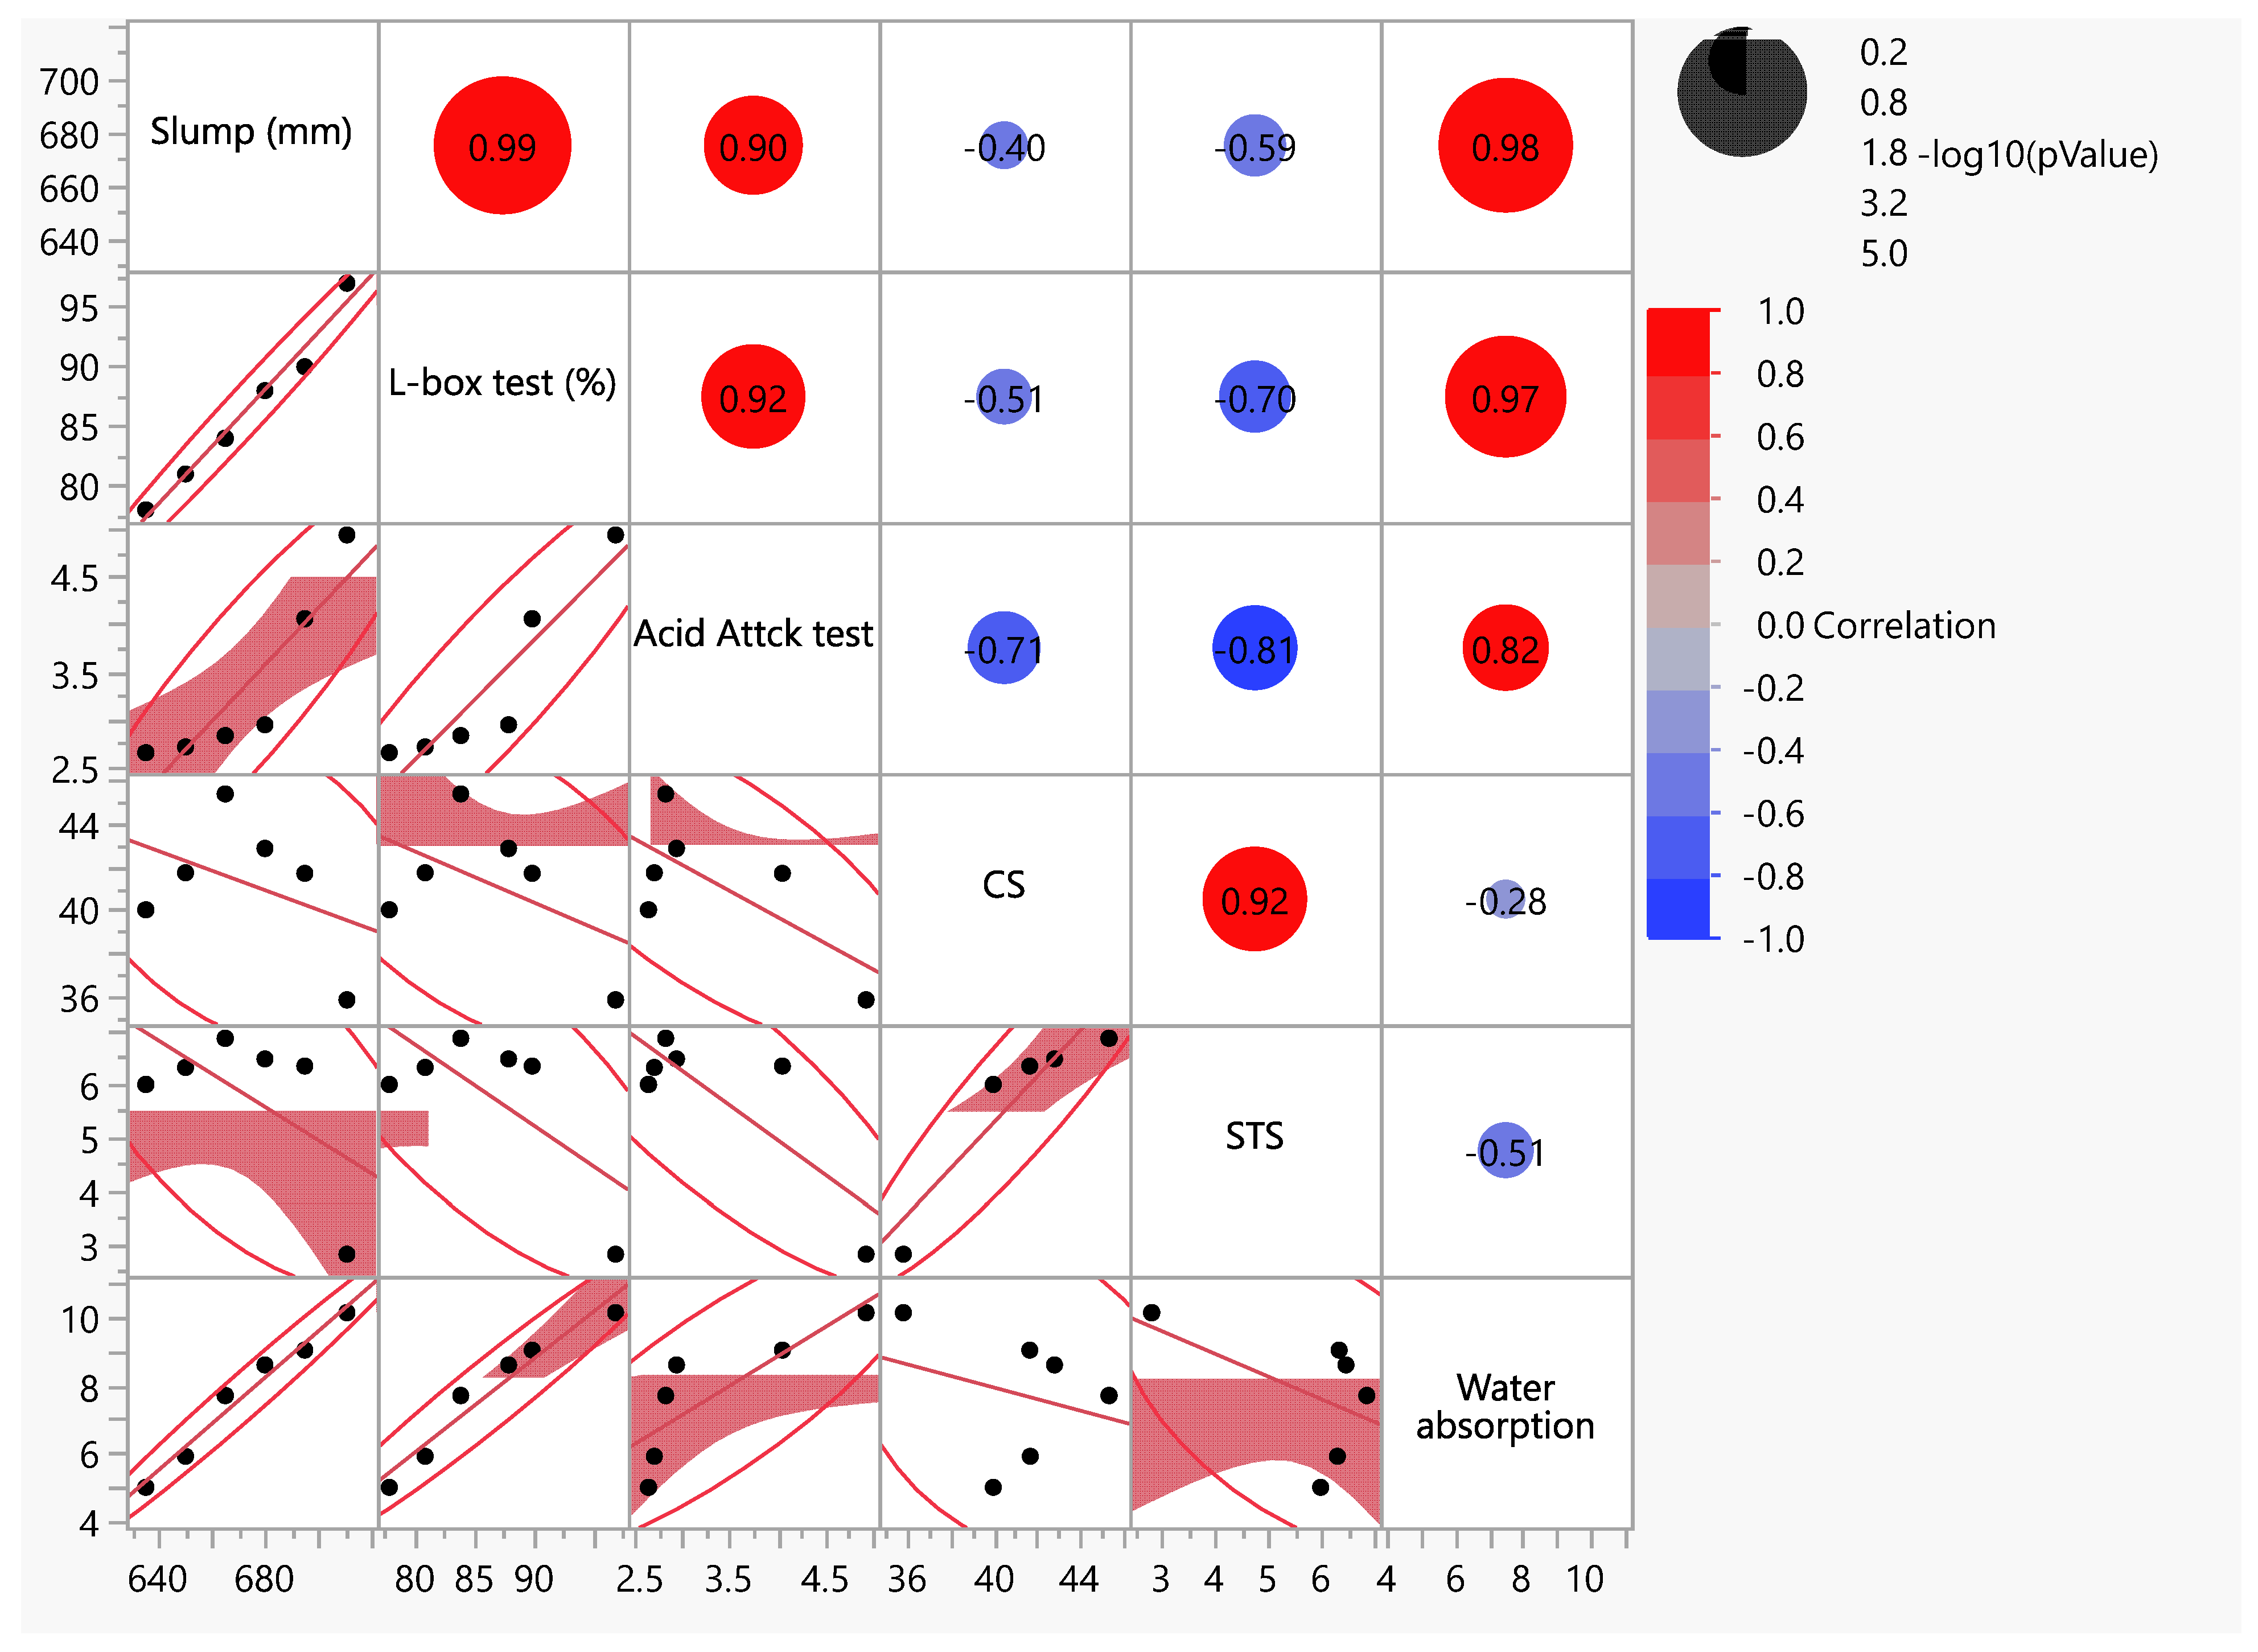
- The R-square values for each model component, including slump flow, L-box test, concrete’s compressive strength, split tensile strength, water absorption, acid attack test, embodied carbon, and eco-strength efficiency are 0.999, 0.985, 0.932, 0.965, 0.999, 0.977, 0.999, and 0.929, respectively.
- Optimum slump was found at 0% of carbon fiber, while the minimal slump flow was recorded at 1% of carbon fiber. It has been observed that the accumulations of carbon fiber in concrete results in reduced slump flow of fresh concrete.
- The highest compressive and split tensile strength was achieved by 45.342 and 6.86 MPa at 0.6% of carbon fiber in concrete at 28 days, respectively. Further addition of 0.6% carbon fiber in concrete causes the strength to start declining.
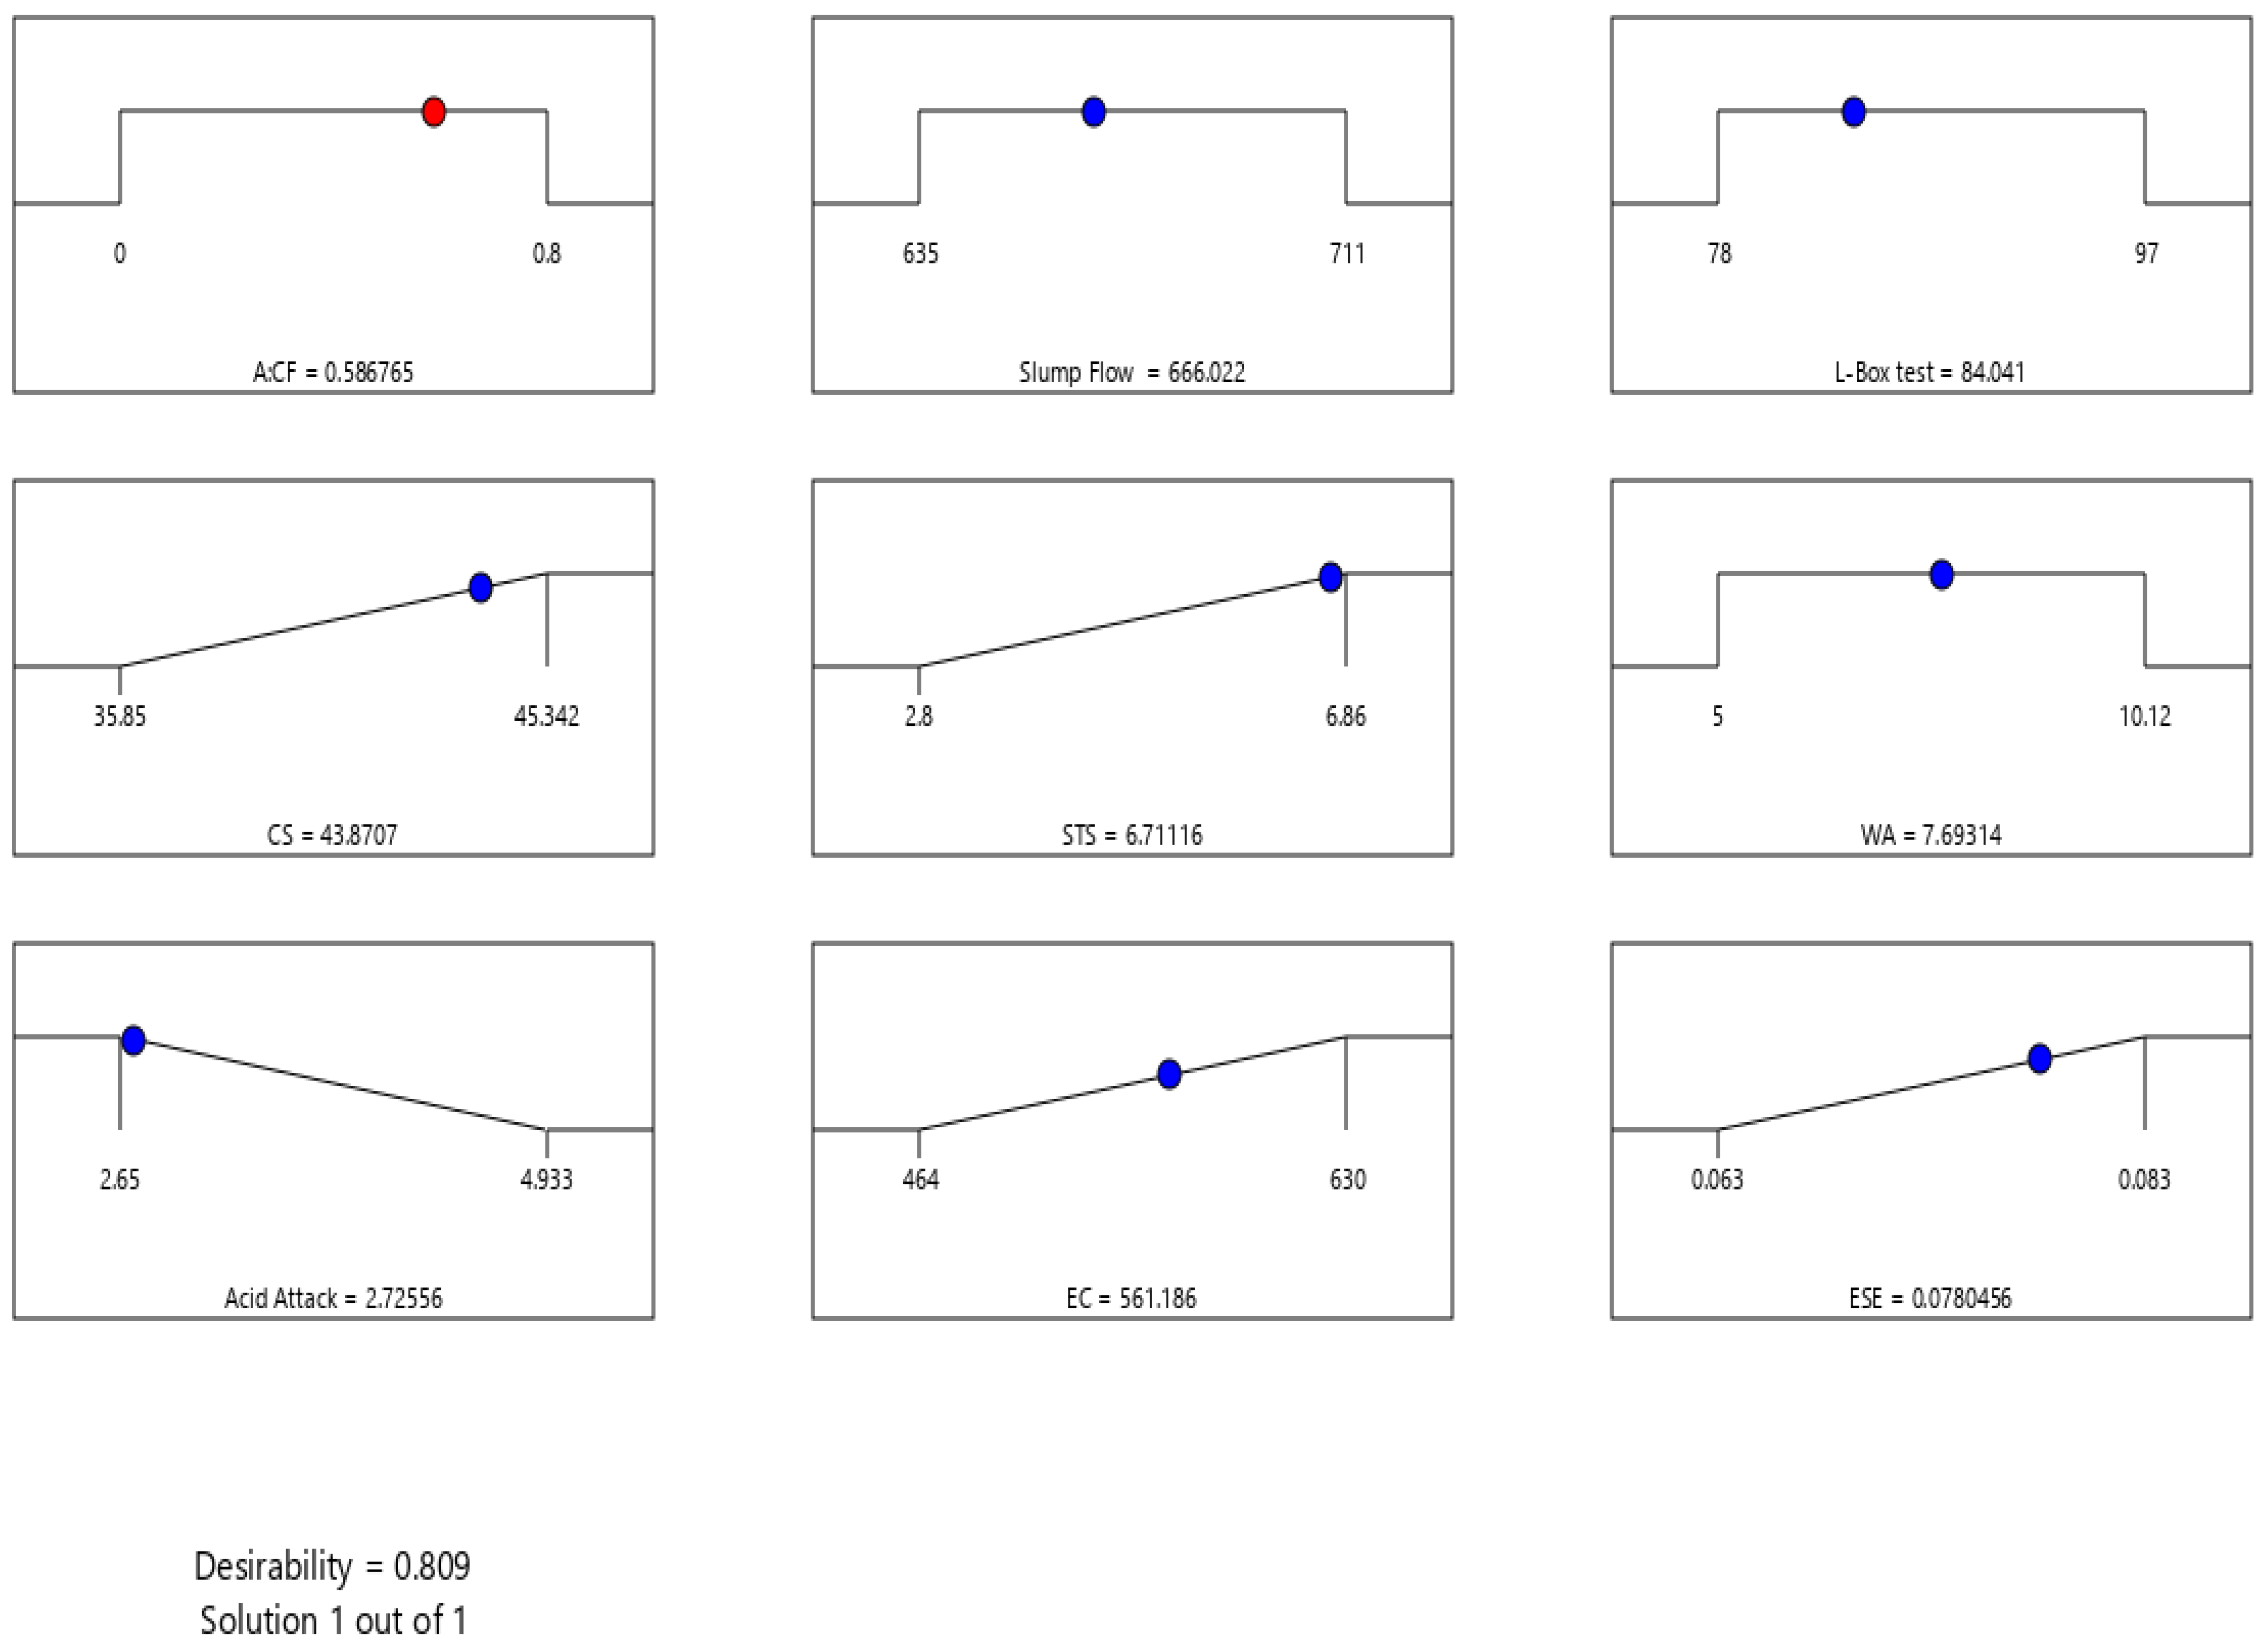
- Optimized responses were found with the value of slump, L-box test, compressive strength of concrete, split tensile strength, absorption of water, acid attack test, embodied carbon, and eco-strength efficiency that were 666.025, 84.041, 43.870, 6.711, 7.693, 2.725, 561.18, and 0.0780, respectively, with the desirability of 0.809.
Author Contributions
Funding
Data Availability Statement
Conflicts of Interest
References
- Wang, Z.; Ma, G.; Ma, Z.; Zhang, Y. Flexural Behavior of Carbon Fiber-Reinforced Concrete Beams under Impact Loading. Cem. Concr. Compos. 2021, 118, 103910. [Google Scholar] [CrossRef]
- Bheel, N.; Awoyera, P.; Shar, I.A.; Abbasi, S.A.; Khahro, S.H.; Prakash, A.K. Synergic Effect of Millet Husk Ash and Wheat Straw Ash on the Fresh and Hardened Properties of Metakaolin-Based Self-Compacting Geopolymer Concrete. Case Stud. Constr. Mater. 2021, 15, e00729. [Google Scholar] [CrossRef]
- Bheel, N.; Awoyera, P.; Tafsirojjaman, T.; Hamah Sor, N.; sohu, S. Synergic Effect of Metakaolin and Groundnut Shell Ash on the Behavior of Fly Ash-Based Self-Compacting Geopolymer Concrete. Constr. Build. Mater. 2021, 311, 125327. [Google Scholar] [CrossRef]
- Keerio, M.A.; Saand, A.; Kumar, A.; Bheel, N.; Ali, K. Effect of Local Metakaolin Developed from Natural Material Soorh and Coal Bottom Ash on Fresh, Hardened Properties and Embodied Carbon of Self-Compacting Concrete. Environ. Sci. Pollut. Res. 2021, 28, 60000–60018. [Google Scholar] [CrossRef] [PubMed]
- Hamah Sor, N.; Ali, T.K.M.; Vali, K.S.; Ahmed, H.U.; Faraj, R.H.; Bheel, N.; Mosavi, A. The Behavior of Sustainable Self-Compacting Concrete Reinforced with Low-Density Waste Polyethylene Fiber. Mater. Res. Express 2022, 9, 035501. [Google Scholar] [CrossRef]
- Kanellopoulos, A.; Savva, P.; Petrou, M.F.; Ioannou, I.; Pantazopoulou, S. Assessing the Quality of Concrete–Reinforcement Interface in Self Compacting Concrete. Constr. Build. Mater. 2020, 240, 117933. [Google Scholar] [CrossRef]
- Hama, S.M.; Hilal, N.N. Fresh Properties of Self-Compacting Concrete with Plastic Waste as Partial Replacement of Sand. Int. J. Sustain. Built Environ. 2017, 6, 299–308. [Google Scholar] [CrossRef]
- Bheel, N.; Ali, M.O.A.; Liu, Y.; Tafsirojjaman, T.; Awoyera, P.; Sor, N.H.; Romero, L.M.B. Utilization of Corn Cob Ash as Fine Aggregate and Ground Granulated Blast Furnace Slag as Cementitious Material in Concrete. Buildings 2021, 11, 422. [Google Scholar] [CrossRef]
- Bheel, N.; Ali, M.O.A.; Tafsirojjaman; Khahro, S.H.; Keerio, M.A. Experimental Study on Fresh, Mechanical Properties and Embodied Carbon of Concrete Blended with Sugarcane Bagasse Ash, Metakaolin, and Millet Husk Ash as Ternary Cementitious Material. Environ. Sci. Pollut. Res. 2022, 29, 5224–5239. [Google Scholar] [CrossRef]
- Channa, S.H.; Mangi, S.A.; Bheel, N.; Soomro, F.A.; Khahro, S.H. Short-Term Analysis on the Combined Use of Sugarcane Bagasse Ash and Rice Husk Ash as Supplementary Cementitious Material in Concrete Production. Environ. Sci. Pollut. Res. 2022, 29, 3555–3564. [Google Scholar] [CrossRef]
- Shan, J.; Shan, B.; Ouyang, J.; Zhang, W.; Yu, X.; Li, P.; Han, B. Rheological Properties of Cementitious Composites with Nano/Fiber Fillers. Constr. Build. Mater. 2018, 158, 786–800. [Google Scholar] [CrossRef]
- Bušić, R.; Miličević, I.; Šipoš, T.K.; Strukar, K. Recycled Rubber as an Aggregate Replacement in Self-Compacting Concrete-Literature Overview. Materials 2018, 11, 1729. [Google Scholar] [CrossRef] [Green Version]
- Chen, Z.Y.; Yang, J. Experimental Study on Dynamic Splitting Characteristics of Carbon Fiber Reinforced Concrete. Materials 2021, 14, 94. [Google Scholar] [CrossRef]
- Xian, G.; Guo, R.; Li, C.; Wang, Y. Mechanical Performance Evolution and Life Prediction of Prestressed CFRP Plate Exposed to Hygrothermal and Freeze-Thaw Environments. Compos. Struct. 2022, 293, 115719. [Google Scholar] [CrossRef]
- Li, C.; Xian, G. Mechanical Property Evolution and Life Prediction of Carbon Fiber and Pultruded Carbon Fiber Reinforced Polymer Plate Exposed to Elevated Temperatures. Polym. Compos. 2020, 41, 5143–5155. [Google Scholar] [CrossRef]
- Ma, A.; Abba, S.I.; Nuruddeen, M.M. Self-Compacting Concrete—A Review. Int. J. Innov. Technol. Explor. Eng. 2017, 6, 1–8. [Google Scholar]
- Bowden, G.D.; Pichler, B.J.; Maurer, A. A Design of Experiments (DoE) Approach Accelerates the Optimization of Copper-Mediated 18F-Fluorination Reactions of Arylstannanes. Sci. Rep. 2019, 9, 11370. [Google Scholar] [CrossRef] [PubMed] [Green Version]
- Zahraee, S.M. Teaching the Design of Experiment and Response Surface Methodology Using Paper Helicopter Experiment. In Proceedings of the 4th International Graduate conference on Engineering, Science and Humanity, Johor Bahru, Johor, Malaysia, 16–17 April 2013; pp. 1–11. [Google Scholar]
- Dejaegher, B.; Heyden, Y. Vander Experimental Designs and Their Recent Advances in Set-up, Data Interpretation, and Analytical Applications. J. Pharm. Biomed. Anal. 2011, 56, 141–158. [Google Scholar] [CrossRef] [PubMed]
- Chong, B.W.; Othman, R.; Ramadhansyah, P.J.; Doh, S.I.; Li, X. Properties of Concrete with Eggshell Powder: A Review. Phys. Chem. Earth 2020, 120, 102951. [Google Scholar] [CrossRef]
- Wu, S.S.; Li, B.Z.; Yang, J.G.; Shukla, S.K. Predictive Modeling of High-Performance Concrete with Regression Analysis. In Proceedings of the 2010 IEEE International Conference on Industrial Engineering and Engineering Management, Macao, China, 7–10 December 2010; pp. 1009–1013. [Google Scholar]
- Tanco, M.; Viles, E.; Ilzarbe, L.; Alvarez, M.J. Is Design of Experiments Really Used? A Survey of Basque Industries. J. Eng. Des. 2008, 19, 447–460. [Google Scholar] [CrossRef]
- Silva, F.A.N.; Delgado, J.M.P.Q.; Cavalcanti, R.S.; Azevedo, A.C.; Guimarães, A.S.; Lima, A.G.B. Use of Nondestructive Testing of Ultrasound and Artificial Neural Networks to Estimate Compressive Strength of Concrete. Buildings 2021, 11, 44. [Google Scholar] [CrossRef]
- Poorarbabi, A.; Ghasemi, M.; Azhdary Moghaddam, M. Concrete Compressive Strength Prediction Using Non-Destructive Tests through Response Surface Methodology. Ain Shams Eng. J. 2020, 11, 939–949. [Google Scholar] [CrossRef]
- Li, L.; Xuan, D.; Sojobi, A.O.; Liu, S.; Chu, S.H.; Poon, C.S. Development of Nano-Silica Treatment Methods to Enhance Recycled Aggregate Concrete. Cem. Concr. Compos. 2021, 118, 103963. [Google Scholar] [CrossRef]
- Cibilakshmi, G.; Jegan, J. A DOE Approach to Optimize the Strength Properties of Concrete Incorporated with Different Ratios of PVA Fibre and Nano-Fe2O3. Adv. Compos. Lett. 2020, 29, 1–16. [Google Scholar] [CrossRef] [Green Version]
- Wei, C.B.; Othman, R.; Sheng, T.W.; Jaya, R.P.; Bakri Abdullah, M.M. Al Properties of Mortar with Waste Tyre Rubber as Partial Sand Replacement. Key Eng. Mater. 2021, 879, 49–61. [Google Scholar] [CrossRef]
- Rizalman, A.N.; Lee, C.C. Comparison of Artificial Neural Network (ANN) and Response Surface Methodology (RSM) in Predicting the Compressive Strength of POFA Concrete. Appl. Model. Simul. 2020, 4, 210–216. [Google Scholar]
- Rahim, N.I.; Mohammed, B.S.; Abdulkadir, I.; Dahim, M. Effect of Crumb Rubber, Fly Ash, and Nanosilica on the Properties of Self-Compacting Concrete Using Response Surface Methodology. Materials 2022, 15, 1501. [Google Scholar] [CrossRef] [PubMed]
- Lokuge, W.; Wilson, A.; Gunasekara, C.; Law, D.W.; Setunge, S. Design of Fly Ash Geopolymer Concrete Mix Proportions Using Multivariate Adaptive Regression Spline Model. Constr. Build. Mater. 2018, 166, 472–481. [Google Scholar] [CrossRef]
- Sarabia, L.A.; Ortiz, M.C. Response Surface Methodology. Compr. Chemom. 2009, 1, 345–390. [Google Scholar] [CrossRef]
- Waqar, A.; Bheel, N.; Shafiq, N.; Othman, I.; Khan, M.B.; Mansoor, M.S.; Benjeddou, O.; Yaseen, G. Effect of Volcanic Pumice Powder Ash on the Properties of Cement Concrete Using Response Surface Methodology. J. Build. Pathol. Rehabil. 2023, 8, 17. [Google Scholar] [CrossRef]
- Aydar, A.Y. Utilization of Response Surface Methodology in Optimization of Extraction of Plant Materials. In Statistical Approaches with Emphasis on Design of Experiments Applied to Chemical Processes; InTech: Rijeka, Croatia, 2018. [Google Scholar] [CrossRef] [Green Version]
- Bezerra, M.A.; Santelli, R.E.; Oliveira, E.P.; Villar, L.S.; Escaleira, L.A. Response Surface Methodology (RSM) as a Tool for Optimization in Analytical Chemistry. Talanta 2008, 76, 965–977. [Google Scholar] [CrossRef] [PubMed]
- Ferreira, S.L.C.; Dos Santos, W.N.L.; Quintella, C.M.; Neto, B.B.; Bosque-Sendra, J.M. Doehlert Matrix: A Chemometric Tool for Analytical Chemistry-Review. Talanta 2004, 63, 1061–1067. [Google Scholar] [CrossRef]
- Willden, C.; Jensen, W.A. Optimal Designs with Axial Values. J. Qual. Technol. 2020, 52, 235–248. [Google Scholar] [CrossRef]
- American Society for Testing Materials. Form and Style for ASTM Standards; ASTM: West Conshohocken, PA, USA, 1989. [Google Scholar]
- Shakir Abbood, I.; aldeen Odaa, S.; Hasan, K.F.; Jasim, M.A. Properties Evaluation of Fiber Reinforced Polymers and Their Constituent Materials Used in Structures–A Review. Mater. Today Proc. 2021, 43, 1003–1008. [Google Scholar] [CrossRef]
- Abbas, N.; Saad, M.; Habib, M. Impact of Carbon Fibers on Mechanical and Durability Properties of Self-Compacting Concrete. Eng. Proc. 2022, 22, 9. [Google Scholar] [CrossRef]
- Yakhlaf, M. Development of Carbon Fiber Reinforced Self-Consolidating Concrete Patch for Repair Applications. Master’s Thesis, University of Waterloo, Waterloo, ON, Canada, 2013. [Google Scholar]
- Nevsky, A.; Kudyakov, K.; Danke, I.; Kudyakov, A.; Kudyakov, V. Improvement of Cement Concrete Strength Properties by Carbon Fiber Additives. AIP Conf. Proc. 2016, 1698, 070005. [Google Scholar] [CrossRef] [Green Version]
- Atiyeh, M.; Aydin, E. Carbon-Fiber Enriched Cement-Based Composites for Better Sustainability. Materials 2020, 13, 1899. [Google Scholar] [CrossRef] [Green Version]
- Collins, F. Inclusion of Carbonation during the Life Cycle of Built and Recycled Concrete: Influence on Their Carbon Footprint. Int. J. Life Cycle Assess. 2010, 15, 549–556. [Google Scholar] [CrossRef]
- Thilakarathna, P.S.M.; Seo, S.; Baduge, K.S.K.; Lee, H.; Mendis, P.; Foliente, G. Embodied Carbon Analysis and Benchmarking Emissions of High and Ultra-High Strength Concrete Using Machine Learning Algorithms. J. Clean. Prod. 2020, 262, 121281. [Google Scholar] [CrossRef]
- Cushman, B.R. Energy Consumption Energy Type. 2017; 1–12. [Google Scholar]
- Turner, L.K.; Collins, F.G. Carbon Dioxide Equivalent (CO2-e) Emissions: A Comparison between Geopolymer and OPC Cement Concrete. Constr. Build. Mater. 2013, 43, 125–130. [Google Scholar] [CrossRef]
- Kumar, R.; Shafiq, N.; Kumar, A.; Jhatial, A.A. Investigating Embodied Carbon, Mechanical Properties, and Durability of High-Performance Concrete Using Ternary and Quaternary Blends of Metakaolin, Nano-Silica, and Fly Ash. Environ. Sci. Pollut. Res. 2021, 28, 49074–49088. [Google Scholar] [CrossRef]
- Jones, R.; Mccarthy, M.; Newlands, M. Fly Ash Route to Low Embodied CO2 and Implications for Concrete Construction. In 2011 WOCA Proceedings Papers; University Press of Kentucky: Lexington, KY, USA, 2011. [Google Scholar]
- Bheel, N.; Ali, M.O.A.; Shafiq, N.; Almujibah, H.R.; Awoyera, P.; Benjeddou, O.; Shittu, A.; Olalusi, O.B. Utilization of Millet Husk Ash as a Supplementary Cementitious Material in Eco-Friendly Concrete: RSM Modelling and Optimization. Structures 2023, 49, 826–841. [Google Scholar] [CrossRef]
- Khodaii, A.; Mousavi, E.S.; Khedmati, M.; Iranitalab, A. Identification of Dominant Parameters for Stripping Potential in Warm Mix Asphalt Using Response Surface Methodology. Mater. Struct. Constr. 2016, 49, 2425–2437. [Google Scholar] [CrossRef]
- Nassar, A.I.; Thom, N.; Parry, T. Optimizing the Mix Design of Cold Bitumen Emulsion Mixtures Using Response Surface Methodology. Constr. Build. Mater. 2016, 104, 216–229. [Google Scholar] [CrossRef]
- Abdulkadir, I.; Mohammed, B. Rsm Analysis and Study on the 6 Months Compressive Strength Development and Shrinkage Behaviour of High Volume Fly Ash Rubberized ECC (HVFA-RECC). Int. J. Adv. Res. Eng. Technol. 2020, 11, 965–980. [Google Scholar]


| MIX | Binder | CF (%) | Micro Silica | C.A | F.A | Water | SP (%) |
|---|---|---|---|---|---|---|---|
| CF 0% | 503.5 | 0.00% | 26.5 | 890 | 740 | 195 | 1 |
| CF 0.20% | 503.5 | 0.20% | 26.5 | 890 | 740 | 195 | 1 |
| CF 0.40% | 503.5 | 0.40% | 26.5 | 890 | 740 | 195 | 1 |
| CF 0.60% | 503.5 | 0.60% | 26.5 | 890 | 740 | 195 | 1 |
| CF 0.80% | 503.5 | 0.80% | 26.5 | 890 | 740 | 195 | 1 |
| CF 1% | 503.5 | 1% | 26.5 | 890 | 740 | 195 | 1 |
| Embodied Carbon | CO₂ (Kg/Kg) | References |
|---|---|---|
| OPC | 0.82 | [43] |
| Silica fume | 0.024 | [44] |
| Carbon Fiber | 33 | [45] |
| Fine Aggregate | 0.0139 | [46] |
| Super Plasticizer | 0.72 | [47] |
| Coarse Aggregate | 3.4 | [45] |
| Water | 0 | [48] |
| Model Validation Constraints | Slump Flow | L-Box Test | CS | STS | WA | Acid Attack | EC | ESE |
|---|---|---|---|---|---|---|---|---|
| Std. Dev. | 0.268 | 0.8680 | 0.8684 | 0.3381 | 0.0405 | 0.1571 | 0.0063 | 0.0019 |
| Mean | 677.7 | 87.69 | 40.76 | 5.56 | 8.05 | 3.49 | 535.42 | 0.0761 |
| C.V.% | 0.039 | 0.9898 | 2.13 | 6.08 | 0.5039 | 4.50 | 0.0012 | 2.47 |
| PRESS | 1.24 | 12 | 16.02 | 7.09 | 2.08 | 0.5096 | 0.0500 | 0.0001 |
| −2 Log Likelihood | 0.534 | 29.80 | 29.81 | 3.92 | −52.76 | −14.65 | −101.19 | −129.68 |
| R-Squared | 0.999 | 0.9853 | 0.9321 | 0.9658 | 0.9997 | 0.9770 | 0.9999 | 0.9293 |
| Adj R-Squared | 0.999 | 0.9824 | 0.9185 | 0.9544 | 0.9995 | 0.9724 | 0.9999 | 0.9151 |
| Pred R-Squared | 0.999 | 0.9766 | 0.8558 | 0.7644 | 0.9465 | 0.9526 | 0.9999 | 0.8304 |
| Adeq Precision | 714.9 | 43.204 | 18.440 | 20.986 | 204.112 | 31.095 | 42,525.262 | 22.884 |
| BIC | 5.66 | 37.50 | 37.51 | 14.18 | −39.93 | −6.95 | −88.37 | −121.99 |
| AICc | 5.73 | 38.47 | 38.48 | 16.92 | −34.19 | −5.98 | −82.62 | −121.02 |
| Response | Source | Sum of Squares | Df | Mean Square | F-Value | p-Value > F | Significance |
|---|---|---|---|---|---|---|---|
| Slump Flow | Model | 8095.51 | 1 | 8095.51 | 1.123 × 10⁵ | <0.0001 | Significant |
| A-CF | 8095.51 | 1 | 8095.51 | 1.123 × 10⁵ | <0.0001 | YES | |
| Residual | 0.7931 | 11 | 0.0721 | ||||
| Lack of Fit | 0.1264 | 4 | 0.0316 | 0.3319 | 0.8484 | not significant | |
| Pure Error | 0.6667 | 7 | 0.0952 | ||||
| Cor Total | 8096.31 | 12 |
| Response | Source | Sum of Squares | Df | Mean Square | F-Value | p-Value > F | Significance |
|---|---|---|---|---|---|---|---|
| L-Box Test | Model | 505.24 | 2 | 252.62 | 335.30 | <0.0001 | significant |
| A-CF | 467.67 | 1 | 467.67 | 620.74 | <0.0001 | YES | |
| A2 | 6.77 | 1 | 6.77 | 8.98 | 0.0134 | YES | |
| Residual | 7.53 | 10 | 0.7534 | ||||
| Lack of Fit | 7.53 | 3 | 2.51 | ||||
| Pure Error | 0.0000 | 7 | 0.0000 | ||||
| Cor Total | 512.77 | 12 |
| Response | Source | Sum of Squares | Df | Mean Square | F-Value | p-Value > F | Significance |
|---|---|---|---|---|---|---|---|
| Compressive Strength | Model | 103.55 | 2 | 51.78 | 68.65 | <0.0001 | significant |
| A-CF | 74.92 | 1 | 74.92 | 99.34 | <0.0001 | YES | |
| A2 | 68.11 | 1 | 68.11 | 90.31 | <0.0001 | YES | |
| Residual | 7.54 | 10 | 0.7542 | ||||
| Lack of Fit | 7.54 | 3 | 2.51 | ||||
| Pure Error | 0.0000 | 7 | 0.0000 | ||||
| Cor Total | 111.09 | 12 |
| Response | Source | Sum of Squares | Df | Mean Square | F-Value | p-Value > F | Significance |
|---|---|---|---|---|---|---|---|
| Split Tensile Strength | Model | 29.09 | 3 | 9.70 | 84.80 | <0.0001 | Significant |
| A-CF | 0.4518 | 1 | 0.4518 | 3.95 | 0.0781 | YES | |
| A2 | 14.51 | 1 | 14.51 | 126.90 | <0.0001 | YES | |
| A3 | 2.27 | 1 | 2.27 | 19.82 | 0.0016 | ||
| Residual | 1.03 | 9 | 0.1143 | ||||
| Lack of Fit | 1.03 | 2 | 0.5145 | ||||
| Pure Error | 0.0000 | 7 | 0.0000 | ||||
| Cor Total | 30.12 | 12 |
| Response | Source | Sum of Squares | Df | Mean Square | F-Value | p-Value > F | Significance |
|---|---|---|---|---|---|---|---|
| Water Absorption | Model | 38.77 | 4 | 9.69 | 5896.18 | <0.0001 | significant |
| A-CF | 0.6749 | 1 | 0.6749 | 410.60 | <0.0001 | YES | |
| A2 | 0.8525 | 1 | 0.8525 | 518.63 | <0.0001 | YES | |
| A3 | 0.3958 | 1 | 0.3958 | 240.76 | <0.0001 | YES | |
| A4 | 0.5822 | 1 | 0.5822 | 354.15 | <0.0001 | YES | |
| Residual | 0.0132 | 8 | 0.0016 | ||||
| Lack of Fit | 0.0132 | 1 | 0.0132 | ||||
| Pure Error | 0.0000 | 7 | 0.0000 | ||||
| Cor Total | 38.78 | 12 |
| Response | Source | Sum of Squares | Df | Mean Square | F-Value | p-Value > F | Significance |
|---|---|---|---|---|---|---|---|
| Acid Attack Test | Model | 10.50 | 2 | 5.25 | 212.74 | <0.0001 | significant |
| A-CF | 10.49 | 1 | 10.49 | 425.06 | <0.0001 | YES | |
| A2 | 1.78 | 1 | 1.78 | 71.99 | <0.0001 | YES | |
| Residual | 0.2467 | 10 | 0.0247 | ||||
| Lack of Fit | 0.2467 | 3 | 0.0822 | ||||
| Pure Error | 0.0000 | 7 | 0.0000 | ||||
| Cor Total | 10.74 | 12 |
| Response | Source | Sum of Squares | Df | Mean Square | F-Value | p-Value > F | Significance |
|---|---|---|---|---|---|---|---|
| Embodied Carbon | Model | 39,448.56 | 4 | 9862.14 | 2.489 × 10⁸ | <0.0001 | significant |
| A-CF | 2188.82 | 1 | 2188.82 | 5.525 × 10⁷ | <0.0001 | YES | |
| A2 | 0.2888 | 1 | 0.2888 | 7289.99 | <0.0001 | YES | |
| A3 | 0.0065 | 1 | 0.0065 | 163.20 | <0.0001 | YES | |
| A4 | 0.1032 | 1 | 0.1032 | 2603.77 | <0.0001 | YES | |
| Residual | 0.0003 | 8 | 0.0000 | ||||
| Lack of Fit | 0.0003 | 1 | 0.0003 | ||||
| Pure Error | 0.0000 | 7 | 0.0000 | ||||
| Cor Total | 39,448.56 | 12 |
| Response | Source | Sum of Squares | Df | Mean Square | F-Value | p-Value > F | Significance |
|---|---|---|---|---|---|---|---|
| Eco-Strength Efficiency | Model | 0.0005 | 2 | 0.0002 | 65.70 | <0.0001 | Significant |
| A-CF | 0.0001 | 1 | 0.0001 | 25.17 | 0.0005 | YES | |
| A2 | 0.0002 | 1 | 0.0002 | 57.87 | <0.0001 | YES | |
| Residual | 0.0000 | 10 | 3.541 × 10⁻⁶ | ||||
| Lack of Fit | 0.0000 | 3 | 0.0000 | ||||
| Pure Error | 0.0000 | 7 | 0.0000 | ||||
| Cor Total | 0.0005 | 12 |
| Factors | Variable (Input Factors) | Response (Output Factors) | ||||||||
|---|---|---|---|---|---|---|---|---|---|---|
| Carbon Fiber | Slump | L-Box Test | Compressive Strength | Split Tensile Strength | Water Absorption | Acid Attack Test | Embodied Carbon | Eco-Strength Efficiency | ||
| Value | Minimum | 0% | 635 | 78 | 35.85 | 2.8 | 5 | 2.65 | 464 | 0.063 |
| Maximum | 1% | 711 | 97 | 45.342 | 6.86 | 10.12 | 4.933 | 630 | 0.083 | |
| Goal | In range | In range | Maximize | Maximize | In range | Minimize | Maximize | Maximize | ||
| Optimization results | 0.586 | 666.025 | 84.041 | 43.870 | 6.711 | 7.693 | 2.725 | 561.18 | 0.0780 | |
| Desirability | 0.809 | |||||||||
| Responses | Predicted | Experimental | Error (%) |
|---|---|---|---|
| Slump Flow | 666.025 | 661 | 0.75% |
| L-box test | 84.041 | 83 | 1.23% |
| Compressive Strength | 43.870 | 45 | 2.57% |
| Split Tensile Strength | 6.711 | 6.5 | 3.10% |
| Water Absorption | 7.6933 | 7.5 | 2.50% |
| Acid Attack | 2.725 | 2.67 | 2.01% |
Disclaimer/Publisher’s Note: The statements, opinions and data contained in all publications are solely those of the individual author(s) and contributor(s) and not of MDPI and/or the editor(s). MDPI and/or the editor(s) disclaim responsibility for any injury to people or property resulting from any ideas, methods, instructions or products referred to in the content. |
© 2023 by the authors. Licensee MDPI, Basel, Switzerland. This article is an open access article distributed under the terms and conditions of the Creative Commons Attribution (CC BY) license (https://creativecommons.org/licenses/by/4.0/).
Share and Cite
Khan, M.B.; Waqar, A.; Bheel, N.; Shafiq, N.; Hamah Sor, N.; Radu, D.; Benjeddou, O. Optimization of Fresh and Mechanical Characteristics of Carbon Fiber-Reinforced Concrete Composites Using Response Surface Technique. Buildings 2023, 13, 852. https://0-doi-org.brum.beds.ac.uk/10.3390/buildings13040852
Khan MB, Waqar A, Bheel N, Shafiq N, Hamah Sor N, Radu D, Benjeddou O. Optimization of Fresh and Mechanical Characteristics of Carbon Fiber-Reinforced Concrete Composites Using Response Surface Technique. Buildings. 2023; 13(4):852. https://0-doi-org.brum.beds.ac.uk/10.3390/buildings13040852
Chicago/Turabian StyleKhan, Muhammad Basit, Ahsan Waqar, Naraindas Bheel, Nasir Shafiq, Nadhim Hamah Sor, Dorin Radu, and Omrane Benjeddou. 2023. "Optimization of Fresh and Mechanical Characteristics of Carbon Fiber-Reinforced Concrete Composites Using Response Surface Technique" Buildings 13, no. 4: 852. https://0-doi-org.brum.beds.ac.uk/10.3390/buildings13040852