
Research on the Non-Planar Deformation Behavior of Reinforced Concrete Components Based on Size Effect

1
School of Architecture, Harbin Institute of Technology, Shenzhen 518055, China
2
Engineering Management Center, Bureau of Public Works of Shenzhen Municipality, Shenzhen 518009, China
3
Bureau of Public Works of Shenzhen Municipality, Shenzhen 518041, China
4
School of Civil and Environmental Engineering, Harbin Institute of Technology, Shenzhen 518055, China
5
Guangdong Provincial Key Laboratory of Intelligent and Resilient Structures for Civil Engineering, Shenzhen 518055, China
*
Author to whom correspondence should be addressed.
Buildings 2023, 13(7), 1716; https://0-doi-org.brum.beds.ac.uk/10.3390/buildings13071716
Submission received: 5 June 2023
/
Revised: 23 June 2023
/
Accepted: 28 June 2023
/
Published: 5 July 2023
(This article belongs to the Collection Innovation of Materials and Technologies in Civil Construction)
Abstract
:The section deformation distribution of reinforced concrete components is nonlinear due to the size effect. Existing analysis models such as the plastic hinge and the truss element are based on the plane cross-section assumption. The nonlinear deformation distribution of the section cannot be accurately simulated. Therefore, in this paper, non-planar strain distribution functions of sections are established. The law of the influence of geometrical characteristics and load characteristics on the nonlinear deformation distributions of the sections of the beam ends is analyzed. The quantitative method is established between the section size, position, and shear span ratio, and the nonlinear deformation distributions of sections. The finite element simulation and test results show that the non-planar strain distribution shape functions of sections given in this paper can accurately describe the axial strain distributions of different sections along the height and width of the sections. The non-planar deformation behaviors and mechanical properties of the components can be simulated. The interface connection accuracy is improved in the structural multiscale simulation.
1. Introduction
In recent years, the structural systems of high-rise buildings have evolved toward higher complexity, with the emergence of mega-structural systems, such as primary and secondary structures [1]. The size effect becomes more prominent with the increase in the section size of the components in these mega-structural systems. At present, systematic theoretical and experimental research on the size effect behavior of reinforced concrete components has primarily focused on concrete materials and reinforced concrete components. The size effect of materials is a key research topic in the field of materials science [2], primarily influenced by factors such as concrete strength, aggregate distribution and particle size, and initial concrete pouring defects [3], just as the mechanical properties of reinforced soil are influenced by additive materials and addition methods [4,5]. Several size effect laws and theories have been proposed, such as the statistical size effect law by Weibull [6], the fracture size effect law by Bazant [7], the fractal size effect law by Carpinteri [8], and the improved size effect law by Hoover [9]. The size effect behavior of components is a topic of interest in structural mechanics [2], and experimental studies on reinforced concrete beams [10], columns [11], and joints [12] have confirmed differences among various size effect laws at the component level. In some experimental studies on the size effect, the deformation distribution of the component section has gradually deviated from the plane cross-section assumption as the section size increased, in some cases even contradicting the assumption altogether. This reveals a marked size effect of the deformation distribution of the section [13].
These findings put forward new requirements for traditional numerical analysis methods. However, due to different research objectives, the deformation distribution affected by the size effect is mostly approximated to the plane cross-section assumption. The influence law of the size effect on the section deformation distribution of reinforced concrete components remains under-studied [14], with limited consideration given to the influence of geometric characteristics such as section size and section position. No mechanical model or analysis method has been established directly, which inhibits the quantitative description of the nonlinear distribution of section deformation.
In this paper, the deformation distribution of the non-planar section of reinforced concrete components influenced by the size effect is studied. A section deformation distribution function is proposed to quantitatively describe the nonlinear distribution of the section deformation of reinforced concrete components. The influence law of the nonlinear distribution of the beam end section deformation is analyzed considering section geometry and load. A method to quantify the nonlinear distribution of the section deformation according to section size, section position, and shear–span ratio is established and verified using a finite element simulation and test. The influence of non-planar section deformation behavior on the mechanical properties of components is analyzed. In addition, its application in multiscale structural simulations is examined. This approach enables the simulation of non-planar deformation behaviors and mechanical properties of components, enhancing the accuracy of interface connections in multiscale simulations of structures.
2. Establishment of Section Deformation Distribution Function
To accurately describe the nonlinear distribution of cross-section deformation in reinforced concrete components, the section deformation distribution function is established, which is defined as follows:
where B and H are the width and height of the section, respectively; b and h are the coordinates of each fiber point on the cross-section; p is the position of the section along the length of the component; α is the load coefficient, indicating the degree of external load application; and λ is the shear–span ratio.
This section deformation distribution function considers the influence of the section’s geometric characteristics and load. As an important geometric characteristic, section size is the key parameter in determining the size effect of mechanical properties of reinforced concrete components. It also affects the non-planar distribution behavior of the section deformation of the components, thereby causing the mechanical properties of components to change systematically.
Under the influence of a bending moment and shear load, the relative magnitude of the bending moment and shear force on the section changes as the section position of the component changes. This also affects the deformation distribution of the component section. The constraint effect of the joint area intensifies as the section draws closer to the joint, exacerbating the variation in the section deformation distribution.
Simultaneously, the overall deformation of reinforced concrete components increases with an increase in the external load amplitude. The shear–span ratio represents the relative relationship between the bending moment and the shear force on the section of the component. It is an important calculation parameter in structural design and affects the shear-bearing capacity and failure mode of components. Accordingly, components with varying shear–span ratios exhibit different deformation behaviors.
3. Influence Mechanism of Non-Planar Distribution of Section Deformation
3.1. Analysis Model
To analyze the non-planar deformation of the section distribution of components, the boundary conditions of beam ends in reinforced concrete structures should be accurately simulated. In this paper, rectangular section beam–column joints are selected as the objects of analysis of a reinforced concrete plane frame structure. A finite element elastic analysis model is established using the ABAQUS v6.10-1 finite element software. According to the requirements of conceptual design [15], the relative size of component sections is determined. The model numbers of joints and the sizes of components are shown in Table 1. The contribution of a reinforcement to the elastic modulus of concrete is considered according to the longitudinal reinforcement ratio of the component. The elastic modulus of the converted reinforced concrete is 3.77 × 10⁴ MPa. The boundary constraints at the top and bottom of the column in the joint model are unidirectional hinged constraints, and monotonic loading is adopted at the loading point of the beam end.
3.2. Influence of Section Size
To study the influence of section size variation on the non-planar distribution of section deformation, the axial strain distribution along the height and width of beam end sections for different joint models is analyzed, as shown in Figure 1. In the figure, the section dimensions are represented by normalization. The results show that the elastic section deformation displays a distinct non-planar distribution along the height and width direction of the section for models with different section sizes. With the increase in section size, the degree of nonlinearity of the deformation distribution of the section increases significantly.
3.3. Influence of Section Location
To study the influence of the section location on the non-planar distribution of section deformation, a quantitative description of the section location is required. The coupling effects of the distance from the section to the joint and the shear–span ratio of the component are considered. To determine the quantitative relationship between the location and the deformation distribution of the section, this paper adopts a dimensionless expression to quantitatively describe the section location p, as follows:
where lp is the distance from the section to the joint (m); λ is the shear–span ratio; and l0 and λ0 are the length and shear–span ratio of the reference component during dimensionless conversion, respectively. The qualitative law governing the non-planar distribution of section deformation with respect to section location remains unaffected by the choice of the reference component. The beam of model N2 is selected as the reference component. l0 and λ0 are 5.24 m and 4.4, respectively.
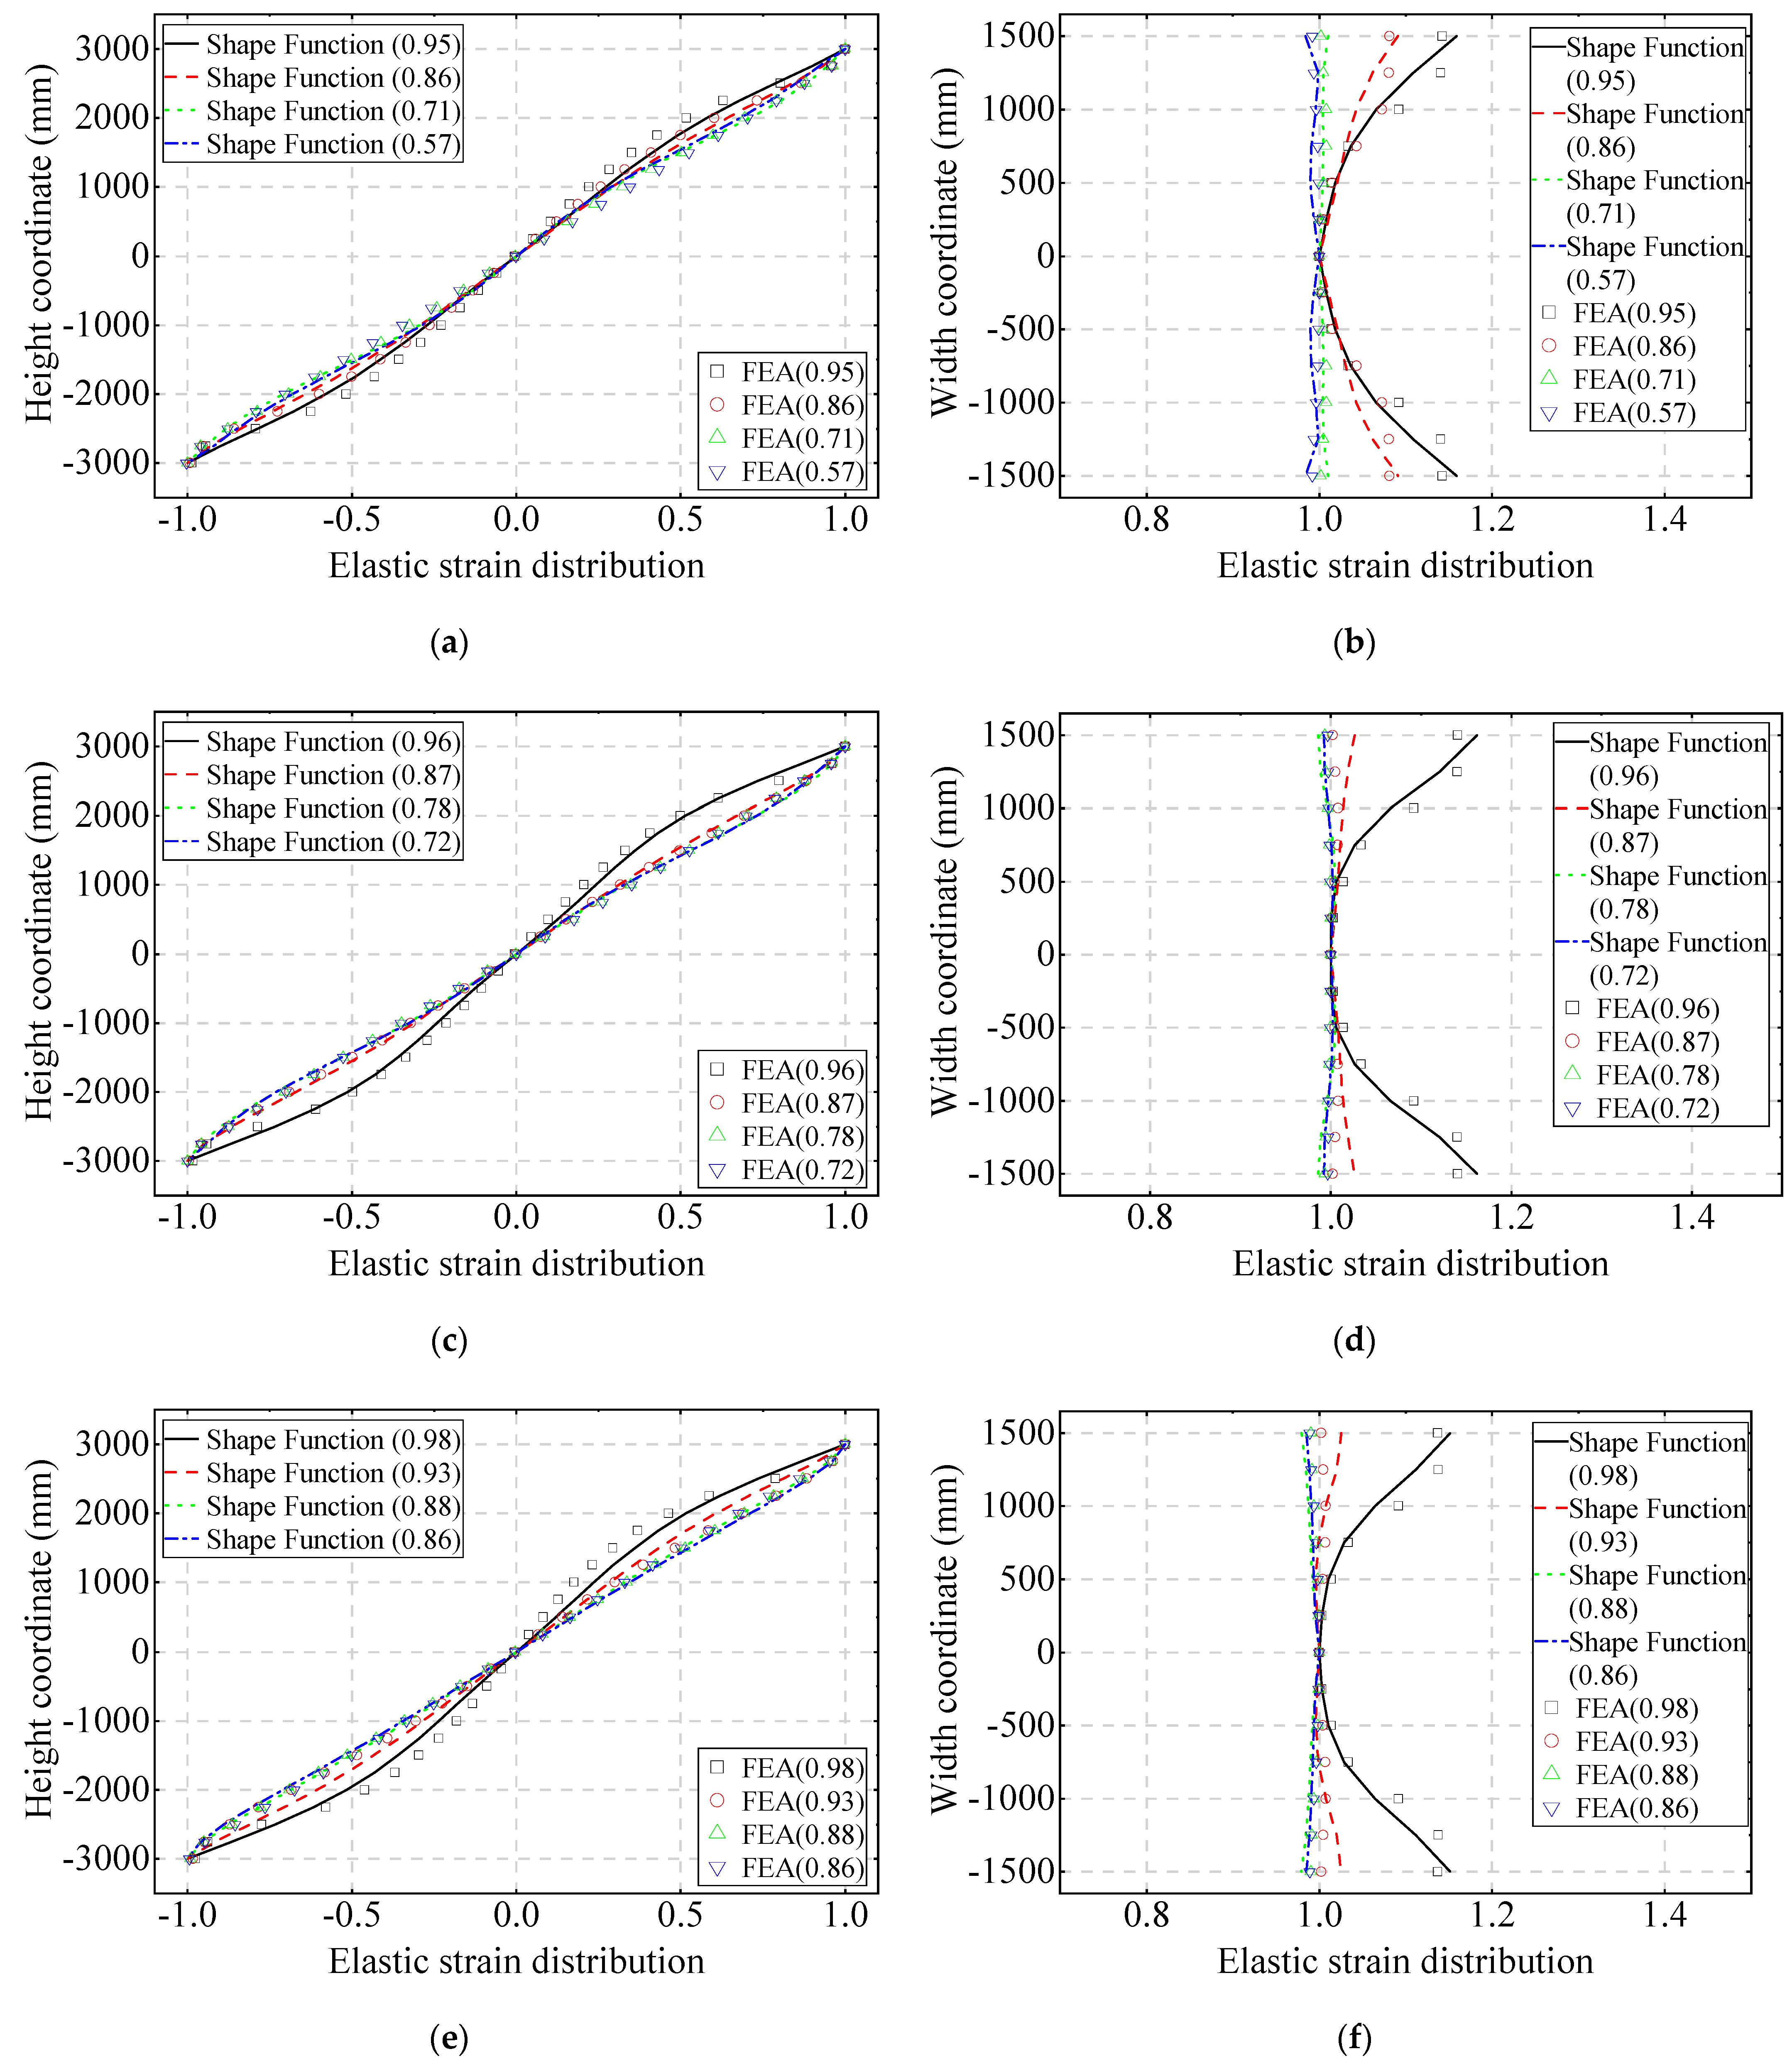
The deformation distributions of sections with different p values are presented and compared with the plane section assumption along the height and width directions of cross-sections, as shown in Figure 2. The values in the legend refer to the p values. The results show that the deformation of sections with different p values has different shape distributions along the section height. The closer the section to the beam–column joint area, the higher the degree of nonlinearity in the section’s elastic deformation distribution along its height and width directions. When p is less than 0.95, the section deformation distribution exhibits a low degree of nonlinearity, closely resembling that of the plane section. When p equals or exceeds 0.95, the section deformation distribution becomes noticeably nonlinear, and its distribution form substantially diverges from that of the plane section.
3.4. Influence of Load Amplitude
To study the influence of variations in load amplitude on the section deformation distribution, the axial strain distribution of the section corresponding to different amplitude loads is presented and compared with the plane section assumption, as shown in Figure 3. In this figure, the maximum strain is normalized. The strain distribution is normalized by setting the maximum value of the strain distribution as the standard, expressed by the dimensionless value of absolute value 0–1. The percentages shown in the legend indicate the relative magnitude of the load amplitude. The results show that during changes in the load amplitude in the elastic stage, the section strain distribution remains nonlinear and the shape of the distribution curve remains unchanged. Therefore, the load factor α in Equation (1) can be omitted in the elastic stage. The section bending moment is calculated by integrating the section deformation distribution curve. The calculation results show that the bending capacity of the section considering the non-planar distribution of the section deformation decreases by 10.41% compared with the result of the plane section. The average strain at the tensile edge of the section is 7.95% lower than that of the plane section.
3.5. Influence of Shear–Span Ratio
The shear–span ratio represents the relationship between the bending moment and the shear force of the component section. For beams under concentrated load, according to the code [16], the shear–span ratio is calculated as follows:
where a is the distance from the concentrated load point to the edge of the joint [16]; is the effective height of the section, which is the distance between the force point of the longitudinal tensile rebar and the compression edge of the section [16].
According to the method of classifying the bending components by the span–depth ratio in the code [16], shear–span ratios representing different types of bending components are selected and the corresponding finite element models of beam–column joints are established, as shown in Table 2.
The calculation results of the section deformation at the beam end of each model are analyzed, and the distribution of the section deformation along the section height and width is presented. The analysis results show that the degree of nonlinearity of the section deformation distribution along the section height increases with the decrease in the shear–span ratio, as shown in Figure 4a. Meanwhile, the nonlinear distribution shape of section deformation along the width direction of models with different shear–span ratios remains unchanged, as shown in Figure 4b.
4. Quantification and Application of Non-Planar Distribution of Section Deformation
4.1. Quantification of Distribution Shape Function
The establishment of a clear, quantitative relationship between each factor and the nonlinear distribution of section deformation in the height and width directions is crucial. A comprehensive consideration of the quantitative influence of various factors on the non-planar distribution of section deformation is also required. Based on Equation (1), the non-planar shape function of the section strain distribution of a reinforced concrete component in the elastic stage is established, as follows:
Here,
where is the four-dimensional row vector of strain distribution coefficients in the section height direction; is the five-dimensional row vector of strain distribution coefficients in the section width direction; is the four-dimensional row vector of height coordinate parameters of the strain calculation point; is the five-dimensional row vector of width coordinate parameters of the strain calculation point; is the shape function of the section elastic axial strain distribution; is the shape function of the elastic axial strain distribution at the central axis of the section along the section height direction; is the shape function of the elastic axial strain distribution at the tension edge of the section along the section width direction; h is the height coordinate of the strain calculation point with the X-axis of the section as the zero axis (unit: m); b is the width coordinate of the strain calculation point with the Y-axis of the section as the zero axis (unit: m); H is the section height (unit: m); and B is the section width (unit: m).
The influence of the section size, section location, and shear–span ratio of components is comprehensively considered in the row vectors and of distribution coefficients for the strain distribution function in the section height and width directions. Each element is defined as follows:
where are the location coefficients of the section; i = 1, 3, 5, 7; j = 1–4; are the shear–span ratio coefficients of the component; is the strain distribution coefficient in the section height direction; is the strain distribution coefficient in the section width direction; is the height coefficient of the section; and is the width coefficient of the section.
Here,
4.2. Verification of Distribution Shape Function
The validity of the quantitative relationship of the non-planar distribution of section deformation in the elastic stage of reinforced concrete components is verified via two approaches: finite element model comparison verification and test comparison verification.
4.2.1. Comparison and Verification of Finite Element Models
Beam–column joint models with different section sizes and shear–span ratios are established. The section sizes and shear–span ratios of each model are substituted into Equation (3) to obtain the shape functions of the section axial strain distribution of each model. The shape function curves of the strain distribution of sections with different p values of each model are compared with the finite element calculation results. The results show that when the section height is 300 mm, the non-planar strain distribution shape function established in this paper effectively simulates the influence of the section location change on the section deformation distribution in the external interpolation calculation of section height. Compared with the reinforced concrete deep beam with a shear–span ratio of 1, the calculation accuracy is higher for the beams with shear–span ratios of 4.4 and 2. As shown in Figure A1, the value in the legend bracket is the p value of the section. The analysis results show that when the section height is 3000 mm, the proposed method shows good agreement with the finite element calculation results. The method can better simulate the non-planar distribution behavior of the section deformation of the component and has a better calculation accuracy of interpolation for models with different shear–span ratios, as shown in Figure A2. When the section height is 6000 mm, the non-planar strain distribution shape function is in good agreement with the finite element results, and the strain distribution along the section height and width of reinforced concrete beams with different shear–span ratios can be obtained, as shown in Figure A3.
4.2.2. Comparison and Verification of Test
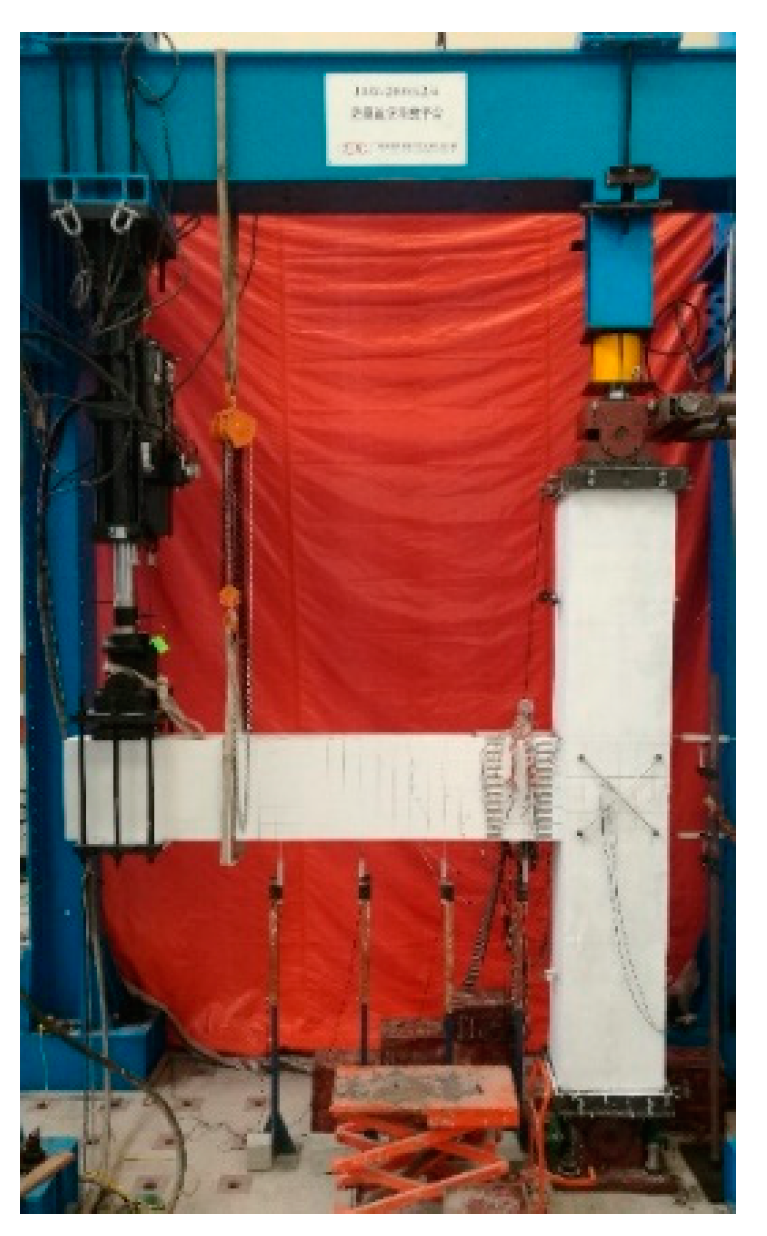
To verify the quantitative relationship and the rules of the non-planar distribution behavior of section deformation at the beam end of reinforced concrete structures, two full-size specimens of cast-in-place reinforced concrete beam and column joints are designed and produced according to the design specifications of concrete structures [16] and the seismic design specifications of buildings [15]. These two specimens are referred to as specimen A and specimen B. The size and reinforcement design information of the specimens is presented in Figure 5. The concrete grade is C50 and the reinforcement grade is HRB400. The material property test data are identical to the prefabricated joint test [17]. The layout of the pseudo-static test loading system for reinforced concrete beam–column joint specimens is shown in Figure 6. To represent the nonlinear deformation distribution of the section of the reinforced concrete component, concrete strain measuring points are set on the specimen surface. The distribution of these measuring points is shown in Figure 7.
The test results show that the plastic deformation and damage of the reinforced concrete specimens are concentrated at the plastic hinge location, which is located in the area with a p value greater than 0.95 at the beam end of the specimens. This is consistent with the aforementioned section location range with a strong nonlinear distribution of section deformation.
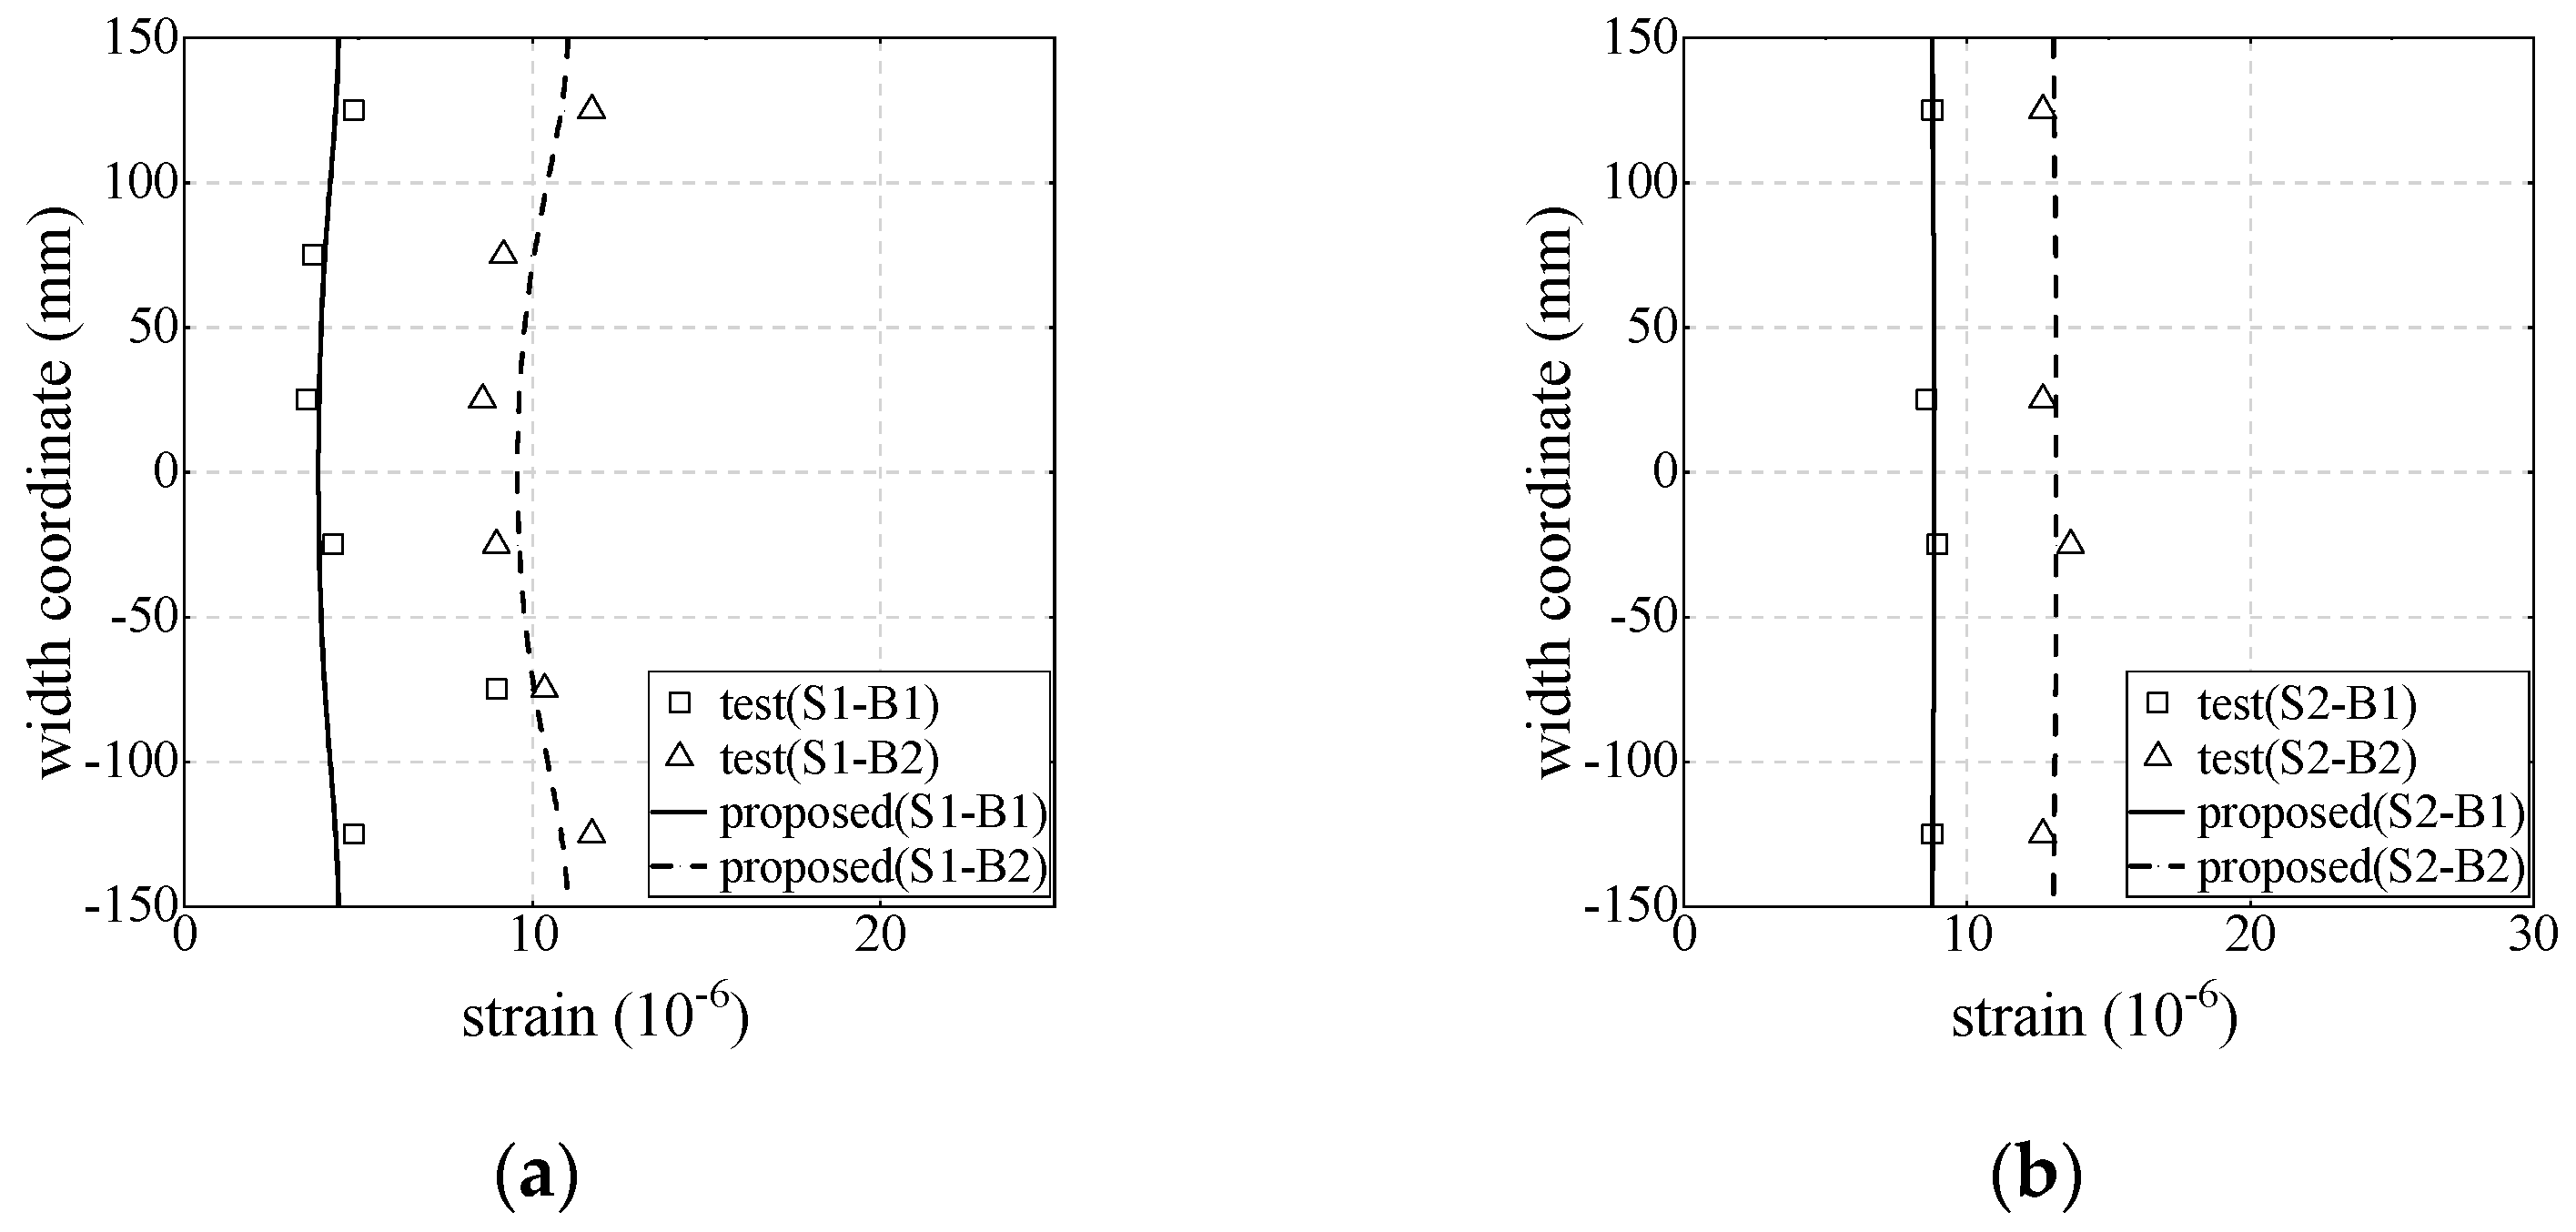
The distribution of concrete strain measuring points in the beam end area of reinforced concrete beam–column joints is given. Based on the size information of specimens and Equation (1), the p values of the two groups of strain measuring points, which are referred to as beam section S1 and beam section S2, respectively, are 0.981 and 0.924. The section strain distributions of concrete strain measuring points at beam sections S1 and S2 under different loads and elastic loading conditions are given. These distributions are compared with those established by the proposed method.
The test results show that the distribution shape of section strain remains unchanged at different loading times, and the variation in load amplitude only changes the strain distribution amplitude. The shape of the strain distribution is affected by the section location. For beam section S2 with a p value less than 0.95, the strain distribution along the section height is minimally nonlinear, closely resembling the plane cross-section assumption. The p value of beam section S1 is greater than 0.95, and the strain distribution along the section height and width shows obvious nonlinearity, which differs markedly from the plane cross-section assumption, as shown in Figure 8 and Figure 9, respectively. In the legend, “S1-H2” represents the second set of test data in the height direction of beam section S1. The proposed method is in good agreement with the test results in terms of the variation trend, distribution law, and shape of the strain distribution.
The test data from reference [18] are selected for verification. The reference study collected the strain distribution along the section height of the reinforced concrete beam under different load degrees in the elastic stage. Based on the proposed strain distribution shape function of the elastic stage, the strain distributions of specimen L2 under various loads are given. The section size of the specimen is 200 mm × 200 mm, and its length is 1000 mm. The analysis results show that the strain distribution in the elastic stage is obviously nonlinear and deviates from the plane cross-section assumption, which is consistent with the conclusions of this paper. By comparing the results of the non-planar shape function of the section strain distribution, it can be seen that the proposed method is in good agreement with the test results of reference [18]. This validates the conclusion that the variation in load degree in the elastic stage only changes the amplitude of the strain distribution, but not the distribution shape. It also verifies the accuracy and applicability of the quantitative relationship of the non-planar distribution of section deformation established in this paper, as shown in Figure 10.
4.3. Influence Analysis of Mechanical Properties of Components
The bending capacity under the elastic limit can be used to evaluate the mechanical properties of components. The ratio of the bending capacity considering the non-planar deformation distribution of the section to the bending capacity under a plane cross-section assumption is defined as the non-planar bending capacity ratio. The ratios of reinforced concrete beams in the elastic stage are given for different section heights and shear–span ratios. The results show that the ratio of small-section-size components is close to 1.0. The ratio decreases with the increase in section height. Once the section height reaches 5000 mm, the ratio stabilizes at approximately 0.83. Furthermore, a decrease in the shear–span ratio results in a reduction in the non-planar bending capacity of sections with different sizes. Moreover, an increase in section height leads to a faster decrease in the non-planar bending capacity ratio for small shear–span members, as shown in Figure 11.
Based on these findings, the relationship curves are established between the non-planar bending capacity ratio and the shear–span ratio of components with different section heights. The analysis results show that when the section height is less than 1000 mm, the reduction in the bending capacity of the components due to non-planar deformation is within 5% relative to that of a plane cross-section assumption. The non-planar deformation behavior has little effect on the mechanical properties of components. However, with the increase in the section size, the negative influence of the shear–span ratio on the bending capacity becomes gradually significant. In the case of a deep beam with a section height of 6000 mm, the weakening degree of the bending capacity is approximately twice that of general beams, as shown in Figure 12.
4.4. Structural Multi-Scale Interface Connection
A multi-scale model is established based on the N2 joint model. At the interface connection, the quantitative relationship of the non-planar deformation distribution of the section is introduced and compared with the interface connection of the plane cross-section assumption. The model is shown in Figure 13, with the interface located 200 mm away from the beam end. The p value, calculated according to Equation (2), is 0.962. The macro-scale part of the multi-scale model is simulated using beam elements. Section size and element material are consistent with the micro-scale part.
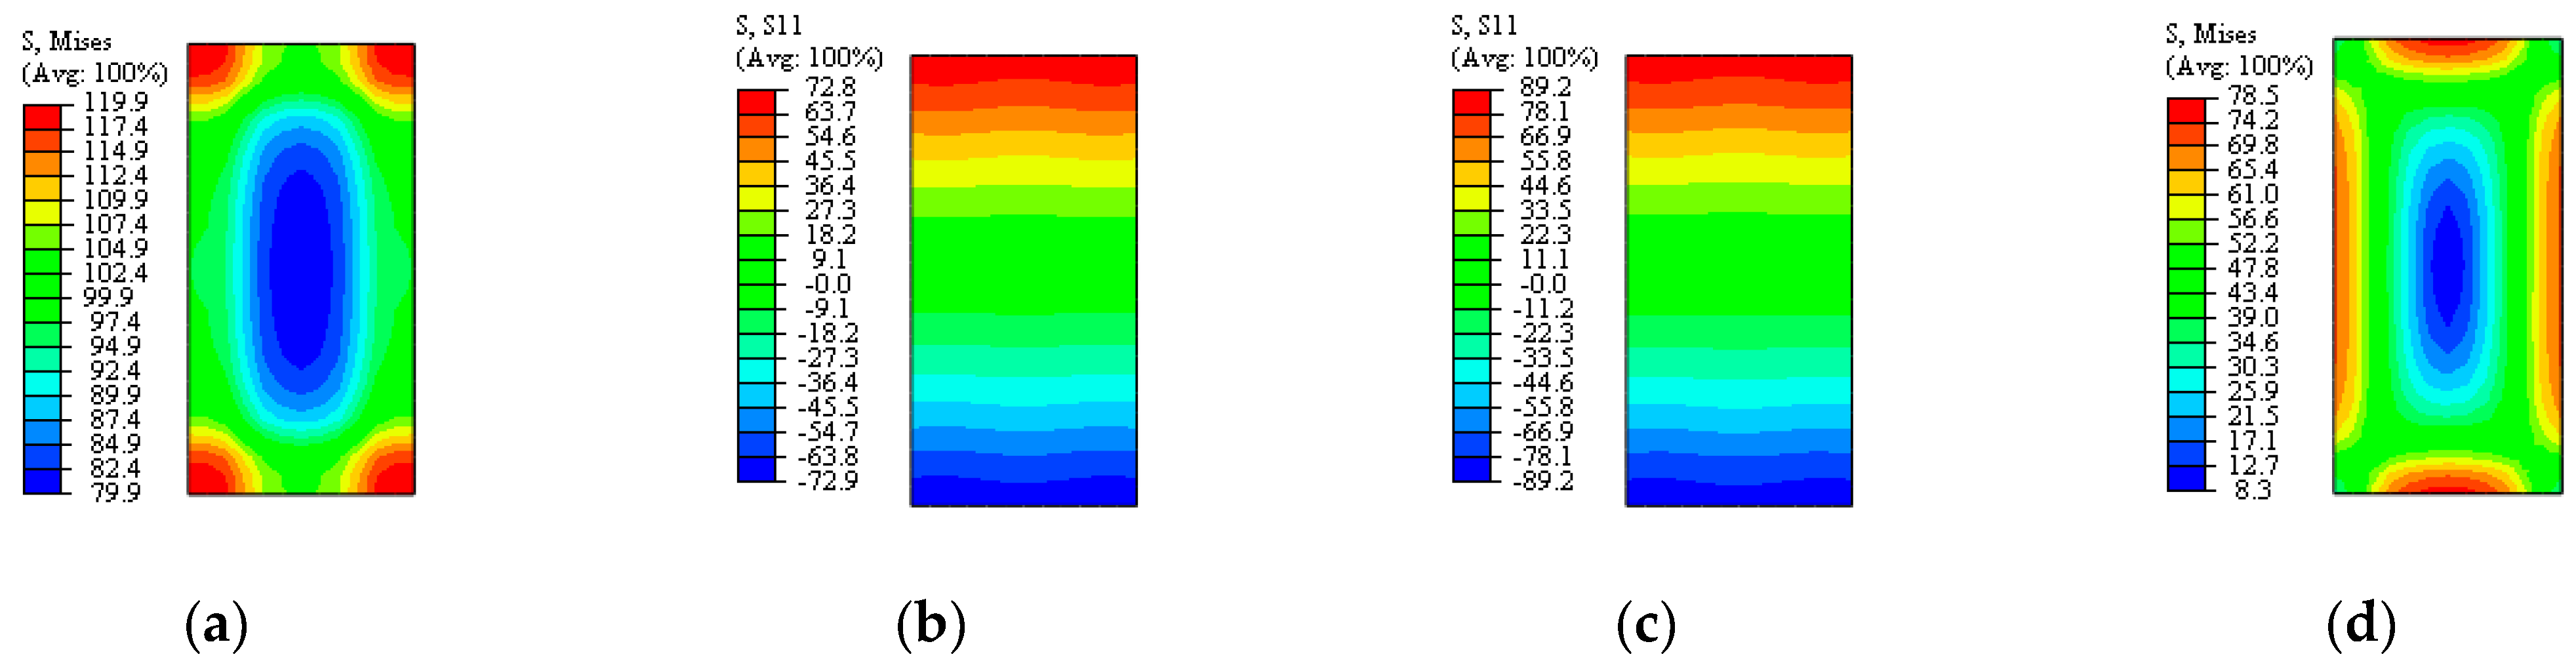
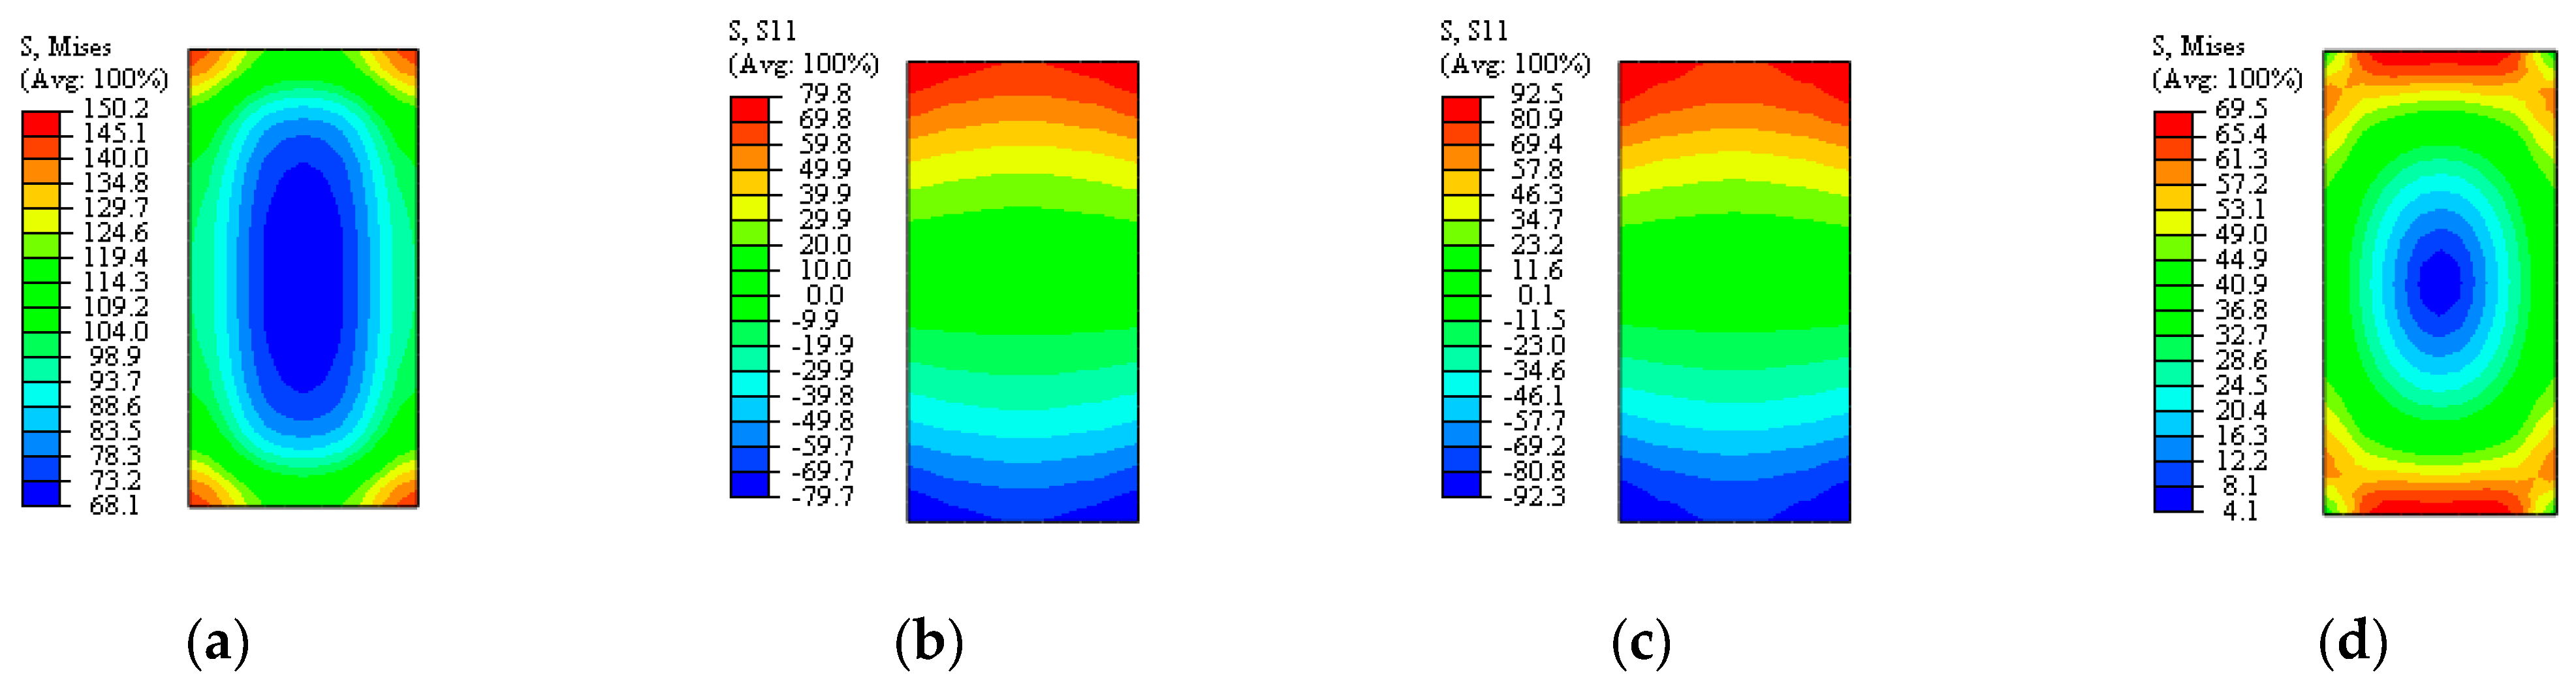
The stress distributions at the interface of different models (the proposed multi-scale model with a quantitative relationship of the non-planar deformation distribution, the multi-scale model with a plane cross-section assumption, and a micro-scale model with solid elements) under different load conditions are shown in Figure 14, Figure 15 and Figure 16. The maximum stress value is shown in Table 3. The error analysis is based on the calculation results of the solid element micro-scale model.
The results show that there is stress concentration at the interface of the multi-scale model based on the plane cross-section assumption, markedly deviating from the stress distribution of the solid element model. By contrast, the proposed multi-scale model exhibits good calculation accuracy under different load conditions. It accurately simulates the maximum stress of the component and the stress distribution of the micro-scale model part, which closely aligns with the calculation results of the solid element model. By introducing the quantitative relationship of the non-planar deformation distribution of the section at the interface connection, the proposed multi-scale interface connection ensures improved calculation accuracy compared with the multi-scale interface connection based on the plane cross-section assumption. In addition, it significantly reduces the number of degrees of freedom of the finite element model, meeting the calculation accuracy requirements of engineering applications.
5. Conclusions
In this paper, a finite element model of a reinforced concrete beam–column joint is established to address the problem of the non-planar deformation distribution of the section of reinforced concrete components in elastic stages. The non-planar deformation distribution is studied considering section geometry and load. The influence law of four parameters (section size, section position, load amplitude, and shear–span ratio) of the non-planar deformation distribution of the section at the beam end along the section height and width directions is established. The quantitative relationship of the non-planar deformation distribution of the section is established and compared with the results of a numerical analysis and test. The influence of the mechanical properties of components is analyzed, and the following conclusions are drawn:
- With the increase in the load amplitude of the component, the amplitude of the section deformation distribution curve increases proportionally, and the shape of the distribution curve remains unchanged. With the decrease in the shear–span ratio, the curve shape of the axial deformation distribution along the section height changes nonlinearly, while the curve shape along the section width remains unchanged.
- As the section position moves away from the joint area, the degree of nonlinearity of the section deformation distribution decreases. The section with a p value of 0.95 represents the position where the transition from a strong nonlinear to weak nonlinear distribution of section deformation occurs. The coupling effect of shear–span ratio and the size effect on the bending capacity of the section become gradually obvious.
- For reinforced concrete beams considering the non-planar deformation distribution behavior, the non-planar bending capacity ratio is always less than 1, and the minimum value is approximately 0.83. Under the influence of the size effect, the non-planar bending capacity ratio decreases with an increase in the section height, and it tends to stabilize when the section height reaches 5000 mm.
- The non-planar section distribution function of the axial strain of reinforced concrete components in elastic stages is established. The accuracy and applicability of the proposed method are verified by comparing it with finite element simulation and test results. The method allows for direct analysis of mechanical properties such as the bending capacity of the components and facilitates the multi-scale simulation of structures, thereby improving the calculation accuracy of the interface connection.
Author Contributions
Conceptualization, Z.L. and J.T.; software, Z.P.; validation, Z.P.; writing—original draft preparation, Z.P.; writing—review and editing, Z.L. and B.X.; supervision, Z.L.; project administration, J.T. and Y.F. All authors have read and agreed to the published version of the manuscript.
Funding
This research was funded by the National Natural Science Foundations of China (Grant Nos. 51921006, 51978224, and 52008141), the National Major Scientific Research Instrument Development Program of China (Grant No. 51827811), the Natural Science Foundation of Guangdong Province (Grant No. 2022A1515010403), the Shenzhen Technology Innovation Program (Grant No. JCYJ20200109112803851), and the Shenzhen Sustainable Development Project (Grant No. KCXFZ202002011010039 and KCXFZ20200121090659756).
Data Availability Statement
The basic data supporting the research results are all in the article.
Conflicts of Interest
The authors declare that there are no conflict of interest regarding the publication of this article.
Appendix A

Table A1.
Calculation coefficients of strain distribution in the direction of section height.
| Calculation Coefficients | Coefficient Value | Calculation Coefficients | Coefficient Value | Calculation Coefficients | Coefficient Value |
|---|---|---|---|---|---|
| Che11 | 0.780 | Dhe31 | 2.632 | Ehe52 | 6.329 |
| Che12 | −1.097 | Dhe32 | −0.253 | Ehe50 | −7.979 |
| Che13 | 0.501 | Dhe30 | 1.721 | Che71 | −5.344 |
| Che10 | −0.195 | Ehe31 | 23.075 | Che72 | 7.051 |
| Dhe11 | 10.246 | Ehe32 | −3.293 | Che73 | −2.969 |
| Dhe12 | −0.913 | Ehe30 | −9.836 | Che70 | 1.279 |
| Dhe10 | −114.731 | Che51 | −15.122 | Dhe71 | 11.832 |
| Ehe11 | −0.120 | Che52 | 19.327 | Dhe72 | −4.482 |
| Ehe12 | 0.013 | Che53 | −7.811 | Dhe70 | 377.825 |
| Ehe10 | 1.472 | Che50 | 3.695 | Ehe71 | −8.588 |
| Che31 | 5.784 | Dhe51 | −2.049 | Ehe72 | 1.496 |
| Che32 | −7.268 | Dhe52 | 0.251 | Ehe70 | −5.428 |
| Che33 | 2.880 | Dhe50 | −6.822 | ||
| Che30 | −1.425 | Ehe51 | −40.509 |
Table A2.
Calculation coefficients of strain distribution in the direction of section width.
| Calculation Coefficients | Coefficient Value | Calculation Coefficients | Coefficient Value | Calculation Coefficients | Coefficient Value |
|---|---|---|---|---|---|
| Cbe10 | 1.013 | Dbe21 | 5.039 | Ebe32 | 1.882 |
| Cbe11 | −4.337 | Dbe22 | −0.754 | Ebe30 | 17.319 |
| Cbe12 | 6.026 | Dbe20 | 0.184 | Cbe40 | 3.001 |
| Cbe13 | −2.712 | Ebe21 | −1.551 | Cbe41 | −7.462 |
| Dbe11 | −3.379 | Ebe22 | 0.097 | Cbe42 | 4.159 |
| Dbe12 | 0.588 | Ebe20 | −1.132 | Cbe43 | 0.339 |
| Dbe10 | 2.360 | Cbe30 | −11.415 | Dbe41 | −6.066 |
| Ebe11 | −6.511 | Cbe31 | 41.425 | Dbe42 | 2.203 |
| Ebe12 | 0.820 | Cbe32 | −49.022 | Dbe40 | −2.845 |
| Ebe10 | 7.998 | Cbe33 | 19.015 | Ebe41 | 2.733 |
| Cbe20 | 0.705 | Dbe31 | −25.422 | Ebe42 | −0.335 |
| Cbe21 | −3.080 | Dbe32 | 3.957 | Ebe40 | −6.347 |
| Cbe22 | 4.406 | Dbe30 | 42.256 | ||
| Cbe23 | −2.068 | Ebe31 | −12.206 |
Figure A1.
Comparison of the non-planar section distribution shape function of section strain and the FEA result (H = 300 mm, B = 150 mm). (a) Section height direction (λ = 4.4); (b) section width direction (λ = 4.4); (c) section height direction (λ = 2); (d) section width direction (λ = 2); (e) section height direction (λ = 1); (f) section width direction (λ = 1).

Figure A2.
Comparison of the non-planar section distribution shape function of section strain and the FEA result (H = 3000 mm, B = 1500 mm). (a) Section height direction (λ = 4.4); (b) section width direction (λ = 4.4); (c) section height direction (λ = 2); (d) section width direction (λ = 2); (e) section height direction (λ = 1); (f) section width direction (λ = 1).

Figure A3.
Comparison of the non-planar section distribution shape function of section strain and the FEA result (H = 6000 mm, B = 3000 mm). (a) Section height direction (λ = 4.4); (b) section width direction (λ = 4.4); (c) section height direction (λ = 2); (d) section width direction (λ = 2); (e) section height direction (λ = 1); (f) section width direction (λ = 1).

References
- Liu, P.; Ge, L.; Li, Z.; Teng, J. Mechanical properties and stiffness calculation method of primary-secondary structure for high-rise building. J. Build. Struct. 2021, 42, 28–38. [Google Scholar] [CrossRef]
- Bažant, Z.P.; Kwon, Y.W. Failure of slender and stocky reinforced concrete columns: Tests of size effect. Mater. Struct. 1994, 27, 79–90. [Google Scholar] [CrossRef]
- Li, D.; Jin, L.; Du, X.; Fu, J.; Lu, A. Size effect tests of normal-strength and high-strength RC columns subjected to axial compressive loading. Eng. Struct. 2016, 109, 43–60. [Google Scholar] [CrossRef]
- Yuan, B.; Chen, W.; Zhao, J.; Li, L.; Liu, F.; Guo, Y.; Zhang, B. Addition of alkaline solutions and fibers for the reinforcement of kaolinite-containing granite residual soil. Appl. Clay Sci. 2022, 228, 106644. [Google Scholar] [CrossRef]
- Yuan, B.; Chen, W.; Li, Z.; Zhao, J.; Luo, Q.; Chen, W.; Chen, T. Sustainability of the polymer SH reinforced recycled granite residual soil: Properties, physicochemical mechanism, and applications. J. Soil Sediment 2023, 23, 246–262. [Google Scholar] [CrossRef]
- Weibull, W. A Statistical Distribution Function of Wide Applicability. J. Appl. Mech. 1951, 18, 293–297. [Google Scholar] [CrossRef]
- Baant, Z.P. Size Effect in Blunt Fracture: Concrete, Rock, Metal. J. Eng. Mech. 1984, 110, 518–535. [Google Scholar] [CrossRef]
- Carpinteri, A.; Ferro, G. Size effects on tensile fracture properties: A unified explanation based on disorder and fractality of concrete microstructure. Mater. Struct. 1994, 27, 563–571. [Google Scholar] [CrossRef]
- Hoover, C.G.; Ba Ant, Z.P. Universal Size-shape Effect Law Based on Comprehensive Concrete Fracture Tests. J. Eng. Mech. 2014, 140, 473–479. [Google Scholar] [CrossRef] [Green Version]
- Syroka-Korol, E.; Tejchman, J. Experimental investigations of size effect in reinforced concrete beams failing by shear. Eng. Struct. 2014, 58, 63–78. [Google Scholar] [CrossRef]
- Sener, S.; Barr, B.I.G.; Abusiaf, H.F. Size-effect tests in unreinforced concrete columns. Mag. Concr. Res. 1999, 51, 3–11. [Google Scholar] [CrossRef]
- Barbhuiya, S.; Choudhury, A.M. A study on the size effect of RC beam–column connections under cyclic loading. Eng. Struct. 2015, 95, 1–7. [Google Scholar] [CrossRef]
- Sun, Y.; Du, X.; Zhang, J.; Lu, A. Experimental study on size effect of common reinforced concrete column under large eccentric loading. China Civ. Eng. J. 2012, 45, 297–301. [Google Scholar]
- Du, X.; Lu, A.; Zhao, J. Experiment on size effect of small eccentric reinforced concrete columns under compressive loads. J. Archit. Civ. Eng. 2015, 32, 1–7. [Google Scholar]
- GB50011-2010; Code for Seismic Design of Buildings. Building Industry Press of China: Beijing, China, 2016.
- GB50010-2010; Code for Design of Concrete Structures. Building Industry Press of China: Beijing, China, 2015.
- Li, Z.; Peng, Z.; Qi, Y.; Teng, J.; Ou, J. Full-scale experimental study on seismic behaviors of plasticity controllable steel joint of prefabricated RC beam column. J. Build. Struct. 2019, 40, 43–50. [Google Scholar] [CrossRef]
- Li, Y.; Yang, D.; Huang, D. Experimental study on mechanical behavior of reinforced concrete beams before cracking at ultra-low temperature. J. Build. Struct. 2021, 42, 110–116. [Google Scholar]
Figure 1.
Strain distribution of sections of different cross-sectional size models. (a) Section height direction. (b) Section width direction.
Figure 1.
Strain distribution of sections of different cross-sectional size models. (a) Section height direction. (b) Section width direction.

Figure 2.
Strain distribution of sections with different p values. (a) Section height direction. (b) Section width direction.
Figure 2.
Strain distribution of sections with different p values. (a) Section height direction. (b) Section width direction.

Figure 3.
Strain distribution of sections under different load amplitudes. (a) Section height direction. (b) Section width direction.
Figure 3.
Strain distribution of sections under different load amplitudes. (a) Section height direction. (b) Section width direction.

Figure 4.
Strain distribution of sections of different shear–span ratio models. (a) Height direction of the section. (b) Width direction of the section.
Figure 4.
Strain distribution of sections of different shear–span ratio models. (a) Height direction of the section. (b) Width direction of the section.

Figure 5.
Specimen size and reinforcement design.

Figure 6.
Quasi-static test loading system.

Figure 7.
Distribution of concrete strain measuring points of specimens. (a) Elevation. (b) Plan.

Figure 8.
Strain distribution along the section height of the beam section of the specimen. (a) Beam section S1. (b) Beam section S2.
Figure 8.
Strain distribution along the section height of the beam section of the specimen. (a) Beam section S1. (b) Beam section S2.

Figure 9.
Strain distribution along the section width of the beam section of the specimen. (a) Beam section S1. (b) Beam section S2.
Figure 9.
Strain distribution along the section width of the beam section of the specimen. (a) Beam section S1. (b) Beam section S2.

Figure 10.
Comparison of the quantitative relationship of non-planar deformation distribution of a section in the elastic stage and the test results of reference [18].
Figure 10.
Comparison of the quantitative relationship of non-planar deformation distribution of a section in the elastic stage and the test results of reference [18].

Figure 11.
Relationship curves between the non-planar bending capacity ratio and section height of reinforced concrete beams with different shear–span ratios (200 mm away from the beam end).
Figure 11.
Relationship curves between the non-planar bending capacity ratio and section height of reinforced concrete beams with different shear–span ratios (200 mm away from the beam end).

Figure 12.
Relationship curves between the non-planar section bending capacity ratio and shear–span ratio of reinforced concrete beams with different section heights (200 mm away from the beam end).
Figure 12.
Relationship curves between the non-planar section bending capacity ratio and shear–span ratio of reinforced concrete beams with different section heights (200 mm away from the beam end).

Figure 13.
Multi-scale model of reinforced concrete beam–column joint.

Figure 14.
Stress distribution at the interface of the solid element model (Pa). (a) Axial force. (b) Bending moment. (c) Shear force. (d) Torque.
Figure 14.
Stress distribution at the interface of the solid element model (Pa). (a) Axial force. (b) Bending moment. (c) Shear force. (d) Torque.

Figure 15.
Stress distribution at the interface of the proposed multi-scale model (Pa). (a) Axial force. (b) Bending moment. (c) Shear force. (d) Torque.
Figure 15.
Stress distribution at the interface of the proposed multi-scale model (Pa). (a) Axial force. (b) Bending moment. (c) Shear force. (d) Torque.

Figure 16.
Stress distribution at the interface of the plane section assumed multi-scale model (Pa). (a) Axial force. (b) Bending moment. (c) Shear force. (d) Torque.
Figure 16.
Stress distribution at the interface of the plane section assumed multi-scale model (Pa). (a) Axial force. (b) Bending moment. (c) Shear force. (d) Torque.

Table 1.
The model numbers of joints and the sizes of components.
| Model Number | Length, Width, and Height of Beam (mm) | Length, Width, and Height of Column (mm) |
|---|---|---|
| N1 | 2620 × 300 × 600 | 600 × 600 × 3740 |
| N2 | 5240 × 600 × 1200 | 1200 × 1200 × 7520 |
| N3 | 7860 × 900 × 1800 | 1800 × 1800 × 11,280 |
Table 2.
Different types of bending components and shear–span ratios of models.
| Model Number | Category of Bending Component | Shear Span Ratio λ |
|---|---|---|
| N2 | General beam | 4.4 |
| N2A | Short beam | 2.0 |
| N2B | Deep beam | 1.0 |
Table 3.
Maximum cross-sectional stress at the interface connection position of each model under different load conditions (Pa).
Table 3.
Maximum cross-sectional stress at the interface connection position of each model under different load conditions (Pa).
| Load Case | Solid Element Model | Proposed Model | Plane Section Assumption Model | ||
|---|---|---|---|---|---|
| Stress | Error | Stress | Error | ||
| Axial force | 119.9 | 117 | −2.42% | 150.2 | 25.27% |
| Bending moment | 72.8 | 73.2 | 0.55% | 79.8 | 9.62% |
| Shear force | 89.2 | 89.2 | 0.00% | 92.5 | 3.70% |
| Torque | 78.5 | 76.2 | −2.93% | 69.5 | −11.46% |
Disclaimer/Publisher’s Note: The statements, opinions and data contained in all publications are solely those of the individual author(s) and contributor(s) and not of MDPI and/or the editor(s). MDPI and/or the editor(s) disclaim responsibility for any injury to people or property resulting from any ideas, methods, instructions or products referred to in the content. |
© 2023 by the authors. Licensee MDPI, Basel, Switzerland. This article is an open access article distributed under the terms and conditions of the Creative Commons Attribution (CC BY) license (https://creativecommons.org/licenses/by/4.0/).
Share and Cite
MDPI and ACS Style
Peng, Z.; Xie, B.; Feng, Y.; Teng, J.; Li, Z. Research on the Non-Planar Deformation Behavior of Reinforced Concrete Components Based on Size Effect. Buildings 2023, 13, 1716. https://0-doi-org.brum.beds.ac.uk/10.3390/buildings13071716
AMA Style
Peng Z, Xie B, Feng Y, Teng J, Li Z. Research on the Non-Planar Deformation Behavior of Reinforced Concrete Components Based on Size Effect. Buildings. 2023; 13(7):1716. https://0-doi-org.brum.beds.ac.uk/10.3390/buildings13071716
Chicago/Turabian StylePeng, Zhihan, Binglei Xie, Yongqian Feng, Jun Teng, and Zuohua Li. 2023. "Research on the Non-Planar Deformation Behavior of Reinforced Concrete Components Based on Size Effect" Buildings 13, no. 7: 1716. https://0-doi-org.brum.beds.ac.uk/10.3390/buildings13071716
Note that from the first issue of 2016, this journal uses article numbers instead of page numbers. See further details here.