1. Introduction
The concrete industry has traditionally used ordinary Portland cement as the binder in concrete mixtures. However, Portland cement production is a large contributor to global carbon dioxide (CO
2) emissions [
1,
2,
3]. One way to reduce CO
2 emissions is to decrease cement usage by partially replacing cement with supplementary cementitious materials (SCMs). Class F fly ash, a byproduct of burning coal to produce electricity, has been a reliable SCM used to replace a substantial portion of cement and mitigate the alkali-silica reaction (ASR) in concrete. Fly ash also improves mechanical and other durability properties of concrete (such as corrosion resistance), reduces materials costs, and improves sustainability [
4,
5,
6]. However, environmental considerations and changes in the energy industry have reduced availability of fly ash [
7,
8,
9].
To compensate for anticipated fly ash shortages, cost-effective and eco-friendly alternative SCMs must be identified and investigated. There are several types of SCMs, such as natural pozzolans, metakaolin, or ground granulated blast-furnace slag (GGBFS) that appear to be potential alternatives to fly ash in concrete. As the effects of metakaolin and GGBFS in ultra-high performance concrete mixtures have been evaluated in previous studies conducted by the authors [
10,
11], a natural pozzolan (pumicite) was selected in this study since it is locally available in New Mexico, USA, where the research was conducted. In the United States, natural pozzolans have not been cost-competitive with fly ash until recently so they have not been widely used as SCMs. Consequently, comprehensive durability studies on concrete mixtures containing pumicite as a SCM are needed.
ASR is a prominent durability concern for concrete, especially in locations with highly reactive aggregates. ASR is an expansive reaction that can occur between siliceous aggregates and alkalis that may be present in Portland cement. Concrete expansion due to the ASR can cause tensile stresses that can lead to internal cracking which can significantly decrease the service life of a concrete structure. As ASR expansion cannot be controlled just by using low-alkali cement in locations with highly reactive aggregates [
12], such as New Mexico, USA, class F fly ash has historically been used in combination with low-alkali cement to mitigate ASR. Another common durability problem in concrete is corrosion of reinforcing steel that is often initiated by chloride ions migrating through concrete and reaching the reinforcing steel. Other durability-related issues that can accelerate degradation in concrete include shrinkage cracking and frost damage. Consequently, any SCM used to replace fly ash in concrete should also have the ability to mitigate ASR and provide the concrete with resistance to chloride ion penetration and frost resistance while also limiting concrete shrinkage.
This research examined the effects of using a locally sourced natural pozzolan (pumicite) mined from a geological deposit located near Española, New Mexico, USA, in concrete mixtures and its ability to provide protection against durability issues such as ASR and corrosion. The first goal of this study was to identify combinations of cementitious materials (including Portland cement, fly ash, and pumicite) capable of mitigating ASR. Once cementitious materials combinations with acceptable ASR resistance were identified, the next goal was to assess the possibility of producing concrete mixtures containing a natural pozzolan (pumicite) or containing a blend of fly ash and pumicite that had rheological, mechanical, and durability properties comparable to concrete mixtures containing only fly ash. In this research, concrete mixtures were characterized by assessing slump, air content, compressive strength, flexural strength, shrinkage, resistance to freezing and thawing, and chloride permeability (measured by rapid chloride permeability and surface resistivity tests).
2. Background
This section reviews information about ASR and other durability issues in concrete as well as the effects of natural pozzolan and other SCMs on rheological, mechanical, and durability properties of concrete.
2.1. Alkali-Silica Reaction
ASR expansion has been shown to increase with greater alkali concentration. Alkalis can be provided by aggregates, admixtures, or SCMs, so it is important to consider the total alkali content of a concrete mixture. Depending on aggregate reactivity, maximum permissible alkali contents of 2.5 to 4.5 kg/m
3 equivalent sodium oxide have been reported [
13]. Equivalent sodium oxide is computed using Equation (1):
where (
Na2O)
e is the equivalent sodium oxide,
Na2O is the sodium oxide, and
K2O is the potassium oxide.
Some studies have focused on identifying the aggregate mineral components, assessing aggregate reactivity, and identifying mechanisms for ASR reactions [
14,
15]. Research has shown that not all siliceous aggregates are susceptible to ASR. In another study, Multon et al. [
16] reported that ASR expansion can be seven times greater with coarser aggregate particles than with the finer particles, even for aggregates containing approximately the same amount of reactive silica. Additionally, ASR cannot be activated without moisture [
17]. Research has also shown that concrete with an internal relative humidity less than 80% will not experience expansive ASR [
18,
19].
Methods to mitigate ASR include replacing a portion of the cement with SCMs, using non-reactive aggregates, limiting the alkali content in the cement by using low-alkali cement, and using lithium compounds to inhibit the reaction [
17,
18,
20,
21]. However, using non-reactive aggregates or using low-alkali cement is not always practical [
17]. For example, New Mexico, USA, contains some of the most reactive aggregates in the world, and the ASR expansion cannot be controlled just by using low-alkali cement [
12]. Replacing a portion of Portland cement with SCMs is a cost-effective and environmentally friendly method for mitigating ASR since many SCMs are waste products or naturally occurring materials [
20,
22].
2.2. Other Durability Issues
SCMs in concrete generally improve mechanical and durability properties through pozzolanic reactions that lead to secondary calcium silicate hydrate (CSH) production that fills pore space, improves density, and reduces permeability [
10,
11,
23,
24,
25,
26]. Decreasing concrete permeability increases resistance to chloride ion penetration, which reduces the probability of reinforcing steel corrosion and extends the life expectancy of a concrete structure. While using SCMs is an effective way to reduce concrete permeability and to protect a structure against corrosion, moisture and harmful chemical compounds may still penetrate dense concrete through cracks caused by freezing and thawing cycles or shrinkage. Studies have shown that damage caused by freezing and thawing cycles can be avoided by using air-entraining admixtures (AEAs) or foaming agents to develop an appropriate air void system and by selecting frost-resistant aggregates [
27,
28,
29,
30,
31]. Cracking caused by shrinkage can also be limited by using SCMs such as fly ash and GGBFS that reduce concrete shrinkage [
32].
2.3. Supplamantry Cementiouos Materials
For decades, SCMs have been used to reduce Portland cement content and mitigate durability issues such as ASR expansion, degradation caused by freezing and thawing, chloride ion penetration, and attack by sulfates in different types of concrete [
1,
10,
11,
26,
33,
34]. In many cases, it has been demonstrated that SCMs can also enhance mechanical properties of concrete. Fly ash, GGBFS, silica fume, and natural pozzolans are some of the most commonly used SCMs in the concrete industry [
10,
35,
36,
37]. Other SCMs, such as rice husk ash and metakaolin, have also been used in the concrete industry to partially replace Portland cement and mitigate ASR [
11,
38,
39,
40,
41]. Additionally, Thomas et al. [
21] highlighted studies where highly reactive recycled glass (crushed) and ground reactive aggregates were used to mitigate ASR.
2.4. Natural Pozzolan
Natural pozzolans include a wide range of naturally occurring siliceous or siliceous and aluminous materials that individually lack significant cementitious ability but can form compounds possessing cementitious properties in the presence of water [
42]. Pumicite is an amorphous natural pozzolan that can be produced by gases released when volcanic lava solidifies. Pumicite has a porous structure caused by gas bubbles being trapped in rapidly cooling molten lava [
43].
Studies have shown that concrete slump decreases with the addition of pumicite powder [
44]. In a study conducted by Kabay et al. [
45], it was observed that using pumicite powder, fly ash, and blends containing both SCMs to replace Portland cement in concrete mixtures resulted in reduced sorptivity, lower water absorption, decreased void content, as well as reduced compressive and splitting tensile strengths at early ages. Additionally, using more, or coarser, pumicite in concrete mixtures may also lead to reduced heat of hydration and compressive strength along with increased setting time and water demand as well as improved ASR resistance and sulfate resistance [
46,
47]. Another study [
48] found that the use of pumicite alone (without catalysts such as sodium silicate and potassium fluoride) showed limited pozzolanic activity.
Sarıdemir [
49] also used pumicite in high strength concrete and found that using 25% pumicite decreased 28-day compression strength and elastic modulus. Another study [
50] also reported that replacing 10% of Portland cement with pumicite in high strength concrete significantly improved microstructural density, increased resistance to chloride ion penetration, enhanced 180-day compressive and indirect tensile strengths, and decreased 90-day water absorption. Tangtermsirikul and Kitticharoenkiat [
51] showed that using fly ash, pumicite, or a blend of both reduced 91-day compressive strength although strength development after 28 days was more rapid than for ordinary concrete. Using pumicite in self-compacting concrete also resulted in acceptable workability and greater 120-day compressive strength than mixtures without pumicite [
52]. Öz et al. [
53] also reported that replacing up to 20% of the Portland cement in concrete mixtures with pumicite resulted in acceptable frost resistance. However, concrete frost resistance decreased when 30% pumicite was used [
53]. Ghafari et al. [
44] reported that mixtures with pumicite had similar strength, elastic modulus, and bulk resistivity to mixtures containing class C fly ash and mixtures with only Portland cement at 56 days.
3. Research Significance
Fly ash is a common sustainable SCM in Portland cement concrete. However, availability of fly ash is uncertain as the energy industry transitions to renewable energy sources [
7,
8,
9]. There are several types of SCM such as natural pozzolans, metakaolin, or GGBFS that appear to be potential alternatives to fly ash in concrete mixtures. However, most of the studies on concrete mixtures containing pumicite (as a natural pozzolan) were based on analyses that considered only one or two durability issues and none of the journal articles investigated as many rheological, mechanical, and particularly durability properties as the present research. Therefore, a need exists for research studies that investigate a wide range of rheological, mechanical, and durability properties of both mortar and concrete specimens containing a natural pozzolan in a single study. This paper also addresses a gap in the existing literature of ASR mitigation methods for concrete mixtures containing extremely reactive aggregates. In the present study, two extremely reactive (for ASR) aggregate sources were utilized to assess the ability of the pumicite to effectively mitigate ASR expansions, particularly in the presence of highly reactive aggregates.
4. Materials and Methods
This section describes the materials and methods used in this research to produce mixtures and conduct testing to assess ASR resistance, workability, compressive and flexural strengths, shrinkage, resistance to freezing and thawing, rapid chloride permeability, and surface resistivity.
4.1. Materials
Materials utilized in this study were sourced locally in New Mexico, USA. Two aggregate sources were used in this study, the Placitas quarry near Bernalillo, New Mexico, USA, and another quarry at Moriarty, New Mexico, USA. Aggregates from these sources are siliceous and are known to be extremely susceptible to ASR. Physical properties and particle size distributions of the aggregates are provided in
Table 1 and
Table 2, respectively.
Three types of cementitious materials were used in this research, including Type I/II low-alkali Portland cement produced by GCC, a class F fly ash from the San Juan generating station in northern New Mexico, USA, and a natural pozzolan (pumicite) mined from a geological deposit located near Española, New Mexico, USA, by GCC. Chemical and physical properties of these three cementitious materials are provided in
Table 3.
As can be seen in
Table 3, the natural pozzolan used in this work contains elevated concentrations of Na
2O and K
2O compared to the fly ash and cement. In fact, concrete mixtures produced with the cementitious material combinations evaluated in this study all had Na
2O
e greater than 4.5 kg/m
3. Therefore, it is logical that the primary objective of this study was to evaluate the ability of this pumicite to mitigate ASR prior to investigating other concrete properties.
Due to the scarcity of fly ash, there has been significant escalation of fly ash price, which has led to price parity with the pumicite mined in New Mexico, USA, where this research was conducted. Pumicite is more convenient to obtain than fly ash and is significantly more cost-effective than alternative SCMs, such as silica fume and metakaolin. When fly ash is available, many concrete producers prefer to use it because of the abundant historical data; however, its scarcity drives the need for detailed studies of concrete containing the natural pozzolan.
4.2. Other Materials
To achieve the targeted workability and air content for the concrete mixtures, commercially available chemical admixtures that included a polycarboxylate-based high-range water-reducing admixture (HRWRA) and an AEA were added during mixing. The HRWRA used in this work was MasterGlenium 7920, and the AEA was MasterAir AE-90, both produced by BASF Construction Chemicals, Cambridge, MA, USA.
4.3. Mortar Mixtures
Mortar mixtures were produced to evaluate the effectiveness of the natural pozzolan (pumicite) for mitigating ASR expansion caused by two reactive fine aggregates (Placitas and Moriarty sands).
4.3.1. Proportions
Proportions for 22 mortar mixtures, produced using reactive aggregates from two sources, are presented in
Table 4. A water-to-cementitious materials (w/cm) ratio of 0.47 was used, and 2.87 g of HRWRA was added to improve workability. To maintain the w/cm ratio of 0.47, the mixing water was decreased by the amount of water provided by the HRWRA.
To interpret the names of the mortar mixtures in
Table 4, the first letter denotes the aggregate source (P for Placitas and M for Moriarty; the following one, two, or three letter series denotes the cementitious materials used in the mixture (C for cement, N for natural pozzolan, and F for fly ash); and the numbers after the second hyphen denote the cementitious materials contents (percent by mass) for each cementitious material in the mixture. For example, P-CNF-60/20/20 identifies the mixture with Placitas sand and cementitious materials that comprised 60% cement, 20% natural pozzolan, and 20% fly ash by mass.
The primary goal of this research was to evaluate the possibility of producing concrete mixtures with SCMs other than fly ash or a combination of fly ash and another SCM while ensuring the mixtures have sufficient resistance to ASR. Previous studies have shown that using 30% fly ash, by cementitious materials mass, in concrete mixtures is adequate to mitigate ASR even for highly reactive aggregates [
12]. Therefore, the present study set a limit of 30% total SCM, by mass of cementitious materials, for binary mortar mixtures. The natural pozzolan content in binary mortar mixtures was increased from 10 to 30% of cementitious materials mass in increments of 5% to replace all of the fly ash (30% of cementitious materials) and compare mortar mixtures containing natural pozzolan with those containing fly ash. Additionally, four ternary mortar mixtures from each aggregate source were produced to assess the effects of using a combination of fly ash and natural pozzolan on ASR mitigation. It should be noted that the ternary mortar mixtures contained up to 40% total SCM content, by mass of cementitious materials, instead of the 30% used in binary mortar mixtures, to reduce Portland cement consumption.
4.3.2. Alkali-Silica Reaction Testing
Specimen production, sampling, and testing were performed according to ASTM C1567 [
54]. Prior to mixing, the two reactive fine aggregates were sieved and washed to meet the particle size distribution requirements from ASTM C1567 [
54]. Three mortar bar specimens produced from each mortar mixture were cast in 25.4 × 25.4 × 286 mm
3 steel molds with steel studs cast into each end. Twenty-four hours after mixing, initial length readings were taken for each mortar bar specimen prior to being immersed for a 24-h period in a water bath that was raised to and then maintained at 80 ± 2 °C. The zero reading was taken after the 24-h water bath period to account for the thermal expansion the specimens experience. Then, the specimens were immersed in a 1 N sodium hydroxide (NaOH) solution that was kept at 80 ± 2 °C for 14 days. Length changes in the specimens were measured at 1, 3, 5, 7, 9, 11, 13, and 14 days using a length change comparator.
Measurements were taken within 15 s of a specimen being removed from the solution. According to ASTM C1567 [
54], mortar mixtures containing combinations of cement, pozzolan, or GGBFS that expand more than 0.10% at 16 days are considered to be unacceptable. However, some transportation agencies use a more stringent expansion limit of 0.08%.
4.4. Concrete Mixture Proportions
This research also investigated concrete mixtures produced using the two aggregate sources to identify the effects of using a natural pozzolan to replace fly ash on rheological, mechanical, and durability properties of concrete.
4.4.1. Proportions
To select proportions for concrete mixtures, an existing concrete mixture with a w/cm ratio of 0.35, approved by New Mexico Department of Transportation (NMDOT), New Mexico, USA, was revised using the properties of aggregates measured in the lab. Eight concrete mixtures were produced using each aggregate source.
Table 5 presents the proportions of 16 concrete mixtures with slump and air content values within the targeted ranges. For each mixture, the targeted slump range was 40 ± 25 mm, and the targeted air content range was 6.5% (−1.0 to +2.0%), which are typical criteria for paving mixtures in New Mexico, USA.
In the mixture names, the first letter indicates the aggregate source (P for Placitas and M for Moriarty), the letter N (for natural pozzolan), and a two-digit number indicating the natural pozzolan to cementitious materials ratio (%) appear after the first hyphen, and the letter F (for fly ash) and a two-digit number indicating the fly ash to cementitious materials ratio (%) appear after the second hyphen. For example, P-N22-F10 identifies the mixture with Placitas aggregates containing 22.5% pumicite and 10% fly ash as percentages of the total cementitious materials by mass.
Another goal of this research was to investigate the possibility of producing concrete mixtures with SCMs other than fly ash or a combination of fly ash and another SCM, while ensuring the produced concrete mixtures had rheological, mechanical, and durability properties comparable to concrete mixtures containing only fly ash. Similar to the logic provided for proportioning the mortar mixtures in
Section 4.3.1, the natural pozzolan content in binary concrete mixtures was gradually increased from 10 to 30% of cementitious materials mass in increments of 10% to replace all of the fly ash (30% of cementitious materials) and compare concrete mixtures containing natural pozzolan with those containing fly ash. Additionally, four ternary concrete mixtures from each aggregate source (with same cementitious materials combinations of ternary mortar mixtures) were produced to assess the effects of using a combination of fly ash and natural pozzolan on the rheological, mechanical, and durability properties of concrete mixtures. In the ternary concrete mixtures, the maximum total SCM content was increased to 40% from 30% in binary mixtures to reduce Portland cement consumption.
The mixing process was performed in a drum mixer with a 0.06 m
3 capacity. Materials for each concrete batch were mixed, placed, and cured according to ASTM C192 [
55]. For each mixture, thirteen cylinder specimens (102 by 203 mm), two beam specimens (152 × 152 × 610 mm
3), and seven prism specimens (76 × 102 × 406 mm
3) were cast. Four prism specimens had contact points embedded in each end. All specimens were demolded 24 h after placement and placed in a moist room with a relative humidity (RH) of 96% and a temperature of 23 ± 2 °C.
4.4.2. Rheological Properties
Immediately after mixing, fresh properties of the concrete mixtures were evaluated for slump and air content according to ASTM C143 and ASTM C231, respectively [
56,
57]. For each mixture, the targeted slump range was 40 ± 25 mm, and the targeted air content range was 6.5% (−1.0 to +2.0%).
4.4.3. Compression Testing
Compression tests were performed according to ASTM C39 [
58] using a 2670 kN capacity universal testing machine. Twelve cylindrical specimens (102 by 203 mm) were tested from each concrete mixture, with four specimens tested at ages of 7, 28, and 90 days.
4.4.4. Flexural Testing
To investigate 28-day flexural strength, two 152 × 152 × 610 mm
3 beam specimens from each mixture were evaluated for modulus of rupture (MOR) according to ASTM C78 [
59]. Beam specimens were positioned on two semi-circular supports that were located a distance of 76 mm from each end of the beam. Specimens were then subjected to two concentrated loads, positioned symmetrically about the midspan of the beam and spaced 152 mm apart.
4.4.5. Shrinkage Testing
Four prism specimens from each concrete mixture, with dimensions of 76 × 102 × 406 mm
3, were tested for shrinkage according to ASTM C157 [
60]. Specimens were moist cured at a RH of 96% and a temperature of 23 ± 2 °C for 28 days. Then, specimens were removed from the moist room and stored in ambient conditions with 30 ± 4% RH and a temperature of 20 ± 2 °C for an additional 28 days. It should be noted that the RH of 30% used in this work was less than the RH of 50% recommended by ASTM C157 [
60], which will lead to conservative final shrinkage results that were appropriate for New Mexico, USA, conditions, where the study was performed. Average length changes for each mixture during the 56-day test were used to calculate shrinkage strains.
4.4.6. Freezing and Thawing Testing
Freezing and thawing tests, depicted in
Figure 1, were conducted using three prism specimens from each mixture in accordance with ASTM C666 Procedure A [
61]. Prismatic specimens measuring 76 × 102 × 406 mm
3 were exposed to 300 cycles of freezing and thawing. Each cycle involved a rapid temperature decrease from 4 to −18 °C over approximately 140 min, followed by an increase in temperature from −18 to 4 °C over approximately 80 min (
Figure 1a). At the bottom of the temperature cycle, the temperature was maintained at −18 °C for eight minutes, whereas, at the top end, temperature was maintained at 4 °C for 10 min. Temperature cycles were paused during the 10-min period at the top of a cycle to measure mass and fundamental frequency of specimens at intervals not exceeding 36 cycles.
Frequency measurements were conducted according to ASTM C215 [
62] using the impact resonance method. In this method, the specimen was struck by an instrumented hammer, and a lightweight accelerometer was used to record the acceleration response history (
Figure 1b). The frequency of the maximum acceleration response for first mode vibration (fundamental frequency) was identified from an amplitude–frequency plot. Fundamental transverse frequency and mass were then used to compute dynamic elastic modulus values, as described in ASTM C215 [
62], which were subsequently used to calculate relative dynamic modulus (
RDM), as shown in Equation (2):
where
E0 and
En are dynamic elastic modulus (Pa) values after 0 and
n cycles of freezing and thawing, respectively [
61].
RDM after 300 cycles of freezing and thawing, referred to as durability factor (DF), was also used to compare the frost resistance of the concrete mixtures.
4.4.7. Rapid Chloride Permeability Testing
A common test for assessing the resistance of concrete to chloride ion penetration is the rapid chloride permeability test (RCPT). Specimen preparation and testing procedures for this test were conducted according to ASTM C1202 [
63]. This test was performed on two 51 mm slices that were sawn from two 102 by 203 mm cylindrical specimens. The sawn slices were first placed in a vacuum desiccator, where they were kept for three hours with an internal pressure of no more than 6650 Pa (
Figure 2a). After three hours, the slices were immersed in deionized water and kept there for one hour with the vacuum pump running. As the final step of specimen preparation, the immersed slices remained in the vacuum desiccator for an additional 18 h with the pump off. After preparation, the specimen slices were inserted in testing cells (
Figure 2b) that exposed one sawn face to a 3.0% sodium chloride solution and the other face to a 0.3 N sodium hydroxide solution. A 60 V DC power supply was used to maintain a constant voltage across the specimen, and the current flowing through the system was monitored at 30 min intervals over a six-hour period. Equation (3) was used to compute the total charge passed (coulombs), which is an indicator of the electrical conductance of the specimen:
where
Q = total charge passed (coulombs) through an
x (mm) diameter specimen,
I0 = current (amperes) immediately after voltage is applied,
It = current (amperes) at
t min after voltage is applied, and
x = diameter (mm) of the nonstandard specimen (102 mm).
RCPTs in this study were conducted at 180 days because ASTM C1202 [
63] recommends a minimum of 56 days of moist curing before performing a RCPT on specimens containing SCMs. Specimens containing SCMs may show ongoing improvements (lower total charge passed) beyond the initial 56-day period, so it is often better to conduct tests at later ages [
63]. Testing at later ages provides a better indication of the long-term durability since the slowly reacting SCMs will have reacted more completely.
4.4.8. Surface Resistivity Testing
A more rapid test to assess the resistance of concrete to chloride ion penetration is the surface resistivity test. In the present study, surface resistivity tests were performed at 180 days to be able to properly compare the surface resistivity test results with the 180-day RCPT results. The equipment used to perform the surface resistivity tests was a Resipod Proceq, shown in
Figure 3, which used a Four-Pin Wenner Probe Array. Testing was conducted on three cylinders from each mixture in accordance with AASHTO T 358 [
64].
In this test, the outer pins (current electrodes) of a Four-Pin Wenner probe array were used to apply an alternating current potential difference, and the resultant potential difference between the two inner pins (potential electrodes) was measured. Surface resistivity was then calculated using the induced current, the measured potential, and the affected specimen area.
5. Results and Discussion
This section presents the results of the testing performed during this study, which included ASR mortar bar tests, slump and air content tests on fresh concrete, compression and flexural strength tests, shrinkage measurements, and frost resistance tests as well as RCPTs and surface resistivity tests on hardened concrete.
5.1. Mortar Alkali-Silica Reaction Tests
Figure 4 and
Figure 5 present the ASR results for Placitas and Moriarty aggregates, respectively. Additionally,
Table 6 provides the average ASR expansion results (14-day) for all mortar mixtures. The greatest ASR expansions occurred in mortar specimens containing only low-alkali Portland cement (no SCMs), mixtures P-C-100 and M-C-100, with average expansions of 0.39% and 0.50%, respectively. Both mixtures experienced ASR expansion that exceeded the ASTM C1567 [
54] acceptable limit of 0.1% expansion. These expansion results confirmed the extremely reactive nature of two aggregate sources used in this study and that the Moriarty sand was more reactive than the Placitas sand.
In addition to mixtures P-C-100 and M-C-100, Placitas and Moriarty mixtures containing 10% pumicite (P-CN-90/10 and M-CN-90/10) and the Moriarty mixture containing 15% pumicite (M-CN-85/15) had unacceptable expansion results that exceeded the ASTM C1567 [
54] limit of 0.1%. Consequently, pumicite contents of 15% or less were identified as inadequate for mitigating ASR expansion and a minimum natural pozzolan content of 20% is recommended for mitigating ASR. It should be noted that mixtures that contained pumicite contents of 15% or less were excluded from some of the other portions of this study such as freezing and thawing tests. All mixtures containing 20% or more SCM showed ASR expansions no greater than 0.051%. Knowing that some state transportation agencies limit acceptable expansion to 0.08% would not change the acceptability of any of the mixtures accepted in this study.
Mortar mixtures containing pumicite (but not fly ash), including P-CN-90/10, P-CN-85/15, P-CN-80/20, P-CN-75/25, P-CN-70/30, M-CN-90/10, M-CN-85/15, M-CN-80/20, M-CN-75/25, and M-CN-70/30, showed a strong trend, where increasing pumicite content improved ASR mitigation (reduced expansion). Additionally, mortar mixtures containing 30% natural pozzolan (P-CN-70/30 and M-CN-70/30) had approximately 40% less expansion than mixtures containing 30% fly ash (P-CF-70/30 and M-CF-70/30), indicating that the natural pozzolan was substantially better than fly ash for mitigating ASR. This is particularly impressive since the alkali equivalent of the pumicite was much greater than for the fly ash (
Table 3). This observation can be used to facilitate a complete replacement of 20% minimum class F fly ash content (for ASR) required by some transportation agencies such as NMDOT.
Mortar mixtures that contained both natural pozzolan and fly ash proved to be the best mixtures for controlling ASR. Mixtures P-CNF-75/15/10, P-CNF-75/10/15, P-CNF-67.5/22.5/10, P-CNF-60/20/20, M-CNF-75/15/10, M-CNF-75/10/15, M-CNF-67.5/22.5/10, and M-CNF-60/20/20 all had expansions less than 0.03%.
Mixtures P-CN-75/25 and M-CN-75/25 demonstrated that 25% pumicite was able to adequately control ASR expansion by itself. However, mixtures containing 15% pumicite and 10% fly ash (P-CNF-75/15/10 and M-CNF-75/15/10) reduced expansions by at least 40% for both aggregate sources compared to the mixtures containing 25% pumicite (P-CN-75/25 and M-CN-75/25), demonstrating the benefits of ternary mixtures. This observation can be used to decrease the fly ash content from the 20% minimum fly ash content (for ASR) required by many transportation agencies such as NMDOT to 10% when fly ash is available.
5.2. Concrete Rheological Properties
Table 7 provides the results from rheological tests for each acceptable concrete mixture. Acceptable concrete mixtures had an average of two slump measurements between 15 and 65 mm and air content between 5.5 and 8.5%, which are typically acceptable for a 40 mm target slump and 6.5% target air content. In general, the workability of mixtures produced with the admixtures and SCMs used in this research was consistent enough to obtain acceptable slump with no more than two trial batches.
Generally, particles with greater surface area, due to angularity or porosity, are expected to have greater water absorption. Therefore, mixtures containing natural pozzolan were expected to require a greater amount of HRWRA to achieve a given slump compared to those containing fly ash since pumicite particles have greater surface area compared to fly ash particles (
Table 3) [
10,
11,
65]. However, when comparing mixtures containing 30% natural pozzolan (mixtures P-N30-F00 and M-N30-F00) to those containing 30% fly ash (mixtures P-N00-F30 and M-N00-F30), it was observed that the pumicite mixtures in this study required less HRWRA than the fly ash mixtures to achieve a slump within the target range. One potential cause of lower slump values for fly ash mixtures could be that the AEA was less effective in reducing water demand when combined with fly ash compared to pumicite. As can be seen in
Table 7, the air content of fly ash mixtures was lower than for pumicite mixtures. Other possible reasons could be differences in other properties of the pumicite and fly ash, such as type, source, and level of purity, which influenced the demand for HRWRA [
66].
Comparing Placitas mixtures containing only pumicite (P-N10F00, P-N20-F00, and P-N30-F00) and Moriarty mixtures containing only pumicite (M-N10-F00, M-N20-F00, and M-N30-F00) indicates that HRWRA demand to achieve the target slump increased as pumicite content increased from 10 to 30%. This was likely due to the large surface area of the pumicite particles, as a result of their angularity or porosity.
It was also observed that aggregate type appeared to influence slump. Comparing mixtures with different aggregate sources, but the same type and amount of cementitious materials (such as P-N30-F00 and M-N30-F00) shows that the amounts of HRWRA and AEA were constant, but mixtures with Moriarty aggregates had less slump. This was most likely associated with specific attributes of Moriarty aggregates such as a greater specific gravity than that of Placitas aggregates (
Table 1) as well as rougher and more angular particles than Placitas aggregates. Generally, aggregates with greater specific gravity tend to contribute to a denser mixture, requiring more water to achieve the target slump. The rough and angular nature of Moriarty aggregates facilitates better interlocking compared to Placitas aggregates, creating a stiffer mixture that either decreases the slump or requires more water to move and flow acceptably. However, the importance of this observation is minimal since the Moriarty mixtures were all acceptable in terms of rheological properties, compressive and flexural strengths, and all durability-related properties tested in this study.
To achieve an air content between 5.5 and 8.5%, the same AEA dosage was used for all mixtures, even though the aggregate and SCM types and amounts varied. From this observation, it appeared that air content was not particularly sensitive to aggregate source or SCM type. When aggregate source or the SCMs were changed, air content changed, but not enough to push the air content out of the target range.
5.3. Concrete Mechanical Properties
5.3.1. Compressive Strength Tests
Figure 6 and
Table 8 present average compressive strengths from four tests conducted at 7, 28, and 90 days for each concrete mixture. Comparing 28- and 90-day compressive strengths shows that increases in compressive strengths from 28 to 90 days ranged from 16.6 to 45.0% for the 16 mixtures. The dramatic increases in compressive strength at later ages were due to low 28-day strengths caused by the pumicite reacting slowly in the first 28 days. This observation was consistent with the behavior of many SCMs that reacted slowly at early ages but reacted more completely at later ages [
43,
45,
50,
67].
As a specific example of this behavior, increasing pumicite content caused a decrease in 7- and 28-day compressive strengths. Compressive strength at 28 days for mixtures with 30% natural pozzolan was 5.2% and 15.6% less than the compressive strength of specimens containing 10% natural pozzolan for specimens produced with Moriarty and Placitas aggregates, respectively. This could be attributed to the pumicite not being fully developed at 28 days since each pumicite content produced similar 90-day compressive strengths.
Specimens containing 30% pumicite had 7-, 28-, and 90-day compressive strengths that were comparable to strengths from specimens with 30% fly ash. This can be seen in
Table 8 by comparing mixture P-N30-F00 with P-N00-F30 and comparing mixture M-N30-F00 with M-N00-F30. For example, 90-day compressive strengths of Moriarty specimens containing 30% pumicite and 30% fly ash were 46.7 MPa and 47.5 MPa, respectively. This indicated that the natural pozzolan could be a desirable alternative for fly ash in terms of compressive strength.
For mixtures containing both fly ash and natural pozzolan, using 20% fly ash led to a decrease in 7- and 28-day compressive strengths compared to specimens with 10% fly ash. The 28-day compressive strength of mixture P-N22-F10 (36.0 MPa) was 16.5% greater than for mixture P-N20-F20 (30.9 MPa), and the 28-day compressive strength of mixture M-N22-F10 (36.5 MPa) was 9.0% greater than for mixture M-N20-F20 (33.5 MPa). By an age of 90 days, the 40% SCM mixtures had reached compressive strengths similar to the strengths of the 32.5% SCM mixtures due to continued reaction of the SCMs. Specifically, 90-day strengths for mixtures P-N22-F10 and P-N20-F20 were similar, as were compressive strengths for mixtures M-N22-F10 and M-N20-F20.
Mixtures containing Moriarty aggregates generally showed greater compressive strengths compared to their Placitas counterparts. Specifically, all but two Moriarty mixtures had 7-day compressive strengths exceeding Placitas mixtures by as much as 11.9%. Similarly, Moriarty mixtures had 28-day compressive strengths that were as much as 15.6% greater than equivalent Placitas mixtures (except for one mixture). All 90-day compressive strengths were also consistently greater for Moriarty aggregates than Placitas mixtures, by as much as 9.4%. The greater strengths provided by the Moriarty aggregates was most likely caused by the greater specific gravity and the rougher and more angular particles of the Moriarty aggregates.
5.3.2. Flexural Strength Tests
Average MOR results from all beam specimens are presented in
Table 8 and
Figure 7. Specimens containing 30% natural pozzolan had MOR values that were less than MOR values for comparable specimens with less pumicite. This rough trend of decreasing MOR with increasing pumicite content was consistent with the trend observed for compressive strength.
Specimens containing pumicite were observed to have average MOR values greater than 4.00 MPa that exceeded the flexural strengths provided by mixtures containing only fly ash (P-N00-F30 and M-N00-F30), indicating that natural pozzolan could also be a good alternative for fly ash when considering flexural strength. Specimens produced with Moriarty aggregates had greater MOR values, by 4.5% on average, compared to similar Placitas specimens. The greater MOR values for Moriarty specimens were consistent with greater compressive strengths from Moriarty specimens.
Similar to the results from the compressive tests, mixtures containing Moriarty aggregates had greater 28-day flexural strengths, by as much as 7.7%, compared to their Placitas counterparts. The rough texture of the Moriarty aggregates appeared to have an improved paste-aggregate bond that led to the increased flexural strength.
5.4. Concrete Shrinkage Tests
Average shrinkage results for four prism specimens from each concrete mixture are presented in
Figure 8 and
Figure 9. Final shrinkage values for all mixtures produced in this study were smaller than 710 μstrain, which was less than the 800 μstrain limit commonly used by many transportation agencies.
Comparing Placitas mixtures containing only pumicite (P-N10F00, P-N20-F00, and P-N30-F00) and Moriarty mixtures containing only pumicite (M-N10-F00, M-N20-F00, and M-N30-F00) shows that shrinkage decreased as pumicite content increased for both aggregate sources, which was consistent with the trend observed for the 7- and 28-day compression tests. Increasing pumicite content from 10 to 30% decreased the shrinkage by 5.9 and 4.9% for Placitas and Moriarty mixtures, respectively.
Mixtures containing 30% fly ash (P-N00-F30 and M-N00-F30) showed less shrinkage than mixtures containing 30% natural pozzolan (P-N30-F00 and M-N30-F00). The 30% fly ash mixtures produced 21.1 and 31.7% less shrinkage than 30% pumicite mixtures for the Placitas and Moriarty aggregates, respectively.
5.5. Concrete Freezing and Thawing Tests
Figure 10 and
Figure 11 present results from the ASTM C666 [
61] tests. Mixtures containing only 10% pumicite were not evaluated for frost resistance because they were shown to be unacceptable for ASR mitigation. All other mixtures had DF values (RDM after 300 cycles) greater than 75, which were acceptable according to ASTM C666 [
61]. These results showed that an adequate air void system was produced for each acceptable combination of cementitious materials and admixtures.
The results for mixtures containing 20 and 30% natural pozzolan also showed that these mixtures had the lowest DF values for both aggregate sources, and these DFs were substantially less than the DFs obtained from the 30% fly ash mixtures. These results were consistent with observations by Öz et al. [
53] that mixtures with 30% natural pozzolan had low DF values. The specific cause of the lower DFs for pumicite mixtures was not investigated, so the lower DFs may have been caused by a specific interaction with one or both of the admixtures used in this study. Alternatively, as pore size and distribution affected DF values [
68], the pumicite may cause the air void system to have a different distribution (pore size and spacing), although hardened air void analyses would need to be performed to verify this.
Increasing SCM content in concrete mixtures containing both fly ash and pumicite increased DF. Specifically, the trend for increasing DF with increasing SCM content was demonstrated by ordering mixtures with 25% SCM (P-N10-F15, P-N15-F10, M-N10-F15, and M-N15-F10) that had the lowest DF values, mixtures with 32.5% SCM (P-N22-F10 and M-N22-F10) that had intermediate DF values, and mixtures with 40% SCM (P-N20-F20 and M-N20-F20) that had the greatest DF values.
5.6. Concrete Chloride Ion Permeability Tests
RCPTs and surface resistivity tests at 180 days were used to evaluate chloride ion permeability of concrete specimens in accordance with ASTM C1202 [
63] and AASHTO T 358 [
64], respectively.
Table 9 provides average results of RCPTs and surface resistivity tests from each concrete mixture.
Total charge passed for all mixtures ranged between 237 and 498 coulombs and surface resistivity values for all mixtures were between 348 and 427 kΩ-mm. ASTM C1202 [
63] and AASHTO T 358 [
64] state that RCPT results between 100 and 1000 coulombs and surface resistivity test results between 370 and 2540 kΩ-mm indicate that the chloride ion penetration is “very low”. Therefore, all mixtures evaluated in this research had “very low” chloride ion penetration according to the RCPT results. According to the surface resistivity results, all mixtures other than the mixtures containing 10% pumicite were also categorized as being “very low” in terms of chloride ion penetration.
It was also observed that mixtures containing 10% natural pozzolan had the greatest chloride ion permeability (greatest total charge passed and lowest surface resistivity) and mixtures containing 40% SCM (20% pumicite and 20% fly ash) had the least chloride ion permeability for both types of aggregate. This is most likely due to additional secondary CSH formation, resulting from reaction of the SCMs, decreasing permeability of the mixtures [
23,
69].
Both RCPT and surface resistivity results also show that increasing pumicite content from 10 to 30% decreased chloride ion permeability, showing the effectiveness of pumicite in preventing ingress of chloride ions into concrete. The improved chloride ion permeability with increasing natural pozzolan content is most likely due to greater density caused by either the pumicite particle sizes or the pozzolanic reaction of the pumicite. Specifically, secondary CSH formation resulting from the natural pozzolan reacting with calcium hydroxide can fill pore spaces between cement particles, decreasing permeability [
23,
69].
Comparing specimens containing 30% fly ash (P-N00-F30 and M-N00-F30) and specimens containing 30% pumicite (P-N30-F00 and M-N30-F00) showed that using fly ash resulted in a lower chloride ion permeability (lower total charge passed and greater surface resistivity) for both Placitas and Moriarty aggregates. However, the benefit of using fly ash was not substantial and should not cause any concern about replacing fly ash with pumicite.
Comparing mixtures with different aggregate types that contained similar types and quantities of cementitious materials (such as P-N30-F00 and M-N30-F00) indicated that although the aggregate source impacted the RCPT and surface resistivity test results, this influence was not substantial enough to change the chloride ion classification of a mixture.
Overall, the chloride ion permeability tests show that surface resistivity results matched well with the RCPT results, which was consistent with observations reported by other researchers [
70,
71].
5.7. Comparison of Chloride Ion Permeability Tests
Comparing the results from RCPTs and surface resistivity tests indicated that the surface resistivity test results correlated well with RCPT results, which was consistent with findings from other studies [
10,
11,
36,
70,
71,
72]. In the present study, a power regression method was applied to results from the 16 mixtures with average surface resistivity values ranging from 348 to 427 kΩ-mm and RCPT values ranging from 237 to 498 coulombs to develop the relationship presented in Equation (4) with a coefficient of determination (R
2) of 0.80:
where
El Dieb [
70] also studied the relationship between surface resistivity and RCPT results for 42 concrete mixtures with surface resistivity values ranging from 50 to 4000 kΩ-mm and RCPT values ranging from 100 to 5000 coulombs and developed Equation (5) (with R
2 = 0.95):
As can be observed in
Figure 12, Equation (5) overestimates RCPT results from the present study while Equation (4) represents data reasonably well. The lower R
2 value for Equation (4) is due, at least in part, to the small population and narrow range of results in this study. Although El Dieb [
70] did not present individual test results, it is visually apparent that the scatter in El Dieb’s [
70] data was greater for surface resistivity values in the range of 300 to 500 kΩ-mm than the scatter observed in the present study.
6. Conclusions
Based on the research conducted during this project, the following conclusions were drawn:
While combinations of natural pozzolan and fly ash in ternary mixtures proved to be the best combinations for mitigating ASR, using a 20% minimum pumicite content in binary mixtures was adequate to effectively control ASR expansions. Additionally, mortar mixtures containing 30% pumicite produced approximately 40% less expansion compared to mixtures with 30% fly ash, which indicated the greater effectiveness of pumicite for mitigating ASR.
Although increasing natural pozzolan content reduced 28-day compressive strength, specimens containing 30% pumicite had 28-day compressive strengths comparable to strengths from specimens with 30% fly ash.
Specimens containing pumicite had average MOR values greater than 4.00 MPa and exceeded the flexural strengths of specimens containing only fly ash.
Although the pumicite seemed to cause greater shrinkage than fly ash, all of the concrete mixtures had final shrinkage values smaller than 710 μstrain, which was less than the 800 μstrain limit commonly used by many transportation agencies.
Freezing and thawing tests showed that 20 and 30% pumicite mixtures had the lowest DF values for both aggregate sources, however, all mixtures had acceptable DFs.
Other than mixtures containing only 10% pumicite, all mixtures had “very low” chloride ion penetration (total charge passed less than 500 coulombs and surface resistivity greater than 371 kΩ-mm). Additionally, increasing pumicite content decreased chloride ion penetration, with 30% pumicite specimens performing almost as well as 30% fly ash specimens.
Surface resistivity measurements were mostly consistent with RCPT results when comparing the chloride ion resistance categories.
Overall, the results indicate that pumicite can be a desirable alternative for fly ash.
Author Contributions
Conceptualization, S.M. and C.M.N.; Data curation, S.M.; Formal analysis, S.M. and C.M.N.; Funding acquisition, C.M.N.; Investigation, S.M. and J.M.G.; Methodology, S.M. and J.M.G., W.K.T., and C.M.N.; Project administration, C.M.N.; Supervision, C.M.N.; Validation, S.M. and C.M.N.; Visualization, S.M.; Writing—original draft, S.M.; Writing—review and editing, S.M., J.M.G., W.K.T., and C.M.N. All authors have read and agreed to the published version of the manuscript.
Funding
This research was funded by the Transportation Consortium of South-Central States, grant number 20CNMSU40. The APC was funded by New Mexico State University.
Data Availability Statement
The data presented in this study are openly available in Transportation Consortium of South-Central States (Tran-SET), project No. 20CNMSU40 entitled “Durability of Concrete Produced with Alternative Supplementary Cementitious Material” at
https://digitalcommons.lsu.edu/transet_pubs/109 (accessed on 10 June 2023) [
36].
Acknowledgments
The authors would like to thank Salt River Materials Group for their donations of fly ash, BASF Chemical Company for their donations of admixtures, and the New Mexico Department of Transportation for the use of their surface resistivity instrument.
Conflicts of Interest
The authors declare no conflict of interest. The funders had no role in the design of the study; in the collection, analyses, or interpretation of data; in the writing of the manuscript; or in the decision to publish the results.
References
- Masoule, M.S.T.; Bahrami, N.; Karimzadeh, M.; Mohasanati, B.; Shoaei, P.; Ameri, F.; Ozbakkaloglu, T. Lightweight Geopolymer Concrete: A Critical Review on the Feasibility, Mixture Design, Durability Properties, and Microstructure. Ceram. Int. 2022, 48, 10347–10371. [Google Scholar] [CrossRef]
- Kamath, M.; Prashant, S.; Ralegaonkar, R. Microstructure Properties of Popular Alkali-Activated Pastes Cured in Ambient Temperature. Buildings 2023, 13, 858. [Google Scholar] [CrossRef]
- Amran, Y.H.M.; Alyousef, R.; Alabduljabbar, H.; El-Zeadani, M. Clean Production and Properties of Geopolymer Concrete: A Review. J. Clean. Prod. 2020, 251, 119679. [Google Scholar] [CrossRef]
- Dhir, R.K.; Munday, J.G.L.; Ong, L.T. Investigations of the Engineering Properties of OPC/Pulverized-Fuel Ash Concrete: Deformation Properties. Inst. Struct. Eng. 1986, 64B2, 36–42. [Google Scholar]
- Atis, C.D.; Kilic, A.; Sevim, U.K. Strength and Shrinkage Properties of Mortar Containing a Nonstandard High-Calcium Fly Ash. Cem. Concr. Res. 2004, 34, 99–102. [Google Scholar] [CrossRef]
- Kristiawan, S.; Aditya, M.T.M. Effect of High-Volume Fly Ash on Shrinkage of Self-compacting Concrete. Procedia Eng. 2015, 125, 705–712. [Google Scholar] [CrossRef]
- ACAA (American Coal Ash Association). Fly Ash Use in Concrete Increases Slightly as Overall Coal Ash Recycling Rate Declines. Available online: https://acaa-usa.org (accessed on 21 December 2022).
- Diaz-Loya, I.; Juenger, M.; Seraj, S.; Minkara, R. Extending Supplementary Cementitious Material Resources: Reclaimed and Remediated Fly Ash and Natural Pozzolans. Cem. Concr. Compos. 2019, 101, 44–51. [Google Scholar] [CrossRef]
- Yaseen, N.; Irfan-ul-Hassan, M.; Saeed, A.; Rizwan, S.A.; Afzal, M. Sustainable Development and Performance Assessment of Clay-Based Geopolymer Concrete Bricks Incorporating Fly Ash and Sugarcane Bagasse Ash. J. Mater. Civ. Eng. ASCE 2022, 34, 4022036. [Google Scholar] [CrossRef]
- Mousavinezhad, S.; Gonzales, G.J.; Toledo, W.K.; Garcia, J.M.; Newtson, C.M.; Allena, S. A Comprehensive Study on Non-Proprietary Ultra-High-Performance Concrete Containing Supplementary Cementitious Materials. Materials 2023, 16, 2622. [Google Scholar] [CrossRef]
- Mousavinezhad, S.; Gonzales, G.J.; Toledo, W.K.; Garcia, J.M.; Newtson, C.M. Mechanical Properties of Ultra-high performance Concrete Containing Natural Pozzolan and Metakaolin. In Tran-SET 2022; ASCE: San Antonio, TX, USA, 2022; pp. 200–208. [Google Scholar] [CrossRef]
- Malvar, L.J.; Lenke, L.R. Efficiency of Fly Ash in Mitigating Alkali-Silica Reaction Based on Chemical Composition. Am. Concr. Inst. Mater. J. 2006, 103, 319–326. [Google Scholar]
- Nixon, P.J.; Sims, I. RILEM TC106 Alkali Aggregate Reaction—Accelerated Tests Interim Report and Summary of National Specifications. In Proceedings of the 9th International Conference on Alkali-Aggregate Reaction in Concrete, London, UK, 27–31 July 1992; The Concrete Society: Taito City, Tokyo, 1992; Volume 2, pp. 731–738. [Google Scholar]
- Stanton, T.E. Expansion of Concrete Through Reaction Between Cement and Aggregate. In Proceedings of the American Society of Civil Engineers; ASCE: Reston, VA, USA, 1940; Volume 66, pp. 1781–1811. [Google Scholar]
- Poole, A.B. Introduction to Alkali-Aggregate Reaction in Concrete. In The Alkali-Silica Reaction in Concrete, 1st ed.; Swamy, R.N., Ed.; Van Nostrand Reinhold: New York, NY, USA, 1992; pp. 1–29. [Google Scholar]
- Multon, S.; Cyr, M.; Sellier, A.; Leklou, A.; Petit, L. Coupled Effects of Aggregate Size and Alkali Content on ASR Expansion. Cem. Concr. Res. 2007, 38, 350–359. [Google Scholar] [CrossRef]
- Farney, J.A.; Kerkhoff, B. Diagnosis and Control of Alkali-Aggregate Reactions in Concrete; Portland Cement Association: Skokie, IL, USA, 2007. [Google Scholar]
- Folliard, K.J.; Thomas, M.D.A.; Kurtis, K.E. Guidelines for the Use of Lithium to Mitigate or Prevent Alkali-Silica Reaction (ASR): Chapter 2 Alkali-Silica Reaction; Publication No. FHWA-RD-03-047; FHWA, USA Department of Transportation: Washington, DC, USA, 2003. [Google Scholar]
- Stark, D. The Moisture Condition of Field Concrete Exhibiting Alkali-Silica Reactivity. In Proceedings of the Durability of Concrete: Second International Conference, Montreal, QC, Canada, 4–9 August 1991; Volume 2, pp. 973–987. [Google Scholar]
- Kosmatka, S.H.; Wilson, M.L. Design and Control of Concrete Mixtures, 15th ed.; Portland Cement Association: Skokie, IL, USA, 2008. [Google Scholar]
- Thomas, M.D.A.; Fournier, B.; Folliard, K.J. Alkali-Aggregate Reactivity (AAR) Facts Book; Publication No. FHWA-HIF-13-019; FHWA, USA Department of Transportation: Washington, DC, USA, 2013. [Google Scholar]
- Snellings, R. Assessing, Understanding and Unlocking Supplementary Cementitious Materials. RILEM Tech. Lett. 2016, 1, 50–55. [Google Scholar] [CrossRef]
- Ezziane, K.; Bougara, A.; Kadri, A.; Khelafi, H.; Kadri, E. Compressive Strength of Mortar Containing Natural Pozzolan Under Various Curing Temperature. Cem. Concr. Compos. 2007, 29, 587–593. [Google Scholar] [CrossRef]
- Stanish, K.D.; Hooton, R.D.; Thomas, M.D.A. Testing the Chloride Penetration Resistance of Concrete: A Literature Review; Contract No. DTFH61-97-R-000228; FHWA, USA Department of Transportation: Washington, DC, USA, 1997. [Google Scholar]
- Shetty, P.P.; Rao, A.U.; Pai, B.H.V.; Kamath, M.V. Performance of High-Strength Concrete with the Effects of Seashell Powder as Binder Replacement and Waste Glass Powder as Fine Aggregate. J. Compos. Sci. 2023, 7, 92. [Google Scholar] [CrossRef]
- Nematzadeh, M.; Nazari, A.; Tayebi, M. Post-Fire Impact Behavior and Durability of Steel Fiber-Reinforced Concrete Containing Blended Cement–Zeolite and Recycled Nylon Granules as Partial Aggregate Replacement. Arch. Civ. Mech. Eng. 2022, 22, 5. [Google Scholar] [CrossRef]
- Pigeon, M.; Zuber, B.; Marchand, J. 11-Freeze/thaw Resistance. Adv. Concr. Technol. 2003, 1, 1–17. [Google Scholar]
- Kohandelnia, M.; Hosseinpoor, M.; Yahia, A.; Belarbi, R. New insight on rheology of self-consolidating earth concrete (SCEC). Powder Technol. 2023, 424, 118561. [Google Scholar] [CrossRef]
- Masoule, M.S.T.; Baffoe, E.; Ghahremaninezhad, A. On the Physicochemical Properties and Foaming Characteristics of Proteins in Cement Environment. Constr. Build. Mater. 2023, 366, 130204. [Google Scholar] [CrossRef]
- Tunstall, L.E.; Ley, M.T.; Scherer, G.W. Air Entraining Admixtures: Mechanisms, Evaluations, and Interactions. Cem. Concr. Res. 2021, 150, 106557. [Google Scholar] [CrossRef]
- Qiao, M.; Chen, J.; Yu, C.; Wu, S.; Gao, N.; Ran, Q. Gemini Surfactants as Novel Air Entraining Agents for Concrete. Cem. Concr. Res. 2017, 100, 40–46. [Google Scholar] [CrossRef]
- Mokarem, D.W.; Weyers, R.E.; Lane, D.S. Development of a Shrinkage Performance Specifications and Prediction. Cem. Concr. Res. 2005, 35, 918–925. [Google Scholar] [CrossRef]
- Kumar, M.; Prashant, S.; Kamath, M.V. Enhancing the Sustainability of High Strength Concrete in Terms of Embodied Energy and Carbon Emission by Incorporating Sewage Sludge and Fly Ash. Innov. Infrastruct. Solut. 2022, 7, 240. [Google Scholar] [CrossRef]
- Rezvan, S.; Moradi, M.J.; Dabiri, H.; Daneshvar, K.; Karakouzian, M.; Farhangi, V. Application of Machine Learning to Predict the Mechanical Characteristics of Concrete Containing Recycled Plastic-Based Materials. Appl. Sci. 2023, 13, 2033. [Google Scholar] [CrossRef]
- Tanu, H.M.; Unnikrishnan, S. Utilization of Industrial and Agricultural Waste Materials for the Development of Geopolymer Concrete—A Review. Mater. Today Proc. 2022, 65, 1290–1297. [Google Scholar]
- Newtson, C.M.; Weldon, B.D.; Garcia, J.M.; Mousavinezhad, S.; Toledo, W.K. Durability of Concrete Produced with Alternative Supplementary Cementitious Material; Final Research Report, Tran-SET project 20CNMSU40; Transportation Consortium of South-Central States; Louisiana State University: Baton Rouge, LA, USA, 2021; Available online: https://digitalcommons.lsu.edu/transet_pubs/109 (accessed on 10 January 2023).
- Tanu, H.M.; Unnikrishnan, S. Mechanical Strength and Microstructure of GGBS-SCBA based Geopolymer Concrete. J. Mater. Res. Technol. 2023, 24, 7816–7831. [Google Scholar]
- Aguilar, R.A.; Díaz, O.B.; García, J.I.E. Lightweight Concretes of Activated Metakaolin-Fly Ash Binders, with Blast Furnace Slag Aggregates. Constr. Build. Mater. 2010, 24, 1166–1175. [Google Scholar] [CrossRef]
- Tarhuni, F.; Zahid, H. Use of Rice Husk Ash and Hydrated Lime as Stabilizing Agents for Poor Subgrade Soils and Embankments. In Tran-SET 2022; ASCE: San Antonio, TX, USA, 2022; pp. 173–181. [Google Scholar]
- Mehmood, A.; Irfan-ul-Hassan, M.; Yaseen, N. Role of Industrial By-Products and Metakaolin in the Development of Sustainable Geopolymer Concrete Blends: Upscaling from Laboratory-Scale to Pilot-Scale. J. Build. Eng. 2022, 62, 105279. [Google Scholar] [CrossRef]
- Tanu, H.M.; Unnikrishnan, S. Review on Durability of Geopolymer Concrete Developed with Industrial and Agricultural Byproducts. Mater. Today Proc. 2023; in press. [Google Scholar] [CrossRef]
- American Concrete Institute (ACI) Committee 116. Cement and Concrete Terminology; ACI 116R-00; American Concrete Institute (ACI) Committee: Farmington Hills, MI, USA, 2000. [Google Scholar]
- Khandaker, M.; Hossain, A. Properties of Volcanic Pumice Based Cement and Lightweight. Cem. Concr. Res. 2004, 34, 283–291. [Google Scholar]
- Ghafari, E.; Feys, D.; Khayat, K. Feasibility of using Natural SCMs in Concrete for Infrastructure Applications. Constr. Build. Mater. 2016, 127, 724–732. [Google Scholar] [CrossRef]
- Kabay, N.; Tufekci, M.M.; Kizilkanat, A.B.; Oktay, D. Properties of Concrete with Pumice Powder and Fly Ash as Cement Replacement Materials. Constr. Build. Mater. 2015, 85, 1–8. [Google Scholar] [CrossRef]
- Ramasamy, U.; Bordelon, A.C.; Tikalsky, P.J. Properties of Different Pumice Grades Blended with Cement. J. Mater. Civ. Eng. 2017, 29, 4017040. [Google Scholar] [CrossRef]
- Hossain, K.M.A. Blended Cement using Volcanic Ash and Pumice. Cem. Concr. Res. 2003, 33, 1601–1605. [Google Scholar] [CrossRef]
- Liu, J.; Lv, X.J.; Cao, M.L.; Cui, S.C. Experimental Study on Cementitious Property of Pumice. Appl. Mech. Mater. 2011, 99–100, 773–776. [Google Scholar] [CrossRef]
- Sarıdemir, M. Effect of Silica Fume and Ground Pumice on Compressive Strength and Modulus of Elasticity of High Strength Concrete. Constr. Build. Mater. 2013, 49, 484–489. [Google Scholar] [CrossRef]
- Zeyad, A.M.; Tayeh, B.A.; Yusuf, M.O. Strength and Transport Characteristics of Volcanic Pumice Powder Based High Strength Concrete. Constr. Build. Mater. 2019, 216, 314–324. [Google Scholar] [CrossRef]
- Tangtermsirikul, S.; Kitticharoenkiat, P. Development of Low Heat Concrete Using Fly Ash and Pumicite. Res. Dev. J. Eng. Inst. Thail. 1997, 1, 88–98. [Google Scholar]
- Granata, M.F. Pumice Powder as Filler of Self-Compacting Concrete. Constr. Build. Mater. 2015, 96, 581–590. [Google Scholar] [CrossRef]
- Öz, H.Ö.; Yücel, H.E.; Günes, M. Freeze-Thaw Resistance of Self Compacting Concrete Incorporating Basic Pumice. Int. J. Theor. Appl. Mech. 2016, 1, 285–291. [Google Scholar]
- ASTM C1567-21; Standard Test Method for Determining the Potential Alkali-Silica Reactivity of Combinations of Cementitious Materials and Aggregate (Accelerated Mortar-Bar Method). ASTM International: West Conshohocken, PA, USA, 2021.
- ASTM C192/C192M-19; Standard Practice for Making and Curing Concrete Test Specimens in the Laboratory. ASTM International: West Conshohocken, PA, USA, 2019.
- ASTM C143/C143M-20; Standard Test Method for Slump of Hydraulic-Cement Concrete. ASTM International: West Conshohocken, PA, USA, 2020.
- ASTM C231/C231M-17a; Standard Test Method for Air Content of Freshly Mixed Concrete by the Pressure Method. ASTM International: West Conshohocken, PA, USA, 2017.
- ASTM C39/C39M-20; Standard Test Method for Compressive Strength of Cylindrical Concrete Specimens. ASTM International: West Conshohocken, PA, USA, 2020.
- ASTM C78/C78M-21; Standard Test Method for Flexural Strength of Concrete (using Simple Beam with Third-Point Loading). ASTM International: West Conshohocken, PA, USA, 2021.
- ASTM C157/C157M-17; Standard Test Method for Length Change of Hardened Hydraulic-Cement Mortar and Concrete. ASTM International: West Conshohocken, PA, USA, 2017.
- ASTM C666/C666M-15; Standard Test Method for Resistance of Concrete to Rapid Freezing and Thawing. ASTM International: West Conshohocken, PA, USA, 2015.
- ASTM C215-19; Standard Test Method for Fundamental Transverse, Longitudinal, and Torsional Resonant Frequencies of Concrete Specimens. ASTM International: West Conshohocken, PA, USA, 2019.
- ASTM C1202-22; Standard Test Method for Electrical Indication of Concrete’s Ability to Resist Chloride Ion Penetration. ASTM International: West Conshohocken, PA, USA, 2022.
- AASHTO T 358; Standard Method of Test for Surface Resistivity Indication of Concrete’s Ability to Resist Chloride Ion Penetration. American Association of State Highway and Transportation Officials: Washington, DC, USA, 2019.
- Kohandelnia, M.; Hosseinpoor, M.; Yahia, A.; Belarbi, R. Multiscale Investigation of Self-Consolidating Earthen Materials using a Novel Concrete-Equivalent Mortar Approach. Constr. Build. Mater. 2023, 370, 130700. [Google Scholar] [CrossRef]
- Kohandelnia, M.; Hosseinpoor, M.; Yahia, A.; Belarbi, R. A New Approach for Proportioning Self-Consolidating Earth Paste (SCEP) using the Taguchi method. Constr. Build. Mater. 2022, 347, 128579. [Google Scholar] [CrossRef]
- Khandaker, M.; Hossain, A. Potential Use of Volcanic Pumice as a Construction Material. J. Mater. Civ. Eng. 2004, 16, 573–577. [Google Scholar]
- Dodson, V.H. Concrete Admixtures, 1st ed.; Springer: New York, NY, USA, 1990. [Google Scholar]
- Lam, L.; Wong, M.O.; Poon, C.S. Degree of Hydration and Gel/Space Ratio of High-Volume Fly Ash/Cement Systems. Cem. Concr. Res. 2000, 30, 747–756. [Google Scholar] [CrossRef]
- El Dieb, A.S. Evaluating Concrete Durability using Simple Non–Destructive Test Towards Performance–Based Specification. MOJ Civ. Eng. 2018, 4, 100–102. [Google Scholar] [CrossRef]
- Tanesi, J.; Ardani, A. Surface Resistivity Test Evaluation as an Indicator of the Chloride Permeability of Concrete; Publication No. FHWA-HRT-13-024; FHWA, USA Department of Transportation: Washington, DC, USA, 2012. [Google Scholar]
- Malakooti, A.; Thomas, R.J.; Maguire, M. Investigation of Concrete Electrical Resistivity as a Performance-Based Test; Final Report, Report Number: UT-19.09; Utah Department of Transportation: Taylorsville, UT, USA, 2019. [Google Scholar]
Figure 1.
Freezing and thawing test: (a) freeze–thaw chamber and (b) fundamental frequency test.
Figure 1.
Freezing and thawing test: (a) freeze–thaw chamber and (b) fundamental frequency test.
Figure 2.
RCPT: (a) vacuum pump and desiccator and (b) power supply and test cell.
Figure 2.
RCPT: (a) vacuum pump and desiccator and (b) power supply and test cell.
Figure 3.
Surface resistivity test.
Figure 3.
Surface resistivity test.
Figure 4.
ASR test results (Placitas aggregate).
Figure 4.
ASR test results (Placitas aggregate).
Figure 5.
ASR test results (Moriarty aggregate).
Figure 5.
ASR test results (Moriarty aggregate).
Figure 6.
Compressive strength results (±standard deviation).
Figure 6.
Compressive strength results (±standard deviation).
Figure 7.
28-day flexural strength results (±standard deviation).
Figure 7.
28-day flexural strength results (±standard deviation).
Figure 8.
Shrinkage test results (Placitas aggregate).
Figure 8.
Shrinkage test results (Placitas aggregate).
Figure 9.
Shrinkage test results (Moriarty aggregate).
Figure 9.
Shrinkage test results (Moriarty aggregate).
Figure 10.
Freezing and thawing test results (Placitas aggregate).
Figure 10.
Freezing and thawing test results (Placitas aggregate).
Figure 11.
Freezing and thawing test results (Moriarty aggregate).
Figure 11.
Freezing and thawing test results (Moriarty aggregate).
Figure 12.
Relationship between RCPT and surface resistivity test results [
70].
Figure 12.
Relationship between RCPT and surface resistivity test results [
70].
Table 1.
Aggregates physical properties.
Table 1.
Aggregates physical properties.
| Aggregate Source | Aggregate Type | Bulk Specific Gravity | Moisture Content (%) | Absorption
(%) | Dry Rodded
Unit Weight (kg/m3) | Fineness Modulus |
|---|
| Placitas | Coarse Agg. | 2.53 | 0.2 | 1.7 | 1565 | - |
| | Pea Gravel | 2.52 | 0.9 | 2.0 | 1476 | - |
| | Sand | 2.61 | 1.1 | 1.4 | - | 2.77 |
| Moriarty | Coarse Agg. | 2.65 | 0.2 | 1.7 | 1572 | - |
| | Pea Gravel | 2.66 | 0.2 | 1.3 | 1530 | - |
| | Sand | 2.70 | 0.9 | 1.2 | - | 3.40 |
Table 2.
Particle size distribution (percent passing) of aggregates.
Table 2.
Particle size distribution (percent passing) of aggregates.
| Aggregate Source | Aggregate Type | Sieve Opening (mm) |
|---|
| 19.0 | 12.5 | 9.5 | 4.75 | 2.36 | 1.18 | 0.6 | 0.3 | 0.15 | PAN |
|---|
| Placitas | Coarse Agg. | 62.8 | 8.9 | 5.7 | 7.0 | 6.8 | 1.1 | - | - | - | 0.0 |
| | Pea Gravel | - | - | 98.7 | 8.2 | 0.6 | 0.5 | 0.4 | 0.3 | 0.2 | 0.0 |
| | Sand | - | - | - | 98.4 | 84.7 | 70.9 | 49.9 | 16.8 | 2.9 | 0.0 |
| Moriarty | Coarse Agg. | 81.7 | 39.5 | 11.3 | 3.7 | 1.6 | 0.7 | - | - | - | 0.0 |
| | Pea Gravel | - | - | 93.2 | 7.5 | 3.0 | 1.9 | 1.8 | 1.3 | 1.1 | 0.0 |
| | Sand | - | - | - | 98.3 | 87.1 | 78.2 | 59.8 | 29.1 | 6.3 | 0.0 |
Table 3.
Chemical and physical properties of cement, fly ash, and natural pozzolan (% mass).
Table 3.
Chemical and physical properties of cement, fly ash, and natural pozzolan (% mass).
| Chemical Compounds | Material |
|---|
| Cement (Type I/II) | Class F Fly Ash | Pumicite |
|---|
| SiO2 | 20.3 | 53.16 | 76.29 |
| Al2O3 | 4.6 | 24.64 | 12.13 |
| Fe2O3 | 3.4 | 4.22 | 1.74 |
| CaO | 63.9 | 8.99 | 0.40 |
| MgO | 1.91 | 1.25 | 0.07 |
| Na2O | 0.23 | 1.66 | 4.23 |
| K2O | 0.38 | 1.24 | 4.29 |
| TiO2 | - | - | 0.10 |
| MnO2 | - | - | 0.08 |
| P2O5 | - | - | 0.02 |
| SrO | - | - | 0.01 |
| BaO | - | - | 0.01 |
| SO3 | 2.86 | 0.25 | 0.00 |
| Loss on Ignition | 2.24 | - | - |
| Physical Properties | | | |
| Specific Gravity | 3.15 | 1.91 | 2.45 |
| Spec. Surface Area (m2/kg) | 335 | 734 | 17,348 |
| Autoclave Expansion (%) | 0.05 | 0.01 | - |
Table 4.
Mortar mixture proportions.
Table 4.
Mortar mixture proportions.
| Mixture Name | Cement
(g/m3) | Natural Pozzolan
(g/m3) | Fly Ash
(g/m3) | Sand
(g/m3) | Water
(g/m3) | HRWRA
(g/m3) |
|---|
| P-C-100 | 440 | - | - | 990 | 206 | 2.87 |
| P-CN-90/10 | 264 | 176 | - | 990 | 206 | 2.87 |
| P-CN-85/15 | 176 | 264 | - | 990 | 206 | 2.87 |
| P-CN-80/20 | 88 | 352 | - | 990 | 206 | 2.87 |
| P-CN-75/25 | - | 440 | - | 990 | 206 | 2.87 |
| P-CN-70/30 | - | 440 | | 990 | 206 | 2.87 |
| P-CF-70/30 | 308 | - | 132 | 990 | 206 | 2.87 |
| P-CNF-75/10/15 | 132 | 264 | 44 | 990 | 206 | 2.87 |
| P-CNF-75/15/10 | 198 | 176 | 66 | 990 | 206 | 2.87 |
| P-CNF-67.5/22.5/10 | - | 396 | 44 | 990 | 206 | 2.87 |
| P-CNF-60/20/20 | - | 352 | 88 | 990 | 206 | 2.87 |
| M-C-100 | 440 | - | - | 990 | 206 | 2.87 |
| M-CN-90/10 | 264 | 176 | - | 990 | 206 | 2.87 |
| M-CN-85/15 | 176 | 264 | - | 990 | 206 | 2.87 |
| M-CN-80/20 | 88 | 352 | - | 990 | 206 | 2.87 |
| M-CN-75/25 | - | 440 | - | 990 | 206 | 2.87 |
| M-CN-70/30 | - | 440 | | 990 | 206 | 2.87 |
| M-CF-70/30 | 308 | - | 132 | 990 | 206 | 2.87 |
| M-CNF-75/10/15 | 132 | 264 | 44 | 990 | 206 | 2.87 |
| M-CNF-75/15/10 | 198 | 176 | 66 | 990 | 206 | 2.87 |
| M-CNF-67.5/22.5/10 | - | 396 | 44 | 990 | 206 | 2.87 |
| M-CNF-60/20/20 | - | 352 | 88 | 990 | 206 | 2.87 |
Table 5.
Concrete mixture proportions.
Table 5.
Concrete mixture proportions.
| Mixture Name | Cement
(kg/m3) | Natural Pozzolan
(kg/m3) | Fly Ash
(kg/m3) | Coarse Agg.
(kg/m3) | Pea Gravel
(kg/m3) | Sand
(kg/m3) | Water
(kg/m3) | HRWRA
(kg/m3) | AEA
(kg/m3) |
|---|
| P-N10-F00 | 389 | 43 | - | 632 | 276 | 738 | 152 | 1.33 | 1.19 |
| P-N20-F00 | 346 | 87 | - | 632 | 276 | 728 | 152 | 1.48 | 1.19 |
| P-N30-F00 | 303 | 130 | - | 632 | 276 | 717 | 152 | 1.55 | 1.19 |
| P-N00-F30 | 303 | - | 130 | 632 | 276 | 679 | 152 | 1.63 | 1.19 |
| P-N10-F15 | 325 | 43 | 64 | 632 | 276 | 703 | 152 | 1.63 | 1.19 |
| P-N15-F10 | 325 | 64 | 43 | 632 | 276 | 710 | 152 | 1.63 | 1.19 |
| P-N22-F10 | 292 | 97 | 43 | 632 | 276 | 702 | 152 | 1.63 | 1.19 |
| P-N20-F20 | 259 | 87 | 87 | 632 | 276 | 680 | 152 | 1.63 | 1.19 |
| M-N10-F00 | 389 | 43 | - | 632 | 276 | 809 | 152 | 1.33 | 1.19 |
| M-N20-F00 | 346 | 87 | - | 632 | 276 | 799 | 152 | 1.48 | 1.19 |
| M-N30-F00 | 303 | 130 | - | 632 | 276 | 788 | 152 | 1.55 | 1.19 |
| M-N00-F30 | 303 | - | 130 | 632 | 276 | 748 | 152 | 1.63 | 1.19 |
| M-N10-F15 | 325 | 43 | 64 | 632 | 276 | 773 | 152 | 1.63 | 1.19 |
| M-N15-F10 | 325 | 64 | 43 | 632 | 276 | 780 | 152 | 1.63 | 1.19 |
| M-N22-F10 | 292 | 97 | 43 | 632 | 276 | 771 | 152 | 1.77 | 1.19 |
| M-N20-F20 | 259 | 87 | 87 | 632 | 276 | 751 | 152 | 1.63 | 1.19 |
Table 6.
ASR expansion at 14 days (±standard deviation).
Table 6.
ASR expansion at 14 days (±standard deviation).
| Placitas Mixtures | Average (%) | Moriarty Mixtures | Average (%) |
|---|
| P-C-100 | 0.391 ± 0.007 | M-C-100 | 0.503 ± 0.029 |
| P-CN-90/10 | 0.210 ± 0.014 | M-CN-90/10 | 0.229 ± 0.005 |
| P-CN-85/15 | 0.074 ± 0.007 | M-CN-85/15 | 0.101 ± 0.015 |
| P-CN-80/20 | 0.050 ± 0.015 | M-CN-80/20 | 0.051 ± 0.001 |
| P-CN-75/25 | 0.048 ± 0.048 | M-CN-75/25 | 0.028 ± 0.002 |
| P-CN-70/30 | 0.018 ± 0.002 | M-CN-70/30 | 0.020 ± 0.001 |
| P-CNF-75/15/10 | 0.026 ± 0.057 | M-CNF-75/15/10 | −0.007 ± 0.052 |
| P-CNF-75/10/15 | 0.018 ± 0.007 | M-CNF-75/10/15 | 0.018 ± 0.003 |
| P-CNF-67.5/22.5/10 | 0.015 ± 0.002 | M-CNF-67.5/22.5/10 | 0.015 ± 0.004 |
| P-CNF-60/20/20 | 0.010 ± 0.051 | M-CNF-60/20/20 | 0.008 ± 0.007 |
| P-CF-70/30 | 0.031 ± 0.002 | M-CF-70/30 | 0.033 ± 0.012 |
Table 7.
Rheological properties results.
Table 7.
Rheological properties results.
| Mixture Name | HRWRA
(kg/m3) | AEA
(kg/m3) | Slump
(mm) | Air Content
(%) |
|---|
| P-N10-F00 | 1.33 | 1.19 | 50 | 5.9 |
| P-N20-F00 | 1.48 | 1.19 | 50 | 6.5 |
| P-N30-F00 | 1.55 | 1.19 | 65 | 7.3 |
| P-N00-F30 | 1.63 | 1.19 | 45 | 6.8 |
| P-N10-F15 | 1.63 | 1.19 | 60 | 6.6 |
| P-N15-F10 | 1.63 | 1.19 | 60 | 6.7 |
| P-N22-F10 | 1.63 | 1.19 | 50 | 6.6 |
| P-N20-F20 | 1.63 | 1.19 | 65 | 6.5 |
| M-N10-F00 | 1.33 | 1.19 | 45 | 5.8 |
| M-N20-F00 | 1.48 | 1.19 | 45 | 6.4 |
| M-N30-F00 | 1.55 | 1.19 | 50 | 7.3 |
| M-N00-F30 | 1.63 | 1.19 | 40 | 6.8 |
| M-N10-F15 | 1.63 | 1.19 | 45 | 6.6 |
| M-N15-F10 | 1.63 | 1.19 | 45 | 6.4 |
| M-N22-F10 | 1.77 | 1.19 | 45 | 6.5 |
| M-N20-F20 | 1.63 | 1.19 | 50 | 6.5 |
Table 8.
Compressive and flexural strength results (±standard deviation).
Table 8.
Compressive and flexural strength results (±standard deviation).
| Mixtures | Average Compressive Strength (MPa) | Average 28-Day Flexural Strength (MPa) |
|---|
| 7-Day | 28-Day | 90-Day |
|---|
| P-N10-F00 | 31.9 (±1.9) | 37.3 (±1.1) | 43.5 (±1.3) | 4.39 (±0.38) |
| P-N20-F00 | 30.4 (±1.9) | 35.8 (±1.2) | 44.0 (±0.8) | 4.53 (±0.30) |
| P-N30-F00 | 24.7 (±1.8) | 31.4 (±1.7) | 43.7 (±1.2) | 4.03 (±0.56) |
| P-N00-F30 | 24.5 (±1.2) | 31.3 (±0.7) | 43.4 (±1.4) | 3.93 (±0.26) |
| P-N10-F15 | 27.5 (±1.2) | 36.8 (±0.7) | 44.4 (±1.5) | 4.32 (±0.06) |
| P-N15-F10 | 26.3 (±1.6) | 36.2 (±1.2) | 44.1 (±1.0) | 4.41 (±0.14) |
| P-N22-F10 | 25.4 (±1.3) | 36.0 (±0.8) | 44.7 (±0.3) | 4.47 (±0.15) |
| P-N20-F20 | 23.6 (±1.0) | 30.9 (±1.1) | 44.8 (±1.1) | 4.12 (±0.31) |
| M-N10-F00 | 30.6 (±1.1) | 38.3 (±1.7) | 46.0 (±1.1) | 4.69 (±0.17) |
| M-N20-F00 | 28.7 (±1.6) | 37.0 (±1.5) | 46.4 (±1.0) | 4.70 (±0.30) |
| M-N30-F00 | 27.5 (±1.7) | 36.3 (±1.7) | 46.7 (±1.2) | 4.20 (±0.52) |
| M-N00-F30 | 27.0 (±1.8) | 34.1 (±1.2) | 47.5 (±1.6) | 4.03 (±0.26) |
| M-N10-F15 | 28.8 (±1.0) | 37.8 (±1.0) | 47.1 (±1.6) | 4.42 (±0.07) |
| M-N15-F10 | 28.2 (±1.2) | 36.1 (±0.5) | 47.2 (±1.9) | 4.75 (±0.24) |
| M-N22-F10 | 27.9 (±1.1) | 36.5 (±1.7) | 47.2 (±1.3) | 4.61 (±0.50) |
| M-N20-F20 | 26.4 (±1.8) | 33.5 (±1.6) | 46.9 (±1.1) | 4.36 (±0.31) |
Table 9.
RCPT and surface resistivity test results (±standard deviation).
Table 9.
RCPT and surface resistivity test results (±standard deviation).
| Mixtures | RCPT
(Coulombs) | Surface Resistivity
(kΩ-mm) |
|---|
| P-N10-F00 | 498 ± 11 | 355 ± 33 |
| P-N20-F00 | 409 ± 4 | 371 ± 31 |
| P-N30-F00 | 298 ± 14 | 398 ± 27 |
| P-N00-F30 | 262 ± 18 | 406 ± 24 |
| P-N10-F15 | 294 ± 6 | 378 ± 31 |
| P-N15-F10 | 302 ± 5 | 371 ± 9 |
| P-N22-F10 | 325 ± 6 | 382 ± 17 |
| P-N20-F20 | 237 ± 18 | 427 ± 20 |
| M-N10-F00 | 480 ± 6 | 348 ± 15 |
| M-N20-F00 | 383 ± 17 | 379 ± 22 |
| M-N30-F00 | 293 ± 3 | 382 ± 31 |
| M-N00-F30 | 246 ± 13 | 409 ± 15 |
| M-N10-F15 | 253 ± 11 | 400 ± 10 |
| M-N15-F10 | 295 ± 3 | 394 ± 12 |
| M-N22-F10 | 300 ± 1 | 405 ± 21 |
| M-N20-F20 | 248 ± 13 | 419 ± 8 |
| Disclaimer/Publisher’s Note: The statements, opinions and data contained in all publications are solely those of the individual author(s) and contributor(s) and not of MDPI and/or the editor(s). MDPI and/or the editor(s) disclaim responsibility for any injury to people or property resulting from any ideas, methods, instructions or products referred to in the content. |
© 2023 by the authors. Licensee MDPI, Basel, Switzerland. This article is an open access article distributed under the terms and conditions of the Creative Commons Attribution (CC BY) license (https://creativecommons.org/licenses/by/4.0/).


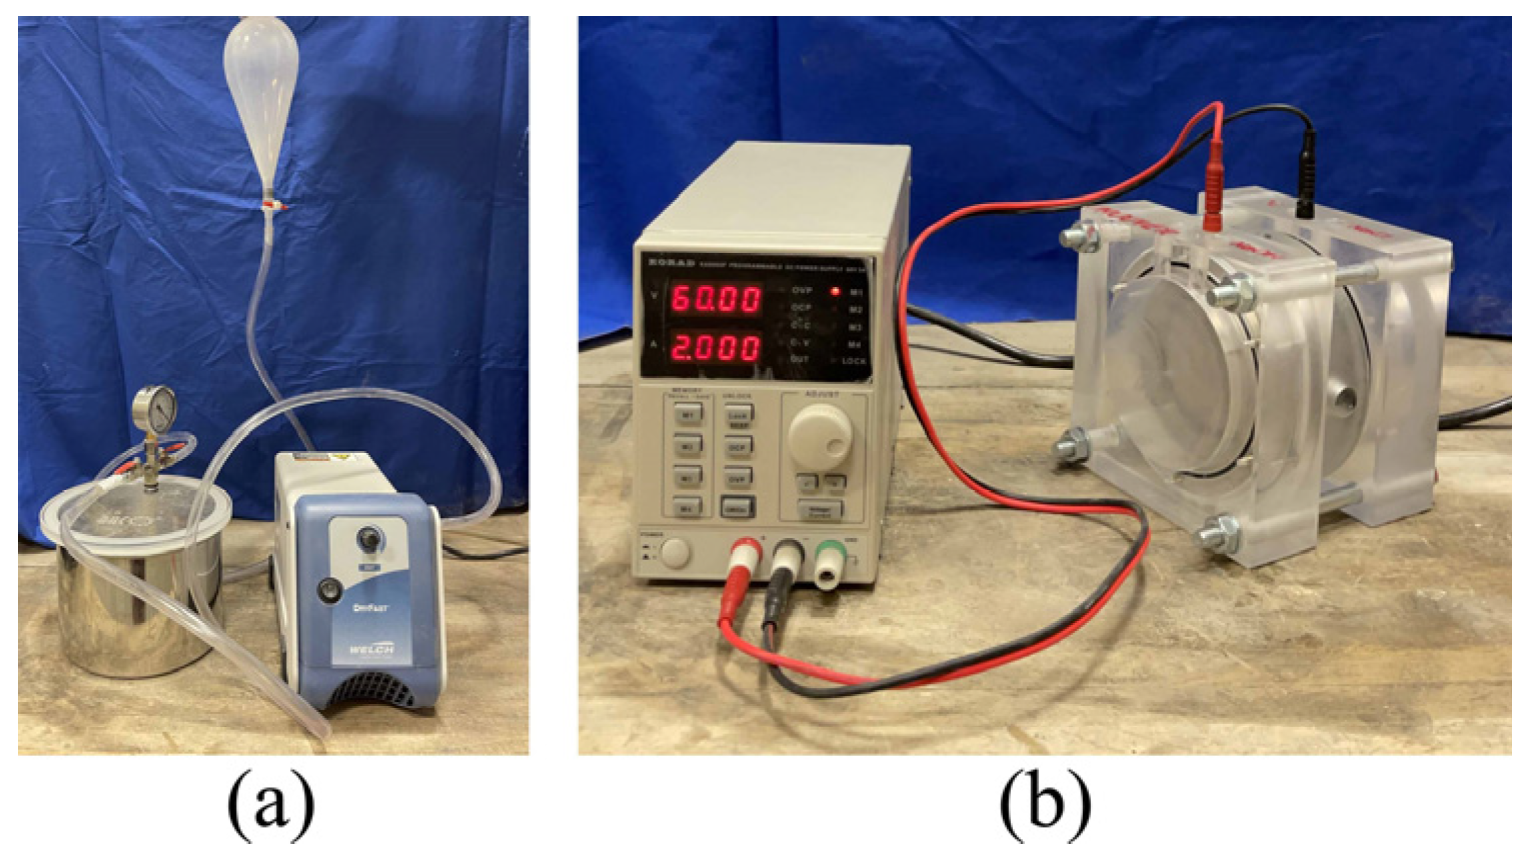
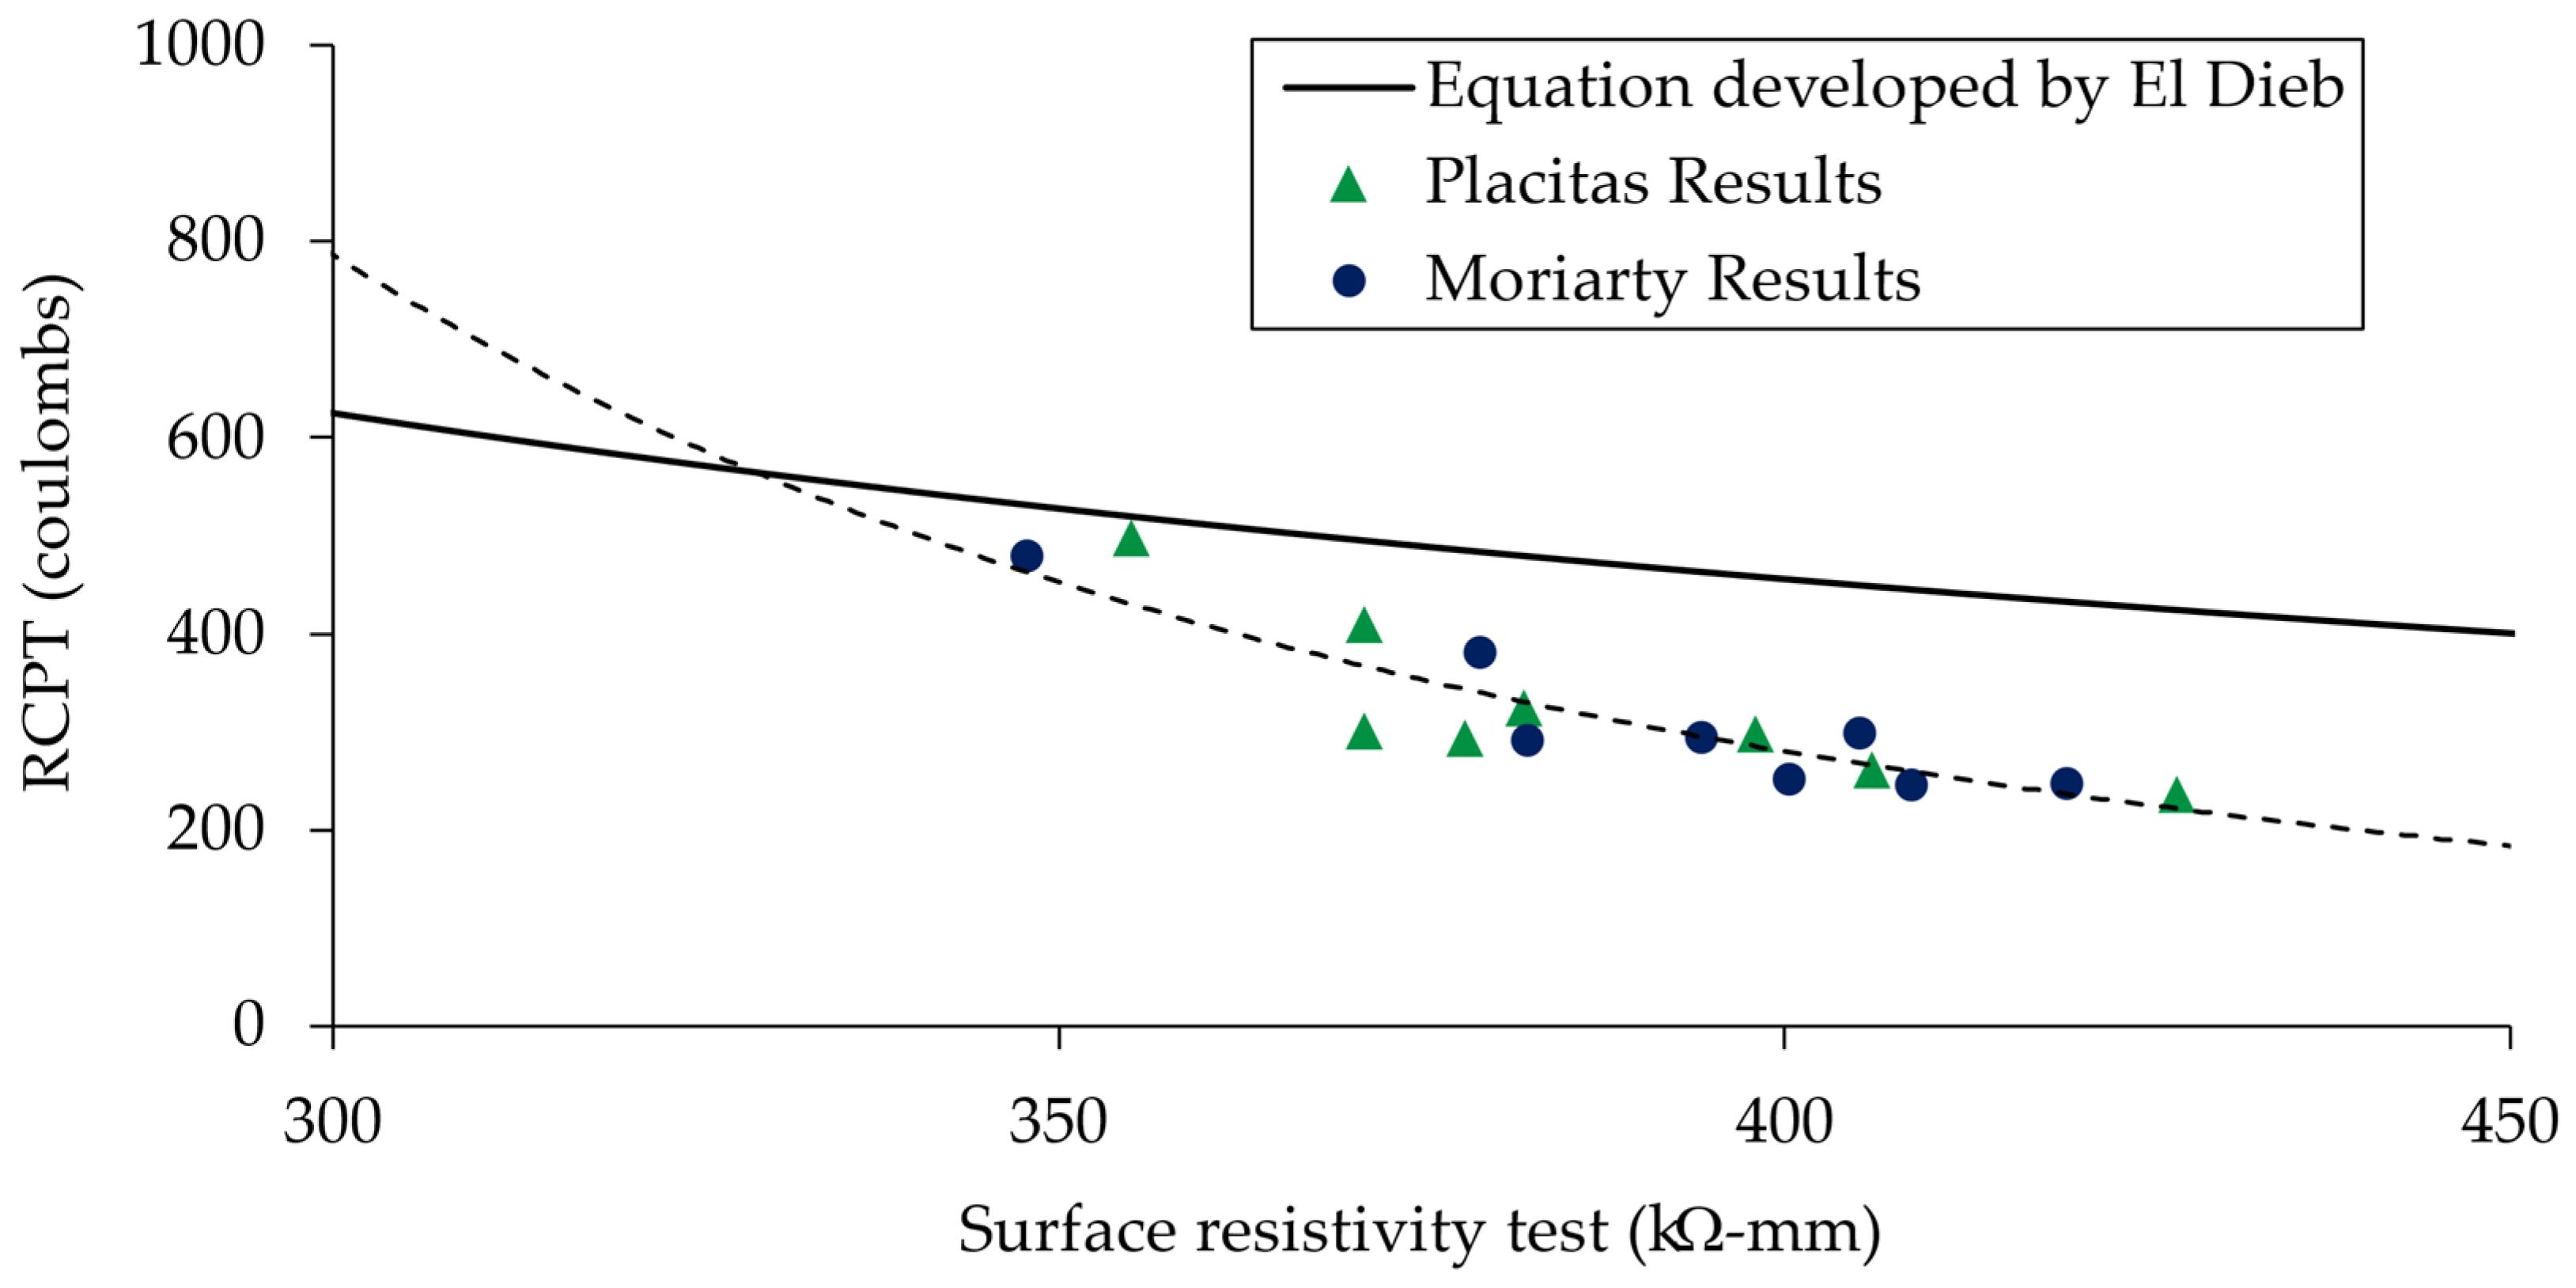